lab_notes
DESCRIPTION
fdsfTRANSCRIPT

Laboratory Class Notes
MNGN321 INTRODUCTION TO ROCK MECHANICS
Prepared by:
Dr. Ugur Ozbay and B. Asbury
2013 Fall
Colorado School of Mines Mining Engineering Department

Colorado School of Mines MNGN321 Introduction to Rock Mechanics Class
Student Liability Waiver and Release Agreement I, ___________________________________, a student at the Colorado School of Mines (“CSM”), have enrolled in the CSM course MNGN321 Introduction to Rock Mechanics and desire to participate in all course activities and field trips. I understand that required Course Activities include: Rock Mechanics laboratory classes, which involve use of machinery at the CSM laboratories, traveling to and from the Edgar Mine, and measurement, data collection, and installing instrumentation in and outside of the Edgar Mine. I further understand that students will be required to travel to and from the field trip site at Edgar Mine, Idaho Springs, via personal vehicle or vehicles arranged by CSM. I understand that participating in the Course Activities requires a significant level of physical exertion on my part, and that such Activities and travel to and from the course and field trip sites involve an inherent risk of physical injury or death to me, as well as damage to, or destruction of my personal property. I understand and acknowledge that specific risks of the Course Activities include, but are not limited to the following:
• Hiking or walking along trails, sidewalks, walkways or even roads may cause damage to equipment or personal
injuries. • Vehicle and airplane accidents may result in property damage and physical injuries such as scrapes, abrasions,
sprains, broken bones, torn muscles or ligaments, head, neck or spinal injuries, or death. • Poisonous or dangerous plants, insects or animals might be encountered. • Exposure to the natural elements can be uncomfortable or harmful. Sunburn, dehydration, heat exhaustion, heat
stroke, wind, rain, and being outdoors can be uncomfortable or cause injury or illness. • Risks also include injuries or damages resulting from certain decisions and conduct, including the risk that a course
instructor, co-instructor or other participant may misjudge someone’s capabilities, or misjudge weather, terrain, water level, or route location etc.
• Environmental risks include rapidly moving, deep or cold water, rough ocean surf, steep and rocky terrain, insects, snakes, predators, and other animals; falling or rolling rock, hot molten lava, lightning, fires, flash floods and unpredictable forces of nature, including weather that may change to extreme conditions without notice. Such environmental conditions pose additional risks, including hypothermia, frostbite, frost nip, sunburn, heatstroke, dehydration, and other mild or serious conditions.
• Other risks include: Observations, geotechnical data collection, instrumentation installation and monitoring in surface and underground mines.
In exchange for the opportunity to participate in and receive academic credit for the Introduction to Rock Mechanics Course Activities, I hereby assume all risk of injury to myself and my property that I may suffer as a result of my participation in any Course Activities, including transportation to and from course and field trip sites. On behalf of myself as well as my heirs, administrators, executors, and assigns, I hereby RELEASE AND FOREVER DISCHARGE THE STATE OF COLORADO AND CSM, AS WELL AS ITS TRUSTEES, OFFICERS, AGENTS AND EMPLOYEES, FROM ANY AND ALL CLAIMS, DEMANDS, AND CAUSES OF ACTION, OF WHATEVER KIND OR NATURE, EITHER IN LAW OR IN EQUITY, ARISING FROM, OR IN ANY WAY CONNECTED WITH MY PARTICIPATION IN THE COURSE ACTIVITIES. IN ADDITION, I AGREE TO INDEMNIFY AND HOLD THE ABOVE-NAMED ENTITIES AND INDIVIDUALS HARMLESS FROM ANY LOSS, LIABILITY, DAMAGE, OR COST THAT THEY MAY INCUR AS A DIRECT OR INDIRECT RESULT OF MY PARTICIPATION IN THE COURSE ACTIVITIES.
1

I hereby agree that if CSM is compelled to defend any action, lawsuit or litigation by myself, my executors, or my heirs, on my family’s or my behalf, my heirs or executors and I agree to pay CSM’s costs and attorney’s fees if CSM successfully defends such action, lawsuit or litigation.
I further state that there are no health-related reasons or problems that would preclude or restrict my participation in the Course Activities, and that I have adequate health insurance necessary to provide for and pay any medical costs that I may incur as a result of illness or injury during the course of my participation in the Course Activities. If I require emergency medical action or treatment, I hereby consent to being transported by CSM to a hospital or medical care facility, and consent to being administered medical care by the physician or licensed hospital or medical care facility deemed by the CSM representative in charge to be the most expedient and appropriate under the circumstances. I understand and agree that CSM assumes no responsibility for any injury or damage that might arise out of or in connection with such authorized emergency medical treatment or my transportation to or from the medical care facility. I agree that this Liability Waiver and Release Agreement is intended to be as broad and inclusive as permitted by the laws of the State of Colorado, and that if any portion herein is held to be invalid or unenforceable, the balance shall continue in full legal force and effect. This agreement and the legal relations among the parties hereto shall be governed by and construed in accordance with the laws of the State of Colorado. Nothing in this Liability Waiver and Release Agreement shall be construed to waive, limit, or otherwise modify any governmental immunity that may be available to CSM’s trustees, officers, employees, agents and representatives under the Colorado Governmental Immunity Act, Colorado Revised Statutes § 24-10-101, et seq. By my signature below, I acknowledge and represent that I have carefully read this document in its entirety, understand its contents and effect, and am executing it voluntarily of my own free will. ___________________________________ ________________________________ Student Signature Parent Signature (Required if Student is under 18 years old) ___________________________________ ___________________________________ Date Date
2

Rules of Rock Mechanics Laboratory Classes 1. All students will practice proper and safe operation of all the equipment
contained within the Advanced Mining Method Laboratory. 2. Because of safety considerations, working alone in any Mining Engineering
Laboratory is prohibited. 3. Safety glasses will be worn at all times within any Mining Engineering
Laboratory. 4. Access to all Mining Engineering Laboratories is controlled by the Laboratory
Coordinator. No one will use or bring any equipment or samples into any Mining Engineering Laboratory unless arrangements are made with the Laboratory Coordinator.
5. All users of the Mining Engineering Laboratory will clean all equipment used immediately after use. All equipment will be returned to its proper place and the Lab will• be left as clean, if not cleaner, when you leave.
6. Any Mining Engineering Laboratory user who violates any of the above rules, will immediately have their Mining Engineering Laboratory privileges suspended by the Laboratory Coordinator. Re-instatement of privileges can only be granted by the Head of the Department of Mining Engineering.
I have read the rock mechanics and rock preparation laboratories safety rules and regulations above and the training material provided in the subsequent sections. I will adhere to these rules and do everything possible to safeguard myself and others in the laboratories. I will not operate any of the equipment until I have been tasked trained by representatives of the Mining Engineering Department. Name: Signature Date:
NOTE For reasons of practicality, the test procedures you will be using during your
laboratory classes may be different to the standard procedures defined by the ASTM. The ASTM standard methods for these tests are given separately at
the end of this laboratory class notes for you to note. You may refer to the formal ASTM test procedures for improving quality of
your laboratory reports.

Rock Mechanics Laboratory Clothing Requirements
You will be working in a wet, dirty environment with powered rotating
equipment.
All students must be properly dressed, in order to help provide a safe working environment. Students will not be allowed to participate in the lab unless they are properly dressed. This could have an effect on grading. Clothing requirements include, but are not limited to:
• No lose or tattered clothes. • Shirt that covers the stomach and lower back as well as the upper arms • Long non-baggy pants that cover the entire leg, (capris are Not
acceptable). • Socks • Closed toed shoes that cover the entire foot (No sandals, clogs, high heels
or any shoes with holes in the top side or back). Tennis shoes are acceptable.
• If you have your own steel toed work boots, please feel free to wear them. • If not, toe protectors will be provided. • Long hair must be controlled (i.e. pulled back in a ponytail). • Eye and hearing protection will be provided, but feel free to bring your
own. • It is recommended that all rings, watches, etc. be removed.
To help determine whether your clothing is appropriate, stand in front of a mirror
and lift your hands above your head. If any skin shows between your shoulders and your toes, you are NOT dressed adequately for the laboratory.
If you have questions or concerns speak with the instructor prior to the schedule
laboratory time.

Laboratory Class Outline
1. Introduction This laboratory class supplements the MNGN321 Introductory Rock Mechanics course. Only MNGN321 students are eligible for this class. It is structured to have the students achieving the following objectives:
1. Developing a fuller understanding of the fundamental rock mechanics concepts introduced during lectures.
2. Furthering practical experience in carrying out laboratory tests including preparation, measurement of experimental parameters, analysis and evaluation of results and presentation of findings
3. Improving communication skills through the exercises of report writing
2. Execution of the laboratory exercises The students conduct their own experiments working in groups of four or less. The groups and time-table for the exercises are announced at the beginning of the semester. A group can submit one report for all its members. This is encouraged since discussions among peers facilitate better learning. However, students wanting to submit their individual reports are allowed to do so after informing the course instructor. The reports are submitted within a week from the laboratory class day. The grades from the laboratory reports constitute 20% of final year mark for MNGN321. Late reports are graded out of 50% if submitted within one week. No reports are graded a week after the submission deadline. A report is not accepted for submission without attendance. Before each laboratory session, the instructor presents a short talk on the subject of the day’s exercise. This is for the benefit of the student - be sure to attend. Many of the exercises involve the use of machines in the laboratory and equipment in a mining environment. For safety reasons, suitable footwear and clothing must be worn in the rock mechanics laboratories. Edgar Mine experiments requires full compliance with the Mine’s safety requirements, including steel toe shoe ware, hard hat, and eye protection glasses. All students are required to attend the training session presented on the first day of laboratory class and receive a Certification of Training document, which also outlines the procedures for safe operation of equipment during laboratory classes. Neither smoking nor eating during laboratory classes is permitted.
3. Assessment Assessment of a student's performance from the laboratory classes is based on the following action items:
1

1. Attendance is compulsory and the University’s general rules apply to this course. Absence can only be condoned by the presentation of a medical certificate.
2. Contribution to the conduct of the laboratory exercise. 3. Submission of a technical report on each exercise.
4. Preparation of reports As mentioned before, the reports can be submitted as groups or individuals. It is strongly advised, as it is to the advantage of the student, that the reports be completed soon after each laboratory exercise. Remember, a report is written to be read, its purpose is to convey information to other persons. Material presented in a logical, accurate, and tidy form will most effectively achieve this. It is important that a report maintains the interest of the reader while transmitting all essential information as concisely as possible. The ideal report combines accuracy, wholeness and neatness, with brevity. Each report should be written to suit the particular exercise under study. A comprehensive introduction and, where appropriate, description of method and apparatus are given in the laboratory notes. Do not present in the report sections that are simply a re-write from the manual. At this stage you should be interested in the results and in developing an analytical approach to their interpretation. Do not include any of the printed sheets from the laboratory manual in the main text of your report, unless this is a table or a question sheet that you have to fill in. The sections dealing with the introduction, description of apparatus and procedure should be concise, with reference given to the laboratory manual where appropriate. Lengthy description and expansion of these sections is both unnecessary and time wasting. Concentrate more on your report writing style, presentation, analysis of results, and discussion. The report should be typed and its pages should be numbered. Leave a margin on the left side of each page of approximately 25mm. Writing in the past tense and using the third person generally works well. The structure of the report should include
1. Report Title: Use a title page and include on this your name, group and date of experiment.
2. Contents
3. Summary: A concise review of the objective of the experiment, an expression of the
main results, and the conclusions that can be drawn.
4. Introduction: This should be brief and should include a short statement of the objectives of the experiment. Basic physical principles should be outlined.
2

5. Description of Apparatus: A short description of equipment used, together with either objects such as an isometric view or line diagram or photographs, as appropriate. These objects should be clearly labeled.
6. Procedure: This section should only briefly outline the procedure with emphasis on the
more important steps in the exercise. Draw attention to any part of the procedure, which differed from that detailed in the manual, noting any difficulties encountered and how these were overcome.
7. Results: All measurements and derived results should be included in a suitably devised
tabular form. Use of metric system is encouraged. Wherever appropriate, include a graph as this always aids in the presentation of the results. Ensure that
• there is a title to the graph, • the axes are labeled, and • the scale is shown.
Clearly indicate the important features of the graph, e.g. inflection points, maximums and minimums. At least one sample calculation should be given for each set of parameters if these parameters are separately included in the appendix.
8. Analysis of Results: This is the most important section of the report and hence should be
given the most weight during writing. This section allows the author to demonstrate an understanding of the principles involved. An intelligent analysis of the results with respect to the topic area is required. Where appropriate, results should be equated with other published data and comparisons drawn. Comment on the sources of error in the experiment and their effects on the results. Included in this section should be the answers to any questions asked.
9. Conclusions: This section should contain a discussion of the results, including a critical
evaluation of the experiment, the equipment used, and the techniques employed. Reference should be made, where relevant, to the practical applications of the experiment in the industry and suggestions for possible improvements to the experimental procedure.
10. Bibliography: All publications referred to in the report should be listed with full details
of author, title, publisher and year of publication. Clearly indicate in the text all references to these authors or reports.
11. Appendices: Include any additional data, sample calculations, diagrams and other
information. If you wish to append the printed laboratory manual, then this is the section where it should be placed.
3

Colorado School of Mines Mining Engineering Department
MNGN 321 Introductory Rock Mechanics Laboratory Classes
Sample Preparation
1. Purpose The purpose of this laboratory session is to familiarize students with preparing rock specimens for Uniaxial Compressive Strength (UCS), Triaxial Compressive Strength (TCS), Brazilian Tensile Strength (BTS), Point Load Index (PLI), Schmidt Hammer (SH), and Acoustic Velocity (AV) tests. Specimens will be prepared from blocks of limestone rock. The tests performed in this laboratory classes are close to but not exactly follow the standards as defined by ASTM. Interested students are advised to look up the formal standards at the ASTM references in the library. Proper preparation of specimens requires considerable care and effort and thus takes up much of the time allocated for tests. Often the results are widely scattered. This poses the problem as to how many specimens are required for the test. Usually testing of a minimum 3, preferably 5, specimens per test type, is recommended from each coring location. For this laboratory exercise, the number of test specimen to be prepared will depend on the availability of specimen rock blocks.
2. Test Specimens Normally, samples are collected from the field in the form of rock cores or large blocks. In the case of softer rocks such as coal, shale and salt, they are cut from the parent body with appropriate machines. In the case of harder rocks, the large blocks are excavated by drilling closely spaced holes touching each other. Rock blocks created by large blasts can also be used as long as they are not affected to contain fractures. When it is necessary to test the properties of rock from inaccessible regions, diamond drilling is carried out to obtain cores. In his laboratory class, students will obtain their samples from the limestone or sandstone rock blocks brought to the laboratory from a limestone quarry.
3. Preparation of Specimens The equipment that will be used in the sample preparation tasks is given as follows:
(Do not use these machines until you have received training and the instructions from the lab supervisor.)
• Diamond Drill Coring Machine - to obtain cores of selected size from sample blocks • Diamond Rock Saw Machine - to cut drilled cores into selected lengths • Surface Grinder to obtain the required parallelity between the specimen ends • Balance Scale with 2kg range and 0.1 gram accuracy to weigh specimens • Caliper with 0.01 mm accuracy to measure specimen dimensions.

. Typical specimen diameters are 54 mm (NX). Length-to-diameter ratios commonly used for some of the tests are listed below (ASTM standards):
• UCS, triaxial, acoustic velocity 2 - 2.5 • Brazilian tensile: 0.2-0.7 • Direct shear: 2 - 2.5 • Elastic properties: 2 - 2.5 (same as UCS samples)
Cores will be obtained from drilling into blocks of rocks in the laboratory. The specimens will then be prepared by cutting the cores into required lengths by disc saws. Grinding the ends to ensure parallelism and required flatness will be done on the surface grinder machine. Coring
1. Use the provided coring bit 2. Place the rock block on the platform of the machine and place the 25 mm plywood
provided between the rock block and grill.
3. Clamp the rock block properly and make sure that it is not moving during coring (check by hand).
4. Connect fresh water hose to the machine and make sure that drainage hose is clean.
5. Before you start coring make sure that the bit and sample are aligned properly.
6. Turn on the water before start coring (for cooling the bit and flushing the cuttings)
7. At the beginning, drill slowly for collaring (DO NOT GO FAST!) 8. When water stops coming up around the core barrel indicates that the bit is through the
rock block. Start to pull up the core bit very slowly. After the bit is clear from the rock block turn off the machine and water.
9. Move the rock block over slightly to leave room for coring another sample. Do not take
the cored samples out. Repeat the same procedure from step 1 through step 8.
10. Make sure that you have enough core samples for specimen preparation. Remove the core bit from the machine and take the samples out from the block.
Cutting
1. Use the rock saw to cut the core samples into required length. Use recommended “length-to-diameter ratios” given earlier.
1.05_321sampleprep_UO_F12.doc 2

2. Clamp the sample properly into the V-block
3. Turn on the water
4. Check that the saw is at the “up position”, and then turn on the machine
5. Pull down the saw blade slowly onto the rock sample. Keep steady pressure.
6. After you finish the cutting turn off the machine and water. Wait till the saw blade comes
to a complete STOP.
7. Remove the sample and repeat the same procedure for the next sample. When completing cutting, identify and mark the specimens to be used for different tests, which are Uniaxial Compressive Strength, Brazilian Tensile Strength, Point Load Index, Acoustic Velocity, and Schmidt Hammer tests. There will be specimens provided for you for the shear strength tests. Surface grinding Surface finish is given on a surface grinder machine (only for UCS, triaxial strength and shear strength specimens).
1. Place the sample on the surface grinder with the proper clamping (V-block). 2. Grind specimen ends to required flatness as per ASTM-4543. Make sure that the sample
is held securely by the V-Block to ensure the parallelism of the ends and verticality of the ends with respect to core axis. Do not remove the sample from the V-Block until both ends are ground. This is to maintain the position of the sample with respect to V-Block.
3. Check the smoothness of the ends with the dial gage. The variation must not exceed 0.02
mm. If this value is exceeded, the surfaces must be reground to meet the specified tolerance.
4. Repeat the same procedure for each UCS sample.
When finished with the UCS specimens, measure and record dimensions and weights. Strain gaging The instruction for this activity will be given at the Strain Gauge test station
1.05_321sampleprep_UO_F12.doc 3

4. Number of specimens to be prepared for each group The class will be divided into groups. Usually there are 3 to 5 groups. Each group will prepare the flowing specimens: UCS with strain gages 1 Triaxial Compressive Strength tests: 1 Shear test: will be provided Indirect Brazilian tensile test: 1 Point Load test: 2 Acoustic Velocity test use Triaxial sample Schmidt Hammer test 1 There are 5 preparation stations. At the start of the class groups will go to these station and start with specimen preparation. You may have to borrow specimens from the lab to get you started at your first station. After completing all five stations, you will have all the specimens you need for the tests, plus the ones that you borrowed, which you will return to the lab supervisor.
5. Reporting of results See the section on “Preparation of reports” in the “Laboratory Class Outline” section. Emphasize should be on the following aspects: • Objectives of the specimen preparation exercise • The rational for particular shapes and the tolerances in specimen dimensions. (e.g. why
H/L=2 – 2.5 for the UCS test, importance of end parallelity, etc.) • Equipment used • Descriptions (brief) of the sample preparation processes • A sample inventory that shows the number of samples for each test, coring date, preparation
date, etc.
6. Reference
“Standard Practice for Preparing Rock Core Specimens and Determining Dimensional and Shape Tolerances” American Society for Testing and Materials, 1995, Annual book of ASTM Standard, Section 4, Vol. 04.08, Designation D 4543-85 (Reapproved 1991)
1.05_321sampleprep_UO_F12.doc 4

Description of Specimen Features
Before testing After Testing
Notes:
Operator: ______________ Rock type: __________________ Date: _________________ Core ID: ____________________ Data File: ______________ Sample Length: ______________ Sample Weight: _________ Diameter 1: __________________ Diameter 2: ____________
MNGN321 – Rock Mechanics Laboratory
Unuaxial Comressive Strength tests with Elastic Modulus and Poison’s ratio
1.06_321UCS_UO_F12.doc 1

Colorado School of Mines Mining Engineering Department
MNGN 321 Introductory Rock Mechanics Laboratory Classes
Uniaxial Compressive Strength (UCS) Test with Elastic Modulus (E) and
Poisson’s ratio (ν)
1. Purpose This test measures the Uniaxial Compressive Strength (UCS) and elastic constants (elastic modulus (E) and Poisson’s ratio (ν)) of intact rock specimens prepared in form cylinders. The UCS is the most commonly used index property of rocks as well as being one of the main parameters in defining rockmass strength and rockmass classification systems.
2. Equipment Equipment to be used for uniaxial compressive test: • Hydraulic Press (220 Kips MTS Rock Testing Machine), two flat faced platens, swivel seat. • Data acquisition system integrated into the MTS control system.
3. Procedures UCS samples are already prepared during the previous specimen preparation lab. For the UCS tests, the procedure is as follows:
1. Record all pertinent information and measurements on the test sheet above - a general rock and project information, date, sample weight and dimensions. You can take pictures and include them in your report.
2. Place and secure the specimen between the platens of the testing machine. Platens must
be clean and oil free. The spherical seat must be tight yet moving and rotating freely. Place the sample at the center of the platens assuring that a full contact with both platens is established.
3. Connect the strain gage cables to the terminals of the strain gage connection
4. Close the shield doors on the test machine to protect the operator from flying pieces of
rock.
5. Turn on the machine, the hydraulic pumps, and the computer control system and raise the lower platen till the sample is held firmly by both platens with a pre-load of about 300 pounds of force. Run the Test-Ware program and select the appropriate template for the test (e.g. “UCS Soft/Hard”).
1.06_321UCS_UO_F12.doc

6. Reset the displacement. Set the loading rate at 10 kips per minute. Open a new data file with the same name as the Sample ID. Start loading. The machine will collect data and detect the increase in load. When the sample fails, the machine will when senses a drop of over 200 lbs in load.
7. Record the peak load and make a sketch of the failure geometry on the test sheet. Remove
the sample and collect all the pieces and put them in a clearly labeled zip lock bag. Clean the machine. Close and back up the data file.
4. Calculations The uniaxial compressive strength of the specimen is calculated by dividing the maximum load carried by the specimen during the test, by the original cross-sectional area:
AF
c =σ
where σc – UCS of the specimen (MPa) F - applied force at failure (MN) A - initial cross-sectional area (m2)
You will be able to visually observe the increasing force on the specimen as function of both horizontal and vertical strain increase on the specimen on the test system’s computer screen. During testing, the force applied and strains induced on the specimen are recorded into an electronic data file in Excel format. After the completion of the test, you will be given this data file. Using the data obtained, you will calculate the values of UCS, E, and ν, which is the main objective of performing this particular test. An example data set produced by the testing machine is shown in the figure above. The load is given in kN, which needs to be converted to MPa units. The specimen deformations are already given in strain units, thus do not require unit conversions.
Original data record Add this stress calculation column
Axial DisplaAxial ForceTime Axial StrainAxial Lat Strainmm kN Sec mm/mm mm/mm Stress (MPa)3.677726 0.236319 0.326172 3.27E-06 7.79E-07 0.116603.685595 0.337567 0.576172 4.09E-06 5.46E-07 0.166553.699008 0.439501 0.826172 4.90E-06 3.25E-07 0.216843.721449 0.469306 1.076172 4.99E-06 2.90E-07 0.231553.761398 0.480936 1.326172 5.71E-06 2.93E-07 0.237283.800765 0.858969 1.576172 8.24E-06 -5.59E-07 0.423803.818206 1.376115 1.826172 1.21E-05 -1.84E-06 0.67895
. . . . . .
. . . . . .
. . . . . .
1.06_321UCS_UO_F12.doc
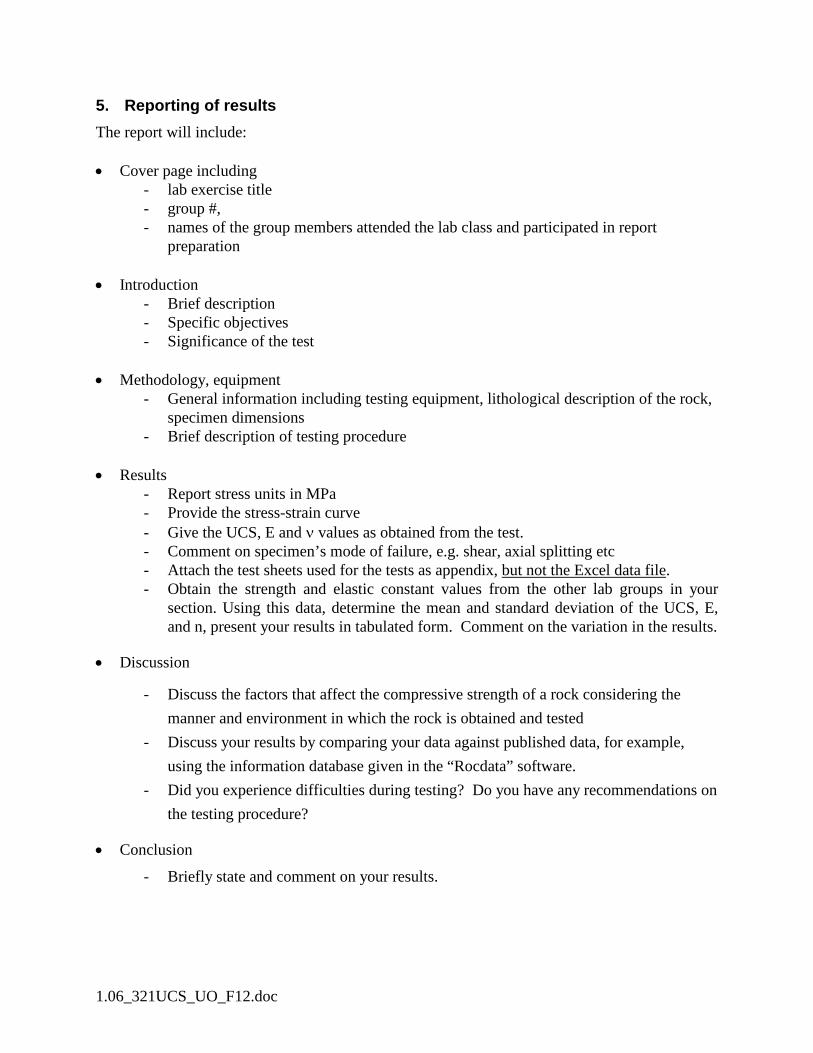
5. Reporting of results The report will include: • Cover page including
- lab exercise title - group #, - names of the group members attended the lab class and participated in report
preparation • Introduction
- Brief description - Specific objectives - Significance of the test
• Methodology, equipment - General information including testing equipment, lithological description of the rock,
specimen dimensions - Brief description of testing procedure
• Results
- Report stress units in MPa - Provide the stress-strain curve - Give the UCS, E and ν values as obtained from the test. - Comment on specimen’s mode of failure, e.g. shear, axial splitting etc - Attach the test sheets used for the tests as appendix, but not the Excel data file. - Obtain the strength and elastic constant values from the other lab groups in your
section. Using this data, determine the mean and standard deviation of the UCS, E, and n, present your results in tabulated form. Comment on the variation in the results.
• Discussion
- Discuss the factors that affect the compressive strength of a rock considering the manner and environment in which the rock is obtained and tested
- Discuss your results by comparing your data against published data, for example, using the information database given in the “Rocdata” software.
- Did you experience difficulties during testing? Do you have any recommendations on the testing procedure?
• Conclusion
- Briefly state and comment on your results.
1.06_321UCS_UO_F12.doc

6. References
• American Society for Testing and Materials, 1995, Annual book of ASTM Standard, Section 4, Vol. 04.08, Designation D 2938-86.
• American Society for Testing and Materials, 1995, Annual book of ASTM Standard, Section 4, Vol. 04, 08, Designation D 4543-85.
1.06_321UCS_UO_F12.doc

MNGN321 – Rock Mechanics Laboratory
Pulse velocities and Ultrasonic Elastic Constants
Operator: ______________ Rock type: __________________ Date: _________________ Core ID: ____________________ Data File: ______________ Sample Length: ______________ Sample Weight: _________ Diameter 1: __________________ Diameter 2: ____________ Moisture content: Yes No Flatness: Pass Fail
Notes:
3
2
1
S-wave P-wave
Transducer delay time
Travel time Direction
321AcVelDynConst_UO_F07 1

Colorado School of Mines Mining Engineering Department
MNGN 321 Introductory Rock Mechanics Laboratory Classes
Acoustic Velocities and Dynamic Elastic Constants
1. Purpose
The purpose of the experiments in this class is to determine the dynamic elastic constants of rock samples - the dynamic elastic modulus and Poisson’s ratio.
2. Equipment and Procedure
This experiment is performed in accordance with the procedures recommended by ASTM D2845 on core samples prepared for UCS testing. The core ends are cut parallel to within 0.1 mm/20 mm and flat to a variability of less than 0.025 mm across each surface. NX-sized core (5.4 cm diameter) is used unless the average grain size of the rock is larger than (1 cm), in which case larger core is required. Prior to testing the bulk density of the sample is determined.
Piezoelectric transducers capable of transmitting and receiving ultrasonic electromagnetic waves are attached to the core ends with drops of liquid phenyl salicylate so that the transducer centers are aligned within 2º. When the phenyl salicylate is set, a wave generator sends a pulse through the sample from one transducer while simultaneously transmitting that same pulse to an oscilloscope. The receiving transducer also sends its signal to the oscilloscope. The time difference that is measured on the oscilloscope between the direct pulse and its arrival after traveling through the sample allows determination of the velocities of the shear and compressive waves in the rock, since the sample length is known.
From the waves’ velocities and the sample bulk density, the dynamic elastic modulus and dynamic Poisson’s ratio are calculated from the following formulae:
( )2
S2P
2S
2P
2S
d VVV4V3V
E−−ρ
=
( )2S
2P
2S
2P
d VV2V2V
−−
=ν
where VS shear wave velocity (m/s) VP compressive wave velocity (m/s) Ed dynamic elastic modulus (Pa) νd dynamicPoisson’s ratio ρ density (kg/m3)
321AcVelDynConst_UO_F12 2

These formulae are valid for isotropic rock samples. Even then, the expected error of E is 6% and of ν is 24%. Five separate measurements are recommended for calculation of average values.
3. Reporting of results The report will include: • Cover page including
- lab exercise title - group #, - names of the group members attended the lab class and participated in report
preparation • Introduction
- Brief description - Specific objectives - Significance of the test
• Methodology, equipment - General information including testing equipment, lithological description of the rock,
specimen dimensions - Brief description of testing procedure
• Results
- Give the static and dynamic E and ν values as obtained from the test. - Attach the test sheets used for the tests as appendix. - Results
• Discussion
- Discuss how Ed and νd values compare to E and v that you determined from the UCS testing.
- Discuss your results by comparing your data against published data. - Did you experience difficulties during testing? Do you have any recommendations on
the testing procedure?
• Conclusion
- Briefly state and comment on your results. 4. References
• American Society for Testing and Materials, 1995, Annual book of ASTM. Designation D 2845-95. Standard test method for laboratory determination of pulse velocities and ultrasonic elastic constants of rock.
321AcVelDynConst_UO_F12 3

321AcVelDynConst_UO_F12 4

MNGN321 – Rock Mechanics Laboratory
Point Load Test
Operator: ______________
Rock type: __________________ Date: _________________
Core ID: ____________________
Sample Length: ______________ Sample Weight: _________
Diameter 1: __________________ Diameter 2: ____________
Max. Load: ________
Description of specimen features
Before testing Mode of failure
Notes:
321PointLoad_UO_F07 1

Colorado School of Mines Mining Engineering Department
MNGN 321 Introductory Rock Mechanics Laboratory Classes
Point Load Test
1. Purpose
Point Load Strength (PLS) is a rough measure of the strength of a core or irregular piece of rock, performed on samples normally with unsuitable shape for UCS testing. The rock piece is loaded to failure between two conical platens of a Point Load Testing machine. The failure load is converted to stress units and then, using a constant coefficient, may be interpreted to obtain an estimate of the uniaxial compressive strength of the rock. In the absence of UCS data, the PLS is used as an input parameter in determining rockmass classifications. Caution should be exercised in using PLS for design purposes.
In this experiment, the test procedure and calculations assume that the test specimen is cylindrical and its diameter is 50 mm. For full procedure including different diameter and shape specimens, refer to ASTM Method D 5731-95..
2. Equipment and Procedure
1. Core specimens with Length/Diameter ratio greater than one are suitable for diametral testing Diametral loading method will be used for this lab exercise.
2. Insert a specimen in the test device and close the platens to make contact along a core diameter. Ensure that the axial distance, L, between the contact points and the nearest free end is at least 0.5 times the core diameter.
3. Determine and record the diameter D and length L
4. Steadily increase the load such that failure occurs within 10 to 60 second, record the failure load, P. The test should be rejected if the fracture surface passes through only one platen loading point.
To calculate the UCS value from the test results, first the Point Load Strength Index (Is) is
calculated:
Is = P / (De)2 (MPa)
In this formula, P is Failure Load in force units (Newton) and De is the equivalent diameter in millimeters.
In the case of diametrically loaded cylindrical specimen loaded De is given as
1.08_321PointLoad_UO_F01-02.doc 2

De = D, where D is the diameter of the specimen.
In the axially loaded cylindrical specimen case, De is calculated from the following formula:
De2 = (4 L D) / π
UCS value of the rock tested can then be determined from formula (see the relevant sections in your class notes and the document in the Reference below)
δuc = 24 x Is(50)
where the subscript (50) is a symbol that refers to the specimen diameter (mm) and δuc is the estimated UCS (Uniaxial Compressive Strength).
3. Reporting of results
• Cover page including - lab exercise title - group #, - names of the group members attended the lab class and participated in report
preparation • Introduction
- Brief description - Specific objectives - Significance of the test
• Methodology, equipment - General information including testing equipment, lithological description of the rock,
specimen dimensions - Brief description of testing procedure
• Results - Present the measured and calculated values in a table form (include P, De, Is, and δuc).
• Discussion - Discuss how the point load determined UCS values compare to the direct UCS
testing. - Discuss your results by comparing your data against published data. - Did you experience difficulties during testing? Do you have any recommendations on
the testing procedure?
• Conclusion
- Briefly state and comment on your results.
1.08_321PointLoad_UO_F01-02.doc 3

4. References Standard Test Method for determination of the Point Load Strength Index of Rock. Designation: D 5731 – 02. ASTM.
1.08_321PointLoad_UO_F01-02.doc 4

MNGN321 – Rock Mechanics Laboratory
Brazilian Tensile Strength
Operator: ______________ Rock type: __________________ Date: _________________ Core ID: ____________________ Sample Length: ______________ Sample Weight: _________ Diameter 1: __________________ Diameter 2: ____________ Moisture Condition: As received Air dried Oven fried Saturated Frozen Max. Load: ________ Description of specimen features Before testing Mode of failure
Notes
1.09_321BTS_UO_F01-02.doc 1

Colorado School of Mines Mining Engineering Department
MNGN 321 Introductory Rock Mechanics Laboratory Classes
Indirect (Brazilian) Tensile Strength Tests
1. Purpose Indirect (or Brazilian) Tensile Strength (BTS) test aims at indirectly determining the tensile strength of rock specimens by means of so called the "Brazilian testing" procedure. It also provides an indication of rock toughness and brittleness, which are not covered in our class. The justification for the test’s measuring the tensile strength of rocks is based on the experimental fact that most rocks subjected to a biaxial stress field fail in tension when one of the principal stresses is tensile and the other principal stress is compressive.
2. Equipment and procedure In this lab experiment, BTS is measured using the procedures of ASTM D3967. The test equipment to be used during the testing include • MTS Hydraulic Press, 220 Kips MTS Rock Testing Machine. • Computer and Data Acquisition system (Integrated into the MTS control system). When a solid cylinder is subjected to a diametrical force, a nearly uniform tensile stress field develops across the loaded along the diametrical plane in the perpendicular direction to the diameter – see the section on Brazilian Tensile Strength in the Mechanical Properties of Rocks chapter in you class lecture notes. This tensile stress field, when it becomes large enough, causes a tensile failure to commence and propagate along the diametrical plane. This behavior is used to determine the tensile strength of rocks by subjecting short cylinders of rock to diametrical compressive loading in the testing machine. The length of the cylinder is not important theoretically, but if the thickness to diameter ratio is too small, failure may occur by buckling rather than by tension. Too long cylinders are also avoided due to reducing loading accuracy with increasing specimen length. Normally, disc thickness of about one quarter of the diameter is used. A compressive force is applied at a rate similar to the maximum rate recommended for uniaxial compressive strength (200 N/sec). The tensile stress developed, σt, can be calculated using the following equation:
Dt2F = t π
σ
321BTS_UO_F12 2

where F = failure load (Newton), D = disc diameter (mm), and t = disc thickness (mm).
3. Reporting of results The report will include: • Cover page including
- lab exercise title - group #, - names of the group members attended the lab class and participated in report
preparation • Introduction
- Brief description - Specific objectives - Significance of the test
• Methodology, equipment - General information including testing equipment, lithological description of the rock,
specimen dimensions - Brief description of testing procedure
• Results
- Give the force applied at failure - Calculate the BTS values for the specimens tested. - Present your results in a table format. - Note the failure plane and discuss its characteristics in terms of failure mode (shear,
compression or tension). State your observations of the edges of the specimen that had been in contact with the steel plates during testing.
• Discussion
- In the rock mechanics literature, the tensile strength is quoted as being 12 to 16 time less than of the UCS of the rock. How does you’re your compare against this rule of thumb? Why?
- Did you experience difficulties during testing? Do you have any recommendations on the testing procedure?
- List some of the experimental difficulties encountered in the indirect tensile strength test.
• Conclusion
- Briefly state and comment on your results.
321BTS_UO_F12 3

4. References
• American Society for Testing and Materials, 1995, Annual book of ASTM Standard, Section 4, Vol. 04, 08, Designation D 3967-92.
321BTS_UO_F12 4

MNGN321 – Rock Mechanics Laboratory
Schmidt Hammer Hardness
Operator: ______________ Rock type: __________________ Date: _________________ Core ID: ____________________ Sample Length: ______________ Sample Weight: _________ Diameter 1: __________________ Diameter 2: ____________ Description of specimen features Before testing Mode of failure
Notes
321schmidtham_UO_F07 1

Colorado School of Mines Mining Engineering Department
MNGN 321 Introductory Rock Mechanics Laboratory Classes
Schmidt Hammer Hardness (HR)
1. Purpose
This test measures the rebound hardness of a rock specimen by the impact and rebound of an impacting piston striking a metal anvil on the rock. The piston is driven by a set of springs within the hammer, which store and release energy while pressing the hammer on the sample by hand. The test was originally developed as a quick measure of compressive strength of concrete and later was extended to a quick measurement method for compressive strength of rocks. This hardness is also used as an index to represent rock elastic properties, resistance to grinding and breakage and, importantly, for determining Joint wall Compressive Strength (JCR) of discontinuity surfaces.
A copy of the Schmidt Hammer test sheet is attached.
2. Equipment and procedure
1. Schmidt hammer (L type with impact energy of 0.542 ft-lbs or 0.075 kg-m) 2. Standard calibration anvil
3. Core cradle with semi-cylindrical groove for supporting rock cores for rebound testing.
4. C –clams
The specimen is an NX (or larger diameter) size core, not less than 10 cm long, it has smooth sides that is fracture and defect free and seems to be representative of the rock sample. You should have the specimen already been prepared from the Specimen Preparation exercise. Calibration test procedure Testing procedure involves a calibration step, which should be performed before starting a test set. The calibration test data is used in determining the correction factor (see formula below). Perform the calibration test on the anvil by following the procedures described below. Make sure that the hammer is properly seated in the target point before running the tests.
A total of 10 readings must be made on the anvil. Record the result of each one and calculate the correction factor as follows:
Readings 10 of Average(74) Standard ersManufacturF:Factor Correction =
321schmidtham_UO_F12 2

The average of 10 calibration readings must be within ±2 of the manufacturer-specified value (74±2).
Specimen test procedure
1. Place the sample in the core cradle and orient it in such way that a smooth flat surface can be tested. If the core surface is very rough or the core is not straight, it must be noted on the test sheet.
2. Hold the hammer in a vertical position against the V-shape guide. Make sure the hammer is aligned along the vertical diagonal line passing through the samples and the contact point between the core and the semi-cylindrical slot in the cradle.
3. Depress the hammer gently (downward) to compress the springs until the hammer is released. Record the rebound reading on the side indicator and enter the reading in the test sheet. This must be done before resetting the hammer (use the trigger lock to assure preventing the reset).
4. Mark test point by drawing a circle around it and put down the reading next to the mark. This allows identifying week spots or edge effects on the tests.
5. Perform the test at 10 different points on the core specimen. Ideally, there should be three in a row along one axis, turn the sample 90° and do two more along this axis, turn another 90° and do three, and once again with two. Test positions must be at least 10 mm (0.4 in) apart from each other and from the ends. Avoid any week spots such as fractures, joints, defects, voids, soft mineral concentrations, miniature-faults etc.
6. Discard unusually low readings (accompanied by a hollow sound, specimen cracking or failure,).
7. Calculate the Schmidt Hammer hardness Hr from the average of the highest 5 readings, multiplied by the correction factor F, i.e.
8. Estimate the UCS for this specimen using the chart supplied at the end of this section.
3. Reporting of Results • Cover page including
- lab exercise title - group #, - names of the group members attended the lab class and participated in report
preparation
F5
5
1∑== i
i
R
HH
321schmidtham_UO_F12 3

• Introduction
- Brief description - Specific objectives - Significance of the test
• Methodology, equipment - General information including testing equipment, lithological description of the rock,
specimen dimensions - Brief description of testing procedure
• Results
- Give the Calibration Factor F used for the Schmidt Hammer Hardness number obtained from the test.
- Calculate the UCS values for the specimens tested using the chart given below. Present your results in a table format.
- State your observations of the hammer indentations on the specimen surface related • Discussion
- How does Schmidt Hammer UCS results compare to the UCS values you obtained from the PLI tests and direct testing using the MTS machine? Quantify the differences in percentage terms and give a short discussion on possible reasons for the differences.
- Did you experience difficulties during testing? Do you have any recommendations on the testing procedure?
- List some of the experimental difficulties encountered in the indirect tensile strength test.
• Conclusion
- Briefly state and comment on your results. .
321schmidtham_UO_F12 4

Schmidt hammer – UCS chart
321schmidtham_UO_F12 5

MNGN321 – Rock Mechanics Laboratory
Triaxial Compressive Strength
Operator: ______________ Rock type: __________________ Date: _________________ Core ID: ____________________ Data File: ______________ Sample Length: ______________ Sample Weight: _________ Diameter 1: __________________ Diameter 2: ____________ Confining Stress: ______________ Flatness: Pass Fail Straightness: Pass Fail Temperature : _______ Loading rate: _________ Max. Load: ________ Description of specimen features Before testing Mode of failure
Notes

Colorado School of Mines Mining Engineering Department
MNGN 321 Introduction Rock Mechanics Laboratory Classes
Triaxial Strength Test
1. Purpose The triaxial compression test has proved to be one of the most useful tests in studying the mechanical properties of rocks. The test comprises a testing arrangement where the major principal stress is applied along the axis of a cylindrical rock specimen by a testing machine, while a constant confining stress (minor principal stress) is applied to the entire curved surface of the specimen by oil pressure behind an impervious flexible jacket. The tests are repeated for different confining stress levels to establish the rock’s axial strength– confining pressure relationship. This relationship reveals the important rock strength parameters, such as cohesion and internal friction angle.
2. Equipment and Procedure In this exercise, the specimens are tested under three different confining pressures. At least three tests is required for each confinement level, however, the number of tests in our case will be determined by the number groups in the class. The main objective is to determine the strength equation (envelope) for the rock type being tested. The equipment required for performing the tests include • Servo controlled Hydraulic Press (1000 Newton MTS Rock Testing Machine), two flat faced
platens, swivel seat. • Computer and Data Acquisition system (integrated into the MTS control system). • Triaxial Cell • Synthetic Rubber Jacket • Hydraulic pressure system Use the previously prepared NX (42 mm) size sandstone specimens with the L/D ratio of 2. Remove the end cap of the Hoek triaxial cell and insert a specimen in the high strength synthetic rubber jacket. This jacket serves the double function of preventing leakage of the pressurizing fluid from the cell and ingress of fluid into the specimen. In normal use, a single jacket will test a large number of specimens without rupturing. Hence the cell need not be dismantled or the fluid drained in between tests. After locating the specimen centrally in the jacket, place platens and the load spreader pads are placed at either end of the specimen. The confining stress is applied by pumping oil into the chamber between the jacket and cell. The axial load is applied in the testing machine, with the load applied through the platens. The following steps should be adhered to: 1. Measure the dimensions of the cores to be tested.
321Triax_UO_S12 2

2. Place the sample core into the cell and place the tightened assemblage on the bottom platen of the testing machine.
3. Raise the lower platen until the cell is just supported in the machine.
4. Select a series of confining (radial) pressures (σ3) which gives a reasonably wide spread of
values of for the construction of Mohr circles. 5. Failure of the test specimen is indicated by a rapid increase in lateral pressure concurrently
with a fall in axial pressure. 6. Load each specimen axially at a steady and very slow rate to failure. Record the failure load.
Release load immediately, always keeping the axial pressure higher than radial pressure in order to avoid rupturing the jacket enclosing the specimen.
7. Note that care must be taken when handling the jacket enclosing the failed specimens.
Where possible, remove the failed specimen in such a way as to be able to sketch the appearance of the fracture and measure the direction of the plane of failure.
8. Repeat for the samples varying σ3 each time.
3. Reporting of results • Cover page including
- lab exercise title - group #, - names of the group members attended the lab class and participated in report
preparation • Introduction
- Brief description - Specific objectives - Significance of the test
• Methodology, equipment - General information including testing equipment, lithological description of the rock,
specimen dimensions - Brief description of testing procedure
• Results
- Give a sketch or appearance of the failed specimen. Measure the shear plane angle from horizontal.
321Triax_UO_S12 3

- Tabulate the confined compressive strength and confining stress values obtained by you and the other lab groups.
- Plot the linear σ1 vs σ3 strength envelope for the rock by considering all the results obtained by the entire class to determine the rock’s
o uniaxial compressive strength, o strengthening parameter, β, and o linear strength formula.
- Mark the tension cut-off point on the horizontal (σ3) axis
- Plot Mohr’s stress circles for each of the specimen tested by the class, including the
UCS results.
- Establish the linear Mohr’s strength envelope for the rock
- Determine the cohesion, c, and internal friction angle, φ, values from the Mohr’s envelope
• Discussion (consider only the linear form of the failure envelope)
- Why do you think nearly all compressive strength tests on rocks are carried out on cylindrical specimens?
- Compare the cohesion, c, and internal friction angle, φ, values obtained from σ1-σ3 plot against those obtained from the Mohr’s circle linear failure envelope.
- Discuss if the σ1 - σ3 plot can be used to determine the rock’s tensile strength, give recommendation.
- Using the test result and Rocdata software, determine UCS, β, c, and φ values of your rock. How do your results from Mohr-Coulomb plots compare to Rocdata results?
- Compare the uniaxial compressive strength value interpreted from the triaxial tests
against the results from a) the actual UCS tests you performed in the previous lab class, b) point load index tests, and c) schmidt hammer tests. Which of the UCS value do you think should be used in practice? Why?
- The Mohr criterion of brittle failure suggests that the relation between the angle of
internal friction, φ, and the angle between the failure plane and the principal stress plane is always given by
2 + 45 = o φ
β
321Triax_UO_S12 4

Comment on how the β parameter calculated from the above formula compare to your specimen’s failure plane angle (see the first item in the “Reporting of results” section above).
- Suggest a linear strength formula for the rock - - Did you experience difficulties during testing? Do you have any recommendations on
the testing procedure?
• Conclusion
- Briefly summarize your method and the results obtained
321Triax_UO_S12 5

Colorado School of Mines Mining Engineering Department
MNGN 321 Introduction to Rock Mechanics Laboratory Classes
Direct Shear Strength Test
1. Purpose Direct shear strength test aims at establishing the shear strength – normal stress and shear stress – shear displacement relationships of a discontinuity surface. The ASTM D5607 document gives the full testing procedure. This laboratory experiment is limited to establishing shear strength as function of normal stress based on Mohr-Coulomb and Barton shear failure criteria. 2. Equipment and Procedure Equipment used for testing includes: • Coring machine • Caliper with 0.001-inch accuracy • DR-44 Direct Shear Machine with specimen holding rings The testing machine provides a direct shear strength reading for the normal load applied on the discontinuity. Usually, the tests are performed using under three or more normal load levels. The shear strength is established as function of normal stress by plotting the test results. The procedures used in this laboratory exercise for specimen preparation and testing are given below. Specimen preparation
1. Cut a sample that includes the discontinuity from the core with a length/diameter ratio of approximately of 2:1. The length should be long enough to cast the specimen in the upper and lower specimen holding rings.
2. Allow the specimen to air dry for at least 12 hours prior to testing.
3. Record all pertinent information and measurements on the test sheet.
4. Measure sample dimensions to include length and diameter at 3 points (all measurements
to the nearest 0.1 mm).
5. Measure the Joint Roughness Coefficient (JRC) and Joint Compressive Strength (JCS) of the discontinuity.
6. Measure the specimen dimensions to determine shear surface area. Also record the ……… for the determination of normal and shear values at failure.
321DirectShear_UO_F12

7. Log the specimen to indicate the position, orientation, and condition of existing discontinuities, such as joints, fractures and bedding/foliation. Make a sketch on the test sheet to show any daylighting rock discontinuities on the specimen surface.
Testing
1. Place and secure the specimen between the platens of the testing machine. 2. Apply a normal stress magnitude (usually between 1 to 5 MPa) depending upon the type
of rock to being tested and the expected normal stresses that the discontinuity is likely to be loaded in situ.
3. Load the upper part of the specimen on its side to create a shear motion along the
discontinuity surface in shear motion by activating the hydraulic cylinder of the test apparatus.
4. Record the maximum shear load sustained by the specimen.
5. Make a sketch of the failure on the test sheet.
3. Reporting of results • Cover page including
- lab exercise title - group #, - names of the group members attended the lab class and participated in report
preparation • Introduction
- Brief description - Specific objectives - Significance of the test
• Methodology, equipment - General information including testing equipment, lithological description of the rock,
specimen dimensions - Brief description of testing procedure
• Results
- Include in your report o Normal stress – shear strength plot of the test data o Cohesion and friction angle o JRC and JCS for the discontinuity surface o Mohr- Coulomb shear strength of the discontinuity o Barton shear strength of the discontinuity
321DirectShear_UO_F12 2

• Discussion
- Comment on the reliability of your test results - How do the two shear strength criteria compare?
• Conclusion
- Briefly state and comment on your results.
321DirectShear_UO_F12 3

Analysis of stress and strength around circular excavations
using the Boundary Element program Examine2D
Objective
In this laboratory class, you will solve Problem 2 in the “Stresses around Excavations”
chapter. You will also perform k-ratio sensitivity analyses for the stress and stability
distributions around circular excavations.
Plot the distribution of maximum principal stresses along the horizontal line L between a set of twin tunnels shown in the diagram below. Take k = 1 and rock mass density = 2650 kg/m3.
Procedure
Find Rocscience in Program files, find and run Examine2D. Once you are in the
program, go through these stages to set up the conditions for Problem 2:
1- In the Analysis tab, chose Project Settings and then check against Generalized
Hoek-Brown.
2- Calculate the virgin stress magnitude and enter these on the appropriate boxes on
the right margin.
Set k = 1, and rock mass density ρ = 2650 kg/m3. Determine vertical component
of the virgin stress:
σv = ρ g H = [2650 (kg/m3) 9.81 (m/s2) 200 (m)] / 1x10⁹
σ1 = σv = 5.2 MPa
3- In the same margin, also enter the H-B strength properties as σci: 35 MPa; mb=
1.5; s = 0.042; a = 0.5. Leave the elastic properties as is, i.e. Em=10000 MPa and
Poisson’s ratio = 0.2.
4- Go to Boundaries tab and choose Add Excavation.
1 March 13, 2013_UO

5- Use the small window on the bottom right of the screen for entering the
coordinates of the tunnel. Place the “left tunnel” center at location 0,0. You
should see the tunnel and the maximum stress distribution around it. Place your
second excavation to the right at 16 m centers.
6- Save your file.
Analysis
a) Answer Question 2 in the Stress around Excavations Chapter (see above)
b) How do your analytic and numerical modeling results compare?
c) Using the “Strength Factor” option in the program, evaluate the compressive
failure conditions around the excavations. Give a summary of your findings
supported by relevant plots.
d) Change the k-ratio to 0.5. What changes do you observe in terms of principal
stresses and strength factor around the excavations?
e) Change the k-ratio to 2. What changes do you observe in terms of principal
stresses and strength factor around the excavations?
f) Using the numerical model you have, determine the magnitude and direction of
the principal stresses at point A , located 2 m to the right from the excavation on
left as shown in the figure below, for the two different cases of k=0.5 and k=1.
g) Solve (f) above using the analytical formulae given in Page 8 of Chapter 6.
Compare your results to comment on the validity and similarity of the solutions of
(f) and (g).
Reporting
2 March 13, 2013_UO

The report for this lab session will be prepared in the usual format described in the
“Laboratory Class Outline” section.
3 March 13, 2013_UO

Scanline Survey and RQD Measurements at the Edgar Mine 1. SCANLINE SURVEY 1. 1. Purpose The purpose of this exercise is to learn to collect the structural data of rockmass for design and planning using Scanline survey, which is a basic technique used in mapping surface or underground exposures. 1. 2. Procedure A scanline is a line set on the surface of the rock mass. The scanline survey consists of recording data for all discontinuities that intersect the scan line along its length. An alternative approach is to measure all discontinuities within a defined area on the rock face, but this is more difficult to control and do systematically than are scan line surveys. In practice, a scanline is a measuring tape fixed to the rock face by short lengths of wire attached to masonry nails hammered into the rock. The nails should be spaced at approximately 3 m intervals along the tape that must be kept as taut and as straight as possible. Once the scanline is established, the location, date, rock type, face orientation, scanline orientation and name of the surveyor are recorded on the logging sheet (Figure 1). Surveyors should then carefully and systematically work their way along the scan line recording the following features for each discontinuity intersecting the scan line (Figure 2): D: Distance along the scan line to the point at which the discontinuity intersects the scan line (in
m rounded to nearest cm). Record whether the feature is geological or blast induced. L: Length of the discontinuity measured above the scan line. T: Nature of the termination point (A= at another discontinuity; I= in rock material; O=obscured
or extending the extremity of the exposure). Orientation: Dip direction/Dip measured at or near the point of intersection with the scan line
using a suitable magnetic compass. C: Curvature or waviness on the numerical scale of, say 1 (undulating) to 5 (planar). R: Roughness of small-scale irregularities on the numerical scale of 1 (rough) to 5 (smooth). A: Aperture of the discontinuities in mm, if any. Comments: On one or more of the following discontinuity properties: type of discontinuity, nature of any in filling present, water inflow, zones of broken or obscured rock, aperture, slickensideness, sample locations.
1.14_321_EDGAR_ScanLine_RQDUO_12F.doc 1

Figure 1. An example of completed scanline survey sheet.
Figure 2. Elements of a scanline survey
1.14_321_EDGAR_ScanLine_RQDUO_12F.doc 2

SCANLINE SURVEY SHEET
Location:…………………………. Date:………………….
Rock Type:……………………….
Face Orientation:…………………………………………..
Scanline Orientation:………………………………………
Recorded by:……………………..
D L T Orientation C R A Comments (m) (m) (Dip direction/Dip)
D: Distance to discontinuity. L: Length of discontinuity above scanline. T: Termination point (A=At another discontinuity; I=In rock material; O=Obscured or out exposure). O: Orientation (Dip direction/Dip). C: Curvature or waviness (1 to 5). R: Roughness (1 to 5). Comments – Any + nature of any in filling present.
1.14_321_EDGAR_ScanLine_RQDUO_12F.doc 3

2. RQD MEASUREMENTS The Rock Quality Designation (RQD) index is a core recovery percentage used to quantify natural fracture where unrecovered core, fragments and small pieces of rock downgrade the quality designation of rock containing these features. 2. 1. Purpose The purpose of this laboratory exercise is to learn how to determine RQD (Rock Quality Designation), RMR (Rock Mass Rating), and Q (Rock Tunneling Quality Index) from the given rock core samples obtained from Edgar experimental mine. Later on during the semester, you will be able to categorize and design support systems using RMR and Q values. 2. 2. Procedure The RQD is basically a core recovery percentage in which all the pieces of sound core over 100 mm long are summed and divided by the length of the core run. The correct procedure for measurement is illustrated in Figure 1. The steps involved in calculating the RQD are: 1. Align the core from top to bottom as it was received from the core barrels (for the class: the
top and bottom of the boxes are already marked). 2. Measure the total length of the core barrel used to obtain the core run (for the class: each box
has capacity of 10 feet). 3. Measure the length of the core present in the box and divide it by total capacity of the box.
This will give you the total recovery percentage of the core. 4. Measure the length of the core pieces which are 4 inches or greater in length and add their
lengths and then divide it by total core run. This will give you the RQD percentage. Core Size RQD was originally developed for NX size core (2.16 in (54.7 mm) diameter). The experience has shown that other core sizes are also applicable to recording RQD measurements. Variable length requirements for RQD measurements have been proposed, for example instead of using the standard 4 inch (100 mm) requisite length, a length equal to double the core diameter was advocated. It is recommended that a 4 inch (100mm) requisite length should be used in all cases for the purposes of standardization and comparison. Moreover, with good drilling techniques the lengths of the core pieces will be same regardless of the core diameter, since the spacing of natural unbounded joints does not change. Measurement of Core Lengths There are various ways to measure the length of a core piece. The same piece of core could be measured along the centerline, from tip to tip or along the fully circular barrel section. The recommended procedure is to measure the core length along the centerline as shown in Figure 1.
1.14_321_EDGAR_ScanLine_RQDUO_12F.doc 4

Figure 1. Procedure for measurement and calculation of RQD 3. REPORTING OF RESULTS In preparing your report, you will use the data you obtained from your scanline and RQD measurements, except that you will share the dip direction data with the rest of the class. To share the dip-direction data, put your data in an excel file in two columns (dip and dip direction) and send the file to your TA. The TA will upload all groups dip / dip direction data on Blackboard so that you can download the files from all the groups in class for your stereo net plot of discontinuities.
The report will include the following: • Objective of the exercise • Summary of the scanline and measurement results, including
a) Number of acanline sections and core runs (or boxes) measured b) Lithologic description of the rock (for each scanline / core run) c) Core size in (diameter)
d) RQD determination for each box f) Recovery calculation for each box e) Any other visual observation for each box
1.14_321_EDGAR_ScanLine_RQDUO_12F.doc 5

g) Stereonet plot of your data to determine the number joints sets and their orientation. h) RMR and Q values for the site i) Verification of your RMR and Q values
How to get to CSM’s Edgar mine
1.14_321_EDGAR_ScanLine_RQDUO_12F.doc 6

Edgar mine Underground plan
1.14_321_EDGAR_ScanLine_RQDUO_12F.doc 7

Colorado School of Mines Mining Engineering Department
MNGN 321 Introductory Rock Mechanics Laboratory Classes
Discontinuity Data Analysis and Stereonets
1. Purpose In this exercise you will analyze discontinuity (fracture) data using stereonets in establishing number of joints sets and their orientation. 2. Equipment For this exercise you will need: • stereonets (provided) • tracing paper 3. Procedure This exercise consists of three parts, using the information you recorded for the fractures mapped from the two mapping lines in the Edgar Mine: a) Stereonet plotting of joint poles Each team mapped one line parallel to the shear zones (A-Left or B-Left) and one line perpendicular to them (the Research Room or the Drill Display). Perform the following steps separately for the data from each line:
i. Plot the poles for all the joints on a single stereonet overlay as practiced during the laboratory class on the subject.
ii. Contour the density plot by hand on the overlay. Use 3 to 5 contours. iii. Estimate and mark on the overlay, the location of the centers of density for each of the
clusters of joint poles. Each center of pole concentration, as indicated by the contours, represents the average orientation of a joint set. Label each set.
b) Calculation of average joint properties Once you have completed part (a), the next task is to determine the “average” joint properties of each of the joint sets.
i. Tabulate the joints according to which set they belong to, including location on the mapping line and all other characteristics.
ii. Calculate the apparent spacing between consecutive members of the same joint set. Average the apparent spacings for each set.
MNGN321_Disc_Stereonets_UO_F08 1

iii. Determine the most common roughness, planarity, mineral lining/filling, and moisture condition for each joint set.
4. Reporting of Results Report the mean orientation for each joint set from each mapping line. Report the complete characteristics of an “average” fracture from each joint set, including apparent spacing. Discuss any differences between the two lines and possible reasons for them. Identify any potential failure blocks in the roof and in either rib. Discuss your findings. Include the following as appendices: All overlays and plots, fully labeled Spreadsheet with all joint data, separated according to joint set The hand calculation to check the spacing algorithm 5. References Brady, G.H.G. and E.T. Brown, 2004. Rock Mechanics for Underground Mining, 2nd edition, Chapman & Hall, New York, Section 3.6 and Appendix A.
MNGN321_Disc_Stereonets_UO_F12 2

Colorado School of Mines Mining Engineering Department
MNGN 321 Introductory Rock Mechanics Laboratory Classes
Rock Mass Rating (RMR), and Tunneling Quality Index (Q)
1. Purpose The purpose of this laboratory exercise is to learn how to establish RMR (Rock Mass Rating) and Q (Rock Tunneling Quality Index) values from the measurements taken at a site at the Edgar Experimental Mine. The exercise also includes an introductory section on the selection of a support system using the RMR and Q values determined for the site. 2. Procedure
2.1 Calculate RMR value for the site measured at the Edgar Mine (e.g. RQD, discontinuity spacing, etc)
2.2 Also calculate Q value for the site Use the following additional information as needed: a) The RQD and UCS core samples were taken at the depth of 180m.
b) UCS value is 120 MPa based on the lab test conducted previously. c) Condition for ground water is dry and minor inflow, < 5 liter/meter. d) k ratio is 1 e) For the excavation type, assume 3m-wide permanent mine opening
2.4 Specify the support design system for the section measured based on RMR and Q Refer to relevant tables in the “Support of Underground Excavations” chapter in your Course Notes.
2.5 Reporting of Results
a) Objective of exercise b) Brief background and description of the experimental process c) Summary of the results d) Compare RMR and Q values using the formulae given below:
RMR = 9 lnQ + 44 (Bieniawski, 1976)
321RQD_UO_F12 1

References • Deere, D. U. and Deere, D. W. “The Rock Quality Designation (RQD) Index in Practice,”
Rock Classification systems for Engineering Purposes, ASTM STP 984. Louis Kirkaldie. Ed., American Society for Testing and Materials, Philadelphia, 1988, pp. 91-101
• Brady, B. H. G. & Brown E. T. (2006) “Rock Mechanics for Underground mining” Chapman
& Hall, London (Third edition)
1.16_321RMR&Q_UO_F12.doc 2

Slope Stability Analysis Lab Assignments
Prepare one report for both Swedge and Slide simulations using the format described in your “Lab Notes”
Wedge Failure Analysis Solve the problem stated below using the Swedge computer program.
Take unit weights of rock as γ = 25 kN/m3 and water as γw= 9.81 kN/m3.
Problem: 1. Calculate the safety factor for the 40 m high wedge (30.8 m on the slope)
with the characteristics given in the table below. Assume water in the planes but no tension crack.
2. Perform an analysis of the effect of water pressure in the planes (fissures) on the stability of the wedge. Use a plot of SF against fissure water levels.
3. Compare the effectiveness of applying bolts in the case of water filled fissures to achieve the safety factor of the fully undrained fissures.
Plane
Dip
Dip direction
Friction
Cohesion (kPa)
Slope surface 65o 185 o
Upper surface 12 o 195 o
A 45 o 105 o 20 o 24
B 70 o 235 o 30 o 48
1 1.17_321_SWEDGE_SLIDE_F12.doc

Circular Failure Analysis The 30 m high road-cut shown in the figure below has a slope angle of 45o. It is excavated in a weak, homogenous rockmass (c=0.1 MPa, φ=16o), which contains water. Boreholes drilled at three locations define the phreatic surface as shown in the diagram and table below. There is no observable tension crack within or behind the slope. 1. Determine the safety factor for the slope 2. How much improvement can be expected if the water table is reduced down to 8 m from the slope mid-height and 20 m from the crest and behind? 3. Study the effect of cohesion on the slope’s safety factor by running additional simulations to generate a safety factor vs cohesion plot. Use original water levels as given in the figure below. Take the specific weights of rockmass and water density 25 kN/m3 and 10 kN//m3, respectively.
2 1.17_321_SWEDGE_SLIDE_F12.doc

Colorado School of Mines _________________________ Class [insert correct class title/number]
Student Liability Waiver and Release Agreement I, ___________________________________, a student at the Colorado School of Mines (“CSM”), have enrolled in the CSM course MNGN321 Introduction to Rock Mechanics and desire to participate in all course activities and field trips (“Course Activities”). I understand that required Course Activities include: Rock Mechanics laboratory classes, which involves use of machinery at the CSM laboratories, traveling to and from the Edgar Mine in my personally arranged transport or travel arranged by the CSM, and measurement, data collection, and installing instrumentation in and outside of the Edgar Mine. I further understand that students will be required to travel to and from the field trip site at Edgar Mine, Idaho Springs via personal vehicle or motor vehicles arranged by CSM. I understand that participating in the Course Activities requires a significant level of physical exertion on my part, and that such Activities and travel to and from the course and field trip sites involve an inherent risk of physical injury or death to me, as well as damage to, or destruction of my personal property. I understand and acknowledge that specific risks of the Course Activities include, but are not limited to the following:
[Please supplement or modify these as appropriate for Course Activities or Field Trip.] • Hiking or walking along trails, sidewalks, walkways or even roads may cause damage to equipment or personal
injuries. • Vehicle and airplane accidents may result in property damage and physical injuries such as scrapes, abrasions,
sprains, broken bones, torn muscles or ligaments, head, neck or spinal injuries, or death. • Poisonous or dangerous plants, insects or animals might be encountered. • Exposure to the natural elements can be uncomfortable or harmful. Sunburn, dehydration, heat exhaustion, heat
stroke, wind, rain, and being outdoors can be uncomfortable or cause injury or illness. • Risks also include injuries or damages resulting from certain decisions and conduct, including the risk that a course
instructor, co-instructor or other participant may misjudge someone’s capabilities, or misjudge weather, terrain, water level, or route location etc.
• Environmental risks include rapidly moving, deep or cold water, rough ocean surf, steep and rocky terrain, insects, snakes, predators, and other animals; falling or rolling rock, hot molten lava, lightning, fires, flash floods and unpredictable forces of nature, including weather that may change to extreme conditions without notice. Such environmental conditions pose additional risks, including hypothermia, frostbite, frost nip, sunburn, heatstroke, dehydration, and other mild or serious conditions.
• Other risks include: Working in a non-production, underground mine. ________________________________________________________________________________.
In exchange for the opportunity to participate in and receive academic credit for the Introduction to Rock Mechanics Course Activities, I hereby assume all risk of injury to myself and my property that I may suffer as a result of my participation in any Course Activities, including transportation to and from course and field trip sites. On behalf of myself as well as my heirs, administrators, executors, and assigns, I hereby RELEASE AND FOREVER DISCHARGE THE STATE OF COLORADO AND CSM, AS WELL AS ITS TRUSTEES, OFFICERS, AGENTS AND EMPLOYEES, FROM ANY AND ALL CLAIMS, DEMANDS, AND CAUSES OF ACTION, OF WHATEVER KIND OR NATURE, EITHER IN LAW OR IN EQUITY, ARISING FROM, OR IN ANY WAY CONNECTED WITH MY PARTICIPATION IN THE COURSE ACTIVITIES. IN ADDITION, I AGREE TO INDEMNIFY AND HOLD THE ABOVE-NAMED ENTITIES AND INDIVIDUALS HARMLESS FROM ANY LOSS, LIABILITY, DAMAGE, OR COST THAT THEY MAY INCUR AS A DIRECT OR INDIRECT RESULT
1

OF MY PARTICIPATION IN THE COURSE ACTIVITIES. I hereby agree that if CSM is compelled to defend any action, lawsuit or litigation by myself, my executors, or my heirs, on my family’s or my behalf, my heirs or executors and I agree to pay CSM’s costs and attorney’s fees if CSM successfully defends such action, lawsuit or litigation.
I further state that there are no health-related reasons or problems that would preclude or restrict my participation in the Course Activities, and that I have adequate health insurance necessary to provide for and pay any medical costs that I may incur as a result of illness or injury during the course of my participation in the Course Activities. If I require emergency medical action or treatment, I hereby consent to being transported by CSM to a hospital or medical care facility, and consent to being administered medical care by the physician or licensed hospital or medical care facility deemed by the CSM representative in charge to be the most expedient and appropriate under the circumstances. I understand and agree that CSM assumes no responsibility for any injury or damage that might arise out of or in connection with such authorized emergency medical treatment or my transportation to or from the medical care facility. I agree that this Liability Waiver and Release Agreement is intended to be as broad and inclusive as permitted by the laws of the State of Colorado, and that if any portion herein is held to be invalid or unenforceable, the balance shall continue in full legal force and effect. This agreement and the legal relations among the parties hereto shall be governed by and construed in accordance with the laws of the State of Colorado. Nothing in this Liability Waiver and Release Agreement shall be construed to waive, limit, or otherwise modify any governmental immunity that may be available to CSM’s trustees, officers, employees, agents and representatives under the Colorado Governmental Immunity Act, Colorado Revised Statutes § 24-10-101, et seq. By my signature below, I acknowledge and represent that I have carefully read this document in its entirety, understand its contents and effect, and am executing it voluntarily of my own free will. ___________________________________ ________________________________ Student Signature Parent Signature (Required if Student is under 18 years old) ___________________________________ ___________________________________ Date Date
2