lab meeting
DESCRIPTION
Lab Meeting. Performance Analysis of Distributed Embedded Systems Lothar Thiele and Ernesto Wandeler Presented by Alex Cameron 17 th August, 2012. One cause for end-to-end timing constraints is the fact that embedded - PowerPoint PPT PresentationTRANSCRIPT

Lab Meeting
Performance Analysis of Distributed Embedded SystemsLothar Thiele and Ernesto Wandeler
Presented byAlex Cameron
17th August, 2012

One cause for end-to-end timing constraints is the fact that embeddedsystems are frequently connected to a physical environment through sensorsand actuators. Typically, embedded systems are reactive systems that arein continuous interaction with their environment and they must execute ata pace determined by that environment.
A real-time constraint is called hard, if not meeting that constraint could resultin a catastrophic failure of the system, and it is called soft otherwise. As aconsequence, time-predictability in the strong sense can not be guaranteedusing statistical arguments.
Performance Analysis using Network Calculus presents an elegant methodology for offering performance guarantees in deterministic queuing systems.
“It is the purpose of performance analysis to determine the timing and memory properties of such systems.” !!
Failures of embedded systems very often relate to timing anomalies that happen infrequently and therefore, are almost impossible to discover by simulation….

3
Consider an Embedded Real-Time System Comprising Two Applications
Threat
Sensor
CPU DSP
Actuator
Detection
Data
Launch
BCET WCETt
A1 A2
P1, P2
P3
P5,P6
P4
Interference between bus and Apps means competing BCET and WCET

Consider the System when Network Enabled
4
Threat
Sensor
CPU DSP
Actuator
Detection
Data
Launch
A1 A2
Service 1 Service 2
BCET WCETt

Example Arrival Patterns
Basic arrival functions for a set of arrival patterns that can be derived using Patterns (e.g. sensor), Trace (measure) or Specifications (Data Sheets)

Effect of Deadline Variance for given Event Arrival Rate
Figure 12: Graph shows the normalised rate of missed deadlines for the LLF scheduling algorithm plotted against the ratio of the deadline to the Poisson arrival mean for a range of variances (jitter) in the deadline. The graphs have been smoothed but were based on a sample of 200 arrivals for each measured point on the curve. These results are for a complex workflow comprising five services running on a single CPU.
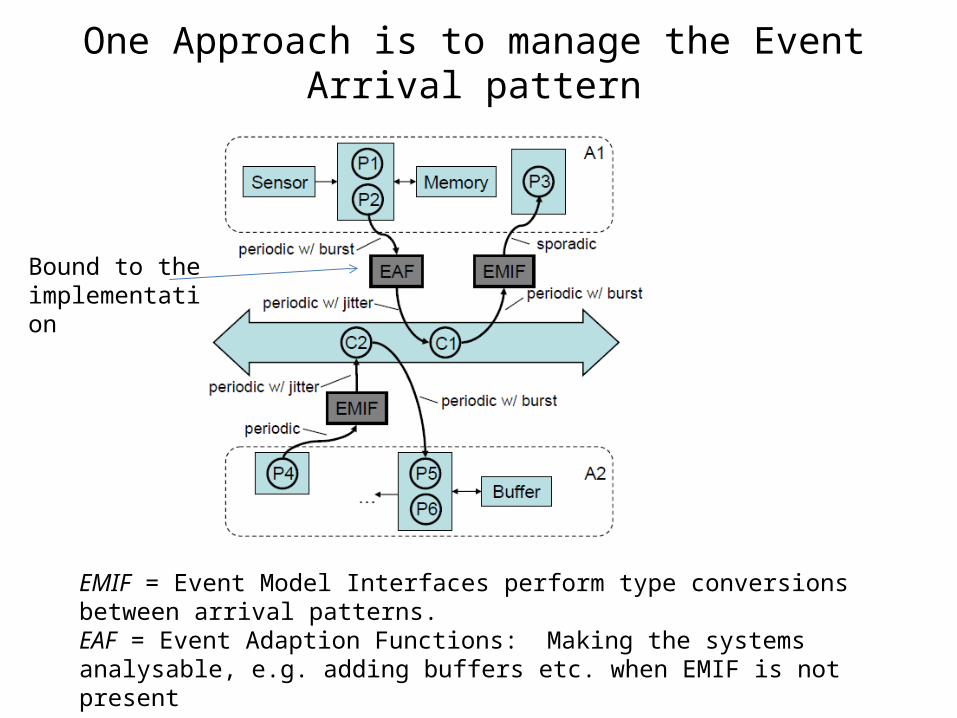
One Approach is to manage the Event Arrival pattern
EMIF = Event Model Interfaces perform type conversions between arrival patterns.EAF = Event Adaption Functions: Making the systems analysable, e.g. adding buffers etc. when EMIF is not present
Bound to the implementation

The Concept
𝐴 (𝑡 )− 𝐴 (𝑠)≤ 𝜌 (𝑡−𝑠)+𝜎
The Network Calculus traffic characterisation model
The guarantee – either regulator or leaky bucket

Performance Network Approach
Resource Modelling: In comparison to functional validation, we need to model the resource capabilities and how they are changed by the workload of tasks or communication. Therefore, contrary to the approaches described before, we will model the resources explicitly as ‘first class citizens'.
AbstractionsArrival Curves
Abstractions
Resource ModellingService Functions

Primary Difficulty - Modelling the Workload
WCET and BCET: The simplest possibility is to assume that each event of an event stream triggers the same task and that this task has a given worst case and best case execution time determined by other methods. Application Modelling: Take into account the characteristics of the application, e.g. (a) distinguishing between different event types each one triggering a different task and modelling various WCET (or BCET). This way, one can model correlations in event streams. Each incoming event, a subtask generates the associated workload and the program branches to one of its successors.Trace: As in the case of arrival curves, we can use a given trace and re- port the workloads associated to each event, e,g, by simulation. Based on this information, we can easily compute the upper and lower envelope.

The Outcome
Figure 12: Representation of the delay and accumulated buffer space computation in a performance network.

DISCUSSIONS

BACKUP SLIDES

14
Distributed Real-Time Event Driven Service Oriented Architectural
Implementation
Deterministic Measures
Performance Measures
Threat
Sensor ActuatorDetection Launch
VMSA
Event Synchronised Petri Nets (CSPN) Model
Architecture to Petri Net Mapping
Random Events
Decision Variables
Random Variate Generator
Predictive Measures
Discrete Event Simulator
Response
Applicability

And What about the Event Arrival Patterns?
periodic
𝑡1 𝑡1+1 T
𝑡𝑖+1−𝑡𝑖=𝑇
Periodic withJitter𝑡1 T
𝑡𝑖=𝑖∗𝑇+𝜑𝑖+𝜑0
JAdmissible occurrence of event
