lab 3 - geometrical optics theory - dartmouth …physics/labs/descriptions/geometrical...physics 23...
TRANSCRIPT

Physics 23 Fall 1988 Lab 3 - Geometrical Optics Theory
This laboratory is an exercise in geometrical optics, the reflection and refraction of light
when it strikes the surface between air and glass, or air and water. It consists of three parts (which can, and for practical purposes probably should, be done in any order). The first two parts are a study of the deflection of a ray of light by a prism and by a spherical "raindrop". There are two basic laws involved in these parts: the law of reflection and Snell's law . The third part is a study of the imaging properties of simple thin lenses. In that part, the basic relationships involved are Snell's law of refraction and the lens equation.
Part I - Ray Deviation by a Prism A ray of light is both reflected and refracted when it strikes a plane, transparent surface (e.g.
glass). The direction of the rays is given with respect to the normal to the surface; we label the angles of the incident, reflected, and refracted rays as φ , r , and φ' , respectively. They are related by the formulas
and
where n and n' are the indices of refraction of the two sides of the surface. As shown in Figure 1a on the next page, the deviation of the ray upon reflection is
and the deviation upon refraction is
The figure is drawn for the case when n' > n and φ' < φ , but the same principles hold in n < n' and the refracted ray is bent away from the normal.
Light striking a prism can suffer two such refractions, as shown in figure 1b. In this figure, a

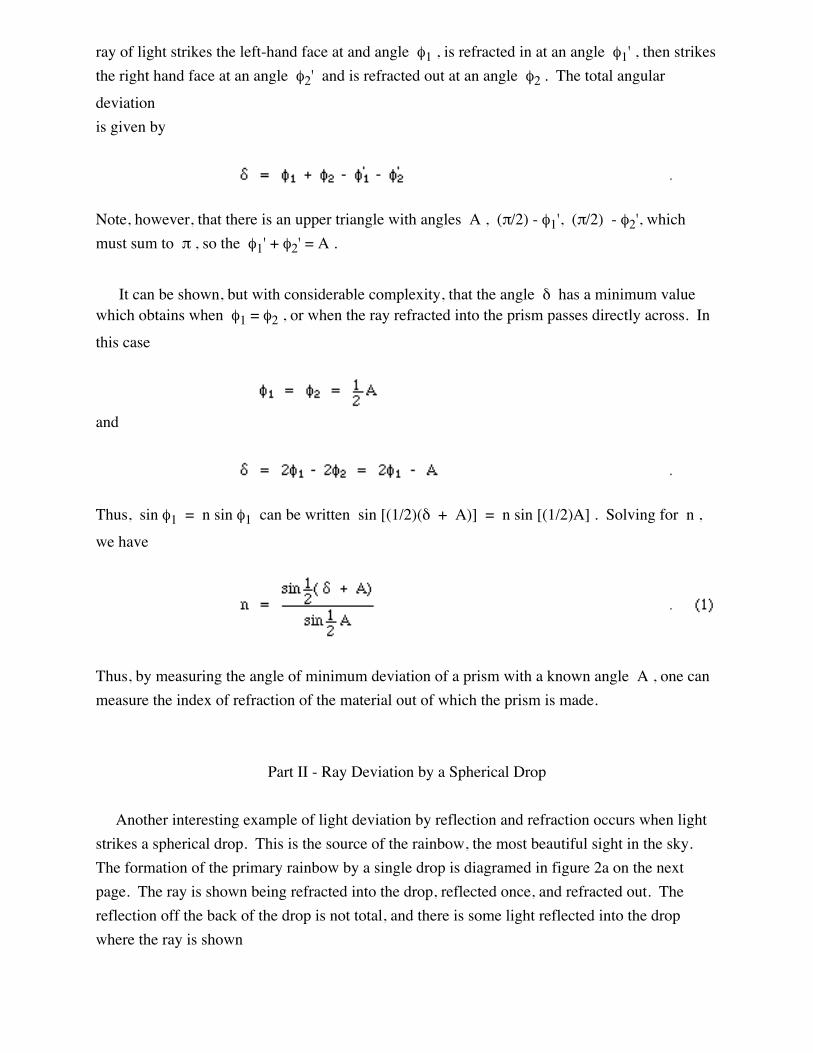
ray of light strikes the left-hand face at and angle φ1 , is refracted in at an angle φ1' , then strikes the right hand face at an angle φ2' and is refracted out at an angle φ2 . The total angular
deviation is given by
Note, however, that there is an upper triangle with angles A , (π/2) - φ1', (π/2) - φ2', which must sum to π , so the φ1' + φ2' = A .
It can be shown, but with considerable complexity, that the angle δ has a minimum value
which obtains when φ1 = φ2 , or when the ray refracted into the prism passes directly across. In
this case
and
Thus, sin φ1 = n sin φ1 can be written sin [(1/2)(δ + A)] = n sin [(1/2)A] . Solving for n ,
we have
Thus, by measuring the angle of minimum deviation of a prism with a known angle A , one can measure the index of refraction of the material out of which the prism is made.
Part II - Ray Deviation by a Spherical Drop
Another interesting example of light deviation by reflection and refraction occurs when light strikes a spherical drop. This is the source of the rainbow, the most beautiful sight in the sky. The formation of the primary rainbow by a single drop is diagramed in figure 2a on the next page. The ray is shown being refracted into the drop, reflected once, and refracted out. The reflection off the back of the drop is not total, and there is some light reflected into the drop where the ray is shown


being refracted out. In principle, the ray will continue to be reflected around and refracted out of the drop many times. We will consider only the case shown, the course of the primary rainbow, and the results of a second reflection and refraction, the source of the secondary rainbow. As shown in figure 2b, the first reflected ray and the first three refracted rays are classified 1 through 4, respectively. The impact parameter ρ is the distance between the original ray trajectory and a parallel line passing through the center of the drop; ρ is given as a fraction of the drop radius, so for cases of interest 0 < ρ < 1 . The object is to find an expression for the angle of deviation α as a function of ρ . Since φ is measured with respect to the normal to the surface, and since the normal to a spherical surface is the radius, it can be seen that sin φ = ρ . One can then calculate α for any number of reflections for any given ρ ; α will be a function of k , the number of internal reflections and n the index of refraction of the drop. It is found that with the drop, as with the prism, there is a minimum value for α . The deviated, or back-scattered, light reaches a maximum intensity when it is concentrated at this mini- mum angle. Since the water in the drop has a different n for each wavelength, the light of different wavelengths (colors) is concentrated at different angles of back-scatter. This dispersion of the white light into component colors by the drops is the primary cause of the colors of the rainbows. Figure 2a shows the basic detail for calculating the angle of deviation α of a ray after being refracted into a spherical drop, reflected once, and then refracted out. The angles of incidence and refraction are all measured with respect to the normal to the surface, and the normals are all radii which intersect at the center. Note from the figure that the path of the ray inside the drop, before and after reflection, forms an isosceles triangle with two radii, the angles of which are φ' , φ' and π - 2φ' . The first deviation is φ - φ' ; the second deviation (and the deviation of every subsequent reflection) is π - 2φ' ; the deviation upon refraction out of the drop is again φ - φ' . If there is only one reflection (the primary rainbow), the total deviation is
We have that sin φ = ρ , where ρ is the impact parameter and, by Snell's Law, sin φ = n sin φ', where n is the index of refraction of the liquid (n = 1.33 for water). The value of α increases as ρ and φ increase up to a point, where upon it decreases again.
The maximum value of α can be found by taking the derivation of α with respect to φ ,
and setting dα/dφ = 0. The derivative is

Since, from Snell's Law, cos φ dφ = n cos φ' dφ' , we have
and cos2 φ' = 1 - sin2 φ' = 1 - (1/n2) sin2 φ so that
If we set the right-hand side of the equation equal to 0, cross multiply and square, we have
or
If n = 1.33, cos φ = 0.506 and φ = 59.6 . From Snell's Law it follows that φ' = 40.4 and α = 180 + 2(59.6) - 4(40.4) = 138˚ . This is the angle the positive direction of the primary rainbow ray makes with the position direction of the incoming rays. There is then an angle of 42˚ between them if one measures down from the incoming rays to the rainbow ray.
If there are k reflections inside the drop (k = 1, 2, 3,...), then
Following the same procedure,
which (setting the right side equal to 0) results in
For k = 2, φk = 72 , φ'k = 45.6˚ , and α = 360 + 2(72) - 6(45.6) = 230˚. These rays make an
angle of 230˚ - 180˚ = 50˚ with respect to the original rays. These results are only accurate to three significant figures; more accurate calculations for these and other values of n are given in the references.
Part III - Imaging With Simple Thin Lenses
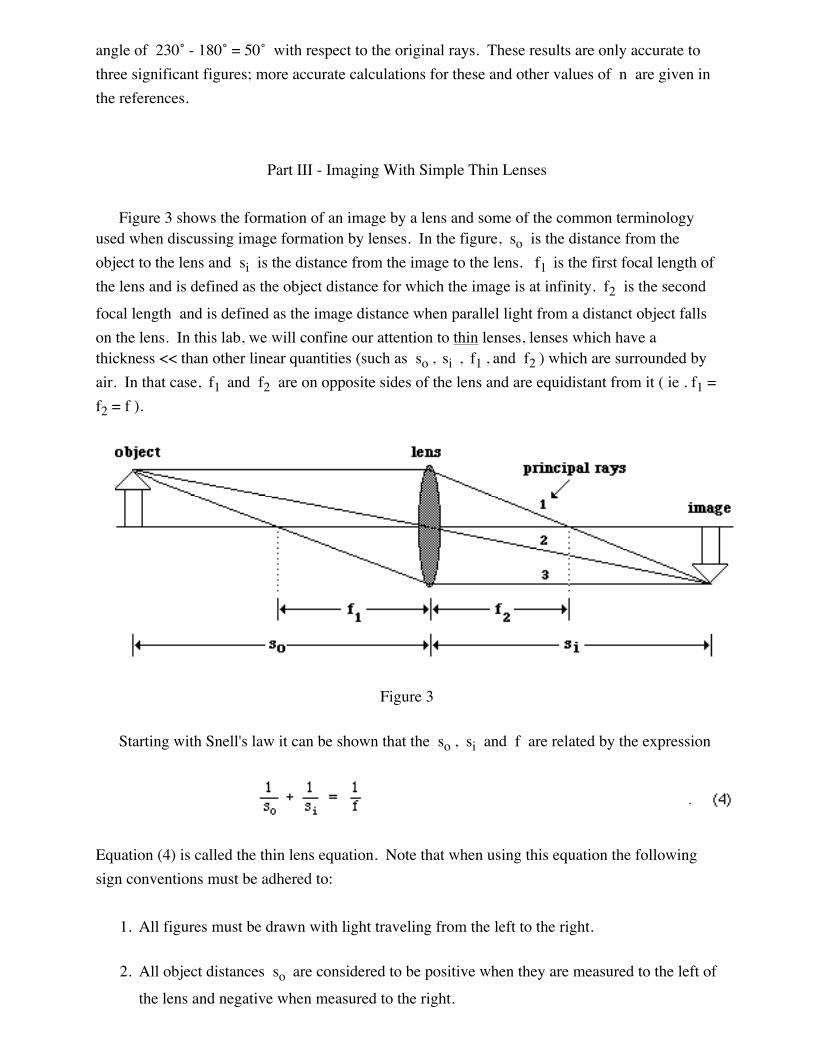
Figure 3 shows the formation of an image by a lens and some of the common terminology used when discussing image formation by lenses. In the figure, so is the distance from the object to the lens and si is the distance from the image to the lens. f1 is the first focal length of the lens and is defined as the object distance for which the image is at infinity. f2 is the second
focal length and is defined as the image distance when parallel light from a distanct object falls on the lens. In this lab, we will confine our attention to thin lenses, lenses which have a thickness << than other linear quantities (such as so , si , f1 , and f2 ) which are surrounded by air. In that case, f1 and f2 are on opposite sides of the lens and are equidistant from it ( ie . f1 = f2 = f ).
Figure 3 Starting with Snell's law it can be shown that the so , si and f are related by the expression
Equation (4) is called the thin lens equation. Note that when using this equation the following sign conventions must be adhered to:
1. All figures must be drawn with light traveling from the left to the right. 2. All object distances so are considered to be positive when they are measured to the left of
the lens and negative when measured to the right.

3. All image distances si are considered to be positive when they are measured to the right
of the lens and negative when measured to the left. If si is positive, then the image is real. This means that light actually passes through si and could be focused on a surface (such as a sheet of paper) located at si . If si is negative, then the image is virtual. This means that light does not actually pass through si but only appears to (why?). If a surface was placed at si no image would be formed on the surface.
The location of the image of an extended object, such as an arrow, can be located graphically
by using the following three facts: 1. A ray parallel to the axis and falling on the lens passes, either directly or when extended,
through the second focal point f2 (ray 1 in figure 3).
2. A ray falling on a lens after passing, either directly or when extended, through the first
focal point f1 will emerge from the lens parallel to the axis (ray 3 in figure 3).
3. A ray falling on the lens at its center will pass through undeflected (ray 2 in figure 3).
There is no deflection because the lens, near its center, behaves like a thin piece of glass with parallel sides. The direction of the light rays is not changed and the sideways displacement can be neglected because the lens thickness has been assumed to be negligible.
This technique of graphically locating the position of an image formed by a lens is called ray tracing. Figure 4 on the next page shows examples of ray tracing for three different situations: (1) image formation by a converging lens with so > f, (2) image formation by a converging lens
with


so < f , and (3) image formation by a diverging lens with so > f.
Finally, figure 5 shows a ray passing from the tip of the object through the center of the lens
to the tip of the image. Triangles abc and dec are similar triangles and we may write
The right side of this equation is si / so and the left side is -M where M is the magnification
factor. The minus sign is required because we wish M to be negative for an inverted image. Thus, this equation can be rewritten as
which holds for all types of thin lenses and for all object distances.
Figure 5
References
The following are the sections in the texts which are pertinent to this lab. They should be read before coming to lab.
1. Ohanian's Physics Chapter 37 sections 37.1 - 37.5 2. Halliday and Resnick's Physics Chapter 43 sections 43.1 - 43.4 3. Halliday and Resnick's Physics Chapter 44 sections 44.4 - 44.5

Experimental Purpose Part I - Ray Deviation by a Prism
The following theoretical predictions for the deviation of a light ray passing through a prism
were made in the theory section: a. when the angle of deviation δ is at a minimum, the refracted beams goes straight across
the prism parallel to its base; b. the minimum angle of deviation is given by the expression
and c. the index of refraction of the material from which the prism is made can be computed
from the expression
The experimental purpose of this part is to test the validity of these three theoretical predictions. Part II - Ray Deviation by a Spherical Drop
The following theoretical predictions for the deviation of a light ray passing through a
spherical raindrop were made in the theory section: a. for the primary rainbow ray (one internal reflection) when the maximum angle of
deviation α occurs, the angle between the positive direction of the primary rainbow ray and the positive direction of the incoming rays is 138˚;
b. for the case of two internal reflections (secondary rainbow ray) when the maximum angle
of deviation α occurs, the angle between the positive direction of the secondary rainbow ray and the positive direction of the incoming rays is 230˚; and
c. the impact parameter ρ is related to the the angle φ between the incoming ray and the
normal to the surface of the drop by the expression

The experimental purpose of this part is to test the validity of these three theoretical predictions. Part III - Imaging With Simple Thin Lenses
The purpose of this part of the laboratory is to gain familiarity with the imaging properties of
simple thin lenses, alone and in combinations, by observing the relationship between the size and location of the object and image. To a good approximation, certainly within the accuracy of this laboratory, the position and size of the image is given by the thin lens equation and the magnification formula:
Procedure Initial Alignment - Parts I and II
The apparatus for parts I and II of this experiment is shown schematically in figure 6 on the next page. It consists of a low power helium-neon laser, mirrors (including a constant-angle deflecting pair), a prism, a circular dish, a board on which the prism and circular dish can be placed for ray-tracing and graph paper and rulers for doing the tracing. A stand with a small piece of glass tubing, mounted so as to project into the beam, forms a cylindrical lens which spreads the beam and makes it visible as a long red line on the paper.
Caution: The laser used in this experiment is safe without goggles, but you should not look
directly into the beam, and you should avoid reflections straight to the eye. Keep the beam in a horizontal plane close to the table top and away from highly reflective objects.
The mirrors are first-surface, meaning that the silvered side is the front and can be
scratched easily. Please treat them very carefully.


The constant-angle deflecting mirrors are diagramed in figure 7. A horizontal beam of light strikes one mirror, is deflected down and then back up where it strikes a second mirror. If the upper mirror makes an angle β with the vertical, the angle of incidence is β and the ray is deflected by π - 2β upon the first reflection. The angle of incidence on the second mirror is A - β , and the ray is deflected by π - 2(A - β) at the second surface. The total deflection is thus 2π - 2Α (counter-clockwise) which is equivalent to a deflection in the opposite direction (clockwise) of 2A . Note that this deflection is constant, independent of the orientation of the mirrors as specified by the angle β . In our case, A is 45˚ so the deflection by the mirror is 90˚.
Figure 7
1. Tape a piece of polar graph paper to the raised portion of the blue board nearest the mirrors in
such a way that the 8.5 inch side of the paper is parallel to the short edge of the raised portion of the blue board (see figure 6). Orient the graph paper so that the 180˚ line is closest to the mirrors.
2. Place the constant angle deflecting mirrors on the same level of the blue board as the single
deflecting mirror and next to the short edge of the raised portion of the blue board to which the the polar graph paper is taped. Turn on the laser and adjust the mirror system so that the beam from the laser is reflected from single deflecting mirror to the constant angle deflecting mirrors and then from the the constant angle deflecting mirrors straight along the 180˚ - 0˚ line on the polar graph paper. An index card with a line drawn perpendicular to one of its edges can be used to track the direction of the beam. When the system is properly aligned, you should be able to move the line on the index card along the entire length of the 180˚ - 0˚ line on the graph paper and the light from the laser should remain fixed on the line on the index card.
3. Position the cylindrical lens between the single deflecting mirror and the constant angle
deflecting mirrors. Adjust the height of the cylindrical lens until the light from the laser beam

strikes the center of the glass rod. When properly aligned, the laser beam exiting from the cylindrical lens should be spread out into a vertical line and the base of this line after leaving the constant angle deflecting mirrors should be clearly seen going straight along the 180˚ - 0˚ line on the graph paper. [Note: although it is not necessary to do this lab in a dark room, many of the lab procedures can be done much more easily in subdued lighting. If you have a hard time seeing the line along the graph paper, turn off some or all of the lights in the room.]
Part I - The Equilateral Prism 1. Place the 60˚ prism in the center of the polar graph paper and observe the deviation of the
beam as the prism is turned. Adjust the prism carefully to produce the minimal deviation of the incident ray. Without moving the prism, mark on the paper the path of the incident ray, the ray reflected off the first surface, and the deviated ray. The index card with the line drawn on it can be used to track the paths of the various rays. As carefully as possible, mark the three points of the vertices of the prism. Remove the prism and draw in the surfaces of the prism.
2. On the graph paper, extend the reflected ray and the deviated ray back to the 180˚ - 0˚ line.
Use these lines and the provided protractor to measure φ1 and δ (as defined in figure 1).
3. From φ1 and δ , compute a value for the index of refraction for the glass from which the
prism is made. The prism is made out of optical glass. Look up the index of refraction for optical glass in the Handbook of Chemistry and Physics located in the lab. Compare this value with your experimentally measured value.
Part II - The Cylindrical Raindrop 1. Tape a clean sheet of polar coordinate graph paper to the board and repeat the initial
alignment procedures. Measure the diameter of the cylindrical glass dish and from that measurement compute its radius. Measure outward along the 180˚ line from the cross at the center of the graph paper a distance equal to the radius of the dish. Mark the spot. Repeat this process for the 0˚, 90˚ and 270˚ lines. Fill the cylindrical glass dish two thirds full of water and carefully place it on the graph paper. Using the four marks, align its center with the center of the paper. If the system is properly aligned, the laser beam going straight down the paper will be undeviated by the presence of the dish. If this is not the case, repeat the alignment procedures.
2. Move the constant angle mirrors back and forth and observe how the beam is reflected and

refracted off the dish. Locate the primary rainbow ray (see figure 2) by holding the index card in its path (it may be too dim to cast a line on the paper). Move the double mirrors until this ray is concentrated into the brightest line. When this condition is met, the beam is entering at the critical impact parameter, suffering the minimal deviation, and exiting at the rainbow angle. Trace a line along this ray. Trace in the incident ray and measure the lateral distance from the incoming ray to the center line. This distance, divided by the radius of the dish, is the impact parameter.
Remove the glass dish from the paper and extend the line of the path of the primary rainbow
ray back to the 180˚ - 0˚ line. Use the protractor to measure α as defined in figure 2. 3. Repeat procedures 1 and 2 of this part, locating the path of the the secondary rainbow ray. 4. Empty the cylindrical dish in the sink, remove all tape from the blue board and turn off the
laser. Initial Alignment - Part III
The apparatus consists of a one-meter optical bench mounted on a board, some riders for
attaching apparatus to the bench, an object lamp, lenses, lens holders and a screen for locating the final image. There are nine lenses in all, with focal lengths of +5, +10 (2 each), +15, +20 (2 each), +30, -10, and -20 cm. There are also rulers for measuring the position of the lenses and image. The size of the image can best be found by imaging on graph paper. Please handle the lenses with care. As with all optical instruments, do not touch the surface of the lens. Handle them by their edges. The initial alignment of the system is as follows.
1. Place the luminous arrow at the far left hand end of the optical bench and the image screen at
the far right hand end of the optical bench. Lock the object lamp and the screen in place by tightening the lower thumbscrews on each of the riders. Adjust the height of the object lamp so that the center of the arrow is 19 cm above the top of the optical bench.
2. Carefully place a +10 cm lens in one of the lens holders and tighten in place. Place the lens
holder in a rider and place the rider on the optical bench. Adjust the height of the lens holder so that the center of the lens is 19 cm above the top of the optical bench. Repeat this step with the other two lens holders and riders. This system is not elegant or highly precise, but with care you can get good results. Some
specific exercises are described below. There is a great variety of experiments that you could try with this apparatus, and these are only a few. You may modify these and add to them, but in each case be sure to explain the purpose of your setup, and compare the results with the thin lens

equation. For each step below you should include in your lab notebook a sketch of the lens-object-
image configuration, the measured positions and sizes requested, a comparison between these measured positions and sizes with those predicted by the thin lens equation and the magnification equation and a ray tracing diagram locating the image graphically. Indicate on your ray tracing whether the image was real or virtual and whether it was inverted or not inverted.
Part III - Imaging With Simple Lenses 1. Place a +10 cm lens between the object lamp and the screen as shown in figure 8. Move the
lens along the optical bench and find two locations that give a sharp image on the screen. Record the locations with respect to either the object lamp or the screen.
Figure 8
2. Move the screen closer to the lens and find an object-to-image distance (arrow to screen distance) such that there is only one location where the +10 lens will form an image. Compare image and object size. On the basis of steps 1 and 2, what is the real focal length of the +10 lens?
3. Place the object and screen about 80 cm apart. Use two +10 cm lenses to obtain an erect
image the same size as the object as shown in figure 9 on the top of the next page. Using a sheet of paper, look for a primary image between the two +10 cm lenses. Place a third lens (of any focal length) at the location of the primary image. Does this third lens affect the second image?

Figure 9
4. Place the +30 lens 20 cm in front of the object. Place a +20 lens 20 cm in front of the +30 (40 cm in front of the object). (See figure 10.) Where is the image formed by the +30 lens? Where is the image formed by the +20? Are they real or virtual, erect or inverted?
Figure 10
5. Carefully place two +20 cm lenses together so that their optical surfaces are touching. Use masking tape to tape them together. Place the taped combination into a lens holder and put the lens holder on the optical bench between the object lamp and screen. Find the effective total focal length of two +20 cm lenses placed close together, by measuring so and si.
6. Repeat step 5 using the +5 and the -10 cm lenses. 7. Place a +20 cm lens 40 cm in front of the object. Place a +10 cm lens 20 cm in front of the

+20 cm lens (60 cm from the object). (See figure 11.) Is the object distance for the +10 cm lens positive or negative? Where is the image?
Figure 11
8. Repeat step 7, except now use the -10 cm lens instead of the +10 cm lens. Can you get a real image? Why? How far from the +20 cm lens must the -10 be placed to get a real image?
9. (Optional.) Read the note below taken from the "American Journal of Physics" and then try to
locate the "extra" images referred to and try to offer an explanation.
A Lens Forms Too Many Images! Allen L. King and Niels K. Winsor Dartmouth College, Hanover, New Hampshire A thin spherical lens is one of the simplest optical systems to be found in a
physics laboratory. Its image-forming characteristics should be observed and understood by every student of physics. Usually the textbook contains a geometrical derivation of a "lens formula" and often the student is asked to verify it in the laboratory. Or, better still, before reading the book he is asked to find the relationship by suitable experimentation. But, even this really does not involve the element of discovery or the solution of a problem; for the student knows that the equation was "discovered" long ago and therefore it poses no problem. The solution is so straightforward and the subject so dull! Or, is it?
Mount a simple thin converging lens of 15-25 cm focal length and 5-10 cm

diameter on an optical bench and locate the principal real image of a flashlight filament, the object, on a screen in the usual way. Now move the screen close to the lens and locate a second real image.. It is small and only a short distance from the lens. What is the origin of this second image? It is not sufficient to make suitable measurements in order to show how the image-distance depends on the object distance and to invent plausible qualitative explanations. Here the student has an opportunity to apply the deductive aspect of physics. If his explanation is valid by means of it he should deduce an equation which relates the measured quantities. His success in this endeavor then can be put to the immediate test.
The student may be further puzzled and intrigued by locating still another real
image on the other side of the lens. This can be observed on a small screen mounted in front of the lens. Are there more than three real images formed by a simple converging lens? Does an achromatic lens form more than one real image? Does a simple diverging lens form a real image? Can data on secondary images be used to determine focal lengths or other lens characteristics? These and other questions may come to mind. Try them on your students.
This note was published in the November, 1964 edition of the "American Journal of Physics" (Am. J. Phys. 32, 895 (1964). Prof. Allen King has retired, but is presently Curator of Historical Scientific Apparatus at Dartmouth.
10. Carefully disassemble all of the lens combinations and place all of the lenses back into the
box from which you got them. Turn off the object lamp. Lab Report
Follow the usual lab notebook format. Your lab report should include the answers to all of
the questions asked in the introduction or procedure, all raw and derived data, and an estimate of the magnitude and sources of error in any data recorded. When answering any question or when giving any comparison or explanation, always refer to specific data to support your statements. For this lab also include the following:
Part I - Ray Deviation by a Prism a. a copy of the polar graph paper showing the ray tracing done in this part (with the rays and the
measured angles clearly identified on the graph paper);

b. a calculation of the value of the index of refraction n of the glass out of which the prism is made with a comparison of the value as given in the Handbook of Physics and Chemistry;
c. a comment on whether or not the ray appeared to go straight across the prism when the angle
of deviation was at a minimum; and d. a comment on whether or not the condition δ = 2φ1 - A was met when the deviation was at
a minimum. Part II - Ray Deviation by a Spherical Drop a. a copy of the polar graph paper showing the ray tracing done in this part (with the rays and the
measured angles clearly identified on the graph paper); b. a comparison of the measured value of the primary "rainbow angle" with the theoretical
values as given by equations (2) and (3); c. a comparison of the measured value of the secondary "rainbow angle" with the theoretical
values as given by the modified versions of equations (2) and (3); d. a comparison of the measured value of the impact parameter ρ with the theoretical value of sin φ .
Part III - Imaging With Simple Lenses a. a diagram of each optical configuration you used; b. a ray tracing for each of those configurations showing the location and relative size of the
image; the tracing should be clearly labeled with image type (real or virtual), object distance (measured and calculated) and image distance (measured and calculated); and
c. all calculations comparing theoretical quantities based on the thin lens equation and
magnification equation with the experimentally measured quantities.