lab 1: exploring arcmap and arccatalog
TRANSCRIPT
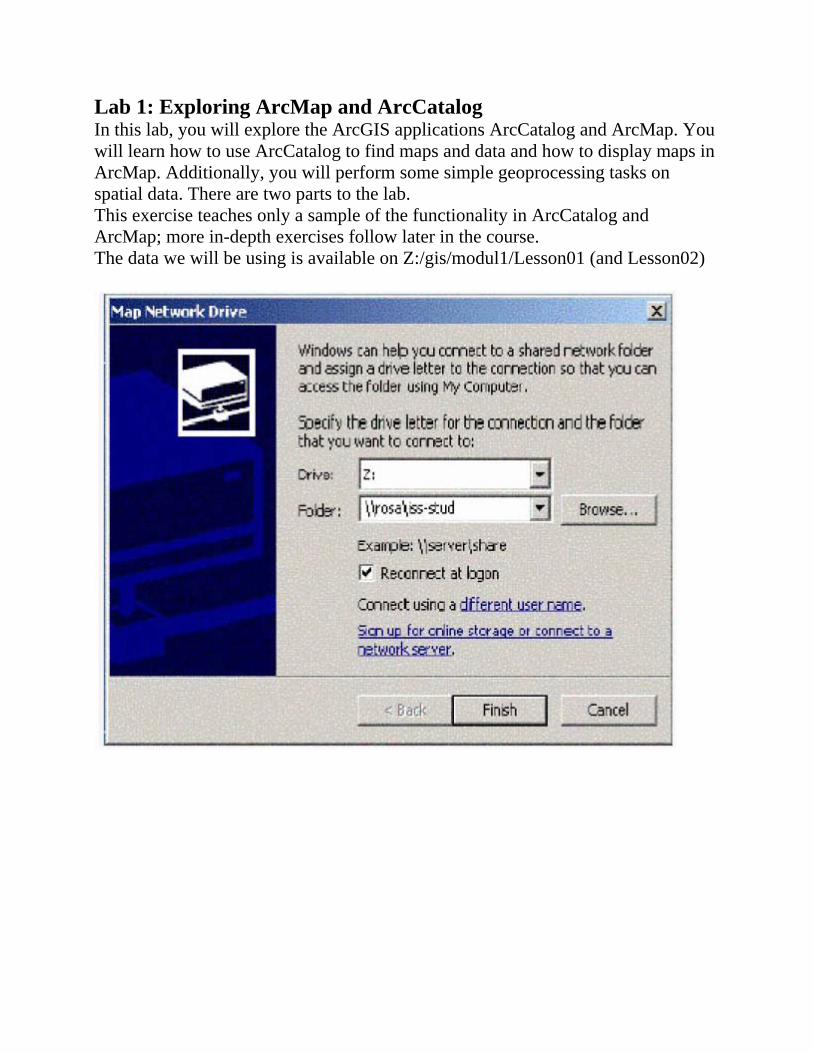
Lab 1: Exploring ArcMap and ArcCatalog In this lab, you will explore the ArcGIS applications ArcCatalog and ArcMap. You will learn how to use ArcCatalog to find maps and data and how to display maps in ArcMap. Additionally, you will perform some simple geoprocessing tasks on spatial data. There are two parts to the lab. This exercise teaches only a sample of the functionality in ArcCatalog and ArcMap; more in-depth exercises follow later in the course. The data we will be using is available on Z:/gis/modul1/Lesson01 (and Lesson02)

PART 1: Getting Familiar with ArcGIS
Step 1: Start ArcMap
Start ArcMap. If you have a shortcut icon for ArcMap on your desktop, double-click it to start ArcMap.
You can also start ArcMap by clicking the Start menu, then choosing Programs, ArcGIS, then ArcMap. (Your ArcMap location may be different, depending on the program location specified when the software was installed.)
If an ArcMap dialog appears, click "A new empty map" and click OK.
Step 1a: Start ArcMap
You see the interface of the ArcMap application.

Step 1b: Start ArcMap
Don't worry if your ArcMap interface looks different from the View Result graphic. For example, your ArcMap window may be larger or smaller. The View Result shows a toolbar that is in the middle of the ArcMap window. Your ArcMap may have this toolbar in another location, or the toolbar may not be displayed at all. These differences have no effect on the results of the exercise.
Whenever you work in ArcMap, you are working with a map document. A map document can contain multiple data frames, which in turn are populated by geographic (spatial) datasets. A map document has the .mxd file extension.
Don't worry about understanding everything you see on the ArcMap interface. You'll learn more about ArcMap later in this course.
Step 2: Examine feature layers From the File menu, choose Open.
Navigate to the folder where you downloaded the exercise data for this module (e.g., Z:/gis) and click Redlands.mxd.
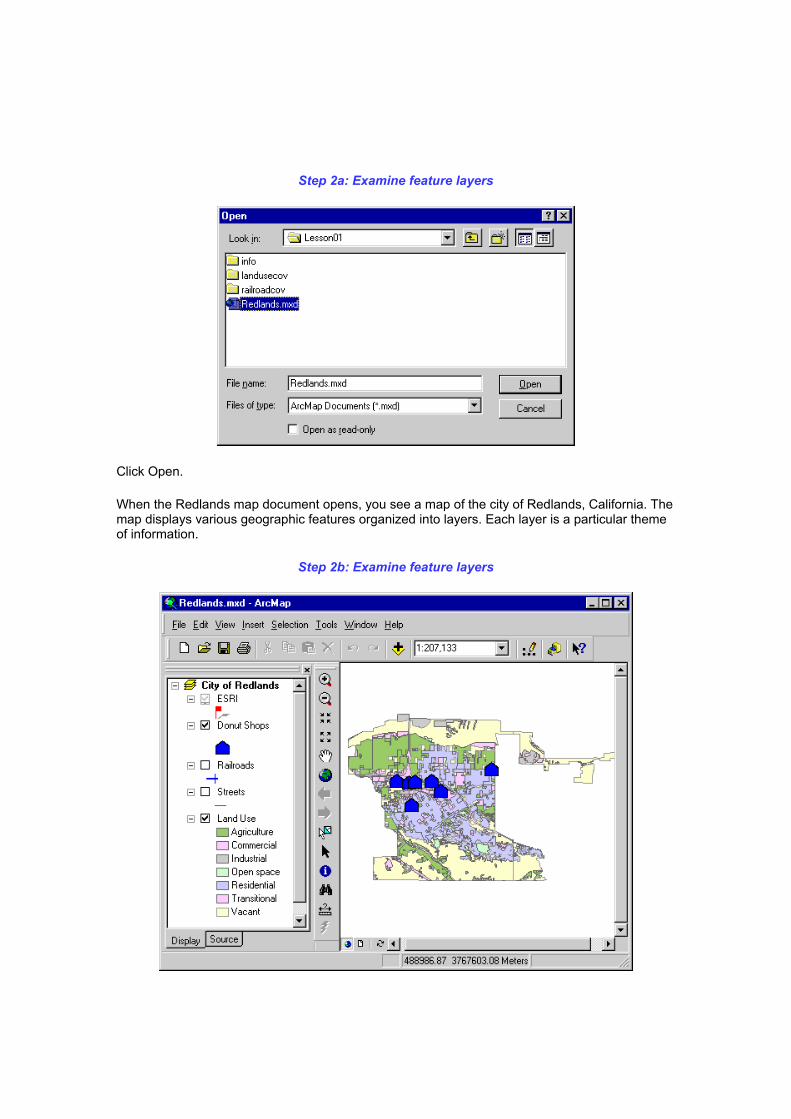
Step 2a: Examine feature layers
Click Open.
When the Redlands map document opens, you see a map of the city of Redlands, California. The map displays various geographic features organized into layers. Each layer is a particular theme of information.
Step 2b: Examine feature layers

The area on the left side of the ArcMap application window contains the list of layers and is called the Table of Contents. The area on the right side of the application window contains the graphic display of the layers in the Table of Contents.
For instance, all the donut shops on the map are point features (represented with house symbols) and grouped into a layer called Donut Shops. The current land use for parcels in the city of Redlands is contained in a layer called Land Use. This layer groups the different land use polygons according to their land use type.
________________________________________________________________________
Review: How a GIS organizes geographic data
A GIS organizes and stores information about the world as a collection of thematic layers that can be linked by geography. Each layer contains features having similar attributes, like streets or cities, that are located within the same geographic extent. This simple but extremely powerful and versatile concept has proven invaluable for solving many real-world problems--from tracking delivery vehicles, to recording details of planning applications, to modeling global atmospheric circulation.
________________________________________________________________________
Step 3: Display other layers
The other layers in the map display railroads, streets, and the location of ESRI.
Check the box next to the Railroads layer. The railroad tracks in Redlands display.
Now, check the box next to Streets to display the Redlands streets.
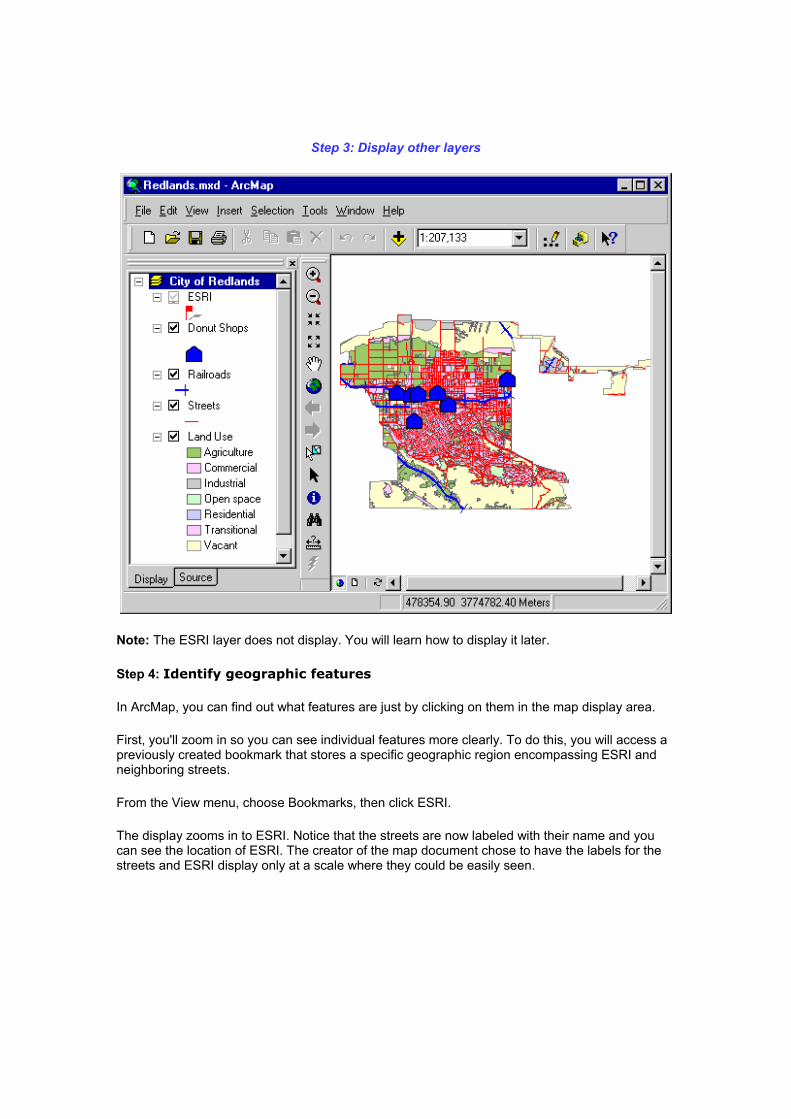
Step 3: Display other layers
Note: The ESRI layer does not display. You will learn how to display it later.
Step 4: Identify geographic features
In ArcMap, you can find out what features are just by clicking on them in the map display area.
First, you'll zoom in so you can see individual features more clearly. To do this, you will access a previously created bookmark that stores a specific geographic region encompassing ESRI and neighboring streets.
From the View menu, choose Bookmarks, then click ESRI.
The display zooms in to ESRI. Notice that the streets are now labeled with their name and you can see the location of ESRI. The creator of the map document chose to have the labels for the streets and ESRI display only at a scale where they could be easily seen.

Step 4a: Identify geographic features
On the Tools toolbar, click the Identify button . If the Tools toolbar is not visible, right-click the menu bar to the right of the Help menu and click Tools.
Click the line feature that represents New York Street (the red line just to the left of the street name).
The Identify Results window opens and displays all the attributes for New York Street that are contained in the database. You may have to enlarge the Identify Results window to see all the attributes.
Step 4b: Identify geographic features

You can "flash" the feature that you just identified to see it in the display area.
Move the Identify Results window out of the way, if necessary, so you can see both it and the map display. In the left side of the Identify Results window, click New York (the name of the street) and observe the feature flash in the map display.
From the Layers dropdown list, choose All layers, then click the line representing New York Street again.
The Identify Results window now contains the attributes for the land use polygon in which the street is located.
On the left side of the Identify Results window, click the plus sign (+) next to Land Use, then click the first land use type listed (more than one may be listed). All the attributes for that specific land use polygon display.
Step 4c: Identify geographic features
Continue identifying other features in the display area by clicking them with the Identify button.
When you are finished, close the Identify Results window by clicking the "X" in the upper-right corner of the window.

________________________________________________________________________
Review Concept: Querying Data
A GIS must provide tools for finding specific features based on their location or attributes. Queries, which are often created as logical statements or expressions, are used to select features on the map and their records in the database.
A common GIS query is determining what exists at a particular location. In this type of query, the user knows where the features of interest are, but wants to know what characteristics are associated with them. This can be accomplished with a GIS because geographic features on the map display are linked to their attributes (descriptive characteristics) stored in the database.
In a GIS, you can click on a map feature to see the attributes associated with the feature in the database.
Another type of GIS query is to determine which location or locations satisfy certain conditions. In this case, the user knows what characteristics are important and wants to find out where the features are that have these characteristics.

Suppose you wanted to find landlocked countries with a population greater than 20 million. You would create a query expression with those criteria. When the GIS finds features that meet the query's criteria, it highlights them on the map.
________________________________________________________________________
Step 5: Examine other attribute information:
Before you explore the attribute information for some of the layers listed in the Table of Contents, you will return to the original geographic extent of the ArcMap document. This extent is stored in a bookmark. This bookmark was created to prevent the display from becoming cluttered and allows you to focus on only those layers you want to learn more about.
From the View menu, choose Bookmarks, then click Original.
The layers displayed should be Donut Shops, Railroads, Streets, and Land Use.

Step 5a: Examine other attribute information
In the Table of Contents, right-click Railroads and click Open Attribute Table.
Step 5b: Examine other attribute information
The attribute table associated with the Railroads layer displays. Each record represents an individual feature in the Railroads layer.
Notice that the number of records is displayed at the bottom of the table window. In this case, there are eleven records and none of the records are selected. You'll learn about selecting records later. Scroll to the right to see all the attributes describing this layer.

When you're finished examining the attributes, close the attribute table.
Next, in the Table of Contents, right-click Donut Shops and click Open Attribute Table. Examine this layer's attributes.
Step 5c: Examine other attribute information
Close the attribute table when you're finished.
Finally, open the attribute table for the Land Use layer. Notice that each feature (record) has an LU_ABV attribute which contains a land use abbreviation. In the map, each feature is displayed using the values in this attribute field.
Step 5d: Examine other attribute information
Close the Land Use attribute table when you're finished examining it.

Step 6: Add map tips to your display
Map tips are text that represents a single feature attribute; map tips display when you hold the mouse pointer over a feature. They are an easy way to get attribute information for a specific feature.
Hold your mouse pointer over the center of one of the symbols representing a Donut Shop and hold it there. The name of the Donut Shop displays.
Step 6a: Add map tips to your display
You can specify which field displays by setting it in the layer's Properties dialog.
In the Table of Contents, right-click the Donut Shops layer name and click Properties. In the Properties dialog, click the Fields tab. Click the dropdown arrow next to Primary display field to see all the attribute choices.
You can specify that any one of these attributes be used as the map tip. The default that ArcGIS chose (Name) is usually the most useful for a map tip, but you are going to change it.
In the Primary display field dropdown list, click Address.

Step 6b: Add map tips to your display
Click OK to close the Properties dialog. Hold your mouse pointer over any Donut Shops feature. The address should appear as a map tip.
Step 6c: Add map tips to your display

Step 7: Display a layer using its attributes
The Streets layer is currently displayed using the same symbol for all the features, but you can display the features using their attributes.
First, turn off the display for Land Use by unchecking its box in the Table of Contents. Next, right-click Streets and click Properties. In the Layer Properties dialog, click the Symbology tab.
Step 7a: Display a layer using its attributes
On the left side of the dialog, in the Show list, click Categories. Under Categories, click Unique Values. In the Value Field dropdown list to the right, click CLASS.
Step 7b: Display a layer using its attributes

Click the Add All Values button.
Step 7c: Display a layer using its attributes
Click Apply (not OK) and move the Layer Properties dialog out of the way, if necessary, so that you can see the map display.
The streets now display with different symbols depending on their CLASS value.
Step 7d: Display a layer using its attributes

Return the Streets layer to its previous setting by clicking Features in the Show list, then click OK to close the Layer Properties dialog.
Step 8: Select features using attributes
Often, you will want to display features that meet specific criteria. In this step, you will select and locate Interstate 10.
In the Table of Contents, uncheck the box next to Railroads to turn its display off. You don't need to see the railroads for this step.
From the Selection menu, choose Select By Attributes.
The Select By Attributes dialog allows you to select features by building a query. You will build a query by creating an expression for the Streets layer that selects features whose STR_NAME is equal to I 10 (Interstate 10). The selected features are highlighted on the map and in the layer's attribute table.
In the Layer dropdown list, click Streets. For Method, make sure "Create a new selection" is selected. In the Fields list, scroll down and double-click STR_NAME. Click the equals sign button (=) in the middle of the dialog.
Next, under the Unique sample values list, click Complete List. Scroll down the list of unique values and double-click I 10.
Step 8a: Select features using attributes
Click Apply. Move the Select By Attributes dialog out of the way so you can see the map display.

Step 8b: Select features using attributes
In the display area, notice that I-10 is highlighted. The selected segments are all part of Interstate 10.
Close the Select By Attributes dialog.
Step 9: Select geographic features using spatial relationships
Now you will select all the donut shops within 1,000 meters of Interstate 10 so that all the hungry commuters driving from Palm Springs to Los Angeles will know where to stop.
From the Selection menu, choose Select By Location.
In the Select By Location dialog, select items in the dropdown lists so that the selection query reads, "I want to select features from the Donut Shops layer that are within a distance of the features in the Streets layer."
Check the box next to "Apply a buffer to the features in Streets" and for the buffer distance, enter 1000 meters.

A 50-foot buffer is created on either side of the road to find those parcels within the 50-foot distance.
Overlay analysis
The integration of different data layers involves a process called overlay. At its simplest, this could be a visual operation, but analytical operations require one or more data layers to be joined physically (i.e., combined into one layer in the database). Overlay analysis could be used to integrate data on soils, slope, and vegetation or land ownership data with tax assessment data.
Overlay analysis results can help determine appropriate land uses.
________________________________________________________________________
Step 10: Close ArcMap
From the File menu, choose Exit to close ArcMap. Click No when you're prompted to save changes.
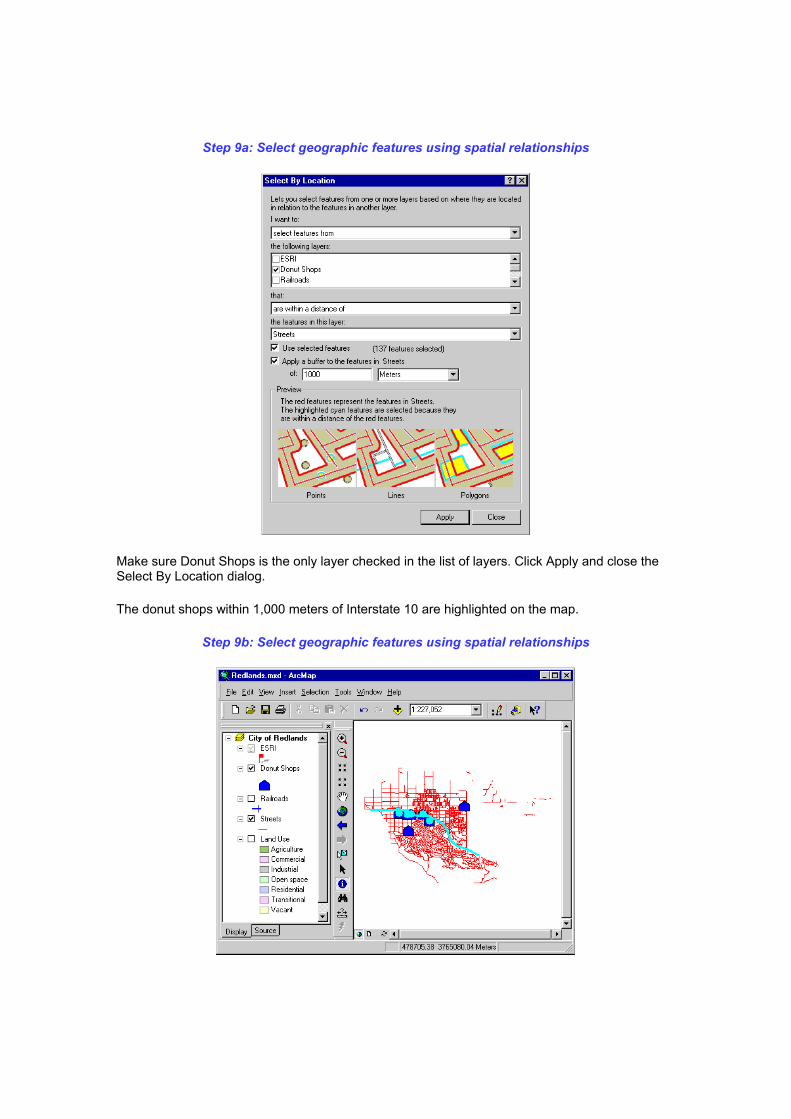
Step 9a: Select geographic features using spatial relationships
Make sure Donut Shops is the only layer checked in the list of layers. Click Apply and close the Select By Location dialog.
The donut shops within 1,000 meters of Interstate 10 are highlighted on the map.
Step 9b: Select geographic features using spatial relationships

In the Table of Contents, right-click Donut Shops and click Open Attribute Table.
The records for the selected donut shops are also highlighted in the table.
Step 9c: Select geographic features using spatial relationships
Close the table.
You have just performed a spatial analysis operation. In future exercises, you will perform similar operations as well as more complex ones.
________________________________________________________________________
Review Concept: Analyzing Data
Geographic analysis usually involves more than one geographic dataset and requires working through a series of steps to reach a final result. A GIS must be able to analyze the spatial relationships among multiple datasets to answer questions and solve problems.
There are many types of geographic analysis. While this course cannot cover all of them, two common types of geographic analysis are described below.
Proximity analysis
Proximity analysis uses the distance between features to answer questions like:
• How many houses lie within 100 meters of this water main? • What is the total number of customers within 10 kilometers of this store? • What proportion of the alfalfa crop is within 500 meters of the well?
GIS technology often uses a process called buffering to determine the proximity relationship between features.

QUESTIONS:
In ArcMap, open Redlands.mxd and answer the following questions. Link a web page with the answers to Lab1 on your home page.
1). Which donut shop is located at 514 East Redlands Blvd.? 2). What is the land use abbreviation for the parcel on which ESRI is located? (choose from: OPS, COM, TNS, IND) 3). Use the Select By Attributes dialog to select all streets whose CLASS = 3. How many records are selected? 4). What is the class description of New York Street? (choose from: Minor street, Major street, Avenue, Local street)