la opala-first page 8 - skp moneywise opala rg ltd... · • la opala glass ltd got merged with...
TRANSCRIPT
April 23, 2015
La Opala RG Ltd In a sweet spot…
CMP ` 431 Target ` 506 (Re)Initiating Coverage - Accumulate
SKP Securities Ltd www.skpmoneywise.com Page 1 of 12
Analysts: Nikhil Saboo Tel No: +91‐33‐4007 7019; Mob: +91 9330186643 Email: [email protected] Vineet P. Agrawal Tel No.: +91‐22‐4922 6006; Mob: +91 9819510575 Email: [email protected]
Key Share DataFace Value ( )̀ 2.0Equity Capital ( ̀mn) 111.0M.Cap ( ̀mn) 23926.152‐wk High/Low ( )̀ 503/154Avg. Daily Vol 52,468 BSE Code 526947NSE Code LAOPALAReuters Code LAOP.NSBloomberg Code LOG:IN
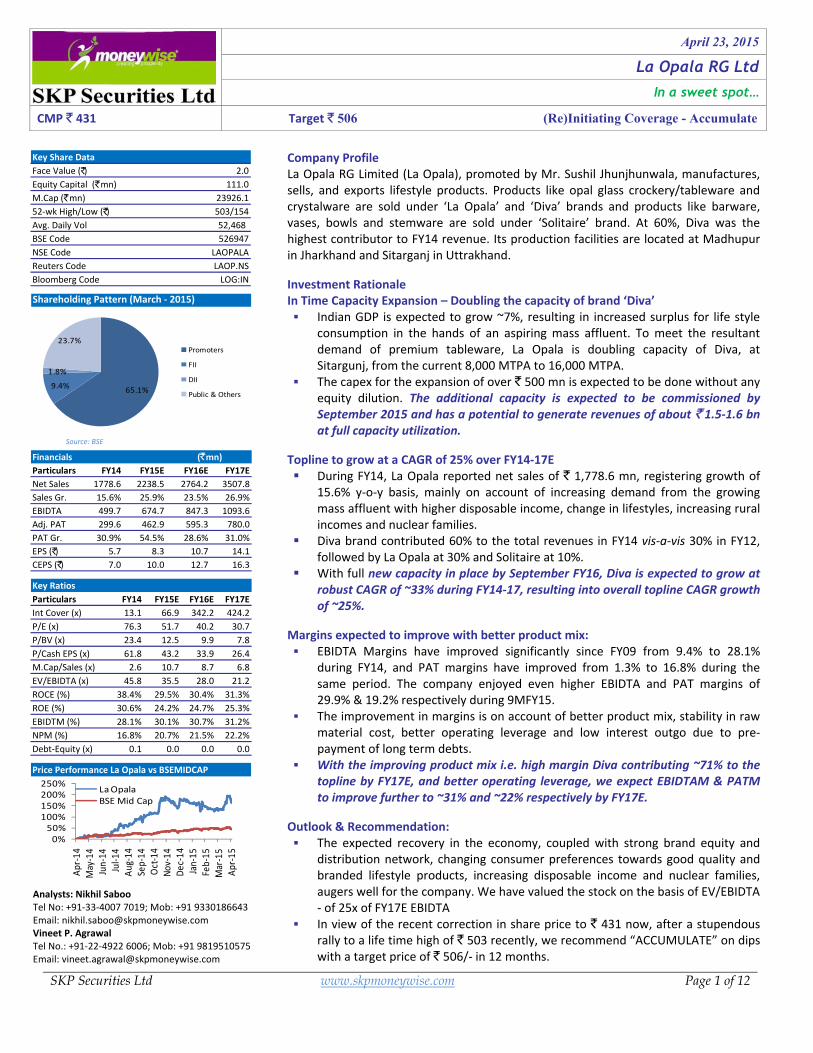
Shareholding Pattern (March ‐ 2015)
65.1%9.4%
1.8%
23.7%Promoters
FII
DII
Public & Others
Source: BSE
Particulars FY14 FY15E FY16E FY17ENet Sales 1778.6 2238.5 2764.2 3507.8Sales Gr. 15.6% 25.9% 23.5% 26.9%EBIDTA 499.7 674.7 847.3 1093.6Adj. PAT 299.6 462.9 595.3 780.0PAT Gr. 30.9% 54.5% 28.6% 31.0%EPS ( )̀ 5.7 8.3 10.7 14.1CEPS ( )̀ 7.0 10.0 12.7 16.3
Financials ( ̀mn)
Particulars FY14 FY15E FY16E FY17EInt Cover (x) 13.1 66.9 342.2 424.2P/E (x) 76.3 51.7 40.2 30.7P/BV (x) 23.4 12.5 9.9 7.8P/Cash EPS (x) 61.8 43.2 33.9 26.4M.Cap/Sales (x) 2.6 10.7 8.7 6.8EV/EBIDTA (x) 45.8 35.5 28.0 21.2ROCE (%) 38.4% 29.5% 30.4% 31.3%ROE (%) 30.6% 24.2% 24.7% 25.3%EBIDTM (%) 28.1% 30.1% 30.7% 31.2%NPM (%) 16.8% 20.7% 21.5% 22.2%Debt‐Equity (x) 0.1 0.0 0.0 0.0
Key Ratios
Price Performance La Opala vs BSEMIDCAP
0%50%
100%150%200%250%
Apr‐
14M
ay‐1
4Ju
n‐14
Jul‐1
4Au
g‐14
Sep‐
14O
ct‐1
4No
v‐14
Dec‐
14Ja
n‐15
Feb‐
15M
ar‐1
5Ap
r‐15
La OpalaBSE Mid Cap
Company Profile La Opala RG Limited (La Opala), promoted by Mr. Sushil Jhunjhunwala, manufactures, sells, and exports lifestyle products. Products like opal glass crockery/tableware and crystalware are sold under ‘La Opala’ and ‘Diva’ brands and products like barware, vases, bowls and stemware are sold under ‘Solitaire’ brand. At 60%, Diva was the highest contributor to FY14 revenue. Its production facilities are located at Madhupur in Jharkhand and Sitarganj in Uttrakhand.
Investment Rationale In Time Capacity Expansion – Doubling the capacity of brand ‘Diva’
Indian GDP is expected to grow ~7%, resulting in increased surplus for life style consumption in the hands of an aspiring mass affluent. To meet the resultant demand of premium tableware, La Opala is doubling capacity of Diva, at Sitargunj, from the current 8,000 MTPA to 16,000 MTPA.
The capex for the expansion of over ` 500 mn is expected to be done without any equity dilution. The additional capacity is expected to be commissioned by September 2015 and has a potential to generate revenues of about ` 1.5‐1.6 bn at full capacity utilization.
Topline to grow at a CAGR of 25% over FY14‐17E During FY14, La Opala reported net sales of ` 1,778.6 mn, registering growth of
15.6% y‐o‐y basis, mainly on account of increasing demand from the growing mass affluent with higher disposable income, change in lifestyles, increasing rural incomes and nuclear families.
Diva brand contributed 60% to the total revenues in FY14 vis‐a‐vis 30% in FY12, followed by La Opala at 30% and Solitaire at 10%.
With full new capacity in place by September FY16, Diva is expected to grow at robust CAGR of ~33% during FY14‐17, resulting into overall topline CAGR growth of ~25%.
Margins expected to improve with better product mix: EBIDTA Margins have improved significantly since FY09 from 9.4% to 28.1%
during FY14, and PAT margins have improved from 1.3% to 16.8% during the same period. The company enjoyed even higher EBIDTA and PAT margins of 29.9% & 19.2% respectively during 9MFY15.
The improvement in margins is on account of better product mix, stability in raw material cost, better operating leverage and low interest outgo due to pre‐payment of long term debts.
With the improving product mix i.e. high margin Diva contributing ~71% to the topline by FY17E, and better operating leverage, we expect EBIDTAM & PATM to improve further to ~31% and ~22% respectively by FY17E.
Outlook & Recommendation: The expected recovery in the economy, coupled with strong brand equity and
distribution network, changing consumer preferences towards good quality and branded lifestyle products, increasing disposable income and nuclear families, augers well for the company. We have valued the stock on the basis of EV/EBIDTA ‐ of 25x of FY17E EBIDTA
In view of the recent correction in share price to ` 431 now, after a stupendous rally to a life time high of ` 503 recently, we recommend “ACCUMULATE” on dips with a target price of ` 506/‐ in 12 months.

La Opala RG Ltd.
SKP Securities Ltd. www.skpmoneywise.com Page 2 of 12
• Opal Glass – An Introduction: Opal glass consists of a glass mass, toughened by using a special production technique, which gives it two‐three times more mechanical resistance than normal glass dishes.
• Ingredients and applications: The basic ingredients are a fusion of quartz sand, lime, soda, clays and other added natural substances. Opal glass is manufactured in the basic colors of white and ivory and used in the manufacturing of crockery.
• Market dynamics: Crockery market comprises pottery, kitchenware and tableware. Indian
tableware market size is ~` 10 bn (excluding stainless steel) of which opalware comprises ~`3.5 bn.
• Glassware is the biggest segment in tableware followed by opalware, melamine, bone
china, stoneware and porcelain. In contrast to opalware segment, glassware segment is dominated by unorganized segment.
Source: Overview on Ceramic and Glass Tableware by SwapanGuha; 2013 figures
• Opalware segment is dominated by organized players in India: La Opala, RAK (UAE),
Luminarc (France), Bormiolli Rocco (Italy), and Corelle (USA) are the major players in opalware segment. The exhibit below shows the market standing of La Opala vis‐à‐vis its peers.
Source: Overview on Ceramic and Glass Tableware by SwapanGuha; 2013 figures
10%
11%
6%
6%
3%3%
2%2%
16%
40%
Yera (Alembic Group)
Ocean (Thailand)
Treo (India)
Luminarc (France)
Roxx
Pashabhashi
Borosil (India)
Laopala (India)
Unorganised ‐ Imported
Unorganised ‐ Domestic
43%
10%7%
7%
20%
13%
Laopala
RAK
Luminarc
Boromiolli Rocco
Corelle
Unorganised Sector
Opalware and Glassware ‐ The Industry at a Glance

La Opala RG Ltd.
SKP Securities Ltd www.skpmoneywise.com Page 3 of 12
• Anti dumping duty to curb cheap China imports: India has imposed anti‐dumping duty on cheap imports of opal glassware from China and UAE for five years, starting August 2011. The duty is in the range of 42‐110% of the landed cost of consignments from China, while UAE‐imported opal glassware attracts duty at 36.73% of the cost.
• Imports from unorganized segment comprised more than 50% before imposition of anti dumping duty, which has now come down to below 25%. Tableware is imported from South Korea, Indonesia, Sri Lanka and Bangladesh besides China and UAE.
Key Demand Drivers: • Growing Mass Affluent: Mass Affluent i.e. households with disposable incomes from
`200,000 to 1,000,000 per annum comprises about 50 mn people, roughly 5% of the population (Source: McKinsey Survey in 2007 for India). By 2025, mass affluent segment is expected to increase to ~ 583 mn people, or 41% of the population. With its rising numbers and incomes, mass affluent is becoming the biggest market segment for the industry.
• Increasing Disposable Income – increase in potential to spend: The average annual disposable income in India increased by more than 29% in real terms between 2007 and 2012 while consumer spending was up by more than 25%, which has lead to shift from ordinary to fashionable crockery, fueling demand in the process.
• India is expected to grow at a fast pace in next four years. The rapid economic growth will
increase and enhance employment and business opportunities, which in turn, is expected to further increase disposable incomes and aspirations.
• Changing Life Style – adding to the status symbol: There is a radical change in the attitude
of consumer behavior in India, riding on the back of higher disposable income, changing lifestyle, urbanization of semi‐urban and rural communities, more push towards aesthetics, increasing consumer awareness, brand consciousness and innovative promotional campaigns.
• Indian consumers are also more optimistic and increasingly willing to spend on branded products. With the changing pattern of consumer behavior and consumer spending, companies in India are also tweaking their strategies to retain their loyal consumer base, while attracting the emerging young consumers.
• La Opala is one such company, which has truly captured the mind of Indian consumers in glass tableware category.
• Rising Rural Income: Over the last decade there is a significant growth in the rural income – an average annual median per capita income increase of 7.2% ‐ inspiring a shift in life style to modern alternatives. This is expected to plug the extensive crockery ware under‐penetration (24%) within India’s total dinner set market.
• Nuclear Families: Nearly 1.5‐2% of joint families are becoming nuclear each year on account of dispersed job opportunities and other urban realities. The consequent increase in the number of households has also catalyzed the growth of tableware in India.
• Acceptance of microwave ovens: The increasing consumer awareness has led to a spurt in the demand for microwave ovens, making the presence of this segment felt successfully in Indian households.

La Opala RG Ltd.
SKP Securities Ltd www.skpmoneywise.com Page 4 of 12
• According to "India Household Microwave Ovens Market Forecast & Opportunities, 2017", the already growing Indian household microwave ovens segment is forecasted to grow at the CAGR of around 15% in revenues during 2012‐17. Tier II and III cities are anticipated to generate significant revenue in microwave ovens market in the next five years.
• The growth in microwave ovens further fuels the demand of (microwave compatible) opalware and glassware.
Outlook: With such demand drivers at play, we are bullish on a bright future of India tableware industry.
• An Introduction: The Company began its journey as La Opala Glass Pvt Ltd in 1987, under the dynamic leadership of Mr. Sushil Jhunjhunwala, having ~45 years industry experience. It set its first opal glass facility at Madhupur, Jharkhand in 1988. It became the first listed tableware company in 1995.
• The company ventured into glassware segment, under the brand name ‘Solitaire’, in 1996, by setting up its first crystal glassware plant at Madhupur, with technological collaboration of Korea’s Doosan Glass.
• La Opala Glass Ltd got merged with Radha Glass Ltd in 1999, when its name changed to
name La Opala RG Ltd (La Opala).
• La Opala launched hi‐tech world class opal brand ‘Diva’ in 2008, in the premium segment which contributed 60% to the total revenues in FY14.
• Today, the Company has three brands viz. La Opala, Diva and Solitaire. La Opala’s business
model at a glance:
Source: Company
The Company at a Glance
Business Model ‐ La Opala
Solitaire(Since 1996)
Diva (Since 2008)
MadhupurJharkhand
1,000 MTPA
SitargunjUttarakhand
8,000 MTPA
La Opala(Since 1988)
MadhupurJharkhand
4,000 MTPA
Brand
Infrastructure Location
Capacity
Market Positioning Budget Opalware High‐end Glassware Mid‐end Opalware
10% 60% 30% Revenue Cont.
Realisation Lowest Highest Between La Opala and Solitaire
Peers RAK, Luminarc, Boromiolli
Rocco, Corelle, Unorganised small Players
Bohemian, RCR
LuminarcCorelle Vanras
La Opala RG Ltd.
SKP Securities Ltd www.skpmoneywise.com Page 5 of 12
• La Opala dominating Indian market with strong brand recall: La Opala is the first Indian company to bring opalware in India, dominating Indian organized tableware segment.
• La Opala sells its products under three brands viz. La Opala, Solitaire and Diva, which has emerged as the most valuable assets for them, resulting into strengthening of ROCE from 1.6% in FY08 to 38.4% in FY14. Its brands are known for high product quality, attractive product designs and dealer loyalty.
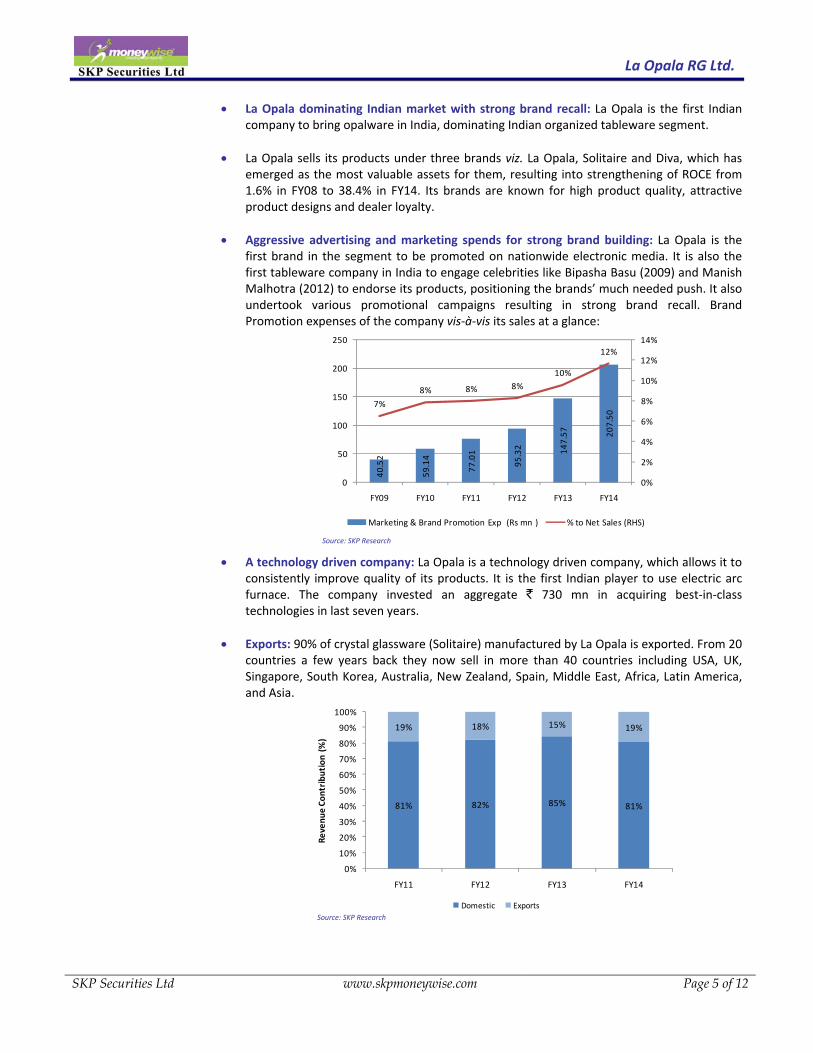
• Aggressive advertising and marketing spends for strong brand building: La Opala is the
first brand in the segment to be promoted on nationwide electronic media. It is also the first tableware company in India to engage celebrities like Bipasha Basu (2009) and Manish Malhotra (2012) to endorse its products, positioning the brands’ much needed push. It also undertook various promotional campaigns resulting in strong brand recall. Brand Promotion expenses of the company vis‐à‐vis its sales at a glance:
• A technology driven company: La Opala is a technology driven company, which allows it to consistently improve quality of its products. It is the first Indian player to use electric arc furnace. The company invested an aggregate ` 730 mn in acquiring best‐in‐class technologies in last seven years.
• Exports: 90% of crystal glassware (Solitaire) manufactured by La Opala is exported. From 20
countries a few years back they now sell in more than 40 countries including USA, UK, Singapore, South Korea, Australia, New Zealand, Spain, Middle East, Africa, Latin America, and Asia.
40.5
2
59.1
4
77.0
1
95.3
2 147.
57 207.
50
7%
8% 8% 8%10%
12%
0%
2%
4%
6%
8%
10%
12%
14%
0
50
100
150
200
250
FY09 FY10 FY11 FY12 FY13 FY14
Marketing & Brand Promotion Exp (Rs mn ) % to Net Sales (RHS)
81% 82% 85% 81%
19% 18% 15% 19%
0%
10%
20%
30%
40%
50%
60%
70%
80%
90%
100%
FY11 FY12 FY13 FY14
Reve
nue
Cont
ribu
tion
(%
)
Domestic ExportsSource: SKP Research
Source: SKP Research

La Opala RG Ltd.
SKP Securities Ltd www.skpmoneywise.com Page 6 of 12
• Strong Distribution Network: La Opala products are present in 500 towns across India having population in excess of 100,000 through a network of ~12500 dealers served through 135 distributors. These dealers address the growing demand for lifestyle tableware products from the semi‐urban to the urban market. It plans to add 15‐20 distributors and more than 1,000 dealers and retail points every year.
• The Company also sells its products through many of world’s leading retail outlets including Walmart, Carrefour and Tesco. Modern trade accounted for 12‐13% of the total sales.
• Raw Materials: The basic ingredients for the Company are a fusion of quartz sand, lime,
soda, clays, Borax Pentahydrate, transfers paper etc. The Company sources quartz sand locally whereas Borax is imported from USA and Turkey. Prices of raw materials are stable and are expected to remain stable going forward.
• Launch of New Cook and Service Product: La Opala has launched new cook and serve
brand, in India, imported from Europe. Investment Rationale
1. Timely Capacity Expansion – Doubling the capacity of brand ‘Diva’ at Sitargunj:
• Indian GDP is expected to grow ~7% in the coming years, resulting in increased buying power in the hands of a growing and aspiring mass affluent segment. La Opala is doubling the capacity of Diva, at Sitargunj, from the current 8,000 MTPA to 16,000 MTPA, to take advantage of the robust demand in premium category of tableware.
• The capex for the expansion is over ` 500 mn. Which is expected to commission by September 2015 and has a potential to generate additional revenue of about ` 1.5‐1.6 bn at full capacity utilization.
• La Opala has already raised ` 550 mn by issuing shares on preferential basis to Westbridge Crossover Fund at a price of ` 220 per share. No further equity dilution in near future.
• The overall capacity utilization of the company during FY14 was ~80%. La Opala and Solitaire brands are at 90%.
2. Top‐line expected to grow at a CAGR of 25% over FY14‐17E
• In FY14, La Opala reported net sales of `1,778.6 mn, registering growth of 15.6% y‐o‐y.
• Diva brand contributed 60% to the total revenues (it was just 30% in FY12), followed by La Opala at 30% and Solitaire at 10%.
• La Opala posted revenue of ` 1,619.9 mn during 9MFY15, of which Diva brand contributed about 65%, followed by La Opala (25%) and Solitaire (10%).
• In view of the facts mentioned above, we expect La Opala to grow at a CAGR of 25% during FY14‐FY17, led by Diva brand. With the new capacity in place in FY16, Diva brand is expected to grow at robust CAGR of 33% during FY14‐17E. Topline from Diva at a glance:

La Opala RG Ltd.
SKP Securities Ltd www.skpmoneywise.com Page 7 of 12
• Improving Revenue mix and overall sales of La Opala at a glance:
3. Margins expected to improve with better product mix: • EBIDTA Margins of the company is improving since FY09 (from 9.4% to 28.1% during FY14)
till date. PAT margins have improved from 1.3% in FY09 to 16.8% in FY14. The company enjoyed even higher EBIDTA and PAT margins of 29.9% & 19.2% respectively during 9MFY15. This has happened on the back of:
Improved Product mix: Diva brand is growing at a faster pace and enjoys better
margins of 32‐33% compared to La Opala brand (16‐17%). Contribution from Diva brand has increased from 30% in FY12 to 60% in FY14, resulting in improvement in overall margins. We further expect the contribution from Diva to reach ~71% by FY17E, resulting in further betterment of margins.
Raw Material cost remaining stable: Quartz sand, clay, borax, etc are the major raw materials of the company whose prices have remained more or less stable (RM to % to sales for last three years hovered at 22%‐23%. It has fallen to 19% during 9M FY15) and we expect it to remain stable in the coming years.
Replacement of fuel based furnace with electric arc furnace, will result in lower power consumption, thus increasing margins.
Prepayment of long term loans: The Company prepaid its long term loans of ` 149.8 mn during FY14, resulting in lower interest payout.
• With improving product mix and better operating leverage, we expect EBIDTAM & PATM to improve further to ~31% and ~22% respectively by FY17E.
1045
.8
1321
.1
1787
.3
2486
.7
70%
26%
35%39%
0%
10%
20%
30%
40%
50%
60%
70%
80%
0
500
1000
1500
2000
2500
3000
FY14 FY15E FY16E FY17E
% G
row
th
Div
a N
et S
ales
(`
mn)
Diva Net Sales Growth %
29% 26% 21% 17%
10%9%
7%6%
59%59%
65% 71%
0% 4% 5% 5%
0%
10%
20%
30%
40%
50%
60%
70%
80%
90%
100%
FY14 FY15E FY16E FY17E
Other Operating Incom
Borosilicate
Diva
Solitaire
La Opala
Source: SKP Research
Source: SKP Research
961.
5
1150
.1
1539
.2
1778
.5
2238
.5
2764
.2
3507
.8
0
500
1000
1500
2000
2500
3000
3500
4000
FY11 FY12 FY13 FY14 FY15E FY16E FY17E
Ove
rall
Net
Rev
enue
s (`
mn)
Overall Revenue

La Opala RG Ltd.
SKP Securities Ltd www.skpmoneywise.com Page 8 of 12
4. Deleveraged Balance Sheet: • La Opala has raised ` 550 mn by issuing shares on preferential basis at a price of ` 220 per
share. Also over the past many years it has been generating strong free cash flows, resulting into de‐leveraging of balance sheet. FCF of La Opala at a glance:
• Outstanding long term debt of ` 149.8 mn in FY13 was pre‐paid fully in FY14, bringing down the D/E ratio significantly to 0.14x in FY14 vis‐a‐vis 1.03x in FY11.
• After the recent issue
of equities on preferential basis the company has become net debt free.
216
51 141
206
148 29
4
272
738
1042
0
100
200
300
400
500
600
700
800
900
1000
FY09 FY10 FY11 FY12 FY13 FY14 FY15E FY16E FY17E
`m
n
Source: SKP Research
Source: SKP Research
209.
9
268.
5
411.
9
499.
7 674.
7 847.
3 1093
.6
22%23%
27%28%
30% 31% 31%
0%
5%
10%
15%
20%
25%
30%
35%
0
200
400
600
800
1000
1200
FY11 FY12 FY13 FY14 FY15E FY16E FY17E
PAT
Mar
gin
(%)
EBID
TA (`
mn)
93.2126.0
228.8
299.6
462.9
595.3
780.0
9.7%11.0%
14.9%
16.8%
20.7%21.5%
22.2%
0%
5%
10%
15%
20%
25%
0.0
100.0
200.0
300.0
400.0
500.0
600.0
700.0
800.0
900.0
FY11 FY12 FY13 FY14 FY15E FY16E FY17E
PAT
Mar
gin
(%)
PAT
(`m
n)
374.
58
280.
54
111.
19
149.
87
0.00
0.00
0.00
0.00
15.6
1
10.2
0
90.8
1
88.8
5
141.
84
67.1
5
16.5
9
17.5
4
0.0
0.2
0.4
0.6
0.8
1.0
1.2
0
50
100
150
200
250
300
350
400
FY10
FY11
FY12
FY13
FY14
FY15
E
FY16
E
FY17
E
x
`m
n
Long Term Debt (LHS) Short Term Debt (LHS) D/E (RHS)
Source: SKP Research

La Opala RG Ltd.
SKP Securities Ltd www.skpmoneywise.com Page 9 of 12
Key Concerns
1. Unfavorable Government Policies could affect sectoral growth: India imposed an anti‐dumping duty on the import from China and UAE, for five years, effective from August 2011. Any reversal or non‐continuation of the same by the Government of India may negatively impact the results of the Company.
2. Competition from unorganised players: The tableware industry is dominated by small unorganized players. Though, Indian consumers are gravitating towards the organized segment, offering branded products, any increase in the competitive intensity from unorganized segment may be detrimental for the company.
3. Any change in design preferences could affect the offtake: The Company possesses more than two
decades of insight into design preferences across regions, ages, income profiles and social backgrounds. As an effective de‐risking strategy, La Opala introduces new design collections every year, phases out the designs that have reached the end of their productive life cycle and nurses an active portfolio of not more than 1,000 SKUs. This has helped the Company evolve its focus from ‘sale’ to ‘quickest sale’. Any unexpected change in the design preferences by the end consumers may affect the business of the company.
Valuation
The expected recovery in the economy, coupled with strong brand equity and distribution network, changing consumer preferences towards quality and lifestyle products, increasing disposable income and nuclear family, augers well for the company.
La Opala is numero uno in key parameters of profitability, cash flow generation, return ratios and payout. Although the stock witnessed a smart rise and re‐rerating, with the sharp reaction witnessed lately, we recommend an Accumulate on the stock with a target price of ` 506/‐ in 12 months (17.6% upside).
One Year Forward Looking EV/EBIDTA Band One Year Forward Looking P/E Band
Source: SKP Research Desk
0
5000
10000
15000
20000
25000
30000
35000
Apr‐0
8
Sep‐
08
Feb‐
09
Jul‐0
9
Dec
‐09
May‐1
0
Oct‐1
0
Mar‐1
1
Aug
‐11
Jan‐
12
Jun‐
12
Nov
‐12
Apr‐1
3
Sep‐
13
Feb‐
14
Jul‐1
4
Dec
‐14
5 15 25 35 45 EV
050
100150200250300350400450500
Apr‐0
8
Aug
‐08
Dec
‐08
Apr‐0
9
Aug
‐09
Dec
‐09
Apr‐1
0
Aug
‐10
Dec
‐10
Apr‐1
1
Aug
‐11
Dec
‐11
Apr‐1
2
Aug
‐12
Dec
‐12
Apr‐1
3
Aug
‐13
Dec
‐13
Apr‐1
4
Aug
‐14
Dec
‐14
10 20 30 40 50 60 Close Price

La Opala RG Ltd.
SKP Securities Ltd www.skpmoneywise.com Page 10 of 12
Source: The Company
Particulars Q3 FY15 Q3 FY14 % Change Q2FY14 % Change 9MFY15 9MFY14 % ChangeNet Sales 631.6 569.9 10.8% 569.2 11.0% 1619.9 1290.0 25.6%Raw Material Consumed 122.6 125.9 ‐2.6% 85.3 43.7% 293.9 306.7 ‐4.2%% to Sales 19.4% 22.1% ‐‐ 15.0% ‐‐ 18.1% 23.8% ‐‐Purchase of traded goods 8.0 0.0 ‐‐ 0.0 ‐‐ 8.0 0.0 ‐‐Employee Expenses 70.4 61.9 13.9% 65.55 7.4% 195.0 158.8 22.8%Fuel Cost 60.1 70.6 ‐14.9% 75.5 ‐20.4% 195.0 170.9 14.1%Marketing & Advertisement 107.6 91.3 17.8% 105.0 2.5% 250.5 161.1 55.5%Other Expenses 55.0 53.0 3.8% 68.1 ‐19.2% 192.7 130.9 47.3%TOTAL EXPENDITURE 423.7 402.7 5.2% 399.4 6.1% 1135.1 928.3 22.3%EBIDTA 207.9 167.1 24.4% 169.8 22.4% 484.8 361.7 34.0%EBIDTA Margin 32.9% 29.3% ‐‐ 29.8% ‐‐ 29.9% 28.0% ‐‐Depreciation 22.5 19.1 18.0% 25.6 ‐12.0% 67.3 51.2 31.6%EBIT 185.4 148.1 25.2% 144.3 28.5% 417.5 310.5 34.4%EBIT Margin 29.3% 26.0% ‐‐ 25.3% ‐‐ 25.8% 24.1% ‐‐Interest 2.0 8.2 ‐76.2% 1.4 39.3% 6.3 28.8 ‐78.1%Other Income 1.5 4.6 ‐67.9% 5.1 ‐70.6% 9.5 8.6 10.3%Exceptional Items 0.0 0.0 ‐‐ 0.0 ‐‐ 0.0 0.0 ‐‐Forex Difference 0.0 0.0 ‐‐ 0.0 ‐‐ 0.0 0.0 ‐‐Tax 46.0 34.2 34.5% 37.1 24.0% 109.8 76.1 44.2%Extraordinary Items 0.0 0.0 ‐‐ 0.0 ‐‐ 0.0 0.0 ‐‐Prior period taxes written bk. 0.0 0.0 ‐‐ 0.0 ‐‐ 0.0 0.0 ‐‐Minority Interest 0.0 0.0 ‐‐ 0.0 ‐‐ 0.0 0.0 ‐‐Share of Associate Company 0.0 0.0 ‐‐ 0.0 ‐‐ 0.0 0.0 ‐‐Reported Profit After Tax 138.9 110.3 25.9% 110.9 25.3% 310.9 214.3 45.1%PAT Margin 22.0% 19.4% ‐‐ 19.5% 13.0% 19.2% 16.6% ‐‐Diluted EPS (`) 2.6 2.1 23.6% 2.1 23.6% 5.8 4.0 42.3%
Standalone Q3FY15 and 9MFY15 Financials (`mn)

La Opala RG Ltd.
SKP Securities Ltd www.skpmoneywise.com Page 11 of 12
Income Statement FY14 FY15E FY16E FY17E Balance Sheet FY14 FY15E FY16E FY17E
Net Operating Income 1778.6 2238.5 2764.2 3507.8 Equity Capital 106.0 111.0 111.0 111.0
Operating Expenditure 1278.8 1563.7 1916.9 2414.3 Share Warrants 0.0 0.0 0.0 0.0
EBIDTA 499.7 674.7 847.3 1093.6 Reserves 872.3 1805.0 2302.9 2966.0
Depreciation 70.1 90.4 109.5 126.4 Net Worth 978.3 1916.0 2413.9 3077.0
EBIT 429.6 584.3 737.7 967.2 Loan Funds 141.8 67.2 16.6 17.5
Other Income 10.8 17.9 27.6 35.1 Deferred Tax Liab. 93.5 93.5 93.5 93.5
Interest 32.8 8.7 2.2 2.3 Total Liabilities 1227.0 2093.5 2544.8 3214.4
Exceptional Items 0.0 0.0 0.0 0.0 Net Block 731.3 662.9 1053.3 926.9
EBT after Exceptional Items 407.6 593.5 763.2 1000.0 Capital WIP 22.0 333.3 0.0 0.0
Tax 108.1 130.6 167.9 220.0 Investment 0.9 561.0 561.0 561.0
Minority Interest 0.0 0.0 0.0 0.0 Net Current Assets 472.8 536.2 930.4 1726.4
PAT 299.6 462.9 595.3 780.0 Total Assets 1227.0 2093.5 2544.8 3214.4
EPS ( )̀ 5.7 8.3 10.7 14.1
Cash Flow Statement FY14 FY15E FY16E FY17E Ratios FY14 FY15E FY16E FY17E
PBT 407.6 593.5 763.2 1000.0 Valuation ratios (x)
P/E 76.3 51.7 40.2 30.7
P/Cash EPS 61.8 43.2 33.9 26.4
Net change in WC, Tax, Int ‐113.2 ‐212.8 ‐417.0 ‐418.7 P/BV 23.4 12.5 9.9 7.8
EV/EBIDTA 45.8 35.5 28.0 21.2
EV/Sales 12.9 10.7 8.6 6.6
Capital Expenditure ‐161.4 ‐333.3 ‐166.7 0.0 Earning Ratios (%)
EBIDTAM 28.1% 30.1% 30.7% 31.2%
OPM 24.2% 26.1% 26.7% 27.6%
NPM 16.8% 20.7% 21.5% 22.2%
ROE 30.6% 24.2% 24.7% 25.3%
ROCE 38.4% 29.5% 30.4% 31.3%
B/S Ratios
Current ratio (x) 3.1 2.9 3.9 5.3
D/E (x) 0.1 0.0 0.0 0.0
Opening Cash Balance 8.3 91.2 68.9 210.0 Debtor Days 41.1 39.5 42.0 43.7
Creditor Days 7.6 7.6 7.5 7.4
Inventory Days 82.3 74.5 82.7 87.6
Closing Cash Balance 91.2 68.9 210.0 801.7 FA/Turnover (x) 2.4 3.4 2.6 3.8
Add: Depreciation, Interest & Other Exppenditure 98.3 99.1 111.7 128.7
Cash Flow from Operating Activities 392.7 479.8 457.9 710.0
Investments, Sales of FA, Dividend received and others 80.2 ‐560.1 0.0 0.0
Cash flow investing Activities ‐81.1 ‐893.5 ‐166.7 0.0
Cash flow from Financing Activities ‐228.7 391.4 ‐150.1 ‐118.2
Net Increase/Decrease in Cash & Cash equivalents 82.9 ‐22.3 141.1 591.7
Cash balance of acquired subsidiaries 0.0 0.0 0.0 0.0
Notes:
Financials `mn)
Source: SKP Research

La Opala RG Ltd.
SKP Securities Ltd www.skpmoneywise.com Page 12 of 12
The above analysis and data are based on last available prices and not official closing rates. SKP Research is also available on Bloomberg, Thomson First Call &Investext, Myiris, Moneycontrol, Tickerplant and ISI Securities.
DISCLAIMER: This document has been issued by SKP Securities Ltd (SKP), a stock broker registered with and regulated by Securities & Exchange Board of India, for the information of its clients/potential clients and business associates/affiliates only and is for private circulation only, disseminated and available electronically and in printed form. Additional information on recommended securities may be made available on request. This document is supplied to you solely for your information and no matter contained herein may be reproduced, reprinted, sold, copied in whole or in part, redistributed or passed on, directly or indirectly, to any other person for any purpose, in India or into any other country without prior written consent of SKP. The distribution of this document in other jurisdictions may be strictly restricted and/ or prohibited by law, and persons into whose possession this document comes should inform themselves about such restriction and/ or prohibition, and observe any such restrictions and/ or prohibition. If you are dissatisfied with the contents of this complimentary document or with the terms of this Disclaimer, your sole and exclusive remedy is to stop using the document and SKP shall not be responsible and/ or liable in any manner. Neither this document nor the information or any opinion expressed therein should be construed as an investment advice or offer to anybody to acquire, subscribe, purchase, sell, dispose of, retain any securities or derivatives related to such securities or an offer to sell or the solicitation of an offer to purchase or subscribe for any investment or as an official endorsement of any investment. Any recommendation or view or opinion expressed on investments in this document is not intended to constitute investment advice and should not be intended or treated as a substitute for necessary review or validation or any professional advice. The views expressed in this document are those of the analyst which are subject to change and do not represent to be an authority on the subject. SKP may or may not subscribe to any and/ or all the views expressed herein. It is the endeavor of SKP to ensure that the analyst(s) use current, reliable, comprehensive information and obtain such information from sources, which the analyst(s) believes to be reliable. However, such information may not have been independently verified by SKP or the analyst(s). The information, opinions and views contained within this document are based upon publicly available information, considered reliable at the time of publication, which are subject to change from time to time without any prior notice. The Document may be updated anytime without any prior notice to anybody. SKP makes no guarantee, representation or warranty, express or implied; and accepts no responsibility or liability as to the accuracy or completeness or correctness of the information in this Report. SKP, its Directors, affiliates and employees do not accept any liability whatsoever, direct or indirect, that may arise from the use of the information or recommendations herein. Please note that past performance is not necessarily a guide to evaluate future performance. SKP or its affiliates, may, from time to time render advisory and other services to companies being referred to in this document and receive compensation for the same. SKP and/or its affiliates, directors and employees may trade for their own account or may also perform or seek to perform investment banking or underwriting services for or relating to those companies and may also be represented in the supervisory board or on any other committee of those companies or may sell or buy any securities or make any investment, which may be contrary to or inconsistent with this document. This document should be read and relied upon at the sole discretion and risk of the reader. The value of any investment made at your discretion based on this document or income there from may be affected by changes in economic, financial and/ or political factors and may go down as well as up and you may not get back the full or the expected amount invested. Some securities and/ or investments involve substantial risk and are not suitable for all investors. Neither SKP nor its affiliates or their directors, employees, agents or representatives/associates, shall be responsible or liable in any manner, directly or indirectly, for information, views or opinions expressed in this document or the contents or any errors or discrepancies herein or for any decisions or actions taken in reliance on the document or inability to use or access our service or this document or for any loss or damages whether direct or indirect, incidental, special or consequential including without limitation loss of revenue or profits or any loss or damage that may arise from or in connection with the use of or reliance on this document or inability to use or access our service or this document.
SKP Securities LtdContacts Research Dealing Mumbai Kolkata Mumbai KolkataPhone 022 4922 6006 033 4007 7000 022 4922 6000 033 4007 7400Fax 022 4922 6066 033 4007 7007 022 4922 6066 033 4007 7007E‐mail
[email protected] [email protected] [email protected]
Member: NSE BSE NSDL CDSL NCDEX* MCX* MCX‐SX FPSB*Group Entities INB/INF: 230707532, BSE INB: 010707538, CDSL IN‐DP‐CDSL‐132‐2000, DPID: 021800, NSDL IN‐DP‐NSDL: 222‐2001, DP ID: IN302646, ARN: 0006, NCDEX: 00715, MCX: 31705, MCX‐SX: INE 260707532
Institutional & Retail Broking Wealth Advisory & Distribution Investment Banking