l58_19720925
TRANSCRIPT
( / ^ 6 a / • • • ^ ' •ii & I
COitl luLl'liirtL DECONTROLLED AFTEB SIX MONTHS
^ ^ September 25, 1972
t ' \ V '
CAPITAL MARKET DEVELOPMENTS
I Capital Markets Section, Division of Research and Statistics, Board of Governors of the Federal Reserve System, Washington, D. C.
Digitized for FRASER http://fraser.stlouisfed.org/ Federal Reserve Bank of St. Louis
INDEX
Developments in the Corporate and Municipal Bond Markets
Capital Market Y ie lds
Capital Market Volume
Stock Market
Mortgage Market
SYMBOLS:
e Estimate
p Preliminary
r Revised v
n.a. Not avai lable
Digitized for FRASER http://fraser.stlouisfed.org/ Federal Reserve Bank of St. Louis

T A B L E 1: Yields, Volume and Reception
( CORPORATE BOND MARKET YIELDS VOLUME ;2
WEEK ENDING: MOODY'S PER CENT SEASONED GROSS SOLD BY END BONDS SCHEDULED
NEW ISSUE 1 Aaa OFFERINGS OF WEEK WITHIN 28 DAYS
1972 - Aug. 4 7.27 7.22 228 74 n.a. 11 7.24 7.20 305 82 n.a. 18 7.22 7.19 528 73 25 7.23 7.17 360 86
Sept. 1 7.31 7.16 98 41 8 7.28 7.19 371 90 n.a. 15 7.32 7.23 12 Oe 58 n.a. 22 7.44 7.23 180e 81 29 200e n.a.
MUNICIPAL BOND MARKET YIELDS VOLUME2
WEEK ENDING: MOODY'S BOND BUYER PER CENT SEASONED SEASONED 20 GROSS SOLD BY END BONDS SCHEDULED Aaa BOND INDEX OFFERINGS OF WEEK WITHIN 28 DAYS
1972 - Aug. 4 5.10 5.32 382 88 825 11 5.10 5.24 520 84 700 18 5.05 5.22 293 70 937 25 5.10 5.32 452 66 691
Sept. 1 8
5.10 5.38 299 68 681 Sept. 1 8 5.15 5.39 225 88 758 15 5.10 5.38 600 79 1,308 22 5.15 5.37 291 72 1,289 29 n.a. 224e n,a.
1 Derived by adjusting to a Aaa basis, new issues of publicly-offered corporate bonds with call protection, rated A, Aa, or Aaa by Moody's Investors Service (except serial and convertible issues, offerings of natural gas pipeline and foreign companies, and bonds guaranteed by the Federal Government.)
2 Millions of dollars unless otherwise indicated.
Note: Sc-c- footnotes to Table 3
Digitized for FRASER http://fraser.stlouisfed.org/ Federal Reserve Bank of St. Louis
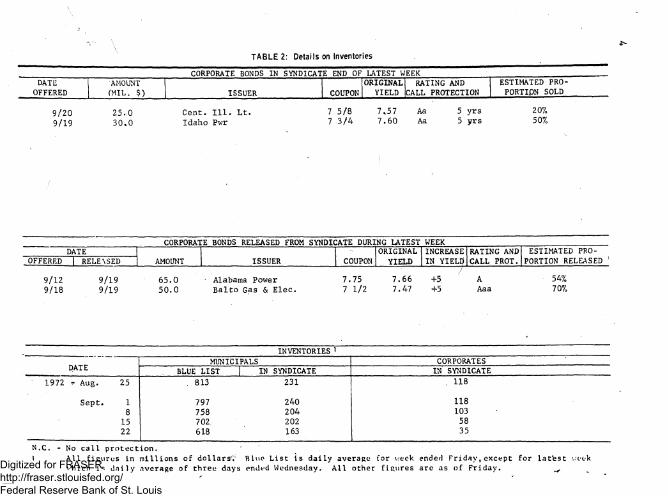
T A B L E 2: Details on Inventories
CORPORATE BONDS IN SYNDICATE END OF LATEST WEEK DATE I AMOUNT ORIGINAL RATING AND ESTIMATED PRO-
OFFERED | (MIL. $) ISSUER COUPON YIELD CALL PROTECTION PORTION SOLD
9/20 25.0 Cent. 111. Lt. 7 5/8 7,57 Aa 5 yrs 20%
9/19 30.0 Idaho Pwr 7 3/4 7.60 Aa 5 yrs 50%
CORPORATE BONDS RELEASED FROM SYNDICATE DURING LATEST WEEK DATE ORIGINAL INCREASE RATING AND ESTIMATED PRO-
OFFERED I RELEXSED AMOUNT ISSUER COUPON YIELD IN YIEL1) CALL PROT. PORTION RELEASED 1
9/12 9/18
9/19 9/19
65.0 50.0
- Alabama Power Balto Gas & Elec.
7.75 7 1/2
7.66 7.47
/ +5 +5
A Aaa
54% 70%
INVENTORIES *
DATE MUNICIPALS CORPORATES
DATE BLUE LIST | IN SYNDICATE IN SYNDICATE
1972 T Aug. 25 . 813 231 . 118
Sept. 1 797 240 118 8 758 204 103 15 702 202 58 22 618 163 35
N.C. - No call protection. 1 All figures in millions of dollars'". Blue List is daily average for v/eck ended Friday, except for lat'est v.cck
vhich is daily average of three days endvd Wednesday. All other figures arc as of Friday. Digitized for FRASER http://fraser.stlouisfed.org/ Federal Reserve Bank of St. Louis

T A B L E 3: High Grade Bond Yields
DATE NEW
CORPORATE Aaa1
MOODY'S SEASONED CORPORATE
Aaa 2
U.S. GOVERNMENT 20-YEAR
CONSTANT MATURITIES 3
BOND BUYER'S SEASONED
MUNICIPALS 4
1970 - High 9.30 (6/19) 8.60 (7/3) 7.55 (5/29) 7.12 (5/29) Low 7.68 (12/18) 7.48 (12/21) 6.17 (12/18) 5.33 (12/11)
1971 - High 8.23 (5/12) 7.71 (8/13) 6.51 (6/18) 6.23 (6/23) Low 6.76 (1/29) 7.06 (2/12) 5.69 (3/23) 4.97 (10/21)
1972 - High 7.44 (9/22) 7.36 (4/28) 6.19 (4/14) 5.54 (4/13) Low 6.86 (1/14) 7.16 (8/1) 5.92 (8/18) 4.99 (1/13)
1972 - Aug. 18 7.22 7.19 5.94 5.22 25 7.23 7.17 5.92 5.32
Sept. 1 7.31 7.16 5.97 5.38 8 7.28 7.19 v 6.01 5.39
15 7.32 7.23 6.03 5.38 22 7.44 7.23 6.07 5.37
1 New corporate issues, with call protection, adjusted (as described in footnote 1 of Table 1) to a Aaa basis.
2 Weekly average of daily figures. Average term of bonds included is 22-24 years.
3 Weekly average of daily figures. 4 Thursday figures. The average rating of the 20 bonds used in this index
falls midway between the four top groups as classified by Moody's In-vestors Service.
Note--Highs and lows are for individual series and may be on different dates for different series.
Digitized for FRASER http://fraser.stlouisfed.org/ Federal Reserve Bank of St. Louis

T A B L E 4: Long-term Corporate and State and Local Government Security Offerings and Placements
(In millions of dollars)
PERIOD
GROSS PROCEEDS
PERIOD CORPORATE 1 STATE AND LOCAL 2 PERIOD
1972 1971 1970 1972 1971 1970
January 3,205 3,115 2,636 1 1,776 2 ,732 1,340 February 3,369 3,000 1,802 | 2,002 1 ,851 1,214 March 3,229 6,075 3,539 | 2,237 2 ,258 1,555
April 3,275 4,042 3,170 I 2,114 1 ,891 1,647 May 3,598 3,300 3,909 1 1,986 2 ,167 996 June 4,341 4,375 3,389 2,224
1 -2 ,013 1,085
July 3,436 4,147 2,768 ! 18740e 1 ,989 1,348 August 2,910e 2,532 2,274 | 1,900e 1 ,903 1,359 September 3,768 3,518 | 2 ,098 1,758
October 3,387 3,777 1 ,728 1,924 November 3,704 4,182 2)264 . ; 1,748 December 3,673 3,980 2! ,068 2,190
1st Quarter 9,803 12,190 7,977 * 6,015 6, ,841 4,109 2nd Quarter 11,214 11,688 10,468 6,325 6, ,081 3,728 3rd Quarter 10,447 8,560 5, 990 4,465 4th Quarter 10,764 11,939 6, 060 5,862 v
1st half 21,017 23,844 18,445 , 12,339 12, 912 7,837 ; Three quarters 34,325 27,005 18, 902 12,302 Year 45,089 38,944 24, 962 18,164
Securities and Exchange Commission estimates of gross proceeds. Investment Bankers Association of America estimates of principal amounts.
Digitized for FRASER http://fraser.stlouisfed.org/ Federal Reserve Bank of St. Louis

TABLE 5: New Corporate Security Issues, Type of Issue and Issuer (In millions of dollars)
GROSS PROCEEDS BY
1 Other issuers arc extractive, railroad and other transportation, real estate and financc, and commercial and other. Sourco: Securities and Exchange Commission. Quarterly supplements are avail-able.
QUARTER OR
MONTH
TYPE OF ISSUE TYPE OF ISSUER QUARTER
OR MONTH TOTAL
BONDS COMMON
AND PFD. STOCK
MEMO: MFG.
PUBLIC UTILITY
COMMUNI-CATIONS
OTHER ISSUERS1
QUARTER OR
MONTH TOTAL PUBLICLY OFFERED
PRIVATELY PLACED
COMMON AND PFD. STOCK
ISSUES INCLUDED MFG. PUBLIC UTILITY
COMMUNI-CATIONS
OTHER ISSUERS1
QUARTER OR
MONTH TOTAL PUBLICLY OFFERED
PRIVATELY PLACED
COMMON AND PFD. STOCK FOREIGN 1 CONVERTIBLE
MFG. PUBLIC UTILITY
COMMUNI-CATIONS
OTHER ISSUERS1
~'Tl 11,688 6,546 1, 758 3, 384 215 1,351 3, ,130 2,910 896 4,753
III 10,447 4,725 1, 641 4, 079 114 652 2, ,202 2,651 2. ,263 3,331 IV 10,764 5,135 2, 439 3, 193 133 767 2; ,543 3,041 1, ,053 4,164
- I 9,805 5,361 1, 593 2, 851 74 511 1: ,525 2,261 1 ,476 4,541
II 11,214 4,634 2 781 3 798 245 449 2 ,109 3,495 1 ,369 4,240
- June 4,375 2,282 760 1, ,332 52 712 1 ,206 1,055 218 1,897
July 4,147 1,331 619 2. ,196 72 199 582 732 1 ,622 1,210 Aug. 2,532 1,428 416 687 34 160 474 849 359 850 Sept. 3,768 1,966 606 1, ,196 8 293 1 ,146 1,070 282 1,271
Oct. 3,387 1,942 723 723 59 222 662 933 432 1,360 Nov. 3,704 2,003 433 1 ,269 62 395' 811 1,217 269 1,408 Dec. 3,673 1,190 1 ,283 1 ,201 12 150 980 891 352 1,450
- Jan. 3,205 1,767 604 .834 59 195 392 533 752 1,529 Feb. 3,369 1,917 412 1 ,041 12 83 529 988 498 1,354 Mar. 3,229 1,677 577 976 3 233 604 740 227 • 1,658
Apr. 3,275 1,622 789 864 15 92 581 1,219 178 1,297
May 3,598 1,676 774 1 ,148 100 . 226 761 738 391 1,708
June 4,341 1,336 1 ,218 1 ,786 130 131 767 1,538 800 1,235
July e/ 3,436 1,803 534 1 ,100 — , 442 568 767 582 1,519
Aug. ;/ 2,910 1,510 600 800 n. a. 220 425 650 / 190 1,645
GROSS PROCEEDS BY
Digitized for FRASER http://fraser.stlouisfed.org/ Federal Reserve Bank of St. Louis

T A B L E 6: Large Long-term Pub l ic Secur i ty Issues for New Capi ta l (cont inued) (Other than U.S. T reasury ) 1
ISSUER Corporate
Carolina Pwr & Lt Mack Trucks, Inc. Goodyear Tire & Rubber Co Kentucky Utilities^, Illinois Pwr i Gen'l Tel of Ohio Halliburton Co Will Ross Inc. Cenco Instruments Corp Alabama Pwr Public Svc of Indiana Bait Gas & Elect United Va. Bancshares American Natural Gas Phil Elect Houston Lighting & Pwr Baltimore Gas & Elec CMI Investment Corp Digital Equip Corp S. Calif Gas National Kinney Idaho Pwr Central Illinois Light Idaho Pwr Dallas Pwr & Lt Detroit Edison Gulf States Utilities
TYPE '
AMOUNT (MILLIONS
OF DOLLARS)
Sept. 5, 1972 thru Sept. 22. 1972
Cum pref Debs Debs Cum pref Cm Bonds Conv deb Conv deb Conv deb 1st mtge Com stk Pref s t k Bonds Com stk Com (rts) Pref stk Bonds Conv deb Com stk Bonds Conv debs 1st mtg Bonds Pref 1st mtg Com stk Pref stk
50.0 75.0 150.0 20.0 44.6 20.0 70.0 25.0 20.0 65.0 35.0 40.0 35.0 60.0 90.0 50.0. 50.0 30.0 52.2 45.0 35.0 30.0 25.0 15.0 30.0 80.0 35.0
1997 1997
2002 1997 1992 1997 2002
1997
2002 1992
1997 1997 2002 2002
2002
COUPON RATE OR IIFFHR-
NET INTER- ' i;,c EST COST J YIELD
7.72 7 7/8 7.35 7.84
7 5/8 4.00 4.50 4.75 7.72
7.75
7.50 4.75
7.63 5.20 7.75 7.63
7.63
7.75
7.47 4.75
7.58 5.20 7.60 7.57
7.47
MOODY'S RATING
A Baa A A .
A
Ba
A
Aaa
Aa B Aa Aa
Digitized for FRASER http://fraser.stlouisfed.org/ Federal Reserve Bank of St. Louis

T A B L E 6: Large Long-term
ISSUER
State and Local Nashville & Davidson Co.
Metro. Gov't, Tenn Connecticut Jacksonville Elect Auth Fla Jacksonville Elect Auth Fla Green Bay Metro Sew Dist. Wis. Delaware River Port Auth Delaware River Port Auth University of Tex System Bd of
Regents Kansas Oklahoma Industries Auth Oklahoma Indus. Auth Georgia Ed Auth Industry Urban Dev Ag. Ca. HUD HUD Grant Co.,W. Wa. Spring Branch ISD, Texas Dade Co. Fla. Port Auth Dade Co., Fla. Port Auth Massachusetts Hollywood, Fla. Florida, State of
Other F.N M . A .
Public Security Issues for New Capital (continued) (Other than U.S. Treasury)1
September 4 COUPON I
thru September 22, 1972
AMOUNT RATE OR (MILLIONS
NET INTER-MATURITY EST COST DOLLARS)
G • 0* G • 0 • Rev. Rev. G.O. Rev-Re f Ref-Rev
G.O. Rev. 1st mtge 1st mtge Rev G.O* G.O. G.O. Rev. G.O. Rev Rev G.O. Rev Rev
Deb 8
OFFER-
i;;<;
YIELD
MOODY 1S RATING
16.3 1974-1992 4.79 3.50-5.60 A
100.0 1973-1992 4.81 3.10-5.10 Aaa
32.8 2001 5.28 5.40-5.35 Aa
17.2 1980-1990 5.28 4.30-5.10 Aa
15.0 1975-1992 4.94 3.50-5.55 A-l
31.0 1979 — 4.60
77.4 2010 6.00 6.00 " "
16.0 1977-1997 5.26 4.00-5.40 A-l
40.0 1973-2002 5.29 3.10-5.55 A
rev 7.6 1976-1987 — 4.25-6.00
rev 23.9 2002 6.20 6.20
19.6 1973-1997 5.13 3.00-5.50 Aa
10.0 2000 5.83 5.85 A
233.4 1973-2013 4,20 3.00-5.25 Aaa
23.4 1973-2013 5.20 2.85-5.25 Aaa
22.0 2002 5.63 5.63 50 — 10.2 1974-1998 5.18 3.20-5.25-5. 50 —
26.5 2011 5.94 5.93 Baa
1.5 1974-1992 5.94 5.93 Baa
100.0 1973-1992 4.82 3.10-5.15 Aa
20.0 1973-2001 5.48 3.20-5.80 Baa
22.0 1973-1997 5.31 3.00-5.50-5, .70 A
250.0 1997 7.40 7.40 —
Rights offering. Includes corporate and other security offerings of $15 million and over; State and local security offerings of $10 million and over. In case of State and local government securities, G.O. denotes general obligation; •<ev.-Ut., revenue obligations secured only by income from public utilities; Rev.-Q.-lit., revenue bonds secured only by income from quasi-utilitivs; Rev.-S.T., revenue bonds secured by revenue from specific taxes only; Rev.-Rent., revenue bonds secured solely by lease payments. Includes foreign government and International Bank for Reconstruction and Development issues and non-quaranteed issues by Federal Agencies.
Digitized for FRASER http://fraser.stlouisfed.org/ Federal Reserve Bank of St. Louis
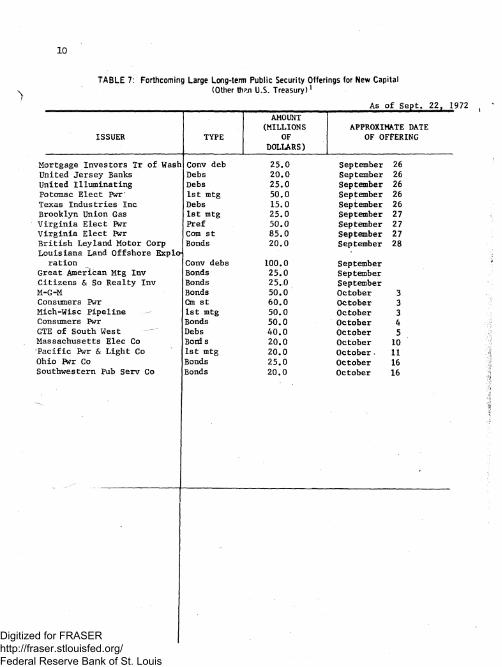
10
T A B L E 7: Forthcoming Large Long-term Public Security Offerings for New Capital (Other th?.n U.S. Treasury)1
As of Sept. 22, 1972
AMOUNT (MILLIONS APPROXIMATE DATE
ISSUER TYPE OF OF OFFERING DOLLARS)
Mortgage Investors Tr of Wash Conv deb 25 .0 September 26 United Jersey Banks Debs 20 .0 September 26 United Illuminating Debs 25 .0 September 26 Potomac Elect Pwr* 1st mtg 50 .0 September 26 Texas Industries Inc Debs 15 .0 September 26 Brooklyn Union Gas 1st mtg 25, .0 September 27 Virginia Elect pwr Pref 50, .0 September 27 Virginia Elect Pwr Com st 85, .0 September 27 British Leyland Motor Corp Bonds 20. .0 September 28 Louisiana Land Offshore Explo
ration Conv debs 100. .0 September Great American Mtg Inv Bonds 25. ,0 September Citizens & So Realty Inv Bonds 25. 0 September M-G-M Bonds 50. ,0 October 3 Consumers Pwr Cm st 60. 0 October 3 Mich-Wise Pipeline 1st mtg 50. 0 October 3 Consumers Pwr Bonds 50. 0 October 4 GTE of South West Debs 40. 0 October 5 Massachusetts Elec Co Bond s 20. 0 October 10 Pacific Pwr & Light Co 1st mtg 20. 0 October - 11 Ohio Pwr Co Bonds 25. 0 October 16 Southwestern Pub Serv Co Bonds 20. 0 October 16
Digitized for FRASER http://fraser.stlouisfed.org/ Federal Reserve Bank of St. Louis

11
T A B L E 7: Forthcoming Large Long-term Public Security Offerings for New Capital (Other than U.S. Treasury)1
(continued) ' . n 1972
ISSUER State and Local
TYPE
AMOUNT (MILLIONS
OF DOLLARS)
APPROXIMATE DATE OF OFFERING
Gloucester Co Sewage Auth. NJ Rev 15.0 Sept. 27 (Fairfax Co., Va. G.O 29.0 Sept. 27 Dallas, Texas G.O 40.0 Sept. 27 ]Was Co., Ohio Rev. 18.5 Sept. Flkt Rock, Mich Ind Dev. Rev 25.0 Sept.
*Texas Water Development Bd. G.O. 25.0 Oct. 3 San Bernardino Wtr. Dist., Cal G.O. 12.0 Oct. 3 New York State G.O. 156.0 Oct. 4 Washington Metro Area Transit
Auth Rev. 225.0 Oct. 10 New York City G.O. 300.0 Oct. 11 Los Angeles DWAP Rev. 40.0 Oct. 11 Phoenix, Arizona G.O. & Rev 22.0 Oct. 17 Los Angeles Ca. Fla Cont. Dist
Cal. Rev. 35.0 Oct. 17 Austin, Texas G.O. & Rev 12.2 Oct. 19 Oregon G.O. 45.0 Oct. 25 Winston-Salem N.C. G.O. 10.9 Oct. 31 Nebraska Pub Pwr Rev. 25.0 Oct.
' California, State of G.O. 90.0 Nov. 3 Ohio G.O. 100.0 Nov. 16
Included in table for first time. Includes corporate and other issues of 515 million and over; State and local Government issues of $10 million and over. Includes foreign government and International Bank for Reconstruction and Development issues and non-guaranteed issues -of Federal Agencies.
!
Digitized for FRASER http://fraser.stlouisfed.org/ Federal Reserve Bank of St. Louis

12 Table 8
STOCK PRICES AND VOLUME
STOCK PRICES1- TRADING VOLUME 2-
DATE NYSE INDEX 3" D J . INDUSTRIALS AMEX * NYSE AMEX
1970 - High 52.36 (1/5) 842.00 (12/29 ) 27.02 (1/8) 18.5 (12/4) 7/1 (1/2)
Low 37.69 (5/26) 631.16 (5/26) 19.36 (5/27 ) 7.8 (8/14) 1.8 (8/14)
1971 - High 57.76 (4/28) 950.82 (4/28) 26.68 (4/28 ) 22.1 (2/12) 6.7 (2/5)
Low 48.73 (1/4) 797.97 (11/23 ) 22.72 (1/4) 11.0 (9/17) 2.7 (8/13)
1972 - High 61.56 (8/11) 971.25 (5/26) 28.53 (4/14 ) 21.2 (3/24) 7.4 (3/10)
Low 56.23 (1/3) 889.30 (1/3) 25.61 (1/3) 13.8 (7/7) 2.6 (9/8)
Aug. 4 60.75 951.76 26.92 16.1 3.9
11 61.56 964.18 27.01 15.1 3.9
18 61.52 966.99 26.97 16.2 4.0
25 60.93 959.36 26.71 16.7 3.6
Sept. 1 8
61.34 970.05 26.67 16.7 3.3 Sept. 1 8 60.53 961.24 26.46 11.2 2.6
15 59.76 947.32 26.15 12.3 2.8
22 59.51 943.03 26.06 11.8 2.6
Figures other than highs and lows are Fridays only. Highs and lows are for the year and are not necessarily.for Fridays.
NYSE is the New York Stock Exchange; AMEX is the American Stock Exchange. Volume figures are daily averaged for the entire week, (millions of shares). Trading is normally conducted for 5-1/2 hours per day and 5 days per week, or In recent years, however abbreviated trading to the extent, and over the time
Hours/ Days/ From Through: Day Week
January 3, 1969' July 7, 1969 January 2, 1970
3. 12/31/65 = 50
4. Average dollar value of shares
July 3, 1969 December 31, 1969 May 1, 1970
4 4-1/2 5
27-1/2 hours per week, periods, shown below:
Week
20
Digitized for FRASER http://fraser.stlouisfed.org/ Federal Reserve Bank of St. Louis
1 3
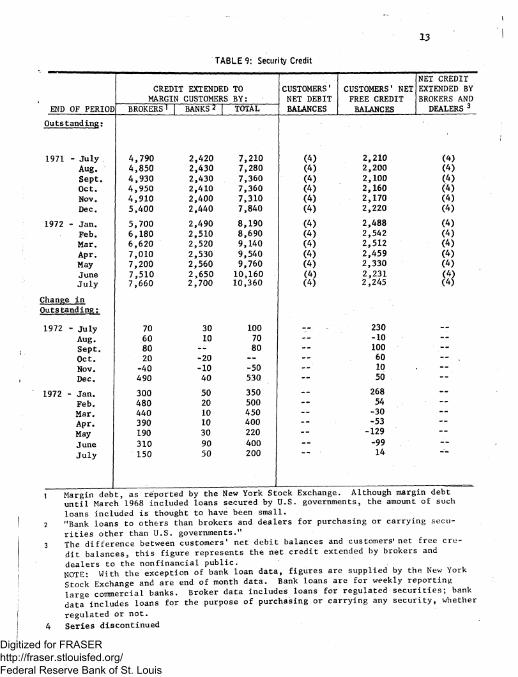
T A B L E 9: Security Credit
NET CREDIT CREDIT EXTENDED TO CUSTOMERS1 CUSTOMERS' NET EXTENDED BY
MARGIN CUSTOMERS BY: NET DEBIT FREE CREDIT BROKERS AND END OF PERIOD BROKERS' | BANKS 2 | TOTAL BALANCES BALANCES DEALERS 3
Outstanding:
1971 - July 4,790 2,420 7,210 ( 4 ) 2,210 ( 4 ) Aug. 4,850 2,430 7,280 ( 4 ) 2,200 ( 4 ) Sept. 4,930 2,430 7,360 ( 4 ) 2,100 ( 4 ) Oct. 4,950 2,410 7,360 ( 4 ) 2,160 ( 4 ) Nov. 4,910 2,400 7,310 (4) 2,170 (4) Dec. 5,400 2,440 7,840 (4) 2,220 (4)
1972 - Jan. 5,700 2,490 8,190 (4) 2,488 (4) Feb. 6,180 2,510 8,690 ( 4 ) 2,542 ( 4 ) Mar. 6,620 2,520 9,140 ( 4 ) 2,512 (4)
Apr. 7,010 2,530 9,540 (4) 2,459 (4) May 7,200 2,560 9,760 ( 4 ) 2,330 (4)
June 7,510 2,650 10,160 (4) 2,231 July 7,660 2,700 10,360 (4) 2,245 (4)
Change in Outstanding:
1972 - July 70 30 100 230 —
Aug. 60 10 70 — -10 - -
Sept. 80 - - 80 — 100
Oct. 20 -20 — — 60 —
Nov. -40 -10 -50 10 —
Dec. 490 40 530 - - 50 —
1972 - Jan. 300 50 350 — 268 —
Feb. 480 20 500 — 54 - -
Mar. 440 10 450 — -30
Apr. 390 10 400 -53 - -
May 190 30 220 -129 —
June 310 90 400 — -99 —
July 150 50 200 14
_L Margin debt, as reported by the New York Stock Exchange. Although margin debt until March 1968 included loans secured by U.S. governments, the amount of such loans included is thought to have been small. "Bank loans to others than brokers and dealers for purchasing or carrying secu-rities other than U.S. governments." The difference between customers' net debit balances and customers'net free cre-dit balances, this figure represents the net credit extended by brokers and dealers to the nonfinancial public. NOTE: With the exception of bank loan data, figures are supplied by the New York Stock Exchange and are end of month data. Bank loans are for weekly reporting large commercial banks. Broker data includes loans for regulated securities; bank data includes loans for the purpose of purchasing or carrying any security, whether
regulated or not. Series discontinued
Digitized for FRASER http://fraser.stlouisfed.org/ Federal Reserve Bank of St. Louis
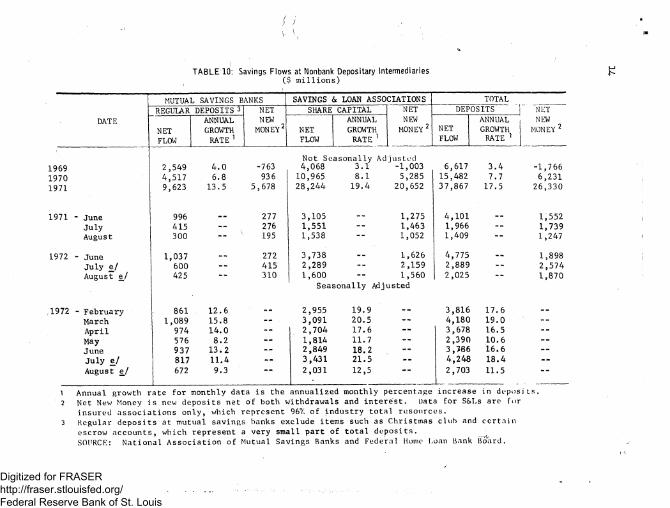
T A B L E 10: Savings Flows at Nonbank Depositary Intermediaries ($ millions)
MUTUAL SAVINGS BANKS SAVINGS < St LOAN ASSOCIATIONS TOTAL
REGULAR DEPOSITS 3 NET SHARE CAPITAL NET DEPOSITS NET
DATE ANNUAL NEW ANNUAL NEW ANNUAL NEW NET GROWTH MONEY2 NET GROWTH MONEY 2 NET GROWTH MONEY 2
FLOW RATE 1 FLOW RATE 1 FLOW RATE 1
2,549 4.0 -763 Not Seasonally Adjusted 4,068 3.1 -1,003
1970 4 517 6.8 936 10, 965 8.1 5,285 15,482 7.7 6,231 1971 9 623 13.5 5,678 28, 244 19.4 20,652 37,867 17.5 26,330
1971 - June 996 277 3, ,105 1,275 4,101 1,552 July 415 - - 276 1, ,551 - - 1,463 1,966 — 1,739 August 300 - - 195 1, ,538 - - . 1,052 1,409 - - 1,247
1972 - June 1 ,037 __ 272 3, ,738 - - 1,626 4,775 1,898 July e/ 600 — 415 2 ,289 2,159 2,889 2,574 August e/ 425 — 310 1. ,600 1,560 2,025 — 1,870
Seasonally Adjusted
,1972 - February 861 12.6 — * 2 ,955 19.9 - - 3,816 17.6 - -
March 1 ,089 15.8 ~ - 3 ,091 20.5 - - 4,180 19.0 April 974 14.0 - - 2 ,704 17.6 - - 3,678 16.5 —
May 576 8.2 - - 1 ,814 11.7 2,390 10.6 —
June 937 13.2 - - 2 ,849 18.2 — 3,786 16.6 —
July e/ 817 11.4 - - 3 ,431 21.5 4,248 18.4 - -
August e/ 672 9.3 2 ,031 12,5 2,703 11.5
6,617 3.4 -1,766
1 Annual growth rate for monthly data is the annualized monthly percentage increase in deposits. 2 Net New Money is new deposits net of both Withdrawals and interest. Data for S&Ls are for
insured associations only, which represent 96% of industry total resources. 3 Regular deposits at mutual savings banks exclude items such as Christmas club and certain
escrow accounts, which represent a very small part of total deposits. SOURCE: National Association of Mutual Savings Banks and Federal Home I.can Bank Board.
Digitized for FRASER http://fraser.stlouisfed.org/ Federal Reserve Bank of St. Louis

T A B L E 11: Mortgage Commitments at Selected Thrift Institutions 1
OUTSTANDING COMMITMENTS | NET CHANGE ALL MUTUAL 1 ALL MUTUAL
DATE TOTAL SAVINGS & SAVINGS TOTAL SAVINGS & SAVINGS LOAN BANKS LOAN BANKS
ASSOCIATIONS (N.Y. STATE) ASSOCIATIONS (N.Y. STATE)
(Billions of Dollars, Sea sonally Adjusted)
71 - June 15.9 12.8 3.1 1.31 1.26 .05 July 16.2 13.1 3.1 .30 .29 .01 Aug. 16.3 13.2 3.1 .12 .14 -.01 Sept. 16.4 13.2 3.2 .08 -.07 . 14 Oct. 16.3 13.1 3.3 .02 -.05 .07 Nov. 16.6 13.2 3.4 .20 .08 .12 Dec. 16.6 13.1 3.6 .09 -. 06 . 15
>72 - Jan. 17.0 13.3 3.7 .30 . 12 . 18 Feb. 18.3 14.2 4.1 1.34 .97 .37 Mar. 19.5 15.2 4.3 1.19 .97 .22 Apr. 20.5 16.0 / 4.5 .99 .79 .20 May 21.7 17.1 \ 4. 6 1.24 1.15 .09 June 21.7 17.2 4.5 .91 . 83 -.08
Based on data from Federal Home Loan Bank Board and Savings Banks Associations of New York State. Data for savings banks and S&L's include a minor amount of non-residential commitments. S&L commitments include loans in process. Net changes are derived directly from unrounded outstandings levels as reported and after seasonal adjustment by Federal Reserve. Subtotals may not add to totals because of rounding.
Digitized for FRASER http://fraser.stlouisfed.org/ Federal Reserve Bank of St. Louis

16
TABLE 12: Net Change in Mortgage Holdings 1
FINANCIAL INSTITUTIONS
DATE TOTAL
INCLUDING FNMA-GNMA
TOTAL COMMERCIAL BANKS
MUTUAL SAVINGS BANKS
SAVINGS & LOAN
ASSOC.
LIFE INSURANCE COMPANIES
1972 - May June July
1971 - June July Aug. Sept. Oct. Nov. Dec.
1972 - Jan. Feb. Mar. Apr. May
July
Not Seasonally Adjusted
23,781 24,074 21,736 41,647
4,758 5,624
4,136 4,186 4,295 4,021 3,747 3,745 4,323
3,123 3,315 4,208 4,057 4,714 5,224
21,273 19,699 16,827 39,259
4,474 5,592
3,935 3,878 3,783 3,555 3,357 3,443 4,081
2,974 3,065 4,097 4,058 4,339 5,105
6,677 5,404 2,462 9,940
1,300 1,500 1,400
2,787 2,682 1,845 3,938
454 585
9,350 9,561 10,172 24,160
2,720 3,453 2,819
Seasonally Adjusted
1,219 977
1,001 999 974 843 824
754 1,061 1,084 1,261 1,414 1,377
386 374 400 306 329 465 522
272 296 486 390 455 533
2,309 2,455 2,252 2,122 1,977 2,058 2,357
1,813 2,042 2,571 2,506 2,571 3,067 2,754
2,459 2,508 2,052 4,375 2,348 4,909 1,221 2,388
24 284 54 50 n.a. 155
21 201 72 308 130 512 128 466 77 390 77 302
378 242
1 149' -27 .250 -21 111 78 -1 52 375 91 119
144
Monthly data for commercial banks based on Federal Reserve estimates .benchmarked to Call Report data on real estate loans outstanding as available. Other data derived from mortgage debt outstanding as reported separately by National Assn. of Mutual Savings Banks, Federal Home Loan Bank Board, Institute of Life Insurance and, through August 1968, the Federal National Mortgage Association, and there-after by FNMA and the Government National Mortgage Association. Data for mutual savings banks and for Life Insurance companies may differ somewhat from those derived from regular quarterly series because of minor conceptual differences for which adjustments are not made in the monthly series. Altogether, these groups accounted for 87 per cent of the net increase estimated for all holders in 1971.
Digitized for FRASER http://fraser.stlouisfed.org/ Federal Reserve Bank of St. Louis

1 7
T A B L E 13: Net Increases in Mortgage Debt Outstanding 1
Billions of dollars, SAAR -
1- to 4- MULTI- MULTI-AND QUARTER TOTAL RESIDENTIAL 3 FAMILY FAMILY COMMERCIAL COMMERCIAL FARM
1967 - I 16.0 10.3 7.0 3.3 3.9 7.2 1.8 II 20.8 14.0 10.6 3.4 5.0 8.4 1.8 III 26.3 18.9 15.1 3.8 4.9 8.8 2.5 IV 27.2 19.7 15.9 3.8 4.7 8.5 2.8
1968 - I 28.1 19.4 16.2 3.2 6.4 9.5 2.3 II 26.4 18.2 15.0 3.2 6.0 9.2 2.2 III 25.8 17.4 13.9 3.5 6.6 10.1 1.8 IV 29.4 20.2 16.3 3.9 7.3 11.2 1.9
1969 - I 31.8 23.6 19.2 4.4 6.1 10.5 2.2 II 29.1 21.5 16.8 4.7 5.4 10.1 2.2 III 26.2 19.0 14.4 4.7 5.4 10.0 1.7 IV 24.9 18.2 13.0 5.3 5.2 10.5 1.4
1970 - I 20.6 14.2 9.1 5.1 4.8 9.9 1.5 II 22.9 16.9 11.5 5.4 4.6 9.9 1.5 III 29.1 21.8 15.5 6.3 5.2 11.5 2. 1 IV 31.3 22.5 16.0 6.5 6.7 13.2 2.2
1971 - I 37.1 26.6 18.5 8.1 8.3 16.3 2.2 II 47.8 36.1 26.4 9.7 9.4 19.1 2.3 III 53.6 40.1 31.4 8. 7 11.2 19.9 2.3 IV 53.4 40.1 31.4 8.7 10.8 19.5 2.5
1972 - Ie 56.7 - 41.5 32.2 9.3 13.0 22.2 2.2 H e 57.7 42.8 33.4 9.4 12.8 22.3 2.1
l i l i i i l l l i l * . Residential mortgage debt includes nonfarm only and is sum of 1-to 4- family and multifamily mortgage debt combined. y
Digitized for FRASER http://fraser.stlouisfed.org/ Federal Reserve Bank of St. Louis

/
T A B L E 14: FNMA Weekly "Auct ion" Results
COMMITMENTS IN $ MILL! NS IMPLICIT YIELD2(per cent) ACCEPTED
WEEK TOTAL TOTAL 90- 6- 1-YEARH 90- 6- 1-YEAR 1
ENDED OFFERED DAY MONTH & OVER DAY MONTH & OVER
May 30 133.4 76.4 76.4 - - . 7.62 - -
June 12 83.5 48. 1 48. 1 7.62 __
26 97.8 76.6 76.6 - - 7.62 - -
July 10 134.6 92.1 92.1 \ -- ' 1 7.62 __
24 123.9 113.0 113.0 - - 7.62 - -
Aug. 7 106.2 81.7 81. 7 7.63 21 114.6 87.2 87.2 - - 7.62 - - - -
Sept. 5 220.6 151.2 151.2 7.63 __
18 295.9 148. 1 148.1 7.65
Note: Under the FNMA auction system, approved sellers of Government-underwritten mortgages bid for FNMA forward purchase commitments. Average secondary market yields after allowance for commitment fee and required purchase and holding of FNMA stock, assuming prepayment of 15 years for 30-year Government-underwritten mortgages. Yields shown are gross, before deduction of 38 basis points fee paid by investors to servicers.
Digitized for FRASER http://fraser.stlouisfed.org/ Federal Reserve Bank of St. Louis

1 9
T A B L E 15: Private Housing Starts and Permits
DATE
STARTS BUILDING PERMITS (SEASONALLY ADJUSTED ANNUAL RATE) 2
DATE SEASONALLY ADJUSTED
ANNUAL RATE
UNADJUSTED BUILDING PERMITS (SEASONALLY ADJUSTED ANNUAL RATE) 2
DATE SEASONALLY ADJUSTED
ANNUAL RATE TOTAL TYP E OF FINANCING
BUILDING PERMITS (SEASONALLY ADJUSTED ANNUAL RATE) 2
DATE SEASONALLY ADJUSTED
ANNUAL RATE TOTAL FHA VA OTHER
BUILDING PERMITS (SEASONALLY ADJUSTED ANNUAL RATE) 2
DATE TOTAL 1-FAMILY 2 OR MORE
TOTAL FHA VA OTHER
BUILDING PERMITS (SEASONALLY ADJUSTED ANNUAL RATE) 2
- August 2,219 1,198 1,021 204. 5 45.8 9.4 147.0 1,997 September 2,029 1,172 857 173. 8 48.3 8.7 116.8 1,944 October 2,038 1,155 882 179. 7 38.5 8.1 133.1 1,983 November 2,228 1,242 985 176. ,4 47.2 9.1 120.1 2,051 December 2,457 1,347 1,110 152. 1 85.4 7.4 59.3 2,142
- January 2,487 1,415 1,071 150. 9 37.4 7.5 106.0 2,204 February 2,682 1,325 1,357 • 153. 6 27.8 8.0 i 117.8 2,056 March 2,369 1,302 1,067 205. 8 37.7 10.5 . 155.7 2,007
April 2,109 1,167 942 213. 2 29.1 8.5 172.9 1,991
May 2,350 1,344 1,006 227. 9 34.1 9.4 180.3 1,955 June e/ 2,330 1,296 1,034 226. 3 32.7 9.6 181.1 2,121
July 2,190 1,272 918 205. 0 28.6 9.4 165.6 2,108 Augus t 2,457 1,405 1,052 228.2
"
2,246
1 Total starts are Census estimates including farm for both permit-issuing and noi.-issuing areas. A dwelling unit is started when excavation begins; all units in an apartment structure are considered started at that time. FHA and VA starts are units started under commitments by these agencies to insure or guar-antee the mortgages. As reported by FHA and VA, a unit is "started when a field office receives the first compliance inspection report, which is made before footings are poured in some cases but normally after the foundations have been completed. Other starts are derived as a residual, although total and FHA and VA starts are not strictly comparable in concept or timing; other starts in-clude both units financed by conventional mortgages and units without mortgages.
2 Building permits before January 1963 are Census estimates for about 10,000 areas identified as having a local building permit system in 1959. Estimates beginning January 1963 are for approximately 12,000 and beginning January 1967 13,000, or all known permit-issuing places. Unlike starts, seasonally adjusted building per-mits reflect direct adjustment for differences in the number of working days per month, as well as other differences in timing and coverage.
Digitized for FRASER http://fraser.stlouisfed.org/ Federal Reserve Bank of St. Louis
2 o
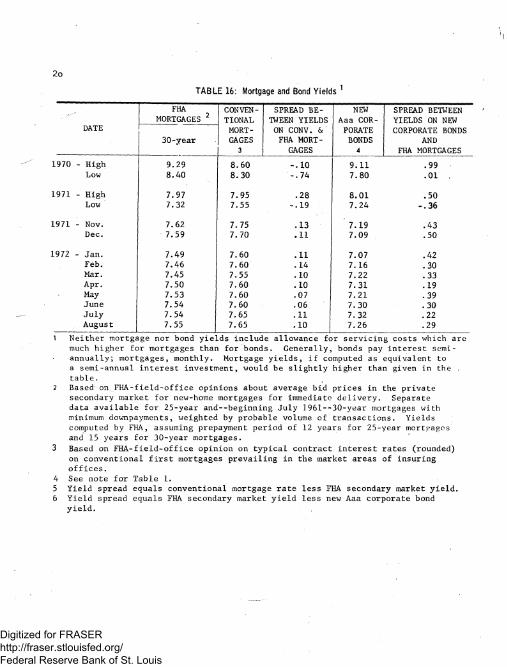
T A B L E 16: Mortgage and Bond Yields 1
SPREAD BETWEEN YIELDS ON NEW CORPORATE BONDS
AND FHA MORTGAGES
1970 - High 9.29 8.60 -.10 9.11 .99 Low 8.40 8.30 -.74 7.80 .01 .
1971 - High 7.97 7.95 .28 8.01 .50 Low 7.32 7.55 -.19 7.24 -.36
1971 - Nov. 7.62 7.75 .13 7.19 .43 Dec. 7.59 7.70 .11 7.09 .50
1972 - Jan. 7.49 7.60 . 11 7.07 .42 Feb. 7.46 7.60 .14 7.16 .30 Mar. 7.45 7.55 .10 7.22 .33 Apr. 7.50 7.60 .10 7.31 .19 May 7.53 7.60 .07 7.21 .39
7.54 7.60 .06 7.30 .30 July 7.54 7.65 .11 7.32 .22 Augus t 7.55 7.65 .10 7.26 .29
1 Neither mortgage nor bond yields include allowance for servicing costs which are much higher for mortgages than for bonds. Generally, bonds pay interest semi-annually; mortgages, monthly. Mortgage yields, if computed as equivalent to a semi-annual interest investment, would be slightly higher than given in the . table.
2 Based onFHA-field-office opinions about average bid prices in the private secondary market for new-home mortgages for immediate delivery. Separate data available for 25-year and--beginning July 1961--30-year mortgages with minimum downpayments, weighted by probable volume of transactions. Yields computed by FHA, assuming prepayment period of 12 years for 25-year mortgages and 15 years for 30-year mortgages.
3 Based on FHA-field-office opinion on typical contract interest rates (rounded) on conventional first mortgages prevailing in the market areas of insuring offices.
4 See note for Table 1. 5 Yield spread equals conventional mortgage rate less FHA secondary market yield. 6 Yield spread equals FHA secondary market yield less new Aaa corporate bond
yield.
MORTGAGES
30-year
CONVEN-TIONAL MORT-GAGES
3
SPREAD BE-TWEEN YIELDS ON CONV. & FHA MORT-
GAGES
NEW Aaa COR-PORATE BONDS
4
Digitized for FRASER http://fraser.stlouisfed.org/ Federal Reserve Bank of St. Louis

21
TABLE 17: Conventional Mortgage Terms 1
DATE
1971
July Aug. Sept. Oct. Nov. Dec.
1972
Jan. Feb. Mar. Apr. May June July j>/
CON-TRACT RATE (PER CENT)
FEES & CHARGES (PER CENT)
2
NEW HOMES
EFFEC-TIVE RATE 3
MATURITY (YEARS)
LOAN/ PRICE RATIO (PER
CENT)
LOAN AMT. ($000)
4
7 . 5 1 7.60 7.67 7.68 7.65 7.62
7.62 7.45 7.38 7.38 7.40 7 . 4 1 7.45
0 .90 0 .84 0.97 0.97 0.87 0.93
0.95 1.02 0.84 0.83 0 .84 0.85 0.83
7.66 7.74 7.83 7.84 7.79 7.77
7.78 7 .61 7.52 7 .51 7.53 7.55 7.58
26.3 26.2 25.8 26.4 26.7 26.6
26.5 27.0 27.2 27.2 27.2 27.2 27.3
74.5 73.9 75.3 75.5 75.4 74.5
75.0 76.5 76.2 76.0 76.2 76.5 77.2
27 .1 26.5 25.9 26.3 27.3 26.5
27.6 27.8 28.2 28.5 28.5 27.8 28.2
EXISTING HOMES CON-TRACT RATE (PER CENT)
FEES & CHARGES (PER CENT)
2
EFFEC-TIVE RATE 3
MATU RITY (YEARS)
LOAN/ PRICE RATIO (PER
CENT)
7.50 7.58 7.63 7.62 7.56 7 .51
7.45 7.35 7 .31 7.30 7.33 7.36 7.37
0.75 0.76 0 .78 0 .79 0 .79 0.78
0.82 0.79 0.77 0 .78 0.77 0 .78 0.78
7.63 7 .71 7.76 7.75 7.69 7.64
7.58 7.48 7.44 7.42 7.46 7.49 7.50
24.2 24.5 24.2 24 . 1 24.6 24.6
24.7 25.4 25 .1 25.2 25.2 25.5 25.5
74.5 74.2 74.5 74.2 74.6 74.6
74.7 75.8 75.6 75.3 75.4 76 .1 76.0
LOAN AMT. ($000)
23.2 23.5 22.5 22.9 23.2 23.9
24 .1 24.8 24.4 24.9 24.6 25.2 25 . 0
V Compiled by Federal Home Loan Bank Board in cooperation with Federal Deposit Insurance Corporation. Data are weighted averages based on probability sample survey of charac-teristics of conventional first mortgages originated by major institutional lender groups (including mortgage companies) for purchase of single family homes. Data ex-clude loans for refinancing, reconditioning or modernization; construction loans to home-builders; and permanent loans which are coupled with construction loans to owner-builders . Related series on conventional mortgage rates only, based on unweighted opinions of field-office directors of the Federal Housing Administration, are available somewhat sooner than the results of the FHLBB-FDIC survey, and are included-in the case of new home mortgage rates--in Table 16.
Fees and charges--expressed as a percentage of the principal mortgage amount--include loan commissions, fees, discounts, and other charges which provide added income to the lender and are paid by the borrower. They exclude any closing costs related solely to transfer of property ownership.
Includes fees & charges amortized over a 10 year period in addition to the contract interest rate.
Derived by FRB.
Digitized for FRASER http://fraser.stlouisfed.org/ Federal Reserve Bank of St. Louis