l2 pronunciation conventions 1 running head: l2 ... · this scale was redeveloped as an analytic...
TRANSCRIPT

L2 pronunciation conventions
1
Running Head: L2 pronunciation conventions
Rater experience, rating scale length, and judgments of L2 pronunciation:
Revisiting research conventions
Talia Isaacs, University of Bristol
Ron I. Thomson, Brock University
Corresponding author: Talia Isaacs
Graduate School of Education
University of Bristol
35 Berkeley Square, Clifton
Bristol, United Kingdom BS8 1JA
Phone: +44 (0) 117 331 4312
E-mail: [email protected]
Isaacs, T., & Thomson, R. I. (2013). Rater experience, rating scale length, and judgments of L2
pronunciation: Revisiting research conventions. Language Assessment Quarterly. 10, 135–159.

L2 pronunciation conventions
2
Abstract
This mixed-methods study examines the effects of rating scale length and rater experience on listeners’
judgments of second language (L2) speech. Twenty experienced and 20 novice raters, who were
randomly assigned to 5-point or 9-point rating scale conditions, judged speech samples of 38 newcomers
to Canada on numerical rating scales for comprehensibility, accentedness, and fluency. Results yielded
high Cronbach’s alpha coefficients and no group differences for rating scale length or rater experience.
However, Rasch category probability plots revealed that raters had difficulty differentiating between
scale steps, particularly in mid-scale range—a challenge which was exacerbated in the 9-point scale
condition. Evidence from verbal protocols and post-task interviews suggested that experienced and
novice raters adopted strategies to either draw on or offset their perceived experience with L2 speech in
conducting their ratings. Implications for L2 pronunciation research are discussed, including the need to
draw on raters’ perceptions to develop a greater understanding of major listener perceptual constructs in
L2 pronunciation and to move beyond adherence to the native speaking standard in data collection
procedures.

L2 pronunciation conventions
3
Rater experience, rating scale length, and judgments of
L2 pronunciation: Revisiting research conventions
Rating scales provide the framework within which human raters score second language (L2)
performance, which is taken to be an indicator of L2 learners’ ability on the construct being measured.
Such assessment schemes constrain, structure, or filter raters’ responses, often through rigid scale
descriptors associated with a fixed number of scale bands. Lumley describes the tension between the
“simplified orderliness of the rating scale,” which underrepresents the complexity involved in L2
performance, and raters’ unconstrained reactions to the performance, which may be disordered and
complex (2005, p. 248). The challenge for raters is to reconcile their possibly idiosyncratic, intuitive, or
non-linear impressions of an L2 performance with rating scale specifications, including discretizing
what might be a “grey area” performance.
In L2 pronunciation research, 9-point numerical rating scales are increasingly becoming
entrenched as a research convention to measure qualitative constructs of comprehensibility,
accentedness, and fluency.1 Nine levels are used due to the conclusion that, for accentedness at least,
smaller scales might cause a ceiling effect (Southwood & Flege, 1999). Generally, only scalar endpoints
are defined (e.g., very easy/difficult to understand for comprehensibility), with little guidance for raters
on how to assess these dimensions other than to use the full range of the scale (Derwing, Munro, &
Wiebe, 1998). A major appeal of these Likert-type scales to L2 pronunciation researchers is that their
generic nature offers versatility, in that they can be used with learners from virtually any first language
(L1) background or proficiency level on any task. That is, no description of L1 transfer phenomena
constrains application of the scale, which can be used to assess extended stretches of speech, sentences,
or, in the case of comprehensibility and accentedness, the production of a single word or phoneme. An
additional advantage is that untrained raters who do not have any background in linguistics can use the
scales and have been shown to make reliable judgments after listening to just 20–30 s of

L2 pronunciation conventions
4
extemporaneous speech (e.g., Derwing, Thomson, & Munro, 2006). Cronbach’s alpha coefficients are
almost universally high using this scoring method (> .9), even in the case of raters from diverse L1
backgrounds scoring speech samples of learners from different L1 groups (Munro, Derwing, & Morton,
2006). Finally, eliciting lay listeners’ impromptu responses using a numerical rating scale could be
viewed as preferable to using more detailed descriptors developed by assessment or teaching
professionals, since this cuts out the “middleman” of descriptors that may not reflect everyday listeners’
impressions. Thus, from the perspective of L2 pronunciation researchers, 9-point numerical scales are
practical, usable across contexts, and sufficiently reliable for research purposes, and their limited
descriptors only minimally prescribe or constrain lay listeners’ routine perceptions of speech.
Even when raters assign the same score to a speech sample, however, their rationale for doing so
may be different. That is, quantitatively equivalent ratings do not preclude qualitative differences in
raters’ approach to the decision-making task or interpretation of the construct (Douglas, 1994). Although
introspective techniques are increasingly being used in L2 speaking assessment research to elucidate
different dimensions of the construct (Brown, Iwashita, & McNamara, 2005), the use of qualitative
methods to probe listener processes as they relate to L2 pronunciation—including for the constructs of
comprehensibility, accentedness, and fluency—has been limited. Harding (2008) used focus groups and
interviews to investigate L2 learners’ perceptions of different L1 English accents. The interest in the
present study, however, is the reverse scenario—native English listeners’ perceptions of L2 speech.
Zielinski (2008) corroborated observational data of NSs transcriptions of L2 speech with additional data
sources to reveal the locus of breakdowns in listener understanding. However, the three transcribers’
written comments were limited to identifying utterances that were difficult to decipher and did not
involve ratings. Rossiter (2009) examined rater motivations for L2 fluency judgments by examining
their written impressions of the speech. However, her sample size was small (six in the case of expert
NS raters) and the comments were relatively unelaborated. The goal of the present study, therefore, is to
L2 pronunciation conventions
5
extend previous research by examining the effects of rating scale length and rater experience on rater
decision-making in assessments of L2 pronunciation.
Rating scale length
Ratings scales are commonly used in psychological research to operationalize constructs that
cannot be directly observed and measured. The issue of the optimum rating scale length has been a focus
of decades of psychological research on attitudes or preferences. Bendig (1953) found that reliability
was stable in 3- to 9-point scales but was compromised in 11-point scales. Matell and Jacoby (1971)
reported stable reliability in scales with 2 to 19 levels, concluding that increasing measurement precision
by adding levels does not yield greater reliability. Thus, coarser scales (with fewer levels) were no less
reliable than finer scales. Similarly, McKelvie (1978) found no psychometric advantage to scales with
10 or more levels, concluding that 5- or 6- point scales should be used. Although the issue of the ideal
number of scale categories remains unresolved (Preston & Colman, 2000), these findings can be roughly
summarized by Miller’s dictum, “the magical number seven, plus or minus two: Some limits on our
capacity for processing information” (1956, p. 81).
While including more scale levels should, in theory, allow finer-grained distinctions to be made
between L2 performances, raters must be able to differentiate between all scale levels for measurement
to be precise (Bachman, 1990). One goal of scale validation research is to investigate the number of
scale levels that raters are reliably able distinguish in their context of use. In the L2 assessment
literature, there is some suggestion that raters have difficulty managing 9-point scales. The Cambridge
Assessment of Spoken English scale, for instance, was reduced from nine to six band levels due to raters’
“inability to differentiate effectively over all the scales” (Milanovic, Saville, Pollitt, & Cook, 1996, p.
19). Further, Hamp-Lyons and Henning suggest that “a nine point scale is longer than optimum for a
writing test” due to the high cognitive load imposed when raters embark on the complex rating task
(1991, p. 364). In particular, the assessment of multiple traits on a long scale makes attaining some
L2 pronunciation conventions
6
degree of step separation difficult and leads to a halo effect. Finally, in reference to the precursor of the
IELTS speaking scale, Alderson (1991) indicated that the pronunciation content did not appear in all
nine levels of the holistic scale, since this could introduce artificial or unusable distinctions. This scale
was redeveloped as an analytic scale, and the pronunciation criterion was subsequently expanded from a
4-point to a 9-point scale (DeVelle, 2008). Part of the impetus for this revision was that the 4-point
pronunciation scale was too crude in its distinctions, and raters were not using the entire scale. To
summarize, while language testers have long acknowledged there is no perfect scale (Underhill, 1987),
the challenge is to develop a scale that is neither too fine-grained nor too coarse for a given assessment.
Davidson (1991) suggests a role for scale step calibration using Rasch modeling to develop and refine
scales.
As noted earlier, 9-point numerical rating scales are increasingly pervasive in L2 pronunciation
research to the extent that their use is necessary to make results comparable to other studies. It should be
noted, however, that the purpose and stakes of these scales is different than L2 proficiency scales used in
operational assessment settings. That is, the resulting ratings are not being used to make consequential
decisions about stakeholders, but, rather, to examine different aspects of speech communication. In an
early L2 pronunciation study that employed the 9-point accentedness scale, Munro and Derwing (1994)
reasoned that it was “better to overestimate the listeners’ ability to resolve accentedness than to
underestimate it” (p. 259). This echoes Flege and Fletcher’s (1992) argument for using too fine a scale
over too restrictive a scale that could fail to capture distinctions that listeners may make.1 Southwood
and Flege (1999) empirically substantiated this view by comparing the adequacy of two accent scaling
techniques. The first method derived accent ratings using a 7-point interval scale, with the descriptors
“least/most accented” at scalar endpoints. The second method, direct magnitude estimation (DME),
required raters to indicate the scope of difference between a baseline speech sample and all other speech
samples. A speaker judged twice as accented as the baseline speaker, for example, would receive double
L2 pronunciation conventions
7
the score; a speaker deemed half as accented would receive half the score. This method allows raters to
construct ratio scales without being constricted by the endpoints imposed by an interval scale. The
dispersion of DME scores led the researchers to conclude that 9- or 11-point interval scales are
necessary to prevent a ceiling effect. The 7-point scale did not reflect the magnitude of differences
captured in the DME ratings, at least for a few raters sensitive to accent differences between early L2
learners and NSs.
The number of scale categories a rater is able to distinguish is not only constrained by his/her
ability to detect differences between stimuli, but also by the discriminability inherent in the speech
samples (Garner, 1960). The L2 speakers in Southwood and Flege’s (1999) study were widely variable
in their age of arrival (1.9–23.3 years) and length of residence in the target language country (14.6–44.3
years). Arguably, in most L2 pronunciation research that does not focus on age and accent, the range of
such age-related variables tends to be much more restricted. In Derwing, Rossiter, Munro, and Thomson
(2004), for instance, the L2 speakers were adult immigrants who had resided in Canada for under 6
months. Similarly, the nonnative graduate students in Munro and Derwing (1999) had all learned
English after puberty. Were Southwood and Flege’s (1999) study to be replicated on either group of
speakers, a ceiling effect may not be detected using the 7-point scale due to the presence of fewer native-
like L2 speakers in the sample. Thus, it is unclear whether this ceiling effect is generalizable to L2
pronunciation research where less variability is the norm.
Notably, the numerical rating scales used in L2 pronunciation research are at the opposite end of
the spectrum from criterion-oriented scales, which describe with precision the skills or abilities
necessary to achieve adequate performance at the given levels, possibly in conjunction with exemplars
or benchmarks to illustrate each scale point (Davidson & Lynch, 2002). There are at least three reasons
why there has been little uptake of the criterion-referenced tradition in L2 pronunciation circles. First,
there has been limited dialogue between L2 pronunciation researchers and language testers over the past

L2 pronunciation conventions
8
several decades until recently, with the consequence that there have been few collaborative efforts and
little awareness of developments across disciplines (Isaacs, in press). Second, although interrater
reliability is consistently reported in L2 pronunciation research and correlations among
comprehensibility, accentedness, and fluency have been examined, there is a dearth of research
dedicated to clearly operationalizing constructs in rating scales or, indeed, to issues of construct validity.
The broader aim of this study is, therefore, to make language testers aware of some of the conventions in
L2 pronunciation research, including the use of 9-point numerical rating scales, and to reflect on these
conventions. The next section will briefly review L2 pronunciation-specific research that has focused on
the second independent variable of interest in this study—rater experience.
Rater experience
In L2 assessment, experienced L2 teachers have conventionally been called upon to make expert
judgments of L2 performances or to validate rating scales (Brindley, 1991). In L2 pronunciation studies
that elicit listeners’ scalar judgments of comprehensibility, accentedness, and/or fluency, “expert” raters
have referred to both phoneticians and speech therapists (Cucchiarini, Strick, & Boves, 2002) and ESL
teachers with extensive teaching experience (Rossiter, 2009). Bongaerts, van Summeren, Planken, and
Schils (1997) use the term “experienced judges” to include both phoneticians and EFL teachers, whereas
Calloway’s (1980) experienced raters were ESL teachers and teaching assistants. Finally, Kennedy and
Trofimovich (2008) define experience as the degree of listeners’ exposure to L2 speech, which in some
studies is considered an indicator of rater accent familiarity. Barnwell (1989), however, argues against
the need to appeal to expert assessors, since the domain of L2 oral proficiency lies outside the
classroom. Because L2 teachers’ and linguists’ impressions are “atypical” compared to those of
interlocutors outside educational settings, Barnwell elaborates that naïve NSs should constitute another
“expert” audience that is consulted in rating scale validation. Clearly, the way that the expert or
experienced rater and the nonexpert, inexperienced, naïve, novice, lay rater, or “person in the street”

L2 pronunciation conventions
9
(Thompson, 1991, p. 177) are defined will impact the expertise/experience effect that is detected in a
given study (Schoonen, Vergeer, & Eiting, 1997).
The aforementioned definitional inconsistencies make cross-study comparisons difficult.
Thompson (1991), for example, found that experienced raters with linguistic training and considerable
contact with L2 learners were more lenient and more reliable in their ratings than their “inexperienced”
counterparts (p. 184). Conversely, Bongaerts et al. (1997) found no significant differences between
experienced and inexperienced (non-linguistically trained) raters’ accent ratings. More recently,
Derwing et al. (2004) found that “untrained raters” (undergraduate students in an introductory TESL
course) provided reliable L2 comprehensibility, accentedness, and fluency judgments on 9-point
numerical scales, and that their fluency ratings strongly correlated with temporal measures of the L2
stimuli. For the purposes of the present study, experienced raters were defined as native English
speaking ESL teachers with postsecondary training, whereas novice raters were linguistically untrained
NSs matched for education level.
If linguistically untrained listeners produce reliable comprehensibility, accentedness, and fluency
ratings, then the often onerous task of recruiting nominally experienced listeners (however defined)
might be unnecessary. Seeking “lay” listeners’ ratings is particularly attractive if their scores are
statistically equivalent to those of experienced raters and they are representative of a segment of people
with whom the test-taker is likely to interact in real-world settings. However, even if there are no group
differences in scoring outcomes, experienced and novice raters may approach the rating task in
qualitatively different ways or focus on different rating criteria (Douglas, 1994).
The present study
Our interest in the numerical scales most widely used by convention in L2 pronunciation
research and in experienced and novice raters’ scoring behavior led to the following research questions:

L2 pronunciation conventions
10
1a. Are there differences in the mean scores raters assign on measures of comprehensibility,
accentedness, and fluency using 5-point or 9-point numerical rating scales?
b. Furthermore, is there evidence of rater preference for the 5-point or 9-point scale?
2a. Are there differences in the mean ratings that experienced ESL teacher raters and
novice raters assign on measures of comprehensibility, accentedness, and fluency?
b. Furthermore, is there evidence that experienced and novice raters arrive at their ratings in
different ways?
Method
Research design
The research questions were addressed using a mixed methods triangulation design (Creswell &
Plano Clark, 2007). This involved converging qualitative and quantitative data to better understand the
complexities involved in experienced and novice raters’ judgments in the absence of detailed scoring
rubrics.
Participants
The speakers were 38 newcomers to Canada (11 males, 27 females; Mage = 39.4 years; 29–52).
Half were L1 Mandarin speakers and the other half were L1 speakers of a Slavic language (13 Russian,
3 Serbian, 2 Ukrainian, 1 Polish). Having arrived in Canada on average 15.6 months earlier (2–42), they
were assessed at beginner levels of the Canadian Language Benchmarks (1–4) and were enrolled in
government-funded ESL classes.
The raters were 40 L1 Canadian English speakers. Half were experienced ESL teachers who
either held or were pursing postgraduate degrees in applied linguistics (6 males, 14 females; Mexperience =
9.7 years; 3–25).2 They varied in their TESL training. Thirteen had taken a phonology course, 16 had
taken an L2 assessment course, 10 had received over 2 hr of rater training, and two reported no
pronunciation or assessment training. The 20 novice raters (5 males, 15 females) were graduate students

L2 pronunciation conventions
11
from nonlinguistic fields (e.g., geography, nursing) with no assessment background. Although no raters
had ever learned Chinese or Slavic languages, the experienced raters reported greater familiarity with
both accents (see Table 1).
<INSERT TABLE 1 HERE>
Procedure
Speech elicitation and stimulus preparation
L2 speech samples on six tasks were elicited individually in 1 hr sessions. This paper will report
on performance on an eight-frame picture narrative. This task was selected due to its extensive use in
previous L2 pronunciation research (e.g., Derwing, Munro, Thomson, & Rossiter, 2009), which made it
ideal for a study attempting to simulate research conventions. The picture featured a man and a woman
who collided and dropped the identical suitcases they were carrying only to later realize that they had
retrieved the wrong suitcase.
After normalizing the speech samples, the first 20 s of each narrative, excluding initial
dysfluencies (e.g., false starts, hesitations), were randomized and burned onto CDs. This practice of
using short speech samples for research purposes is common in L2 pronunciation research, since raters
are able to make reliable judgments after listening to utterances of this length, although longer
performance samples would clearly be necessary for higher-stakes purposes. The intention here was to
replicate this common practice to revisit conventions. Following Derwing et al. (1998), the speech
sample of a male native English speaker on the same task was included approximately two thirds of the
way through each randomization to ensure that the scores the raters assigned corresponded to the correct
speech sample. This strategy assumes that the NS will be rated at the high end of the scale. Once it was
determined that the speech sample and rating item number corresponded, the NS’ ratings were discarded
from subsequent analyses.

L2 pronunciation conventions
12
Experimental conditions for raters
Half of the raters in each of the experienced and novice groups were randomly assigned to either
the 5- or 9-point scale conditions. The raters in the 5-point condition rated the speech samples on
separate 5-point numerical scales for comprehensibility (1 = very hard to understand, 5 = very easy to
understand), accentedness (1 = heavily accented, 5 = not accented at all), and fluency (1 = very
dysfluent, 5 = very fluent). The raters in the 9-point condition assigned scalar judgments on the same
constructs using three separate 9-point numerical scales with identical endpoint descriptors but with ‘9’
(rather than ‘5’) designating the highest level of performance. In accordance with L2 pronunciation
research conventions, no rating descriptors were provided at the scale levels between the scalar
extremes.
Stimluated recalls were employed to shed light on experienced and novice raters’ scoring
decisions. The rationale was that raters’ verbalizations would offer an indirect glimpse into their thought
processes while they evaluated the L2 speech (Ericsson & Simon, 1993). However, the artifice of having
raters think aloud could obscure the phenomenon it was being used to probe, namely, the nature of the
rating process (Lumley, 2005). Therefore, the effect of the additional demand of the think aloud on
scoring was measured by randomly assigning half the raters in each of the rating scale and experience
conditions to either a stimulated recall (think-aloud) condition or a rating only (no verbal commentary)
condition.
Rating sessions
The individual rating sessions, which included a training component and a break, lasted 1–2
hours. Construct definitions based on previous research were provided to ensure consistency.
Comprehensibility was defined as “how easy the speaker is to understand.” Accentedness denoted “how
different the speaker sounds from a NS of North American English” (Munro & Derwing, 1999).
L2 pronunciation conventions
13
Fluency, here defined temporally (Lennon, 1990), was described as “how smooth the speaker’s oral
delivery is based on pausing, hesitations, fillers (e.g., um, uh), or speech rate.”
After familiarizing themselves with the speaking prompt, the raters judged five practice items for
comprehensibility, accentedness, and fluency on the 5- or 9-point scales, depending on the condition3. In
addition, raters in the stimulated recall condition practiced thinking aloud. They subsequently received
feedback on their practice ratings by comparison with mean scores from a previous study (Derwing et
al., 2009). This brief calibration was designed to familiarize raters with the overall speaking ability to
expect and to give them a rough idea of previous raters’ assessments. NSs were included during training
to establish the upper bounds of the scales.
The duration of the stimulated recalls averaged 41.1 min for experienced and 34.4 min for novice
raters (27–61 min). After listening to a given speech sample, the recording was paused and raters scored
the speech on the three rated measures and verbalized their thoughts on the speech and rating process
before proceeding to the next sample. In the event of a sustained silence, the researcher prompted raters
to continue verbalizing (Gass & Mackey, 2000). However, the raters were ultimately the arbitrators of
how much to say, using verbal/nonverbal cues to signal readiness to move on. Conversely, listeners in
the timed rating only condition (duration = 18 min) scored the speech without providing verbal
commentary during a 7 s interstimulus interval.
Next, all raters verbalized their thoughts while referencing their original ratings during a second
listening. This served as a check on the consistency of the verbal reports of raters in the stimulated recall
condition (Ericsson & Simon, 1993) and was a means of probing the impressions of raters in the rating
only condition, who had hitherto remained silent.4 Finally, all raters were interviewed about their
impressions of the task, interpretations of the constructs, scoring behaviour, rating strategies, and
influences on their assessments. They were asked to comment on their scale use and the criteria they
used to distinguish between low and high ability speakers.
L2 pronunciation conventions
14
Data analysis
Statistics from classical test theory were conducted using SPSS 17. In preparation for analysis,
the comprehensibility, accentedness, and fluency scales were normalized by scaling the 9-point scale
down to a 5-point scale using the equivalencies shown in Table 2. Because a wider-ranging scale
typically yields larger variance than a smaller-ranging scale, changing the metric of the 5-point scale so
it would encapsulate the same numerical range as the 9-point scale and adjusting the ratings accordingly
made the variance of the two sets of ratings more amenable to parametric comparison.
<INSERT TABLE 2 HERE>
To examine raters’ application of the 5- and 9-point scales, Rasch analyses were conducted on
the original (unnormalized) rating data using FACETS 3.60 (Linacre, 2010a). This program extrapolates
estimates of speaker ability and rater severity based on the scores that individual raters assign each
speech sample. It then maps these facets on a logit (arithmetic) scale. In this study, separate analyses
were conducted for comprehensibility, accentedness and fluency for both rating scale conditions (3
Perceptual Measures x 2 Rating Conditions), since these were rated on separate scales with different
metrics. In total, six analyses were conducted with 760 ratings calibrated for each analysis (38 Speakers
x 20 Raters). This paper will focus primarily on scale response category plots—a tool used to inform the
extent to which raters distinguish between scale points on interval scales (Milanovic et al., 1996). Rater
consistency indices are also reported.
Following orthographic transcription of the verbal report and interview data, which were verified
by a second transcriber, the qualitative data were analyzed using the ATLAS.ti 5.0.66 qualitative
software package. As part of a larger-scale analysis, the verbal protocol data were segmented, coded,
and mapped onto the interview data to generate emergent themes (Green, 1998). Coded categories
relevant to the present study included rater comments about their role as raters (e.g., teaching
experience), statements of rating scale use and preference (e.g., rating scale length, use of scale levels),

L2 pronunciation conventions
15
perceived leniency and self-consistency, process of arriving at scoring decisions (e.g., difficulty with
scale-step choice), interpretations of the constructs (e.g., independence of the rated dimensions), and
rating strategies (e.g., norm-referencing). Following initial coding, a second researcher blind to the goals
of the study reached exact agreement in applying nine coded categories 94.4% of the time for 25% of the
data. In cases of disagreement, consensus was reached through discussion.
Results
Rater consistency, correlations of the ratings, and comparison of mean ratings
Cronbach’s alpha (or the numerically equivalent two-way mixed effects intraclass correlation) is
uniquely reported as evidence of reliable scoring in most L2 pronunciation studies. However, Stemler
and Tsai (2008) argue that relying on a single interrater reliability estimate could be misleading. Thus,
additional rater consistency indices are reported here. Table 3 shows that Cronbach’s alpha values
exceeded .90 for all experimental conditions, indicating high overall consistency, although Kendall’s W
values suggest more modest levels of intragroup agreement (.39–.53; p < .001). Both measures reveal
that judgments obtained using the 9-point scales were more consistent than those obtained using the 5-
point scales, due presumably to the more restricted scale-step choice. Also apparent is that experienced
(ESL teacher) raters achieved greater consensus on ratings than did novice raters, with group differences
most pronounced for comprehensibility. Taken together, the indices reveal more consistency/consensus
in fluency ratings relative to comprehensibility and accentedness ratings.
Raters’ infit mean-square indices, examined as a measure of the consistency of their application
of the 5- versus 9-point scales for each rated measure, yielded average indices of .94–.97, which
signifies conformity with Rasch model predictions (Linacre, 2010a). Using the cut-off of 1.4 (Myford
&Wolfe, 2000), five raters in the 5-point condition and six in the 9-point condition were designated
misfitting (i.e., were associated with considerable unmodelled variance, although none approached the

L2 pronunciation conventions
16
data-distortion level of 2.0). Of these, five were experienced and six were novice raters. Therefore, fit
statistics for individual raters did not yield clear patterns for scale length or rater experience variables.
<INSERT TABLES 3–4 HERE>
Next, Spearman rank-order correlations were computed to examine the shared variance between
the 5- versus 9-point scales, experienced versus novice raters, and stimulated recall versus rating only
conditions. Table 5 shows that raters reached considerable consensus about speakers’ ability regardless
of experimental condition, with shared variance of 84 to 94%.
<INSERT TABLE 5 HERE>
In light of this overlapping variance, we averaged the scores for each experimental subgroup over
the 38 speech samples. We then conducted descriptive statistics, shown in Table 6, and three-
independent t-tests to examine group differences between (a) the 5- and 9-point scales; (b) experienced
and novice raters; and (c) stimulated recall and rating only conditions. A two-tailed Bonferroni
correction was applied to adjust the significance level for multiple comparisons (α = .017). Results
revealed no significant differences on any of the dependent variable measures for rating scale length,
rater experience, or think-aloud condition, t(74) = -2.1–.80, p > .017. That is, the scores assigned by the
subgroups were not quantitatively different.5 In the remainder of the paper, evidence from additional
data sources will be used to extend the null result for rating scale length and rater experience.
<INSERT TABLE 6 HERE>
Rating scale use and preference
As a follow up to the nonsignificant t-test for rating scale length, each rater’s mean skewness
score was calculated for comprehensibility, accentedness, and fluency to examine whether differences
exist in the centeredness of the distribution for ratings obtained using the 5- and 9-point scales. T-tests
revealed no skewness differences between the rating scale conditions. Coefficients for fluency, which
yielded the largest positive skew of the three measures (.36 for both conditions) were still within the

L2 pronunciation conventions
17
range of distribution normality (Huck, 2004). Figures 1–3 show that when ratings are pooled over
experience and think-aloud conditions, the score distributions for 5- and 9-point conditions mirror one
another. This again suggests no differences in raters’ overall scoring patterns based on rating scale
condition.
<INSERT FIGURES 1–3 HERE>
Notably, no L2 speakers received a score of ‘5’ on the 5-point accentedness scale or ‘9’ on the 9-
point accentedness or fluency scales. Several raters echoed Nov.R8.9pt’s observation (Novice Rater 8,
9-point condition) that “there’s certainly a big gap between the NSs and almost everyone in this study. If
a NS is 9, these people [the NNSs] certainly weren’t even close to being a 5” (on a 9-point scale). Most
raters reported reserving the upper bounds of the accentedness scale for speakers who approached the
NS standard. This was in accordance with the definition of accentedness as the deviation of the accent
from the standard language norm and use of NSs to establish the upper bounds of the scale during rater
training. In fact, 11 raters in the 5-point condition only worked with a 4-point accentedness scale, and
the remaining nine raters “were just using from 3 to 1, because 4 to 5 were so high,” as Exp.R21.5pt
(Experienced Rater 21, 5-point condition) stated.
Several raters expressed discomfort rating accentedness. Nov.R38.9pt articulated the prevalent
view that “accentedness is amorphous in the sense that as long as I can understand the word, I don’t
mind if it’s said with a non-North American accent.” In some cases, raters’ beliefs that accentedness was
unimportant relative to comprehensibility even led to indiscriminate scoring. For example, Exp.R3.5pt
put accentedness “down in the middle as something that doesn’t really matter,” assigning her “default”
score of ‘3’ over 70% of the time for accentedness ratings but only a third of the time for
comprehensibility and fluency ratings. By not distinguishing between L2 learners’ accentedness level in
a study where the three rated measures were implicitly assigned the same importance, R3 was arguably
successful at “putting accent in its place” (Derwing & Munro, 2009, p. 1).

L2 pronunciation conventions
18
When asked about their application of the scales, some raters expressed that the 5-point scale was
too constraining, since they tended to want to assign half points in the lower scale range. Exp.R36.5pt
related how he circled a number based on his initial judgment at the onset of each speech sample and
would write an arrow as the recording progressed to signal whether the actual score was slightly higher
or lower than indicated. He noted, “you have only five categories, but it could’ve been a thousand
categories actually.” Although R36 was alone in adopting this strategy, other raters also saw more
subtleties in the performances than a 5-point scale could accommodate. In contrast, proponents of the 5-
point scale, such as Nov.R24.5pt, noted that shorter scales are more “meaningful” and make items
“easier to rate because you just have less nuance.”
Opinion on the 9-point scale was also mixed. However, a majority of respondents found the 9-
point scale difficult to manage. Exp.R39.9pt stated, “I think it’s hard for people to set real discrete
categories. I know I had trouble with the middle [of the scale]. I think sometimes it’s a coin toss.”
Exp.R5.9pt, whose verbal protocol was the longest, frequently appeared conflicted about score
assignment, as illustrated in the following passage from his interview: “I’m wondering how accurate this
would be, because I just feel so uncertain while I’m doing it. And there are so many times that I’m like
I’ll just go with a 6, because I can’t figure it out. Is it 7 or 6? I don’t know man. I’m just going to go with
the 6… It’s annoying because you don’t get the resolution, so it’s very frustrating.” In contrast, R5
stated, “I like that there are nine [categories], because you can really play with the 7, 8, 9.” It is possible
that his scoring decisions would have been as laboured had he been assigned to the 5-point condition.
However, the interviews revealed that no raters in the 9-point condition arrived at a system to
differentiate all adjacent scale levels. In fact, although raters were instructed to use the entire scale, none
in the 9-point condition did so, whereas 12 out of 20 raters in the 5-point condition made use of all five
scale points for either comprehensibility or fluency. In fact, two raters in the 9-point condition used only
L2 pronunciation conventions
19
a 5-point scale and eight used just a 6-category range for comprehensibility or fluency. It is likely that
this restricted scale use reflected the low L2 ability of the speakers in this study.
Rasch probability plots further illustrate raters’ application of the scales. Figures 4–9 show the
likelihood of a given scale category being assigned across the speaker ability continuum on the 5- and 9-
point comprehensibility, accentedness, and fluency scales. For all plots, each step calibration increases
monotonically with the scale step number (i.e., as speaker ability increases, so does the probability of
receiving a higher score). Outfit mean-square indices for all scale categories are close to the expected
value of 1.0 (range: 0.8–1.3), which signifies that all scale categories meet Rasch model specifications
(Linacre, 2010b). Response category probability curves for comprehensibility (Figure 4 and 5) are
described in the greatest detail below, since both rating scale groups used the full range of the
comprehensibility scale.
<INSERT FIGURES 4–9 HERE>
In probability plots for polytomous data, categories at scalar extremes always approach a
probability of 1. In an ideal calibration, the probability curve for each step between the scalar extremes
should be highly peaked and cover a distinct area on the ability scale, with visible separation between
adjacent levels (Davidson, 1991). Evidently, the data in this study fall short of ideal. Figure 4 shows
some separation between levels of the 5-point comprehensibility scale, in that one scale category is
clearly the most probable at all points on the ability continuum. Probabilities associated with scale steps
2 to 4 range from 55% to 62%. However, the peaks, while easily discernable, are not very steep. Further,
there is overlap between the probability curves by more than just the neighbouring category (e.g., scale
level 3 is encroached upon by levels 2 and 4). Notably, scale category 4 is higher peaked and more
expansive than categories 2 and 3. However, this spread indicates less measurement precision and,
therefore, a greater chance of inappropriate scoring (Milanovic et al., 1996). This may have been due to
few instances of response category 4 in the dataset (see Figure 1).

L2 pronunciation conventions
20
Overall, it appears that the 5-point comprehensibility scale in addition to the 5-point
accentedness and fluency scales were applied with some clarity although level distinctions were not
always discernible to the raters. Indeed, as Exp.R37.5pt observed, the rating task in this study “asked us
[raters] to create our own scales.” It is possible that they each developed a distinct system of selecting
scale categories in response to the speech, although how explicitly they created and adhered to their own
distinctions is unclear. The interpretative scope raters were allowed in this study is reflected in the
overlapping categories of the probability curves.
Figures 5, 7, and 9 show that the scale categories of the 9-point scales are less discernible than
those applied using the 5-point scale. While comprehensibility scale levels 2 and 8 are nicely peaked
(see Figure 5), levels 3 through 7 are not easily distinguished, with their probability of occurrence
ranging between 32% and 42%. In fact, 76% of the total comprehensibility scores assigned were
between scale points 3 and 7, yet there is less than a 50% chance that a speaker in this ability range will
be assigned the most probable score. Thus, it is possible that a speaker meriting a score of 2 based on the
model calibrations will actually receive a score of 5. Scale levels 4 and 5 are overshadowed by heavily
overlapping adjacent levels, again leaving little assurance that speakers at the corresponding ability
levels will be accurately assessed. Clearly, the categories in the midsection of all three 9-point scales are
muddled, lending credence to Nov.R31.9pt’s view that the 9-point scales were “a bit too long to gather
better precision” and “it seemed like there’s an extra point in there.” One approach might be to collapse
categories 3 and 4 or 5 and 6. Milanovic et al. (1996) suggest that raters have more difficulty judging
mediocre performances than extreme ones, and this seems to have been the case for the raters in this
study.
Experienced and novice raters’ scoring tendencies
While the t-tests revealed no mean differences between experienced and novice raters, some
group differences emerged in the qualitative data. One difference was that experienced raters’ verbal
L2 pronunciation conventions
21
reports and interviews were about 5 min longer than those of novice raters on average, although
durational differences were nonsignificant. Experienced raters’ interviews tended to be longer due to
descriptions of pronunciation practices in their classrooms or their rating experience. In the think-alouds,
experienced raters were almost twice as likely to pinpoint pronunciation errors than novice raters, either
through descriptions of the speech (e.g., Exp.R1.9pt: “lots of extra sibilants and fricatives”) or through
imitation/correction (e.g., Exp.R9.5pt: “cOrner not cərner”).
Another difference is exemplified by some experienced raters’ view that ESL teachers are more
adept at understanding L2 speech than “the typical NS” or “average person whose only qualification is
they speak English” (Exp.R37.5pt). For instance, Exp.R3.5pt revealed needing to put on her “best
teacher ears” to understand the speech of a low-rated speaker. Exp.R14.5pt avoided drawing on his
teacher tendency “to overinterpret what they [the L2 learners] are saying and fill in the gaps” and,
instead, considered only the “general ability of the [non-ESL teacher] interlocutor” to process the
speech. This attempt to trump his own experience by making his ratings resemble lay ratings, which he
described as “an irony in my filling out of the scale,” was a strategy uniquely adopted by experienced
raters, half of whom reported thinking about being “in the average person’s shoes” while rating
(Exp.R5.9pt). Conversely, some novice raters like Nov.R10.5pt conceded, “I don't have any experience
describing this kind of thing [L2 speech], so I’m like uhh.” Nov.R19.9pt challenged her rating
qualifications due to her perception of her own less than articulate verbal discourse, commenting, “like
who am I to evaluate someone?”6 The fact that several experienced raters constructed their identities
based on their experience listening to and evaluating L2 speech and occasionally tried to discount this
experience, whereas several novice raters acknowledged their lack of experience, even if they frequently
interacted with L2 speakers, validates the a priori distinction made between experienced and novice
raters in this study.

L2 pronunciation conventions
22
Another point that demonstrates experienced raters’ self-identification as ESL professionals is
that they frequently referred to the voices in the speech samples as “students,” extrapolating the research
context to the classroom. Some described the strategies they teach their students to overcome the
challenges shared by the speakers in the recordings. Others judged the rating task or quality of the scale
using the benchmark of its usefulness for the classroom. Novice raters, on the other hand, who lacked
ESL students as a point of reference, instead referred to the L2 spoken English of personal contacts (e.g.,
Austrian relatives, Chinese co-worker, Ukrainian roommate) or of individuals from popular culture (e.g.,
Arnold Schwarzenegger, Borat) in conducting their ratings. Thus, experienced and novice raters used
different reference points in evaluating L2 speech yet arrived at virtually identical scoring decisions.
The experienced raters varied in their access to technical vocabulary to describe L2
pronunciation. Exp.R39.9pt, for example, referred to “vowel epenthesis.” In contrast, Exp.R13.5pt, who
reported no phonological training, referred to the “pronunciation of certain letters,” whereas an
individual with such training would likely have cited the pronunciation of phonemes. The novice raters,
who more uniformly lacked access to technical vocabulary and ESL jargon, were overall more creative
in describing the speech. For example, “flashcard speaking” referred to a lack of linking, “dead air”
denoted silent pauses, and “noise” designated filled pauses for three novice raters. Nov.R15.5pt, who
provided the most vivid descriptions, recalled one voice sounding like “you put a clock over it [the
speech] to dampen the English pronunciation,” whereas another speaker’s “slow,” “heavy” speech “felt
like moving in water.” In sum, while differences between experienced and novice raters were masked in
the quantitative analysis, the qualitative data accentuated group differences due to L2 teaching
experience. Novice raters tended to compensate for their lack of technical vocabulary through reference
to the speech of familiar L2 speakers and, in some cases, through creative descriptions.

L2 pronunciation conventions
23
Discussion
This study examined the effects of rating scale length and rater experience on judgments of L2
comprehensibility, accentedness, and fluency by replicating rating conventions typically used in L2
pronunciation research. Qualitative data extended quantitative findings by drawing on experienced and
novice raters’ perspectives and reported approach to the listening and rating task. There were no
differences in mean scores obtained using the 5- versus 9-point scales. However, Rasch probability plots
revealed considerable scale category overlap, particularly when the 9-point scales were applied. While
the 5-point scales were reportedly too constraining for some raters, particularly at the low end of the
scale, raters in the 9-point condition were unable to meaningfully differentiate between “so many
numbers” (Nov.R19.9pt). Alderson (1991) and Milanovic et al. (1996) report on rater difficulty making
nine level distinctions in reference to standardized tests, although the difference in stakes between these
studies and the research context of the present study bears acknowledgment.
In contrast to Southwood and Flege’s (1999) accent scaling study (also conducted for research
purposes), there was no evidence of a ceiling effect. Due to the low proficiency of L2 speakers in this
study, a floor effect would have been more probable than a ceiling effect, even though some raters
admitted reluctance to assign scores of ‘1,’ because “there’s a moral failing attached to the low end of
the scale” (Exp.R14.5pt). Clearly, Southwood and Flege’s arguments for using a 9- or 11-point scale for
measuring L2 accent cannot always be generalized to studies that draw on more homogenous samples of
L2 speakers (as was the case in the present study). Indeed, without providing raters with some indication
of how different dimensions of the focal constructs manifest at different ability levels (i.e., through
rating descriptors), it is unlikely that any speech sample from this study would receive an equivalent
mean rating if it were presented within a more heterogeneous set of speech samples. For example, a
speaker in the present study might be assigned a rating of ‘6’ on the 9-point accentedness scale but a ‘3’
in a study where more of the speakers had less obviously nonnative accents. Thus, in the absence of a

L2 pronunciation conventions
24
criterion-referenced standard and rigorous rater training using purposeful benchmarking, ratings are only
interpretable within a specific study, not across studies.
Some raters were uncomfortable with the NS standard that loomed over the study, an issue that
arose for accentedness judgments in particular. Exp.R14.5pt expressed, “I think you need a scale… that
allows successful nonnative speakers to be at the top end of the scale. We need to make sure that the
scale reflects our judgments about success and not about who their parents are or their first language. If
you detect a first language that should not put them lower on the scale.” From the perspective of
communication, having a perceptible L2 accent is far less important than being understandable to one’s
conversational interlocutors, since having an accent does not necessarily lead to difficulty processing the
speech or to communication breakdowns (Derwing & Munro, 2009). In addition, it is unlikely that the
newly-arrived immigrants in this study needed to sound like NSs to integrate into society or successfully
communicate in the workplace. From this perspective, raters were right to question the premise of rating
accentedness. This notwithstanding, developing a greater understanding of the factors that underlie
listeners’ accentedness ratings is important for research purposes (albeit arguably less important than
comprehensibility). This is due to the potential for listeners’ perceptions of accent to bias their formal or
informal judgments of speech and to affect the success of their communicative exchanges with non-
native interlocutors in real-world contexts.
With respect to R14’s above suggestion, it is unclear how the highest level of the accentedness
scale could be modified to make it attainable for a sample of low-proficiency L2 speakers. While
accentedness is typically defined in reference to a NS norm, using NSs to establish the upper bounds of
the scale during rater training likely reinforced this unrealistic standard and may have discouraged more
comprehensive scale use. This notwithstanding, adjustments could be made to research conventions that
uphold the NS standard for no strong substantive reason. For example, in lieu of eliciting ratings for a
NSs’ performance solely to check that ratings and item numbers are aligned, as was done in this study,

L2 pronunciation conventions
25
Thomson and Isaacs (2011) recently piloted an alternative procedure. This involved raters hearing a
recorded voice at planned junctures within the randomized sequence of L2 speech samples that said,
“you should now be on item number __.” An advantage of this procedure is that it does not invite
comparisons between L2 performances and those of NSs peripheral to the purposes of the study.
The second main focus of the study centered on rater experience. There were no significant
differences between mean ratings that experienced and novice raters assigned on measures of
comprehensibility, accentedness, and fluency. This result contradicts both Thompson’s (1991) finding
that experienced raters assign higher accentedness ratings than novice raters, and Rossiter’s (2009)
report of the opposite trend for fluency, but is congruent with Bongaerts et al.’s (1997) null result for
accentedness. At least some of the differences in these findings are attributable to different
operationalizations of “experience” and different speaking task types, as appears to be the case for rater
experience research in L2 speaking assessment research more generally (see Bridgeman, Powers, Stone,
& Mollaun, 2012). In addition, variability in experienced raters’ pronunciation and assessment training
may have masked between-group differences. A second finding that experienced raters are slightly more
consistent in their ratings than novice raters conforms with Calloway’s (1980) results for accentedness
and comprehensibility and Thompson’s result for accentedness (1991). Thus, it appears that in the
absence of specific scoring criteria, ESL teachers, who are charged with assessing their students’ oral
productions, have a greater shared notion with their teacher colleagues about high and low
manifestations of ability than do novice raters, who lack experience formally evaluating L2 speech.
While Kendall’s W coefficients held relatively constant for experienced raters across the three rated
measures, coefficients for novice raters were lowest for comprehensibility relative to those of
experienced raters but reached near parity for fluency. This could be because the definition of
comprehensibility (ease of understanding) left the most scope for interpretation, whereas fluency, which
included illustrative examples (speech rate, pauses), was the most concretely defined. Thus, it may be

L2 pronunciation conventions
26
that novice raters in particular would have benefited from more guidance about the nature of the
construct being measured for reliability reasons.
Additional differences between experienced and novice groups emerged in the qualitative data.
First several experienced raters related that their experience with L2 learners might affect their
comprehension and appraisal of the speech relative to non-ESL teachers. Some even attempted to put
themselves in the place of a non-ESL trained interlocutor when assigning scores. Conversely, several
novice raters expressed feeling unqualified to carry out the task, due to their lack of experience
describing and evaluating learner interlanguage. A second difference was that experienced raters
produced lengthier think-alouds and interviews, since they almost uniformly related anecdotes about
their teaching or assessment practices. In contrast, novice raters, who did not have access to “students”
as a point of reference, instead referred to the speech of personal acquaintances or celebrities as their
point of reference. Finally, whereas experienced raters were more variable in their knowledge of L2
pronunciation and assessment, novice raters were more uniform in their lack of access to TESL
vocabulary. Some novice raters compensated for this deficit by describing the L2 speech in more
creative terms. Taken together, experienced and novice raters adopted strategies to either draw on or
offset their perceived experience with L2 speech in conducting their ratings.
Despite qualitative differences between experienced and novice rater groups, the absence of
significant quantitative differences in mean ratings suggests that choosing novice over experienced
raters for research purposes might be justified (e.g., since novice raters are easier to recruit), albeit with
the potential trade-off of slightly lower rater consistency. Because it is unclear how effective
experienced raters’ strategy was of simulating novice raters’ impressions of the speech, it is desirable to
use judgments of novice raters when the intent is to extrapolate findings beyond the L2 classroom, at
least when qualitative data are involved. Conversely, when the desire is to pinpoint the aspects of speech
that contribute to listeners’ perceptions of comprehensibility, accentedness, and fluency through rater

L2 pronunciation conventions
27
descriptions (e.g., for the purpose of developing an empirically-based scale), experienced raters’
accounts might prove more useful.
Gathering evidence that raters are attending to the construct of interest is paramount for validity
reasons (Bachman, 1990). In the present study, it is unclear if novice raters lacked the vocabulary of
experienced raters and, therefore, had difficulty verbalizing their perceptions of the speech, or rather if
experienced and novice raters were attending to qualitatively different dimensions of the speech overall.
What is clear from the findings has long been demonstrated in research on criterion-referenced
measurement but may not be obvious to L2 pronunciation researchers—that raters are likely to benefit
from clearer operationalization of the construct, including guidance about what numerical scale points
"mean" in terms of performance quality (Davidson & Lynch, 2002; Fulcher, 1996). For this reason and
in order to refine our understanding of the construct, it is important to examine in greater depth the
factors that raters attend to when scoring. Brown et al. (2005) have spearheaded work on this in the
assessment of speaking, although little L2 assessment research has focused on pronunciation
specifically.
Concluding remarks
Given the limited dialogue between SLA-oriented pronunciation researchers and language testers
over the past several decades and the few empirical studies that cut across these disciplinary areas,
examining the efficacy of 9-point numerical scales may be perceived, from a language testing
standpoint, as a remnant from the past (see Isaacs, in press). Our intention is to ultimately bring
pronunciation research out of this “time warp,” and the present paper represents a starting point,
highlighting the work that is sorely needed in bridging the gap between these research areas.
As Lumley (2005) notes, “the search for the perfect scale (the ‘holy scale’) is futile” (p. 301),
since scales are imperfect representations of reality and underrepresent the complexities involved in L2
performances. Chalhoub-Deville emphasizes that there is no one-size-fits-all rating scale (1995), since
L2 pronunciation conventions
28
different aspects of the construct get emphasized depending on the speaking task, the raters who assess
the speech, and other sources of systematic variance. Of course, the way the construct is operationalized
in a rating instrument is constrained by our understanding of different dimensions of the construct and
the way they are manifested at different proficiency levels (Pollitt & Murray, 1996). Although for L2
pronunciation research purposes, using comprehensibility and accentedness scales with detailed
descriptors may be impractical for simply rank ordering learners from different L1 backgrounds, since at
least some of the criteria are likely to be L1-specific (not least task-specific), developing a better
understanding of the constructs that pronunciation researchers claim to operationalize in their scales is
urgently needed. Logically, the key to understanding holisitic constructs in L2 pronunciation research
that are defined in terms of listeners’ perceptions is to investigate the nature of these perceptions, how
they relate to the L2 speakers’ productions, and linguistic and nonlinguistic influences on listeners’
judgments (e.g., Isaacs & Trofimovich, 2011, in press; Kang, in press). Such insights could inform
rating instruments and procedures in higher-stakes assessment contexts that view pronunciation as an
integral part of the construct of L2 oral proficiency.

L2 pronunciation conventions
29
Endnotes
1 These major holistic listener perceptual constructs are often examined in conjunction with one
another in the L2 pronunciation literature. However, the theoretical and empirical basis for
understanding these constructs is, as yet, limited (Isaacs, in press).
2 Flege and Fletcher (1992) measured listeners’ accentedness ratings on a 256-point sliding scale. The
position of the lever on the scale indicated the score that was assigned.
3 Raters were asked to report their age range due to the sensitivity of some raters to specifying their
exact age during piloting. The novice raters were a younger demographic, with three quarters in their
20s and only two in their 40s or 50s. Conversely, half of the experienced raters were in their 30s, and
eight were in their 40s or 50s.
4 Raters were unaware that rating scale length was being manipulated in this study.
5 Due to the time consuming nature of verbal protocols, it was not feasible for raters in the stimulated
recall condition to verbalize their thoughts about the performances of all 38 L2 speakers a second
time. Thus, their verbal commentary for the second listening was restricted to 10 Slavic and 10
Mandarin speakers. These speakers were selected due to some distinctive aspect of their speech based
on pilot study responses, with the reasoning that these “memorable” items would be the most likely to
trigger memory traces. Conversely, listeners in the rating only condition, whose initial ratings were
completed in under 20 min, verbalized their thoughts on all 38 speakers during the second listening.
6 No significant interaction effects were detected in separate 3-way ANOVAs computed for
comprehensibility, accentedness, and fluency.
7 Nov.R19.9pt’s comment may, in part, reflect her self-consciousness about thinking aloud, a pervasive
sentiment in the transcripts of both experienced and novice raters. Although no significant group
differences were detected as a function of the think-aloud condition, individual differences emerged
in the qualitative data. Some raters felt that thinking aloud was a natural process that mirrored their

L2 pronunciation conventions
30
everyday behaviour of speaking to themselves while performing a cognitive task (e.g., marking).
Others felt pressured to come up with content to talk about or even suggested that this demand
diverted their attention away from rating. Raters who decided on the scores to assign after the speech
sample had finished playing (as opposed to while still listening to the recording) provided rich insight
into their scoring processes but were more susceptible to forgetting what the speech had sounded like
before arriving at their ratings due to the time lapse.

L2 pronunciation conventions
31
References Alderson, J. C. (1991). Bands and scores. In J. C. Alderson & B. North (Eds.), Language testing in the
1990s: The communicative legacy (pp. 71–86). London: Macmillan.
Bachman, L. F. (1990). Fundamental considerations in language testing. Oxford: Oxford University
Press.
Barnwell, D. (1989). Proficiency and the native speaker. ADFL Bulletin, 20, 42-46.
Bendig, A. W. (1953). The reliability of self-ratings as a function of the amount of verbal anchoring and
of the number of categories on the scale. Journal of Applied Psychology, 37, 38-41.
Bongaerts, T., van Summeren, C., Planken, B., & Schils, E. (1997). Age and ultimate attainment in the
pronunciation of a foreign language. Studies in Second Language Acquisition, 19, 447-465.
Bridgeman, B., Powers, D., Stone, E., & Mollaun, P. (2012). TOEFL iBT speaking test scores as
indicators of communicative language proficiency. Language Testing, 29, 91-108.
Brindley, G. (1991). Defining language ability: The criteria for criteria. In S. Anivan (Ed.), Current
developments in language testing (pp. 139-164). Singapore: SEAMEO.
Brown, A., Iwashita, N., & McNamara, T. (2005). An examination of rater orientations and test-taker
performance on English for academic purposes speaking tasks. TOEFL Monograph 29.
Princeton, NJ: Educational Testing Service.
Calloway, D. R. (1980). Accent and the evaluation of ESL oral proficiency. In J. W. Oller, Jr & K.
Perkins (Eds.), Research in language testing (pp. 102-115). Rowley, MA: Newbury House.
Chalhoub-Deville, M. (1995). Deriving oral assessment scales across different tests and rater groups.
Language Testing, 12, 62-70.
Creswell, J. W., & Plano Clark, V. L. (2007). Designing and conducting mixed methods research.
Thousand Oaks, CA: Sage.
L2 pronunciation conventions
32
Cucciarini, C., Strick, H., & Boves, L. (2002). Quantitative assessment of second language learners’
fluency: Comparisons between read and spontaneous speech. Journal of the Acoustical Society of
America, 111, 2862–2873.
Davidson, F. (1991). Statistical support for training in ESL composition rating. In L. Hamp-Lyons (Ed.),
Assessing second language writing in academic contexts (pp. 155-164). Norwood, NJ: Ablex.
Davidson, F., & Lynch, B. K. (2002). Testcraft: A teacher's guide to writing and using language test
specifications. New Haven, CT: Yale University.
Derwing, T. M., & Munro, M. J. (2009). Putting accent in its place: Rethinking obstacles to
communication. Language Teaching, 42, 1-15.
Derwing, T. M., Munro, M. J., Thomson, R. I., & Rossiter, M. J. (2009). The relationship between L1
fluency and L2 fluency development. Studies in Second Language Acquisition, 31, 533-557.
Derwing, T. M., Munro, M. J., & Wiebe, G. E. (1998). Evidence in favor of a broad framework for
pronunciation instruction. Language Learning, 48, 393-410.
Derwing, T. M., Rossiter, M. J., Munro, M. J., & Thomson, R. I. (2004). Second language fluency:
Judgments on different tasks. Language Learning, 54, 665-679.
Derwing, T. M., Thomson, R. I., & Munro, M. J. (2006). English pronunciation and fluency
development in Mandarin and Slavic speakers. System, 34, 183-193.
DeVelle, S. (2008). The revised IELTS pronunciation scale. Research Notes, 34, 36-38.
Douglas, D. (1994). Quantity and quality in speaking test performance. Language Testing, 11, 125-144.
Ericsson, K. A., & Simon, H. A. (1993). Protocol analysis: Verbal reports as data (Rev. ed.).
Cambridge, MA: MIT Press.
Flege, J. E., & Fletcher, K. L. (1992). Talker and listener effects on degree of perceived foreign accent.
Journal of the Acoustical Society of America, 91, 370-389.

L2 pronunciation conventions
33
Fulcher, G. (1996). Does thick description lead to smart tests? A data-based approach to rating scale
construction. Language Testing, 13, 208-238.
Garner, W. R. (1960). Rating scales, discriminability, and information transmission. Psychological
Review, 67, 343-352.
Gass, S. M., & Mackey, A. (2000). Stimulated recall methodology in second language research.
Mahwah, NJ: Lawrence Erlbaum.
Green, A. (1998). Verbal protocol analysis in language testing research: A handbook. Cambridge:
Cambridge University Press.
Hamp-Lyons, L., & Henning, G. (1991). Communicative writing profiles: An investigation of the
transferability of a multiple-trait scoring instrument across ESL writing assessment contexts.
Language Learning, 41, 337-373.
Harding, L. (2008). Accent and academic listening assessment: A study of test-taker perceptions.
Melbourne Papers in Language Testing, 13, 1-33.
Huck, S. W. (2004). Reading statistics and research (4th ed.). Boston: Pearson.
Isaacs, T. (2013, in press). Assessing pronunciation. In A. J. Kunnan (Ed.), The companion to language
assessment. Hoboken, NJ: Wiley-Blackwell.
Isaacs, T., & Trofimovich, P. (2011). Phonological memory, attention control, and musical ability:
Effects of individual differences on rater judgments of second language speech. Applied
Psycholinguistics, 32, 113-140.
Isaacs, T., & Trofimovich, P. (2012, in press). “Deconstructing” comprehensibility: Identifying the
linguistic influences on listeners’ L2 comprehensibility ratings. Studies in Second Language
Acquisition, 34.
Kang, O. (in press). Impact of rater characteristics on ratings of international teaching assistants' oral
performance. Language Assessment Quarterly.

L2 pronunciation conventions
34
Kennedy, S., & Trofimovich, P. (2008). Intelligibility, comprehensibility, and accentedness of L2
speech: The role of listener experience and semantic context. Canadian Modern Language
Review, 64, 459-489.
Lennon, P. (1990). Investigating fluency in EFL: A quantitative approach. Language Learning, 40, 387-
417.
Linacre, J. M. (2010a). A user’s guide to FACETS: Rasch-model computer programs [Software manual
3.67.0]. Chicago: Winsteps.com.]
Linacre, J. M. (2010b). Category misfit. In Winsteps help for Rasch analysis. Retrieved February 18,
2012, from http://www.winsteps.com/winman/index.htm?table3_2.htm
Lumley, T. (2005). Assessing second language writing: The rater's perspective. Frankfurt: Peter Lang.
Matell, M. S., & Jacoby, J. (1971). Is there an optimal number of alternatives for Likert scale items?
Educational and Psychological Measurement, 31, 657-674.
McKelvie, S. J. (1978). Graphic rating scales: How many categories? British Journal of Psychology, 69,
185-202.
Milanovic, M., Saville, N., Pollitt, A., & Cook, A. (1996). Developing rating scales for CASE:
Theoretical concerns and analyses. In M. Milanovic, N. Saville & A. Pollitt (Eds.), Validation in
language testing (pp. 15-38). Clevedon, UK: Multilingual Matters.
Miller, G. (1956). The magical number seven, plus or minus two: Some limits on our capacity for
processing information Psychological Review, 63, 81-97.
Munro, M. J., & Derwing, T. M. (1994). Evaluations of foreign accent in extemporaneous and read
material. Language Testing, 11, 254-266.
Munro, M. J., & Derwing, T. M. (1999). Foreign accent, comprehensibility, and intelligibility in the
speech of second language learners. Language Learning, 49, 285-310.

L2 pronunciation conventions
35
Munro, M. J., Derwing, T. M., & Morton, S. L. (2006). The mutual intelligibility of L2 speech. Studies
in Second Language Acquisition, 28, 113-131.
Myford, C. M., & Wolfe, E. W. (2000). Strengthening the ties that bind: Improving the linking network
in sparsely connected rating designs. TOEFL Technical Report No. 15. Educational Testing
Service: Princeton, NJ.
Pollitt, A., & Murray, N. L. (1996). What raters really pay attention to. In M. Milanovic & N. Saville
(Eds.), Performance testing, cognition and assessment (pp. 74–91). Cambridge: Cambridge
University Press.
Preston, C. C., & Colman, A. M. (2000). Optimal number of response categories in rating scales:
Reliability, validity, discriminating power, and respondent preferences. Acta Psychologica, 104,
1-15.
Rossiter, M. J. (2009). Perceptions of L2 fluency by native and non-native speakers of English.
Canadian Modern Language Review, 65, 395-412.
Schoonen, R., Vergeer, M., & Eiting, M. (1997). The assessment of writing ability: Expert readers
versus lay readers. Language Testing, 14, 157-184.
Southwood, M. H., & Flege, J. E. (1999). Scaling foreign accent: Direct magnitude estimation versus
interval scaling. Clinical Linguistics & Phonetics, 13, 335-349.
Stemler, S. E., & Tsai, J. (2008). Best practices in estimating interrater reliability. In J. Osborne
(Ed.), Best practices in quantitative methods (pp. 29-49). Thousand Oaks, CA: Sage.
Thomson, R. I., & Isaacs, T. (2011, September). Perceptions of friendliness and intelligence in L2
accented speech: The contribution of race-independent variables. Pronunciation in Second
Language Learning and Teaching Conference, Ames, IA.
Thompson, I. (1991). Foreign accents revisited: The English pronunciation of Russian immigrants.
Language Learning, 41, 177-204.

L2 pronunciation conventions
36
Underhill, N. (1987). Testing spoken language: A handbook of oral testing techniques. Cambridge:
Cambridge University Press.
Zielinski, B. W. (2008). The listener: No longer the silent partner in reduced intelligibility. System, 36,
69-84.

L2 pronunciation conventions
37
Table 1. Summary of raters’ reported exposure to L2 speech Experienced raters Novice raters t-test results
Measure M SD M SD t(38) p-value Familiarity with spoken English of Slavic speakersa 4.35 2.43 2.20 1.28 2.20 .002
Familiarity with spoken English of Mandarin speakersa 5.60 2.39 3.15 2.03 3.15 .001
Percent of time spent interacting with L2 speakers 39.0 16.83 22.5 17.73 22.5 .005
Note: aMeasured on a 9-point scale (1 = extremely familiar, 9 = extremely unfamiliar).

L2 pronunciation conventions
38
Table 2. Normalization of 9-point scale to 5-point scale
Scale points
Original 9-point scale 1 2 3 4 5 6 7 8 9
Normalized 9-point scale 1 1.5 2 2.5 3 3.5 4 4.5 5

L2 pronunciation conventions
39
Table 3. Cronbach’s α and Kendall’s W (italicized) for comprehensibility, accentedness, and fluency
grouped by experimental condition
Comprehensibility Accentedness Fluency
α W α W α W
Rating scale length
5-pointa .92 .40 .92 .41 .94 .47
9-pointa .95 .50 .94 .49 .95 .53
Rater experience
Experienceda .95 .50 .94 .47 .95 .50
Novicea .92 .39 .92 .42 .94 .49
Verbal report
Stim. recalla .93 .44 .92 .43 .95 .49
Rating onlya .93 .40 .93 .46 .95 .50
Pooledb .97 .43 .97 .43 .97 .49
an = 20; bn = 40

L2 pronunciation conventions
40
Table 4. Spearman rank-order correlations of ratings for the different levels of each independent variable
Experienced vs. novice
raters 5- vs. 9-point scales Stimulated recall vs.
rating only
Comprehensibility .88** .84** .90**
Accent .94** .90** .91**
Fluency .94** .92** .94**
** p < .001, two tailed

L2 pronunciation conventions
41
Table 5. Descriptive statistics for rater experience and think-aloud conditions grouped by normalized 5-
and 9-point rating scales
5-point scale 9-point scale
Comp. Acc. Flu. Comp. Acc. Flu.
Experienced M 2.78 2.45 2.56 2.75 2.40 2.32
SD 1.00 .76 .88 .98 .79 .86
Min 1.0 1.0 1.0 1.0 1.0 1.0
Max 5.0 4.0 5.0 5.0 4.5 4.5
Novice M 2.55 2.16 2.30 2.88 2.40 2.35
SD .98 .92 .94 .96 .76 .71
Min 1.0 1.0 1.0 1.0 1.0 1.0
Max 5.0 4.0 5.0 5.0 4.5 4.5
Stim. Recall M 2.57 2.38 2.45 2.65 2.32 2.40
SD .98 .84 .96 .95 .75 .83
Min 1.0 1.0 1.0 1.0 1.0 1.0
Max 5.0 4.0 5.0 5.0 4.5 4.5
Rating only M 2.76 2.22 2.41 2.98 2.48 2.27
SD 1.0 .86 .88 .95 .80 .75
Min 1.0 1.0 1.0 1.0 1.0 1.0
Max 5.0 4.0 5.0 5.0 4.5 4.5

L2 pronunciation conventions
42
Figure 1. Score distributions for 5- and 9-point comprehensibility sales

L2 pronunciation conventions
43
Figure 2. Score distributions for 5- and 9-point accentedness scales
L2 pronunciation conventions
44
Figure 3. Score distributions for 5- and 9-point fluency scales
L2 pronunciation conventions
45
Figure 4. Response category probability curves for comprehensibility, 5-point scale
Figure 5. Response category probability curves for comprehensibility, 9-point scale
L2 pronunciation conventions
46
Figure 6. Response category probability curves for accentedness, 5-point scale
Figure 7. Response category probability curves for accententness, 9-point scale
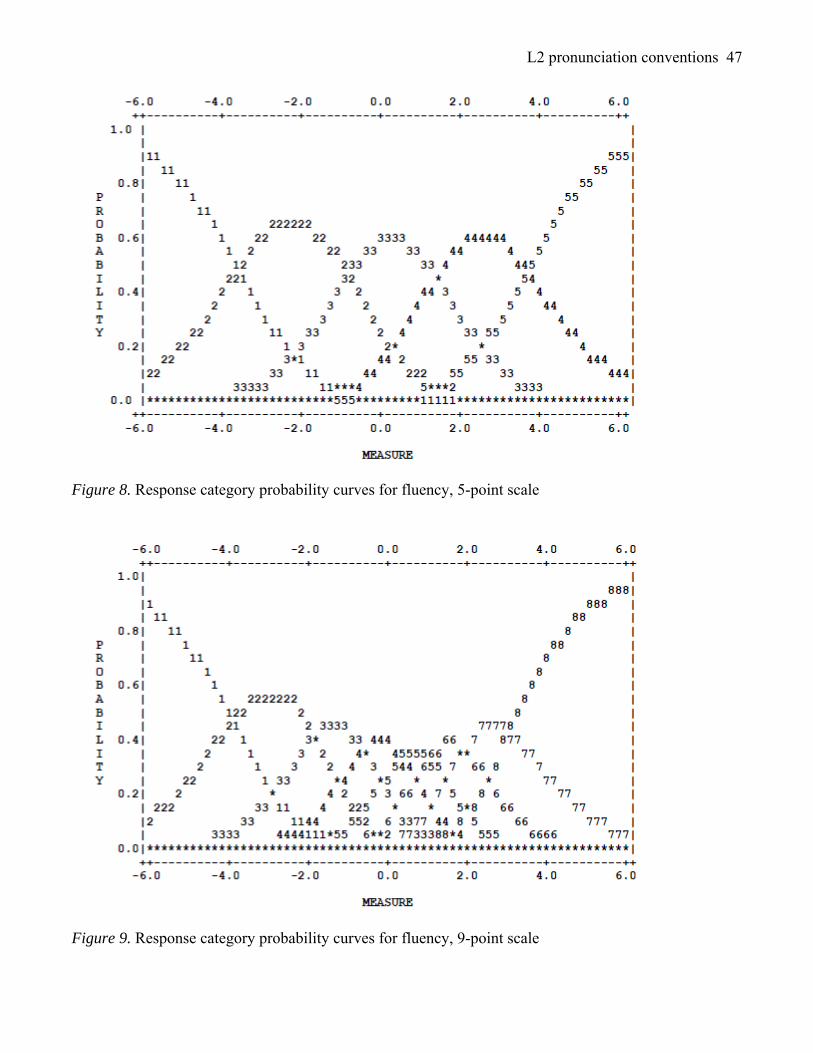
L2 pronunciation conventions
47
Figure 8. Response category probability curves for fluency, 5-point scale
Figure 9. Response category probability curves for fluency, 9-point scale