l1 m1 executive report - defra, ukrandd.defra.gov.uk/document.aspx?document=wr1204_8366_frp.pdfthe...
TRANSCRIPT
WR1204
Household Waste Prevention
Evidence Review:
L1 m1 – Executive Report
A report for Defra’s
Waste and Resources Evidence Programme
October 2009
This research was commissioned and funded by Defra. The views expressed reflect the research findings and the authors’ interpretation. The inclusion of or reference to any particular policy in this report should not be taken to imply that it has, or will be, endorsed by Defra
WR1204 Household Waste Prevention Evidence Review | A report for Defra L1 m1 Executive report
.October 2009
Contents
1 Introduction, approach and method 1
2 Policy context 3
3 Consumers – engaging 4
3.1 Coverage of the review 4
3.2 Options available and consumer participation 4
3.3 Behaviour change theories and waste prevention 5
3.4 Motivations for waste prevention behaviour 6
3.5 Barriers to waste prevention behaviour 7
3.6 Contribution of consumer behaviour change options to waste prevention 8
4 Third sector, retail and service stakeholders - enabling households to take action 10
4.1 Coverage of the review 10
4.2 Reuse and the third sector 10
4.3 Retail solutions – refillables and self-dispensing systems 13
4.4 Product service systems (PSS) 15
5 Policy measures: encouraging 17
5.1 Coverage of the review 17
5.2 Possible policy options and implementation issues 17
5.3 Potential contribution of policy measures to waste prevention impacts 22
6 Monitoring and evaluation 22
6.1 Coverage of the review 22
6.2 Approaches to monitoring and evaluation 23
6.3 Key issues relating to monitoring and evaluation approaches 23
6.4 Barriers to progressing monitoring and evaluation 24
6.5 Opportunities for progressing monitoring and evaluation 24
7 Stakeholder engagement feedback 25
7.1 Scope of the stakeholder engagement 25
7.2 Evidence gaps 25
7.3 Experience of waste prevention – how to work with consumers 26
7.4 Perceptions of barriers and motivating actions 26
8 Evidence gaps and signposts 27
8.1 The evidence base for household waste prevention 27
8.2 Evidence gaps 28
8.3 Further development of the waste prevention evidence base 29
9 Implications and issues 31
9.1 Answers to the research questions 31
9.2 Relative impacts of waste prevention options 34
10 Annex 1: Report module navigation 36
11 Annex 2: Bibliography 38
© Brook Lyndhurst 2009
This report has been produced by Brook Lyndhurst Ltd under/as part of a contract placed by Defra. Any views expressed in it are not necessarily those of Defra. Brook Lyndhurst warrants that all reasonable skill and care has been used in preparing this report. Notwithstanding this warranty, Brook Lyndhurst shall not be under any liability for loss of profit, business, revenues or any special indirect or consequential damage of any nature whatsoever or loss of anticipated saving or for any increased costs sustained by the client or his or her servants or agents arising in any way whether directly or indirectly as a result of reliance on this report or of any error or defect in this report.

WR1204 Household Waste Evidence Review | A report for Defra L1 m1 Executive report
October 2009
1
1 Introduction, approach and method In Autumn 2008, Defra commissioned a review to consolidate the policy-relevant evidence base applying
to household waste prevention.
The review adopted Defra‟s definition of „evidence‟1:
“We can say that evidence is any information that Defra can use to turn its policy goals into something
concrete, achievable and manageable. It can take many forms: research, analysis of stakeholder opinion,
economic and statistical modelling, public perceptions and beliefs, anecdotal evidence, and cost/benefit
analyses; as well as a judgement of the quality of the methods that are used to gather and synthesise
the information.
Evidence for policy has three components. First is hard data (facts, trends, survey information) but the
second component is the analytical reasoning that sets the hard data in context. Third, an evidence
base comprises stakeholder opinion on an issue or set of issues. The reason for this tripartite approach
is: if there is any weakness in the hard data on which you are basing a policy option, then you will need
to fall back upon the analysis that underpins the data. If there is any weakness in the analysis, or any
risk that others could bring an alternative interpretation to the table, then you need to go back to your
stakeholder base in order to understand the different interpretations that could give rise to different
analyses of the same set of data.”
With this in mind, the review encompassed evidence from Defra, WRAP and the EA2; as well as academic
research and grey literature from UK and international sources. Stakeholders were also engaged in the
evidence review process, drawing their knowledge into the evidence base. The research was undertaken
by Brook Lyndhurst, the Social Marketing Practice and the Resource Recovery Forum. The research team
was supported by a Defra-appointed steering group and an expert panel approved by Defra.
The evidence review addressed a set of key questions:
What is the extent to which household waste prevention behaviours are practised?
What are the barriers and opportunities to encourage participation?
What are the options available to householders?
What are the options for stakeholders?
What are the infrastructure considerations and technical solutions?
What is the impact of different policy options and measures on waste prevention?
In addressing these questions, the review sought to assemble the evidence that could be useful to the
formulation of future policy; and to identify gaps in that evidence. The review is not a statement of
policy; and the inclusion of or reference to any given policy measure should not be taken to imply that it
has, or will be, endorsed by Defra as an option for England. Future policy will need to be developed from
an evidence-based platform; and it is hoped that this report and its accompanying suite of supporting
material3 provides such a platform.
1 http://www.defra.gov.uk/science/how/evidence.htm 2 Waste and Resources Action Programme; Environment Agency. The work was commissioned by the Defra Waste & Resources
Evidence Programme (WREP). 3 The overall findings from the review are presented as a series of modules for ease of access – see Annex 1
WR1204 Household Waste Evidence Review | A report for Defra L1 m1 Executive report
October 2009
2
The evidence review adopted the definition of waste prevention set out by the OECD4 and the NRWF
toolkit5. The definition encompasses:
strict avoidance (not generating waste in the first place)
source reduction; and
product reuse (in its original form)
as well as reducing the hazardousness of waste.
It excludes all forms of recycling – including food collection and commercial composting – and
remanufacturing. The latter are sometimes included in a broader definition of “waste minimisation” and it
is worth noting that stakeholders involved in the review sometimes did not make a clear distinction
between recycling and prevention.
The scope of the review was agreed with Defra. It was informed by the resource lifecycle framework set
out in Waste Strategy 2007; by the coverage of waste prevention topics in Defra‟s Waste and Resources
Evidence Programme (WREP); and by WRAP‟s consumer research.
Over 800 source documents (against a nominal target of 200) were identified in a scoping phase,
including 19 WREP projects which each had multiple reports. In all, 88 documents were reviewed in
detail; 44 others were skimmed for relevant material, and 106 covered in the international review6. The
desk element was supported by further evidence gathered from stakeholders (reported in section 7),
interviews with 19 UK experts, and input from 40 international experts to the international review
(document reference L3 m5/2 (D) – see below). The evidence is consolidated here under three main
headings that relate to the key „entry points‟ at which prevention behaviour can be influenced:
voluntary action by consumers at home
support through stakeholders (e.g. retail and reuse sectors)
and directly through national and local policy
Other chapters report on issues related to monitoring and evaluation, on stakeholder views, and gaps in
the evidence. In reading the report it is important to bear in mind that the scope focused very
much on secondary published literature, and on literature that had been peer reviewed or was
undertaken by/for government, WRAP or the EA. Though significant gaps were found in the
evidence – especially reliable statistics - it was outside the scope of the review to piece together new
information from primary sources.
The outputs from the review have been produced in a series of modules spread over three „levels‟. This
executive report comprises „Level 1‟ (or L1). Further detail is provided in a series of Level 2 (L2) papers
(that have also been compiled into a single volume). Further details, and briefing notes on particular
subjects, are provided by a suite of Level 3 (L3) modules. The structure is an acknowledgement that not
all readers will be interested in all of the material; and the intention is that users of the material can drill
down from this top level executive report to the particular detail of interest. Navigation to other modules
is indicated by grey highlighted text (e.g. Level 2 Module 3 is written as L2 m3) throughout this executive
report; while the key for the modules is in Annex 1.
4 OECD (2002), Working Group on Waste Prevention and Recycling: OECD Workshop on waste prevention – toward performance
indicators 8-10 October 2001. 5 National Resource & Waste Forum (NRWF) (2006) Household Waste Prevention Toolkit Part A – A Continuous Waste Prevention
Improvement Approach. http://www.wrap.org.uk/downloads/NRWFToolkit1.d24df631.2677.pdf Accessed 30.03.2009. 6 Sources included in the review are detailed in Annex 1 and references to them are given in the text in square brackets. Other sources (e.g. web-sites, press releases) are listed as footnotes. The international review can be found in L3 m5/2 (D).
WR1204 Household Waste Evidence Review | A report for Defra L1 m1 Executive report
October 2009
3
2 Policy context
Total waste arisings in England are some 272 million tonnes per annum; 9% of this originates from
households according to Waste Strategy 2007. Over the last five years, total household waste has
declined at an average rate of 0.4% per annum7. Residual waste (that left after reuse and recycling)
averaged 321 kg per head in the year to June 20088, down from 450 kg per person in 20009.
Waste Strategy 2007 sets the policy context for waste prevention in England. A key objective is to
decouple waste growth (in all sectors) from economic growth. The strategy includes a specific target to
reduce household residual waste from 22.2 million tonnes in 2000 to 15.8 million tonnes in 2010, with a
further aspiration to reach 12.2 million tonnes in 2020. This is equivalent to reducing residual waste per
person to 225 kg in 202010. The means of achieving the target include recycling and composting, as well
as prevention. Resource efficiency and waste prevention are also priorities in Defra‟s work on sustainable
consumption and production, including product roadmaps for priority products and an extensive
programme of consumer and product research11.
To further the commitments made in Waste Strategy 2007, the government made provision in the
Climate Change Act 2008 for the piloting of household financial incentives schemes in five local
authorities. No applications have been made to date. Significant other measures that should encourage
local authorities to pursue waste prevention include:
the Landfill Allowance Trading Scheme (LATS) (monitored by the Environment Agency12)
new waste performance indicators for local authorities announced in 2007 (NIs 191, 192 and 19313) –
including an indicator for residual waste per head, and inclusion of reuse in the diversion indicator
(with recycling and central composting) (see L2 m2 for more detail).
WRAP is further supporting local authority activity on household waste prevention through revision of the
former National Resource and Waste Forum (NRWF) waste prevention toolkit and is working with Defra
on initiatives to promote sustainable clothing14 and third sector capacity in the reuse economy15. WRAP
also plays an important role in promoting the reduction of packaging and food waste through the
Courtauld Commitment with major retailers16; and from 2010 onwards WRAP will be leading on delivery
of the government‟s resource efficiency policy to businesses and consumers.
Implementation of the EU Waste Framework Directive (WFD – Directive 2008/98/EC)17 in the UK will
likely provide further impetus to waste prevention, with a new obligation for member states to design and
introduce comprehensive waste prevention programmes by 2013.
7 Defra, Statistical Release November 2008
http://www.defra.gov.uk/environment/statistics/wastats/archive/mwb200708_statsrelease.pdf 8 Defra, Statistical Release February 12th 2009, „Municipal waste management statistics: Provisional Quarter 1 – 2008/09.‟
http://www.defra.gov.uk/news/2009/090212a.htm NB These data are provisional as returns to WasteDataFlow can be revised by local
authorities during the scheme year and there are also season effects on waste arisings and management. To minimise the effects of
seasonal fluctuations, comparisons are made between the years. 9 Defra (May 2007), Waste Strategy for England 2007, p. 11. 10 Defra (May 2007), Waste Strategy for England 2007, p. 11. 11 Defra, SCP Evidence Base Research http://www.defra.gov.uk/environment/business/scp/evidence/index.htm 12 Environment Agency (Nov. 2008), Report on the Landfill Allowances and Trading Scheme. 13 For more information visit: http://www.defra.gov.uk/environment/localgovindicators/ni191-193.htm and
http://www.defra.gov.uk/environment/waste/localauth/perform-manage/index.htm 14 Defra, Sustainable Clothing Action Plan
http://www.defra.gov.uk/environment/business/products/roadmaps/pdf/sustainable-clothing-action-plan.pdf 15 Defra (2008) Third Sector Strategy
http://www.defra.gov.uk/corporate/how-do-we-work/third-sector/strategy/documents/Defra-Third-Sector-Strategy-1108.pdf 16 WRAP, Courtauld Commitment. http://www.wrap.org.uk/retail/courtauld_commitment/ 17 Directive 2008/98/EC of the European Parliament and of the Council of 19 November 2008 on waste and repealing certain Directives,
Official Journal of the European Union 22.11.2008, L 312/3. http://eur-lex.europa.eu/LexUriServ/LexUriServ.do?uri=OJ:L:2008:312:0003:0030:en:PDF

WR1204 Household Waste Evidence Review | A report for Defra L1 m1 Executive report
October 2009
4
Also looking to the future, the House of Lords Science and Technology Committee published an inquiry
into waste reduction in 200818 to which the Government responded19. A key concern of the inquiry was
the prevention of commercial and industrial waste, including the barriers that exist to local authorities
engaging with businesses to reduce their waste. Business waste prevention was outside the scope of this
evidence review.
Outside England, the devolved administrations in Scotland, Wales and Northern Ireland all have their own
strategies on waste minimisation/prevention, which are detailed in L2 m2.
3 Consumers – engaging
Engaging consumers and households to rethink their behaviour is one of the main ways in which waste
prevention can be progressed. The evidence is summarised below for public participation in waste
prevention, the motivations and barriers underlying behaviour and the contribution of public engagement
initiatives to increasing action.
3.1 Coverage of the review
The review uncovered a large body of evidence on attitudes and behaviour on waste prevention, including
five Defra WREP projects [1-5], Defra‟s work on sustainable clothing, academic papers, WRAP consumer
research and consultants‟ reports (see Annex 2). Modules related to this section of the executive report
are:
Level 1 Report Level 2 Report Level 3 reports
L1 m0
Executive summary
L2 m3
Consumers - Engaging
L3 m3/1 (D) Extent to which behaviours are practised
L3 m3/2 (D) Consumer motivations and barriers
L3 m3/3 (D) Impacts of public campaigns & interventions
L3 m3/4 (T) Attitudes & behaviour – food waste
L3 m3/5 (T) Attitudes & behaviour – home composting
L3 m3/6 (T) Attitudes & behaviour – reuse
L3 m3/7 (T) Attitude & behaviour – everyday actions at home
L3 m3/8 (T) Consumer segmentation
L3 m3/9 (T) Small group behaviour change models
L3 m8/2 (D) Waste prevention bibliography
(D) denotes a briefing paper providing more background detail; (T) indicates a short focused topic briefing
3.2 Options available and consumer participation
The review found that there is no standard set of behaviours which is widely accepted as comprising
„household waste prevention‟. In practice, it covers anything from rejecting junk mail to reusing food
leftovers; from home composting to donating electrical goods to charities; from buying second hand
clothes to avoiding single-use bags, and so on20. Unlike recycling - which is a more singular act -
prevention comprises many small, individual behaviours. Also unlike recycling, prevention behaviour
tends to be private and invisible, so there is much less likelihood of a social norm developing.
Data on the incidence of different behaviours are largely inconclusive, mainly because they come from
surveys that relate to differing contexts (e.g. a specific area or group of people). A few nationally
representative surveys are available, conducted mainly by WRAP (on food, nappies, home composting,
junk mail and single use bags). The only reliable time-series tracking data is currently held by WRAP
18 House of Lords Science and Technology Committee (2008), Waste Reduction.
http://www.parliament.uk/parliamentary_committees/lords_s_t_select/waste_reduction.cfm 19 Government (2008), Waste Reduction: Government responses to House of Lords Science and Technology Committee report.
http://www.publications.parliament.uk/pa/ld200708/ldselect/ldsctech/203/203.pdf 20 A complete listing of behaviours, together with evidence on motivations and barriers, is in report L3 m3/2
WR1204 Household Waste Evidence Review | A report for Defra L1 m1 Executive report
October 2009
5
while some questions in Defra‟s Survey of Public Attitudes and Behaviours Toward the Environment also
cover waste behaviours21.
From the literature, examples of the extent of practice for waste prevention behaviours include: home
composting 35%; avoiding packaging 10%-40%; committed to preventing food waste 14%; always using
a „bag for life‟ 23%; avoiding junk mail 15%; and buying second hand 30-45% (sources and detailed
participation data are given in L3 m3/1 (D)). On reuse, a higher percentage generally donates (clothes
or bulky/WEEE22 goods) than purchases second hand; however, Freecycle membership is growing fast in
the UK and is currently around one million members [6] (L3 m3/6 (T)).
Up to 60% of people do at least one waste prevention behaviour [1] but behaviours tend to be practised
sometimes rather than always, and some people will do one or a few but not a whole range of behaviours
[7]. Willingness is consistently greater than the actual level of engagement in waste prevention
behaviours [7]. Donating items is commonly reported as the most practised behaviour; private reuse of
items around the home and other „low effort‟ reduction behaviours tend to occupy an intermediate
position; and those that require major changes in consumer habits are often least practised (L2 m3 & L3
m3/1 (D)).
Practice varies across different socio-economic groups and the variations are often specific to the
behaviour in question (L2m3, L2 m3/1 & L3 m3/4 to 7). In broad terms, however, waste prevention
behaviours are more prevalent among individuals who are: older; middle to high income; female; living
in detached properties; not living with children at home; and more concerned about the environment.
3.3 Behaviour change theories and waste prevention
A number of authors have used behaviour change theories either to explain or predict waste prevention
behaviour [8, 9] or have reviewed others‟ work in this area [1]. One of the most widely tested is the
theory of planned behaviour, which proposes that intention to act derives from three factors: a person‟s
attitude, whether they feel able to act (known as „perceived behavioural control‟) and wider social norms.
Under the right external conditions (e.g. no limiting barriers), intention is expected to translate into
action.
The theory of planned behaviour is just one of the many social psychological frameworks that are being
examined and applied in pro-environmental behaviour change research (including Defra‟s programme on
sustainable consumption23 24). This body of applied theory points to the following as being important
considerations at a practical level [1, 4]:
Personal values, norms and identity – including whether I feel the issue is important, I feel
responsible, I feel I am the kind of person who does this, and I feel I am able to do it, the perceived
difficulty and costs;
Social norms and identity – either whether I want to act because I see others do it (descriptive
norm), or I feel obliged to do it because most people do it (injunctive norm), whether I get praise
from others for doing it, or it gives me a sense of social „belonging‟;
External conditions – whether I have access to services or products or whether there are other
barriers that are out my control;
21 http://www.defra.gov.uk/environment/statistics/pubatt/ 22 Waste Electrical and Electronic Equipment 23 Defra‟s programme of social research on pro-environmental behaviour can be found here
http://www.defra.gov.uk/environment/business/scp/evidence/theme3/sustain-consump.htm 24 Other key sources include various papers by Professor Tim Jackson
http://portal.surrey.ac.uk/portal/page?_pageid=822,512810&_dad=portal&_schema=PORTAL and Andrew Darnton‟s review of theories for government social researchers http://www.gsr.gov.uk/downloads/resources/behaviour_change_review/practical_guide.pdf

WR1204 Household Waste Evidence Review | A report for Defra L1 m1 Executive report
October 2009
6
Habits – behaviours that occur regularly and repeatedly without conscious reflection are referred to
as habitual and are not directly subject to the influence of values, norms and so on. Theoretical
mechanisms have been described for breaking into habits and „re-freezing‟ new ones (e.g. „cueing‟ of
desirable habits, learning by doing etc.)25.
3.4 Motivations for waste prevention behaviour
The motivations driving waste prevention are as many and varied as the diverse activities under the
waste prevention umbrella: they cover many of the aspects flagged by theory; and are often specific to
particular behaviours (e.g. food, home composting, reuse, etc - see L2 m3 & L3 m3/3 (D)).
Importantly, research has suggested that waste prevention behaviours are poorly correlated with
recycling, and are sometimes even negatively correlated [1 & 7] – such that recycling may become a
reason for not doing more to reduce waste26. The research also revealed a degree of confusion among
the public between “recycling” and “reduction” and the two are often conflated in the public‟s mindset.
Studies that have tried to explain waste prevention behaviour through statistical models or testing of
behavioural theory have generally found that their models have only weak explanatory power (see also
L3 m5/1 (T)]. Two of the main studies [1 & 7] found that some 70% to 85% of the variation in behaviour
could not be explained. Difficulty in explaining waste prevention behaviour may be related to the fact
that it is, in reality, not a single behaviour but many. Moreover, it is possible that there are missing
inputs to the models which are drivers of behaviour but that do not relate either to waste, environmental
values or world views (for example, the strength of purchase and food management drivers in WRAP‟s
food waste research [10]).
The difficulties faced by such modelling exercises lie, in part, in the fact that there is no consensus about
behaviour change at a theoretical level. Nevertheless, various motivations are identified in the literature.
The following are the most frequently mentioned in the studies reviewed (simply presented in the same
order as theoretical drivers shown above because the literature does not provide the basis for a clear
ranking):
Values – universalism and moral motivations. Motivations for recycling are often described as more
functional and influenced by external conditions (e.g. kerbside collection) than are those for waste
prevention. Several authors link waste prevention behaviour to underlying personal values, including
what are commonly termed „universal‟ values (generally where an individual puts collective benefits
ahead of their own personal gain) [1]. Moral and charitable motivations are drivers for reuse (especially
donation); and an „ethic of care‟ – a general sense of responsibility for the intrinsic value or on-going use
of „things‟ – has also been flagged (L3 m3/6 (T)).
Personal responsibility. Acceptance of personal responsibility is often cited as a primary requirement
for prevention behaviour. It may be manifested, for example, as a sense of duty or obligation,
satisfaction, embarrassment (or lack of it in relation to second hand goods), guilt, and active concern.
Self-efficacy. This describes the personal capabilities, confidence, know-how and skills needed to carry
out a particular behaviour. Interventions or campaigns may address it by providing hands-on help or
giving tips on how to perform an activity (e.g. the Love Food Hate Waste web site or several WREP
projects [2, 3, 4]).
25 See Defra research (forthcoming) Unlocking habits to enable pro-environmental behaviours - EV0502
http://randd.defra.gov.uk/Default.aspx?Menu=Menu&Module=More&Location=None&Completed=0&ProjectID=16189 26 This „negative spillover‟ is also identified in Defra‟s evidence review of catalyst behaviours (Brook Lyndhurst, in progress). See
especially Thorgerson (2004). http://randd.defra.gov.uk/Default.aspx?Menu=Menu&Module=More&Location=None&Completed=0&ProjectID=16324
WR1204 Household Waste Evidence Review | A report for Defra L1 m1 Executive report
October 2009
7
Costs. Saving money through avoided or alternative purchase has been shown to be an important
motivator - for example on home composting (through subsidy of bins), carrier bags (charging), buying
from charity shops, interest in refills, and switching from bottled to tap water (L3 m3/2 (D)). Money
saving is a complex driver, however, and has to be set against the risk that consumers will perceive
cheaper or alternative products as lower quality or sub-optimal options (see section 4).
Social norms. Knowing or seeing that others are taking action can create a sense that individual
contributions are worth the effort [1]. A national survey, for example, indicated that 5% - 10% of home
composters started due to encouragement from friends [9]. Social norm effects and peer support are
actively deployed in behaviour change interventions based around small groups working together (L3
m3/9 (T)) and some have recorded significant reduction impacts among the individuals taking part (e.g.
Global Action Plan [2] and Love Food Champions [11] – see also L3 m3/3 (D)).
Habits can have either a negative or a positive effect on prevention behaviour: they can either block the
take up of new behaviours where routines are so established that consumers never think to question
them; or help to maintain established „good‟ behaviours [1, 4, 12]. The challenge for behavioural change
interventions is to break into (or „disrupt‟) routinised thinking and help consumers maintain new habits
once they try something new. This can be done through repeat communication and hands-on support, for
example ([2, 4] and (L2 m3)) 27.
3.5 Barriers to waste prevention behaviour
The barriers to waste prevention behaviour are equally diverse and almost mirror the motivations above
(see L2 m3, L3 m3/2 (D) & L3 m3/4 (T) to L3 m3/7 (T) for further detail of the barriers listed below).
Apathy or a general lack of interest in the idea of prevention has been identified as a general barrier [4,
8] and specifically in studies of junk mail, food and refillables.
It’s someone else’s responsibility. Lack of interest is often compounded by a feeling that business
and retailers are more responsible for the waste problem than consumers, commonly noted around
packaging but also food waste [1, 4, 10, 11, 13].
Inconvenience is commonly cited as a barrier, with specific mentions for home composting, refillable
packaging and retail self-dispensing systems, product service systems, reusable nappies and donating for
reuse. Non-participants can be put off by the perception of inconvenience without any actual experience
[e.g. 9, 14]. Behaviour change projects may address this by providing opportunities to see activities „for
real‟ (e.g. nappy or home composting demonstrations) or by making it very easy to participate (e.g. by
providing sign-up forms for junk mail opt outs) [e.g. 3, 4].
Cost can be a motivator for buying low waste products where there is some price advantage (or
subsidy); but where consumers perceive there will be little or no discount, or they think an alternative
will be more expensive, this acts as a barrier (e.g. in relation to refills, product service systems and food
purchase). Special offers on food have been shown to contribute to food waste by encouraging people to
buy more than they need [10, 11, 15].
Weak self efficacy and a sense of powerlessness. Many people feel that their contribution, either to
the waste problem or to the solution, is marginal. In particular, some specific prevention behaviours can
be seen as too insignificant to be worthwhile [1]. In addition, consumers may lack the know-how which
would enable them to act differently, including what products to buy/use (e.g. nappies or home
composting), how to manage wastage (e.g. on food or junk mail), or where to access services (e.g.
reuse).
27 A large scale study of the influence of habits on behaviour is currently underway for Defra. Unlocking habits to enable pro-
environmental behaviours - EV0502.
http://sciencesearch.defra.gov.uk/Default.aspx?Menu=Menu&Module=More&Location=None&Completed=0&ProjectID=16189

WR1204 Household Waste Evidence Review | A report for Defra L1 m1 Executive report
October 2009
8
Social norms don’t favour waste prevention. This problem faces two ways: the prevailing social
norm values mass consumption, rapid turnover of products and a personal identity built on the ownership
of „stuff‟ [4]; waste prevention is not a mainstream behaviour and may sometimes be seen as weird or
different (e.g. buying second hand [16]). Moreover, the actions that contribute to waste prevention are
largely private and unseen, so there is no explicit social pressure to „do the done thing‟ [1], nor a
reminder to hang on to new prevention habits [5] – as there is now for recycling.
Dominance of the recycling norm. As we saw above, the recycling norm has become so strong that
this is generally people‟s understanding when they are asked to “reduce waste”. Intervention projects
have found that people need to be educated about the specific actions they can take, and why these are
worth doing, rather than relying on general exhortations to “reduce waste” – because many people
believe they are already doing their bit through recycling (see L2 m3 section 3.8).
While the above list of motivations and barriers provides a generic indication of the „basics‟ that need to
be considered when trying to engage the public in waste prevention, it does not do justice to the richness
of the evidence base for specific prevention behaviours. Further detail and insight can be found by
following the signposts given in section 3.1 above.
3.6 Contribution of consumer behaviour change options to waste prevention
Approaches
Campaigns and interventions that tackle a full range of waste prevention behaviours are a relatively new
area for local authorities28. The existing evidence comes from WREP projects [2, 3, 4], and a small
number of authorities and community-led initiatives [5, 17, 18, 19, 20]. The two main approaches trialled
so far include:
Doorstepping information and advice campaigns, targeted at all households in a defined area [3];
Volunteer household campaigns/projects, where individuals sign up to be part of a group
receiving a package of advice, challenge activities and (often) hands-on support [e.g. 2, 4, 5, 11](L3
m3/9 (T)).
In addition to these cross-cutting campaigns are local authority and other initiatives on specific
behaviours such as nappy or compost bin promotions [e.g. 17, 21] and projects in schools. All three
approaches may involve champions or mentors (paid or voluntary) who help to support households in
taking up new behaviours (e.g. WRAP‟s home composting advisors; Global Action Plan‟s (GAP‟s) Eco
Team facilitators).
National support for local activity in the UK has been principally through the activities of WRAP, including
financial and communications support for compost bin promotion, and the Love Food Hate Waste
campaign which provides a key communications „asset‟ for local authorities. During 2009, WRAP has
updated the NRWF waste minimisation (now prevention) toolkit and is producing revised monitoring and
evaluation guidance.
28 L2 m3 provides a fuller discussion of approaches, organised around Defra‟s 4Es behaviour change framework. („Intervention‟ is a
generic term referring to any activity or project intended to effect change: „campaigns‟ comprise communication processes intended to raise awareness, encourage participation, promote change and so forth.)
WR1204 Household Waste Evidence Review | A report for Defra L1 m1 Executive report
October 2009
9
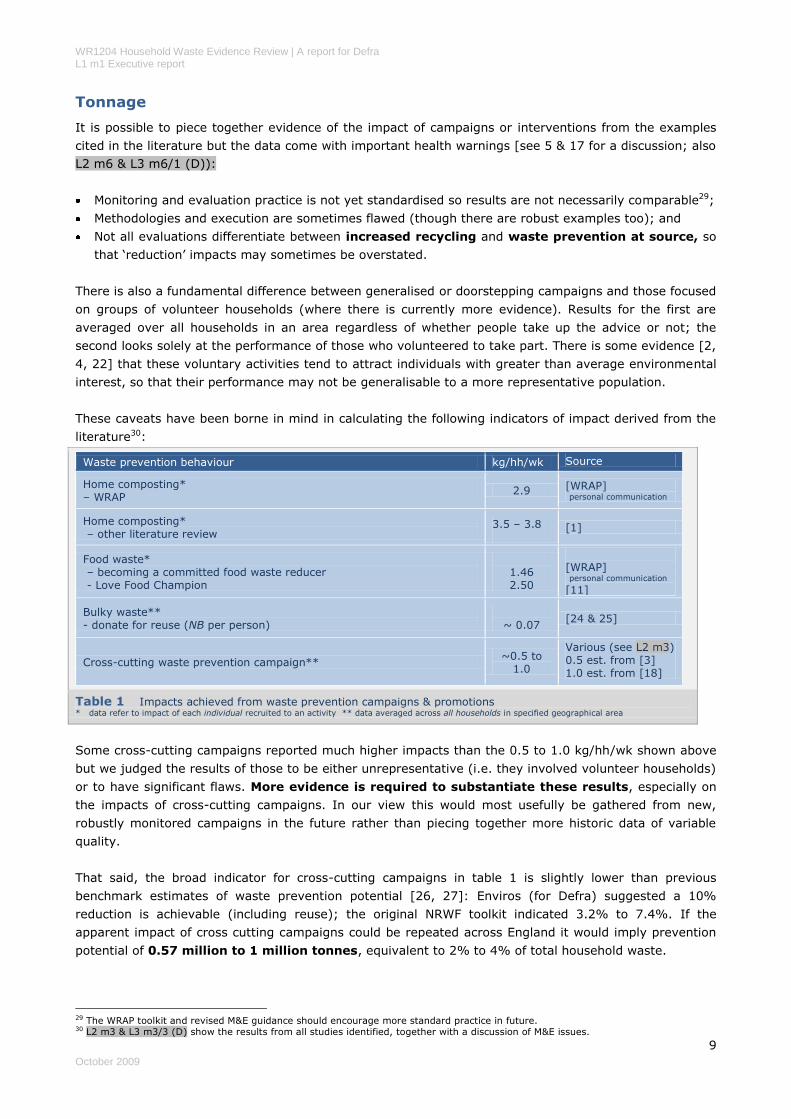
Tonnage
It is possible to piece together evidence of the impact of campaigns or interventions from the examples
cited in the literature but the data come with important health warnings [see 5 & 17 for a discussion; also
L2 m6 & L3 m6/1 (D)):
Monitoring and evaluation practice is not yet standardised so results are not necessarily comparable29;
Methodologies and execution are sometimes flawed (though there are robust examples too); and
Not all evaluations differentiate between increased recycling and waste prevention at source, so
that „reduction‟ impacts may sometimes be overstated.
There is also a fundamental difference between generalised or doorstepping campaigns and those focused
on groups of volunteer households (where there is currently more evidence). Results for the first are
averaged over all households in an area regardless of whether people take up the advice or not; the
second looks solely at the performance of those who volunteered to take part. There is some evidence [2,
4, 22] that these voluntary activities tend to attract individuals with greater than average environmental
interest, so that their performance may not be generalisable to a more representative population.
These caveats have been borne in mind in calculating the following indicators of impact derived from the
literature30:
Waste prevention behaviour kg/hh/wk Source
Home composting* – WRAP
2.9 [WRAP] personal communication
Home composting* – other literature review
3.5 – 3.8
[1]
Food waste* – becoming a committed food waste reducer - Love Food Champion
1.46 2.50
[WRAP] personal communication [11]
Bulky waste** - donate for reuse (NB per person)
~ 0.07
[24 & 25]
Cross-cutting waste prevention campaign** ~0.5 to
1.0
Various (see L2 m3) 0.5 est. from [3] 1.0 est. from [18]
Table 1 Impacts achieved from waste prevention campaigns & promotions * data refer to impact of each individual recruited to an activity ** data averaged across all households in specified geographical area
Some cross-cutting campaigns reported much higher impacts than the 0.5 to 1.0 kg/hh/wk shown above
but we judged the results of those to be either unrepresentative (i.e. they involved volunteer households)
or to have significant flaws. More evidence is required to substantiate these results, especially on
the impacts of cross-cutting campaigns. In our view this would most usefully be gathered from new,
robustly monitored campaigns in the future rather than piecing together more historic data of variable
quality.
That said, the broad indicator for cross-cutting campaigns in table 1 is slightly lower than previous
benchmark estimates of waste prevention potential [26, 27]: Enviros (for Defra) suggested a 10%
reduction is achievable (including reuse); the original NRWF toolkit indicated 3.2% to 7.4%. If the
apparent impact of cross cutting campaigns could be repeated across England it would imply prevention
potential of 0.57 million to 1 million tonnes, equivalent to 2% to 4% of total household waste.
29 The WRAP toolkit and revised M&E guidance should encourage more standard practice in future. 30 L2 m3 & L3 m3/3 (D) show the results from all studies identified, together with a discussion of M&E issues.
WR1204 Household Waste Evidence Review | A report for Defra L1 m1 Executive report
October 2009
10
4 Third sector, retail and service stakeholders - enabling households to take action
This section turns to the contribution of particular stakeholders in supporting household action and their
role in the service infrastructure for waste prevention.
4.1 Coverage of the review
The scope here was limited to three specific topics within a potentially vast subject field, mainly driven by
the coverage of the work undertaken for WREP [28 - 33]. The review covered:
Reuse and the third sector;
Retail solutions, focusing on refillables and retail self-dispensing systems;
Product service systems.
The WRAP Retail Innovation programme was a further key source of evidence [34 - 36]. Related issues
not covered in the review but signposted elsewhere (L3 m8/1 (T)) include eco-design, packaging
innovation, mandatory deposit schemes for refillables, remanufacturing, and product lifespan. Related
report modules are:
4.2 Reuse and the third sector
Three WREP studies examined the contribution of third sector organisations to the waste sector and their
support needs [28, 29, 20]. A further study examined the contribution of community composting [31].
Evidence from these sources was supplemented by academic and practitioner literature.
Current situation
The precise scale and character of the reuse sector in England is currently unknown (though it has been
researched in depth for London [24]). A best estimate based on the evidence is that approximately
500,000 tonnes is reused annually in England31, around half of which is textiles32. This estimate does not
include commercial channels such as eBay and car boot sales, or Freecycle, which is expanding very fast
in the UK [6]. Other key facts are:
Half to two-thirds of households dispose of bulky waste and Waste Electrical and Electronic Equipment
(WEEE) each year, mostly to Household Waste Recycling Centres (HWRCs).
Capture of bulky waste (including WEEE) for reuse may be in the order of 10% to 15% [24, 37, 38].
Council bulky collections achieve an estimated 2% reuse rate and HWRCs 2-3%, while channels such
as charity shops can achieve 80%+ (though much of this is textiles) [24, 37, 38].
Third sector collections in London achieved a 68% reuse rate of bulky items collected in 2006/7 [24].
31 WRAP are currently investigating this further to inform their future strategy related to reuse and the total estimate for reuse is
expected to be broadly of this magnitude. See “Investment for Growth”, Eunomia for WRAP/REalliance (forthcoming) 32 This is pieced together from various sources and excludes recycling – see L2 m4/1. It is likely to be a similar order of magnitude to the more precise figure being developed in the WRAP work.
Level 2 reports Level 3 report
L2 m4/1 Reuse & the third sector L3 m3/6 (T) Attitudes & behaviour – reuse
L2 m4/2 Retail solutions – refillables & self-dispensing systems
L2 m4/3 Product service systems

WR1204 Household Waste Evidence Review | A report for Defra L1 m1 Executive report
October 2009
11
Large appliances and bulky waste are more easily captured for reuse; most small WEEE goes to
landfill, either because of low consumer recognition that it can be reused, or it not being accepted by
collections or charities [39].
Between 800 and 1,200 third sector organisations provide recycling and/or reuse services [40; cited in
28, 29, 30]; in addition there are 7,500 charity shops in the UK 33.
Reuse charities and enterprises divert (not necessarily reuse) 90,000 tonnes of bulky waste and have
helped 750,000 low income households to acquire appliances and furniture [41].
170 community composting sites (existing in 2007) composted 12,500 tonnes of organic waste [31].
Third sector involvement in waste activities is characterised by a large number of small charities and a
handful of large social enterprises, plus nationally co-ordinated charity shops. Social objectives are often
(but not always) the prime motivation for the organisation, with waste activities being the means of
achieving those objectives, and such organisations can often have an important role in wider economic
development and regeneration. An organisation‟s orientation – whether it sees itself as a „waste business‟
or not – shapes its capabilities and role as a waste operator/contractor [29]. The dominance of third
sector organisations is a special feature of reuse activity in the UK and different models may be observed
in other countries [42]. Examples exist in Europe where there is a more developed second hand retail
sector and/or greater integration of reuse organisations with the local authority bulky waste
infrastructure: Flanders is a notable example of the latter (L2 m4/1 & L3 m5/1 (T)).
Barriers and success factors
Barriers cited in the literature are summarised in table 2 below. The success factors for these kinds of
organisations are a mirror of the barriers. They include in particular:
Funding and business development support – many of the barriers to capacity, effectiveness and
growth are being addressed in the Defra/WRAP supported REAlliance programme, a community
interest company led by a consortium of four third sector organisations that is providing support to
third sector reuse organisations34.
Co-ordination with local authority activities – most often where activity is formalised in service level
agreements. Some authors cite this as a key barrier where it is not seen [e.g. 37]; or show a
correlation between levels of reuse activities and authorities which have service agreements with
reuse organisations [24]. The Flanders example shows how a package of policy provisions (including
reuse targets, special exemptions, allowances, employment subsidy and tax treatment of reuse) can
support the development of an integrated reuse sector.
33 http://www.charityshops.org.uk/ 34 See Defra‟s Third Sector Strategy which announced the set up of the REconomy capacity building initiative supported by Defra and
WRAP. See http://www.defra.gov.uk/corporate/how-do-we-work/third-sector/strategy/documents/Defra-Third-Sector-Strategy-1108.pdf

WR1204 Household Waste Evidence Review | A report for Defra L1 m1 Executive report
October 2009
12
Operational Funding – tendency of some to rely on grants Capacity, lack of enterprise culture, business
skills, & governance Decline in quality of material donated for reuse –
result of „fast fashion‟ and „flat-pack furniture‟ Logistics – high cost of property; large storage
requirements The „rules‟ for bulky waste collection services may
mean items are easily damaged – e.g. leaving items exposed to rain/vandals at kerbside; type of vehicle used to collect
Consumer Lack of visibility/knowledge of reuse options –
donation or purchase Most bulky waste taken to HWRCs – reuse
organisations prefer collections to maintain quality
Stigma around second hand purchase, especially if linked to charity (L3 m3/6 (T))
Perception of bulky waste collection service – sometimes seen as inconvenient or expensive
Policy/regulatory Delays & changes in the implementation of the
WEEE directive (though forthcoming revisions are expected to have a positive impact)
Perverse incentives created by relative prices of waste treatment options – reuse “chronically undervalued” [24]
Planning regulations & waste management site licensing (for community composting)
Conditions & thresholds for exemption from the Animal By Products Regulations (ABPR) (community composting)
Relationship with local authority bulky waste Lack of strategic planning for reuse in bulky waste
services Lack of co-ordination between LAs and third
sector (except where service level agreements are in place)
Lack of co-ordination within LAs between social
services (potential clients) and waste services (suppliers)
No consistent practice with respect to payment of re-use credits to third parties
Shift towards integrated waste management contracts – possibility that small organisations are ineligible/unable to tender
Table 2 Barriers to the growth and development of third sector organisations and reuse infrastructure
Potential contribution of reuse and the third sector to waste prevention
Authors are generally optimistic about opportunities and growth for reuse activities, both generally and
involving third sector organisations. Revisions to the WEEE directive are expected to increase reuse
activity: Furniture Recycle Network (FRN) have suggested it might increase appliance reuse from ½
million items a year to 1 million [41]. Stakeholders consulted during the review also suggested that the
new national indicators for local authorities35 (with the inclusion of reuse) may encourage authorities to
pursue reuse as a means of achieving landfill diversion.
Community and social benefits
Strengths of third sector reuse/recycling organisations identified in the WREP studies included:
Innovation and creativity, including trial of concepts before mainstream markets develop;
Serving (social or market) niches that would otherwise not be covered by mainstream services;
Leverage of additional resources (e.g. through volunteering);
Strong ties with the local community, which may enhance education and communication activity;
Job creation for low skill workers or the long term unemployed;
Supply of appliances and furniture to low income households (the Furniture Reuse Network (FRN) and
London Community Recycling Network (LCRN) both suggest that demand currently exceeds supply).
One study [28] set out to calculate the Social Return on Investment of community waste organisations
but with limited success.
Carbon reduction benefits
Reuse of bulky waste [24] can lead to a carbon dioxide saving of 4.2 tonnes per tonne of furniture or
appliances reused, and 19 tonnes per tonne of reused textiles36. The 21,500 tonnes of organic material
35 http://www.communities.gov.uk/publications/localgovernment/finalnationalindicators 36 LCRN say the estimates have provisional approval from policy officers at Defra and WRAP. The saving is derived from avoidance of replacement manufacturing of new goods.

WR1204 Household Waste Evidence Review | A report for Defra L1 m1 Executive report
October 2009
13
composted at community compost sites in 2007 approximated 1,850 tonnes CO2 equivalent emissions
saved [31, using Defra guidelines].
Tonnage
Reuse of bulky waste (including WEEE) and textiles currently amounts to around 500,000 tonnes per
year. Authors agree that there is significant potential to capture many more items for reuse (and
recycling), and so contribute to diversion from landfill:
Only 15% of bulky waste is reused, and a further 25% recycled, leaving more than 1 million tonnes
going to landfill or for incineration [37];
The UK generates 1.5 to 2 million tonnes of clothing waste a year, of which only 16% is recovered for
reuse or recycling [43].
At national level, authors suggest that reuse of between a quarter and a third of bulky waste would
be feasible if best practice approaches are adopted, including better integration of third sector and local
authority infrastructure [37, 38, 44]. This would be equivalent to around double the present tonnage37.
Where it has been estimated at local level (in London), authorities are currently achieving 0.1 to 3.7
kg/hh/yr reuse on average [24]. Similar projections are not available for textiles, though Defra‟s
sustainable clothing action plan is investigating how greater recycling and reuse can be achieved [43].
No reliable evidence was identified on tonnes reused through commercial and private second hand
channels, or through Freecycle, though indicative estimates calculated from data in various sources
suggest anywhere between 8kg and 25kg per Freecycle member per year.
4.3 Retail solutions – refillables and self-dispensing systems
Coverage of the review
The review was concerned with packaging options that require active involvement of households/
consumers in making alternative choices. Other retail packaging solutions are largely passive as far as
the household is concerned (e.g. light-weighting38 or mandatory deposit return schemes39) and were
excluded from the review. Working with Boots, a WREP study [32] explored 15 possible options for a
lower weight refill to use with an original primary cosmetics pack when it is empty. Other evidence came
from the WRAP retail innovation programme which included two studies on international experience of
refills and their applicability to the UK [34, 36] and one study on store based self-dispensing systems
[35].
Current situation
The share of refillables in packaging has been in long term decline, replaced by single-use (also known as
single-trip or one-way) options. For example, the market share of refillable milk bottles has declined from
94% to 10% (during 1974-2006), for beer containers from 33% to 0.3% (1961-2006) and for soft drinks
from 46% to 10% (1980-1989) [36]. Refillables are available in the UK but demand has not taken off
among consumers or retailers [32, 36].
Both refillables and self dispensing systems (SDS) are more established in some other countries including
the US and the Asia Pacific region, where different consumer cultures (less frequent shopping, more bulk
37 Precise tonnage projections are not feasible because baseline estimates vary between authors, depending on their definition of reuse
(e.g. reuse from all bulky waste including council collections; tonnage from reuse organisations only). There are no official waste
statistics on reuse; WRAP recently commissioned work to size and characterise reuse to support its work in the sector. 38 See “Packaging optimisation: the impact to date” on the WRAP website for information on retail packaging solutions. 39 Mandatory deposit schemes are covered in detail in other Defra research: WR1203 ERM (2008) for Defra. Review of Packaging
Deposits System for the UK.

WR1204 Household Waste Evidence Review | A report for Defra L1 m1 Executive report
October 2009
14
buying) and awareness of environmental benefits play a part [34]. Self dispensing is found mainly in food
stores specialising in fresh/organic/health food products40.
Barriers and success factors
Authors generally agree on the main barriers to greater take-up of refills (summarised in table 3). A
central conundrum is that consumers expect refills to be cheaper than original products; yet being
cheaper can also convey a sense that the product is lower quality. Perception also plays an important role
with retailers and producers, in particular a perception that retail volumes will be too low to generate
acceptable profits. Notably, consumers like the fact that refills confer environmental benefits, but this is
not found to be a primary motivation for purchase.
Consumer Expectation that the refill will be (much) cheaper Lack of significant discount (real or perceived)
between original and refill pack Perception that refills may be lower quality Making the pack too small makes consumers
think they are getting less value, even if quantity is the same as the original
Lack of awareness/worries about availability Lack of understanding about how refills work Needing to be organised Fear about „lock-in‟ to particular product Concerns about hygiene in open access SDS Lack of branding on self-dispensed goods
Retailer Shelf-space requirement of stocking original and
refill versions of product – UK has greater product proliferation than, e.g., the US
Stock management Perception of low market volume & impact on
profits Mess & wastage from spillage (SDS) Possibility of needing staff to support customers
in using SDS
Producer Worries about cost of either refitting production
lines to make refills, or sourcing additional suppliers
Risks to brand image/perception of quality (esp. in relation to scuffing of reused glass; control where refill requires dilution)
Potential loss of product identity & consumer „lock-in‟ if container design becomes generic
Perception of low market volume & impact on profits
Table 3 Barriers to the take-up of refills & self dispensing in the UK
Factors that are found to encourage consumer interest in refills include:
They are lighter and so more transportable for people without cars
They take up less room at home (a reason why a bulk buying culture in the US favours refills)
Consumers are already engaged with a brand; the refill is an extension of the offer
If the overall consumer offer of original-plus-refill conveys a sense of a quality or a premium product
to the consumer
If they are cheaper (as long as the product still conveys a sense of quality)
To reduce waste (but very much a secondary motivation after price and perception of quality)
The overall consensus in the literature is that refills need to be presented as a premium product at the
same price, or at a lower price, so that consumers believe they are benefitting from switching.
Counter to some of the perceptions identified, the WRAP feasibility studies [34] found that both refills and
self dispensing systems can generate cost savings for retailers and consumers. WRAP also suggest the
voluntary agreements should be considered as a mechanism for overcoming barriers and for improving
consumer messaging on the benefits of SDS. Across WRAP‟s international case studies, consumer cost
savings were 26% on average [34]. SDS is also observed to encourage consumers to buy smaller
portions, which could offer potential for reducing food waste.
40 Though see also WRAP‟s current trial of a SDS for laundry products: http://www.wrap.org.uk/wrap_corporate/news/wrap_retail_trials.html
WR1204 Household Waste Evidence Review | A report for Defra L1 m1 Executive report
October 2009
15
Potential contribution of refills and self dispensing to waste prevention
There is a significant problem in estimating the potential contribution of refills and SDS to waste
prevention at UK level, because impacts and benefits cannot be generalised across products [34, 36]. The
case for refillables needs to be assessed on a product by product basis because the LCA benefits are so
variable [36]. In particular, less packaging in refills needs to be set against factors such as relative
recyclability of primary pack and refills, logistics impacts, and whether the consumer sustains a shift to
refills.
Indicative estimates are given in the various studies for individual products or models. In the Defra WREP
study [32], for each individual product sold (rather than total tonnage for that product) a weight
reduction of 60% - 90% was estimated on the basis of usage over a six month period. When recycling
benefits are added, weight reduction would be 77% - 81%. Taking into account assumed sales volumes
as well as product weights, the WRAP refills study reported the following indicative impacts on total
tonnages of different refill options:
Glass instant coffee jars supported by soft pack refills: 77,000 tonnes pa
Soap pack pump dispensers supported by lidded packs: 4,000 - 7,000 tonnes pa
(the higher figure being if the refill is a bulk container providing several refills)
A trigger household cleaner dispenser supported by a capped bottle:7,500 tonnes pa
A soap dispenser supported by pouch refills: 5,000 tonnes pa
Deodorant stick dispenser supported by shrink wrap refills: 10,000–11,000 tonnes pa
The indicative savings for self dispensing systems were rather less. Illustrative examples included a 70
tonne reduction from cornflakes, 26 tonnes from coffee (assuming it replaces jars), and 86 tonnes for
detergent cartons.
4.4 Product service systems (PSS)
Coverage of the review
This part of the review focused on one very specific study by Cranfield University (in conjunction with
house builder Taylor Woodrow) of a particular application of the concept of product service systems [33].
The general idea of PSS is that consumers purchase some sort of service instead of owning a physical
product, thereby reducing the number of goods they own and eventually throw away (e.g. appliances).
The specific form of PSS tested was result orientated PSS – where the consumer has no contact with the
product and simply buys an outcome, for example, clean clothes or a tidy garden. PSS concepts were
developed in the study for:
Home improvement
Garden maintenance
House cleaning
Laundry (clothes & linen)
In the concepts tested, the PSS would be delivered through either a regular subscription or an ad hoc call
out. The service would be administered by the housing developer through a call centre for consumers and
service contracts with suppliers. The concepts were tested with consumers and staff from the developer
in separate workshops, while potential waste and other environmental benefits were estimated
quantitatively for different scenarios.

WR1204 Household Waste Evidence Review | A report for Defra L1 m1 Executive report
October 2009
16
Motivations, barriers and opportunities
Key findings on reactions to the concepts are summarised in table 4.
Consumer House builder & supplier of service
Motivations Buy service to free up time – more attractive to
higher income, working households To avoid chores perceived as unpleasant Where residents lack confidence in own
competence (e.g. DIY) PSS preferred for home improvement and
gardening more than home cleaning or laundry More interest among those still furnishing their
new homes than longer term residents
Opportunities Potential revenue & moderate profit stream Added value after-sales service to new residents
of housing developments
Barriers
Enjoying the task being targeted (e.g. gardening) Cost (if time trade-off considered insufficient) Suspicion about competence of service provider Concern about loss of convenience/needing to be
at home to receive service
Barriers
Concern about lack of competency in service supply which could dilute core profitability
Uncertainty about volume of demand – and therefore profit risk
Lack of regulatory stimulus (e.g. through planning or environmental regulations)
Sacrificing a building plot to house the service centre, which would need to be costed into the business case
Table 4 Key findings on reaction of consumers and service providers to product service system concepts
Consumers were generally interested in the idea of PSS but were reluctant to consume it as a substitute
for owning products; they tended instead to prefer PSS as a complement to „self service‟ (SS) – that is,
being able to do the task themselves when they wanted to, meaning that they would need to own the
relevant appliance as well as using the PSS. The main condition influencing whether or not consumers
liked the idea of PSS was a standard economic trade off between time and money. Those on higher
incomes but time constrained were more likely to favour PSS than those on low incomes or retired.
Potential contribution of housing based PSS to waste prevention
The study suggests that product service systems may reduce the amount of WEEE from households on
new developments by 13 tonnes over 10 years on a 200 household eco-development, most of
which (8.8 tonnes) comes from washing machines through avoided ownership or smaller appliances41.
Critical to the impact calculations are assumptions about substitution of large appliances for smaller ones
which households then keep for longer than usual (15 years as opposed to 7). The assumption here is
that consumers hold onto appliances until the end of their operational life, rather than replace them
because of aesthetics, fashion or upgrading to the latest technology.
Cooper [45] shows that the latter reasons are, in fact, key drivers of short product lifespan. There are
also significant consumer barriers to keeping appliances in working order, including moderate to low
interest in repairs [45 & L3 m3/1 (D)] and a systematic tendency to over-estimate the cost of repairs
[46].42 The Cranfield study‟s authors also warn that actual consumer behaviour is a substantial unknown,
since the models were tested as hypothetical „what ifs‟. They recommend that piloting and monitoring of
PSS on new developments would help substantiate their findings, for example on new social housing
schemes or in Eco Towns.
41 Key assumptions are: 100% adoption of PSS; 80% ownership of smaller washing machines & vacuum cleaners; 25% ownership of
drills & lawnmowers. 42 Product lifespan is not covered in detail in this review, even though it is likely to be of fundamental importance to waste prevention.
WR0107 [49] for example, ran a modelling scenario which showed that doubling product lifespan could have a significant impact on household goods arisings (L3 m5/1 (T)) . Further sources on product lifespan are signposted in L2 m4/3 & L3 m8/1 (T).

WR1204 Household Waste Evidence Review | A report for Defra L1 m1 Executive report
October 2009
17
5 Policy measures: encouraging This section provides a summary of the literature on policy measures to encourage waste prevention. It
includes measures that:
already operate in England but where evidence suggests that impact could be greater if
implementation mechanisms are modified;
are in place in other countries but not in England;
are not in place anywhere in Europe but which one or more studies reviewed suggest might offer
benefits as part of a waste prevention portfolio.
The review covers policies which would need to be co-ordinated at national level, and policies where local
authorities would need to take a lead in implementation. The selection of policy measures included in the
review was shaped by what was found in the evidence base.
Inclusion of a policy measure in this evidence review should not be taken to imply that it has
been or will be endorsed by Defra as an option for England. Further, in many cases Government‟s
role is to provide a suite of measures or a „toolkit‟ of options, from which local authorities can then select
those most suitable for dealing with the challenges they face. Having provided the tools, Defra does not
seek to force their take-up by authorities, preferring that they make decisions about what will work for
them locally. For example, powers to pilot financial incentives schemes in England were introduced in the
Climate Change Act 2008. So far no authorities have chosen to put forward a proposal for a scheme,
though the powers remain on the statute book for use if an authority decides that such an approach is
right for its own circumstances.
5.1 Coverage of the review
One of the WREP studies by Eunomia et al [46] undertook a large scale strategic review of policy options
for waste prevention. The options included in the present review were shaped by that study, as well as
the scoping exercise and suggestions from the project steering group. The evidence review focused
particularly on policy measures that would impact directly on households or household waste prevention.
Broader policy measures (such as the landfill tax escalator, business or schools waste) were excluded.
Related modules are:
Level 2 reports Level 3 reports
L2 m/2 Policy context L3 m5/1 (T) Future waste growth, modelling & decoupling
L2 m/5 Policy measures – encouraging L3 m5/2 (D) International review
5.2 Possible policy options and implementation issues
Table 5 below summarises the range of policy options identified in the literature, indicating their
rationale, current status in England, and issues flagged in the evidence in relation to maximising the
benefit of each measure. The potential quantitative (tonnage) impact of each measure (as reported in the
literature) is also shown in the table and discussed in section 5.3.
Overall, the review identified policy measures that either have already been considered by Defra or are
already in place in some form in England. Several studies covered by the review (references are
provided at the end of table 5) considered the issue of direct charging for household waste and concluded
that this policy option offers significant benefits for both recycling and source prevention. International
experience (L3 m5/2 (D)) also suggests strong positive prospective benefits from this option. As has
already been mentioned, this option is not being pro-actively pursued by Defra, but is included in this
WR1204 Household Waste Evidence Review | A report for Defra L1 m1 Executive report
October 2009
18
review for the sake of completeness. Once again, its appearance in this document should not be taken
as an implication of endorsement by Defra.
The international experience (L3 m5/2 (D)) also suggests that waste prevention is most effectively
tackled where a complementary package of measures is in place – including prevention targets, producer
responsibility, householder charging, public sector funding for pilot projects, and collaboration between
public, private and third sector organisations, and intense public awareness/communications campaigns.
Government funding for campaigns is not traditionally treated as a „policy measure‟ but it can be an
effective lever for raising the visibility of prevention and encouraging new norms, as demonstrated by the
WRAP-led Love Food Hate Waste campaign in the UK which prevented 137,000 tonnes in its first year.43
43 Consumers save £300 million worth of food going to waste (14.01.09), WRAP Press Release,
http://www.wrap.org.uk/wrap_corporate/news/consumers_save_300.html . Accessed 19.03.2009

WR1204 Household Waste Evidence Review | A report for Defra L1 m1 Executive report
October 2009
19
Policy option Rationale Current situation/status Further issues Potential impact
Household behaviour (through local waste services)
Waste collection scheme
design (e.g. alternate weekly
collection (AWC),
residual bin sizes, no side
waste policy, etc.)
Restricting capacity for residual waste
while maximising options for recycling
encourages households to think about waste prevention as well as recycling
National policy is to allow local
authorities to choose system
appropriate to their area WRAP guidance on AWC
AWC known to be linked to reduced
total HH waste but little evidence of
relative contributions of source reduction and recycling
More evidence forthcoming in Defra
waste growth and composition
reviews44
4-13% reduction in total
household waste from
recycling and source reduction combined
(WRAP estimate)
Equivalent to ~0.69 million
tonnes
Direct variable householder charging &
financial incentives
Costs borne by residents are proportionate
to how much waste each produces (e.g.
like utilities)
Charging by „unit‟ of waste produced sends
direct signal to household to recycle or
prevent waste
Can reward high recyclers/low waste
producing households
International evidence shows both recycling & source reduction impact
Provision made in Climate Change Act
for 5 local authorities to pilot
incentives schemes
No applications so far received by
deadline
„Evidence suggests that a regular
and convenient recycling service needs to be in place for charging to
be effective as a residual waste
reduction measure; and that
complementary measures may be
needed to avoid either simple
diversion (e.g. to HWRCs) or fly
tipping.‟
1.0 million to 2.5 million
tonnes
(reduction in LA collected
waste based on scenarios –
percentage reductions from
2006 Defra study applied to
updated 2008 Defra waste
statistics for baseline)
Producers & retailers
Reducing quantities of
junk mail*
Producer responsibility agreements provide
incentive for recycling and promotion of
junk mail opt outs Producers can be mandated to contribute to
recycling collection costs (e.g. France)
Other measures (not in place in England
currently) include stronger incentive or
enforcement for junk mail opt outs– see
col. 3.
Voluntary agreement between
government and Direct Mail
Association Targets for recycling of direct mail of
70% by 2013
Prevention mechanism through Mailing
Preference Service
MPS opt out available for many years
(15% of HHs registered with MPS)
Opt-in (or similar) provision under
consideration
Other options mentioned in the
literature:
Increase postage charge on bulk mail
Tax or levy on junk mail
Legislative backing of „no junk mail‟
stickers, allowing LAs to enforce
them
Requiring all direct mail to have MPS
details
119 k to 223 k tonnes
direct mail could be avoided
(scenarios based on package of „other options‟)
Extended product
warranties*
Encourage longer product lifespan of
products, reducing need to replace
Would be communicated to consumers
through product labelling
Resulting change in consumer demand
would influence production of more durable products
Does not currently exist in Europe
Would need to be implemented at EU
level
Not suitable for products with high
“in-use” environmental impacts
(need to be guided by life cycle
assessment (LCA) of product)
Unknown
44 Resource Futures for Defra WREP (forthcoming), Understanding Waste Growth at Local Level WR0121. See also Resource Futures (forthcoming), Municipal Waste Composition: A Review of Municipal
Waste Component Analyses.WR0119.

WR1204 Household Waste Evidence Review | A report for Defra L1 m1 Executive report
October 2009
20
Minimum standards for
appliances*
Waste/resource impacts included in eco-assessment for product labelling
Product labelling informs consumers‟
choices
Encourages producers to „design out‟ waste
Various labels in use – including EU Eco-label - but currently not widely
recognised or effective at
communicating waste/resource
impacts & benefits
Best implemented at EU level Could be built into the EU Eco-Label
scheme
Stricter options would include:
- compulsory labelling for
weight & durability
- mandatory minimum criteria
Unknown
Mandatory use of
rechargeable batteries in
new products*
Reduce quantities of hazardous waste by
increasing length of „time in use‟ of
batteries
Policy option would extend beyond
households
EU Batteries Directive comes into force
in England in May 2009
Introduces producer responsibility
requirements
Focus on collection and recycling; no
provision made for mandating
rechargeable batteries
Need a law requiring the use of
rechargeables or law banning use of
single-use batteries through EU
Batteries Directive implementation
Raising targets for battery recycling
could encourage prevention as well
Unknown -
market for small household
batteries currently 20 k
tonnes pa
Other producer
responsibility
agreements*
Producers bear costs of waste disposal of
their products which (in theory)
encourages waste prevention and recycling
Expected to influence product design
Schemes in place at UK levelfor
Packaging and WEEE
Proposed upward revisions to WEEE
directive targets include specific
reference to reuse of whole appliances
for first time
Little evidence of strong impact on
prevention – compliance
mechanisms tend to favour recycling
Collection costs currently greater
than compliance costs, so LAs bear
cost burden
Potentially significant but not
known precisely
Indicative potential of 250 k
tonnes cited for packaging
(based on assumption of 5% „prevention effect‟)
Material or sector based
voluntary agreements
In addition to or complementary to
producer responsibility
Various in places in England
Direct mail (see above)
Courtauld Commitment – major
retailers have voluntary target for absolute reduction in packaging waste
and help cut HH food waste by 155 k
tonnes, both by 2010
Carrier bags – voluntary agreement
signed with retailers in 2008
Achievements:
80 k tonnes pa
packaging (2008) =
zero waste growth 137 k tonnes pa food
waste (2008)
23 k tonnes carrier
bags since 2006
Collaborative
procurement
(joint public sector
procurement to eco-
standards)*
Encourages producers to offer most
environmentally advantageous products
Potentially drives product innovation
towards low waste products
Limited impact on household waste – spin-
off to domestic products unknown
Various initiatives in place in central
and local government to „green
procurement‟
Waste not necessarily priority –
benefits need to be set in LCA context
Unknown
Immediate impact on HH
waste probably small - but
potentially significant impact
on product design, including
resource use in manufacture
& products
Local authority waste management
Home composting
inclusion in LATS*
Provides a financial incentive for LAs to promote home composting
Decline in residual waste arisings observed
where HHs home compost
Modelling suggests significant cost savings
possible for collection services
Current system may divert garden waste
into household stream where it is collected
free of charge
Not currently included in LATS calculations
Authors & stakeholders argue that this
non-inclusion gives perverse incentive
to LAs to maximise collection of
biodegradable waste – rather than
promote home composting
Would require change in LATS calculation methods
Data issues – modelling work by
WRAP under consideration by Defra
Spending on promotions and
communication required to maximise
impact
1.4 million tonnes pa (projection for 2020 assuming
50% HH participation)

WR1204 Household Waste Evidence Review | A report for Defra L1 m1 Executive report
October 2009
21
Stimulating re-use of
durable goods*
Reuse extends product lifespan, reduces waste to landfill & has carbon saving
benefits
Only ~15% of bulky waste currently
reused
Most disposed through LA collection
channels/HWRCs
Reuse rate for bulky goods in LA channels
(collection & HWRC) only ~2-3%
No national targets but reuse included in new national performance indicators
for LAs
Higher targets and inclusion of reuse
in WEEE Directive revisions expected
to boost reuse sector
National guidance on optimising bulky
waste collections
REconomy programme supporting
capacity development of third sector
reuse organisations
Data coverage & quality of reuse sector is weak
Better integration & strategic
planning of LA and third sector
services needed
Options might include:
- service level agreements with
third sector
- single customer contact point
for collection service in each
authority - „first call‟ of reuse
organisations on bulky waste
- financial incentives for reuse
organisations
No standard LA practice towards
payment of reuse credits to third
parties
~500 k tonnes of bulky &
textile waste currently reused
Optimised reuse rate ~30%
of bulky waste arisings
(double present level)
Indicative scenarios of 215 k
tonnes of furniture & 100 k
tonnes WEEE (but limited to reuse
organisations)
30% reuse of all bulky waste
would be equivalent to higher
tonnage than scenario
Local authority targets
for waste prevention*
(potentially supported by
levy for missed targets)
Target for residual waste (reducing over
time) encourages LAs to consider all
means of reducing waste, including
prevention
Targets for residual waste in Waste
Strategy 2007 (see section 1)
New national indicator for residual
waste
No specific target for waste prevention
(as distinct from residual waste)
Levies for missing targets used in
some countries to support progress
to target
Levy may be used in conjunction
with direct householder charging
Examples of specific targets in other
countries (e.g. Flanders reuse target; Wallonia levy)
3+ million tonnes
(scenario modelling based on
Wallonia; depends on
configuration of target and/or
levy)
Implementation plans for WP *
Dutch experience shows it can bring key
stakeholders from whole product lifecycle
together to draw up strategic plans
(„covenants‟) for particular material streams & lead to reduction
EU Waste Framework Directive
requires waste prevention plan – may
be opportunity to encourage LAs to
draw up WP plans Some activity in UK sustainable
product roadmaps – though end of life
less prominent than energy/materials
in current roadmaps
Requires well facilitated stakeholder
processes
Unknown but potentially
significant
Impact on HH waste less
clear than on commercial waste
Restrictions on landfill
Restrictions on particular materials
increases treatment costs & encourages
waste prevention
Defra considering introduction of
further landfill restrictions – research
commissioned exploring key
experience in other EU countries
Unknown but potentially
significant
Table 5 Summary of evidence reviewed on policy measures for waste prevention *Indicates measure was included in the Eunomia et al study [46] Key sources are [46] and various WRAP reports [23] & press releases. Other references for policy measures are [48-58] & [26]. Also draws on references in section 4. See L3 m8/2 (D) for full list of
sources
WR1204 Household Waste Evidence Review | A report for Defra L1 m1 Executive report
October 2009
22
5.3 Potential contribution of policy measures to waste prevention impacts
Confronted by the evidence presented in table 5, policy makers face a number of challenges:
figures for tonnage impact are based on widely differing methodologies (some are derived from
empirical research; some are based on case studies; some are based on modelling)
some policy options have „unknown‟ quantitative impact
the range of tonnage impacts – from 20k tonnes per annum to 3+ million tonnes per annum – is very
wide
impacts relate to different waste prevention behaviours which, as we saw in chapter 3, are very
diverse
impacts would appear to be in part a function of wider social, institutional and political conditions
most measurement of impacts has been in terms of tonnage diversion. For policy purposes, one also
needs to consider both the carbon and the cost impacts, as well as the qualitative impacts which are
not amenable to measurement.
The research team‟s reflections on these challenges are presented in the final section of this executive
report.
6 Monitoring and evaluation
As we have just seen, data on the impact of various waste prevention measures cannot currently be
easily assembled into a format that permits straightforward decision-making by policy-makers. If local
authorities, Defra and other stakeholders are to make robust decisions, robust and high quality data are
required (on tonnage, carbon and cost impacts, as well as information on less tangible qualitative
impacts).
The means by which such data and information are secured – through monitoring and evaluation – can
be difficult, and are characterised by a number of sensitivities. If policy makers are to further develop
their capacity for evidence-based policy making, however, they will need to overcome these difficulties
and manage the sensitivities. This section of the executive report presents what has been learned from
the review about monitoring and evaluation so as to support such efforts.
6.1 Coverage of the review
The number of robust waste prevention evaluations is currently small [5, 17]. Often, evaluations report
on projects targeted at groups of volunteers, rather than general populations. In addition to the general
literature, WREP projects provide useful examples of M&E approaches in different contexts [2, 3, 4, 5].
Further detail on the range of approaches, their strengths and weaknesses, the evidence sources
reviewed and references can be found in further modules:
Level 2 report Level 3 reports
L2 m6 Monitoring and evaluation L3 m3/3 (D) Impacts of public campaigns & interventions
L3 m6/1 (D) Approaches to monitoring and evaluation
WR1204 Household Waste Evidence Review | A report for Defra L1 m1 Executive report
October 2009
23
6.2 Approaches to monitoring and evaluation
Household waste prevention is notoriously difficult to measure, the key problems being:
We can‟t see it – participation cannot be observed visually as it can be with recycling.
We can‟t know if it has happened even if the amount of waste collected falls – disaggregating
prevention from recycling effects is difficult and diversion to other channels is possible (e.g. HWRCs).
Even where we can classify changes as waste prevention we can‟t know whether this is either
accidental or maintainable – if a consumer buys a light-weighted bottle this week they may or may
not have intended to – and they may or may not repeat the behaviour the next week.
A variety of different approaches to the measurement problem were identified in the review:
Approach
Context applied
Self-weighing, monitoring or reporting
Working with volunteer households to prevent waste. Households weigh, or observe, or audit the amount of waste they produce and record this using diaries or feedback sheets.
Use of collection round data to accurately measure waste arisings
Uses a mix of monitoring techniques, e.g. tracking waste arisings via waste tonnage / collection round data and surveys, upon which to evaluate impact of campaigns.
Control and pilot groups to compare changes so that changes in waste arisings can be accurately measured
To compare performance in an area targeted with an intervention with a comparable area where no intervention happens.
Attitude and behaviour surveys including metrics, interviews and focus groups (outcome focused)
Before, during and after surveys which are based on declared participation, attitudes, behaviours. At times attitudes and behaviours are also captured through diaries. Surveys are typically used to estimate how many people do a particular action; focus groups are used to uncover why they act and/or their response to campaign material.
Participation surveys (or participation monitoring) including enquiries to help lines, web statistics, publications disseminated, etc.
To gauge the reach of the initiative proposed – at times this can be either actual (e.g. web hits) or claimed participation. Also monitors the uptake of incentives, e.g. nappy vouchers, sale of home compost bins, or registrations to the Mail Preference Service.
Compositional analysis To understand the impacts of initiative across different waste materials.
Conversion factors, estimates and modelling
Using conversion factors, proxies and ratio model with available detailed figures on consumption and waste generation.
Hybrid approach - a combination of any one or more of the above approaches
Uses a mix of monitoring and evaluation techniques.
Table 6 Monitoring and evaluation methods identified in the evidence review (for references see text in section 6.3)
6.3 Key issues relating to monitoring and evaluation approaches
In the evidence reviewed, there were no generally accepted monitoring and evaluation approaches which
could be applied more widely for measuring the impact of consumer waste prevention interventions (see
especially [5]); nor was there „off the shelf‟ guidance. In the reuse sector, the FRN‟s „Standard Weights‟ is
the accepted basis for calculating reuse tonnages: even so, reuse is a good example of a sector where
monitoring and evaluation is particularly difficult, and where there is considerable unease with respect to
relying too heavily on quantitative (tonnage) measures, as these do not reflect the social and other
benefits of reuse activities.
The review uncovered no formal evidence assessing either the scale or the impact of the sensitivities
associated with monitoring and evaluation. That these sensitivities are real was confirmed by the
engagement with stakeholders: issues associated with how householders feel about being monitored,
about media reactions to monitoring and about different political approaches to waste all have the

WR1204 Household Waste Evidence Review | A report for Defra L1 m1 Executive report
October 2009
24
potential to impact on decisions about monitoring and evaluation. The need for evidence in support of
policy development nevertheless remains.
Key insights about the various approaches reviewed were:
Self-weighing and diary data are widely used as an alternative to waste collection round data, and
can be an effective alternative to collection round data [2, 11]. Its use on a larger scale carries risks
because it is labour intensive if done properly and data quality can be poor [4].
The use of weight-based data needs to be complemented by qualitative and survey evidence.
Surveys in most cases worked well, however various issues need to be taken into account:
o Good sample design, including large sample sizes;
o The risk of small samples in some engagement models;
o Self selecting and unrepresentative samples;
o Self reporting, e.g. tendency to over-estimate waste reduction impacts.
Short term evaluations provide no indication of sustained behavioural change. However, longer term
approaches reveal sustained change can occur.
Pilot trials and large-scale projects tend to have more rigorous monitoring regimes and as a result
tend to have better data.
Small group (volunteer) approaches where there is drop out from baseline to follow-up surveys can
compromise sample sizes and statistical robustness.
6.4 Barriers to progressing monitoring and evaluation
The key monitoring and evaluation barriers discussed in the evidence are [see in particular 3, 4, 5]:
Lack of funds, lack of staff capacity, lack of skills (including data analysis), non-availability or
unsuitability of data, unexpected problems [4, 5];
Projects were also not always able to estimate the cost of monitoring, the resources required, or
likely sample sizes before starting, meaning that monitoring had to be abandoned or revised [5].
Action research using experimental approaches may be particularly prone to this issue [4];
Even where changes in waste arisings or behaviour can be reliably measured, it can be difficult to
distinguish the impact of a waste prevention initiative from the impact of other factors, e.g. influence
of national campaigns [5, 19];
Use of collection round data is inappropriate for non-geographically based interventions;
The need for longitudinal data for monitoring and evaluation can pose a problem. One study [5]
recommended that baseline data for at least a year should be gathered before a waste prevention
initiative is launched and the evaluation should track progress over time to see if change is sustained.
6.5 Opportunities for progressing monitoring and evaluation
Various suggestions are made in the evidence base for taking forward activity on monitoring and
evaluation, including:
Investigate the cost implications for each approach to present a „pick and mix‟ selection of
approaches to operators.
To consider the development of further waste prevention metrics (beyond WRAP‟s committed food
waste reducer and home composting).
Further insight could be gained from evaluations on a selection of past projects to see if behavioural
change / tonnage reductions have been sustained.
A clear steer is needed on reporting priorities for carbon, tonnages, volume and cost when it comes
to evaluating waste prevention initiatives.
Explore linking waste prevention on a national level to personal consumption expenditure rather than
GDP to allow for measurement of impact on product groups or market activity.

WR1204 Household Waste Evidence Review | A report for Defra L1 m1 Executive report
October 2009
25
In addition, WRAP is currently revising its monitoring and evaluation guidance which should encourage
further movement towards best practice approaches. Guidance is also being provided on how to develop
strategic targets for waste prevention via the Waste Prevention Toolkit. The toolkit will be supported by
a training programme for Local Authorities to help bridge the skills gaps outlined above. In its new
guidance, WRAP has also developed a series of recommended waste prevention survey questions.
Sources in the review, and the present authors, concur that there is no further benefit to be obtained in
trying to collate evidence from past waste prevention projects. A more promising way forward is to
ensure that evidence is captured and collated into a common resource as it is generated.
7 Stakeholder engagement feedback
7.1 Scope of the stakeholder engagement
Given Defra‟s definition of evidence (see section 1), a programme of engagement with stakeholders was
specified in the research brief. The purpose of the engagement was primarily to:
Draw into the evidence base stakeholders‟ experience of working on waste prevention
Help to identify gaps in the evidence
Gauge views on the barriers and opportunities for progressing waste prevention
The engagement programme involved four workshops in London (2), Leeds and Bridgwater, together with
two stakeholder surveys, one in the evidence scoping phase and one during the development of the
analysis.
In all, 148 stakeholders (practitioner, policy and academic) attended workshops; 106 responded to the
Wave 1 survey; and 148 responded to the Wave 2 survey. Further details of the stakeholder engagement
are given in modules L2 m7 and L3 m7/1 (D).
This level of engagement compares favourably with the consultation that contributed to England‟s Waste
Strategy 2007, in which 500 organisations submitted responses45. Nevertheless, it is inevitable that the
findings from an engagement process can only report on the basis of those engaged. The rest of this
section, which reports on the findings from the engagement, should be read on that basis. It should also
be recalled that the inclusion of or reference to any given policy should not be taken to imply that it has,
or will be, endorsed by Defra as an option for England.
7.2 Evidence gaps
Gaps were most frequently highlighted in the areas of waste prevention data, monitoring and evaluation.
Stakeholder views of the gaps concurred with the scoping exercise for this review. Stakeholders reported
that they need more evidence specifically with respect to:
‘Hard’ (i.e. statistical) data on the impact and/or potential of waste prevention activities –
including impacts of campaigns, relative benefits of different options, central guidance on actions to
prioritise, and LCA/carbon benefits for different options.
Guidance on accepted methods for measuring waste prevention – including techniques,
standardised benchmarks for measuring performance, and how to deal with issues such as attribution
and displacement effects.
45 “Review of England‟s Waste Strategy: A Consultation Document – Summary of Responses to the Consultation”, Dialogue by Design
for Defra, 2006

WR1204 Household Waste Evidence Review | A report for Defra L1 m1 Executive report
October 2009
26
Campaign messaging and evidence on successful behavioural change levers – most notably
understanding of consumer motivations but also how to target or segment audiences, what messages
are effective and lessons from best practice case studies. Recycle Now and Love Food Hate Waste
were frequently mentioned as exemplary models, supporting local authorities with thoroughly tested
messaging based on expensive research that no single authority could afford.
How the configuration of waste services can favour waste prevention – including robust
evidence on the impact of system design on recycling and source prevention (e.g. alternate weekly
collection or bin size) and cost benefit analysis of waste prevention versus recycling to help „make the
case‟ for prevention to local authority councillors (see footnote 16).
7.3 Experience of waste prevention – how to work with consumers
Workshop attendees were asked to list which waste prevention actions they think householders are
currently taking, what they think consumers should be encouraged to do and how people could be
motivated. These views were further tested in the wave 2 survey, where respondents were asked if they
agreed with the prioritisation of actions. Key findings on current household behaviour were:
The most mentioned actions that stakeholders thought households were already doing were using
Freecycle, eBay and charity shops, home composting, reusable nappies, avoiding junk mail, food
waste and plastic bags.
Bulky waste reuse and shopping related prevention behaviours were ranked lower.
The top five priority actions that workshop attendees thought households should be doing were:
Use re-use facilities
Develop a better understanding of what needs to be done, particularly the distinction between
recycling and waste prevention
Smart shopping (e.g. avoid special offers) and plan shopping
Buy less
Home composting
Renting of e.g. consumables and appliances and reducing food waste followed these top five.
A majority (74%) of survey respondents endorsed the five actions above, re-emphasising the need for
general attitudinal and behavioural change, as well as wanting to add food waste and junk mail to the list.
Three actions that would need to be taken by other stakeholders rather than households were also
flagged as priorities: producer responsibility; government action to enable and encourage prevention; and
education campaigns.
7.4 Perceptions of barriers and motivating actions
Key barriers were thought to be:
Consumer culture, understanding and knowledge
Lack of retailer partnerships with other stakeholders (e.g. local authorities)
Weak supply chain incentives (e.g. implementation of producer responsibility)
The nature of incentives operating on local authorities as a result of waste policy (a feeling that the
current system inadvertently favours recycling over prevention)
Lack of evidence of what works to support decision making
Lack of feedback to householders on waste performance

WR1204 Household Waste Evidence Review | A report for Defra L1 m1 Executive report
October 2009
27
Stakeholders think these factors, together, lead to inconsistent messages to households, and make it
difficult to define what the priority actions should be at local authority level.
When asked what actions retail, policy or local authority stakeholders could take to motivate action on
waste prevention, the top three measures identified by workshop delegates were:
Better – and more cross-sectoral - information provision to consumers about waste prevention
activity and options (from government, retailers and local authorities working together)
Better promotion and capacity building of the third sector to develop re-use services.
Householder financial incentives, implemented by local authorities with national support 46
Other suggestions made in the workshops related to retail options and design of collection systems (e.g.
bin limits). A majority (86%) of survey respondents agreed with these priorities. The biggest area of
debate was around incentives; 26 (of 148) respondents thought that incentives should not be a priority.
Producer responsibility measures were the main aspect thought to be missing.
8 Evidence gaps and signposts This section describes the current state of the evidence base on household waste prevention and outlines
areas for further evidence gathering, based on the gaps identified in the research and by stakeholders.
Supporting modules are:
Level 2 report Level 3 reports Level 4 reports
L2 m8 Evidence gaps and signposts L2 m8/1 (T) Waste prevention evidence map L4 m/1 Scoping sources
L2 m8/2 (D) Waste prevention bibliography L4 m/2 Evidence review summaries
8.1 The evidence base for household waste prevention
Because household waste prevention covers so many different subject areas the evidence is spread very
wide and thin across diffuse organisations. This review has been a significant attempt to consolidate
important sources (L3 m8/2 (D)) and begin to log international experience (L3 m5/2 9 (D)). WREP and
WRAP studies are key sources of information, providing some of the greatest depth and robust insight on
waste prevention activities.
WREP studies are important sources on:
Third sector waste organisations and community sector waste projects
Consumer motivations (particularly theoretical understanding)
Consumer interventions – doorstepping and small group approaches
Approaches to measuring waste prevention behaviour change – both practice reviews and trial of
methodologies
Scope and options for policy measures
Future lifestyle trends and forecasting waste growth
Concept testing of refillable packaging and a product service system model
(and in addition to those included in this review) mandatory deposit systems for returnable
packaging, interaction of waste collection arrangements and waste arisings
WRAP reports and guidance are sources of key information on:
Retail packaging solutions, including refills (the retail innovation programme)
Consumer attitudinal and behaviour research – from a practical angle (including food waste, home
composting, reusable nappies, plastic bags, junk mail and reuse)
46 The workshops were held shortly after the closing date for applications to Defra to be a pilot authority for financial incentives. A few comments were made in the workshops that incentives would only work if they were introduced universally across England.
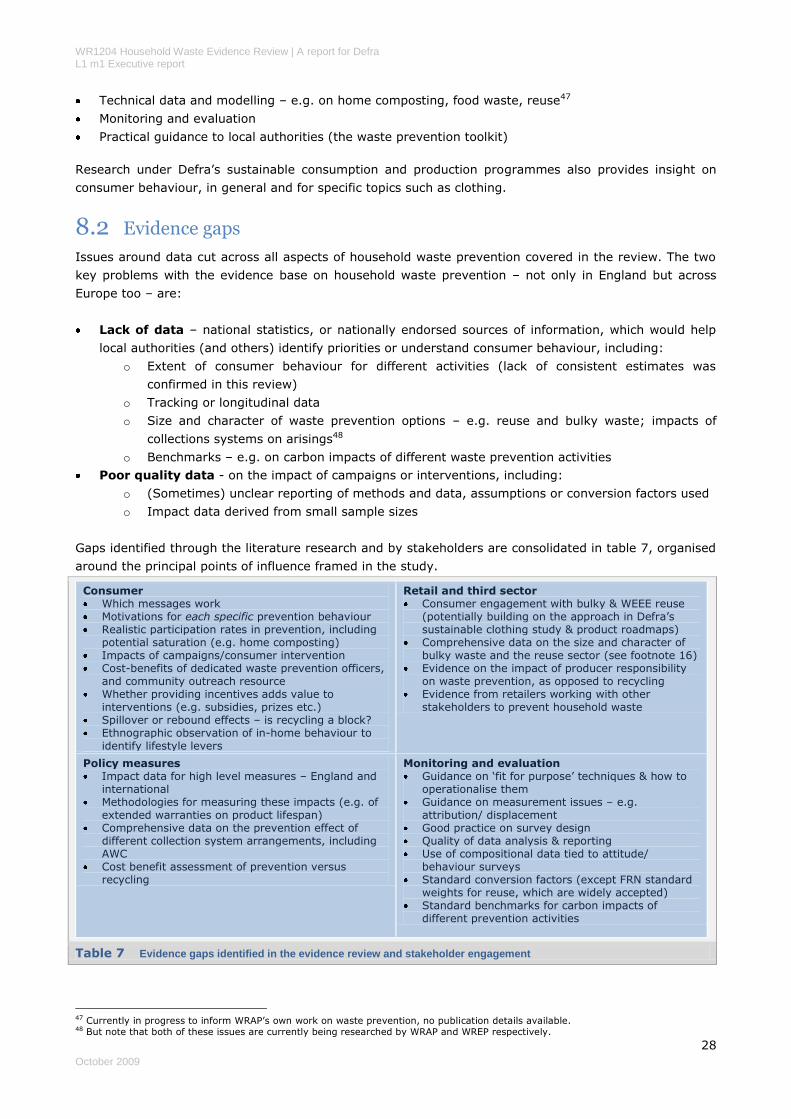
WR1204 Household Waste Evidence Review | A report for Defra L1 m1 Executive report
October 2009
28
Technical data and modelling – e.g. on home composting, food waste, reuse47
Monitoring and evaluation
Practical guidance to local authorities (the waste prevention toolkit)
Research under Defra‟s sustainable consumption and production programmes also provides insight on
consumer behaviour, in general and for specific topics such as clothing.
8.2 Evidence gaps
Issues around data cut across all aspects of household waste prevention covered in the review. The two
key problems with the evidence base on household waste prevention – not only in England but across
Europe too – are:
Lack of data – national statistics, or nationally endorsed sources of information, which would help
local authorities (and others) identify priorities or understand consumer behaviour, including:
o Extent of consumer behaviour for different activities (lack of consistent estimates was
confirmed in this review)
o Tracking or longitudinal data
o Size and character of waste prevention options – e.g. reuse and bulky waste; impacts of
collections systems on arisings48
o Benchmarks – e.g. on carbon impacts of different waste prevention activities
Poor quality data - on the impact of campaigns or interventions, including:
o (Sometimes) unclear reporting of methods and data, assumptions or conversion factors used
o Impact data derived from small sample sizes
Gaps identified through the literature research and by stakeholders are consolidated in table 7, organised
around the principal points of influence framed in the study.
Consumer Which messages work Motivations for each specific prevention behaviour Realistic participation rates in prevention, including
potential saturation (e.g. home composting) Impacts of campaigns/consumer intervention Cost-benefits of dedicated waste prevention officers,
and community outreach resource Whether providing incentives adds value to
interventions (e.g. subsidies, prizes etc.) Spillover or rebound effects – is recycling a block? Ethnographic observation of in-home behaviour to
identify lifestyle levers
Retail and third sector Consumer engagement with bulky & WEEE reuse
(potentially building on the approach in Defra‟s sustainable clothing study & product roadmaps)
Comprehensive data on the size and character of bulky waste and the reuse sector (see footnote 16)
Evidence on the impact of producer responsibility on waste prevention, as opposed to recycling
Evidence from retailers working with other stakeholders to prevent household waste
Policy measures Impact data for high level measures – England and
international Methodologies for measuring these impacts (e.g. of
extended warranties on product lifespan) Comprehensive data on the prevention effect of
different collection system arrangements, including AWC
Cost benefit assessment of prevention versus recycling
Monitoring and evaluation Guidance on „fit for purpose‟ techniques & how to
operationalise them Guidance on measurement issues – e.g.
attribution/ displacement Good practice on survey design Quality of data analysis & reporting Use of compositional data tied to attitude/
behaviour surveys Standard conversion factors (except FRN standard
weights for reuse, which are widely accepted) Standard benchmarks for carbon impacts of
different prevention activities
Table 7 Evidence gaps identified in the evidence review and stakeholder engagement
47 Currently in progress to inform WRAP‟s own work on waste prevention, no publication details available. 48 But note that both of these issues are currently being researched by WRAP and WREP respectively.
WR1204 Household Waste Evidence Review | A report for Defra L1 m1 Executive report
October 2009
29
8.3 Further development of the waste prevention evidence base
Taking these gaps into account, two types of further evidence were identified as being required –
technical research (mainly for consideration by Defra and the academic community) and good practice
guidance (for consideration by WRAP). These are shown in table 8 below.
Overall, the evidence review has highlighted a general lack of consistent or high quality data on either
practice or impact. The challenge going forward will be to put in place processes that:
can capture the practice data in „real time‟ (rather than retrospectively which has been the case up
until now);
continue to use central resources to develop consumer insight on key activities that can then be
disseminated to local authorities;
will develop a suite of best practice guidance on aspects of waste prevention; and is capable of
tracking both consumer and tonnage trends.
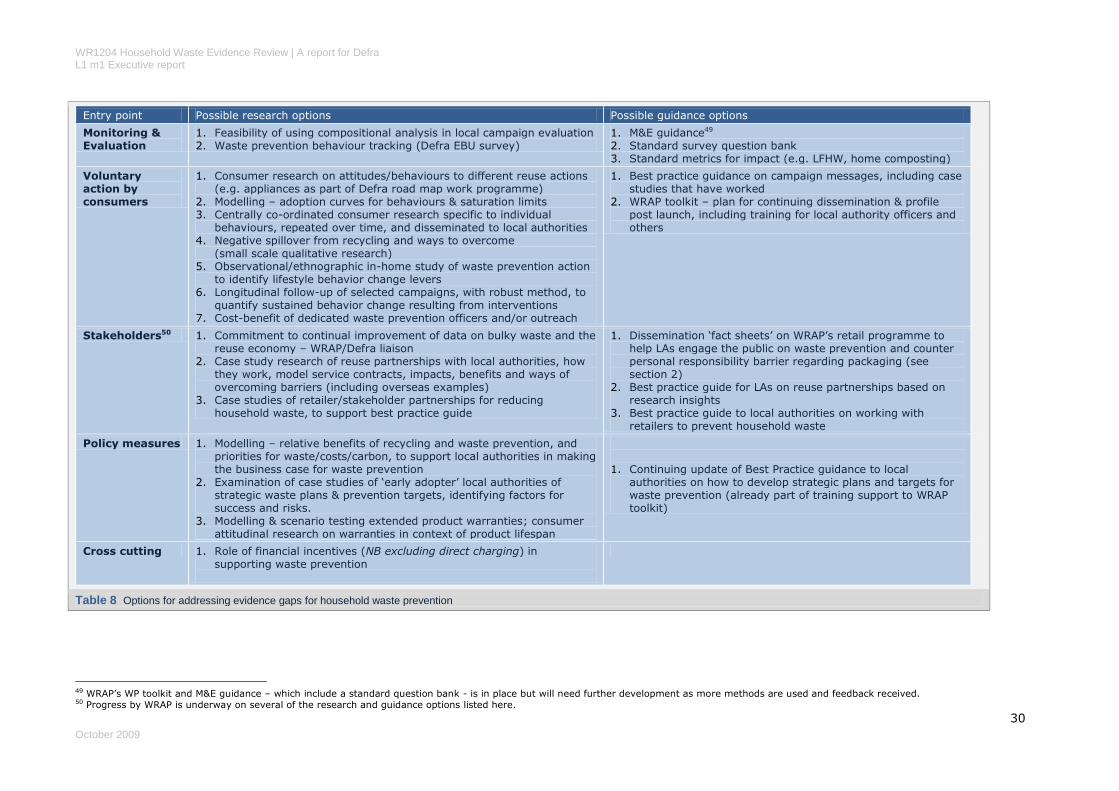
WR1204 Household Waste Evidence Review | A report for Defra L1 m1 Executive report
October 2009
30
Entry point Possible research options Possible guidance options
Monitoring & Evaluation
1. Feasibility of using compositional analysis in local campaign evaluation 2. Waste prevention behaviour tracking (Defra EBU survey)
1. M&E guidance49 2. Standard survey question bank 3. Standard metrics for impact (e.g. LFHW, home composting)
Voluntary action by consumers
1. Consumer research on attitudes/behaviours to different reuse actions (e.g. appliances as part of Defra road map work programme)
2. Modelling – adoption curves for behaviours & saturation limits 3. Centrally co-ordinated consumer research specific to individual
behaviours, repeated over time, and disseminated to local authorities 4. Negative spillover from recycling and ways to overcome
(small scale qualitative research) 5. Observational/ethnographic in-home study of waste prevention action
to identify lifestyle behavior change levers 6. Longitudinal follow-up of selected campaigns, with robust method, to
quantify sustained behavior change resulting from interventions 7. Cost-benefit of dedicated waste prevention officers and/or outreach
1. Best practice guidance on campaign messages, including case studies that have worked
2. WRAP toolkit – plan for continuing dissemination & profile post launch, including training for local authority officers and others
Stakeholders50 1. Commitment to continual improvement of data on bulky waste and the reuse economy – WRAP/Defra liaison
2. Case study research of reuse partnerships with local authorities, how they work, model service contracts, impacts, benefits and ways of overcoming barriers (including overseas examples)
3. Case studies of retailer/stakeholder partnerships for reducing household waste, to support best practice guide
1. Dissemination „fact sheets‟ on WRAP‟s retail programme to help LAs engage the public on waste prevention and counter personal responsibility barrier regarding packaging (see section 2)
2. Best practice guide for LAs on reuse partnerships based on research insights
3. Best practice guide to local authorities on working with retailers to prevent household waste
Policy measures 1. Modelling – relative benefits of recycling and waste prevention, and priorities for waste/costs/carbon, to support local authorities in making the business case for waste prevention
2. Examination of case studies of „early adopter‟ local authorities of strategic waste plans & prevention targets, identifying factors for success and risks.
3. Modelling & scenario testing extended product warranties; consumer attitudinal research on warranties in context of product lifespan
1. Continuing update of Best Practice guidance to local authorities on how to develop strategic plans and targets for waste prevention (already part of training support to WRAP toolkit)
Cross cutting 1. Role of financial incentives (NB excluding direct charging) in supporting waste prevention
Table 8 Options for addressing evidence gaps for household waste prevention
49 WRAP‟s WP toolkit and M&E guidance – which include a standard question bank - is in place but will need further development as more methods are used and feedback received. 50 Progress by WRAP is underway on several of the research and guidance options listed here.

WR1204 Household Waste Evidence Review | A report for Defra L1 m1 Executive report
October 2009
31
9 Implications and issues
This final section provides summary answers to the research questions (section 1) then brings together
the impact evidence for consumer action, retail and third sector options, and policy measures.
9.1 Answers to the research questions
What is the extent to which waste prevention behaviours are practised?
The evidence revealed many limitations in the data available to answer this question, with some notable
exceptions. A significant cause of weakness in the evidence is that no two researchers ask households
about the same portfolio of waste prevention behaviours. Unlike recycling, waste prevention is not
one behaviour but many.
Beyond acceptance of top level definitions (such as the OECD and the Waste Framework Directive) there
is no consensus definition in the literature of which specific behaviours make up „waste prevention‟. This
may help to explain why statistical models struggle to explain the origins of waste prevention behaviour –
they typically leave around 70% of it unexplained. It may be the case that there is too much „noise‟
caused by different motivations for different kinds of prevention behaviours in the models, so that they
lose explanatory power.
Some authors manage to identify categories of prevention behaviours that seem to be broadly related,
such as those that relate to minimising purchase, as opposed to private reuse of products at home.
Others argue that each individual behaviour needs to be understood separately. WRAP‟s work on home
composting and on food waste, which show very different origins, underline the case for behaviours to be
targeted with bespoke messages.
While there is no consensus definition of a waste prevention behavioural portfolio, and estimates vary on
the extent to which different behaviours are practised, studies generally agree that there is a broad
hierarchy of action. Donation for reuse tends to be at the top (mainly clothes), running through private
reuse behaviours, to avoidance or substitution of purchase at the bottom. Stakeholder views on the
hierarchy of consumer practice differed and we speculated that their perception is skewed by their
current interests and activities (e.g. in food waste). The danger of practitioners and policy makers relying
on „gut feel‟ and personal experience to understand consumers was highlighted by this mismatch of
perception with the evidence.
What are the barriers and opportunities to encourage participation?
The most significant issue emerging from the evidence is lack of consumer understanding of both the
idea of „waste prevention‟ and of the actions that might be associated with it. There is, in particular, a
general tendency to equate the idea of „reduce waste‟ with „recycling‟. Some academic papers suggest
that it is only the most environmentally motivated or committed recyclers that undertake prevention
behaviour, and there are hints in the evidence that (kerbside) recycling may get in the way of developing
prevention habits. So it cannot be assumed that prevention is the next „natural step‟ from recycling.
Lack of understanding is compounded by lack of visibility. Waste prevention is usually a very personal
behaviour, done imperceptibly (e.g. when shopping) or out of the sight of others (at home), so that there
is no descriptive social norm to support it – as there is now with widespread recycling. Equally there is no
injunctive norm – the sense that something should be done – because many of the behaviours involve
rethinking consumption. Prevailing consumer identity that is achieved through the acquisition of „stuff‟ or
affiliation with brands was identified as a significant barrier to consumer engagement.

WR1204 Household Waste Evidence Review | A report for Defra L1 m1 Executive report
October 2009
32
As we saw in section 3, opportunities exist to raise the profile and visibility of prevention, not through
general exhortations to “reduce waste”, but by identifying specific activities, helping consumers to be
good at them (e.g. through handy tips, doorstepping, community outreach) and educating about the
need to do these things. Consumers may not immediately identify such activities as „environmental‟ and
other hooks may need to be found, at least in this early adoption phase. This kind of approach is
exemplified in the WRAP-led Love Food Hate Waste campaign, as is the notion of an „ethic of care‟ - for
products, the environment or wider society – which was also flagged as a motivation in the literature.
What are the options available to householders?
A variety of methods and tools was identified in the literature to engage households in waste prevention
behaviour. None of them is radically different from the approaches used to increase recycling
participation, for example, doorstep campaigns, or community outreach. Common themes included the
need to provide specific tips on how to do waste prevention, and activities that break into routine habits
to increase the visibility of waste prevention.
It was possible to identify a small number of interventions where waste impacts had been measured,
though significant data limitations were identified that make it difficult to produce a robust overall
estimate of the impact of campaigns. Drawing on the data, our best judgement is that campaigns which
target a mix of behaviours can achieve around 0.5kg to 1kg/hh/wk reduction. These can only be
indicative estimates at this stage and much more substantial evidence is required.
Of separate measures, the highest impacts are observed from home composting (where the data are the
most reliable) and food waste.
What are the options for stakeholders?
Under this heading, the review looked mainly at reuse in general and the role of the third sector within it
specifically, as well as retail solutions which require active involvement of consumers – notably refills and
self-dispensing product systems. Passive solutions, such as light-weighting of packaging materials and or
mandatory deposit return schemes were excluded.
In total, current reuse in the UK amounts to around 500,000 tonnes per annum, of which around half is
textiles. Once again, the data is weak, needing to be pieced together from diverse sources. In addition to
the above, is a commercial second hand market of unknown size, which is important because its channels
compete for supply with local authority and third sector options. Freecycle is a new phenomenon which is
growing fast but currently of unknown impact.
Higher reuse rates are achieved through third sector channels – around 65% to 80% depending on
material, compared to 2-3% for bulky waste channelled through local authority collections and HWRCs.
Third sector channels appear able to collect materials of a higher quality, thus enabling the high re-use
rate, whereas LA collections and HWRCs are often collecting bulky waste of very low quality.
Authors agree that there is significant scope to increase the scale of reuse activity in the UK, though
estimates of the tonnage potential vary – perhaps up to double the present level would be feasible. The
evidence points to significant social benefits too from third sector operators, though researchers have
found it very difficult to measure this benefit as a return to public investment.
Forthcoming revisions to the WEEE Directive are expected to boost the reuse economy. There is a
consensus in the literature and from stakeholders that in order to optimise the role of reuse in waste
strategy more needs to be done to create an integrated reuse system, which involves enhancing the
following linkages and building good working relationships between reuse stakeholders:
WR1204 Household Waste Evidence Review | A report for Defra L1 m1 Executive report
October 2009
33
Between waste and social services in local authorities, and between housing departments, housing
associations and ALMOs51 - to join up supply and demand sides for reused furniture and appliances;
Between local authorities and the third sector - through service agreements and consistent
approaches to the payment of reuse credits; and
Between the service infrastructure and consumers/households – by supporting campaigns and
services that increase the visibility of reuse options, and working to undermine the stigma associated
with second hand goods.
There are useful international examples of a more retail-focused second hand culture, and more
integrated reuse networks between local authorities and the third sector. Flanders is an exemplar of a
strategic level, integrated policy package for reuse, including per capita targets and favourable treatment
on product taxes and employment subsidies (L2 m4/1 & L3 m5/1 (T)).
In relation to retail solutions, the principal barriers relate to consumer price sensitivity and no real price
advantage. Consumers like the environmental benefits but these are not a primary motivation for
purchase. Barriers for manufacturers and retailers relate to a perception of low profitability, stock
management issues, and possible costs of refitting manufacturing lines. The main role that Defra can play
here is in supporting WRAP and its retail innovation programme; and WRAP through the Courtauld
Commitment. Influencing design standards was also hinted at in the literature, as was a possibility to
influence consumer behaviour through carbon or eco-labelling. This evidence review did not include
mandatory options – such as deposit-return schemes – which is covered in other Defra research52.
What are the infrastructure considerations and technical solutions?
There is much less opportunity to influence waste prevention through infrastructure than there was
recycling in the early days of adoption. The main scope is to influence the service infrastructure that
supports householder action for targeted prevention activities – such as home composting, bulky waste,
purchasing, and food. The Courtauld Commitment is a key instrument here, especially if its remit can be
widened beyond reduction of packaging in supply chains, as is being done with food waste. Other options
include encouraging formal partnerships between local authorities and third sector reuse organisations;
and supporting local authorities to partner with retailers to engage households, perhaps by
demonstrating feasibility through best practice case studies.
What is the impact of different policy options and measures on waste prevention?
The objective set by Waste Strategy 2007 is to reduce residual waste from households to 12.2 million
tonnes by 2020. To achieve this, the rate of decline of residual waste that has been seen since 2000 will
need to be maintained.
It is beyond the scope of the present review to consider the mix of recycling, composting and prevention
that could most effectively and cost effectively achieve this target. It does seem likely, however, that
prevention will need to play a larger role over the next decade than it has in the past decade.
The various policy options that have been investigated in the literature covered by this review – ranging
from measures such as collaborative procurement strategies, through programmes to stimulate re-use,
to charging and incentive schemes – vary considerably both in terms of the scale of their potential
impact, and in the degree of confidence that can be ascribed to calculations of impact. Different
behaviours, different methodologies and different institutional arrangements combine to make
comparison between options exceptionally difficult.
51 ALMO – Arms Length Management Organisation 52 WR1203 ERM (2008) for Defra. Review of Packaging Deposits System for the UK.
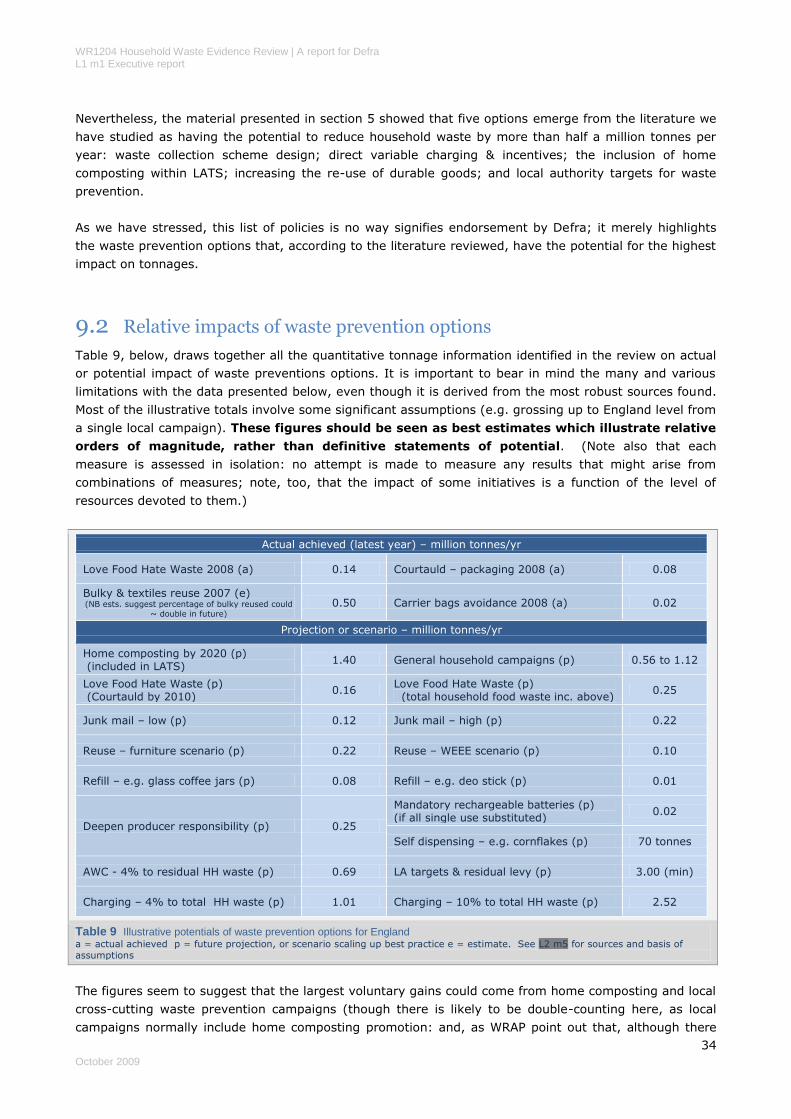
WR1204 Household Waste Evidence Review | A report for Defra L1 m1 Executive report
October 2009
34
Nevertheless, the material presented in section 5 showed that five options emerge from the literature we
have studied as having the potential to reduce household waste by more than half a million tonnes per
year: waste collection scheme design; direct variable charging & incentives; the inclusion of home
composting within LATS; increasing the re-use of durable goods; and local authority targets for waste
prevention.
As we have stressed, this list of policies is no way signifies endorsement by Defra; it merely highlights
the waste prevention options that, according to the literature reviewed, have the potential for the highest
impact on tonnages.
9.2 Relative impacts of waste prevention options
Table 9, below, draws together all the quantitative tonnage information identified in the review on actual
or potential impact of waste preventions options. It is important to bear in mind the many and various
limitations with the data presented below, even though it is derived from the most robust sources found.
Most of the illustrative totals involve some significant assumptions (e.g. grossing up to England level from
a single local campaign). These figures should be seen as best estimates which illustrate relative
orders of magnitude, rather than definitive statements of potential. (Note also that each
measure is assessed in isolation: no attempt is made to measure any results that might arise from
combinations of measures; note, too, that the impact of some initiatives is a function of the level of
resources devoted to them.)
Actual achieved (latest year) – million tonnes/yr
Love Food Hate Waste 2008 (a) 0.14 Courtauld – packaging 2008 (a) 0.08
Bulky & textiles reuse 2007 (e) (NB ests. suggest percentage of bulky reused could
~ double in future)
0.50 Carrier bags avoidance 2008 (a) 0.02
Projection or scenario – million tonnes/yr
Home composting by 2020 (p) (included in LATS)
1.40 General household campaigns (p) 0.56 to 1.12
Love Food Hate Waste (p) (Courtauld by 2010)
0.16 Love Food Hate Waste (p) (total household food waste inc. above)
0.25
Junk mail – low (p) 0.12 Junk mail – high (p) 0.22
Reuse – furniture scenario (p) 0.22 Reuse – WEEE scenario (p) 0.10
Refill – e.g. glass coffee jars (p) 0.08 Refill – e.g. deo stick (p) 0.01
Deepen producer responsibility (p) 0.25
Mandatory rechargeable batteries (p) (if all single use substituted)
0.02
Self dispensing – e.g. cornflakes (p) 70 tonnes
AWC - 4% to residual HH waste (p) 0.69 LA targets & residual levy (p) 3.00 (min)
Charging – 4% to total HH waste (p) 1.01 Charging – 10% to total HH waste (p) 2.52
Table 9 Illustrative potentials of waste prevention options for England a = actual achieved p = future projection, or scenario scaling up best practice e = estimate. See L2 m5 for sources and basis of
assumptions
The figures seem to suggest that the largest voluntary gains could come from home composting and local
cross-cutting waste prevention campaigns (though there is likely to be double-counting here, as local
campaigns normally include home composting promotion: and, as WRAP point out that, although there
WR1204 Household Waste Evidence Review | A report for Defra L1 m1 Executive report
October 2009
35
are benefits in a local authority implementing multiple (cross-cutting) activities over the course of a year
or more, it may not be appropriate to promote these all under one campaign - advice should be sought
on the best approach to the communications required to support such campaigns, e.g. to avoid too many
messages and to make it clear what people are being asked to do). The other significant options are all
top-down policy measures, though as explained earlier it is not possible even to make rough estimates of
some of the more interesting options – such as extended product warranties – with current data.
In addition to pure tonnage gains, authors suggest there are potential „quick wins‟ in options such as junk
mail and carrier bag reduction (supported by voluntary agreements) that are popular with the public and
relatively straightforward to implement. However, since their quantitative waste prevention impacts may
not be that great (e.g. with bags) it will be important to leverage any „foot in the door‟ effects of such
initiatives in order to educate the public on the bigger impact activities. This will be especially so in local
campaigns.
The international experience also suggests that the most effective and most frequently applied waste
prevention policy measures come in a package including:
waste prevention targets;
producer responsibility;
variable rate charging (pay as you throw) systems for householders‟ residual waste;
intense public awareness/communications campaigns (long-term with deeper links to consumerism
and short-term with emblematic targets);
public sector funding pilot projects; and
collaboration between public, private and third sector organisations.
The need for a „package‟ approach, or a „basket of measures‟, is linked to and reinforced by the fact that
waste prevention is not one behaviour, but many. Tackling these complex and disaggregated behaviours
will require similarly subtle and variegated policy.
WR1204 Household Waste Evidence Review | A report for Defra L1 m1 Executive report
October 2009
36
10 Annex 1: Report module navigation
Reporting for WR1204 has been organised into modules that allow for the evidence to be accessed at different levels of detail, and different packages,
depending on the interests of the reader. The modular structure is as follows:
Level 1
executive
L1 m0 Executive summary
L1 m1 Executive report
Level 2
synthesis
Technical report
Chapters of report available separately as synthesis papers
under main headings covered in L1 m1 Executive report
Level 3
briefs
Level 3(T): short (5-8pg) self contained briefs on key topics
flagged at L1 & L2
Level 3 (D): longer briefing papers providing detailed material
that supports L2 & L1 modules
Level 4
evidence
base
Scoping database – signposts to ~800 sources
Evidence review spreadsheet – summary notes from all
sources reviewed
The table overleaf lists the different modules and their titles. In addition to those shown in the table below are the two Level 4 modules which contain the
evidence sources reviewed: the scoping database of all sources found; an evidence review database containing written summaries for sources reviewed in
depth.

WR1204 Household Waste Evidence Review | A report for Defra L1 m1 Executive report
October 2009
37
WR1204 Modular reporting map
Level 1 modules - Overarching reports
L1 m0 Executive summary L1 m1 Executive report
Level 2 modules Level 3 modules
L2 m1 Technical report (single document)
Individual chapters are basis of all L2 modules below & it links to all L3 modules L3 m1 (D)
Approach & method of the review
L2 m2 Policy context
links to L2 m5 „policy measures‟ below
links to L3 m5 modules
below
L2 m3 Consumers - engaging L3 m3/1 (D) Extent to which WP behaviours are practised
L3 m3/2 (D) Motivations & barriers
L3 m3/3 (D) Impact & delivery of household waste prevention intervention
campaigns (at the local level)
L3 m3/4 (T) Attitudes & behaviour – food waste
L3 m3/5 (T) Attitudes & behaviour – home composting
L3 m3/6 (T) Attitudes & behaviour – reuse
L3 m3/7 (T) Attitudes & behaviour – everyday actions around the home
L3 m3/8 (T) Consumer segmentation
L3 m3/9 (T) Small group approaches to behaviour change
L2 m4/1 Reuse & the third sector links to L3 m3/6 (T)
L2 m4/2 Retail solutions – refillables & self dispensing systems
L2 m4/3 Product service systems
L2 m5 Policy measures L3 m5/1 (T) Future waste growth, modelling & decoupling
L3 m5/2 (D) International review
L2 m6 Monitoring & evaluation L3 m6/1 (D)
links also to L3 m3/3 (D) Approaches to monitoring & evaluation
L2 m7 Stakeholder engagement feedback L3 m7/1 (D) Stakeholder views on waste prevention
L3 m7/2 (T) Future scope for a waste prevention network
L2 m8 Evidence gaps & signposts L3 m8/1 (T) Waste prevention evidence map
L3 m8/2 (D) Waste prevention bibliography
WR1204 Household Waste Evidence Review | A report for Defra L1 m1 Executive Report
October 2009
38
11 Annex 2: Bibliography
References
1 WR0112: Tucker, P. and Douglas, P. (Environmental Technology Group, University of Paisley) (2007) Understanding Household Waste Prevention Behaviour. Final report & technical reports 1-4.
2 WR0114, Global Action Plan, Nye, M. and Burgess, J. (School of Environmental Sciences, University of East Anglia) (2008) Promoting durable change in household waste and energy use behaviour.
3 WR0116: Dorset County Council, AEA, The Social Marketing Practice, Mike Read Associates, & The University of Northampton (2008) Household Waste Prevention Activity in Dorset. Summary report, technical annexes.
4 WR0117: Brook Lyndhurst for Hampshire County Council (2008) Small Changes Big Difference Towards a Materials Resource Authority: Promoting Practical Waste Prevention and Exploring Options for Resource Management. Summary report, technical report and annexes.
5 WR0105 Waste Watch (2006) Project REDUCE Monitoring & Evaluation - Developing tools to measure waste prevention. Summary report and project evaluation reports.
6 Phillips, P. (2009) A report to East Midlands Regional Assembly on the role of Freecycle in regional MSW practice.
7 Barr, S. (2007) Factors influencing environmental attitudes and behaviors. A UK case study of household waste management. Environment and Behavior 39(4): 435-473.
8 Tonglet, M., Phillips, P.S. and Bates, M.P. (2004) Determining the drivers for householder pro environmental behaviour: waste minimisation compared to recycling. Resources, Conservation and Recycling 42: 27-48.
9 Gray, S. and Toleman, I. (2006) National home composting survey results, 1997 2005. Waste 2006: Sustainable Waste & Resource Management Conference Proceedings, 775-786.
10 WRAP (2007) Understanding Food Waste - research summary
11 WRAP and the Women's Institute (2008) Love Food Champions.
12 OVAM (Openbare Vlaamse Afvalstoffenmaatschappij) (2008) Analysis of Innovative Environmental Policy Instruments - Towards the Realisation of Environmentally Responsible Production and Consumption
13 Obara, L. (The ESRC Centre For Business Relationships, Accountability, Sustainability and
Society) (2005) Is Waste Minimisation a Challenge Too Far?: The Experience of Household Waste Management and Purchasing in the UK. Working Paper Series No 29.
14 WR0209: Brook Lyndhurst (forthcoming) Enhancing participation in kitchen waste collections
15 Salhofer, S., Obersteiner, G., Schneider, F. and Lebersorger, S. (2008) Potentials for the prevention of municipal solid waste. Waste Management 28: 245-259.
16 Watson, M. (2008) A Review of the Literature and Research on Public Attitudes, Perceptions and Behaviour Relating to Remanufactured, Repaired and Reused Products. Report for the Centre for
Remanufacturing and Reuse, University of Sheffield.
17 WR504: Brook Lyndhurst (2006), Establishing the behaviour change evidence base to inform community based waste prevention and recycling.
18 Changeworks & SisTech (2008) The Waste Wise Armadale Project. Final report.
19 NLWA (North London Waste Authority) (2009) North London Watch Your Waste Week 4th to 12th October 2008.
20 Wickens, S. (Ross-shire Waste Action Network - RoWAN) (2005) Waste Free Households project.
Final report.
21 Salisbury, V., Worcestershire County Council and Herefordshire County Council (2008, unpublished) Performance Evaluation of the Waste Challenge Team.
22 Brook Lyndhurst for Defra (2009) Evaluation of the Environmental Action Fund 2005-8.
WR1204 Household Waste Evidence Review | A report for Defra L1 m1 Executive Report
October 2009
39
23 WRAP (Gray, S.) (2007c) Possible Method for Estimating the Landfill Diversion Attributable to
Home Composting for use in LATS Calculations: a discussion paper by WRAP.
24 LCRN (London Community Recycling Network for the Greater London Authority) (undated), Third Sector Reuse Capacity in London
25 Vandenbussche, B. (undated) Reuse in Flanders - Introduction in the Flemish reuse sector.
Unpublished.
26 Enviros (for Defra) (2004) International Waste Prevention and Reduction Practice.
27 NRWF (2004) Waste Minimisation Toolkit.
28 WR0506: Resources for Change, The New Economics Foundation, Resource Futures and Community Environment Associates (2008b) The Benefits of Third Sector Involvement in Local Authority Waste Management. Final report and annexes.
29 WR502: Hines, F., Morley, A., Frater, L., Cartwright, S. and Chandrashekar, S. (The ESRC Centre
for Business Relationships, Accountability, Sustainability and Society, Cardiff University) (2008a) Social Enterprises and Sustainable Waste and Resource Management: Evaluating Impacts, Capacities and Opportunities. Final report and annexes.
30 WR501: London Development Agency & Brook Lyndhurst (2007) Replicating Success: Social Enterprises & the Waste Sector in London.
31 WR0211 Slater, R. (Open University) (2008), Unlocking the potential of community composting.
32 WR0113: Lofthouse, V., Bhamra, T. and Trimingham, R. (Department of Design and Technology, Loughborough University) (2007) Refillable packaging systems. Final report and technical reports.
33 WR0106: Cook, M. and Gottberg, A. (Centre for Natural Resource Management, Cranfield University) (2008) Achieving household waste prevention through product service systems. Final report and technical reports.
34 James Ross Consulting Ltd and Butcher & Gundersen for WRAP (2008) Potential refill solutions
for the food and non-food retail sectors – Feasibility study.
35 James Ross Consulting, Marketry Ltd and The Brewery for WRAP (2008) Self dispensing systems – commercial feasibility study.
36 Lee, P., Vaughan, P., Bartlett, C. (Oakdene Hollins), Bhamra, T., Lofthouse, V. and Trimingham, R. (Loughborough University) for WRAP (2008) Refillable glass beverage container systems in the UK.
37 Curran, A. and Williams, I.D. (2007) Maximising the Recovery of Household Bulky Waste in
England. Proceedings: Sardinia 2007, Eleventh International Waste Management and Landfill Symposium.
38 Curran, A., Williams, I.D. and Heaven, S. (2007) Management of household bulky waste in England. Resources, Conservation and Recycling 51 78–92.
39 Darby, L. and and Obara, L. (2004) Household recycling behaviour and attitudes towards the disposal of small electrical and electronic equipment. Resources Conservation and Recycling 44
(2005) 17–35.
40 Willams, N., Croker, M, & Barrett, D. (In House Policy Consultancy)(2005) for ODPM, DfT & Defra. Review of the Voluntary and Community Waste Sector in England.
41 FRN (undated) Live Long and Prosper – The value of re-use in Britain. Presentation.
42 Arold, H and Koring, C (2008) New Vocational Ways and Qualifications for Professionalisation in the Second-Hand Sector. European report: An Investigation and Analysis of the Second-Hand Sector in Europe.
43 Defra sustainable clothing roadmap (see http://www.defra.gov.uk/environment/business/products/roadmaps/clothing.htm )
44 WR0103: Eunomia Research and Consulting, The Environment Council, Öko-Institut, TNO and Atlantic Consulting (2007) Household Waste Prevention Policy Side Research Programme.
45 Cooper, T. (2005) Slower Consumption Reflections on Product Life Spans and the “Throwaway Society”. Journal of Industrial Ecology, Volume 9, Number 1-2, pp 51-57.
WR1204 Household Waste Evidence Review | A report for Defra L1 m1 Executive Report
October 2009
40
46 Huysentruyt, M. and Read, D. (2008) How do people value extended warranties? : Evidence from
two field surveys.
47 WR0107: AEA Energy and Environment and The Future Foundation (2007) Modelling the Impact of Lifestyle Changes on Household Waste Arisings – Additional Research. WR0107.
48 ACR+ (2008), Analysis of Municipal Waste Management Practices in Europe.
49 Dunne, L., Convery, F.J. and Gallagher, L. (2008) An investigation into waste charges in Ireland, with emphasis on public acceptability. Waste Management 28: 2826-2834.
50 EPA (Environment Protection Agency) (2008), The National Waste Prevention Programme Fourth Annual Report 2007/2008.
51 Eunomia Research and Consulting, for Defra (2006) Modelling the Impact of Household Charging for Waste in England.
52 Gordon Mackie Associates Ltd (2007) Direct and Variable Charging for Household Residual Waste
- Overview of Key Issues. Prepared for the Chartered Institution of Wastes Management.
53 OVAM (Openbare Vlaamse Afvalstoffenmaatschappij) (2004), Indicators of waste prevention.
54 OVAM (Openbare Vlaamse Afvalstoffenmaatschappij) (2008) Analysis of Innovative Environmental Policy Instruments - Towards the Realisation of Environmentally Responsible Production and Consumption.
55 Parfitt, J. (WRAP) (2006) Home Composting Versus 'Collect and Treat' Options for Biodegradable
Municipal Wastes - Towards a More Level Playing Field? CIWM 2006 Conference proceedings, briefing session 1, paper 3.
56 Salhofer, S., Obersteiner, G., Schneider, F. and Lebersorger, S. (2008) Potentials for the prevention of municipal solid waste. Waste Management 28: 245-259.
57 Skumatz, L.A. (2008) Pay as you throw in the US: Implementation, impacts, and experience. Waste Management 28: 2778-2785.
58 Waste Improvement Network (2009), Results of WIN survey December 2008: Experiences of
local authorities with (1) lowest waste arisings/head; and (2) largest decrease in waste arisings/head on previous year (according to Defra stats for 2007/8).