l v*ctfl- ,olyffffli/// iieet - apps.dtic.mil · unclassified security classification of this page...
TRANSCRIPT

7AD-A095 802 HENNINGSON DURHAM AND RICHARDSON SANTA 1BAR1BARA CA - UF/A 16/1 MA -x ENVIRONMENTAL fECHNICAL REPORT. PUBLIC FINANCE MODEL. U)
DEC A0 FO4704-7-C-0029ii r e n L v*CTfl- .rc *T AI 1*, C////I////i
,olyfffflI///IIEET

AFSC-TR-81-44
LEVL /M-X
ENVIRONMENTAL
TECHNICAL REPORT
V
ETR 29
PUBLIC FINANCE MODEL
DTICl ELECTE_
LII I DISTRIBUTION STATE NIV, A 3 1981-Approved for public relecsO;i . Distribution Unimitcd
2 006

UnclassifiedSECURITY CLASSIFICATION OF THIS PAGE ("en Data Entered)
READ INSTRUCTIONS-- TDOCUMENTATION PAGE BEFORE COMPLETING FORM
Lj 2. GOVT ACCESSION NO. ECIPIEND'S CATALOG NUMBER
4. TITLE (and Subtitle) 5. PERIOD COVERED-........... . Final1M-X Environmental Technical Report,
Public
Finance Model , 6. PERFORMING ORG. REPORT NUMBERMX ETR 29
7. AUTHOR(s) -. CONTRACT OR GRANT NUMBER(s)
"' -'- j -.- /51. F04704-78-C-__
9. PERFORMING ORgA1ZATION NAME AND ADDRESS 10. PROGRAM ELEMENT. PROJECT, TASKAREA & WORK UNIT NUMBERS
Henningson, Durham and Richardson _ .Santa Barbara CA 93010 64312F___.-----__
ii. CONTROLLING OFFICE NAME AND ADDRESS _1 -PR Ar,! 22 Dc i~p
Ballistic Missile Office !R\ E
Norton AFB CA 2714. MONITORING AGENCY NAME & ADDRESS(If different from Controlling Office) 15. SECURITY CLASS. (of this report)
Unclassified15sa. DECLASSIFICATIONDOWNGRADING
SCHEDULE
16. DISTRIBUTION STATEMENT (of this Report)
Unclassified/Unlimited
17. DISTRIBUTION STATEMENT (of the abstract entered in Block 20, If different from Report)
IS. SUPPLEMENTARY NOTES
19. KEY WORDS (Continue on reverse side If necessary and Identify by block number)
Public Finance Texasiting Analysis Nevada New Mexicoviromnental Report Utah
,0. ABSTRACT (Continue on reverse side If necessary and identify by block number)
Anticipated increases in revenues and expenditures and associated deficitsand/or surpluses due to M-X related population in-migration are estimated
1' (1) at an aggregate level for all governmental units within a county area anda , (2) for the potentially affected school districts within each affected county.
In each case, the per capita and/or per pupil rates employed reflect theexpenditure and revenue patterns of each jurisdiction as classified by the'I population size of the particular county area under analysis. Data wereobtained from the U.S Bureau of the Census, Census of Governments, 1976/7
DD 'ITa U Anp T o1rVp NOV 65 IS OBSOLETE Unclassified lZ / lSECURITY CLASSIFICATION OF THIS PAGE (Wten Dota fnteid)
Li

Unclassified
ECyJRITY CLASSIFICATION OF THIS PAGE(Whon Data Entered)
J and adjusted to 1980 dollars using the implicit price deflator for state
and local government purchases of goods and services (CEA, 1980). Theresultant impact estimates are presented in constant 1980 dollars. As the pecapita rates used reflect aggregate revenues and expenditures, the estimatespresented reflect aggregate levels of revenues and expenditures and should nolbe interpreted as impacts associated witn any specific jurisdiction within tvcounty area under analysis.
The following sectionsdiscuss the three modules developed for analyzing thefiscal effects of M-X deployment:
• Local Government Expenditures and Revenue Module* Education Module* Caltal Expenditure Module
'I
UnclassifiedSECURITY CLASSIFICATION OF THIS PAGEnWhen Date Entered)

M-X ETR-29
M-X ENVIRONMENTAL TECHNICAL REPORT:PUBLIC FINANCE MODEL
Prepared for
UNITED STATES AIR FORCEBALLISTIC MISSILE OFFICENORTON AIR FORCE BASE
Acoesson For CALIFORNIAIRTIS GRAIDTIC TABUnannounced 13Justificatio
.i ByDistribution/
Availability Codes-- DT ICAvail and/or
Dist Special HDRSciences OELECTEI C,04 Anacapa Streett ' Bhl Santa Barbara, California ,,A 3 1981
22 December 190
ii ~~DISTRIBUTJor ON.ST AT EMEFNT A
Approved for publc lelea3e;
i)istTib itio1 Unlinited

TABLE OF CONTENTS
PAGE
1.0 Introduction
2.0 Local Government Expenditure and Revenue Module 3
2.1 Introduction 3
2.1.1 Administrative Expenditures 32.1.2 Public Safety Expenditures 32.1.3 Social Service Expenditures 32.1.4 Environmental Service Expenditures 32.1.5 Transportation Expenditures 62.1.6 Education Service Expenditures 62.1.7 Miscellaneous Expenditures 62.1.8 Property Tax Revenues 62.1.9 Other Tax Revenues 62.1.10 Service Charge Revenues 62.1.11 Intergovernmental Revenues 7
2.2 Local Government Expenditure and Revenue Module:Algorithm and Variable Definitions 7
2.2.1 Output Variables 7
2.2.2 Input Variables 9
3.0 Education Module 13
3.1 Introduction 13
3.1.1 Revenues 133.1.2 Expenditures 13
3.2 School District/County Specific Education Algorithmand Variable Definitions 16
3.2.1 Output Variables 163.2.2 Input Variables 17
4.0 Capital Expenditure Module 19
4.1 Model Structure and Description 194.2 Algorithm and Variable Definition 19
24, References
4.!
Ai
°LI

LIST OF TABLES
NO. PAGE
2.1.1-1 Local government model, per capita rates for Nevada/Utahcounties (1980 dollars). 4
2.1.1-2 Local government model, per capita rates for Texas/NewMexico counties (1980 dollars). 5
3.1.1-1 Education module, per capita, and per pupil rates forNevada/Utah counties (FY 1980 dollars). 14
3.1.1-2 Education module, per capita, and per pupil rates forTexas/New Mexico 3unties (FY 1980 dollars). 15
4.1 Rates used in calculating the local government capitalexpenditures requirements (1978 dollars). 23
.4
ii! iii
4 J

LOCAL GOVERNMENT FINANCE MODEL
1.0 INTRODUCTION
Anticipated increases in revenues and expenditures and associated deficitsand/or surpluses due to M-X related population in-migration are estimated (1) at anaggregate level for all governmental units within a county area and (2) for thepotentially affected school districts within each affected county. In each case, theper capita and/or per pupil rates employed reflect the expenditure and revenuepatterns of each jurisdiction as classified by the population size of the particularcounty area under analysis. Data were obtained from the U.S. Bureau of the Census,Census of Governments, 1976/77, and adjusted to 1980 dollars using the implicitprice.deflator for state and local government purchases of goods and services (CEA,1980). The resultant impact estimates are presented in constant 1980 dollars. Asthe per capita rates used reflect aggregate revenues and expenditures, the estimatespresented reflect aggregate levels of revenues aid expenditures and should not beinterpreted as impacts associated with any specific jurisdiction within the countyarea under analysis.
As accounting practices vary from county to county, and from state to state,differing line items (expenditures categories and revenue sources) are accounted forin the general fund budgets of each jurisdiction. From an accounting framework, noone model can accurately account for these differences. A model was developedbased on expenditure functions (administrative, transportation, public safety, socialservice, education, environmental services) and revenue sources (local revenues, andintergovernmental revenues) as classified by the Bureau of the Census. The analysisassumes the existing tax rates and structures within each county area to remainconstant through the period of analysis. Intergovernmental aid (federal revenuesharing monies, grants-in-aid, in-lieu taxes) are not varied relative to the localjurisdictions so that the potential level of federal assistance required as mitigationscould be estimated. Federal and state aid to local school districts, however, havebeen included in the analysis. In all cases the tax expenditure estimates presentedassume that service standard levels will not degrade throughout the period ofanalysis.
In addition, each expenditure function and revenue source within each jurisdic-tion is affected in varying degrees by the type of in-migrating population group thatis anticipated in the area--construction workers residing in construction camps,military personnel housed on base, and community-based populations. While thecommunity-based population in-migration will affect each expenditure function andrevenue source as determined by the specific per capita rate for each categoryunder analysis, the military personnel and construction workers will exert differinginfluences due to their particular residence and consumption patterns. Thesedifferences are reflected in the revenue and expenditure equations by adjustmentsto the per capita rates based on anticipated effects these population groups willhave upon the particular expenditure function and revenue source under analysis.
The following sections discuss the three modules developed for analyzing thefiscal effects of M-X deployment:
4o Local Government Expenditures and Revenue ModuleSI
o Education Module0~o Capital Expenditure Module

2.0 LOCAL GOVERNMENT EXPENDITURE AND REVENUE MODULE
2.1 INTRODUCTION
The Local Government Module estimates the aggregate expenditures andrevenues of the potentially affected local governmental units (county, city, schooldistrict, special district) within a county area by major expenditure functions andrevenue sources for each county area for the period 1982-1994. Section 2.2 presentsthe algorithm used in the analysis and the variable definitions. The followingdiscussion presents the assumptions and a general description of the particularexpenditure categories and revenue sources that comprise the Local GovernmentModule.
Administrative Expenditures (2.1.1)
As the population and community expands within each potentially affectedcounty area, administrative outlays for new staff, equipment, and other relatedexpenses are assumed to increase in direct proportion to the community-basedpopulation. Increased administrative outlays are calculated by multiplying the percapita administrative rates (Tables 2.1.1-1 and 2.1.1-2) by the community-basedpopulation for each county area under analysis. Construction camp based andonbase military personnel are assumed to contribute negligible demands for thisservice and are not included in the calculations.
Public Safety (2.1.2)
Police and fire protection services required and the attendant increases inoperation and maintenance costs are calculated to expand in direct proportion to theincreased community-based population and the temporary construction work force.Onbase military personnel and dependents are expected to demand a diminishedlevel of service and thus the per capita rate applied against this population group isassumed to be 70 percent less to reflect their particular residence pattern. The percapita public safety rates used in the analysis are presented in Tables 2.1.1-1 and2.1.1-2.
Social Service Expenditures (2.1.3)
Increased social service expenditures (hospital, health and public welfare) arecalculated by applying the per capita social service expenditure rates (Tables 2.1.1-1and 2.1.1-2) against community-based population in-migration and construction workforce in-migration. Health facilities will be provided for military personnel and thushealth service demands were not calculated for this population group.
Environmental Service Expenditures (2.1.4)
Increased infrastructure development (sewage, solid waste, parks and recrea-tion) will require increased maintenance and operation costs in direct proportion tothe level of the in-migrating community-based population. As facilities required forthe military personnel will be provided by the federal government, increasedmaintenance and operation costs are calculated for the community-based populationonly. The per capita environmental service rates are presented in Tables 2.1.1-1and 2.1.1-2.
3
4 J ~~pa~uLm PA=I Buma-NoTnF~o.

2 m~ m. f, a' A ra' Mo 4I. z w ~ 0 Mm N 0 0 ~ N ~ 4
w 19~
>Z Z 0 W In I 0 0n 0 Vn~ 0 0'
~~~~~I 'a N o N . - N
10
W ~ ~ ~ ~ le w 4N
zl 4,, a' ND I) W, CD 4O CO N
~ C.) (0 , N 0 N N ((
En xn N N N N N a 'N a
'-44
z0
C) W
E a3) a' m a' 4,o4,l ,A. U w w 4, W W W (
C' LE U) C,
Q __ EIibLtoO
>4 LO ) cc cc w a' C cc 4,,0 zI a) r
00
0 - ) > ) U 1
W~~~~~ m 0 n ) .4
0w 1 .- El D I l 1 0'
0U~
U
0)u w N1

U0 Z X ND ND 6DC 'D N N %D6N N M N N' NN
6) 06'. 0~ 0N N ' W v 'W 0 ' 6 '6 ' N W 6 '
w bO N N 6 N N N I v 0 N N v
IcC6 w VS V 0 U, m 0 m ON M; MO M M M ;M
4
0 C C O VS . O NO . N .- 0 . . 00 .- . . 00 NCd U, m , 0 r. 0 N r. r. C ' 0, U, U ' C U, ,
Cd0)
r; 4-)4 U C O V CON U, C -0 - OD C C '6 W0C D W '6 C VCDW C
go w u' 4 064 C .40 C C;0 .6 C C .z c MU !t '6 U, MU, In U, M LA M %D 'M M M '6 U, U, M M U,
200
4- 0
0) 0 Nl NO r. '6 N , w6 N '6 U, N N '6W N N N D ' 0 N. Nl w
0.) W.z x
00.
6' 0 ' 06' 6' M6 W 06 6' M OD M ' 0 ' 6' ( 6' W W 6' 6' WD ., c,0 OW v 0 v N 0 0 v 0 0 00 0 v .00 v 4)
C14E
- 0 - - f N v S VS N v- 0- VS N 0 a, v mV 0 - VS u
r, r, C , U , 6' U ' V , U, 6 U ,, r ': 6 C z U , '
o. . . . . . . . ~ . . . .4 . . . C:
v~~~~ ~ ~ ~ N0 wvvv c
U z.
'C E-0CM 0 at 4 . 0 '0 0 6'C M O C C
Lo u
u~~~~~~ -3 - c 9 Lc i

Transportation Expenditures (2.15)
Provision and maintenance of highway facilities, county roads, and city streetsare calculated by directly multiplying the per cap)ta transportation rates (Table2.1.1-1 and 2.1.1-2) by the community-based population in-migration. Constructionworker population in-migration and Air Force population in-migration residingonbase are expected to demand a diminished level of service and thus the per capitarate applied against these two population groups is assumed to be 70 percent less toreflect their particular residence pattern.
Educational Service Expenditures (2.1.6)
Educational service outlays are calculated by multiplying total pupils associa-ted with total population in-migration (community, construction and Air Forcepopulation) by educational expenditures per pupil. Per pupil rates are presented inSection 3, table 3.1.1-1 and Table 3.1.1-2. The estimates presented assume thatservice standard levels (pupil/teacher) ratios remain constant throughout the periodof analysis.
Miscellaneous Expenditures (2.1.7)
Increased miscellaneous outlays are calculated by applying the miscellaneousexpenditures per capita (Table 2.1.1-1 and 2.1.1-2) to the community-basedpopulation in-migration. Construction camp based and onbase personnel areexpected to contribute ncgligible demands and are not included in the calculations.
Property Tax Revenues (2.1.8)
Increased property tax revenues are calculated by applying the community-based population in-migration directly to the property tax revenues per capita.These revenues have been lagged one year. Construction camp based and militarypersonnel living on-base are not assumed to contribute to this revenue source. Theper capita property tax rates used in the analysis are presented in Tables 2.1.1-1 and2.1.1-2.
Other Tax Revenues (2.1.9)
Other tax revenues (sales, income, other) are anticipated to rise in directproportion to the community-based population in-migration. Construction workerpopulation in-migration, however, will have a greater effect upon other tax revenuesdue to their higher incomes and differing consumption patterns. Per capita rateswere adjusted upward by 16 percent to reflect their differing consumption patterns(Construction Worker Profile, Old West Regional Commission, 1975). Military per-sonnel and their dependents will have the use of base facilities, thus the contributionof Air Force population will be less than the other in-migrating population groups.Thus, the per capita rates employed are assumed to be 75 percent less. The percapita rates for other tax revenues are presented in Tables 2.1.1-1 and 2.1.1-2.
Service Charge Revenues (2.1.10)
Service charges (licenses, permits, fines and fees) are calculated by directlyapplying the service charge revenues per capita rate (Tables 2.1.1-I and 2.1.1-2)
. ,,6

against the community-based population in-migration. Air Furce population in-migration living onbase and con'struction worker population in-migration, due totheir residence patterns, also contribute to service charges but to a lesser extent.Per capita rates applied to these populations are assumed to be 75 percent less toreflect the particular residence characteristics.
Intergovernmental Revenues (2.1.11)
Intergovernmental revenues (grants-in-aid, revenue sharing monies, in-lieutaxes) are assumed to be not available to the local jurisdictions. Revenuesgenerated from state and federal sources for educational support, however, havebeen included in the aralysis. Federal m.'nies under P.L. 81-874 have been allocatedfor the number of school age military dependents who live onbase (3A pupils); thenumber of school age dependents of both military and civilian personnel who workonbase and reside in the community (3B pupils); and the number of school agedependents of construction worker population employed on a federal project (3Cpupils). The revenues are calculated by multiplying the respective pupil categoriesby $872 per pupil (3A pupils), $436 per pupil (3B pupils), and $392 per pupil (3Cpupils) respectively.
It is anticipated that grants-in-aid, revenue sharing monies, and in-lieu taxeswill be available to local governmental jurisdictions at levels above current levels.These intergovernmental transfers would form a major source of mitigations. Theactual levels of such funding will be negotiated by state and local agencies on theone hand and representatives of the federal government on the other hand. Moredetailed and jurisdiction-specific analyses will be prepared in close cooperation withall potentially affected governmental bodies. The methodology reported heresupports a more general analysis for the EIS that allows comparison of variousalternatives.
2.2 LOCAL GOVERNMENT EXPENDITURE AND REVENUE MODULE:ALGORITHMS AND DEFINITIONS
Output Variables (2.2.1)
EXPENDITURES
ADMij = PCADMij * CMPOPij
PS'' (PCPS. * CCPOP.) + (PCPS.. * CMPOP.j) + (PCPSi. *
AFPOY1 * WEIGHfJ 1)
SOCi = (PCSOCij * CMPOP..) + (PCSOCiJ * CCPOP)ij
ENVIRij = PCENVIRij * CMPOPiqTRANS.- (PCTRANS.. * CMPOP..) + IPCTRANS.. * CCPOP.. *
WEIGHT l)'J+ (PCTRANS! * AFPOP.. * WPIGHT 1) 'j
EDUC.. PUP.. * PPEXP..•Ii IJ I]
17

A
MISCi PCMISCij * CMPOPij
TTEXP = - ADM.. + PSij + SOCij + ENVIRij + TRANSij + EDUCij +MIS&'.
BTEXP.. (PCADM.. + PCPS.. + PCSOC.. + PCENVIR.. + PCTRANS..R EVENUES + PCEDb&i + PCI&hSCij) * BdbPi j
PRT.ij-1REVENUES
PRPTX.j PCPRPTX * CMPOPij_1
OTTX = (PCOTTX.. * CMPOP..) + (PCOTTX.. * CCPOP..WEIGHT + (PCOTTX.IJ* AFPOPij * WVIGHT 3) 'j
SERV = (PCSERV.. * CMPOP..) + (PCSERV.. * CCPOP..WEIGHT3J + (PCSERVij 4 AFPOPij * WEIGHT3)
ZLOCREVij = PRPTXiq + OTTXIj + SERV ij
ZIGREV (PPREVS.. * PUP..) + (ASTUDT * PUPM..) + (BSTUDT *PUPC..) j+l (CSTUDI * PUPCCij)
TTREVij = ZLOCREVij + ZIGREV..
ZIMP. = TTREV.. - TTEXP..
BTREVij = (PCPRPTX.. + PCOTTXij + PCSERV.. + PCIGREVi]) *
BPOP..1]1Ij
where:
ADM.. M-X related administrative expenditures for county i, year]j.
BTEXP.. = Total baseline expenditures for county i, year j.
BTREV.. = Total baseline revenues for county i, year j.
EDUC. = M-X related education expenditures for county i, year j.
ENVIR.. = M-X related environmental service expenditures (sewerage,natural resources, parks and recreation) for county i, year
MISC.• M-X related miscellaneous expenditures for county i, year
j.
OTTXij M-X related other tax revenues (sales, income, other) forcounty i, year j.
PRPTX. M-X related property tax revenues for county i, year j.
=PSij M-X related public safety expenditures for county i, year j.
i8
,..- -
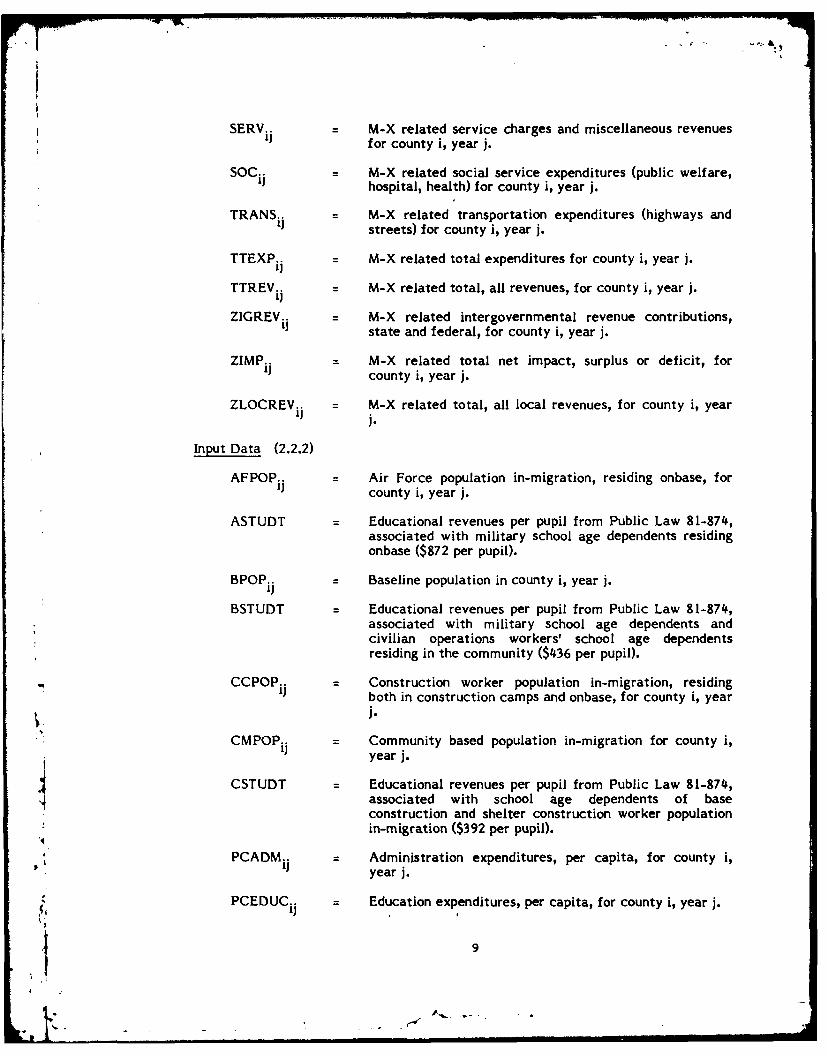
SERV. = M-X related service charges and miscellaneous revenuesiI for county i, year j.
SOC = M-X related social service expenditures (public welfare,hospital, health) for county i, year j.
TRANSi1 = M-X related transportation expenditures (highways and
streets) for county i, year j.
TTEXP. = M-X related total expenditures for county i, year j.
TTREV.. = M-X related total, all revenues, for county i, year j.1)
ZIGREVij M-X related intergovernmental revenue contributions,state and federal, for county i, year j.
ZIMP.. = M-X related total net impact, surplus or deficit, forcounty i, year j.
ZLOCREV.. = M-X related total, all local revenues, for county i, year]j.
Input Data (2.2.2)
AFPOPij = Air Force population in-migration, residing onbase, forcounty i, year j.
ASTUDT = Educational revenues per pupil from Public Law 81-874,associated with military school age dependents residingonbase ($872 per pupil).
BPOP = Baseline population in county i, year j.Ii
BSTUDT = Educational revenues per pupil from Public Law 81-874,associated with military school age dependents andcivilian operations workers' school age dependentsresiding in the community ($436 per pupil).
CCPOP.. Construction worker population in-migration, residingboth in construction camps and onbase, for county i, yearj.
CMPOP ij Community based population in-migration for county i,year j.
CSTUDT Educational revenues per pupil from Public Law 81-874,associated with school age dependents of baseconstruction and shelter construction worker populationin-migration ($392 per pupil).
PCADMij Administration expenditures, per capita, for county i,* year j.
PCEDUCij Education expenditures, per capita, for county i, year j.
o = . I
.1! 9 I I II I

PCENVIRij Environmental service expenditures (sewerage, parks andrecreation, natural resources) per capita, for county i,
year j.
PCIGREV.- Intergovernmental revenues (state and federal1J contributions) per capita, for county i, year j.
PCMISC.. Miscellaneous expenditures, per capita, for county i,Ii year j.
PCOTTX.. Other tax revenues (sales, income, other) per capita, forii county i, year j.
PCPRPTX.. = Property tax revenues, per capita, for county i, year j.I]
PCSERV=. = Service charges and miscellaneous revenue, per capita,for county i, year j.
PCSOC.. Social Service expenditures (health, hospital, publicwelfare), per capita, for county i, year j.
PCPSij Public Safety expenditures (police, fire, correction), percapita, for county i, year j.
PCTRANS ij Transportation expenditures (highways, streets), per
capita, for county i, year j.
PPEXP.. = Education expenditures, per pupil, for county i, year j.
PPREVS.. = Educational revenues per pupil, state contributions, forcounty i, year j.
PUP.. Total pupils associated with total population in-migration for county i, year j.
PUPCij P,,Dils of military personnel, and civilian operationsworkers' school age dependents residing in thecommunity, for county i, year j.
PUPCC.. Pupils of base construction and shelter constructionW worker population in-migration, residing in the
community, for county i, year j.
PUPM.. Pupils of military personnel, residing onbase, for county
i, year j.
WEIGHT I Weighting factor reflecting decreased level of publicservice demands associated with Air Force population in-migration residing onbase, and construction workerpopulation in-migration residing in construction camps.These population groups are assumed to demand 70percent less of the services normally demanded bycommunity based population in-migration for servicessucn as public safety and transportation related items.
10* o i i

WEIGHT 2 Weighting factor (16 percent) reflecting increased levelof consumption demand associated with constructionworker population in-migration. The factor is appliedagainst the construction ,worker in-migration whencalculating their influence on increased local taxpayments (other than property taxes).
WEIGHT 3 Weighting factor (25 percent) reflecting decreasedservice change revenues associated with Air Forcepopulation in-migration residing onbase and constructionworker population in-migration, residing in constructioncamps. This factor is also used in reducing the militarypersonnel's influences on other tax revenues (taxrevenues other than property taxes).
1

3.0 EDUCATION MODULE
3.1 INTRODUCTION
The Education Module estimates the aggregate expenditures and revenues ofthe potentially affected school districts for each county area from 1982 through1994. Section 3.2 presents the algorithm used in the analysis and the variabledefinitions. The following discussion presents the assumptions and a generaldescription of the expenditure and revenue categories that comprise the EducationModule.
Revenues (3.1.)
Total baseline revenues are calculated as the sum of baseline state and federaleducational revenue contributions and local educational revenues. State and federalrevenues are determined by multiplying the state (includes the federal contribution)educational revenues per pupil for each county directly by the number of baselinepupils. Baseline local educational revenues are derived from the per capita localeducation revenues multiplied by baseline population. The local per capita and perpupil rates are presented in Tables 3.1.1-1 and 3.!.1-2.
Revenues accruing to the local school districts due to M-X activities arecalculated for the three primary sources available-federal aid (P.L. 81-874), stateaid, and local sources.
Federal education revenue contributions are mandated through Public Law 81-874 which provides impact funds for dependents of federal employees attendingpublic schools. These monies are allocated for the number of schoolage militarydependents who live onbase (3A pupils); the number of schoolage dependents of bothmilitary and civilian personnel who work onbase and reside in the community (3Bpupils); and the number of schoolage dependents of construction workers employedon a federal project (3C pupils). Revenues are determined by multiplying therespective pupil category by $872 per pupil (3A pupils), $436 per pupil (3B pupils),and $392 per pupil (3C pupils), respectively.
State sources are calculated by multiplying the total number of additionalpupils generated by M-X by the state revenues per pupil rate as presented in Tables3.1.1-1 and 3.1.1-2.
Local educational revenues are a sum of related tax collections (sales,property, motor vehicle), thus the per capita local educational revenue is multiplieddirectly by the population groups expected to create fiscal impacts. This revenuesource has been lagged one year.
Expenditures (3.1.2)
Total educational expenditures are calculated as the sum of baseline expendi-tures plus total M-X impacts (direct and indirect). Total baseline and M-X impactexpenditures are derived by directly multiplying the total per pupil educationalexpenditure rate with total baseline pupils for the former and with pupils associated
,* with total population in-migration for the latter. The per pupil rates used in the4analysis are presented in Tables 3.1.1-1 and 3.1.1-2.
13
qi pwnw piGS uAw-ma nudo
FU
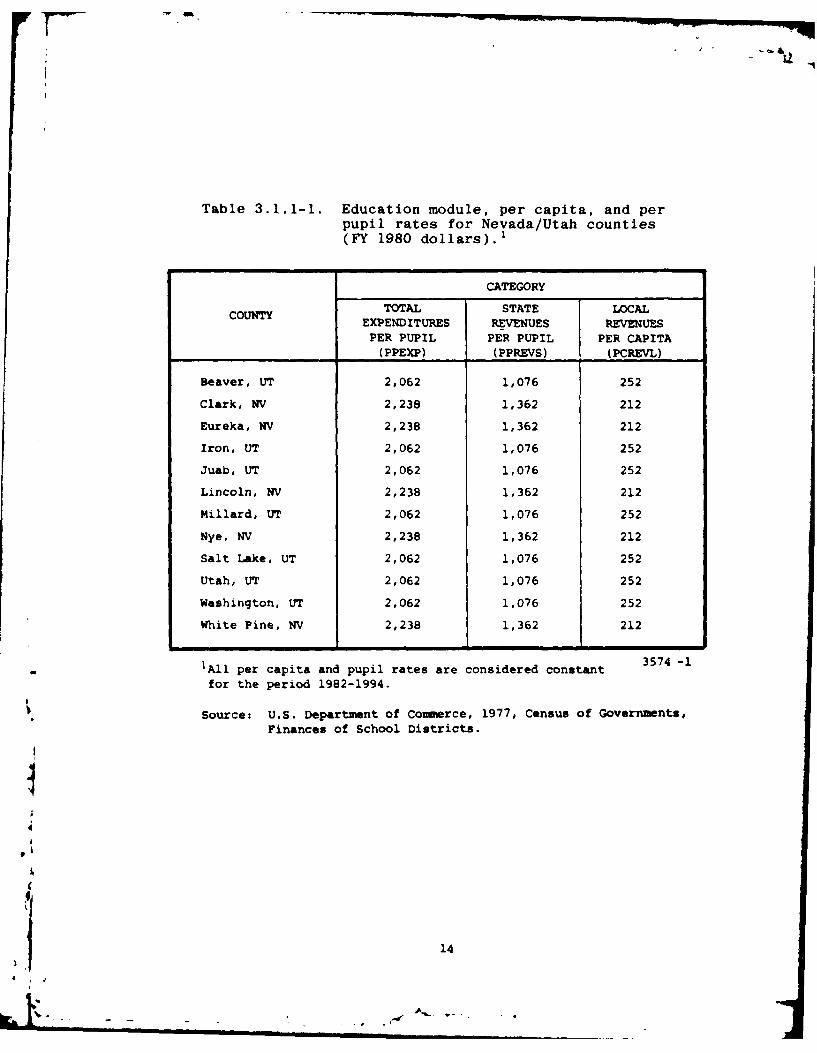
Table 3.1.1-1. Education module, per capita, and perpupil rates for Nevada/Utah counties(FY 1980 dollars). 1
CATEGORY
COUNTY TOTAL STATE LOCALEXPENDITURES REVENUES REVENUESPER PUPIL PER PUPIL PER CAPITA
(PPEXP) (PPREVS) (PCREVL)
Beaver, UT 2,062 1,076 252
Clark, NV 2,238 1,362 212
Eureka, NV 2,238 1,362 212
Iron, UT 2,062 1,076 252
Juab, UT 2,062 1,076 252
Lincoln, NV 2,238 1,362 212
Millard, UT 2,062 1,076 252
Nye, NV 2,238 1,362 212
Salt Lake, UT 2,062 1,076 252
Utah, UT 2,062 1,076 252
Washington, UT 2,062 1,076 252
White Pine, NV 2,238 1,362 212
1All per capita and pupil rates are considered constant 3574 -1
for the period 1982-1994.
Source: U.S. Department of coumerce, 1977, Census of Governments,Finances of School Districts.
1
1,
Cl
'I
: 14
4

Table 3.1.1-2. Education module, per capita, andper pupil rates for Texas/NewMexico counties (FY 1980 dollars).
1
CATEGORY
COUNTY TOTAL STATE LOCALEXPENDITURES REVENUES REVENUESPER PUPIL PER PUPIL PER CAPITA(_pypi (PPREVS) (P(RrVYA1
Bailey, TX 1,767 939 208
Castro, TX 1,767 939 208
Chaves, NM 2,022 1,630 96
Cochran, TX 1,767 939 208
Curry, NM 2,022 1,630 96
Dallam, TX 1,767 939 208
Deaf Smith, TX 1,767 939 208
De Baca, NM 2,022 1,630 96
Hale, TX 1,767 939 208
Harding, NM 2,022 1,630 96
Hartley, TX 1,767 939 208
Hockley, TX 1,767 939 208
Lamb, TX 1,767 939 208
Lea, NM 2,022 1,630 96
Lubbock, TX 1,767 939 208
Moore, TX 1,767 939 208
Oldham, TX 1,767 939 208
Parmer, TX 1,767 939 208
Potter/Randall, TX 1,767 939 208
Quay, NM 2,022 1,630 96
Roosevelt, NM 2,022 1,630 96
Sherman, TX 1,767 939 208
Swisher, TX 1,767 939 208
Union, NM 2,022 1,630 96
3573 -1
IAII per capita and per pupil rates are considered constant*for the period 1982-1994.
Source: U.S. Department of Comerce, 1977 Census ofGovernments, Finances of School Districts.
15

3.2 SCHOOL DISTRICT/COUNTY SPECIFIC EDUCATION ALGORITHM ANDVARIABLE DEFINITIONS
Output Variables 1 (3.2.1)
BASELINE REVENUE
BSREV.. BPUP.. * PPREVS..
BLREV.. BPOP.. * PCREVL..1) ii ij
BTTREVij : BSREVij + BLREVij
M-X REVENUE
PFED.. (ASTUDT * PUPM..) + (BSTUDT * PUPC..) + (CSTUDT *PF~iPUPCCij) i
STATE.)..
STATE. : PPREVSij * PUPij
LOCAL. : PCREVL * CMPOP.
LOCL.ij-1 idj-ITOTALiJ : PFEDij + STATEij + LOCALij
TOTAL REVENUE
TOTREV ij BTTREVij + TOTALi
EXPENDITURES
BTTEXP.. = BPUP.. * PPEXP..1) IJ IJ
ZMXEXP.. = PUP.- * PPEXP..IJ 1J I
TOTEXPij = BTTEXPij + ZMXEXPij
NET IMPACT
BMPACT.. BTTREV - BTTEXP..
,ZMPACTij TOTALij - ZMXEXPij
TOTIMP. : BMPACTij + ZMPACTij
. 1. All school districts are considered as county school districts except for Curry'1. County, New Mexico, designated as Clovis Independent School District and
Dallam and Hartley counties in Texas, designated as Dalhart IndependentSchool District.
16

r 7
where:
BLREV.. Baseline local educational revenue contributions forcounty i, year j.
BMPACTi. Total educational baseline impact (surplus or deficit) forcounty i, year j.
BSREV. Baseline state and federal educational revenuescontributions for county i, year j.
BTTREVij = Total baseline educational revenues for county i, year j.
BTTEXP.. = Total baseline educational expenditures for county i,year j.
LOCALij Local education (M-X-induced) revenue contributions,county i, year j.
PFED.. Educational revenue contributions from the federalgovernment associated with Public Law 81-874 forcounty i. year j.
STATEij State education (M-X-induced) revenue contributions,county i, year j.
TOTALij Total education revenues (M-X-induced) federal, state,and local contributions, county i, year j.
TOTEXP.. Total, all educational expenditures, baseline plus M-Xinduced expenditures for county i, year j.
TOTIMP.. Total, all educational impacts, baseline plus M-Ximpacts for county i, year j.
TOTREV.. Total, all educational revenues, baseline plus M-X-induced revenues for county i, year j.
ZMPACTj Total educational M-X-induced impacts for county i,year j.
* ZMXEXPij Total M-X-induced educational expenditures for county
i, year j.
Input Data (3.2.2)
AFPOPi. Air Force population in-migration, residing onbase, forcounty i, year j.
ASTUDT Educational revenues per pupil from Public Law 81-874associated with military school age dependents residingonbase ($872 per pupil).
C BPOPij Baseline population in county i, year j.
17
4 •i

BPUPij = Baseline pupils in county i, year j.
BSTUDT '= Educational revenues per pupil from Public Law 81-874associated with military school age dependents andcivilian operations , workers' school age dependentsresiding in the community ($436 per pupil).
CMPOPij Community based population in-migration for county i,year j.
CSTUDT Educational revenues per pupil from Public Law 81-874associated with school age dependents of base andshelter construction worker population in-migration($392 per pupil).
PCREVLij Educational revenues per pupil, local contributions, forcounty i, year j.
PPEXP.. = Educational expenditures per pupil for county i, year j.
PPREVSj = Educational revenues per pupil, state contributions, forcounty i, year j.
PUP. = Total pupils associated with total population in-migration for county i, year j.
PUPC ij Pupils of military personnel, residing offbase, andcivilian operations workers' school age dependents forcounty i, year j.
PUPCCij Pupils of base and shelter contruction worker populationin-migration residing in the community, for county i,year j.
PUPMij Pupils of military personnel, residing onbase, for countyi, year j.
A
18
U A

4.0 CAPITAL EXPENDITURE MODULE
4.1 MODEL STRUCTURE AND DESCRIPTION
Nine categories of capital expenditure requirements for local governments inthe deployment areas are estimated. These expenditures are for police, fire,general government, health care, library, street, wastewater, water distribution, andeducational service facilities. In each case these costs are derived from estimatesof the related investment in each region of analysis. All capital requirements arepresented in 1980 dollars. Table 4-1 presents the factors that determine thespecific capital investment requirements. Additionally, the estimates for healthservice facility investments costs are reduced by 70 percent to reflect theprobability that this portion of the related investment costs will be provided byprivate concerns. Likewise, the street and transportation system investment costsare reduced to 77 percent of the total investment requirements to reflect the factthat private developers will pay for the initial capital costs for providing the minorstreets that serve residential and some commercial areas. The estimates presentedassume a linear relationship through time for all capital expenditures. Someeconomies of scale may exist for certain expenditures but this concern has not beenaddressed. In addition, many of the peak year demands could be supplied bytemporary facilities which could reduce the peak year costs substantially. Theestimates presented basically reflect average costs which assume that servicestandard levels are not allowed to deteriorate to substandard levels.
4.2 ALGORITHM AND VARIABLE DEFINITION
Public Facilities
POLFACij = CMPOPij * PCPOLij
FREFAC.. CMPOP.. * PCFRE..
ADMFAC.. = CMPOP.. * PCADM..1J 1] 1]
HLTHFAC.. = CMPOP.. * PCf-LTH.. * Weight Aij ij ij
LIBFACG. = CMPOP.. * PCLIB..
Street System
ART = ARTLij * .ARTCSTiJ
COL i = COLL : * COLCST i
UtilitiesRSS SFU. * SFUCS..i + MFUi." * MFUCSij + MHUij
RWTR SFU.* SFUCW.. + MFU.. * MFUCW.. + MHU.. *
J MH ]W
NRSS.. RSSi. * Weight B
19
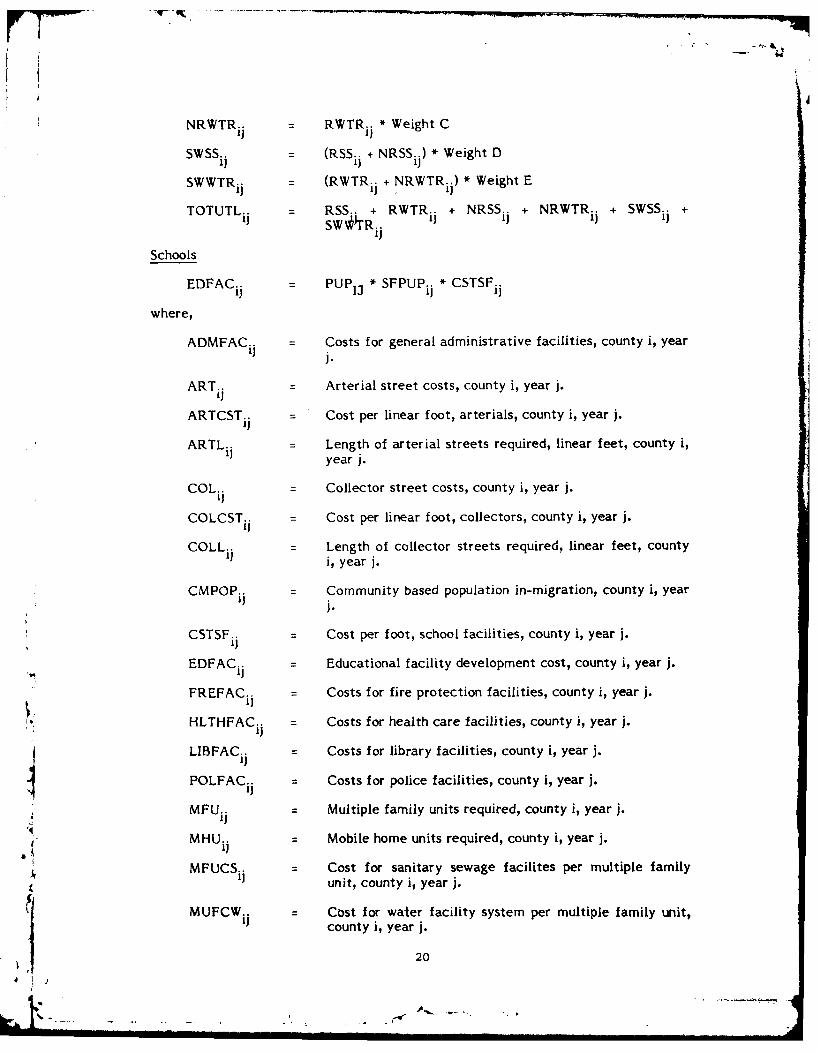
NRWTR.. = RWTRiJ * Weight Ci i
SWSSij = (RSSij + NRSSij) * Weight D
SWWTRij (RWTRij + NRWTR..) * Weight E
TOTUTL.. - RSS.. + RWTR.. + NRSSij + NRWTRij + SWSSijSW'*TR..1)]
1)
Schools
EDFACij PUP1I * SFPUPij * CSTSFij
where,
ADMFACij Costs for general administrative facilities, county i, year
j.
ART.. = Arterial street costs, county i, year j.i
ARTCST.. = Cost per linear foot, arterials, county i, year j.Ii
ARTLij = Length of arterial streets required, linear feet, county i,year j.
COL.. = Collector street costs, county i, year j.ii
COLCST.. - Cost per linear foot, collectors, county i, year j.
COLL.. - Length of collector streets required, linear feet, countyi, year j.
CMPOP.. Community based population in-migration, county i, year
j.
CSTSF ij Cost per foot, school facilities, county i, year j.
EDFACi~ = Educational facility development cost, county i, year j.
FREFACij = Costs for fire protection facilities, county i, year j.
HLTHFACij = Costs for health care facilities, county i, year j.
LIBFAC.. Costs for library facilities, county i, year j.Ii
POLFACij Costs for police facilities, county i, year j.
MFU.- Multiple family units required, county i, year j.i
MHUi. Mobile home units required, county i, year j.
MFUCS. : Cost for sanitary sewage facilites per multiple familyIunit, county i, year j.
IMUFCW F Cost for water facility system per multiple family unit,county i, year j.
20
- . ... .

V7
MHUCS ij Cost for sanitary sewage facilities per mobile home unit,county i, year j.
MHUCWij Cost for water facility system per mobile home unit,
county i, year j.
SFU ij Single family units required, county i, year j.
SFUCS.. = Cost for sanitary sewage facilities per single family unit,1) county i, year j.
SFUCW.. Cost for water facility system per single family unit,county i, year j.
PCAbMij Per capita rate for administrative facilities, county i,year j.
PCHLTHj Per capita rate for health care facilities, county i,year j.
PCFRE.. Per capita rate for fire protection facilities, county i,1] year j.
PCPOL.. = Per capita rate for police facilities, county i, year j.
PCLIBi. = Per capit rate for library facilities, county i, year j.
PUP - Total pupil in-migration, county i, year j.
NRSSij = Nonresidential sanitary sewage costs, county i, year j.
NRWTR. = Nonresidential water system development costs, countyi, year j.
RSS.. = Residential sanitary sewage costs, county i, year j.i
RWTR ij Residential water system development costs, county i,year j.
SFPUPij = Square footage requirements, per pupil, county i, year j.
SWSS.. = System-wide development cost for sanitary sewagefacilities, county i, year j.
SWWTRi - System-wide development cost for water systemdevelopment, county i, year j.
TOTUL ij = Total utility cost requirements for county i, year j.
* WEIGHT A Weighting factor of 30 percent to reflect the probabilitythat this amount of the estimated health care facility
*costs will be provided by public agencies.
21

WEIGHT B Estimate of the nonresidential sanitary sewage facilitycost as a percentage of the rcsidential cost - 40 percent.
WEIGHT C Estimate of the, nonresidential water systemdevelopment cost as a percentage of the residential cost- 20 percent.
WEIGHT D Estimate of the system-wide sanitary sewagedevelopment cost as a percentage of total residentialand nonresidential cost - 40 percent.
WEIGHT E Estimate of the system-wide water sytsem developmentcost as a percentage of total residential andnonresidential cost -20 percent.
• I.4
t 22

Table 4.1. Rates used in calculating the local government
capital expenditures requirements (1978 dollars).
PUBLIC UTILITIES
Police Population living in communities x $48. per capitaPire Population living in communities x $39. per capita
Government Admin. Population living in communities x $24. per capitaHealth Care Population living in communities x $286 per capita
Libraries Population living in communities x $50. per capita
STREET SYSTEM
Arterials Street length x $45. per linear feet
Collectors Street length x $35. per linear feet
Minor Streets Street length x $25. per linear feet
UTILITY
Residential
Sanitary/Sewerage Single Family Units x $1,000 per unit
Multiple Family Units x $400 per unitMobile Homes x $600 per unit
Water Single Family Units x $650 per unit
Multiple Family Units x $260 per unitMobile Homes x $390 per unit
Non-Residential
Sanitary/Sewerage Residential Sanitary/Sewerage Costs x .40
Water Residential Water Costs x .20
System Wide
Sanitary/Sewerage Residential' Plus Non-Residential Sanitary/Sewerage• Costs x .40
Water Residential plus non-residential water costs x .20
SCHOOLS
" Facility Develop -Iment Costs Pupils x 98 square feet per pupil x $47. per ft.
2
3582-1
23
m -- ! I II I l - II $ I I II

REFERENCES
Council of Economic Advisors, Economic Report of the President, 1980.
Murphy/Williams Urban Planning and Housing Consultants, Socioeconomic ImpactAssessment: A Methodology Applied to Synthetic Fuels, April 1978.
U.S. Department of Commmerce, 1977. Census of Governments, Compendium ofGovernment Finances.
U.S. Department of Commerce; 1977 Census of Governments, Finances of SchoolDistricts.
°U.3. ,OVEM EN' PRINTING OFFICE 1901 0-7 3/284
"4
~24.I
II4 I II [n m , ,. . n
