rcinrcin.org.pl/content/4189/wa51_13384_r1995-t65_geogr... · l. ryszkowski, a....
TRANSCRIPT

POLISH ACADEMY OF SCIENCES INSTITUTE OF GEOGRAPHY AND SPATIAL ORGANIZATION
GLOBAL CHANGE: POLISH PERSPECTIVES 2
POLISH NATIONAL COMMITTEE INTERNATIONAL GEOSPHERE-BIOSPHERE PROGRAMME

Editorial Board
PIOTR KORCELLI (Editor) JERZY GRZESZCZAK, JERZY KOSTROWICKI STANISŁAW LESZCZYCKI, BRONISŁAW CZYŻ (Secretaiy)
Address of the Editorial Board Geographia Polonica
Krakowskie Przedmieście 30 00-927 Warszawa Poland
Editorial Board of the series Global Change: Polish Perspectives
LESZEK STARKEL (Editor) CZESŁAW DRUET, TADEUSZ FŁORKOWSKI KRYSTYNA GRODZIŃSKA, ZDZISŁAW KACZMAREK MAŁGORZATA GUTRY- KORYCKA (Secretaiy)
Volume published thanks lo financial supplementation provided by the Polish State Committee for Scientific Research
© Copyright by Instytut Geografii i Przestrzennego Zagospodarowania Polskiej Akademii Nauk
ISBN 83-901355-1-5
http://rcin.org.pl

POLISH ACADEMY OF SCIENCES
INSTITUTE OF GEOGRAPHY AND SPATIAL ORGANIZATION
POLISH NATIONAL COMMITTEE IGBP - GLOBAL CHANGE
GEOGRAPHIA POLONICA
65 GLOBAL CHANGE: POLISH PERSPECTIVES
2
EDITED BY LESZEK STARKEL & MALGORZATA GUTRY-KORYCKA
http://rcin.org.pl

POLISH ACADEMY OF SCIENCES
INSTITUTE OF GEOGRAPHY AND SPATIAL ORGANIZATION
POLISH NATIONAL COMMITTEE IGBP-GLOBAL CHANGE
Preparedfor pńnt and printed by Wydawnictwo Akapit - DTP Sp. z o. o.
ul. Skolimowska 4 / 1 1 , 0 0 - 7 9 5 Warszawa
http://rcin.org.pl

C O N T E N T S
L. Ryszkowski, A. Kędziora: Modification of the effects of global climate change by plant cover structure in an agricultural landscape 5
M. Zimnoch, J. Nęcki, T. Florkowski: Diurnal changes in the isotope composition of atmospheric CO2 in Kraków 35
J. P. Girjatowicz, K. M. Kożuchowski: Contemporary changes of Baltic Sea ice 43 A. A. Ali: Reflections on climate variability within selected monthly mean time series
in Libya and neighboring countries 51 A. Witkowski, J. Pempkowiak: Reconstructing the development of human impact
from diatoms and 210Pb sediment dating (The gulf of Gdańsk — Southern Baltic Sea) 63
R. Domański: Structural changes in geographical systems. Fulfilling the conditions of sustainable development 79
T. Żylicz: Global environmental policy: the role for economic instruments 91 G. D. Anderson: Joint implementation projects to reduce greenhouse gas emissions:
prospects for Poland I l l
http://rcin.org.pl

http://rcin.org.pl

GEOGRAPHIA POLONICA 65, 1995
M O D I F I C A T I O N O F T H E E F F E C T S O F G L O B A L C L I M A T E C H A N G E
B Y P L A N T C O V E R S T R U C T U R E
I N A N A G R I C U L T U R A L L A N D S C A P E
L E C H RYSZKOWSKI, A N D R Z E J KĘDZIORA
Research Centre for Agricultural and Forest Environment Polish Academy of Sciences
ul. Bukowska 19, 60-809 Poznań, Poland
ABSTRACT: To grasp the impact of plant cover structure on heat balance structure the components of heat balance of six ecosystems and two landscapes were calculated by using a mathematical model. The following three types of meteorological conditions during the growing season were taken into consideration: — Real meteorological conditions for normal, wet and dry years chosen from observations made in the period 1956-1992. — Assumed model meteorological conditions for a normal year, (averages from long-term values of meteorological data), and for an extremely dry and hot year, and an extremely wet and cold year. — Predicted meteorological conditions resulting from global changes. The analysis of various meteorological situations has shown that plant cover has mitigating capacities in relation to the presumed effects of global climate change. Thus, in attempts to predict global changes at local level, the mitigating effects of plant cover must be taken into consideration.
KEY WORDS: Impact of global climate change, predicted meteorological conditions, agricultural landscape, heat balance, water balance, shelterbelts.
INTRODUCTION
Studies on the problems of global climate change have recently been increasing in number and are no longer merely drawing the attention of scientists, but also provoking vivid discussion in public circles. This was enhanced by the appearance of anomalously high temperatures at the end of 1980s and the first three years of the 1990s. The large International Geosphere — Biosphere Programme (IGBP) was called into being in recognition of the fact that industrial activity, biomass burning, agriculture, volcanic eruptions and the metabolic activity of some animals and microbes
http://rcin.org.pl
6 L. Ryszków ski, A. Kędziora
can influence the release of the so called greenhouse gases into the atmosphere, which can in turn cause changes in the heat balance of the Earth and thus lead to global climate change. The problems ofglobal change entered worldwide political perceptions in 1988, with the launching of the Intergovernmental Panel on Climate Change (IPCC), which proposed the Framework Convention on Climate Change discussed at the United Nations Conference on Environment and Development in Rio de Janeiro, 1992.
Both the IGBP and the IPCC have provided opportunities for scientific activity concerning climate changes, and this has resulted in significant progress in our understanding of the functioning of the Earth studied as a whole system.
A synthesis of knowledge concerning the functioning of a system is provided by models which translate conceptual ideas into quantitative forms, and make it possible to project possible changes of the system in the future. Projections of future climate trends worldwide are obtained from general circulation models (GCMs), which have recently been improved substantially by taking into account transient, rather than equilibrium states of the atmosphere, and by coupling GCMs with models of the exchange of heat and gases between ocean and atmosphere (Washington and Meehl 1989, Stouffer et al. 1989, Jager 1990, Gates et al. 1992). GCM simulation of local changes has low confidence, but attempts are being made to improve the resolution of models at the regional level (Goodess and Palutikof 1992). The prediction of climate changes on regional scales is uncertain not only because the relationships between air temperature, water cycling, cloudiness, the speed and direction of wind and other factors are poorly understood, but also because the proposed models neglect the modifying effects of the land surface configuration on the local climate.
These drawbacks in modelling have not prevented valuable studies being done to analyse the effects of climate change on the hydrological regime (Gleick 1989), agriculture (Adams et al. 1990, Parry 1992), natural vegetation (Smith et al. 1992) and soils (Bouwman 1990, Anderson 1992). Elucidated in these studies were the various potential consequences of global climatic changes, as approximated by GCMs. The results of these studies have encouraged a grasp of the fact that global changes are influencing a great range of natural processes, as well as the socio-economic development of human society (Jager and Ferguson 1991, Scott et al. 1990, Mooney et al. 1993). A model of the global system is starting to emerge from the results of these evaluations of the functional characteristics of the Earth.
In Poland several scientists have begun work on the problems of global change. The Polish National Committee for IGBP organized a conference to inform the Polish scientific community about recent developments in international research concerning global changes, and to present original studies on the impact of the projected changes on Polands environment, and on the consequences of these for agriculture and human activities (Starkel
http://rcin.org.pl
Modification of effects of global climate change.. 7
et al. 1993). Studies on contemporary climate change in Poland and global warming were also presented in 1993 at conference organized by climatologist in Szczecin (Kożuchowski 1993).
But in all these efforts to project future climatic changes and elucidate their effects on the biosphere and human society, one can hardly find studies on the mitigation of the presumed events by the structure of the vegetation covering a watershed or region. Studies carried out at the Research Center for the Agricultural and Forest Environment of the Polish Academy of Sciences, and the Chair of Agrometeorology at the Agricultural Academy (both located in Poznań) has led to the working-out of a model estimating the heat balance for a large area on the basis of meteorological characteristics and the parameterization of plant cover structure (Ryszkowski and Kędziora 1987, Olejnik 1988, Kędziora et al. 1989, Olejnik and Kędziora 1991, Ryszkowski et al. 1991, Ryszkowski and Kędziora 1993a and b). Use of the model makes it possible to estimate in a given region the effect of plant cover structure (the vegetation cover of cultivated fields, afforestations, shelterbelts, meadows, etc.) on évapotranspiration and air and soil heating, for a particular meteorological regime in the course of the year. By taking presumed patterns of temperature and precipitation conditions from GCM it is then possible to estimate the modification of meteorological conditions as a result of the structure of the plant cover in the landscape. It is the capacity of the structure of plant cover to mitigate climatic change that is the object of this study.
STUDY AREA
The Research Center for the Agricultural and Forest Environment has done its long-term studies on energy flows and matter cycling in vicinity of Turew on area of very slightly undulating plains with many drainage channels. The differences in elevation between higher and lower parts of the area do not exceed a few meters. There is a prevalence of light soils with conditions favourable to water infiltration (Udipsamments and Hapludalfs) and the only differing areas are a few small depressions with Haplaquolls soils. The depth of the water table is related to elevation and is up to 5.0 m. Its depth fluctuates during the year in relation to the annual water regime. The climate of the area is one of the warmest in Poland with a mean annual air temperature of 8°C. The growing season (with air temperatures above 5°) lasts 225 days. The mean annual precipitation for the years 1881-1985 was 594 mm (Ryszkowski and Kędziora 1987).
In the period 1956-1992, mean precipitation in the growing season (March 21 to the end of October) amounted to 440 mm, while the average value for precipitation in the three driest years was 234 mm, and that for the three most humid 649 mm (Tab. 1). The heat balance was estimated for different ecosystems, in the average meteorological conditions occurring in normal, wet and dry years, in order to evaluate the modyfing influence exerted by shalterbelts on the heat balance structure of the landscape.
http://rcin.org.pl

8 L. Ryszków ski, A. Kędziora
Table 1. Real air temperature t[°C], relative sunshine u (dimensionless), and precipitation P [mm] in wet, normal and dry years in Turew
Moisture conditions Month Wet Normal Dry
t[°C] u P t[°C] u P t[°C] u P March 5.0 0.230 47 3.6 0.343 30 5.1 0.378 23 April 8.7 0.352 53 8.0 0.345 51 7.5 0.430 29 May 13.1 0.372 90 12.5 0.422 60 13.3 0.487 34 June 17.7 0.396 122 16.6 0.410 69 16.7 0.432 31 July 18.0 0.365 146 17.1 0.453 68 19.6 0.511 46 August 16.9 0.380 67 17.5 0.387 58 18.1 0.477 33 September 14.6 0.431 47 12.9 0.412 52 14.1 0.426 24 October 11.3 0.218 77 8.5 0.298 52 9.0 0.353 14 Mean/Total 13.2 0.343 649 12.1 0.384 440 12.9 0.437 234
Energy flows and water cycling were studied by a variety of climatological, hydrological and ecological methods which are described in detail by Kędziora et al. (1987), Ryszkowski and Kędziora (1987), Olejnik (1988), Kędziora et al. (1989), Kędziora and Tamulewicz (1990), Pasławski (1990), and Marcinek et al. (1990).
METHODS AND CALCULATION
The climatological characteristics, such as air and soil temperature, sunshine, wind speed, vapour pressure, saturation vapour pressure deficit, precipitation and humidity, were measured by standard methods under field conditions, as were incoming and reflected solar radiation. Net radiation was measured directly with a net-radiometer, or else estimated by empirical equations (Ryszkowski and Kędziora 1987).
The water balance of the watersheds was calculated by the method of Pasławski (1990), from empirically-derived values for precipitation and water runoff from the area. Water infiltration rates for the soil were obtained empirically (Marcinek et al. 1990).
The heat balance of ecosystems is described by the following equation:
Rn + LE + S + G = 0, (1)
where Rn is net-radiation; LE — latent heat used in évapotranspiration; S — air sensible heat flux; G — sub-surface heat flux. All components of equation (1) are measured in W m"2, and have positive values when energy flows to an active surface. In other cases they have negative values.
The empirical model created during previous investigations (Kędziora at al. 1989, Olejnik 1988, Olejnik and Kędziora 1991, Ryszkowski and Kędziora 1987, Ryszkowski et al. 1991) was used in all calculations and analyses to estimate heat balance components on the basis of standard meteorological data and characteristics of plant development stages.
http://rcin.org.pl

Modification of effects of global climate change.. 9
Selected to determine the influence of plant cover on heat balance structure were six typical ecosystems and two types of landscape: meadows (M), cultivated fields (C), deciduous forest (Fd), coniferous forest (Fc), bare soil (B), lake (L), cultivated fields with a 10, 20 or 30% cover of deciduous shelterbelts (C+Fd) and cultivated fields with a 10, 20 or 30% cover of coniferous shelterbelts (C+Fc). .
To analyse the influence of plant cover structure on heat balance components, calculations were carried out for three distinguished types of meteorological conditions:
(a) Real meteorological conditions for normal, wet and dry years chosen from observations made between 1956 and 1992;
(b) Assumed model meteorological conditions for a normal year (long-term averages for meteorological parameters), an extremely dry and hot year, and an extremly wet and cold year.
(c) Predicted meteorological conditions as a result of global change. All analyses were carried out for growing season, which lasts from March
21 to the end of October in Wielkopolska.
ESTIMATIONS OF HEAT BALANCE UNDER REAL METEOROLOGICAL CONDITONS
Net-radiation was calculated in accordance with the following formula: RN= RS+ R l , where: (2) RS = (1 - a) R0 (0.22 + 0.54u), (3) R l = -5.68 • 10~8 (t + 273)4 (0.56 - 0.08e°'5) (0.10 + 0.90u), (4)
and where: a — albedo (dimensionless), R0 — extra-terrestial solar radiation [Wm" ], RS — intercepted short-wave radiation [W m"2], RL — long-wave net balance [W m"2], u—relative sunshine (dimensionless), t—air temperature [°C], e—water vapour pressure [mbar].
Albedo (a) was calculated as: a = 0.20 + 0.05f (in the case of meadow and cultivated field), (5) a = 0.15 + 0.05f (in the case of deciduous forest), (6) a = 0.15 (in the case of coniferous forest), (7)
a = 0.12- 0.06 sin f ( i - 3 ) (in the case of the lake), (8)
a = 0.18 (in the case of bare soil — the mean value for the Turew soils), (9) where: f — plant development stage taken from phenological observations by Karliński and Kędziora (1968), in the case of terrestrial ecosystems with plants, but equal to 1 in the case of the lake and 0.02 for the growing season as a whole in the case of bare soil; i — ordinal number of the month, beginning from January.
Subsurface sensible heat flux G was calculated using the following formula:
http://rcin.org.pl

10 L. Ryszków ski, A. Kędziora
G = K Rn, (10) where the coefficient K changes throughout the year and can be derived from the following formulae:
K= 0.15 (1 - 0.7f) sin
K= 0.15 (1 - 0.5f) sin
K= 0.15 (1 - 0.9f) sin
K= 0.15 sin
K= 0.2 sin
§(i-7.5)
f(i-7.5)
~ (i - 7.5)
f(i-7.5)
f ( i - 7 . 5 )
(for meadows),
(for cultivated fields),
(for forest),
(for bare soil),
(for the lake),
(11)
(12)
(13)
(14)
(15)
where the meanings of the i and f are as above. The energy used for latent heat flux LE and air sensible flux S was
calculated from the following formulae (Kędziora et al. 1989, Olejnik and Kędziora 1991):
(16) (17)
LE = (Rn + G)(l + P)" LE = (Rn + G)(l +
where b — (the Bowen ratio) is derived from:
P = P 12.75
W + 3.9 - 0 . 0 2 (18)
where p equals 1 in a normal year, and is given in dry and wet years (pd and pw respectively) for all the terrestrial ecosystems by the following equations from Bruin and Haltslag (1982) and Thorn (1975):
pd = 5 + 1 + rsd
ra rs,
Ô + 1 + rsn
ra V
pw = 5 + 1 + ra Ô+ 1 + rsn
ra
N-l (19)
(20)
In these equations 5 is the ratio of the pressure gradient of saturated water vapour at a given temperature (given in tables) to the psychrometric constant which equals 0.65 mbar K 1 ; a value of which can be calculated using the formula:
8 = 0.688 exp (0.05662 t); (21) rs is plant stomatal resistance to water transfer, taken as equal to about 100 s m_1in a normal year — rsn, 300 sm" 1 in a dry year — rsd, and 10 s m in a wet year — rsw; ra is aerodynamic resistance to water vapour, given by the equation:
-1
http://rcin.org.pl

Modification of effects of global climate change.. 11
ra In ( z - d) k 2 v l \ ( 2 2 ) zr
where: z — level of wind measurement in meters; d — zero plane displacement; z0 — roughness parameter and v — wind speed; d and z0 are function of the geometrical height h [in meters] of elements constituting the active surface and are calculated as follow:
d = 0.66h, (23) z0 = 0.13h. (24)
In the case of our calculations, the levels of measurement z and value h were as follows:
h = hmaxf (for terrestrial ecosystems), (25) where: hmax for meadows, cultivated fields and forest were respectively 0.5 m, 1 m and 20 m and hmax for bare soil and the water body 0.1 m, and where z was 30 m for forest and 2 m for the other ecosystems. In the case of the lake the value p is equal to pw for a dry year and pd for a wet year and is thus the oposite of those for the other ecosystems.
The factor W in equation (18) is calculated from the formula given by Kędziora et al. (1987), and Olejnik and Kędziora (1991):
W = [(lOOds-v0-5 J1"1 2 f } ] [t(0.4 + u)] -1, (26)
where: W is an agrometeorological empirical index, which express the influence of meteorological conditions and the stage of plant development on évapo-transpiration. The higher the index value, the greater the proportion of net--radiation used in évapotranspiration; ds— saturation vapour pressure deficit [mbar]; other symbols have the meanings described above.
THE ESTIMATIONS OF POTENTIAL AND REAL EVAPOTRANSPIRATION IN mm OF WATER
Potential évapotranspiration for 24 hours ETPd was calculated in accordance with the Penman formula, as follows:
ETPd = p(Rn + G) + Ea](l + 5r\ (27)
where:
Ea = 28.34 0.2626(0.75 + 0.54v)ds. (28) The meanings of Rn, G, t, v, 5 and ds are as described above, and ETPd
is calculated in Wnr2 . Calculation of ETP in mm of water per month involves the following conversion:
http://rcin.org.pl

12 L. Ryszków ski, A. Kędziora
ETPd E T P = ^ i Î n ' ( 2 9 )
where: n — number of days in month. Real évapotranspiration ETR values in mm were calculated directly from estimated values of latent heat fluxes LE, in the following way:
E T R = i i i n > ( 3 0 )
where n is as above.
ASSUMED MODEL METEOROLOGICAL CONDITIONS
The wet and dry years selected from field observations made in the period 1956-1992 were not typical because it so happened that wet years were simultaneously warm. Dry years, however, had very similar air temperatures to those with normal amounts of precipitation (Tab. 1). Such a combination of meteorological conditions make it impossible to evaluate the modifying role of plant cover in extreme conditions when precipitation is high and temperature low, or when precipitation is low and temperatute high. Model conditions for wet years were therefore assumed by increasing precipitation by 50% in relation to normal values. The air temperature in wet years was assumed to be lower by 4.5 degrees in July and by 1 degree in March and November, in relation to that in a normal year. Temperatures for the other months were obtained from an annual curve drawn through these three values and taking the overall shape of the curve in a normal year. Wind speed and relative sunshine were also lowered by 50% in relation to the values noted in a normal year.
Table 2. Assumed air temperature t[°C], relative sunshine u (dimensionless), and precipitation P [mm] in model for wet, normal and dry years in Turew
Moisture conditions Month Wet Normal Dry
t[°C] u P t[°C] u P t[°C] u P March 2.0 0.172 55 3.0 0.343 37 4.0 0.514 18 April 5.5 0.173 67 8.0 0.345 45 11.0 0.516 23 May 9.5 0.211 91 13.0 0.422 61 18.0 0.633 30 June 12.5 0.205 102 17.0 0.410 68 21.5 0.615 34 July 14.0 0.227 132 18.5 0.453 88 23.0 0.680 44 August 13.0 0.193 96 17.5 0.387 64 22.0 0.580 32 September 10.0 0.206 80 13.5 0.412 53 18.0 0.618 27 October 6.0 0.149 56 8.6 0.298 37 10.5 0.447 19 Mean/Total 9.1 0.192 679 12.4 0.384 453 16.0 0.575 227
The procedure for meteorological parameters in a dry year was similar, but precipitation was decreased (and relative sunshine and wind speed increased) by 50%, in relation to the values in a normal year. The air temperature for July was increased by 4.5 degrees, and those for March
http://rcin.org.pl

Modification of effects of global climate change.. 13
and November by 1 degree. In all cases, the conditions in a normal year were the average ones noted in the period 1931-1990, (Tab. 2). In comparison to the normal meteorological conditions observed (Tab. 1), the mean annual temperature for the "wet model" was lowered from 13.2°C to 9.1°C and that for the dry year raised to 16.0°C (Tab. 2).
PREDICTED METEOROLOGICAL CONDITIONS AS A RESULT OF GLOBAL CHANGES IN CLIMATE
The temperature changes were taken from Hulme et al. (1990). Relative sunshine and precipitation were the same as in the assumed model meteorological conditions because in these the starting point for predicted conditions), the range of variation in sunshine and precipitation values between wet and dry years matches the values predicted by the model from Hulme et al. In the predicted wet year the mean temperature for the growing season is 12.8°C, while those for the normal and aby years are estimated at 16.3°C and 19.8°C (table 3).
Table 3. Predicted air temperature t[°C], relative sunshine u (dimensionless), and precipitation P[mm] in wet, normal and dry years in Turew
Moisture conditions Month Wet Normal Dry
t[°C] u P t[°C] u P t[°C] u P March 8.0 0.172 55 9.0 0.343 37 10.0 0.514 18 April 11.2 0.173 67 13.7 0.345 45 16.7 0.516 23 May 14.5 0.211 91 18.8 0.422 61 23.0 0.633 30 June 16.5 0.205 102 21.0 0.410 68 25.5 0.615 34 July 17.0 0.227 132 21.5 0.453 88 26.0 0.680 44 August 15.3 0.193 96 19.8 0.387 64 24.3 0.580 32 September 12.0 0.206 80 15.5 0.412 53 20.0 0.618 27 October 8.3 0.149 56 10.8 0.298 37 12.8 0.447 19 Mean/Total 12.8 0.192 564 16.3 0.384 453 19.8 0.575 227
The predicted temperatures for each month were calculated using the following formula:
tp = t + 2[cos5(i- l ) + 2], (31) D
where: tp — predicted air temperature [°C1, t—present air temperature [°C], i — ordinal number of month starting from January. Other meteorological parameters (such as vapour pressure e and saturation vapour pressure defficit ds) will change as a function of the temperature:
e = 5.5exp(0.055tp), (32) ds = Em a x - e, (33)
where Emax (saturation vapour pressure at a given air temperature) is calculated as follows:
http://rcin.org.pl

14 L. Ryszków ski, A. Kędziora
E ^ = 6.113 |exp[17.105tp(tp +235) ]}. (34)
Changes in the length of the growth period were also taken into account (after Ryszkowski and Kędziora 1993b).
CALCULATION OF HEAT BALANCE COMPONENTS IN A LANDSCAPE WITH SHELTERBELTS
The heat balance components of the field located between shelterbelts were caluclated in the following way, which took into account the results of research carried out in the Turew landscape and the analyses by Rosenberg (1974). The introduction of shelterbelts into an agricultural landscape leads to an increase in air temperature t and vapour pressure e and a fall in wind speed v and saturation vapour pressure deficit ds (Rosenberg 1974, Ryszkowski and Karg 1976). The following equations describe these relationships:
tm = t0(l + 0.5-0.OIL), (35)
em=eo(l + 0.6-0.01L), (36)
dsm = ds0(l - 0.3 0.OIL), (37)
vm = v0(l — 1.3-0.OIL), (38) where: t — air temperature [°C]; e — vapour pressure [mbar]; ds — saturation vapour pressure deficit [mbar]; v — wind speed [m- s"1]; subscript m — a field between shelterbelts; subscript o — an open field; L — % of area under shelterbelts in landscape.
The approximated values of tm, enl, dsm and vm were used to calculate heat balance components by way of the equations described. The mean values of energy fluxes for a landscape composed of shelterbelts and a cultivated field were calculated as a weighted mean wm, as follows:
wm = xmL + x0(l - 0.01L), (39)
where x is any parameter of heat balance and L, m, o as above. Mean values of heat balance parameters for a landscape with shelterbelts are presented in tables 4-12 under the heading C+Fd% and C+Fc% in „a" lines, while heat balance components for a field between shelterbelts are presented in ,,b" lines.
THE HEAT BALANCE OF ECOSYSTEMS
HEAT BALANCE STRUCTURE UNDER REAL METEOROLOGICAL CONDITIONS
The results of the analyses show a considerable diversity of heat balance components in various ecosystems of the landscape. In a normal year, lakes intercept the largest, and meadows the smallest amounts of solar energy (Tab. 4). This difference equals to 451 MJ-m 2 and constitutes the amount
http://rcin.org.pl

Table 4. Components of heat balance [MJ m~2] and évapotranspiration [mm] during the growing season in basic ecosystems and in fields with various percentage covers of shelterbelt for real normal moisture conditions in the aricultural landscape at Threw
Forms of land use Heat balance components Evapotranspiration
Rn LE S G LE/Rn ETP ETR ETR/P
Meadows (M) 1432 -1180 -188 -64 -0.83 636 482 1.10
Cultivated fields (C) 1463 -1064 -297 -103 -0.73 634 434 0.99
Deciduous forest (Fd) 1581 -1361 -194 -36 -0.86 679 552 1.26
Coniferous forest (Fc) 1716 -1508 -186 -21 -0.88 715 616 1.41
Lake(L) 1883 -1585 -120 -179 -0.81 719 620 1.42
Bare soil (B) 1619 -782 -716 -121 -0.49 667 317 0.73
C + Fd 10% a 1492 -1085 -309 -97 -0.73 501 443 1.01
b 1482 -1056 -322 -104 -0.72 481 431 0.98
C + Fd 20% a 1516 -1106 -319 -92 -0.73 488 452 1.03
b 1500 -1044 -350 -105 -0.70 440 426 0.97
C + Fd 30% a 1537 -1126 -326 -86 -0.74 484 460 1.05
b 1518 -1029 -382 -107 -0.68 401 420 0.96
C + Fc 10% a 1505 -1099 -310 -96 -0.74 505 449 1.03
b 1482 -1054 -324 -104 -0.72 481 431 0.98
C + Fc 20% a 1543 -1136 -319 -89 -0.74 495 464 1.06
b 1500 -1042 -352 -105 -0.70 440 426 0.97
C + Fc 30% a 1577 -1171 -325 -81 -0.75 495 478 1.09
b 1518 -1027 -385 -107 -0.68 401 420 0.96
I PL "S TO R r-t. o'
(V TO r* cc
0=1 ! o o-o
3 0 5-4-TO TO s 1 TO
Rn — net radiation LE — latent heat flux S — sensible heat flux G — heat flux into subsurface
ETP — potential évapotranspiration a — ETR — real évapotranspiration b — P — precipitation
total landscape field between shelterbelts
Ü1
http://rcin.org.pl

Table 5. Components of heat balance [MJ-m'2] and évapotranspiration [mm] during the growing season in basic ecosystems and in fields with various ^ percentage covers of shelterbelt for real wet years in the aricultural landscape at Tu rev/0
Forms of land use Heat balance components Evapotranspiration
Rn LE S G LE/Rn ETP ETR ETR/P
Meadows (M) 1436 -1294 -77 -65 -0.91 645 529 0.81
Cultivated fields (C) 1466 -1253 -109 -104 -0.86 643 512 0.79
Deciduous forest (Fd) 1577 -1507 -33 -36 -0.96 687 616 0.95
Coniferous forest (Fc) 1706 -1654 -32 -21 -0.97 723 676 1.04
Lake (L) 1867 -1369 -326 -172 -0.74 727 559 0.86
Bare soil (B) 1614 -992 -504 -118 -0.62 676 405 0.62
C + Fd 10% a 1493 -1278 -118 -98 -0.86 499 522 0.80
b 1484 -1252 -127 -105 -0.85 478 511 0.79
C + Fd 20% a 1517 -1298 -127 -92 -0.86 485 530 0.82
b 1502 -1246 -150 -106 -0.83 435 509 0.78
C + Fd 30% a 1537 -1315 -137 -86 -0.86 482 537 0.83
b 1520 -1232 -181 -108 -0.82 395 503 0.78
C + Fc 10% a 1506 -1292 -118 -97 -0.86 502 528 0.81
b 1484 -1252 -127 -105 -0.85 478 511 0.79
C + Fc20% a 1543 -1327 -127 -89 -0.87 492 542 0.84
b 1502 -1246 -150 -106 -0.83 435 509 0.78
C + Fc30% a 1576 -1358 -136 -82 -0.87 493 555 0.86
b 1520 -1232 -181 -108 -0.82 395 503 0.78
$ ?» N Ä-o S Co ?s-O« . > £ Ö-N o' "-J s x) explanations in table 4 http://rcin.org.pl

Table 6. Components of heat balance [ M J m~2] and évapotranspiration [mm] during the growing season in basic ecosystems and in fields with various percentage covers of shelterbelt for real dry years in the aricultural landscape at Turewx)
Forms ofland use Heat balance components Evapotranspiration
Rn LE S G LE/Rn ETP ETR ETR/P
Meadows (M) 1478 -1070 -342 -66 -0.73 737 437 1.67
Cultivated fields (C) 1511 -886 -520 -106 -0.59 735 362 1.34
Deciduous forest (Fd) 1637 -1188 -412 -37 -0.73 783 485 1.80
Coniferous forest (Fc) 1781 -1367 -393 -22 -0.77 823 558 2.08
Lake(L) 1959 -1664 -107 -187 -0.85 828 680 2.53
Bare soil (B) 1677 -531 -1019 -127 -0.32 771 217 0.81
C + Fd 10% a 1542 -902 -540 -100 -0.59 576 368 1.37
b 1532 -870 -554 -107 -0.57 553 355 1.32
C + Fd 20% a 1569 -920 -556 -95 -0.59 557 376 1.40
b 1552 -853 -590 -109 -0.55 501 348 1.29
C + Fd 30% a 1597 -940 -563 -88 -0.60 552 384 1.45
b 1572 -834 -627 -110 -0.54 453 341 1.27
C + Fc10% a 1557 -920 -538 -99 -0.60 580 376 1.40
b 1532 -870 -554 -107 -0.57 553 355 1.32
C + Fc20% a 1598 -955 -551 -91 -0.60 565 390 1.45
b 1552 -853 -590 -109 -0.55 501 348 1.29
C + Fc30% a 1634 -994 -557 -84 -0.61 564 406 1.51
b 1572 -834 -627 -110 -0.54 453 341 1.27
I a. S o p r-v o" s
r—I o o p
p
0 P
1 TO
x) explanations in table 4 -J
http://rcin.org.pl

Table 7. Components of heat balance [MJ-m"2] and évapotranspiration [mm] during the growing season in basic ecosystems and in fields with various percentage covers of shelterbelt for assumed model of normal conditions: real temperature, precipitation, and realative sunshine, but with vapour pressure
and saturation vapour pressure deficit calculated as functions of temperature*'
00
Forms of land use Heat balance components Evapotranspiration
Rn LE S G LE/Rn ETP ETR ETR/P
Meadows (M) 1454 -1159 -229 -65 -0.80 565 473 1.05
Cultivated fields (C) 1484 -1084 -324 -104 -0.71 563 428 0.94
Deciduous forest (Fd) 1602 -1325 -241 -37 0.83 608 541 1.19
Coniferous forest (Fc) 1737 -1467 -244 -27 -0.85 644 599 1.32
Lake (L) 1904 -1484 -237 -183 -0.78 649 606 1.34
Bare soil (B) 1640 -802 -714 -125 -0.49 596 328 0.72
C + Fd 10% a 1514 -1065 -350 -98 -0.71 434 435 0.96
b 1504 -1036 -363 -105 -0.69 415 423 0.93
C + Fd 20% a 1539 -1083 -364 -93 -0.71 429 442 0.98
b 1523 -1022 -394 -107 -0.68 384 417 0.92
C + Fd 30% a 1560 -1100 -374 -87 -0.71 432 449 0.99
b 1542 -1003 -431 -108 -0.66 356 410 0.90
C + Fc 10% a 1527 -1079 -351 -97 -0.71 438 441 0.97
b 1504 -1036 -363 -105 -0.69 415 423 0.93
C + Fc 20% a 1566 -1111 -364 -91 -0.71 436 454 1.00
b 1523 -1022 -394 -107 -0.68 384 417 0.92
C + Fc 30% a 1601 -1142 -375 -84 -0.72 443 467 1.03
b 1542 -1003 -431 -108 -0.66 356 410 0.90
N o S 05 a-
a. N o' B x) explanations in table 4 http://rcin.org.pl

Table 8. Components of heat balance [MJ-m*2] and évapotranspiration [mm] during the growing season in basic ecosystems and in fields with various percentage covers of shelterbelt for assumed model of wet and cool conditions: temperature, relative sunshine and wind speed lower but precipitation
higher (50%) than in normal season. Vapour pressure and saturation vapour pressure deficit calculated as functions of temperature*'
Forms of land use Heat balance components Evapotranspiration Forms of land
Rn LE S G LE/Rn ETP ETR ETR/P
Meadows (M) 1216 -1070 -90 -56 -0.88 396 437 0.64
Cultivated fields (C) 1239 -1053 -98 -88 -0.85 394 430 0.63
Deciduous forest (Fd) 1328 -1258 -38 -32 -0.95 427 514 0.76
Coniferous forest (Fc) 1430 -1367 -39 -23 -0.96 452 558 0.82
Lake (L) 1555 -1127 -283 -144 -0.73 456 460 0.68
Bare soil (B) 1356 -912 -345 -99 -0.68 418 373 0.55
C + Fd 10% a 1258 -1067 -108 -83 -0.85 341 436 0.64
b 1250 -1046 -116 -88 -0.84 332 427 0.63
C + Fd 20% a 1274 -1078 -118 -78 -0.85 338 440 0.65
b 1260 -1033 -138 -89 -0.82 315 422 0.62
C + Fd 30% a 1288 -1088 -128 -73 -0.85 338 444 0.65
b 1271 -1014 -166 -90 -0.80 300 414 0.61
C + Fc 10% a 1268 -1078 -108 -82 -0.86 344 440 0.65
b 1250 -1046 -116 -88 -0.84 332 427 0.63
C + Fc 20% a 1294 -1100 -118 -76 -0.86 343 449 0.66
b 1260 -1033 -138 -89 -0.82 315 422 0.62
C + Fc30% a 1318 -1120 -128 -70 -0.85 345 458 0.67
b 1271 -1014 -166 -90 -0.80 300 414 0.61
x) explanations in table 4
http://rcin.org.pl

Table 9. Components of heat balance [MJ-m'2] and évapotranspiration [mm] during the growing season in basic ecosystems and in fields with various percentage covers of shelterbelt for assumed model of dry and warm conditions: temperature, relative sunshine and wind speed higher but precipitation lower (50%) than in normal season. Vapour pressure and saturation vapour pressure deficit calculated as functions of temperaturex)
to o
Forms of land use Heat balance components Evapotranspiration
Rn LE S G LE/Rn ETP ETR ETR/P
Meadows (M) 1756 -1135 -545 -77 -0.65 787 464 2.04
Cultivated fields (C) 1795 -921 -747 -125 -0.52 784 376 1.66
Deciduous forest (Fd) 1942 -1244 -655 -43 -0.65 846 508 2.24
Coniferous forest (Fc) 2110 -1412 -667 -31 -0.67 895 577 2.54
Lake(L) 2319 -1903 -189 -227 -0.83 900 777 3.42
Bare soil (B) 1989 -546 -1289 -155 -0.28 829 223 0.98
C + Fd 10% a 1838 -936 -783 -119 -0.51 545 382 1.68
b 1827 -902 -798 -127 -0.50 511 368 1.62
C + Fd 20% a 1875 -954 -809 -112 -0.51 538 390 1.72
b 1859 -882 -847 -129 -0.48 462 360 1.59
C + Fd 30% a 1906 -976 -825 -105 -0.52 545 399 1.76
b 1890 -861 -898 -132 -0.46 416 352 1.55
C + Fc10% a 1855 -953 -784 -117 -0.52 550 389 1.71
b 1827 -902 -798 -127 -0.50 511 368 1.62
C + Fc 20% a 1909 -988 -811 -110 -0.52 548 404 1.78
b 1859 -882 -847 -129 -0.48 462 360 1.59
C + Fc 30% a 1956 -1026 -829 -102 -0.53 560 419 1.85
b 1890 -861 -898 -132 -0.46 416 352 1.55
£ & N O S 00
& 0, N O £ explanations in table 4 http://rcin.org.pl

Table 10. Components of heat balance [MJm~ ] and évapotranspiration [mm] during the growing season in basic ecosystems and in fields with various percentage covers of shelterbelt in predicted normal conditions50
Forms of land use Heat balance components Evapotranspiration
Rn LE S G LE/Rn ETP ETR ETR/P
Meadows (M) 1492 -1183 -242 -67 -0.80 640 483 1.07
Cultivated fields (C) 1522 -1056 -359 -107 -0.70 637 431 0.95
Deciduous forest (Fd) 1630 -1371 -231 -28 -0.85 686 560 1.24
Coniferous forest (Fc) 1775 -1519 -236 -20 . -0.86 726 621 1.37
Lake(L) 1942 -1524 -233 -186 -0.79 728 623 1.37
Bare soil (B) 1678 -760 -791 -127 -0.46 673 310 0.69
C + Fd 10% a 1552 -1079 -373 -100 -0.70 460 441 0.97
b 1544 -1046 389 -108 -0.68 435 427 0.94
C + Fd 20% a 1578 -1100 -384 -94 -0.70 455 449 0.99
b 1565 -1033 -423 -110 -0.67 397 422 0.93
C + Fd 30% a 1599 -1121 -391 -86 -0.71 460 485 1.01
b 1586 -1014 -460 -111 -0.64 362 414 0.91
C + Fc 10% a 1567 -1094 -374 -99 -0.70 464 447 0.99
b 1544 -1046 -389 -108 -0.68 435 427 0.94
C + Fc 20% a 1607 -1130 -385 -92 -0.71 463 462 1.02
b 1565 -1033 -423 -110 -0.67 397 422 0.93
C + Fc 30% a 1643 -1166 -393 -84 -0.71 472 476 1.05
b 1586 -1014 -460 -111 -0.64 362 414 0.91
c a. S Ci p c-t. r - . o s
C/5
0t> r—I o O-p
2 p r-4. 0 p
1
1 explanations in table 4 to
http://rcin.org.pl

Table 11. Components of heat balance [MJ m'2] and évapotranspiration [mm] during the growing season in basic ecosystems and in fields with various [o percentage covers of shelterbelt for predicted wet and cool conditions'0
Forms of land use Heat balance components Evapotranspiration
Rn LE S G LE/Rn ETP ETR ETR/P
Meadows (M) 1232 -1073 -102 -57 -0.88 453 438 0.65
Cultivated fields (C) 1255 -1050 -116 -89 -0.84 451 429 0.63
Deciduous forest (Fd) 1336 -1272 -40 -24 -0.96 486 520 0.77
Coniferous forest (Fc) 1445 -1388 -41 -17 -0.97 514 567 0.84
Lake(L) 1570 -1145 -280 -145 -0.73 514 468 0.69
Bare soil (B) 1372 -857 -415 -100 -0.63 476 350 0.52
C + Fd 10% a 1273 -1064 -126 -83 -0.84 359 435 0.64
b 1266 -1041 -136 -90 -0.83 345 425 0.63
C + Fd 20% a 1289 -1075 -137 -77 -0.84 356 439 0.65
b 1277 -1026 -161 -91 -0.81 323 419 0.62
C + Fd 30% a 1303 -1085 -147 -71 -0.84 358 443 0.65
b 1289 -1005 -192 -91 -0.78 303 411 0.60
C + Fc10% a 1284 -1075 -126 -82 -0.84 362 439 0.65
b 1266 -1041 -136 -90 -0.83 345 425 0.63
C + Fc 20% a 1311 -1099 -137 -76 -0.84 361 449 0.66
b 1277 -1026 -161 -91 -0.81 323 419 0.62
C + Fc30% a 1336 -1120 -147 -69 -0.84 366 458 0.67
b 1289 -1005 -192 -91 -0.78 303 411 0.60
£ Co N a-© S 05
£ •TO a. N x) explanations in table 4 http://rcin.org.pl
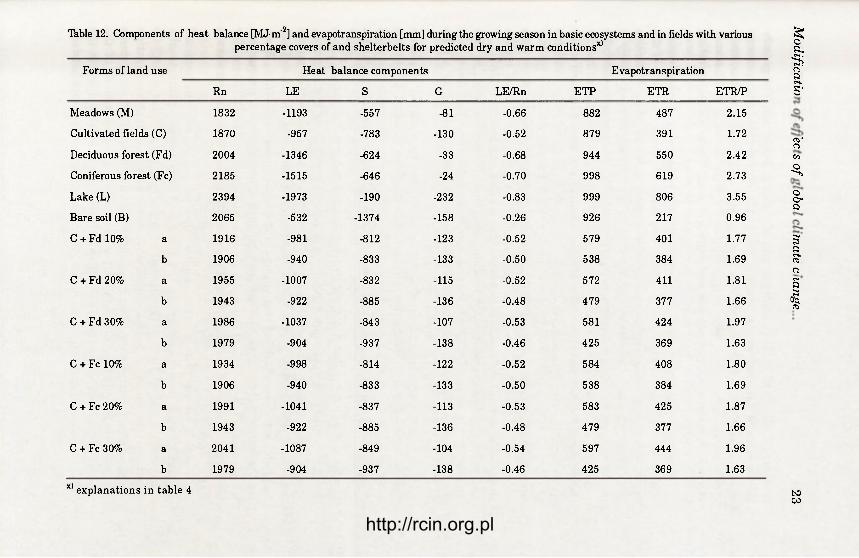
Table 12. Components of heat balance [MJ m 2] and évapotranspiration [mm] during the growing season in basic ecosystems and in fields with various percentage covers of and shelterbelts for predicted dry and warm conditions'0
Forms of land use Heat balance components Evapotranspiration
Rn LE S G LE/Rn ETP ETR ETR/P
Meadows (M) 1832 -1193 -557 -81 -0.66 882 487 2.15
Cultivated fields (C) 1870 -957 -783 -130 -0.52 879 391 1.72
Deciduous forest (Fd) 2004 -1346 -624 -33 -0.68 944 550 2.42
Coniferous forest (Fc) 2185 -1515 -646 -24 -0.70 998 619 2.73
Lake (L) 2394 -1973 -190 -232 -0.83 999 806 3.55
Bare soil (B) 2065 -532 -1374 -158 -0.26 926 217 0.96
C + Fd 10% a 1916 -981 -812 -123 -0.52 579 401 1.77
b 1906 -940 -833 -133 -0.50 538 384 1.69
C + Fd 20% a 1955 -1007 -832 -115 -0.52 572 411 1.81
b 1943 -922 -885 -136 -0.48 479 377 1.66
C + Fd 30% a 1986 -1037 -843 -107 -0.53 581 424 1.97
b 1979 -904 -937 -138 -0.46 425 369 1.63
C + Fc 10% a 1934 -998 -814 -122 -0.52 584 408 1.80
b 1906 -940 -833 -133 -0.50 538 384 1.69
C + Fc 20% a 1991 -1041 -837 -113 -0.53 583 425 1.87
b 1943 -922 -885 -136 -0.48 479 377 1.66
C + Fc30% a 2041 -1087 -849 -104 -0.54 597 444 1.96
b 1979 -904 -937 -138 -0.46 425 369 1.63
I a. S re a ps. 5'
<v Ci Co
^
O o-o
3 o" p rs. re 0 S 1 TO
x) explanations in table 4 to CO
http://rcin.org.pl

24 L. Ryszków ski, A. Kędziora
of energy that would enable about 184 mm of water to evaporate. The greater interception of solar energy by lakes is due to the considerable transparency of water, which makes the energy-intercepting layer veiy deep. However, since a considerable amount of solar energy is used for water heating and because of its high specific heat in comparison to that of soils, the évapotranspiration is only slightly higher than in coniferous forests (4 mm).
In other words, due to the considerable storage of energy in heated water, the amounts of water evaporated by forests and lakes are similar, in spite of the much higher rates of interception of solar energy by water in lakes. In forests and afforested areas, the greater part (86% to 88%) of the intercepted energy is used in évapotranspiration. It is this „pumping effect" which determines shelterbelts significant influence on resources of soil water. The pumping effect is primarily due to the well-developed root system of trees, which allows them to absorb water from deeper layers of the soil. As a result, tree roots have more water available to them directly or indirectly (through capillary rise). Forests also have greater canopy roughness than wheat fields or meadows, a factor which together with higher wind speed and greater turbulence in the high canopy of trees results in the very high rate of évapotranspiration (Ryszkowski and Kędziora 1987).
Deciduous forests start transpiration later than coniferous ones, so the amount lost in évapotranspiration is 64 mm smaller. However this diference, is not as considerable as the ones between a lake and a meadow or a lake and a field (138 and 186 mm respectively) (Tab. 4).
The heat balance of cultivated fields is influenced by removal of plants during harvest and the subsequent major impact of the physical conditions exerted by bare soil. In cultivated fields, 20% of the energy intercepted is used for air heating (see air sensible heat flux — in Table 4). With its limited roughness and year-round plant cover a meadow reflects the largest amount of solar radiation (has the largest albedo) and is thus characterized by the lowest value of net-radiation to be seen among the analyzed ecosystems (Tab. 4). Furthermore, meadows are usually situated in terrain with a high water table, which makes water easily available to root systems. It is for this reason that, in spite of low net-radiation, most (83%) of this energy is used in évapotranspiration. Even so, the considerably lower net-radiation balance of meadows (in comparison with that of afforested areas), renders their real évapotranspiration (ETR) smaller than that in forests, (by 70 mm to deciduous forest, and by 134 mm to coniferous forest) (Tab. 4).
The sub-surface flux of heat is highest in a lake, quite high in bare soil and cultivated fields, and lowest in forests. These results point to the considerable role of the canopy in controlling the influx of solar energy to forest soils. In a normal year, the amount of water used in évapotranspiration is equal to, or even higher than, precipitation in all the studied ecosystems except bare soil (Tab. 4). This indicates that winter precipitation is of the utmost importance for moisture conditions during the growing season in the Turew landscape. An increase in habitat humidity makes differences between
http://rcin.org.pl

Modification of effects of global climate change.. 25
the components of heat balance in the analysed ecosystems smaller. In a wet growing season the difference between the highest LE value (in coniferous forest) and the lowest (on bare soil) amounts to 662 MJ-m'2, whereas the same difference in normal years is 803 MJ-m"2. A very similar situation is noted when sensible heat is compared. The difference between the highest and lowest values (in bare soil and the two types of forest respectively) is about 470 MJ m"2, whereas in a normal year it reaches 600 MJ-m"2. The conditions of a wet growing season see less water evapotranspired in the studied ecosystem than the amount which precipitated besides coniferous forest. In wet years évapotranspiration is 10% higher than lake evaporation in deciduous forest and 20% higher in coniferous forest — a fact which indicates the very important role of plants in the stimulation of évapotranspiration. Normal and wet growing seasons differ little in net radiation, because the change of humidity conditions has only limited influence on the radiation balance.
Dry years differ from normal ones in having increased differences between the values of all components of the heat balance. This is mainly the result of increasing relative sunshine and a consequently higher input of solar radiation. For example,, the Rn value of the lake is 76 MJ-m"2 higher than in a normal year (Tab. 4 and 6). This increase in net-radiation was used for évapotranspira-tion. The amount of energy used for air heating is also greater in dry years than in normal ones. Dry years see cultivated fields use a little less than 2/3 of net--radiation in evaporation (LE/Rn = 0.59). Bare soil uses less than 1/3 (Tab. 6).
The higher the habitat humidity, the higher the degree of energy use in evaporation (LE/Rn V As habitat conditions become drier, the shortage of water increases and evaporation decreases in all ecosystems except the lake because under this conditions the lake évapotranspiration increases due to increasing atmospheric evaporative demand.
Dry and wet years in the ecosystems studied differed most in relation to air sensible heat flux (S) and least in relation to potential evaporation (ETP). Potential evaporation in a wet year was similar in all the ecosystems studied and differences in real evaporation rates (ETR) were rather small. In contrast, real evaporation rates in a dry year varied by a factor of nearly two. The ratio of real évapotranspiration to precipitation is highest in forests and is greater than two in a dry year. This could indicate pumping-out effects of forests on water resources in dry years. However, the problem is very complicated because forests stimulate greater storage of water in soil and have reduced runoff. In addition, forests exhibit the so-called horizontal precipitation in which low clouds, mist or fog are blown against trees, allowing water droplets to coalesce and fall to the ground (Bac 1965).
HEAT BALANCE STRUCTURE IN ASSUMED MODEL METEOROLOGICAL CONDITIONS
Components of the heat balance in the different ecosystems were found to be similar in model meteorological conditions to in real conditions (Tab. 7-9).
http://rcin.org.pl

26 L. Ryszków ski, A. Kędziora
The difference between the highest (lake) and lowest (meadow) values of Rn amounted to 563 MJ-m"2 in model dry years and was 60% higher than in model wet years. In wet years, the differences between ecosystems are blured to a greater extent than is the case in dry years.
Under different meteorological conditions the ecosystems vary greatly in the range of values for latent heat flux. The difference between the highest (coniferous forest) and lowest (bare soil) values is 455 MJ-m"2 in a wet year. In assumed model dry years the range of the difference (866 MJ-m"2) is higher than in wet years by 200%. Still greater differentiation exists in values of sensible heat flux in the various ecosystems with differences of 260% noted between a dry year and a wet year.
Thus, the assumed model meteorological conditions point to a much better mitigating role of plant cover structure on heat balance components than can be observed under normal conditions (compare results presented in Tables 7, 8 and 9 with those in Tables 4, 5 and 6).
The assumed model meteorological conditions indicates much better the mitigating role of plant cover structure on heat balance components in a large range of meteorological conditions than can be observed under real conditions. As humidity increases the amount of intercepted solar energy (Rn) decreases. The mean value for net-radiation in the six analysed ecosystems decreases from 1985 MJ-m"2 in a dry year to 1354 MJ-m"2 in a wet year, i.e. by 32% (Tab. 13). At the same time, the variability in energy used for évapotranspiration is found to be greater than that observed in Rn values (cv values in Tab. 13).
Table 13. Statistical characteristics of heat balance components in the landscape, for distinguished types of meteorological conditions
Meteorological conditions
Rn LE S LE/Rn Meteorological conditions x s cv X s cv X s cv x s cv Real:
Wet 1611 160 10 1345 227 17 180 193 107 0.84 0.14 16 Normal 1616 167 10 1247 300 24 284 219 77 0.77 0.15 19 Dry 1674 178 11 1118 391 35 465 303 65 0.66 0.19 28
Assumed: Wet 1354 126 9 1131 161 14 149 132 88 0.84 0 . 1 1 14 Normal 1634 167 10 1220 260 21 333 190 57 0.74 0.13 18 Dry 1985 207 11 1193 458 38 682 356 52 0.60 0.19 31
Predicted: Wet 1368 126 9 1134 190 17 168 156 93 0.85 0.13 15 Normal 1674 167 10 1246 305 24 349 231 66 0.74 0.15 21 Dry 2058 209 10 1275 497 39 695 395 57 0.61 0.20 32
Rn — net-radiation, LE — latent heat flux, S — sensible heat flux, x — mean, s — standard de-viation, cv — coefficient of variation
The coefficient of variation (cv) of LE value decreases from 38% in dry years to 14% in wet ones, that is by 63%. This shows the great importance of plant cover in the modifying influence of moisture conditions on heat balance structure.
http://rcin.org.pl

Modification of effects of global climate change.. 27
Similarly, plant cover has great importance for the modification of sensible heat flux in changing moisture conditions, increasing the variation between ecosystems when humidity increases (Tab. 13).
HEAT BALANCE STRUCTURE UNDER THE PREDICTED METEOROLOGICAL CONDITIONS CAUSED BY GLOBAL CHANGE
The values of heat balance components are increasing in comparison to normal assumed meteorological conditions. For predicted wet and cool conditions, increases are not high when estimates are compared with the assumed model conditions (Tab. 8 and 11). Under drought conditions, increases are noticeably greater, particularly in the case of forests, where évapotranspiration is greater by 42 mm, provided that the soil had sufficient stored water (Tab. 9 and 12).
The modifying role of plant cover ensures that as the net radiation value incre£ses, the differentiation between latent and sensible heat fluxes increases in comparison with the variation under assumed model conditions. UndeT predicted meteorological conditions the ratio of ETR to ETP decreases as arilification increases (Tab. 14).
Table 11. Ratio of real évapotranspiration (ETR) to potential évapotranspiration (ETP) in various ecosystems under real (R), assumed model (A) and predicted (P) meteorological conditions.
The values of ETR and ETP are shown in Tables 4-12
Lcosystem Meteorological Kind of weather conditions wet normal dry
Conife-ous forest (Fc) R 0.91 0.86 0.67 A 1.23 0.93 0.64 P 1.10 0.85 0.62
Deciduous forest (Fd) R 0.89 0.81 0.62 A 1.20 0.88 0.60 P 1.07 0.81 0.58
Meadovs (M) R 0.82 0.75 0.59 A 1.10 0.84 0.58 P 0.96 0.75 0.55
Cultivited fields (C) R 0.79 0.68 0.49 A 1.09 0.76 0.48 P 0.95 0.67 0.41
Bare s.il (B) R 0.60 0.47 0.28 A 0.89 0.55 0.26 P 0.73 0.46 0.23
Lake (1) R 0.77 0.83 0.82 A 1.00 0.93 0.86 P 0.91 0.85 0.80
Atthe same time, all values of this ratio are lower than the ones observed under model assumed meteorological conditions. This difference between the
http://rcin.org.pl

28 L. Ryszków ski, A. Kędziora
assumed model and predicted values is lower as the degree of aridification is higher (Tab. 14). Increasing air temperature under predicted meteorological conditions will cause an increase in the saturation water vapour pressure defficit. Its impact will be greater on potential évapotranspiration than on real évapotranspiration. This phenomenon will be especially noticeable under good water conditions in the soil.
COMPARISON OF THE MODIFICATION OF HEAT BALANCE COMPONENTS BY THE STRUCTURE OF PLANT COVER UNDER VARIOUS METEOROLOGICAL CONDITIONS
From analyses of heat balances under various real and assumed model conditions, and in the predicted meteorological conditions resulting from by global climatic changes, it can be seen that the structure of an ecosystem has quite an important role in the partitioning of intercepted solar energy into latent, sensible and sub-surface heat fluxes. Thus, the transparency of water to incoming shortwave radiation leads to deeper sub-surface light penetration which increases the interception of solar radiation. This explains why values of Rn in the lake (L) are higher under all meteorological conditions analysed than those in all the land ecosystems (Tab. 4-12). Coniferous afforested areas (Fc) intercept the most incoming solar radiation among terrestrial ecosystems because of the lowest albedo resulting from high roughness of canopy. Having a smooth surface of grass blades, meadows (M) show high light reflection (relatively high albedo) and intercept the lowest amounts of incoming radiation (Tab. 4-12).
A change in the landscape pattern of areas occupied by ecosystems of different albedo provides options of interception of solar energy at the landscape level. If global climate change increases sunshine in a region, then the interception of solar energy could be reduced at the landscape level if the area under grasslands was increased. The reduced interception of solar energy by grasslands will lead to lower évapotranspiration, which will in turn, save water from precipitation in the landscape despite the fact that grasslands divert a high percentage of the Rn value for évapotranspiration. This form of adaptation of plant cover is clearly shown by the substitution of forests by grasslands on the global scale, if the climate becomes warmer or drier. Cultivated fields function even better in this respect (Tab. 4-12), but at the same time divert larger amounts of intercepted energy to air heating which, especially under dry and warm meteorological conditions, enhance évapotranspiration by heat advection processes (Ryszkowski and Kędziora 1993) — especially from dry land to irrigated fields and wetlands. The situation of heat balance in cultivated fields is much more accentuated where bare soil is concerned. Wet, dry and normal meteorological conditions, (both observed and predicted with global climate change), give practically no change in the relations in Rn values between ecosystems. The range of differences in Rn values between ecosystems remains almost stable. In both kinds of forests (Fd and Fc), and in meadows, the highest amounts of intercepted
http://rcin.org.pl

Modification of effects of global climate change.. 29
energy during normal and wet seasons, are used for évapotranspiration (ETR). In dry years the lack of precipitation limits évapotranspiration despite high values of potential évapotranspiration (ETP). In lakes, the plentiful supply of water allows ETR to reach its highest values in dry years. In a wet season, values are lower than in afforested areas (Tab. 4-12). Thus, during wet seasons, forests could mitigate flood risks to some extent. All the analysed meteorological conditions are characterized by greater between-ecosystem variability in sensible heat fluxes, by moderate variability in latent heat fluxes, and by largely-unchanged Rn variability (Tab. 13).
The differentiation of intercepted solar energy by plant cover structure for évapotranspiration and air heating is the second order control mechanism for the modification of local meteorological conditions. As discussed factors which influence albedo, control the input of solar energy at the landscape level. The modification by plant cover of the partitioning of intercepted energy is in operation in each ecosystem, but nevertheless, enhances variability in components of heat balance in the landscape. These control mechanisms are much better expressed under dry and warm meteorological conditions than under wet and cool ones.
Differences in albedo values between ecosystems may not only affect the micrometeorological conditions of the landscape, but may also be considered feedback mechanisms in global temperature control (e. g. Watson and Lovelock 1983).
Increased aridity is accompanied by increased stomatal resistance in plants, as well as by increased atmospheric evaporative demand. This explains why the ratio of real évapotranspiration (ETR) to potential évapotranspiration decreases with increasing aridity. This is not true for a lake in which evaporation increases with aridity, because this process is not then limited by water shortage. The better-developed the structure of plant cover, the higher the ETR and the greater the ratio of real to potential évapotranspiration. Of all the ecosystems studied, the coniferous forest (Fc) has the highest ratio of ETR:ETP (Tab. 14). Under wet meteorological conditions amounts of water actually evapotranspired exceed the potential évapotranspiration. A very similar picture is observed in deciduous forest, with values for ETR:ETP ratios only slightly lower than in coniferous forest (Tab. 14). Meadows (M) are characterized by medium values for ETR:ETP ratios, and cultivated fields (C) — with their lack of perennial plant cover — exhibit even lower values for ETRrETP ratios than meadows. Bare soil (B) has the lowest value of any land habitat. These results point to the substantial role of plant cover structure in the enhancement of real évapotranspiration rates. This function of plant cover is better expressed in wet meteorological conditions. Thus, positive feedback can be found between wet meteorological conditions and évapotranspiration rates which can to some extent moderate the intensity of surface runoff in rainy growing seasons. But when precipitation is very heavy (e.g. 50% above normal) and the temperature relatively low (Tab. 2), real évapotranspiration is lower than
http://rcin.org.pl

30 L. Ryszków ski, A. Kędziora
water input under the wet and cool meteorological conditions assumed in the model (Tab. 8), as well as under the predicted cool and wet conditions (Tab. 11). Thus, the controlling effects of forests on runoff are limited when precipitation increases by 50%.
THE ROLE OF SHELTERBELTS IN THE CONSERVATION OF MOISTURE
In the landscape composed of cultivated fields and shelterbelts one can observe two opposite tendencies in micrometeorological conditions. In relation to the heat balance of ecosystems it was indicated, that the afforested areas intercepting the greatest amounts of incoming solar radiation are the ones with the highest évapotranspiration rates and the most limited influence on air and soil heating among terrestrial ecosystems. At the same time, the protecting effects of trees give fields between shelterbelts higher air temperatures and increased vapour pressure, as well as decreased wind speeds and lower saturation vapour pressure deficits. It is for this reason that afforested areas of landscape have higher évapotranspiration rates, while fields between shelterbelts conserve moisture to some extend. The effect of shelterbelts on water storages can be shown by comparison of real évapotranspiration rates in open fields with those in fields situated between shelterbelts. Water conservation can be detected in fields between shelterbelts under all the meteorological conditions analysed (Tab. 15). The shelter effect is greater in dry and warm meteorological conditions than in wet and cool weather. In a landscape with 20% under deciduous shelterbelts, the water conservation in fields between them was 16 mm under the dry and warm conditions assumed, and up to 8 mm under the model wet and cool meteorological conditions. But at the same time the overall landscape is evaporating 14 mm more water than the open field in a dry and warm year and 10 mm more when prevailing conditions are wet and cool. Thus a shelterbelt can be considered a landscape structure which gives rise to a redistribution of évapotranspiration rates in the watershed. Areas under shelterbelts show much higher évapotranspiration rates while cultivated fields conserve some water. At the landscape level, the value of évapotranspiration is denoted by weighted mean value of these opposing processes, and évapotranspiration rates are always higher than in fields. This is the result of the model used in this paper. But the real situation is probably more complicated. Occurring between cultivated fields and shelterbelts is the exchange of heat energy by advection (Ryszkowski and Kędziora 1993a), and shelterbelts can trap some water from mist or fog as droplets coalesce on trees (Bac 1965).
CONCLUSIONS
Meteorological conditions are modified by plant cover structure because of its influence on:
(a) the interception of solar energy (Rn values);
http://rcin.org.pl

Modification of effects of global climate change.. 31
(b) the partitioning of intercepted energy into the various components of the heat balance (LE, S and G fluxes);
(c) the differentiation of particular heat balance flux intensities within the mosaic structure of landscape (e.g. the decreased évapotranspiration rates of fields between shelterbelts, in comparison to those in open fields).
These influences of plant cover on solar energy fluxes can be considered at three levels of control. It is possible to indicate other control mechanisms connected with heat advection between ecosystems (Ryszkowski and Kędziora 1993a), air horizontal transport of water (Bac 1965), and others. But these phenomena have not been studied in this paper and are omitted from the discussion. The control of energy interception (value of Rn) depends very much on amounts of incoming energy and the physical structure of ecosystem as denoted by surface roughness, the transparency of the surface layer to light penetration, the color of the surface etc. These are physical characteristics which determine the interception of solar energy and they are hardly changed by meteorological conditions within the studied range of parameter values (from the assumed cool and wet to the predicted warm and dry conditions — Tables 1, 2, and 3). This does not indicate that biological features are unimportant. On the contrary, as with their even height and smooth leaf-blades, grasses intercept the least incoming solar energy, while the dark green and very rough canopy of coniferous afforestation has the highest Rn values noted among terrestrial ecosystems.
The management of plant cover structure in the landscape can thus lead to the moderation of Rn values at the landscape level as global climate change gives an increase in the amounts of incoming solar radiation (the values of Rn in Tables 10, 11 and 12). Nevertheless despite these increases in Rn values, the coefficient of variation for all the ecosystems analysed is the same as under normal meteorological conditions or those assumed in the model (Tab. 13).
Plant cover structure has substantial effects on the partitioning of intercepted solar energy into latent, sensible and sub-surface heat fluxes. An increase in the area of cultivated fields in the landscape leads to the amplification of the air-heating flux, and the effect is even more accentuated if vegetation is removed and soil kept bare (see estimations of sensible heat flux in cultivated fields — C, and bare soil — B in Tables 4-12). It can therefore be expected that large areas under cultivation could enhance the warming effects of global climate change at the level of the region. Due to unique properties like high specific heat capacity, and heat of evaporation, water, exerts a considerable influence on the energetic characteristics of ecosystems. The mentioned characteristics, ensure that values for latent and sensible heat (LE and S) — both terrestrial and water — become more similar in the analyzed ecosystems in wet years (Tab. 5). It is the coefficient of variation for sensible heat calculated from all the ecosystems analysed which has the highest values and which is higher under wet meteorological conditions than dry ones (Tab. 13). Thus, under wet conditions the mitigating capacities of plant cover for sensible heat flux are greater than under dry conditions. The opposite
http://rcin.org.pl

32 L. Ryszków ski, A. Kędziora
phenomena are found with évapotranspiration, with greater modificational effects observed in drier conditions.
Control over the partitioning of intercepted energy is not only exerted by characteristics of the plant cover structure, but also by the influence of prevailing meteorological conditions. In other words, plants react differently under wet and dry conditions. The interplay of the internal characteristics of plant cover influencing the partitioning of solar energy, and meteorological conditions, is poorly understood, nevertheless, results of analyses provide some guidelines for the management of the landscape with a view to mitigating presumed global climatic changes. Grasslands will optimize water conservation while lowering the sensible heat flux in a scenario of dry and warm conditions. Cultivated fields will conserve more water but will also intensify the latent heat flux, which because of heat advection (not considered in presented analysis) could probably make trade of between these two opposite processes less favorable for the survival of vegetation. If global changes allow the scenario of dry and warm weather to be realized in Poland, then agricultural land should imitate grassland if it is to be well-adapted to prevailing meteorological conditions. Before and aftercrops should be added to main crops in order to cover soil with a canopy of cultivated plants. A dense stand of crops with bright green leaves reflecting solar radiation should be cultivated by farmers. Cereals with broad leaves will probably be the best choice to imitate grasslands with a view to moderating the unfavourable dry conditions anticipated in the probable scenario of global climate change. The third level of measures distinguished for the control of solar energy fluxes at the landscape level could moderate évapotranspiration rates to some extent and in this way save water for crops grown between shelterbelts. These effects are more pronounced in dry and warm conditions (Tab. 15).
Table 15. Impact of shelterbelts on water conservation (mm) in an agricultural landscape under wet, normal and dry meteorological conditions
Real (R), assumed model (A) and predicted (P) meteorological conditions
Shelterbelts Difference between real évapotranspiration (mm) in open cultivated share in the fields and fields located between shelterbelts
landscape area (%) R
Wet A P R
Normal A P R
Dry A
10 2 3 4 3 5 4 7 8
20 3 8 10 8 11 9 14 16
30 9 16 18 14 18 17 21 24
The analyses of various meteorological situations have shown that plant cover has the capacity to mitigate the presumed effects of global climate change. Thus, account should be taken of it when attempts are made to predict global changes at local level.
Study supported financially by the State Committee for Scientific Research.
http://rcin.org.pl

Modification of effects of global climate change..
REFERENCES
33
Adams R. M., Rosenzweig C., Peart R. M., Ritchie J. T., McCarl B. A., Glyer J. D., Curry R. B., Jones J. W., Boote K J., Allen L. H. Jr., 1990, Global climate change and US agriculture, Nature 345.
Anderson J. M., 1992, Responses of soils to climate change, Advances in ecological research 22. Bac S., 1965, Contribution of forest into the water balance of Poland (in Polish), Folia Forestalia
Polonica A. 14. Bouwman A. F. (ed.), 1990, Soils and the greenhouse effect, J. Wiley and Sons, Chichester. Bruin H. A. R., Haltslag A. M., 1982, A simple parametrization of the surface fluxes of sensible
and latent heat during daytime compared with Penman-Monteith concept, J. Applied Meteorology 21.
Gates W. L., Mitchell J. F. B., Boer G. J., Cubaschi U., Meleshko V. P., 1992, (in:) Houghton J. T., Callander B. A., Verney S. K. (eds), Climate change, Cambridge Univ. Press. Cambridge.
Gleick P. H., 1989, Climate change, hydrology and water resources, Rev. Geophysies 27. Goodess C. M., Palutikof J. P., 1992, The development of regional climate scenarios and the
ecological impact of greenhouse gas warming, Advances in ecological research 22, 33-62, Academic Press.
Hulme M., Wigley T. M. L., Jones P. D., 1990, Limitations of regional climate scenarios for impact analysis (in:) Boer M. M., deGrot R. S. (eds), Landscape-ecological impact of climate change, IOS Press, Amsterdam.
Jager J. 1990, Climate: approaches to projecting tćmperature and moisture changes (in:) Solomon A. M., Kauppi L. (eds), Toward ecological sustainability in Europe, International Institute for Applied System Analysis, Laxenburg, Austria.
J àger J., Ferguson H. L. (eds), 1991, Climate change: sciences, impacts and policy. Cambridge Univ. Press. Cambridge.
Karliński M., Kędziora A., 1968, Consideration on methods for elaboration of nature calendar in Szczecin direct, (in Polish), Roczniki Polskiego Towarzystwa Przyjaciół Nauki, Rolnictwo i Leśnictwo, 24.
Kędziora A., Kapuściński J., Moczko J., Olejnik J., Karliński M., 1987, 24 hours dynamics of évapotranspiration in alfalfa field (in Polish), Roczniki Akademii Rolniczej w Poznaniu 182.
Kędziora A., Olejnik J., Kapuściński J., 1989, Impact of landscape structure on heat and water balance. Ecology International 17.
Kędziora A., Tamulewicz J., 1990, Heat balance (in:) Ryszko wski L., Marcinek J., Kędziora A. (eds) Obieg wody i bariery biogeochemiczne w krajobrazie rolniczym (in Polish), Wydawnictwo Naukowe UAM Poznań.
Kożuchowski K. (ed.), 1993, Global warming and contemporaty climate changes in Poland, Abstracts, Szczecin.
Marcinek J., Spychalski M., Komisarek J., 1990, Water cycling in agricultural micro-watershed (in Polish) (in:) Ryszkowski L., Marcinek J., Kędziora A. (eds), Obieg wody i bariery biogeochemiczne w krajobrazie rolniczym, Wydawnictwo Naukowe UAM Poznań.
Mooney H. A., Fuentes E. R., Kronberg B. I. (eds.), 1993, Earth system responses to global change, Academic Press, New York.
Olejnik J., 1988, The empirical method of estimating mean daily and mean ten-days values of latent and sensible-heat fluxes near the ground, Jour. Applied Meteorology 27.
Olejnik J., Kędziora A., 1991, A model for heat and water balance estimation and its application to land use and climate variation, Earth Surface Processes and Landforms 16.
Parry M., 1992, The potential effect of climate changes on agriculture and land use, Advances in ecological research 22.
Pasławski Z., 1990, Water balance of Wielkopolska (in:) Ryszkowski L., Marcinek J., Kędziora A. (eds), Obieg wody i bariery biogeochemiczne w krajobrazie rolniczym, Wydawnictwo Naukowe UAM Poznań.
Rosenberg N. J., 1974, Microclimate: the biological environment, Wiley and Sons, New York. Ryszkowski L., Karg J., 1976, Role of shelterbelts in agricultural landscape (in:) Missonnier J.
(ed.) Les bocages-histoire, ecologie, economic CNRS, Univ. de Rennes.
http://rcin.org.pl
34 L. Ryszków ski, A. Kędziora
Ryszkowski L., Kędziora A., 1987, Impact of agricultural landscape structure on energy flow and water cycling, Landscape Ecol. 1.
Ryszkowski L., Kędziora A., Olejnik J., 1991, Potential effects of climate and land use changes on water balance structure in Poland (in:) (eds.) Brouwer F. M., Thomas A. J., Chadwick M.J. Land use changes in Europe, Kluwer, Dordrecht.
Ryszkowski L., Kędziora A., 1993a, Energy control of matter fluxes through land-water ecotones in an agricultural landscape, Hydrobiologia 251.
Ryszkowski L., Kędziora A., 1993b, Agriculture and greenhouse effect, Kosmos 42. Scott M. J., Rosenberg N. J., Edmonts J. A., Cushman R. M., Darwin R. F., Yohe G. W., Liebetran
A. M., Hunsaker C. T., Bruns D. S., De Angelis D. L., Hales J. M., 1990, Consequences of climate change for the human environment, Climate Research 1.
Smith T. M., Shugart H. H., Bonan G. B., Smith J. B., 1992, Modeling the potential response of v egetation to global climate change, Advances in ecological reseach 22.
Starkel L., Obrębska-Starkel B., Gutry-Korycka M. (eds), 1993, Global environmental changes — a challange for humanity, Kosmos 42.
Stouffer R. J., Manabe S., Bryan K , 1989, Interhemspheric asymmetry in climate response to a gradual increase of armospheric carbon dioxide, Nature 342.
Thorn A. S., 1975, Momentum, mass and heat exchange of plant communities, J. L. Monteith (ed.) (in:) Vegetation and the atmosphere, Academic Press, London, Great Britain.
Washington W. M., Meehl G. A., 1989, Climate sensitivity due to increased C02 : Experiments with a coupled atmosphere and ocean general circulation model, Climate Dynamic 4.
Watson A., Lovelock J. E., 1983, Biological homeostasis of the global environment: the parable of daisy world, Tellus 35B.
http://rcin.org.pl

GEOGRAPHIA POLONICA G5, 1995
D I U R N A L C H A N G E S I N T H E I S O T O P E C O M P O S I T I O N
O F A T M O S P H E R I C C O 2 I N K R A K O W
M I R O S Ł A W ZIMNOCH, JAROSŁAW N Ę C K I , T A D E U S Z FŁORKOWSKI
Faculty of Physics and Nuclear Techniques The Academy of Mining and Metallurgy
Al. Mickiewicza 30, 30-059 Kraków, Poland
ABSTRACT: In this paper we present the preliminary results of measurements of diurnal changes in the isotopic composition of atmospheric CO2 in Kraków. We present four experiments done in different seasons of the year. Results show that the isotope composition is influenced by biospheric activity and local meteorological conditions.
KEYWORDS: Stable isotopes, CO2 concentration, carbon cycle, diurnal cycle.
INTRODUCTION
Measurement of the diurnal cycle of the isotopic ratios — 13C/12C and 18Q/16Q jn atmospheric C02 helps in understanding the factors controlling the isotope composition of C02 and isotope signs of various components of C02 (anthropogenic and biogenic). As meteorological conditions influence the processes of evolution of soil C02 and vertical mixing strongly, several experiments were done in various meteorological conditions. The results of four experiments are presented along with preliminary interpretation. Isotope composition is expressed by the 8 value:
5 = s _ sc- 1000%o , st
where Rs and Rst are isotopic ratios of heavy to light isotopes in the sample and standard, respectively.
SAMPLING SITE AND TECHNIQUE
The experiments were performed in the building of the Faculty of Physics and Nuclear Techniques of the Academy of Mining and Metallurgy in Kraków. This is located near the centre of the town but in what is rather a recreational
http://rcin.org.pl

36 M. Zimnoch, J. N$cki, T. Florkowski
area on the western side. The contribution of local low emission of atmospheric C02 is small and car traffic is also lower in this region.
The sampling site is located on the roof of the faculty building about 15 m above ground level. Atmospheric air is pumped through a plastic tube from the roof to the laboratory and here C02 is extracted in the glass vacuum line. Cryogenic methods are used to remove moisture (using a dry ice temperature trap) and to extract C02 (with a liquid nitrogen temperature trap). The extraction method has been checked for fractionation effect on oxygen isotopes and the fractionation has been found to be less than 0.1 %o. C02 samples are measured on a Micromass VG 602 mass spectrometer.
EXPERIMENTS
The aim of these experiments was to measure diurnal variability in the isotopic compositions of carbon and oxygen in atmospheric C02. The correlation between those and the influence of meteorological conditions was also investigated.
Four experiments were carried out, each at a different time of the year. The first was in early spring (18-21 March '92) while biosphere activity was low. Two experiments were done during summer (7-10 and 21-24 July '92) when biosphere activity was intense, and one was done in winter (10-13 December '92) when lower temperatures were to raise local emissions.
Samples were collected in 4-hourly cycle for a 3-day period. Meteorological conditions (atmospheric pressure, temperature and relative humidity) were measured simultaneously. The time for collecting a single sample was about 1.5 hours. After extraction the C02 samples were measured on a mass spectrometer to find the 513C and 5180 values.
RESULTS
Values of 813C and 8180 from the samples collected in all experiments are presented in Figs. 1-4. Fig. 5 gives the correlation between oxygen and carbon isotope composition in C02 for all of the experiments.
The experiment done in spring coincided with a period of relatively low temperatures and high humidity, a few days after snow had melted. The temperature difference between day and night reached 10°C, though in practice a situation of equilibrium obtained between sunset and a few hours after sunrise. The mean value for the height of the inversion layer varied between 150 and 200 m. There was no rain nor strong wind during the 3 days. Both delta values are well correlated (Fig. 5a), and there is also a strong correlation with temperature. Maximum delta values were observed in the afternoon and minimum ones in the early morning.
The first of the summer experiments coincided with typical weather for the season and region. Day temperatures reached 25°C and night-time
http://rcin.org.pl

Diurnal changes in the isotope composition.. 37
Fig. 1. Diurnal cycle of the isotopic composition of atmospheric CO2. Experiment 1 (18-21.03.1992)
Fig. 2. Diurnal cycle of the isotopic composition of atmospheric CO2. Experiment 2 (7-10.07.1992)
http://rcin.org.pl

38 M. Zimnoch, J. N$cki, T. Florkowski
Fig. 3. Diurnal cycle of the isotopic composition of atmospheric CO2. Experiment 3 (21-24.07.1992)
Fig. 4. Diurnal cycle of the isotopic composition of atmospheric CO2. Experiment 4 10-13.12.1992)
http://rcin.org.pl
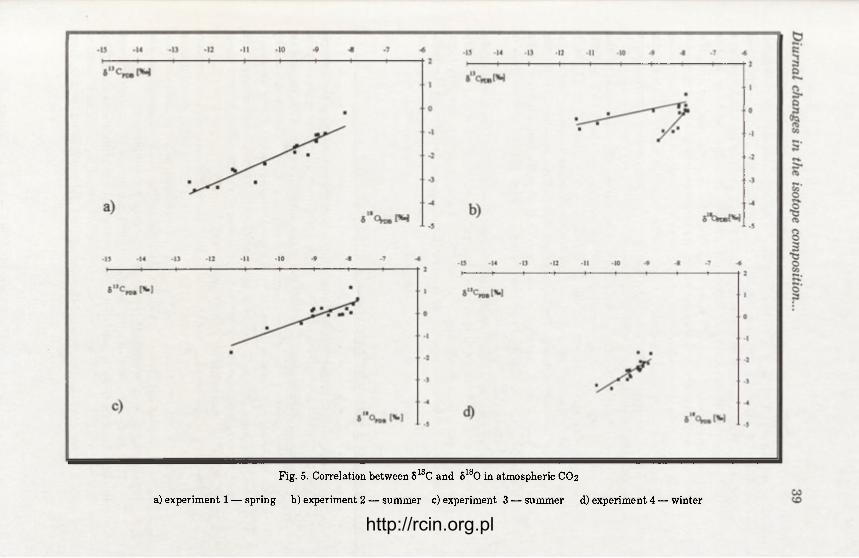
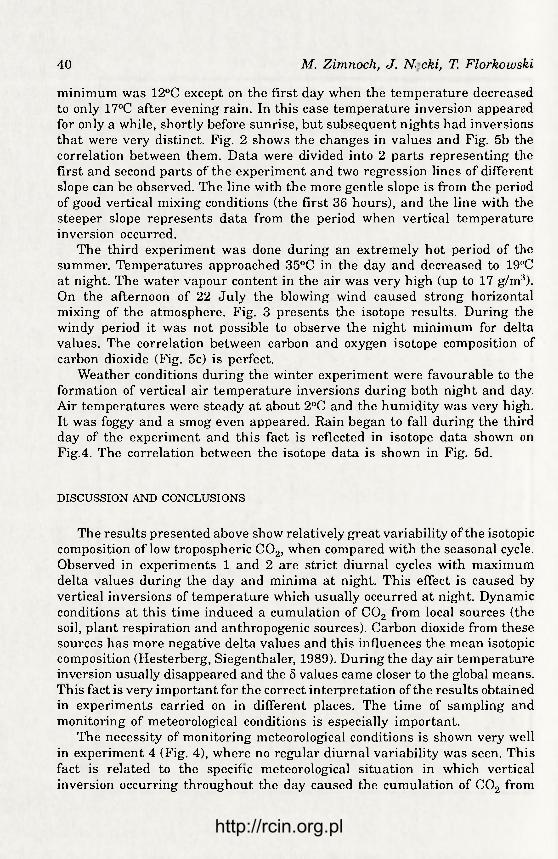
Fig. 5. Correlation between 513C and 51 80 in atmospheric CO2
a) experiment 1 — spring b) experiment 2 — summer c) experiment 3 — summer d) experiment 4 — winter
http://rcin.org.pl
40 M. Zimnoch, J. N$cki, T. Florkowski
minimum was 12°C except on the first day when the temperature decreased to only 17°C after evening rain. In this case temperature inversion appeared for only a while, shortly before sunrise, but subsequent nights had inversions that were very distinct. Fig. 2 shows the changes in values and Fig. 5b the correlation between them. Data were divided into 2 parts representing the first and second parts of the experiment and two regression lines of different slope can be observed. The line with the more gentle slope is from the period of good vertical mixing conditions (the first 36 hours), and the line with the steeper slope represents data from the period when vertical temperature inversion occurred.
The third experiment was done during an extremely hot period of the summer. Temperatures approached 35°C in the day and decreased to 19PC at night. The water vapour content in the air was very high (up to 17 g/m3). On the afternoon of 22 July the blowing wind caused strong horizontal mixing of the atmosphere. Fig. 3 presents the isotope results. During the windy period it was not possible to observe the night minimum for delta values. The correlation between carbon and oxygen isotope composition of carbon dioxide (Fig. 5c) is perfect.
Weather conditions during the winter experiment were favourable to the formation of vertical air temperature inversions during both night and day. Air temperatures were steady at about 2°C and the humidity was very high. It was foggy and a smog even appeared. Rain began to fall during the third day of the experiment and this fact is reflected in isotope data shown on Fig.4. The correlation between the isotope data is shown in Fig. 5d.
DISCUSSION AND CONCLUSIONS
The results presented above show relatively great variability of the isotopic composition of low tropospheric C02, when compared with the seasonal cycle. Observed in experiments 1 and 2 are strict diurnal cycles with maximum delta values during the day and minima at night. This effect is caused by vertical inversions of temperature which usually occurred at night. Dynamic conditions at this time induced a cumulation of C02 from local sources (the soil, plant respiration and anthropogenic sources). Carbon dioxide from these sources has more negative delta values and this influences the mean isotopic composition (Hesterberg, Siegenthaler, 1989). During the day air temperature inversion usually disappeared and the 8 values came closer to the global means. This fact is very important for the correct interpretation of the results obtained in experiments carried on in different places. The time of sampling and monitoring of meteorological conditions is especially important.
The necessity of monitoring meteorological conditions is shown very well in experiment 4 (Fig. 4), where no regular diurnal variability was seen. This fact is related to the specific meteorological situation in which vertical inversion occurring throughout the day caused the cumulation of C02 from
http://rcin.org.pl

Diurnal changes in the isotope composition.. 41
local sources. It is for this reason that a constantly decreasing trend in the isotope ratio was observed during the first two days.
Another interesting effect is a good correlation between 813C and 5180 which has also been observed by others (Francey, Tans, 1989, Friedli et al., 1987). This fact is a confirmation of our previous observations but as seen in experiments, a change in the relative abundance of C02 originating from different sources has an influence on the slope of the regression curve. A situation of this kind arose in the second experiment. On the afternoon of 7-th July rain caused the saturation of pores in the soil and decreased the C02 flux. The second effect which was able to modify results was the lack of air temperature inversion during the night. Fig. 2 has no distinct night minimum and Fig. 5b has two groups of points. After one day the situation came back to a state in which the night minimum was very distinct.
The results presented in Fig. 3 show two different states. During the first day mixing conditions were very typical with a night temperature inversion. However, the afternoon of the second day saw a change in meteo-rological conditions with the onset of wind causing effective horizontal mixing. It is for this reason that a night minimum is not observed in this period. The good correlation between carbon and oxygen isotopes suggests that the contribution of different sources was constant.
ACKNOWLEDGEMENTS
We would like to thank H. Mikołajczyk for carrying out stable isotope analyses, B. Lewandowska and J. Mirosław for help in collecting samples. This work was financially supported by Scientific Research Committee.
REFERENCES
Francey R, Tans P., 1989, Global variations in 0-18 of atmospheric C02 , WMO Report 53. Friedli Hj, Siegenthaler U., Rauber D., Oeschger H., 1987, Measurements of concentration 13C/12C
and 1 0 / 1 6 0 ratios of tropospheric carbon dioxide over Switzerland, Tel I us 39B. Hesterberg R., Siegenthaler U., 1989, C0.2 and its stable isotopes in urban air and in soil,
WMO Report 53. Levin I., 1987, Atmospheric C0 2 in continental Europe — an alternative approach to clean air C0 2
data, Tellus 39B.
http://rcin.org.pl

http://rcin.org.pl
GEOGRAPHIA POLONICA G5, 1995
C O N T E M P O R A R Y C H A N G E S O F B A L T I C S E A I C E
JOZEF P . GIRJATOWICZ, KRZYSZTOF M . KOZUCHOWSIA
Institute of Marine Sciences University of Szczecin
ul. Felczaka 3a, 71-412 Szczecin, Poland
ABSTRACT: The paper presents results of time series analysis of observations of Baltic Sea ice. This research may be used to examine the effect of climatic warming on ice conditions in the Baltic Sea. The 273-year series of data on the maximum annual extent of ice cover in the Baltic Sea, reconstructed and published by Jurva, Seina and Palosuo is analyzed. Three parameters of ice conditions on the Polish coast are also utilized: the duration of the ice season (S), the number of days with ice (N) and the maximum thickness of ice (H). The latter data cover the period 1946/1947-1992/1993. Although a general trend towards milder ice seasons can only be seen in isolated series some significant trends are stated. Significant negative deviations of the amount of ice occured in the most recent 5-year period. The quasi-8-year cyclicity of climatic variation in ice conditions is predominant.
KEYWORDS: Baltic Sea, ice cover, climatic variation, climatic trend, climate cyclicity.
INTRODUCTION
Long-term variations in ice cover are a sensitive indicator of climate changes, and as such are gaining in importance owing to looming global warming.
The Baltic Sea is located in the zone of seasonal sea ice, where climatic variations show up drastically in the characteristics of ice seasons.
There have been winters when ice covered the entire area of the Baltic Sea (420-103 km2), and others in which very limited cover was noted (e.g. 12% in 1988/1989).
A time series for the maximum annual extent of ice in the Baltic Sea was initiated by Jurva (1944). Data are available for every ice season since 1719/1720 and those for the period 1719/1720-1991/1992 were published by Seina and Palasuo (1993).
The maximum annual extent of ice is a useful measure of the severity of the winter season, especially for the northern Baltic Sea. Ice cover along the southern coast is a rather sporadic event due to the repeated freezing
http://rcin.org.pl

44 J. P. Girjatowicz
and breakup of ice in winter. Thus for the Polish coast the length of the ice season, the number of days with ice and the thickness of ice are more meaningful characteristics. Unfortunately, the observational data from the time before 1946 are not available for our studies.
The present paper therefore analyzes the following two groups of time series on ice conditions in the Baltic Sea:
(1) The Jurva-Palosuo-Seina values for the maximum exent of ice cover on the Baltic Sea (with a time series of 273 years).
(2) The duration of the ice season, number of days with ice and maximum thickness of ice on the gulfs and lagoons of the Polish coast: the Szczecin Lagoon, the Vistula Lagoon and the Puck Gulf. Data cover the period 1946/47-1992/93 (47 years).
This paper presents the results of statistical analysis carried out for the purpose of detecting cyclicity and trends in the time series. Use was made of variance spectral analysis (Mitchell 1966), running means, linear regression and Mann-Kendall rank-statistics.
ANNUAL EXTENT OF ICE
Using the records of the maximum annual extent of ice between 1719/1720 and 1991/1992, Seina (1993) estimated the long-term trends for ice cover in the Baltic Sea. The annual rate of the changes is —200 km2. For the last 100 years the trend is almost unchanging. The best estimate for the future is -1440 2960 km2 per year (Seina 1993), which means that ice cover in the Baltic will decrease and fall in with zero at the end of the 21st century.
To date the trend for the extent of ice remains speculative, as coefficients of linear regression, and Mann-Kendall rank-tests (a = -160 km2/y and x = -0.068 respectively) are rather ambiguous with significances at the 90% confidence level only.
Trend have varied considerably in the past, with increases of 987 km2/y in the period 1719/1720-1799/1800 and well-marked decreases in ice cover in the 19th century, with a linear trend of -486 km2 per year. 10-year averages fell from 290-103 km2 (1800/1801-1809/1810) to 214-103 km2 (1890/1891-1899/1900).
The 20th century saw a slow increase in the extent of the ice. For the series since 1990/1901 the linear trend is equal to 162 km2/y. 10-year averages began at 166-103 km2 and have since oscillated between 153-103 km2 and 228-103 km2. The last complete freezing occured in winter 1946/1947, and there have since been cases which generally show values fluctuating below the average (217-103 km2) (Tab. 1).
It is also evident that extremely limited ice cover has characterized the final years of the record. 1988/1989 saw the minimum value ever recorded (52 103 km2), and the period 1987/1988-1991/1992 had averaged values for the maximum annual extent of ice of 91-103 km2. The deviations from long-term means implied by these data were examined using Cramer's test, and 5-year
http://rcin.org.pl

Contemporary changes of Baltic Sea ice 45
Tab. 1. Decadal averages of the maximum extent of the Baltic ice cover since 1720. Values in 103 km 2 (after Seina and Palasuo 1993)
Years 01-10 11-20 21-30 31-40 41-50 51-60 61-70 71-80 81-90 91-100 1700+ 13 0X 166 217 208 280 204 244 300 214 1800+ 290 243 218 248 243 207 243 221 223 214 1900+ 166 189 222 153 206 194 228 174 210 94xx
* — value for winter 1719 /1720 *x — mean for winters 1990 /1991- 1991 /1992
mean was found do deviate negatively in a manner significant at the 0.05 level (Fig. 1). It is worth mentioning that an ice cover of ca 180-103 km2 is some way critical to the freezing of the Baltic Sea (Seina 1993). Ice cover increases rapidly over very large areas once this value has been reached.
Some characteristic climatic rhythms occur in the ice cover series and two significant peaks appear in the spectrum for the maximum annual extent of ice (Fig. 2). These show 7.8- and 3.5-year perdiodicities. It is
Fig. 1. Variations in the maximum extent of ice on the Baltic Sea since 1946/1947: 5-year running means. Data after Seina and Palasuo (1993)
M — mean for the period 1719/1720-1991/1992, m — mean for the period 1946/1947-1991/1992, Significant deviations fromM and m means are marked (significance level = 0.05)
http://rcin.org.pl

46 J. P. Girjatowicz
Data after Seina and Palasuo (1993) Number — significant cycles in years, SE — spectral estimate, x — periods in years
0.50 — white noise, 0.95 — confidence level
notable that all indices of the severity of winters in the region have well-marked 7-8-year periodicity (Sazonov et al. 1992; Stellmacher, Thiesel 1989). Some climatic elements (precipitation, cloudiness and sunshine) also exhibit 3-4-year oscillations (Brazdil, Kozuchowski 1980; Morawska-Horawska 1985), and both 7-8-year and 3.5-year cyclicities have been established for indices of upper atmospheric circulation over the Baltic region (Kozuchowski, Stolarczuk, Wibig 1994).
The spectra themselves change with time. 7-8-year oscillations may dominate in the ice cover series (1719/1720-1991/1992) as a whole but these have only become significant in the spectrum in the most recent subperiod (1900/1901-1991/1992). Oscilations with 3.5-year and 5.3-year cyclicity were found for the subperiods 1719/1720-1799/1800 and 1890/1891-1899/1900 respectively.
ICE SEASON PARAMETERS
The configuration of the curve representing 5-year running means shows some similarities between fluctuations of ice indices for the southern Baltic coast and the maximum extent of ice. A characteristic coincidence can be observed for all variables in the occurence of significant negative deviations after 1987 (Figs. 1, 3).
The duration of the ice season (S) and the number of ice-days (N) show decreasing trends which achieve significance in the Gulf of Puck. Parameter N decreased significantly in all cases and the decrease in the thickness of ice on the Vistula Lagoon was also found to be significant (Tab. 2). The statistics for temporal changes tend to be stronger for the eastern part of the coast.
http://rcin.org.pl

Contemporary changes of Baltic Sea ice 49
Fig. 3. Variations in the number of ice days (N), the duration of the ice season (S) and the maximum of ice thickness (H) for the Szczecin Lagoon in the period 1946/1947-1992/1993: 5-years running means.
Significant deviations from the m-mean are marked (significance level = 0,05)
http://rcin.org.pl

48 J. P. Girjatowicz
S .[days]
1 9 5 0 / 5 1 1 9 6 0 / 6 1 1 9 7 0 / 7 1 1 9 8 0 / 8 1 1 9 9 0 / 9 1
20 10 5 3 2 f ( a ) Fig. 4. Variations in the duration of the ice season (S) for the Szczecin Lagoon in the period
1946/1947-1992/1993: values filtered by 5-term binomial filter (upper) and variance spectrum (see explanation for Fig. 2)
http://rcin.org.pl

Contemporary changes of Baltic Sea ice 49
Table 2. Statistics of indices of the ice conditions of the Polish coast for the period 1946/1947-1992/1993x
Area Position Ind. Mean Coef. of Mann- Linear Cycles <I> X variab. [%] Kendall
x stat. trend (/year)
(years)
Szczecin 53°50 N S 67.0 53 -0.15 -0.75 7.7 2.1 Lagoon 14°20 E N 56,5 60 -0.20" -0.81 7.7
H 19.4 71 -0.12 -0.14 7.7 3.3 Gulf of Puck 54°43 N S 79.0 49 -0.23* -1.24 7.7 2.0
18°25' E N 65.3 55 -0.23x -1.06 7.7 H 22.6 67 -0.15 -0.87 7.7 3.3
Vistula Lagoon 54° 19 N S 105.4 27 -0.20 -0.66 7.7 2.0 19°32 E N 90.7 34 -0.27" -1.00 7.7 2.0
H 32.1 47 -0.21" -0.30 7.7 3.3 S — duration of ice season (days) N — number of ice days (days) H — maximum thickness of ice (cm) * — significant trend at 0.05 level
Predominant in temporal variations is a 7.7-year cyclic oscillation. A quasi-biennal and 3.3-year cycles have also appeared (Tab. 2). An example of periodicity in time series of ice parameters is the spectrum and filtered values of the S parameter for the Szczecin Lagoon (Fig. 4).
CONCLUSION REMARKS
The temporal evolution of ice cover is characterized by a spatial pattern. The differentiation appears in the whole sea area and along the southern coast.
In general, a duality could be seen in ice trends. The south-east coast shows a significant contemporary decline in ice events, while cover on the northern part of the sea has not changed very much with time, although there are series in which rises in the length of ice seasons and in ice thickness were found (Seina 1993).
It is also interesting that the area ice volume in the Western Baltic in the mid-1980s was the same as that almost 100 years ago (Kozlowski, Loewe 1994). This finding is in accordance with a slight trend for ice conditions in the Szczecin Lagoon (the western part of the Polish coast). A slight reduction in winter temperatures along the coast of Sweden and across the Western Baltic has been also reported (Alexandersson, Eriksson 1989; Schonwiese, Stabler 1991).
On the other hand, unusually mild winters set in NE-Europe in 1988 and have occur'ed in succesion in an almost stable area (Sazonov, Malkentin 1994). This warming has been associated with an abrupt decline in the severity of winter ice along the Polish coast since 1987/1988. The winters of 1987/1988, 1988/1989 and 1989/1990 were ice-free in the Szczecin Lagoon and there were only a few ice-days along the eastern part of the Polish coast.
http://rcin.org.pl

50 J. P. Girjatowicz
When appraising the statistical results of the trend analysis it should be remembered that last episode of mild winters is of a prime importance, although the relationship with the forcing of global warming is as yet rather hypothetical.
Particulary characteristic for the ice and thermal variations in the region of the Baltic Sea are the quasi-cyclic 7-8-year oscillations. According to the paper by Kozlowski and Loewe (1994), the periodicity of severely icy winters has been enhanced since about 1940, while a zigzag structure was created in the time series before 1940. In accordance with the opinion of Malcher and Schonwiese (1987), no explanation can be proffered for the non-stability of the cyclic oscillations, as establishing the permanent activity of forcing factors remains rather problematical.
REFERENCES
Alexandersson H., Eriksson B., 1989, Climate fluctuations in Sweden 1860-1987, SMHIReports Met. and Climatol., 58, Norrkóping, Sweden, 54.
Brazdil R., Kożuchowski K., 1986, Some aspects of precipitation variability in Poland in the period 1881-1980, Scripta Fac. Sci. Nat. Univ. Purk., Brno, 8.
Girjatowicz J. P., Kożuchowski K., 1993, Cyclicity and trends in the contemporary changes in thermal and ice conditions in the Southern Baltic gulfs and lagoons (in:) Global warming and contemporary climatic changes in Poland, Proceedings of the Conference in Szczecin Univ.
Kozlowski G., Loewe P., 1994, The Western Baltic Sea ice season in terms of mass-related severity index: 1879-1992, Tellus, 46A.
Kożuchowski K., Stolarczuk A., Wibig J., 1994, Wskaźniki cyrkulacji atmosferycznej na poziomie 500 hPa nad Polską i Południowym Bałtykiem w latach 1951-1990 (Indices of the atmospheric circulation at the 500 hPa level over Poland and the Southern Baltic in the period 1951-1990) (in:) Klimat Polski i regionu Morza Bałtyckiego na tle zmian globalnych, Univ. of Szczecin, (in Polish).
Malcher J., Schonwiese C. D., 1987, Homogeneity, spatial correlation and spectral variance analysis of long European and North America air temperature records, Theor. Appl. Climatol., 38.
Mitchell J. M., 1966, Climatic Change, WMO, Technical Note, 79. Morawska-Horawska M., 1985, Cloudiness and sunshine in Cracow, 1861-1980, and its
contemporary trends, Jour. Climatol., 5. Sazonov B. I., Malkentin E. K., 1994, Znaczny wzrost temperatur zimowych w Europie
północno-wschodniej (A strong rise in winter temeratures in NE Europe) (in:) Klimat Polski i regionu Morza Bałtyckiego na tle zmian globalnych, Univ. of Szczecin, Rozprawy i Studia CCXVI (52), (in Polish).
Sazonov B. I., Malkentin E. K , Bukantis A. A., Stablyanko V. A., 1992, Surovye zimy i cirkulacya v troposfere i stratosfere (Severe winters and the circulations in the troposphere and stratosphere), Trudy GGO, 541.
Seina A., 1993, Ice time series of the Baltic Sea, Report Series in Geoph., Univ. of Helsinki, Dept. of Geo ph., 27.
Seina A., Palosuo E., 1993, The clasification of the maximum annual extent of ice cover in the Baltic Sea (1720-1992), Meri, 20.
Schonwiese C. D., Stahler V., 1991, Multiforced statistical assessments of greenhouse-gas-induced surface air temperature change 1890-1985, Clim. Dyn., 6.
Stellmacher R., Tiesel R., 1989, Uber die strenge der mitteleuropeischen Winter der letzten 220-Jahre — eine statistische Untersuchungen, Ztschr. Met., 39, 1.
http://rcin.org.pl

GEOGRAPHIA POLONICA 65, 1995
R E F L E C T I O N S O N C L I M A T E V A I A B I L I T Y W I T H I N S E L E C T E D
M O N T H L Y M E A N T I M E S E R I E S I N L I B Y A
A N D N E I G H B O U R I N G C O U N T R I E S
ALMABRUK A . ALI 1
Institute of Geophysics, Polish Academy of Sciences ul. Księcia Janusza 64, 01-452 Warszawa, Poland
ABSTRACT: This paper contains some results of long-time series analysis with respect to climate variability and change. The data are the mean monthly air temperature, precipitation and humidity at different stations located in Libya and neighbouring countries. At our disposal were 26 time series of monthly and annual mean values with an average length of ca. 51 years. It is to be hoped that the data are free from any anthropogenic influences. The hypothesis that the mean values or variances are homogeneous has been subject to the falsification procedure of non-parametric tests: the runs test, the Mann-Kendall test for trends in the mean or the variance, Lombard's test of the number of change-points, and the Pettitt change-point test. Appropriate statistical computations led the author to conclude that the climate characterized by the investigated processes of monthly and annual values should be considered unstable.
KEYWORDS: Statistical non-parametric tests, climate change — Libyan case.
INTRODUCTION
In this paper we examine the problem of climate variability and climate change by considering the way these are reflected in long monthly mean time series for air temperature, precipitation, and relative humidity recorded at different stations in Libya and neighbouring countries.
Use has been made of the following definitions (Analyzing... 1988, Mitosek 1992): climate variability means the variability inherent in the stationary stochastic process approximating the climate on a scale of a few decades. On the other hand, differences between the stationary stochastic processes
1 On leave from Al-Fateh University, Faculty of Engineering, Tripoli, Libya
http://rcin.org.pl
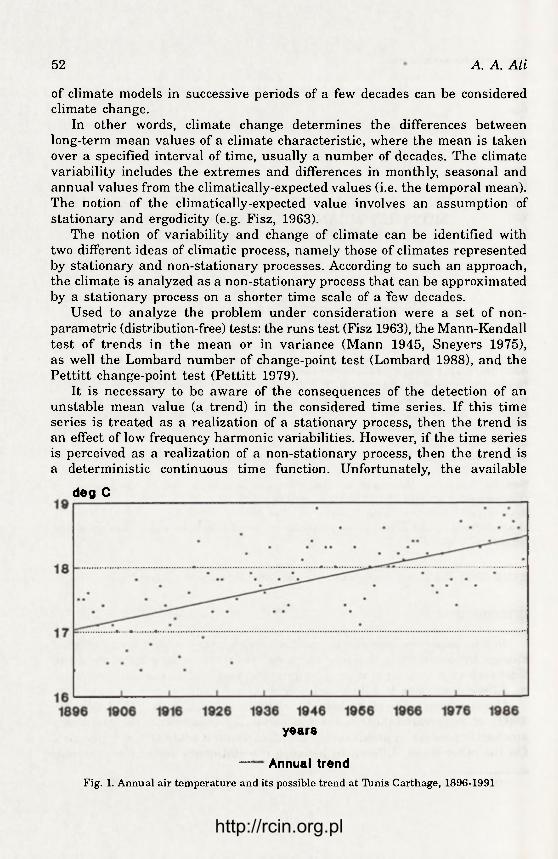
52 A. A. Ali
of climate models in successive periods of a few decades can be considered climate change.
In other words, climate change determines the differences between long-term mean values of a climate characteristic, where the mean is taken over a specified interval of time, usually a number of decades. The climate variability includes the extremes and differences in monthly, seasonal and annual values from the climatically-expected values (i.e. the temporal mean). The notion of the climatically-expected value involves an assumption of stationary and ergodicity (e.g. Fisz, 1963).
The notion of variability and change of climate can be identified with two different ideas of climatic process, namely those of climates represented by stationary and non-stationary processes. According to such an approach, the climate is analyzed as a non-stationary process that can be approximated by a stationary process on a shorter time scale of a few decades.
Used to analyze the problem under consideration were a set of non-parametric (distribution-free) tests: the runs test (Fisz 1963), the Mann-Kendall test of trends in the mean or in variance (Mann 1945, Sneyers 1975), as well the Lombard number of change-point test (Lombard 1988), and the Pettitt change-point test (Pettitt 1979).
It is necessary to be aware of the consequences of the detection of an unstable mean value (a trend) in the considered time series. If this time series is treated as a realization of a stationary process, then the trend is an effect of low frequency harmonic variabilities. However, if the time series is perceived as a realization of a non-stationary process, then the trend is a deterministic continuous time function. Unfortunately, the available
deg C
year 8
— A n n u a l trend Fig. 1. Annual air temperature and its possible trend at Tbnis Carthage, 1896-1991
http://rcin.org.pl

Reflections on climate variability within.. 53
realization give no chance to discern the influence of low frequencies from the trend in mean value.
Moreover, it should be stressed that we have been aware of the fact that, for the discharge time series, the relation of signal (in the form of a possible trend) to noise is very disadvantageous. In all cases, a possible trend is masked by noise (Fig. 1) where annual air temperature at Tunis Carthage and its possible trend are presented.
DATA
The data consisted of monthly and annual mean air temperature, precipitation, and relative humidity records for individual stations selected for Libya and neighboring countries. Each station is described by its latitude, (p, and longitude, X, given in decimal degrees, as well as by the number of years of observation (Tab. 1).
Table 1. List of the used data
Lp. Station/Country <P X Observation period T years Air temperature:
1 Benina\Libya 32. IN 20.3E 1945-1991 47 2 TripoliXLibya 32.9N 13.2E 1944-1991 48 3 KufraXLibya 24.2N 23.3E 1951-1991 41 4 MatruhXEgypt 31.3N 27.2E 1951-1991 41 5 Kom El NaduraXEgypt 31.2N 29.9E 1870-1957 88 6 El FasherXSudan 13.6N 25.4E 1941-1981 41 7 BilmaXNiger 18.6N 12.9E 1929-1990 62 8 BiskraXAlgeria 34.8N 5.7E 1932-1991 60 9 TamanrassetXAlgera 22.8N 5.5E 1951-1991 41
10 Tunis CarthageXTunis 36.8N 10.2E 1896-1991 96 Precipitation:
1 TripoliXLibya 32.IN 20.3E 1931-1992 62 2 SirteXLibya 31.ON 16.6E 1946-1991 46 3 ShahatXLibya 33.ON 21.9E 1946-1991 46 4 NasserXLibya 31.8N 23.9E 1944-1991 40 5 NalutXLibya 31.8N 11.OE 1931-1989 59 6 MisurataXLibya 32.4N 15.IE 1943-1990 48 7 HonXLibya 29. IN 15.9E 1946-1991 46 8 DernaXLibya 32.8N 22.8E 1945-1990 46 9 BeninaXLibya 32. IN 20.3E 1946-1991 46
10 AgedabiaXLibya 30.ON 20.2E 1946-1990 45 Relative air humidity:
1 BeninaXLibya 32.8N 20.3E 1945-1990 46 2 HonXLibya 29.IN 15.9E 1945-1990 46 3 JaloXLibya 29.IN 21.6E 1948-1989 42 4 NalutXLibya 31.8N 11.OE 1945-1990 46 5 TripoliXLibya 32.9N 13.2E 1944-1991 47 6 ZuaraXLibya 33.ON 12.IE 1945-1990 46
http://rcin.org.pl

54 A. A. Ali
The following numbers time series for air temperature have been considered:
Libya: 3 (Benina, Tripoli, and A1 Kufra); Egypt: 2 (Matruh and Kom El Nadura); Sudan: (El Fasher); Niger: 1 (Bilma); Algeria: 2 (Biskra and Tamanrasset); Tunisia: 1 (Tunis Carthage).
The following numbers of stations for precipitation have been selected for Libya only: (Tripoli, Sirte, Shahat, Nasser airport, Tabreq, Nalut, Misurata, Hon, Derna, Benina, and Agedabia).
The following numbers of stations for relative air humidity have been selected for Libya only (Tripoli, Benina, Hon, Jalo, Nalut, Zuara).
It is unfortunate that the lack of further details with regard to the history of the stations has made it difficult to evaluate the matter of the homogeneity of the time series. It is therefore accepted tacitly that the conclusions of this study will not be influenced excessively by any heterogeneities that might exist.
METHODOLOGY
We have adopted the hypothesis after Mitosek (1984), that the considered processes of mean monthly values are periodical random processes with one year cycle, that is that the 12-dimensional random variables for months of the same name have two identical moments, i.e., the mean value and the variance. The same assumption has adopted for the mean annual values, i.e. for the one-dimensional random variable.
In every case, the above assumptions refer to the identity of the appropriate mean values and variances.
The adopted hypothesis has then been subject to the falsification procedure of non-parametric tests: the runs test, the Mann-Kendall test of trends in the mean or the variance, Lombard's test of the number of change-points, and the Pettitt change-point test. This procedure (Mitosek 1995) constitutes a modification of the methodology proposed by Vannitsem and Demaree (1991), and consists of the consecutive use of the following tests:
(a) The runs test (Fisz 1963) allows for consideration of a hypothesis concerning the origin of the time series from a process with consecutively independent elements.
(b) The Mann-Kendall test (Mann 1945) provides for assessment of the overall trend in the mean value run of the time series; it is performed in a sequential forward and backward manner (Sneyers 1975).
(c) In a case in which there are no grounds for rejecting the hypothesis about the homogeneity of the mean value one goes on to consider possible changes in the variance using the Mann-Kendall test (Sneyers 1975); this ends the test analysis of the time series.
(d) If the Mann-Kendall test reveals an overall trend in the mean value then questions should asked about the existence of abrupt changes in the
http://rcin.org.pl

Reflections on climate variability within.. 55
series; the Lombard test (Lombard 1988) allows for the assessment of the number of the change-point.
(e) At the end, the Pettitt test enables on estimate of the change-point to be made; it is frequently impossible to ascribe to the statistically significant number of the change-point the same number of the statistically significant change-points.
The tests (a) to (e) should be used in the above-mentioned order. Test studies were carried out in relation to the standard significance level
of 5%.
RESULTS
The results of verification of the runs and Mann-Kendall tests will be presented separately for the considered phenomena. The results written in the tables express in the numerator the number of cases in which the analyzed hypothesis has been rejected, and in the denominator — their percentage share in the collection of tests.
The results of verification of the hypothesis showing that run number suggests the independence of consecutive random variables are shown in Tab. 2.
Table 2. Results of the runs test for air temperature, precipitation, and relative air humidity
Runs test Month Air temperature Precipitation Air humidity January 6/ 60.0 0/ 0.0 1/ 16.7 February 2/ 20.0 2/ 20.0 3/ 50.0 March 4/ 40.0 1/ 10.0 3/ 50.0 April 4/ 40.0 1/ 10.0 4/ 66.7 May 4/ 40.0 0/ 0.0 2/ 33.3 June 5/ 50.0 4/ 40.0 4/ 66.7 July 6/ 60.0 9/ 90.0 3/ 50.0 August 4/ 40.0 9/ 90.0 4/ 66.7 September 5/ 50.0 V 10.0 1/ 16.6 October 5/ 50.0 V 10.0 1/ 16.7 November 4/ 40.0 0/ 0.0 2/ 33.3 December 2/ 20.0 1/ 10.0 3/ 50.0 Year 7/ 70.0 2/ 20.0 5/ 83.3
Results of the Mann-Kendall, Lombard, and Pettitt tests have been classified according to the hypothesis about the independence which was either (a) rejected, or (b) not rejected.
The results of the Mann-Kendall test, presented in Tab. 3.1, 3.2 and 3.3, allow it to suppose that changes can be visible in the mean value or in the
http://rcin.org.pl

56 A. A. Ali
variance if the suitable hypothesis about homogeneity is rejected. In order to provide against uncertainty, it is assumed arbitrarily that the considered hypothesis about homgeneity is rejected by the Mann-Kendall test if a least five values of the test statistic are found in the critical region.
Then, for a set restricted to those series for which there were grounds for rejection of the hypothesis about homogeneity in the mean value, assessments using the Mann-Kendall test were made with regard to the chance of changes in their variances.
Series of monthly or annual mean values for which the Mann-Kendall test "noticed" some changes were then analyzed by the Lombard test, and the Pettitt test was then applied to the numbers of the series for which possible jumps were discovered by the Lombard test. The results of the Mann-Kendall and Pettitt tests are combined in Tab. 4.1 and 4.2, which give the names of stations with at least one statistically-significant change-point, according to the Lombard test. At the same time, the results of the Pettitt test are given on the right side of the name of station, in the form of the year in which the statistically significant change-point appeared. If a mark
is placed after the name of station it means that the Pettitt test was not applied.
AIR TEMPERATURE
The hypothesis about independence (Tab. 2) has been rejected in 20% of cases in Februrary and December up to 60% of cases in January and July; on average rejection affected 42.5% of cases for all months combined. For the annual data the hypothesis was rejected in 70% of cases.
For the time series declared independent according to the runs test, the hypothesis about stationarity and ergodicity of the mean value has been rejected by the Mann-Kendall test (Tab. 3.1) in between 1 case in January and 5 cases in April, June, and August, i.e. in from 10% to 50% of the considered cases and on average in 3.1 cases (31%) for all the months together. For the annual values, the hypothesis has been rejected in 1 case (10%).
However, for the dependent time series according to the runs test (Tab. 3.1), the hypothesis about the homogeneity of the mean value has been rejected by the Mann-Kendall test in between 2 cases (20%) in February, March, April, June, and December and 5 cases (50%) in July and October and on average in 3.2 cases (32.5%). For the annual values, the hypothesis has been rejected in 7 cases (70%).
Considering the results in Tab. 3.1 all together, i.e., independently of the results of the runs test, the hypothesis about the homogeneity of the mean value has been rejected by the Mann-Kendall test in between 4 cases (40%) in February and December to 9 cases (90%) in August; and on average in 7.6 cases (76%). For all annual values, the hypothesis has been rejected in 8 cases (80%).
http://rcin.org.pl
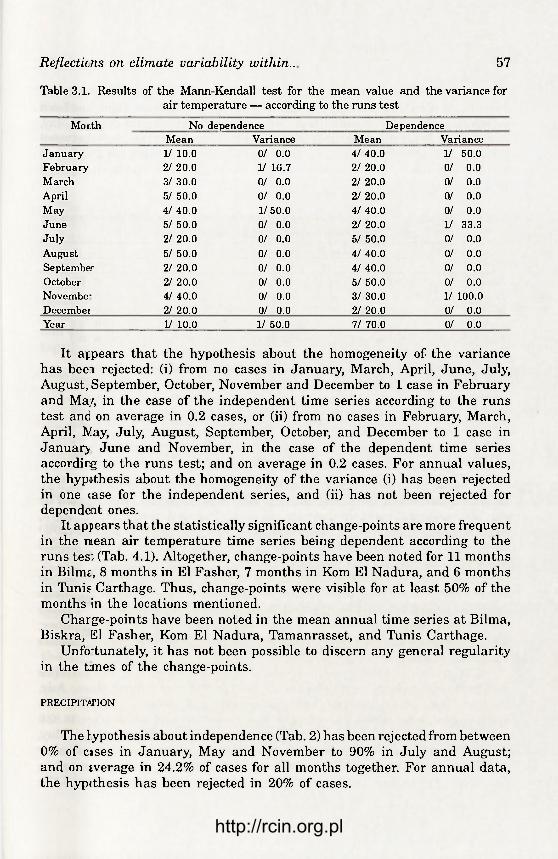
Reflections on climate variability within.. 57
Table 3.1. Results of the Mann-Kendall test for the mean value and the variance for air temperature — according to the runs test
Mor.th No dependence Dependence Mean Variance Mean Variance
January V 10.0 0/ 0.0 4/ 40.0 V 50.0 February 2/ 20.0 V 16.7 2/ 20.0 0/ 0.0 March 3/ 30.0 0/ 0.0 2/ 20.0 0/ 0.0 April 5/ 50.0 0/ 0.0 2/ 20.0 0/ 0.0 May 4/ 40.0 1/50.0 4/ 40.0 0/ 0.0 June 5/ 50.0 0/ 0.0 2/ 20.0 1/ 33.3 July 2/ 20.0 0/ 0.0 5/ 50.0 0/ 0.0 August 5/ 50.0 0/ 0.0 4/ 40.0 0/ 0.0 September 2/ 20.0 0/ 0.0 4/ 40.0 0/ 0.0 October 2/ 20.0 0/ 0.0 5/ 50.0 0/ 0.0 Novembe* 4/ 40.0 0/ 0.0 3/ 30.0 1/ 100.0 Decembei 2/ 20.0 0/ 0.0 2/ 20.0 0/ 0.0 Year 1/ 10.0 1/ 50.0 7/ 70.0 0/ 0.0
It appears that the hypothesis about the homogeneity of the variance has beei rejected: (i) from no cases in January, March, April, June, July, August, September, October, November and December to 1 case in February and Ma;/, in the case of the independent time series according to the runs test and on average in 0.2 cases, or (ii) from no cases in February, March, April, May, July, August, September, October, and December to 1 case in January June and November, in the case of the dependent time series according to the runs test; and on average in 0.2 cases. For annual values, the hypothesis about the homogeneity of the variance (i) has been rejected in one case for the independent series, and (ii) has not been rejected for dependent ones.
It appears that the statistically significant change-points are more frequent in the mean air temperature time series being dependent according to the runs tes: (Tab. 4.1). Altogether, change-points have been noted for 11 months in Bilnu, 8 months in El Fasher, 7 months in Kom El Nadura, and 6 months in Tunis Carthage. Thus, change-points were visible for at least 50% of the months in the locations mentioned.
Charge-points have been noted in the mean annual time series at Bilma, Biskra, 31 Fasher, Kom El Nadura, Tamanrasset, and Tunis Carthage.
Unfortunately, it has not been possible to discern any general regularity in the tmes of the change-points.
PRECIPITATION
The hypothesis about independence (Tab. 2) has been rejected from between 0% of cases in January, May and November to 90% in July and August; and on average in 24.2% of cases for all months together. For annual data, the hyp<thesis has been rejected in 20% of cases.
http://rcin.org.pl

58 A. A. Ali
For the time series that are independent according to the runs test, the hypothesis about the stationarity and ergodicity of the mean value has been rejected by the Mann-Kendall test (Tab. 3.2) from between no cases in May, August and December to 6 cases in October and November, i.e., from between 0% and 60% of considered cases and on average in 2.4 cases (24.2%) for all months together. For the annual values, the hypothesis has been rejected in 1 case (10%).
Table 3.2. Results of the Mann-Kendall test for the mean value and the variance for precipitation — according to the runs test
Month No dependence Dependence Month Mean Variance Mean Variance
January 2/ 20.0 V 12.5 0/ 0.0 0/ 0.0 February 2/ 20.0 0/ 0.0 2/ 20.0 0/ 0.0 March 1/ 10.0 2/ 25.0 0/ 0.0 0/ 0.0 April 4/ 40.0 0/ 0.0 0/ 0.0 0/ 0.0 May 0/ 0.0 3/ 30.0 0/ 0.0 0/ 0.0 June 4/ 40.0 0/ 0.0 y 10.0 0/ 0.0 July 1/ 10.0 0/ 0.0 y 10.0 0/ 0.0 August 0/ 0.0 0/ 0.0 0/ 0.0 0/ 0.0 September 3/ 30.0 0/ 0.0 0/ 0.0 4/ 44.4 October 6/ 60.0 0/ 0.0 0/ 0.0 0/ 0.0 November 6/ 60.0 0/ 0.0 0/ 0.0 0/ 0.0 December 0/ 0.0 y 12.5 0/ 0.0 0/ 0.0 Year 1/ 10.0 y 4.3 0/ 0.0 0/ 0.0
However, for the dependent time series according to the runs test (Tab. 3.2), the hypothesis about the homogeneity of the mean value has been rejected by the Mann-Kendall test from between no cases (0%) in January, March, April, May, August, September, October, November and December to 2 cases (20%) in February; on average 0.3 cases (3.3%) have been rejected. For the annual values, the hypothesis has not been rejected.
Considering the results in Tab. 3.2 altogether, i.e., independently of the results of the runs test, the hypothesis about the homogeneity of the mean value has been rejected by the test Mann-Kendall from between no cases (0%) in May, August and December to 6 cases (60%) in October and November; and on average in 3.3 cases (33%). For all annual values, the hypothesis has been rejected in 1 case (10%).
It appears that the hypothesis about the homogeneity of the variance has been rejected: (i) from between no case in February, April, June, July, August, September, October and November, to 3 cases in May for the independent time series according to the runs test; and on average in 0.6 cases, or (ii) from between no case in January, February, March, April, May, June, July, August, October, November and December to 4 cases in September for the dependent time series according to the runs test; and on average in 0.3 cases. For annual values, the hypothesis about the homogeneity of the
http://rcin.org.pl
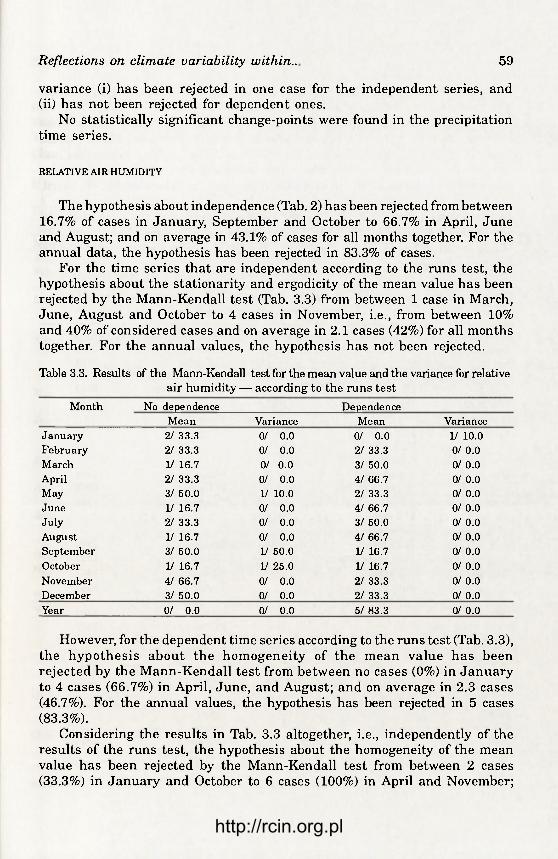
Reflections on climate variability within.. 59
variance (i) has been rejected in one case for the independent series, and (ii) has not been rejected for dependent ones.
No statistically significant change-points were found in the precipitation time series.
RELATIVE AIR HUMIDITY
The hypothesis about independence (Tab. 2) has been rejected from between 16.7% of cases in January, September and October to 66.7% in April, June and August; and on average in 43.1% of cases for all months together. For the annual data, the hypothesis has been rejected in 83.3% of cases.
For the time series that are independent according to the runs test, the hypothesis about the stationarity and ergodicity of the mean value has been rejected by the Mann-Kendall test (Tab. 3.3) from between 1 case in March, June, August and October to 4 cases in November, i.e., from between 10% and 40% of considered cases and on average in 2.1 cases (42%) for all months together. For the annual values, the hypothesis has not been rejected.
Table 3.3. Results of the Mann-Kendall test for the mean value and the variance for relative air humidity — according to the runs test
Month No dependence Dependence Mean Variance Mean Variance
January 2/ 33.3 0/ 0.0 0/ 0.0 y 10.0 February 2/ 33.3 0/ 0.0 2/ 33.3 0/ 0.0 March V 16.7 0/ 0.0 3/ 50.0 0/ 0.0 April 2/ 33.3 0/ 0.0 4/ 66.7 0/ 0.0 May 3/ 50.0 y 10.0 2/ 33.3 0/ 0.0 June 1/ 16.7 0/ 0.0 4/ 66.7 0/ 0.0 July 2/ 33.3 0/ 0.0 3/ 50.0 0/ 0.0 August 1/ 16.7 0/ 0.0 4/ 66.7 0/ 0.0 September 3/ 50.0 y 50.0 y 16.7 0/ 0.0 October V 16.7 y 25.0 y 16.7 0/ 0.0 November 4/ 66.7 0/ 0.0 2/ 33.3 0/ 0.0 December 3/ 50.0 0/ 0.0 2/ 33.3 0/ 0.0 Year 0/ 0.0 0/ 0.0 5/ 83.3 0/ 0.0
However, for the dependent time series according to the runs test (Tab. 3.3), the hypothesis about the homogeneity of the mean value has been rejected by the Mann-Kendall test from between no cases (0%) in January to 4 cases (66.7%) in April, June, and August; and on average in 2.3 cases (46.7%). For the annual values, the hypothesis has been rejected in 5 cases (83.3%).
Considering the results in Tab. 3.3 altogether, i.e., independently of the results of the runs test, the hypothesis about the homogeneity of the mean value has been rejected by the Mann-Kendall test from between 2 cases (33.3%) in January and October to 6 cases (100%) in April and November;
http://rcin.org.pl
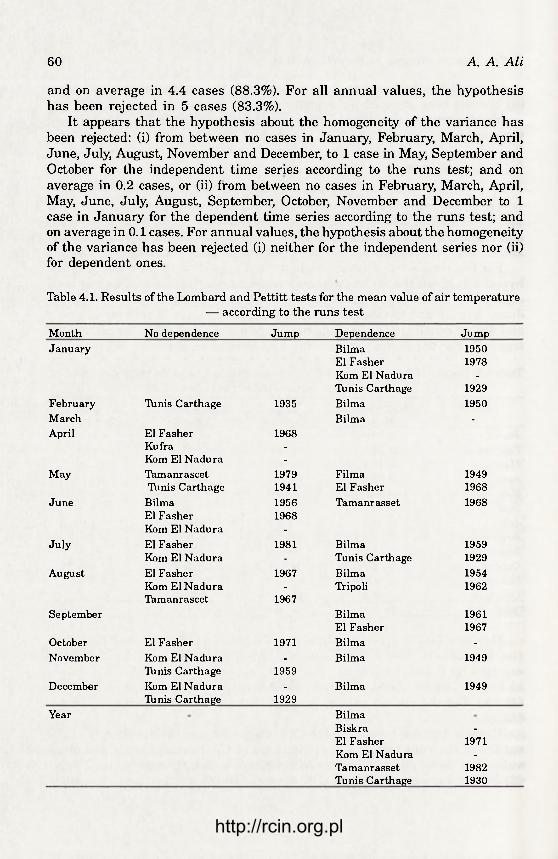
60 A. A. Ali
and on average in 4.4 cases (88.3%). For all annual values, the hypothesis has been rejected in 5 cases (83.3%).
It appears that the hypothesis about the homogeneity of the variance has been rejected: (i) from between no cases in Januaiy, February, March, April, June, July, August, November and December, to 1 case in May, September and October for the independent time series according to the runs test; and on average in 0.2 cases, or (ii) from between no cases in February, March, April, May, June, July, August, September, October, November and December to 1 case in January for the dependent time series according to the runs test; and on average in 0.1 cases. For annual values, the hypothesis about the homogeneity of the variance has been rejected (i) neither for the independent series nor (ii) for dependent ones.
Table 4.1. Results of the Lombard and Pettitt tests for the mean value of air temperature — according to the runs test
Month No dependence Jump Dependence Jump January Bilma 1950
El Fasher 1978 Kom El Nadura -
Tunis Carthage 1929 February TAinis Carthage 1935 Bilma 1950 March Bilma -
April El Fasher 1968 Kufra -
Kom El Nadura -
May Tamanrascet 1979 Filma 1949 Tunis Carthage 1941 El Fasher 1968
June Bilma 1956 Tamanrasset 1968 El Fasher 1968 Kom El Nadura -
July El Fasher 1981 Bilma 1959 Kom El Nadura - Tunis Carthage 1929
August El Fasher 1967 Bilma 1954 Kom El Nadura - Tripoli 1962 Tamanrascet 1967
September Bilma 1961 El Fasher 1967
October El Fasher 1971 Bilma -
November Kom El Nadura - Bilma 1949 Ibnis Carthage 1959
December Kom El Nadura - Bilma 1949 Tunis Carthage 1929
Year Bilma Biskra -
El Fasher 1971 Kom El Nadura -
Tamanrasset 1982 Tunis Carthage 1930
http://rcin.org.pl

Reflections on climate variability within.. 61
It appears that statistically-significant change-points are more frequent in the mean relative air humidity time series that is dependent according to the runs test (Tab. 4.1.). Altogether, change-points have been noted for 10 months in Tripoli, 8 months in Hon and Nalut, and 6 months in Benina. Thus, change-points are visible for at least 50% of months in the locations mentioned.
Change-points have been noted in the mean annual time series at Benina, Hon, Nalut, and Tripoli.
Table 4.2. Results of the Lombard and Petti tt tets for the mean value of relative air humidity — according to the runs test
Month No dependence Jump Dependence Jump January February
March
April
May
June
July
August
September
October November
December
Nalut
Tripoli
Hon Tripoli Hon
Tripoli
Hon Nalut Benina Benina Nalut Benina Nalut
1979
1958 1978 1955
1954
1979 1980
Hon Tripoli Hon Nalut Benina Hon Nalut Benina Tripoli
Nalut Benina Tripoli Hon Nalut Hon Tripoli Tripoli
Jalo Tripoli Tripoli
1961 1979 1957
1957 1960
1962 1978
1956 1978 1955 1961 1955 1962 1958
1977 1978
Year Hon Nalut Benina Tripoli
Unfortunately, it has been not possible to discern any general regularity in the times of the change-points.
CONCLUSION
The climate characterized by the investigated processes of monthly and annual mean values must definitely be considered unstable.
http://rcin.org.pl
62 A. A. Ali
ACKNOWLEDGMENT
The author would like to thank Dr ing. Henryk T. Mitosek for his helpful comments, for suggestion of the methodology assumed, reading the manuscript for critically, and also for improving and editing the text.
REFERENCES
Analyzing long time series of hydrological data with respect to climate variability, Project description, 1988, WCAP Report 3, WMO/TD 224, WMO.
Fisz M., 1963, Probability Theory and Mathematical Statistics, John Wiley & Sons, Inc., New York. Lombard F., 1988, Detecting change points by Fourier analysis, Technometrics 30, 3. Mann H. B., 1945, Nonparametric tests against trend, Econometrica 13. Mitosek H. T., 1984, Stochastyczna struktura przepływu rzecznego, (Stochastic Structure
of Discharge), Wyd. Geologiczne, Warszawa. Mitosek H. T., 1992, Occurence of climate variability and change within the hydrological time series.
A statistical approach, IIASA, CP-92-05. Mitosek H. T., 1995, Reflection of climate variability within the monthly mean time series
of temperature in high montains — A statistical approach, Acta Geophysica Polonica, (accepted for publication).
Pettitt A. N., 1979, A non-parametric approach to the change-point problem, Appl. Statist. 28, 2. Sneyers R., 1975, Sur l'analyse statistique des séries d'observations, Note Technique 143, OMM
415, Genève. Vannitsem S., Demareé G., 1991, Détection et modélisation des sécheresse au Sahel, Hydrol,
continent. 6, 2.
http://rcin.org.pl

GEOGRAPHIA POLONICA 65, 1995
RECONSTRUCTING THE DEVELOPMENT OF HUMAN IMPACT FROM DIATOMS AND 210Pb SEDIMENT DATING
(THE GULF OF GDANSK — SOUTHERN BALTIC SEA)
ANDRZEJ WITKOWSKI
Institute of Oceanography, University of Gdańsk ul. Piłsudskiego 46, 81-378 Gdynia, Poland
JANUSZ PEMPKOWIAK
Institute of Oceanology, Polish Academy of Sciences ul. Powstańców Warszawy 55, 81-765 Sopot, Poland
ABSTRACT The subjects of the study were the diatoms occurring in subfossil sediments of the Gulf of Gdańsk. Analysis of changes in the diatom flora from 2 1 0Pb-dated sediment cores appeared to be an useful tool in reconstructing human impact on the environment of the Gulf of Gdańsk. The application of analysis of diatom coupled with other siliceous microalgae (Chrysophyceans and Ebridians) and sediment dating allowed for the determination of the progress of deterioration in environment of the Gulf of Gdańsk. It is shown that the change in the diatom flora of the study area coincides with industrialization inland and with the construction of the artificial mouth of the Wisla. The results obtained from the sedimentary record of the Gulf of Gdańsk are compared with those from other areas within the Baltic Sea.
KEY WORDS: Diatoms, Chrysophyceans, Ebridians, sedimentary record, 210Pb-dating, industrial pollution of the sea, eutrophication, Gulf of Gdańsk, Baltic Sea.
INTRODUCTION
It is estimated that environmental conditions characteristic for the Postlitorina were established in the Baltic Sea ca. 3000 years ago (Miller 1986, Eronen 1988, Hyvarinen et al. 1988). The species composition of the diatom flora indicates that environmental factors like salinity, water temperature and nutrient content remained relatively stable until ca. 200-150 years ago. From that time onwards, the diatom flora of the Baltic Sea has changed in accordance with a certain pattern. In general all of these changes are linked to the progressively increasing industrialization of inland and coastal areas and to a simultaneous increase in the inflow of waste water.
http://rcin.org.pl

64 A. Witkowski, J. Pempkowiak
These have caused the degradation of the milieu of the Baltic Sea. At present some areas of the Baltic (and the Gulf of Gdańsk in particular) have reached a state which can be defined as an environmental disaster.
Sensitivity to environmental changes makes diatoms the best „fingerprint" of human impact on the environment (e.g. Schoeman, Haworth 1984, Anderson, Vos 1992). The abundant occurrence of diatoms in the sedimentary record makes them useful in tracing the deterioration of the waters of the Baltic Sea. Until quite recently (Risberg 1990, Sakson, Miller 1993, Witkowski 1994) little information was available on diatoms as indicators of human impact in the Baltic. The extent of changes depends on the locality with areas influenced by large loads of wastes displaying drastic changes in the diatom flora. In these areas sensitive diatom taxa are completely replaced while resistant ones are observed to develop en masse.
The last 200 years has seen the Gulf of Gdańsk incorporate drastically increasing loads of sewage and nutrients (see Pliński 1990, Cyberska 1992 and Rybiński et al. 1992). Specific changes in the diatom flora have been brought about by the deterioration of the environment, and by eutrophication in particular, and an autochthonous flora has been replaced by resistant taxa which have developed into an anthropogenic assemblage (Witkowski 1994, Stachura 1994). Studies of the diatom flora in sediment cores dated using 210Pb have allowed for the determination of the spatial extent of the sediment containing the diatom flora influenced by human impact and also of the approximate age of this event (Witkowski et al. 1992, Witkowski 1994). Similar studies from less polluted waters in: the northern part of the Gotland Basin (see Risberg 1990), the southern part of the Gotland Deep and the southern part of the Bornholm Basin have revealed differences in the species composition of the diatom flora. The results obtained show that the extent of the degradation process is less beyond the Gdańsk Basin. The stage of floral development observed in the Bornholm Basin, was recorded a few decades earlier in the Gulf of Gdańsk (Pempkowiak, Szczepańska, Uscinowicz, Witkowski and Zachowicz unpublished).
MATERIAL AND METHODS
The subjects of the study were siliceous microfossils, mainly diatoms occurring in the recent and subfossil sediments of the Gulf of Gdańsk. Cores of stratified bottom sediments were taken using a „Niemisto" type sampler. The location of the cores is given in Fig. 1. Immediately after collection, the cores were cut into 1 cm-thick slices and kept deep-frozen until analyses were performed in the laboratory. The following analyses were carried out: determination of moisture (at 105°C), activity of 210Pb (assuming isotopic equilibrium with 210Pb, after HC104— HF wet digestion, deposition on silver discs and a-spectrometry of the deposited 210Pb) and activity of 137Cs Cy-spectrometry).
http://rcin.org.pl

Reconstructing the development of human.. 65
18 .4 18 .6 18.8 19.0 19.2 19.4 19.6 19 .8 2 0 . 0
Fig. 1. Location of the cores in Gdańsk Bay
From each 1 cm-thick subsample preparations of permanent slides were made for diatom analyses. All the slides were studied quantitatively and qualitatively. Samples were treated (by gentle heating) with 30% hydrogen peroxide to remove the organic matter. The average weight of the sediment samples taken for analysis was ca. 1-2 g. After treatment with hydrogen peroxide, the samples were washed several times with distilled water. The permanent diatom slides were mounted in Naphrax. Taxonomic diatom analyses were performed using a Biolar PI (from the Polish Optical Works) with an oil-immersion 100 x objective, 300 to 500 valves were counted in each sample. The identification of diatoms was in principle based upon Krammer & Lange-Bertalot (1986, 1988, 1991a and 1991b).
RESULTS
The species composition of the subfossil diatom flora was studied in 5 short cores, but the present study only gives results for two cores (Nos. 4 and 22). Part of the study (i.e. the results of the diatom analyses) has already been published by Witkowski (1994).
http://rcin.org.pl

Fig. 2. Distribution of siliceous microfossils in core No. 4 http://rcin.org.pl
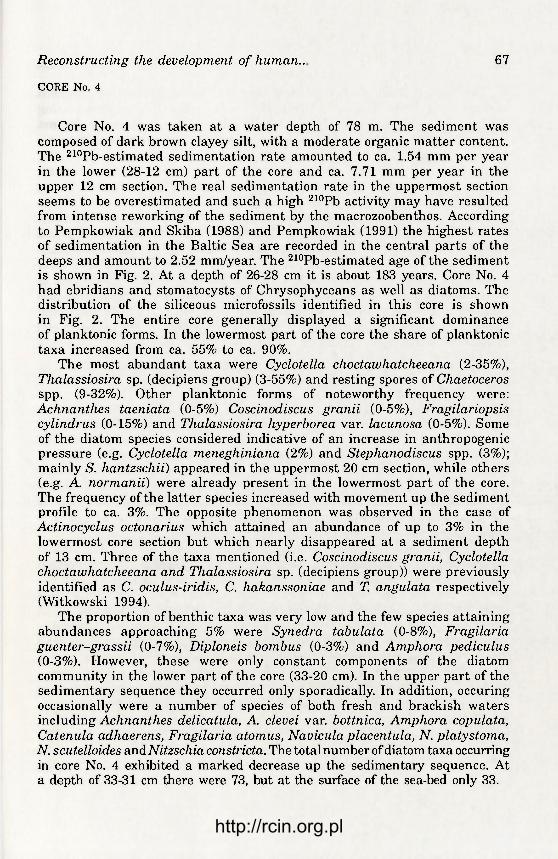
Reconstructing the development of human.. 67
CORE No. 4
Core No. 4 was taken at a water depth of 78 m. The sediment was composed of dark brown clayey silt, with a moderate organic matter content. The 210Pb-estimated sedimentation rate amounted to ca. 1.54 mm per year in the lower (28-12 cm) part of the core and ca. 7.71 mm per year in the upper 12 cm section. The real sedimentation rate in the uppermost section seems to be overestimated and such a high 210Pb activity may have resulted from intense reworking of the sediment by the macrozoobenthos. According to Pempkowiak and Skiba (1988) and Pempkowiak (1991) the highest rates of sedimentation in the Baltic Sea are recorded in the central parts of the deeps and amount to 2.52 mm/year. The 210Pb-estimated age of the sediment is shown in Fig. 2. At a depth of 26-28 cm it is about 183 years. Core No. 4 had ebridians and stomatocysts of Chrysophyceans as well as diatoms. The distribution of the siliceous microfossils identified in this core is shown in Fig. 2. The entire core generally displayed a significant dominance of planktonic forms. In the lowermost part of the core the share of planktonic taxa increased from ca. 55% to ca. 90%.
The most abundant taxa were Cyclotella clioctawhatcheeana (2-35%), Thalassiosira sp. (decipiens group) (3-55%) and resting spores of Cliaetoceros spp. (9-32%). Other planktonic forms of noteworthy frequency were:
Achnanthes taeniata (0-5%) Coscinodiscus granii (0-5%), Fragilariopsis cylindrus (0-15%) and Thalassiosira hyperborea var. lacunosa (0-5%). Some of the diatom species considered indicative of an increase in anthropogenic pressure (e.g. Cyclotella meneghiniana (2%) and Stephanodiscus spp. (3%); mainly S. hantzschii) appeared in the uppermost 20 cm section, while others (e.g. A. normanii) were already present in the lowermost part of the core. The frequency of the latter species increased with movement up the sediment profile to ca. 3%. The opposite phenomenon was observed in the case of Actinocyclus octonarius which attained an abundance of up to 3% in the lowermost core section but which nearly disappeared at a sediment depth of 13 cm. Three of the taxa mentioned (i.e. Coscinodiscus granii, Cyclotella clioctawhatcheeana and Thalassiosira sp. (decipiens group)) were previously identified as C. oculus-iridis, C. hakanssoniae and T. angulata respectively (Witkowski 1994).
The proportion of benthic taxa was very low and the few species attaining abundances approaching 5% were Synedra tabulata (0-8%), Fragilaria
guenter-grassii (0-7%), Diploneis bombus (0-3%) and Amphora pediculus (0-3%). However, these were only constant components of the diatom community in the lower part of the core (33-20 cm). In the upper part of the sedimentary sequence they occurred only sporadically. In addition, occuring occasionally were a number of species of both fresh and brackish waters including Achnanthes delicatula, A. cleuei var. bottnica, Amphora copulata, Catenula adhaerens, Fragilaria atomus, Navícula placentula, N . platystoma, N. scutelloides and Nitzschia constricta. The total number of diatom taxa occurring in core No. 4 exhibited a marked decrease up the sedimentary sequence. At a depth of 33-31 cm there were 73, but at the surface of the sea-bed only 33.
http://rcin.org.pl

68 A. Witkowski, J. Pempkowiak
The most characteristic feature of core No. 4 was the vertical gradient of dominating taxa. Most abundant in the lower part of the core were resting spores of Cliaetoceros spp. However, their abundance displayed a distinct decrease further up the core — to the points where they constituted 32% at a sediment depth of 30 cm — but only 10% at 15 cm. On the other hand, the proportions of Cyclotela choctawhatcheeana, C. caspia and Thalassiosira sp. (decipiens group) showed an increase up the core with the lowest abundances recorded in the lowermost part and the highest close to the surface of the sea-bed. As shown in Fig. 2, the shift in the diatom flora occurred at a sediment depth of 20 cm as a result of some phenomenon which took place in the period between ca. 134 and 128 years ago (as estimated from 210Pb measurements).
The distribution of ebridians is equal throughout the core and their abundance varies from 0.5 to 2.0%. The abundance of the stomatocysts of C/uysophyceae is more variable and shows a distinct decrease up the sedimentary sequence. There is relative stability (from 27.5% to 18.6%) in the lower part of the core (33-16 cm) and then a decrease from 10.4% (at 14-15 cm) to 2.5% (at 1-2 cm; cf. Fig. 2).
CORE No. 22
Core No. 22 was taken close to Krynica Morska at a water depth of 38 m (Fig. 1). The short distance from the shoreline ensured that the silty sediments contained a significant admixture of sand particles. The core was only 15 cm long and the 210Pb-estimated sedimentation rate amounted to ca. 0.91 mm per year in the uppermost 8.5-cm section. The sedimentation rate in the lowermost part of the core was not determined. The 210Pb-measured age of the sediment is illustrated in Fig. 3. At a sediment depth of 8.5 cm it is about 93 years.
As with core No. 4, the distribution of the main components of the diatom flora varied down the sedimentary sequence of core 22 (Fig. 3). The proportion of planktonic forms varied from 49% in the lowermost part to 87% at the surface. The decrease in the number of taxa identified was less pronounced than in core No. 4 with a change from 60 at a depth of 13 cm to 37 at a depth of 2 cm. While the quantity of diatom valves in this core is considerably smaller than in core No. 4, the changes in the abundance of dominant taxa were, even more pronounced. The highest frequencies of the resting spores of Cliaetoceros spp. (at 27-39%) were noted at 15-9 cm, but this figure began to decrease from 8 cm upwards and fell as low as 6% at the sediment surface. The abundances of Cyclotella choctawhatcheeana and Thalassiosira sp. (decipiens group) were nearly constant at sediment depths of 9-15 cm varying as they did between 1 and 5%. They then increased up the remainder of the sediment profile to attain 24% and 18% at the bottom surface in the cases of C. choctawhatcheeana and Thalassiosira sp. (decipiens group) respectively.
http://rcin.org.pl

Reconstructing the development of human.. 69
210Pb Dates (years)
http://rcin.org.pl

70 A. Witkowski, J. Pempkowiak
The core studied was located in the area influenced strongly by run-off from the Wisla, and this influence is clearly reflected in the increasing proportions of Actinocyclus normanii, Cyclotella menegliiniana and Stephanodiscus spp. (S. hantzschii and S. neoastraea) in the diatom assemblage. The proportion of C. menegliiniana at 15-9 cm amounted to 2%, although it was sometimes absent, but the figures for the species were 10-20%. in the uppermost layer. Similar changes were noted for Stephanodiscus spp. although a distinct rise in their frequency was noted at 5 cm. The distribution of S. hantzschii and S. neoastraea showed an interesting phenomenon: the abundance of S. neoastraea was equal throughout the entire core and amounted to 1-2%, while that of S. hantzschii was zero or neglible in the lowermost part of the core but significantly greater (at up to 8.7%) in the layers at or above 5 cm.
An opposite tendency in the vertical distribution was shown by both allochthonous taxa like Aulacoseira spp. and autochthonous ones like
Actinocyclus octonarius, Diploneis bombus and Synedra tabulata. These were frequent in the lower section of the core and rare to absent in the uppermost layer. It seems that the decrease of Aulacoseira spp. was part of the response of the Wisla river diatom community to the increasing load of pollutants. The decreased representation of the other taxa resulted from a deterioration in water quality in the Gulf. A similar phenomenon was also observed in the case of allochthonous Fragilaria spp., which were relatively frequent in the lowermost part of the core and very rare in the uppermost part.
The shortness of cores of the subfossil flora taken for analysis, made it neccessary for supplementary studies to be carried out. The subjects of these studies were several cores, 52 to 100 cm long, which were divided into 5 cm sections. The lowermost parts of the cores had fine grained silty sand, while the remaining parts consisted of a silt with a clay and sand admixture. This lithological change was easily detectable and occurred at a sediment depth of ca. 50 cm (Witkowski 1994).
The lowermost sandy parts of cores had floras with large numbers of taxa (to 70). Amongst these the most abundant were marine planktonic species e.g. Actinocyclus octonarius and Rhizosolenia calcar-avis, as well as resting spores of Chaetoceros spp. and of C. paulsenii. However, with respect to the number of species, there was a predominance of benthic marine and brackish-water species. The most frequent of these were Catenula adhaerens, Diploneis bombus, D. litoralis, D. stroemii, Fragilariaguenter-grassii, Synedra tabulata and Nitzscliia constricta. There were also numerous taxa, which have not been recorded in the recent diatom flora of the eastern Gulf area, including Achnanthes linkei, Cocconeis stauroneiformis, Gomphonema obscurum, Grammatophora marina, Hyalodiscus scoticus, Nauicula digitora-diata, N . plicata, Nitzscliia levidensis, N. littoralis, and N. tryblionella. The flora was well-preserved and whole specimens were more frequent than
http://rcin.org.pl
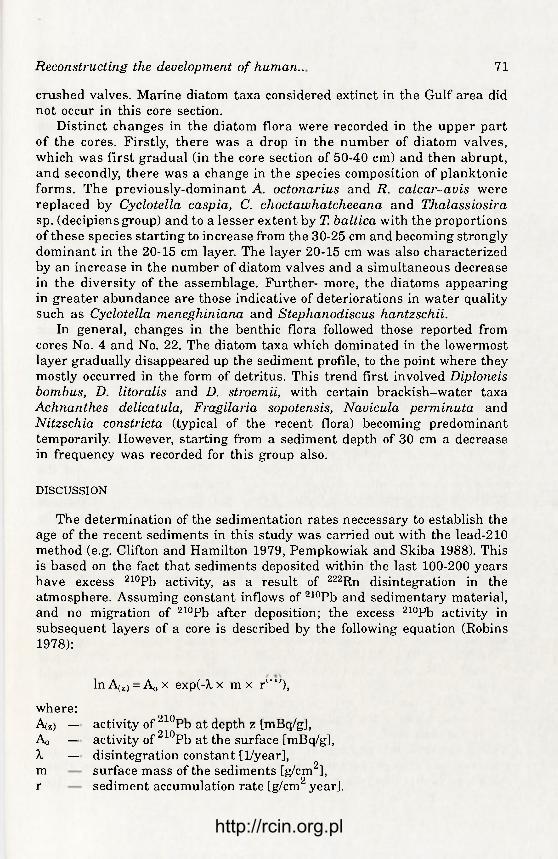
Reconstructing the development of human.. 71
crushed valves. Marine diatom taxa considered extinct in the Gulf area did not occur in this core section.
Distinct changes in the diatom flora were recorded in the upper part of the cores. Firstly, there was a drop in the number of diatom valves, which was first gradual (in the core section of 50-40 cm) and then abrupt, and secondly, there was a change in the species composition of planktonic forms. The previously-dominant A. octonarius and R. calcar-avis were replaced by Cyclotella caspia, C. choctawhatcheeana and Thalassiosira sp. (decipiens group) and to a lesser extent by T. baltica with the proportions of these species starting to increase from the 30-25 cm and becoming strongly dominant in the 20-15 cm layer. The layer 20-15 cm was also characterized by an increase in the number of diatom valves and a simultaneous decrease in the diversity of the assemblage. Further- more, the diatoms appearing in greater abundance are those indicative of deteriorations in water quality such as Cyclotella meneghiniana and Stephanodiscus hantzschii.
In general, changes in the benthic flora followed those reported from cores No. 4 and No. 22. The diatom taxa which dominated in the lowermost layer gradually disappeared up the sediment profile, to the point where they mostly occurred in the form of detritus. This trend first involved Diploneis bombus, D. litoralis and D. stroemii, with certain brackish-water taxa Achnanthes delicatula, Fragilaria sopotensis, Navicula perminuta and Nitzschia constricta (typical of the recent flora) becoming predominant temporarily. However, starting from a sediment depth of 30 cm a decrease in frequency was recorded for this group also.
DISCUSSION
The determination of the sedimentation rates neccessary to establish the age of the recent sediments in this study was carried out with the lead-210 method (e.g. Clifton and Hamilton 1979, Pempkowiak and Skiba 1988). This is based on the fact that sediments deposited within the last 100-200 years have excess 210Pb activity, as a result of 222Rn disintegration in the atmosphere. Assuming constant inflows of 210Pb and sedimentary material, and no migration of 210Pb after deposition; the excess 210Pb activity in subsequent layers of a core is described by the following equation (Robins 1978):
In A(Z) = AQX exp(-X x m x r ), where: A(Z) -A« -X -
activity of" Pb at depth z [mBq/g], activity of 210Pb at the surface [mBq/g], disintegration constant [1/year], surface mass of the sediments [g/cm2], sediment accumulation rate [g/cm2 year].
210
m r
http://rcin.org.pl

72 A. Witkowski, J. Pempkowiak
In cases where sediments are mixed by physical or biological factors to depth s, the activity of 210Pb in the mixing zone (z < s) can be described, in relation to depth, by the following equations (Robins 1978):
z < s A<Z) = Ai x expPx x m + exp{32 x m
Pi = ( r + x r 2 + 4 KB) x (2KB)'1
z > s A<z) = Az=s x exp(-^. x m x r"1)
where: Q KB — mixing coefficient [cm /year] AI, A2 — coefficients dependent on KB and r [mBq/g] AZ=S — activity of 210Pb at the mixing boundary
In practice, mixing of sediments is recognized by peculiar profiles of 210Pb activity, by supporting evidence (e.g. the activity of artificial radionuclides: frequently 134Cs and 137Cs), and by the presence of biota or specific organic substances (see DeMaster et al. 1985, Robins 1978, Pempkowiak and Skiba 1988). Mixing of surface sediments was detected at 2 and 12 cm in cores 22 and 4 respectively, and this confirms earlier findings suggesting extensive mixing of sediments in the Baltic Sea (Pempkowiak 1991).
In the Baltic Sea the boundary between the Litorina and the Postlitorina is marked by a change in the diatom flora. Decrease in salinity lead to an observable retreat of some marine elements and this process is well registered in the diatom assemblage of the off-shore area. Particularly through the disappearance of Thalassionema nitzschioides, Chaetoceros mitra and the silicoflagellate Distephanus speculum (e.g. Thulin et al. 1992, Witkowski 1994). Generally the drop in salinity caused a decrease in the abundance of marine taxa and an increase in those of the brackish-water flora. The latter tendency mostly concerned planktonie forms i.e.Actinocyclus octonarius, Rhizosolenia calcar-avis and resting spores of Chaetoceros spp.
Substantial environmental changes resulted from the industrialization and agricultural development of coastal areas and the catchments of rivers entering the Baltic Sea. As a result, water quality deteriorated in those parts of the Baltic Sea most affected by human impact and the Gulf of Gdańsk in particular was subject to a steadily increasing load of nutrients and pollutants which caused increasing eutrophication (Cyberska, Trzosińska 1984, Pliński 1990, Ringer 1990, Rybiński 1992). According to Pliński and Florczyk (1984) and Pliński (1990), the deterioration in water quality brought about:
— a decrease in the vertical extent of the euphotic zone, — a decrease in the depth of occurrence of macrophytes, — the retreat of some species of macrophyte e.g. Fucus uesiculosus. It
is widely accepted that diatoms are among the best indicators of human-induced environmental changes because the presence of a siliceous exoskeleton allows them to be incorporated easily into sediments. Examination of the diatom flora
http://rcin.org.pl

Reconstructing the development of human.. 73
in the sedimentary record therefore allows the progress of degradation processes to be reconstructed. Comparison of recent and subfossil diatom assemblages enables the extent of environmental changes to be determined, (Anderson, Vos 1992, Witkowski 1994).
Increased industrialization in the second half of the XlXth century caused a distinct rise in the amount of sewage entering the Gulf of Gdańsk via the Wisła. Until the end of that century all floral changes under increasing anthropogenic pressure were stepwise, with analysis of subfossil sediments indicating a first response from the diatom community in the from of a gradual decrease in the number of taxa and individuals and a gradual decline in the proportion of sensitive taxa such as Chaetoceros spp. and autochthonous benthic forms. Simultaneously, the deterioration in water quality mainly through increased nutrient content, stimulated the development of centric taxa i.e. Cyclotella caspia, C. choctawhatcheeana and Thalassiosira sp. (decipiens group). The beginning of the present century saw a distinct acceleration in the rate of the changes, with the apparent trigger being the damming of the natural mouth "Martwa Wisła" (Tote Weichsel) in 1895, and the construction of an artificial mouth which allowed the Wisła waters to enter the Gulf area directly. The hitherto-dominant Chaetoceros spp. resting spores retreated while C. caspia, C. choctawhatcheeana and Thalassiosira sp. (decipiens group) reached their maximum abundance.
Occurring subsequently were: 1) a distinct rise in the number of diatom valves, 2) a drop in the frequency of occurrence of benthic taxa, 3) a decrease in the diversity of the assemblage. These events are registered in the sediment profile at a depth of ca. 15-20 cm. The change in the diatom flora of the Gulf of Gdańsk was already
apparent in the material collected in the 1920s by Schulz (1926, 1928) and in the 1930s by Brockmann (1954). It is perhaps as a result of the generally better environmental status of the area at that time that these authors did not pay special attention to the problem. Schulz merely concluded that the proportion of freshwater flora in the Gulf area was distinct.
However, an analysis of the lowermost part of the subfossil sediments indicates that prior to the opening of the Wisła mouth there was a great similarity between the diatom floras of the eastern part of the Gulf and the inner and outer parts of Puck Bay. The species composition of diatoms at a sediment depth of ca. 60-40 cm is dominated by the marine forms Catenula adhaerens, Diploneis bombus, D. litoralis, D. stroemii and by Rhizosolenia calcar-avis, in association with a number of taxa absent from the extant flora of the eastern part of the gulf, including Fragilaria amicorum, Grammatophora marina, Hyalodiscus scoticus, Melosira lineata, Neosynedra
provincialis, Nitzscliia constricta, N. levidensis, N. tryblionella and Pinnularia quadratarea (Witkowski 1994).
Allochthonous taxa (including freshwater diatoms entering the Gulf with Wisła water) resemble autochthonous marine and brackish-water
http://rcin.org.pl
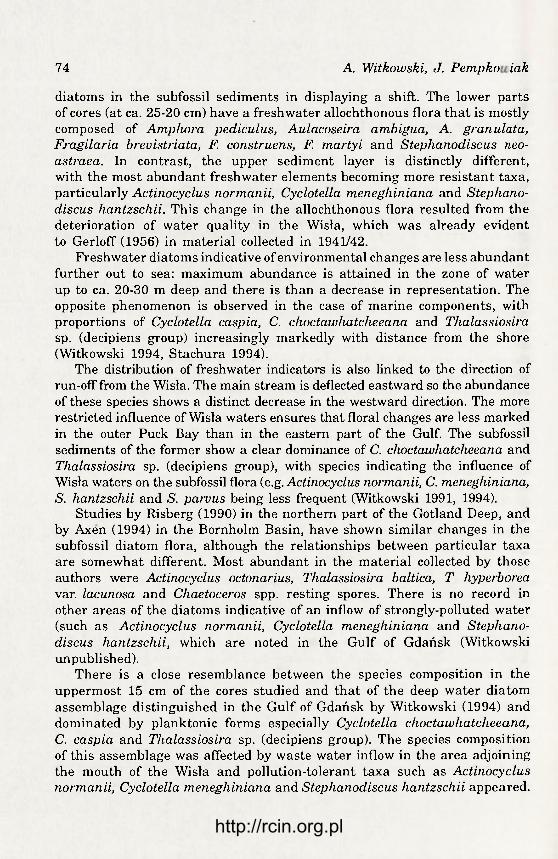
74 A. Witkowski, J. Pempkowiak
diatoms in the subfossil sediments in displaying a shift. The lower parts of cores (at ca. 25-20 cm) have a freshwater allochthonous flora that is mostly composed of Amphora pediculus, Aulacoseira ambigua, A. granulata, Fragilaria brevistriata, F. construens, F. martyi and Stephanodiscus neo-astraea. In contrast, the upper sediment layer is distinctly different, with the most abundant freshwater elements becoming more resistant taxa, particularly Actinocyclus normanii, Cyclotella meneghiniana and Stephano-discus hantzschii. This change in the allochthonous flora resulted from the deterioration of water quality in the Wisła, which was already evident to Gerloff (1956) in material collected in 1941/42.
Freshwater diatoms indicative of environmental changes are less abundant further out to sea: maximum abundance is attained in the zone of water up to ca. 20-30 m deep and there is than a decrease in representation. The opposite phenomenon is observed in the case of marine components, with proportions of Cyclotella caspia, C. choctawhatcheeana and Thalassiosira sp. (decipiens group) increasingly markedly with distance from the shore (Witkowski 1994, Stachura 1994).
The distribution of freshwater indicators is also linked to the direction of run-off from the Wisła. The main stream is deflected eastward so the abundance of these species shows a distinct decrease in the westward direction. The more restricted influence of Wisła waters ensures that floral changes are less marked in the outer Puck Bay than in the eastern part of the Gulf. The subfossil sediments of the former show a clear dominance of C. choctawhatcheeana and Thalassiosira sp. (decipiens group), with species indicating the influence of Wisła waters on the subfossil flora (e.g. Actinocyclus normanii, C. meneghiniana, S. hantzschii and S. parvus being less frequent (Witkowski 1991, 1994).
Studies by Risberg (1990) in the northern part of the Gotland Deep, and by Axen (1994) in the Bornholm Basin, have shown similar changes in the subfossil diatom flora, although the relationships between particular taxa are somewhat different. Most abundant in the material collected by those authors were Actinocyclus octonarius, Thalassiosira baltica, T. hyperborea var. lacunosa and Chaetoceros spp. resting spores. There is no record in other areas of the diatoms indicative of an inflow of strongly-polluted water (such as Actinocyclus normanii, Cyclotella meneghiniana and Stephano-discus hantzschii, which are noted in the Gulf of Gdańsk (Witkowski unpublished).
There is a close resemblance between the species composition in the uppermost 15 cm of the cores studied and that of the deep water diatom assemblage distinguished in the Gulf of Gdańsk by Witkowski (1994) and dominated by planktonie forms especially Cyclotella choctawhatcheeana, C. caspia and Thalassiosira sp. (decipiens group). The species composition of this assemblage was affected by waste water inflow in the area adjoining the mouth of the Wisła and pollution-tolerant taxa such as Actinocyclus normanii, Cyclotella meneghiniana and Stephanodiscus hantzschii appeared.
http://rcin.org.pl

Reconstructing the development of human.. 75
Apart from in the easternmost part of the study area, the proportion of these species decreased abruptly in a seaward direction. This is apparently the result of the strong eastward deflection of the main stream of the Wisła. As has been shown by Stachura (1994) and Witkowski (op. cit.), the Wisła transect and the area east of its mouth are dominated by freshwater taxa out to a water depth of ca. 30 m.
A characteristic feature of the recent flora is the very intense anthropogenic influence in the eastern part of the Gulf area. These effects are directly related to the increasing load of industrial and municipal wastewater entering the Gulf of Gdańsk. Allochthonous (freshwater) taxa were transported to the Gulf by the Wisła, the largest source of pollutants, and the most-affected eastern part of the Gulf area has an anthropogenic diatom assemblage dominated by Stephanodiscus hantzscliii, Cyclotella meneghiniana and Actinocyclus normanii. It seems that S. hantzscliii and A. normanii only originate from the runoff of the Wisła, while C. meneghiniana is a halophilous species which has been able to inhabit the Wisła and Gulf area (Witkowski 1994, Stachura 1994).
It has been shown by Stachura (1994) that the anthropogenic assemblage of the eastern part of the Gulf has a species composition that is relatively stable and only subject to minor quantitative changes. Therefore the only method of restoring the native flora would be to bring about a major decrease in the amount of wastes entering the Gulf of Gdańsk.
It is not only the diatom flora which has reacted to the deterioration in water quality. It is well known that other siliceous algae are also sensitive to the increasing anthropogenic load. Included in this group are the ebridian Ebria tripartita and Chrysophyceae (represented by stomatocysts in the sedimentary record). The development of E. tripartita is stimulated by the increasing anthropogenic load, and the species is therefore considered an indicator of eutrophic conditions in the Baltic Sea (e.g. Risberg 1990). Chrysophyceans display the opposite reaction to the increasing human impact. As is shown in Fig. 2 (core No. 4), the abundance of stomatocysts coincides well with the change in the diatom flora, and there is a distinct drop in their frequency of occurrence following the retreat of sensitive diatom taxa in particular Chaetoceros spp. at a sediment depth ca. 15 cm.
The proportion of resistant species is lower in the western part of the Gulf proper and in the outer part of Puck Bay, and shows a general decline in a westward direction. These species also occur at lower depths in the sediment of the outer Puck Bay than in that of the gulf proper. This may mean that changes in the diatom flora are not so pronounced there as they are in the eastern part of the Gulf. However, without a significant reduction in the amount of sewage entering the Gulf of Gdańsk, it is probable that the response of the diatom flora will be similar to that noted in the eastern part of the study area.
http://rcin.org.pl

76
CONCLUSIONS
A. Witkowski, J. Pempkowiak
Changes in the species composition of the diatom flora occurring in the subfossil sediments allow to trace an influence of the human impact onto the environment of the Gulf of Gdańsk. 210Pb mesurements indicate that anthropogenically mediated shift in the diatom flora started in the gulf area ca. 120 years ago and was accelerated by opening of the artificial mouth of the Wisła in 1895. The diatom flora of the Gulf of Gdańsk responded to the increasing load of pollutants and nutrients in following stages:
— retreat of sensitive taxa, — decrease in number of specimens and in the diversity of the benthic taxa, — increase in abundance of resistant marine planktonie taxa (Cyclotella
caspia, C. choctawhatcheeana and Thalassiosira sp. (decipiens group), — decrease in abundance of marine sensitive taxa (mainly Chaetoceros spp.), — increase in freshwater pollution tolerant taxa (Actinocyclus normcinii,
Cyclotella meneghiniana and Steplianodiscus hantzschii).
ACKNOWLEDGEMENTS
The Authors wish to express their gratitude to Professor Horst Lange-Bertalot for supervising a research stay at his Laboratory at the J.-W. Goethe University in Frankfurt a/Main (A. W.); and to Associate Professor Urve Miller for supervising a scholarship from the Swedish Institute (A. W.). The stay of Andrzej Witkowski at the J-W. Goethe University in Frankfurt a/Main was sponsored by DAAD (Deutscher Akademischer Austauschdienst). The Swedish Institute sponsored a research visit to the Department of Quaternary Geology at Stockholm University.
REFERENCES
Anderson N., J., Vos P., 1992, Learning from the past: Diatoms as paleoecological indicators of changes in marine environments, Netherlands Journal of Aquatic Ecology 26.
Axćn E., 1994, The composition of the diatom flora in two superficial sediment cores from the southern Baltic Sea, Abstracts of the 13th International Diatom Symposium, l-7th September 1994, Italy.
Brockmann C., 1954, Die Diatomeen in den Ablagerungen der ostpreussischen Haffe, Meyniana 3. Clifton R., Hamilton E., 1979, Lead-210 chronology in relation to levels of elements in dated
sediments core profiles, Estuar. Castal Mar. Sci. 8. Cyberska B., 1992, Thermohaline conditions (in:) Trzosińska A. (ed.), Marine Pollution 2. An
assessment of the effects of pollution in the Polish coastal area of the Baltic Sea 1984-1989, Oceanological Studies and Reviews 61.
Cyberska B., Trzosińska A., 1984, Environmental conditions in the Gulf of Gdańsk during 1974-1983, Proceedings of XIV Conference of Baltic Oceanographers.
DeMaster D., McKee B., Nittrouter C., Brewster D., Biscaye P., 1985, Rates of sediment reworking at the Hebble site based on measurements of Th-234, Cs-137 and Pb-210, Mar. Geol. 66.
Eronen M., 1988, A scrutiny of the Late Quaternaiy History of the Baltic Sea (in:) Winterhalter B. (ed.), The Baltic Sea, Geological Survey of Finland, Special Paper 6.
http://rcin.org.pl

Reconstructing the development of human.. 77
Gerloff J., 1958, Das Phytoplankton des Unterlaufes der Weichsel zwischen Plock und Danzig, Willdenowia 2.
Hyvärinen H., Donner J., Kessel H., Raukas A., 1988, The Litorina Sea and Limnea Sea in the Northern and Central Baltic (in:) Donner J., Raukas A. (eds), Problems of the Baltic Sea History, Ann. Acad. Sei. Fenn. Ser. A III Geologica- Geographica 148.
Krammer K., Lange-Bertalot H., 1986, Bacillariophyceae 1, Naviculaceae (in:) Ettl H., Gerloff J., Heynig H., Mollenhauer D. (eds), Süsswasserflora von Mitteleuropa 2, Fischer, Stuttgart.
Krammer K., Lange-Bertalot H., 1988, Bacillariophyceae 2, Epithemiaceae, Bacillariaceae, Surirellaceae (in:) Ettl H., Gerloff J., Heynig H., Mollenliauer D. (eds), Süsswasserflora von Mitteleuropa 2, Fischer, Stuttgart.
Krammer K., Lange-Bertalot H., 1991a, Bacillariophyceae 3, Centrales, Fragilariaceae, Eunotiaceae, (in:) Ettl H., Gerloff J., Heynig H., Mollenliauer D. (eds), Süsswasserflora von Mitteleuropa 2, Fischer, Stuttgart.
Krammer K., Lange-Bertalot H., 1991b, Bacillariophyceae 4, Achnanthaceae (in:) Ettl H., Gärtner G., Gerloff J., Heynig H, Mollenhauer D. (eds), Süsswasserflora von Mitteleuropa 2, Fischer, Stuttgart.
Miller U., 1986, Ecology and palaecology of brackish water diatoms with special reference to the Baltic basin (in:) Ricard M. (ed.): Proceedings of the 8th International Diatom Symposium, Otto Koeltz, Koenigstein.
Miller U., Robertsson A.-M., 1979, Biostratigraphical investigations in the Anundsjo region, Angermanland, northern Sweden, Early Norrland 12.
Miller U., Robertsson A.-M., 1981, Current biostratigraphical studies connected with archaeological excavations in the Stockholm region (in:) Konigsson L.-K, Paabo K. (eds), Florilegium Florinis Dedicatum, Striae 14.
Pempkowiak J., 1991, Enrichment factors of heavy metals in the Baltic sediments dated with 210Pb and 137Cs, Environ. Inter. 17.
Pempkowiak J., Skiba D., 1988, The determination of accumulation rates in the recent Baltic 910 1Q7 sediments on the basis of Pb and Cs profiles, (in:) Proceedings of the 16th Conference of Baltic Oceanographers, Inst. Marine Research Kiel University, 2.
Pliński M., 1979, Kierunki zmian strukturalnych w fitoplanktonie estuariów Bałtyku Południowego, Uniwersytet Gdański, Rozprawy i Monografie 15.
Pliński M., 1990, Important ecological features of the Polish coastal zone of the Baltic Sea, Limnologica 20.
Pliński M., Florczyk I., 1984, Changes in the phytobenthos resulting from the eutrophication of the Puck Bay, Limnologica 15.
Ringer Z., 1990, Vegetation (in:) Majewski A. (ed.) Zatoka Gdańska, Wydawnictwa Geologiczne, Warszawa.
Risberg J., 1990, Siliceous microfossil stratigraphy in superficial sediment core from the northwestern part of the Baltic Proper, Ambio 3.
Robins J., 1978, Geochemical and geophysical application of radioactive lead (in:) Nriagu J. (ed.), The Diogeochemistry of Lead in the Environment, Elsevier, Amsterdam.
Rybiński J., Niemirycz E., Makowski Z., 1992, Pollution load (in.) Trzosinska A. (ed.), Marine Pollution 2, An assessment of the effects of pollution in the Polish coastal area of the Baltic Sea 1984-1989, Oceanological Studies and Reviews 61.
Sakson M., Miller U., 1993, Diatom assemblages in superficial sediments from the Gulf of Riga, eastern Baltic Sea, Proceedings of the 12th International Diatom Symposium, Renesse, The Netherlands, Kluver Academic Publishers, Dodrecht, Boston, London.
Schoeman F. R., Haworth E. Y., 1984, Diatoms as indicators of pollution (in:) Ricard M. (ed.) Proceedings of the Sth International Diatom Symposium, Otto Koelz, Koenigstein.
Schulz P., 1926, Die Kieselalgen der Danziger Bucht mit Einschluss derjenigen aus glazialen und postglazialen Sedimenten, Bot. Arch. 13.
Schulz P, 1928, Süss- und Brackwasserdiatomeen aus dem Gebiet der Freien Stadt Danzig und dem benachbarten Pomereilen, Ber. Westpreuss. Bot.-Zool.
Stachura K., 1994, Zmiany we florze okrzemkowej Zatoki Gdańskiej spowodowane długotrwałym dopływem zanieczyszczonych wód Wisły, Praca magisterska, Instytut Oceanografii Uniwersytetu Gdańskiego, Gdynia.
http://rcin.org.pl

78 A. Witkowski, J. Pempkowiak
Thulin B., Possnert G, Vuorela I., 1992, Stratigraphy and age of two postglacial sediment cores from the Baltic Sea, Geologiska Fóreningens i Stockholm Forhandligar 114.
Winterhalter B., Floden T., Ignatius H., Axberg S., Niemistó L., 1981, Geology of the Baltic Sea (in:) Voipio A. (ed.), The Baltic Sea, Elsevier, Amsterdam.
Witkowski A., 1994, Recent and fossil diatom flora of the Gulf of Gdansk, the southern Baltic Sea, Biblitheca Diatomologica 28.
Witkowski A., Miłosek A., Pempko wiak J., Witak M., 1992, The development of the eutrophication of the Gulf of Gdańsk (southern Baltic Sea) as inferred from changes in the diatom species composition and the sediment characteristics, Poster and Abstract on 12th International Diatom Symposium in Renesse, the Netherlands, IX, 1992.
http://rcin.org.pl

GEOGRAPHIA POLONICA G5, 1995
S T R U C T U R A L C H A N G E S I N G E O G R A P H I C A L S Y S T E M S
F U L F I L L I N G T H E C O N D I T I O N S O F S U S T A I N A B L E
D E V E L O P M E N T
RYSZARD DOMAŃSKI
Department of Spatial and Environmental Economics Academy of Economics
Al. Niepodległości 10, 60-967 Poznań, Poland
ABSTRACT: The present article is an attempt to introduce conditions of sustainable development into a descriptive model of a heterogeneous geographical system. Issues considered include the consequences of the introduction of these conditions, a hypothetical path of sustainable development, and strategies aiming to implementation of this idea. In the description and reasoning, the conceptual apparatus of synergetics is used in a non-mathematical way.
KEY WORDS: Descriptive model of geographical system, conditions of sustainable development, consequences of introduction of sustainability conditions, path of sustainable development, strategies of sustainable development.
INTRODUCTION
The aim of the work is to present a model of geographical systems that fulfil the conditions of an ecologically sustainable development of the economy. The systems to be considered are heterogeneous, consisting of natural and socio-economic elements. They will be described in terms inspired by the conceptual apparatus of synergetics. However, the link with this apparatus will be a loose one, and the terms used will be given verbal, non-mathematical, definitions.
Synergetics is the right source of inspiration for an important reason (Haken 1977). It is a domain of science of an evolutionary character. It makes possible a reconstruction of processes leading ultimately to macroscopic structural transformation. Transformed systems acquire new properties and become new entities. There is no doubt that geographical systems, that would form if the conditions of sustainable development were met, would have significantly altered
http://rcin.org.pl

80 R. Domański
structures and different properties; they would be new entities. Hence the appropriateness of synergetic inspiration to the problem under discussion.
The construction of a model of geographical systems satisfying the conditions of sustainable development has two aims in view: to acquire knowledge about the new properties of these systems, and to formulate assumptions for the strategy of sustainable development. Sustainable development is not a natural, spontaneous process likely to take place without the interference of an intelligent society. Its conception is incorporated by the intelligent society into its strategy of economic development and environmental protection.
The goal of this strategy is economic development, involving interference for the sake of the proper maintenance of the natural environment, so that it can satisfy the needs of today's generation without jeopardising the chances of future generations. The same meaning is expressed by another definition which states that the aim of ecologically sustainable economic development is to ensure a level of welfare and a quality of the natural environment that would be acceptable now and possible to maintain in the future (Archibugi, Nijkamp 1989).
CONDITIONS OF SUSTAINABLE DEVELOPMENT
There is a widespread opinion that if economic development and the natural environment are to be sustainable, societies should be able: 1) to impose constraints on their needs (levels of satisfactory consumption and welfare), and 2) to conserve their resources and raise the productivity of the environment. However, there are no generally-accepted criteria for the manner by which select an optimum strategy, i.e. one that would ensure sustainable development, because particular societies have their own value systems and preferences. This is true of local and regional communities in particular countries as well as multi-national groups. Especially pronounced are differences in the recognized values and preferences of wealthy regions and countries on the one hand and poor ones on the other.
It is commonly assumed that the idea of sustainable development imposes constraints on the economy, but does not determine a unique strategy of economic development. There is a variety of possible scenarios, with each fulfilling the conditions of sustain ability under constraints differing in scope and degree. The choice of a strategy depends on the initial conditions in which regions, states and groups of states find themselves, on their potentials, vitality and productivity, on the trends they perceive for changes in the economy and the environment, and on the conclusions they draw in anticipating these changes.
There is a race between the degradation of the natural environment produced by economic development and the capacity of societies to take wise, co-ordinated action to conserve the environment for present and future generations (Brooks 1992). It is impossible to predict the result of this race today, but if society is to win, further conditions have to be satisfied.
http://rcin.org.pl

Structural changes in geographical systems.. 81
First, the quest for inter-generational justice should be a nonzero-sum game. In other words, the sum of resources extracted from the environment by the pre-sent generation need not necessarily diminish the resources left for subsequent generations by the same sum. Historical experience shows that such a game is possible. Thanks to advances in science and technological innovations, the process of economic development combines restricted resources of the environment and its adaptive abilities with human knowledge and capabilities. Through their use for the benefit of humanity these are not depleted; on the contrary, they increase. National income tends to dematerialise, i.e. the proportion of material resources in it tends to diminish while that of information keeps increasing (Brooks 1992). However, as a rule the progress in dematerialisation lags behind economic growth, even in the most advanced economies. A condition for sustainable development is the acceleration of the process through larger outlays for research and through the implementation of its results.
Second, transformation of economic and social structures should follow changes in the surrounding conditions as well as internal impulses and mechanisms of development. Further studies will certainly reveal other conditions of sustainable development. Their joint fulfilment will make economic growth and social progress potentially non-conflicting and compatible with the maintenance of satisfactory quality in the environment. This potential consistency, however, is a hypothesis yet to be tested in real socio-economic life.
A MODEL OF A HETEROGENEOUS GEOGRAPHICAL SYSTEM
The introduction of conditions of sustainable development to a geographical system alters its operation, and consequently its structure. The tracing of these changes can be facilitated by a synergetic model mapping the operation and development of the system. With the transformation of its structure, the system acquires new properties through to which it gains stability and the possibility of periodically balanced development. Gradually, however, slight changes (of a demographic, economic, or environmental nature) tend to accumulate in the system and be reinforced by non-linear couplings with other changes. The system also experiences sudden strong interactions (shocks), although only occasionally. These can be e.g. heavy investments or socio-political reforms altering the operating conditions of the system. It loses its dynamic equilibrium and becomes unstable. Fluctuations appear in its operation. If they are not damped, they can lead to phase transitions, which may in turn give changes in structure. The new structure is maintained through the exchange of resources, people and information with the system's milieu. The evolution of systems is a series of instabilities and phase transitions generated by them and leading to the transformation of the system's macrostructure (Weidlich and Haag 1983, Domañski 1994).
Thus, the evolution of a geographical system depends on: 1) the external milieu consisting of the natural environment, other geographical systems
http://rcin.org.pl

8 2 R. Domański
(regions), and the socio-economic environment, and 2) impulses stimulating and promoting development (control parameters, control variables). Nevertheless, these do not fully predetermine the macroscopic dynamics of the system, whose nature is defined by internal logic and internal rules of motion. The rules describe the relationship between systemic changes and factors determining them, and are called order parameters. As objects composed of a multitude of elements acting on one another in a variety of aspects, geographical systems nevertheless are governed by relatively few order parameters of a socio-economic and natural character; these elements comply with rules governing the operation and development of the whole. However, the relation can be reversed, with the whole influencing the operation and development of the elements.
The decisive influence of internal logic on the dynamics of the system's structure justifies calling the latelling of these dynamics as self-organization. Its effects, however, are not unequivocal. On the contrary, given the same external conditions, a variety of modifications of socio-economic systems can develop as a result of change in internal logic, i.e. order parameters. Self-organizing systems can then enter various trajectories of development. If their development yields itself to control by society, it is possible to build several scenarios and formulate several strategies for it, including strategies of sustainable development.
CONSEQUENCES OF THE INTRODUCTION OF SUSTAINABILITY CONDITIONS
Let us first consider how the components of a model of a geographical system, constructed with the help of the conceptual apparatus of synergetics, will be affected by the introduction of sustainability conditions. The model consists of: constraints, rules of motion (the mechanism of development), the surroundings, and control parameters (this issue will be presented in the final chapter).
It is generally assumed that sustainable development requires constraints to be imposed on the level of welfare (consumption) and the use of natural resources. What raises most serious doubt is the suggested limitation on consumption. There are no satisfactory suggestions, but sensible proposals have already been put forward. The constraints Bergh and Nijkamp (1991) impose in their model on the lower level of consumption are, that it should exceed the minimum level as much as possible (a maximin condition), and that it should change monotonically over time without falling. Solow (1986) postulates that the present generation should conduct itself in a way that leaves the future generations a chance of a life at a welfare level at least equal to the one it enjoys itself. This, however, means anticipating future trends and their evaluation, because the coming generation may have value systems and expectations different from ours. And their evaluation is risky. It is equally hard to predict new technologies and social opportunities available
http://rcin.org.pl

Structural changes in geographical systems.. 83
in the future. Leaving the environment as it is now is not only impossible; it is also undesirable. We should consider not only the resources we use, but also the resources and human capacities we leave behind, especially the new physical infrastructure, new knowledge, and the new innovative potential. The present generation also leaves a capital of social organizations, norms and connections, as well as social confidence and a sense of community which create conditions for the emergence of ever bigger social groups capable of co-ordinated action for environmental protection. In a similar spirit, Brooks (1992) claims that the strategy of sustainable development does not unavoidably involve a sacrifice of the present for the good of the future. If we can use a given quantity of natural resources we know now in such a way that we produce more goods, develop knowledge enabling us to find, extract and use future resources more effectively, or substitute more readily available materials for those currently used in human artifacts, then we do not sacrifice the present for the good of the future. On the contrary, we extend future options beyond the limits that would exist if we did not use the currently available resources.
Inter-generational justice is not the only worry of the authors of the conception of sustainable development. They are also concerned about the intra-generational injustice of today. It manifests itself in inequalities in the welfare level between particular social strata, regions and states. The demand for more intra-generational justice requires wider co-ordinated action for environmental protection and the immediate improvement of well-being in poor regions and countries because such inequalities, if allowed to grow, may lead to social unrest, uncontrolled migration, and even war.
The rules of motion that make up the internal logic (mechanism of development) of the system, change mainly under the influence of technological and social innovations. The directions of change can both converge with and diverge from the tendencies we call sustainable development. The degree of convergence can be increased using a strategy supporting this idea. The lack of such a strategy may lead to uncontrolled changes in the natural environment and to an ecological disaster, of the kind described and explained in history. Environment-friendly innovations are ones that conserve and increase resources and purify the environment. Examples include the reduction of amounts of waste, recycling, the replacement of scarce or depleted resources with others, electrical precipitators, biological sewage treatment plants, and land reclamation. Dematerialisation of the national income takes place, i.e. the proportion of material components in it tends to diminish while that of information keeps increasing. New possibilities for multiplying economic resources are created by materials engineering and biotechnology. Societies are also able to increase natural resources by improving the productivity of the environment. A spectacular example of achievements in this domain is the so-called green revolution. By their impact on the mechanism of development of heterogeneous geographical systems, technological and social innovations modify the inter-dependence of changes in the systems and their determinants. In their altered shape, these
http://rcin.org.pl

84 R. Domański
relationships, which are as a rule non-linear, may lead to additional (multiplier, synergetic) economic and natural effects, and thus may facilitate sustainable development.
A question that arises at this point is whether sustainable development is possible in the face of dwindling non-renewable resources. Opinions are divided. In pessimistic ones, stress is laid on the fast rate of exploitation and depletion of minerals, and on their non-renewability in the foreseeable future. Optimistic opinions express confidence in the progress of science and technology, in discoveries and innovations resulting in the reduced use of materials per unit of national income, in better methods of prospecting for, extracting and processing and, in the creation of new materials.
To a degree, it is possible to replace non-renewable resources with renewable ones. A matter of prime importance is therefore a correct relationship between the prices of these two kinds of resource. The scarcity of those whose supply is guaranteed (as is the case with renewable resources) is reflected in their prices, because these are as a rule controlled by market mechanisms. On the other hand, there are many resources whose supply is endangered to an extent not reflected in their prices. These include water, woodlands, and especially the adaptive abilities of ecosystems. Societies that intend to pursue the strategy of sustainable development will have to devote more attention to this problem. It is suggested (Brooks 1992) that market mechanisms should be extended to cover resources whose supply is in danger, so that their prices would better reflect private and social costs. So far they have been kept low artificially for social reasons. State intervention should be kept to a minimum, and be limited to the legal framework and principles of economic policy rather than individual pricing decisions. Changes in price relations reflecting differences in the availability of resources will be an unavoidable consequence of the adoption of the strategy of sustainable development.
The system's openness and the existence of active surroundings is an indispensable condition of sustainable development. An exchange of materials, people and information with the surroundings makes possible the creation and survival of structures that would be unlikely to appear otherwise. It was due to the flow of materials from the surroundings that e.g. the industry of Western Europe and Japan could develop. On the other hand, however, the surroundings may pose a risk to the existence of local structures if they are unable to meet external economic competition or a negative influence of other cultures. An example is the fall of the cultures of the Aztecs and Incas after they had come into contact with European culture. A given geographical system can avoid a detrimental impact from its closest vicinity if it is possible for it to develop co-operation with a farther environment. What facilitates such an extension of the surroundings is the increase in the mobility of resources, thanks to e.g. the development of transport. The system can also defend itself against the harmful influence of the surroundings by transforming its internal structure, and thus by changing the kind,
http://rcin.org.pl
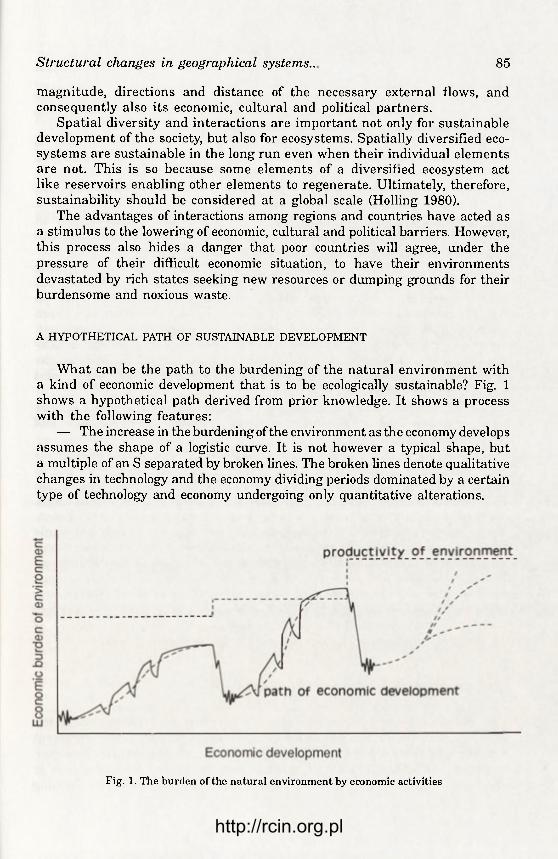
Structural changes in geographical systems.. 85
magnitude, directions and distance of the necessary external flows, and consequently also its economic, cultural and political partners.
Spatial diversity and interactions are important not only for sustainable development of the society, but also for ecosystems. Spatially diversified eco-systems are sustainable in the long run even when their individual elements are not. This is so because some elements of a diversified ecosystem act like reservoirs enabling other elements to regenerate. Ultimately, therefore, sustainability should be considered at a global scale (Holling 1980).
The advantages of interactions among regions and countries have acted as a stimulus to the lowering of economic, cultural and political barriers. However, this process also hides a danger that poor countries will agree, under the pressure of their difficult economic situation, to have their environments devastated by rich states seeking new resources or dumping grounds for their burdensome and noxious waste.
A HYPOTHETICAL PATH OF SUSTAINABLE DEVELOPMENT
What can be the path to the burdening of the natural environment with a kind of economic development that is to be ecologically sustainable? Fig. 1 shows a hypothetical path derived from prior knowledge. It shows a process with the following features:
— The increase in the burdening of the environment as the economy develops assumes the shape of a logistic curve. It is not however a typical shape, but a multiple of an S separated by broken lines. The broken lines denote qualitative changes in technology and the economy dividing periods dominated by a certain type of technology and economy undergoing only quantitative alterations.
Fig. 1. The burden of the natural environment by economic activities
http://rcin.org.pl
8 6 R. Domański
— In a longer period transformations of the environment as a whole are irreversible, but in a shorter period its particular elements or regions can be restored to a state similar to an earlier one.
— Within the given type of technology and economy, the load put on the environment by economic activity can be reduced to a certain degree through the conservation of resources, reduction of pollution, substitution, and creation of new resources. The general load, however, shows an upward trend. The degradation of some regions or some elements of the environment can exceed its capacity and near this limit the pressure of the economy on the one hand and the development of protective measures on the other can increase fluctuations in the economy-environment system.
— The development of the economy is sustainable owing to epoch-making technological and social innovations which radically reduce the burden put on the environment, make new natural resources available, and open up new perspectives in the development of society. Changes that occur as a result of such innovations are phase transitions in sustainable development. However, the adoption of innovations in the economy and society usually requires large outlays for the replacement of technological facilities in the economy, reorganization of management, re-training of personnel, and replacement of household appliances.
— As a result of phase transitions, ecological-economic systems acquire new structures and new properties which enhance their adaptive and developmental abilities.
— The diffusion of epoch-making technological and social innovations accelerates economic development, which in turn increases the burden put on the environment. The burden is reduced step by step, but new perspectives in development only open up with successive epoch-making innovations. Sustainable development is just a series of such innovations and their diffusion. Epoch-making changes in technology and the economy are usually not single innovations, but combinations forming bundles of complementary innovations.
One other feature should be added to those presented in Fig. 1. In some initial conditions and intervals of parameter values, ecological-economic systems of a deterministic nature assume random features and display chaotic features in their development. The phenomenon of deterministic chaos has been observed only recently, and its consequences for the strategy of sustainable development have not been studied properly as yet.
STRATEGIES OF SUSTAINABLE DEVELOPMENT
Sustain ability is a characteristic of a strategy of development of the economy and society. It expresses society's care for its natural environment and for its preservation in a decent state for future generations. However, a strategy of sustainable development cannot change the laws of nature or the laws of the economy and the natural development tendencies forming
http://rcin.org.pl

Structural changes in geographical systems.. 87
under their impact. What it can do, though, is influence them. The influence may aim at short- or long-term targets. Short-term strategies seek to save resources, counteract environmental pollution, open up possibilities for the substitution of various resources, and prevent excessive deviations of an ecological-economic system from the dynamic equilibrium. Targets that come to the fore in long-term strategies are those anticipating phase transitions or turning points in economy-environment relations. They include: the creation of new materials by developing materials engineering and the improvement of the productivity of ecosystems; and — in the domain of socio-economic relations — a change in priorities to favour environment-friendly trends, winning social approval for this change, and adjusting social and ecological-economic macro-structures to meet the new situation that will emerge after a phase transition.
Sustainable development is a gradable concept. Its conditions can be satisfied to varying degrees. This fact exerts an influence on the way in which a strategy of sustainable development is being built. This process also has to allow for uncertainty as to the system of values and preferences of future generations, and the directions and efficiency of future technological and social innovations. Thus, the strategy has to include many variants and offer many options for development and the satisfaction of the needs of future generations. Given our highly incomplete knowledge and a high risk of error in forecasting, the minimum condition adopted in the building of the strategy should be the survival of the human species, and so the preservation of biodiversity at a satisfactory level.
Strategies of sustainable development can be implemented with the help of a variety of instruments: legal, technical, economic, social and cultural. The experience in harmonising economic development with environmental protection accumulated so far allows us to identify the group of instruments that have turned out to be particularly efficient in this respect. It includes those that aim at the conservation of the environment and a co-ordinated environmental policy producing synergetic effects, i.e. a reinforcement of beneficial influences thanks to interactions among various factors. Great and well-founded hopes are placed in the advances of science and technology, which provide access to new resources and qualities of the environment and open up new perspectives for economic development. The outlays earmarked for research and the implementation of its results are high, though, and usually only bring effects after a long time. Not all societies can afford this kind of investment. Advanced countries keep improving the quality of the environment; raising the level they have attained even higher entails ever higher costs per unit output (an increase in marginal costs). The same means invested in developing countries where the quality of the environment is low would produce much more remarkable effects. At a global scale, therefore, such a relocation of means would be advantageous. To make it possible, however, it is necessary to change priorities and to gain approval for it from the communities of particular countries and from the world community.
http://rcin.org.pl

88 R. Domański
Difficult dilemmas arise in the building and implementation of a strategy of sustainable development. These include:
— The scale of application of new technologies, which can be useful and healthy when applied on the small scale, and given up on the appearance of new, better technologies. They can be harmful and unhealthy if they are used on a large scale and over a longer period, as the example of pesticides shows.
— Regulating the pace of change. Socio-economic changes introduced slowly may not upset the adaptive and regenerative abilities of ecosystems, while violent changes may lead to their devastation. At present a factor that jeopardises the ecological-economic equilibrium is the demographic explosion in the poor countries of Africa, Asia and Latin America.
— Costs of insurance and the degree of risk, costs of prevention and adaptation. Economic policy can anticipate a future ecological risk and bear the costs of insurance beforehand, so as to be able to handle possible environmental disturbances. It can also limit the preventive measures resorted to, investing rather in adaptive abilities of the environment and the economy and thus allowing ecological-economic systems to regenerate easily and achieve new equilibrium. In this way the period of frozen capital would shorten and, somewhat later investments in the environment might yield better results owing to the application of newer technologies, whose appearance can confidently be assumed.
— An integrated environmental policy and priorities. An integrated policy produces synergetic results, but it requires the allocation of great resources to the environmental sector. Societies that cannot carry out a full protective programme (a task found to be more or less impossible by all countries), have to choose the direction of investment. If prices reflected the full social and private costs of the involvement of the environment in economic activity, market mechanisms could establish investment priorities. This is not the case, however, and state intervention is therefore indispensable, although its scope is the subject of much controversy.
— The amplitude of the real developmpnt path around the path of sustainable development and the commui .aivity of relations. Because of the imperfect divisibility of investments in infrastructure and production on the one hand and in environmental protection on the other, it is impossible for a developing ecological-economic system to attain a state of equilibrium. The equilibrium is usually upset by the economy, and investments restricting or eliminating disturbances are subject to delay. However, in highly-advanced countries and regions, environmental investments, especially infrastructural ones, are surplus to current requirements once undertaken. This creates a reserve which dwindles slowly in the process of economic growth until the upper limit of admissible environmental load is reached. At that point a new big infrastructural push should take place. This principle of commutative relations in the socio-economic-environmental system was defined by Domański (1992).
http://rcin.org.pl

Structural changes in geographical systems..
CONCLUSIONS
89
The idea of sustainable development is an interesting and promising one, but it needs some clarification to be made operational. In particular, we should elucidate sustainability conditions and the acceptable level of limitations on the consumption and use of resources, and anticipate the pattern of development fulfilling sustainability conditions. This anticipation should be the starting point for a forecast that would warn of an economy approaching the tolerance limits of the environment and an economic crisis resulting from environmental outlays that exceed the accumulative capabilities of the economy. The crisis in the economy would have an effect on the quality of the environment. The study of the mechanism of sustainable development, and the tracing of its trajectory can be facilitated by a model built with the help of the conceptual apparatus of synergetics. The present work is a proposal to undertake and develop research on this matter.
REFERENCES
Archibugi F., Nijkamp P., (eds.), 1989, Economy and ecology: Towards sustainable development. Kluwer Academic Publishers, Dordrecht-Boston-London.
Bergh van den J.C.J.M., Nijkamp P., 1991, Aggregate dynamic economic-ecological models for sustainable development, Environment and Planning A, 10.
Brooks H., 1992, Sustainability and technology (in:) Science and sustainability, Selected Papers on IIASA's 20th Anniversary, IIASA, Laxenburg.
Domański R., 1992, An approach to the examination of man-environment systems using the theoiy of dissipative structures, Przegląd Geograficzny, 1-2.
Domański R., 1994, Transformation of urban systems in terms of synergetics (in:) Changes in the regional economy in the period of transformation, Komitet Przestrzennego Zagospodarowania Kraju PAN, Studia Regionalia, 4.
Haken H., 1977, Synergetics: An introduction. Springer Verlag, Berlin Holling C.S., (ed.) 1980, Adaptive environmental assessment and management, J. Wiley and Sons,
Chichester. Solow R.M., 1986, On the intergenerational allocation of natural resources, Journal of
Environmental Economics, 4. Weidlich W., Haag G., 1983, Concepts and methods of a quantitative sociology. Springer Verlag,
Berlin.
http://rcin.org.pl

http://rcin.org.pl

GEOGRAPHIA POLONICA 65, 1995
G L O B A L E N V I R O N M E N T A L P O L I C Y :
T H E R O L E F O R E C O N O M I C I N S T R U M E N T S
TOMASZ ŻYLICZ
Warsaw Ecological Economics Center University of Warsaw
ul. Długa 44/50, 00-241 Warszawa, Poland
ABSTRACT: The paper discusses global environmental problems such as climate change and biodiversity conservation, and reviews policies to address them. Two broad groups of instruments are analyzed: taxes and marketable permits. The paper consists of 6 parts. In the first one, key policy issues are introduced. This is followed by a discussion of a possible global carbon tax. Using tax revenues for subsidizing environmentally sound projects is studied in section 3. Sections 4 and 5 discuss marketable permits and technological offsets as their special case. The paper concludes with an overview of the available set of policy instruments indicating their potential role in reaching efficient and equitable international environmental agreements.
KEY WORDS: Global change, biodiversity, carbon tax, technology transfer, environmental conventions.
INTRODUCTION
The "Earth Summit" in Rio de Janeiro in 1992 revealed the wide spectrum of environmental issues which require global action and coordination. At the same time it revealed the magnitude of problems which make the prospects for such an action dubious. The great disparity between the rich "North" and the poor "South" makes the latter reluctant to share concerns of the former. An individual whose life expectancy is below 50 and annual income below $1000 has certainly a different perspective on long-term environmental performance than that whose life expectancy is 20-30 years longer and income at least 20 times higher.
Global environmental problems include, among other things, depletion of the ozone layer, climate change, and biodiversity conservation. The first one was addressed by the Vienna Convention of 1986 (and subsequent protocols),
http://rcin.org.pl
92 T. Żylicz
and the other two were covered by the two conventions agreed at Rio. In addition, there is also a class of transboundary and regional issues which call for international concerted efforts as well. They include the European acid rain, eutrophication of semi-enclosed seas (e.g. the Baltic Sea), international river pollution, and so on. Many of them have been regulated by international agreements although in most cases no provisions have been made to optimize the level of protection by cost-effectively differentiating control requirements.
Least-cost solutions to global environmental problems imply that major abatement programme should be targeted at developing (and former centrally planned) rather than developed economies. The latter typically have already undertaken some measures and therefore they are higher up on their marginal cost curves. On the contrary, it is the former where a significant potential for simple, inexpensive improvements exists. These countries however, attach low priority to global environmental goals, as many other, more immediate, needs are not satisfied. As a result what they can spend on such goals is much less than the developed countries are willing them to do. Thus both equity and efficiency require that the latter should be given effective channels of spending their funds on abatement activities in the former.
Economic instruments provide the flexibility that is needed to achieve a socially optimal allocation of abatement or conservation effort.1 They let parties to decide themselves whether to undertake protection or to pay, in one form or another, while the protection is undertaken somewhere else. Setting off lesser protection in one place by more protection in another is the essence of the economic approach to global environmental policy. Economic theory asserts that no social optimum can be achieved unless the marginal costs born by various economic agents to meet the environmental goal in question are equal. Economic instruments are supposed to equate these costs among agents and in fact this is what they do in many actual applications.
The organization of the paper is as follows. In the next four sections an analysis of the two main economic instruments currently discussed at international fora is carried out. The two instruments are: a global tax and a marketable permit system. The tax instrument is explained by example of a global carbon tax. This is followed by an analysis of a possible revenue recirculation scheme to assist countries in adopting environmentally sound technologies. A discussion of marketable permits is offered next. The subsequent section (Tietenberg 1990) deals with an important special case of marketable permits, i.e. international environmental offset programmes. A summary of the main findings concludes the paper.
1 See Żylicz (1991) for a general discussion of the role of economic instruments in optimizing international allocation of abatement effort.
http://rcin.org.pl
Global environmental policy: the role.. 93
GLOBAL CARBON TAX
A number of parliaments have shown interest in establishing „green" taxes on environmentally disrupting products/activities. There are also strong tendencies among economic theorists to advocate for raising budgetary revenues from exhaustible-resource rather than capital-and-labour taxation. These trends are consistent with plans to design a Global Carbon Tax (GCT) both as an incentive and a revenue-raising instrument. The main purpose of such a tax would be to protect the global climate against warming caused by excessive emissions of carbon dioxide and other "greenhouse" gases.
The tax should be levied on: (1) carbon content of fossil fuels burnt, (2) net atmospheric C02 releases resulting from biomass destruction,
and (3) other greenhouse gas (methane, CFCs, etc.) emissions according to
their "greenhouse" potential. The tax has to be uniform in order to stimulate an efficient allocation
of abatement efforts. Its primary incentive effect does not depend on whether the revenues are recirculated (as lump-sum payments) locally or redistributed by a supranational authority. However, only the latter option makes it possible to use the tax as a means of international transfers of wealth to speed up the adoption of anti-C02 policies in poor countries (Hoel 1993).
For political reasons, it is unlikely that developing countries will accept a fully centralized version of GCT. A more realistic scenario is to assume that developing countries will recirculate the tax domestically. The developed countries will finance (from a part of their GCT revenues) a supranational agency authorized to funding "greenhouse" investment programmes; here too, as in the case of developing countries, political factors may result in demands that a certain percentage of the tax revenues is spent internally. The agency will thus be responsible for allocating only a portion of GCT. The rest of the revenues are to be spent domestically in respective countries. The agency, however, may exert significant control over all GCT expenditures by requiring that even the internally funded GCT projects meet certain criteria if international funding (for other projects) is to be authorized.
The static cost-effectiveness conditions require that all projects funded through GCT should be financed so as to equate marginal abatement costs in every country. In practice this would mean that all projects are ranked according to their C02 reduction potential per unit of cost. They are then being included in the programme in this order until thefundinghas exhausted. This state can be achieved but by a pure chance if constraints to the transboundary flows of GCT revenues exist. Even the whole developed countries' portion of the tax (used as a "filler") may not be sufficient to achieve this static optimality criterion on a global scale.
On a national scale, such static criteria could and indeed should be applied to efficiently recirculate the domestic money. Here the international GCT
http://rcin.org.pl

94 T. Żylicz
authority is only to make sure that cost-effectiveness analyses have been competently carried out and followed. On the contrary, a number of development assistance channels can be applied to the "North-South" transfers.
They include: — soft-loans for investment projects; — reimbursing incremental costs of better materials or stricter maintenance
regimes; — subsidizing developed country exports of selected green technologies; — paying all or a percentage of the royalties on patents. The administration of GCT could be a two-tier one. A supranational
agency (existing UNEP and/or the World Bank technical facilities can be utilized) is responsible for setting tax rates, general spending policy, and authorizing international transfers. In particular, it compiles lists of technologies (including patents, and other know-how elements) eligible for funding, and sets target levels of greenhouse gas net releases for each country to be achieved within a-few-year intervals. It continuously reviews the performance of the system, updates the lists, and periodically revises the tax structure. In each country a National Energy Efficiency Centre allocates the domestic GCT revenues, and collaborates with the supranational agency in selecting the projects to be (co)financed.
To the extent that strategies other than simply conserving fossil fuels are of interest, the National Centres can be made responsible for biomass protection as well as all greenhouse gases emissions. In tropical rain-forest countries the most efficient strategy may turn out to be the forest protection, or at least improved logging practices. In certain developed countries — e.g. in the Netherlands — where high energy efficiency standards have been already achieved, developing new agricultural techniques may prove most cost-effective. Strong focus on fossil fuels and energy conservation shall be characteristic of all the countries' activities anyway.
Selecting energy-efficient technologies to be covered under international subsidy schemes is a non-trivial task. Energy efficiency as apparent from the direct energy requirements of a given device or a process can be misleading unless indirect energy consumption is assessed and taken into account. Judging from this point of view, only improvements attainable through better management/supervision practices or otherwise requiring minimal capital expenditures are safe candidates for approved transfers. Whenever significant capital costs are involved, one has to demonstrate that the capital which embodies an (apparently) energy-saving technology does not require excessive energy inputs at earlier stages of production. For instance, solar cell devices should be scrutinized before authorizing GCT subsidies. As long as the price of energy does not include all social costs (including the future ones), options that are indirectly energy intensive will not be excluded by the market forces automatically.
http://rcin.org.pl
Global environmental policy: the role.. 95
Technologies that will almost certainly pass the indirect-energy-intensity test include many insulation materials, new smelting technologies, new engine designs, energy generation control devices, semiconductors (including thyristors), and so on. New combustion technologies (new burners, fluidized bed combustion boilers, etc.) may pass the test as well. Also substituting virgin materials with recycled ones typically leads to energy savings.
Telecommunications should be assessed from the point of view of its energy saving potential. To the extent it serves as a surrogate for transporting passengers and commodities, it may prove to be an anti-C02 policy tool too.
In a number of countries — including e.g. Poland — massive uncontrolled methane emissions accompany coal mining activities. There exist technologies to utilize the methane before extracting the coal from its deposit. The technologies will almost surely qualify to be covered under GCT programmes; the "greenhouse potential" of methane is a multiple of that for C02. In addition to methane, several other greenhouse gases released in industrial or agricultural processes can be abated by means of new, improved technologies.
Benefits from GCT can be attributed to both increasing the price of energy and additional spending on environmentally sound projects. The easily predictable effect of raising energy prices will be slowing down global energy consumption. Hydrocarbon fuels (oil and gas) will be taxed relatively less than solid ones (coal and lignite), since their carbon content per unit of energy is lower. As a result the demand will shift from coal to hydrocarbons. Thus less coal will be burnt during the next 2-3 decades (when fossil hydrocarbons are still available), before more efficient solid fuel combustion technologies are invented and introduced to commercial use. This is another effect of raising fuel prices according to their carbon content rather than uniformly.
The fund raised from GCT will make it possible to fairly assess — independently of the oil majors, coal lobbies, etc. — what global energy scenarios are desirable. Next it will equip policy makers with an instrument to speed up the transition to more efficient energy technologies and to ease North-South transfers of wealth.
The scheme should be considered equitable since most of the burden of financing will be placed on the countries which are the wealthiest ones. It is also efficient, since each fuel user will face the same incentive to reduce greenhouse effect; hence marginal control costs will equalize.
At the same time, however, higher energy prices may retard economic growth of developing countries. Also the political instability in the Middle East is a factor contributing to higher energy bills, which affect developing countries (and former centrally planned economies) most acutely. As a result these countries may resist to any additional charges levied on fuels.
In a number of countries there exist revolving funds or similar facilities established in order to finance environmental protection. It is often hard to separate anti-C02 measures from other activities supposedly eligible for support from these funds. Under these circumstances it will be difficult to
http://rcin.org.pl

96 T. Żylicz
achieve policy integration and overall efficiency in spending. One source of such difficulties is the apparent inconsistency between various measures proposed with respect to various pollutants. For instance, flue gas desulphurization technology implies increased C02 emissions. Conversely, attempts to curb C02 emissions through strong price incentives may create an unwanted bias in favour of nuclear energy. Therefore, a GCT policy must be incorporated into a broader framework. On the other hand, creating additional bureaucracies to coordinate project selection criteria across various public funds may prove impractical.
GCT is an alternative to a marketable permit scheme. Advocates for the former often argue that a tax system is administratively and politically superior as it does not have to rely on an initial (presumably administrative) allocation of quotas. However, if the revenues from a tax are subject to recirculation, then the recirculation rules serve as a baseline for the net tax, and i.e. a de facto initial allocation of permits. Thus any earmarked tax does not free one from arbitrary decisions. Adopting rules for money recirculation simply recognizes countries' rights to the global commons in a less explicit way.
The fact that fossil fuels are one of the most significant items on national accounts lists makes it possible to raise large amounts of money by establishing a relatively modest (in comparison to the average price of fuels) tax. Thus even small changes in the tax rate and/or fuel price will make a tremendous absolute difference in the global sum collected and, perhaps, in its economic impact. Consequently launching the GCT programme should be preceded by careful studies of that impact.
A tax with fixed (fuel-specific) rates would be convenient since it is "inflation-proof'. However, given the fact that fuel prices are difficult to predict — especially in the short run — it would be difficult to plan annual budgets of GCT. On the other hand, adopting alternative anti-inflationary measures (indexation plans) may be cumbersome and difficult to internationally agree upon.
As in any wealth transfer cases, Transnational Corporations (TNCs) can play an active role in identifying potential recipients of the financial assistance in host countries. It is then a matter of fair transfer pricing conditions to minimize risks from excessive intra firm payments charged for the know-how and technology. Having settled this, the supranational agency and National Centres may in fact "harness" TNCs to prepare projects suitable for financing from either of the sources.
Many countries practice excise taxes on gasoline. GCT would therefore boil down to extending such taxes to other fuels (most importantly to include coal), and to earmark them as anti-C02 policy funds. Two problems arise here. First, some countries may choose to shield their economies from new oil-price shocks by decreasing rather than increasing fuel taxes. In Poland, for instance, a draft bill on fuel charge (on the average 4% ad valorem, earmarked
http://rcin.org.pl
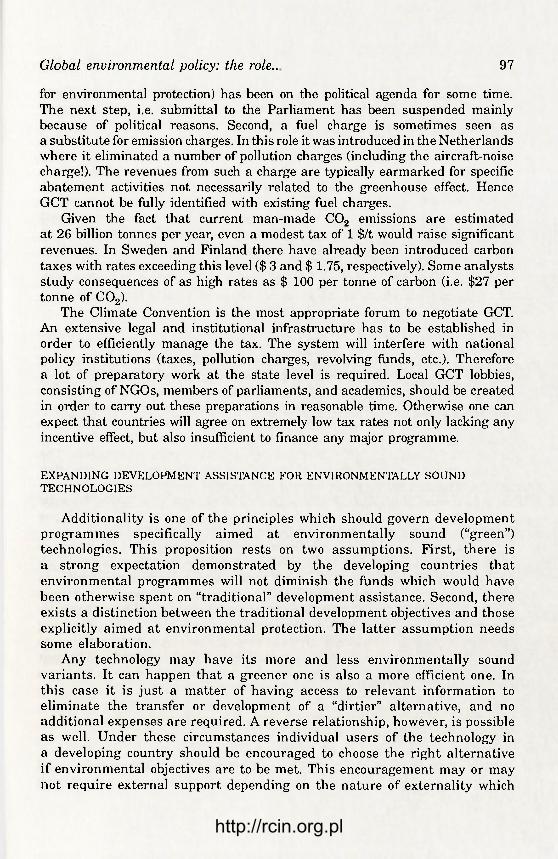
Global environmental policy: the role.. 97
for environmental protection) has been on the political agenda for some time. The next step, i.e. submittal to the Parliament has been suspended mainly because of political reasons. Second, a fuel charge is sometimes seen as a substitute for emission charges. In this role it was introduced in the Netherlands where it eliminated a number of pollution charges (including the aircraft-noise charge!). The revenues from such a charge are typically earmarked for specific abatement activities not necessarily related to the greenhouse effect. Hence GCT cannot be fully identified with existing fuel charges.
Given the fact that current man-made C02 emissions are estimated at 26 billion tonnes per year, even a modest tax of 1 $/t would raise significant revenues. In Sweden and Finland there have already been introduced carbon taxes with rates exceeding this level ($ 3 and $ 1.75, respectively). Some analysts study consequences of as high rates as $ 100 per tonne of carbon (i.e. $27 per tonne of C02).
The Climate Convention is the most appropriate forum to negotiate GCT. An extensive legal and institutional infrastructure has to be established in order to efficiently manage the tax. The system will interfere with national policy institutions (taxes, pollution charges, revolving funds, etc.). Therefore a lot of preparatory work at the state level is required. Local GCT lobbies, consisting of NGOs, members of parliaments, and academics, should be created in order to carry out these preparations in reasonable time. Otherwise one can expect that countries will agree on extremely low tax rates not only lacking any incentive effect, but also insufficient to finance any major programme.
EXPANDING DEVELOPMENT ASSISTANCE FOR ENVIRONMENTALLY SOUND TECHNOLOGIES
Additionality is one of the principles which should govern development programmes specifically aimed at environmentally sound ("green") technologies. This proposition rests on two assumptions. First, there is a strong expectation demonstrated by the developing countries that environmental programmes will not diminish the funds which would have been otherwise spent on "traditional" development assistance. Second, there exists a distinction between the traditional development objectives and those explicitly aimed at environmental protection. The latter assumption needs some elaboration.
Any technology may have its more and less environmentally sound variants. It can happen that a greener one is also a more efficient one. In this case it is just a matter of having access to relevant information to eliminate the transfer or development of a "dirtier" alternative, and no additional expenses are required. A reverse relationship, however, is possible as well. Under these circumstances individual users of the technology in a developing country should be encouraged to choose the right alternative if environmental objectives are to be met. This encouragement may or may not require external support depending on the nature of externality which
http://rcin.org.pl

98 T. Żylicz
makes the greener alternative less (privately) efficient. If the externality affects agents from the polluting country alone, then it can be internalized by means of an adequate domestic policy, and (theoretically) no additional assistance is necessary. On the contrary, if it affects foreign parties, or, in particular, a global commons, then the additionality principle should apply. It is here that developing countries can, and, in fact, do claim that additional assistance is required.
To reiterate: as a rule, official development assistance should be kept compatible with global sustain ability criteria. In some instances this can be achieved by simply restructuring programs traditionally financed without sacrificing any of the economic development objectives. There are, however, instances where a greener technology is more costly than a dirtier alternative, and this incremental cost can discourage a developing country from choosing the right option if the amount of available assistance is fixed. It is thus both efficient and equitable to extend assistance programs so as to cover these costs.
(A) OPTIONS NOT REQUIRING (SIGNIFICANT) ADDITIONAL FUNDING
If a greener technology happens to be more efficient from the receiving country point of view, its adoption should not require additional funding. It may, however, require that appropriate information is available to the decision-makers. One solution is to prepare directories of green technologies with their fob prices for developing countries, and directories of dirty technologies with an explanation of their harmful consequences. This will remove information barrier, but it may not suffice to effectively eliminate wrong alternatives. The decision-makers in developing and former centrally planned economies often are overwhelmed by the initiative and eloquence of foreign salespersons (even in the absence of a bribe). As a result, in the absence of effective domestic international regulation, and low environmental awareness, dirty technologies which are inferior also in economic terms can be imported/adopted.
In the developed countries decisions are heavily influenced by extensive environmental regulation and environmental lobbies. Both factors are much less significant in the rest of the world. Both, however, can be transferable to some extent. Even though strict environmental regulations of one country cannot apply to another one, in some cases they may be transferred via TNCs by requiring the same practices in the host country as at home. Likewise, lobbying the parent company's headquarters in a developed country may be a surrogate for a (non-existing) vigorous environmental lobby in the host country. Whatever has been identified here with respect to direct investment applies to any form of technology transfers.
(B) OPTIONS REQUIRING ADDITIONAL FUNDING TO BE SPENT ON LOCAL GOODS AND SERVICES IN DEVELOPING COUNTRIES
The elimination of dirty but apparently efficient technologies can be eased or accelerated by domestically financing certain activities in a developing
http://rcin.org.pl

Global environmental policy: the role.. 99
country without a need for significant imports. Financing developing country R&D in order to design technologies appropriate for use in these countries is an example of such an expenditure. Financing education and training needed to produce and operate new technologies makes another one. Also covering incremental (both capital and operating) costs of a greener version of a particular technology belongs to this category unless it requires significant imports.
A possibility of financing such activities in local currencies rather than hard ones allows for their funding through e.g. "debt-for-nature swaps". Obviously they can also be funded in a more traditional way by means of direct subsidies.
(C) OPTIONS REQUIRING ADDITIONAL FUNDING TO BE SPENT ON IMPORTED COMMODITIES
Covering incremental costs of a greener technology is a general pattern here. This assistance may take any of the following forms:
— soft-loan for an investment project; — reimbursing incremental costs of better materials or stricter maintenance
regimes; — subsidizing developed country exports of selected green technologies; — paying all or a percentage of the royalties on a patent. This sort of assistance can be carried out by "harnessing market forces"
if economic agents in a developed country are given proper incentives. In particular, these may take the form of tax allowance for selected, specified (listed) types of contracts thus reducing the need for bureaucracies.
Recent amendments to the Montreal Protocol provide examples of how the discussed options can be applied.
Ad (A) As it turned out, in certain applications (e.g. as propellants in aerosols)
CFCs can be substituted with cheaper and safer substances which — like C02 — can be produced locally. It is then only a matter of adequate information and, perhaps, public and legal pressures to eliminate CFCs from such unnecessary uses.
Ad (B) Significant reductions of CFC emissions from poorly managed cooling
processes could be achieved if the personnel responsible for maintenance received proper training. Apart from a likely initial effort to train the trainers, the rest of the training programme can be carried out by locals (e.g. local employees of a TNC). No significant import expenditures are thus required. Hence the funding mechanism may take the form of debt-for-nature swaps among other things.
Ad (C) A number of industrial technologies now using CFCs (e.g. as solvents)
can switch to ozone-friendly substitutes which are more expensive at the moment. Therefore the transition requires additional funding.
http://rcin.org.pl

100 T. Żylicz
Extending development assistance to include the transfer and/or development of environmentally sound technologies speeds up the process of meeting requirements for an effective protection of the global commons. It will also help to restructure development programmes and to eliminate projects which are harmful for the local economies. There are specific benefits characteristic for options (A)-(C):
Ad (A) Dissemination of technological data and impact assessments contributes
to environmental education objectives. In the longer run this should help to establish and/or strengthen environmental NGOs in developing countries. In former centrally planned economies it will also help to promote methods of technology assessment and cost-benefit analysis, which was neither taught nor practiced there.
Ad (B) Funding local purchases will stimulate the development of local
entrepreneurship, research, and markets. It should also help to tailor new technologies to the local needs.
Ad (C) Funding incremental expenses incurred by developing countries will make
global abatement plans viable. It may also trigger spending additional funds (to be raised in developed countries) on development by stimulating the exporting firms to lobby their governments.
This general approach is nevertheless characterized by some disadvantages as well. They can be traced in any of the three cases discussed.
Ad (A) Requiring TNCs or other suppliers of technologies to follow the same
environmental standards as in developed countries deprives the importers of their comparative advantage that potentially may be offered by their less congested natural environments. Also environmental priorities as represented by NGOs from developed countries may not be relevant in very different circumstances of a developing country; as a result local NGOs may receive inadequate inspiration.
Compiling lists of green or dirty technologies will be subject to heavy lobbying on the part of interested/affected industries. The outcome can result from political pressures.
Ad (B) Plans for spending substantial amounts from public funds raise efficiency
questions. These are especially relevant in developing countries (and former centrally planned economies) which are often lacking adequate appraisal procedures. Furthermore, financing domestic environmental expenditures through debt-for-nature swaps can contribute to inflation and thus meet with opposition of governments who see financial stability as an important aim of their policies.2
2 This objection remains valid if the swaps are assessed vis a vis the alternative of an unconditional debt for-giveness; otherwise any form of the debt service is a burden, and the swap may turn out to be a preferred option.
http://rcin.org.pl

Global environmental policy: the role.. 101
Ad (C) The principle of reimbursing all incremental costs of a greener technology
is inefficient. It distorts cost-benefit analysis against other effective — and, perhaps, less expensive — options (like e.g. scaling down the production process). In addition, if a subsidized transfer of a technology (e.g. export, or royalty/patent charge) is channeled through a TNC operating in both countries involved, then the problem of transfer pricing comes out.3 If the transferred technology is tailored to some specific needs of the recipient — as indeed it should — then no exact market price can be referred to. As a result the price charged by the parent company may be too easily accepted by the subsidiary, and this will inflate the costs of the programme.
To some degree extending assistance programmes can be carried out by means of voluntary guidelines (codes of conduct for TNCs, OECD or EC guidelines for spending development funds, NGOs'bilateral agreements etc.). In particular, this relates to option (A). If, however, substantial flows of money are to be triggered than negotiating a convention or protocol would be required.
TNCs can play an active role in all phases of this policy: from selecting development assistance titles to carrying out actual transfers, and to diffusing their results. Potentially this is a positive and creative role provided the corporations meet a countervailing power wherever they attempt to behave uncompetitively.
First, politically powerful TNCs may influence the lists of sound/unsound technologies by providing those who compile the lists with more comprehensive and convincing data than other agents. Here an antidote would be to devise the compilation process so as to enable small businessmen, environmentalists, and academics to adequately voice their opinions.
Second, any TNC may circumvent market pricing by claiming that their products or services embody unique characteristics in order to meet the importer's requirements. International standardization of transferred technologies, coupled with accurate and timely information on their prevailing world market prices, could be a solution. It has to be admitted, however, that TNCs may actually differentiate their products in response to local needs, and a complete standardization is difficult if at all possible.
Executive bodies of international "environmental" conventions or UNEP can be effective fora for negotiations, as the case of recent amendments to the Montreal Protocol proves it. This experience also proves that developing countries are firm in their emphasizing the additionality principle. Other negotiating fora include OECD, EU, and International Chamber of Commerce (World Environment Center). Options (A) — i.e. defining constraints on technologies whose purchases are to be financed through development loans
3 It is well documented that a TNC may use non-market prices for its intra-firm transactions. The resulting financial transfers are designed so as to avoid taxes or to otherwise maximize net overall profits.
http://rcin.org.pl
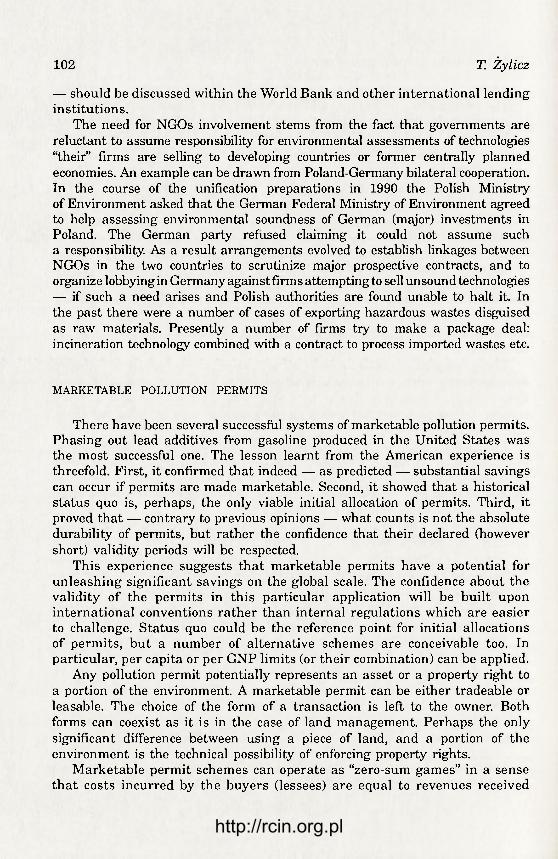
102 T. Żylicz
— should be discussed within the World Bank and other international lending institutions.
The need for NGOs involvement stems from the fact that governments are reluctant to assume responsibility for environmental assessments of technologies "their" firms are selling to developing countries or former centrally planned economies. An example can be drawn from Poland-Germany bilateral cooperation. In the course of the unification preparations in 1990 the Polish Ministry of Environment asked that the German Federal Ministry of Environment agreed to help assessing environmental soundness of German (major) investments in Poland. The German party refused claiming it could not assume such a responsibility. As a result arrangements evolved to establish linkages between NGOs in the two countries to scrutinize major prospective contracts, and to organize lobbying in Germany against firms attempting to sell unsound technologies — if such a need arises and Polish authorities are found unable to halt it. In the past there were a number of cases of exporting hazardous wastes disguised as raw materials. Presently a number of firms try to make a package deal: incineration technology combined with a contract to process imported wastes etc.
MARKETABLE POLLUTION PERMITS
There have been several successful systems of marketable pollution permits. Phasing out lead additives from gasoline produced in the United States was the most successful one. The lesson learnt from the American experience is threefold. First, it confirmed that indeed — as predicted — substantial savings can occur if permits are made marketable. Second, it showed that a historical status quo is, perhaps, the only viable initial allocation of permits. Third, it proved that — contrary to previous opinions — what counts is not the absolute durability of permits, but rather the confidence that their declared (however short) validity periods will be respected.
This experience suggests that marketable permits have a potential for unleashing significant savings on the global scale. The confidence about the validity of the permits in this particular application will be built upon international conventions rather than internal regulations which are easier to challenge. Status quo could be the reference point for initial allocations of permits, but a number of alternative schemes are conceivable too. In particular, per capita or per GNP limits (or their combination) can be applied.
Any pollution permit potentially represents an asset or a property right to a portion of the environment. A marketable permit can be either tradeable or leasable. The choice of the form of a transaction is left to the owner. Both forms can coexist as it is in the case of land management. Perhaps the only significant difference between using a piece of land, and a portion of the environment is the technical possibility of enforcing property rights.
Marketable permit schemes can operate as "zero-sum games" in a sense that costs incurred by the buyers (lessees) are equal to revenues received
http://rcin.org.pl
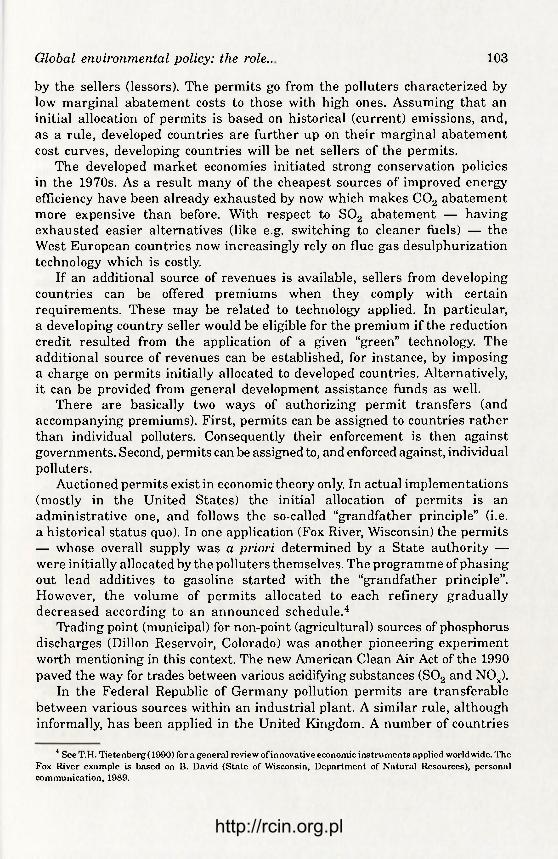
Global environmental policy: the role.. 103
by the sellers (lessors). The permits go from the polluters characterized by low marginal abatement costs to those with high ones. Assuming that an initial allocation of permits is based on historical (current) emissions, and, as a rule, developed countries are further up on their marginal abatement cost curves, developing countries will be net sellers of the permits.
The developed market economies initiated strong conservation policies in the 1970s. As a result many of the cheapest sources of improved energy efficiency have been already exhausted by now which makes C02 abatement more expensive than before. With respect to S02 abatement — having exhausted easier alternatives (like e.g. switching to cleaner fuels) — the West European countries now increasingly rely on flue gas desulphurization technology which is costly.
If an additional source of revenues is available, sellers from developing countries can be offered premiums when they comply with certain requirements. These may be related to technology applied. In particular, a developing country seller would be eligible for the premium if the reduction credit resulted from the application of a given "green" technology. The additional source of revenues can be established, for instance, by imposing a charge on permits initially allocated to developed countries. Alternatively, it can be provided from general development assistance funds as well.
There are basically two ways of authorizing permit transfers (and accompanying premiums). First, permits can be assigned to countries rather than individual polluters. Consequently their enforcement is then against governments. Second, permits can be assigned to, and enforced against, individual polluters.
Auctioned permits exist in economic theory only. In actual implementations (mostly in the United States) the initial allocation of permits is an administrative one, and follows the so-called "grandfather principle" (i.e. a historical status quo). In one application (Fox River, Wisconsin) the permits — whose overall supply was a priori determined by a State authority — were initially allocated by the polluters themselves. The programme of phasing out lead additives to gasoline started with the "grandfather principle". However, the volume of permits allocated to each refinery gradually decreased according to an announced schedule.4
Trading point (municipal) for non-point (agricultural) sources of phosphorus discharges (Dillon Reservoir, Colorado) was another pioneering experiment worth mentioning in this context. The new American Clean Air Act of the 1990 paved the way for trades between various acidifying substances (S02 and NOx).
In the Federal Republic of Germany pollution permits are transferable between various sources within an industrial plant. A similar rule, although informally, has been applied in the United Kingdom. A number of countries
4 SceT.H. Tietenberg( 1990) for a general review of innovative economic instruments applied worldwide. The Fox River example is based on B. David (State of Wisconsin, Department of Natural Resources), personal communication, 1989.
http://rcin.org.pl

104 T. Żylicz
practice marketable fishing permits. Several former centrally planned economies have shown interest in marketable permits. In Poland these are included in the new draft bills on environmental protection and water resources management.
In 1990 the contracting parties to the Montreal Protocol (on the ozone layer) agreed to allow for international trades in CFC and halon quotas. This became the first application of marketable permits on a global scale, although no trades (leases) have been recorded so far.
There is no experience in authorizing premiums on permits sold. The rules for allocating such premiums should be similar to those worked out with respect to general development funds.
Technologies suitable for transferring this way are those aimed at curbing pollution with a global rather than local impact. Otherwise emission sources from various countries are not "substitutable", and they should not be traded for each other.
Ozone depleting substances, and greenhouse gases are the most important examples of global pollutants. Thus CFC-free technologies, and energy efficiency projects are obvious choice to be considered under global marketable permit schemes. Pollutants with regional impact — like S02 and NOx — can be considered under international schemes too. A significant portion of the European acid rain originates from former centrally planned economies (including East Germany) and affects the Nordic countries. Control technologies are costly and rarely applied in Eastern Europe. Marketable permits combined with premiums for countries characterized by low GNP per capita levels are worth considering, although the demand for unused permits (supposedly to be released by East European polluters) is questionable. Another example of a "North-South" encounter in Europe is the eutrophication of the Baltic Sea. Here efficient technologies are required to control the runoff of phosphates and nitrates (e.g. better agricultural practices including the use of pelletized fertilizers), but, again, a questionable demand for unused permits can make this option impractical.
Marketable permits have been also suggested as an instrument for conserving biodiversity (Panayotou 1994). The idea is based on the fact that biodiversity protection boils down to the protection of habitats and thus to land use questions. In order to raise revenues to be paid to land owners foregoing development options, a system of transferable development rights can be established. In this way the demand for unused permits, presumably originatingfrom biodiversity rich areas, will be created. Transferable development rights example demonstrates that marketable permits do not confine to abatement problems but can be applied to other global policy issues as well.
A marketable system applied at the global scale neatly combines the benefits of a development assistance programme (premiums) with the flexibility of market response (trading permits). Especially under the decentralized scenario (i.e. permits traded among individual polluters rather
http://rcin.org.pl

Global environmental policy: the role.. 105
than states) individual firms are offered incentives. The involvement of state bureaucracies is thus reduced. This may speed up technology transfers. If the funds to finance the premiums are raised from charges collected (from developed-country polluters) at the time of initial allocation of permits, then the costs of the assistance programme are directly born by polluters from the developed economies. By raising the cost of unabated emissions in the latter, one expands the demand for abatement technologies, and, consequently, economies of scale can be expected. As a result the prices paid by a developing country for such technologies will be lower.
Although there is no question about the equity of the scheme, its efficiency is uncertain. In terms of static efficiency, the scheme is inadequate since two different prices of a pollution permit coexist: a higher one for polluters from developed countries, and a lower one for developing economies. Moreover, additional inefficiency stems from the fact that the programme creates a bias against abatement alternatives that do not rely on the prescribed technologies (i.e. not included on the list).5 For instance it is biased against reforestation as an anti-C02 policy. These objections are certainly less relevant from the dynamic efficiency point of view, but careful detailed assessments should be carried out before conclusions are drawn.
Decentralized allocation and enforcement of permits is another controversial issue. The attractiveness of this variant originates from avoiding state bureaucracies as an intermediary who can only interfere with strict enforcement and market response. The same bureaucracies, however, may play a positive role wherever, and as long as, the markets are weak. By dealing directly with individual polluters from developing countries one deprives their governments of a chance to correct deficiencies of the markets that are far from perfect there. Also the governments themselves are given less opportunities to adapt and reform. The same applies to former centrally planned economies.
The effectiveness of the scheme depends on the demand for unused permits. It is assumed that the differentials in marginal abatement cost curves will encourage the allocation of abatement activities to the developing countries. It is likely, however, that the developed countries will be able to reduce emissions at an even faster pace than the developing ones despite higher marginal abatement costs. This may result from environmental lobbying and related political pressures that do not exist in the developing (or former centrally planned) economies. Consequently these economies will not find enough buyers for their unused permits. A remedy would be to agree on a scenario with the amount of permits allocated to developed countries being reduced faster than those initially allocated to the developing ones.
The reluctance to sell unused permits, and/or to rely on permits bought will be lower under the decentralized scenario. Benefits from the increased global efficiency may not be sufficient to overcome developing countries' concerns'
5 In addition, compiling lists of green or dirty technologies will be subject to heavy lobbying on the part of interested/affected industries. The outcome can result from political jfressures.
http://rcin.org.pl

106 T. Żylicz
over a possible loss of future development options once their firms' permits are sold. Therefore these countries may prefer leases over trades.
TNCs role may be crucial for this option to work. In view of the qualifications described above, the most likely way of identifying partners of a trade, and actually to carry this out would be an intra-firm contract. TNCs whose subsidiaries operate in both a developed and a developing country will possess the fullest knowledge of marginal cost differentials. They will also understand best what future scenarios for tightening emission reduction requirements are to be expected (especially in the developed country). TNCs will be motivated to screen all the opportunities, and to balance their decisions against possible risks. The risks will be lower, if permits are allocated to, and enforced against, individual polluters rather than countries, since trades are then reversible from a TNC point of view. This alternative will also speed up transfers, and, probably, will increase their number. However, even under the centralized scenario TNCs interested/affected can initiate trades.
There is a chance that some TNCs will take advantage of the mechanism and try to trade back and forth their permits (reallocating production activities accordingly). To eliminate such an outcome, provisions should be adopted that premiums are subject to some qualifications like, for instance, a certain minimum period required before the resale of a permit.
International conventions, and their executive bodies are the most obvious fora for negotiating initial allocation of permits, trading rules, and premiums. The ozone-layer agreements can be seen as model ones even though no premiums were provided there explicitly. Emission "reduction credits" are acknowledged, but "premiums" are based on incremental cost reimbursements. Thus developing countries are subsidized in proportion to abatement costs rather than abatement results. Yet another difference from the model discussed here is that the costs of anti-C02 policies are much higher. Consequently, despite the Climate Framework Convention signed at Rio, prospects for achieving a North-South consensus are dimmer.
All of the former centrally planned economies advocate for "free technol-ogy transfers", and in fact some do benefit from a modest development assistance. As these programmes are only now being launched, there is a unique opportunity to equip them with right incentive mechanisms from the very beginning. Because of the historical traditions, and because of the fact that equity questions are dominating efficiency ones, the same experiments with respect to low income countries seem less likely.
INTERNATIONAL ENVIRONMENTAL OFFSET PROGRAMMES
An offset project is an agreement between two polluters to reduce the overall pollution by letting one of them sponsor an abatement programme of the other
http://rcin.org.pl

Global environmental policy: the role.. 107
in order to utilize the resulting pollution reduction credit. The agreement rests on two premises:
(1) There are enforceable pollution quotas allocated among polluters; (2) The quotas are transferable, i.e. the polluters are given property rights
to pollution reduction credits. Offsets are a special case of marketable — i.e. tradeable or leaseable
permits. They should be understood as trades rather than leases, as abatement technology transfers are irreversible. Contrary to what is assumed in the general marketable permit scheme, here the payment for the pollution reduction credit is in kind.
Rather than establishing regular markets for unused quotas (permits), one can arrange transfers on an ad hoc basis letting potential partners to actively identify each other themselves. This is the idea behind "offsetting" agreements, recognized by the Climate Framework Convention as "Joint Implementation Projects". In the centralized model, a (developed country) government approaches another (developing country) government to propose an abatement investment in exchange for the pollution reduction credit earned in this way. In the decentralized one, the agreements are negotiated between individual polluters.
Only global (or at least regional) pollutants can be regulated in this way. Local pollutants are excluded, unless they affect an international body of water, or an air-basin shared by two or more countries. In the case of regional pollutants, potential partners are obviously constrained to the region. In the case of global ones, there are — by definition — no constraints on the distance between the partners, as all pollution sources are substitutable.
Even though global pollutant offsets may involve any pair of countries, it is also conceivable that twinning arrangements are more practical. Under such schemes every developed country is "assigned" one or several developing countries where offsetting possibilities should be sought.6 The assignment would cover just one pollutant (or a group of substitutable pollutants); it cannot be assumed that the partners whose pollution-and-abatement potential fit each other with respect to one pollutant will meet their mutual requirements with respect to another one. These arrangements are possible under both centralized and decentralized models.
Examples of pollutants that are suitable for international offsetting are the same as conceivable under general marketable pollution permit schemes. The technologies to be transferred include: energy efficiency improvements, other greenhouse gas abatement methods, as well as CFC-free industrial processes. Technologies to control regional impact pollutants include flue gas desulphurization, coal washing, fluidized bed combustion (and other clean coal technologies), secondary and tertiary waste water treatment installations, technologies to control non-point sources of phosphates and nitrates (e.g. pelletized fertilizers), and so on.
6 The assignments can be either spontaneous, or they can be coordinated by an international agency.
http://rcin.org.pl
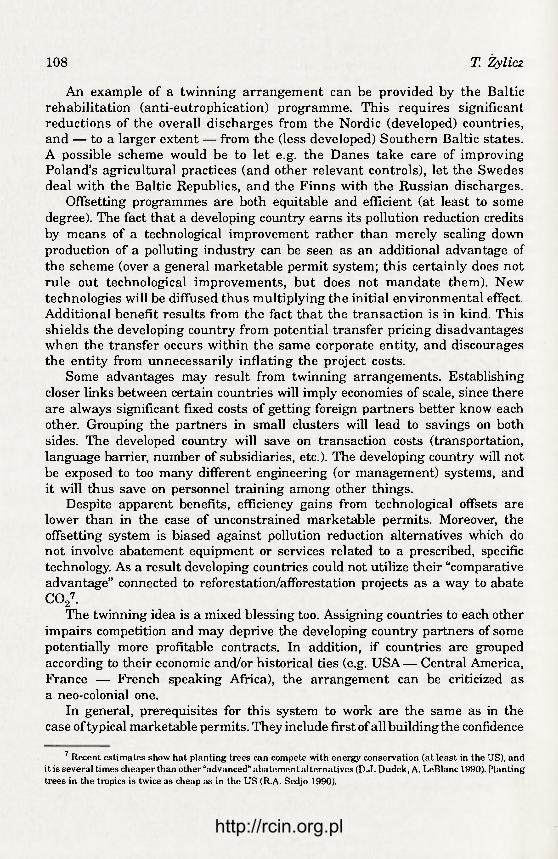
108 T. Żylicz
An example of a twinning arrangement can be provided by the Baltic rehabilitation (anti-eutrophication) programme. This requires significant reductions of the overall discharges from the Nordic (developed) countries, and — to a larger extent — from the (less developed) Southern Baltic states. A possible scheme would be to let e.g. the Danes take care of improving Poland's agricultural practices (and other relevant controls), let the Swedes deal with the Baltic Republics, and the Finns with the Russian discharges.
Offsetting programmes are both equitable and efficient (at least to some degree). The fact that a developing country earns its pollution reduction credits by means of a technological improvement rather than merely scaling down production of a polluting industry can be seen as an additional advantage of the scheme (over a general marketable permit system; this certainly does not rule out technological improvements, but does not mandate them). New technologies will be diffused thus multiplying the initial environmental effect. Additional benefit results from the fact that the transaction is in kind. This shields the developing country from potential transfer pricing disadvantages when the transfer occurs within the same corporate entity, and discourages the entity from unnecessarily inflating the project costs.
Some advantages may result from twinning arrangements. Establishing closer links between certain countries will imply economies of scale, since there are always significant fixed costs of getting foreign partners better know each other. Grouping the partners in small clusters will lead to savings on both sides. The developed country will save on transaction costs (transportation, language barrier, number of subsidiaries, etc.). The developing country will not be exposed to too many different engineering (or management) systems, and it will thus save on personnel training among other things.
Despite apparent benefits, efficiency gains from technological offsets are lower than in the case of unconstrained marketable permits. Moreover, the offsetting system is biased against pollution reduction alternatives which do not involve abatement equipment or services related to a prescribed, specific technology. As a result developing countries could not utilize their "comparative advantage" connected to reforestation/afforestation projects as a way to abate C027.
The twinning idea is a mixed blessing too. Assigning countries to each other impairs competition and may deprive the developing country partners of some potentially more profitable contracts. In addition, if countries are grouped according to their economic and/or historical ties (e.g. USA— Central America, France — French speaking Africa), the arrangement can be criticized as a neo-colonial one.
In general, prerequisites for this system to work are the same as in the case of typical marketable permits. They include first of all building the confidence
7 Recent estimates show hat planting trees can compete with energy conservation (at least in the US), and it is several times cheaper than other "advanced" abatement alternatives (D.J. Dudek, A. LeBlanc 1990). Planting trees in the tropics is twice as cheap as in the US (R.A. Sedjo 1990).
http://rcin.org.pl

Global environmental policy: the role.. 109
that the declared validity periods of the permits will be respected. Therefore an international legal framework in the form of a convention or a multilateral official agreement is necessary. Additionally, under the centralized model, effective government bodies must be established in order to channel the flow of assistance (even though, in technical terms, the flow can be channeled through private institutions like TNCs).
TNCs' involvement is crucial under both centralized and decentralized scenarios. However, under the latter one can assume that TNCs will actually take the lead in identifying developing-country partners (i.e. individual polluters to be taken care of). If twinning arrangements are sought, then the existing TNCs' historical involvement and future interests will serve as the starting point for selecting countries to cooperate.
There are no fully relevant negotiating experiences in the case of international offset agreements. The Montreal Protocol (to the Vienna Convention on the ozone layer) comes closest to the point, albeit not in an explicit way. The Protocol authorizes permit transfers, but it does not state that the transactions have to be in kind. Moreover, it does not create any incentives for developing countries to exceed its requirements, as only incremental costs of meeting the Protocol are reimbursed. On the other hand, it is doubtful whether the developed countries would demonstrate any demand for unused permits (as discussed in the previous section above). As a result, the only trades one can realistically expect will probably take place between various developing countries characterized by different positions on marginal abatement costs curves.
As to the twinning arrangements, the recent Germany unification provides an example. In many fields of the social, economic, and public life various West German entities (Laender, firms, universities, etc.) are assigned to their sister counterparts in East Germany. Despite some affinity to market sharing practices which are inefficient from an economics point of view, this system proves to be very effective and it is capable of demonstrating results in months rather than years. Similar arrangements are contemplated on an international forum in order to speed up the integration of Central-East European countries into the European Union. It will not be easy, though, to replicate these experiences at a broader scale. For the time being there are no such assignments. As a result, for instance, flue gas desulphurization technology is transferred to Poland from Denmark, Finland, Germany, The Netherlands, Sweden, and the United States simultaneously. It is questionable whether this healthy diversity is worth the costs of maintaining parallel channels.
SUMMARY AND CONCLUSIONS
This paper discussed potential applications of economic instruments to global environmental policy problems such as the climate change, the protection of the ozone layer, biodiversity preservation, as well as regional
http://rcin.org.pl

110 T. Żylicz
issues such as e.g. "acid rain". The purpose of economic instruments is to stimulate cost effective allocation of abatement or conservation effort and to address equity concerns by means of wealth transfers.
Two major instruments can be, and occasionally are, applied in this context: taxes (with recirculation of revenues for environmental purposes) and marketable permits. The paper offered a discussion of the global carbon tax indicating its advantages and disadvantages. Financing environmentally sound technology transfers was indicated as one possible way of recirculating revenues from such a tax. Then the paper discussed advantages and disadvantages of marketable permits. These can be applied both to abatement and conservation problems. One special case of the marketable permit approach, namely "international offset" or Joint Implementation Projects was analyzed in more detail.
Either instrument (tax or permit) can be applied in a centralized or decentralized manner. Under the former, states act as agents to be taxed or earn and use emission reductions credits. Under the latter regime, individual polluters rather than governments become parties to international agreements. This adds flexibility to the system and makes it easier to achieve cost-effectiveness on the global scale. At the same time, however, by reducing the role of governments, the decentralized system may leave firms from the less developed countries more vulnerable to pressures from their more economically advanced partners.
The paper also discussed the role of various institutions in creating an effective global mechanism for environmental protection. In addition to (potential) tasks performed by environmental NGOs, the role played by Transnational Corporations was scrutinized. In particular, the paper identified areas where the presence of such corporations my compromise environmental goals or threaten economic efficiency and equity.
REFERENCES
Dudek D.J., LeBlanc A. 1990, Offsetting New C0 2 Emissions: A Rational First Greenhouse Policy Step, Contemporary Policy Issues VIII, July, 29-42
Hoel M. 1993, Harmonization of Carbon Taxes in International Climate Agreements, Environmental and Resource Economics 3, 3, 221-232
Panayotou T. 1994, Conservation of Biodiversity and Economic Development, The Concept of Transferable Development Rights, Environmental and Resource Economics 4, 1, 95-110
Sedjo R.A. 1990, Forests to offset the greenhouse effect, Journal of Forestry, July, 12-15 Tietenberg T.H. 1990, Economic Instruments for Environmental Regulation, Oxford Review of
Economic Policy 6, 1, 17-33 Żylicz T. 1991, The Role for Economic Incentives in International Allocation of Abatement Effort,
in: R. Costanza (ed.), Ecological Economics: The Science of Management of Sustainability, Columbia University Press, New York, 384-399
http://rcin.org.pl

GEOGRAPHIA POLONICA 65, 1995
J O I N T I M P L E M E N T A T I O N P R O J E C T S T O R E D U C E
G R E E N H O U S E G A S E M I S S I O N S : P R O S P E C T S F O R P O L A N D
G L E N D . A N D E R S O N
Harvard Institute for International Development, Policy Advisor, Ministry of Environmental Protection, Natural Resources and Forestry
ul. Wawelska 24, 02-061 Warszawa, Poland
ABSTRACT: Countries throughout the world have become increasingly concerned about the buildup of greenhouse gases in the atmosphere and the potential ramifications for a net increase in surface temperatures. Signatories to the Framework Convention on Climate Change (FCCC), including Poland, have made a commitment to stabilize greenhouse gases (GHGs) to their 1990 (1988 for Poland) levels by the year 2000. Even if these countries are successful in stabilizing emissions, many experts believe that GHGs must be reduced even further. Negotiations on additional reductions in G H G emissions in the next century are now underway. Joint Implementation (JI) refers to a cooperative project between a donor (Annex I country under the FCCC) who provides funds or equipment to reduce GHGs in the territory of the host country. JI projects are attractive to donors because they provide the potential to achieve emission reductions at a lower cost/ton than investments in GHG reductions in their own country. To make JI attractive, donors need to receive credit for G H G reductions in the host country. Poland will most likely be a host country if it participates in JI projects because the cost/ton of GHG reductions in Poland will probably be below the costs of options in donor countries. The paper examines a range of issues that Poland would need to address to more effectively evaluate, implement, and monitor JI projects. Particular attention in the paper is focused on JI criteria, options for organizing a JI Secretariat, and legal issues related to negotiations and contracts the Government of Poland would undertake with donor countries and JI implementors, respectively.
KEY WORDS: Greenhouse gas emissions, Framework Convention on Climate Change, Joint Implementation, donor country, host country, additionality.
INTRODUCTION
Countries throughout the world have become increasingly concerned about the build-up of greenhouse gases in the atmosphere and the potential ramifications for a net increase in temperatures on the planet. While some countries potentially could benefit from such a warming trend, the net global
http://rcin.org.pl

112 G. D. Anderson
effect is anticipated to be negative and could threaten the existence of many coastal areas if the climate change is accompanied by a rise in sea levels. Although experts do not agree on when increases in temperature might occur, how much the increase will be and how it will be distributed by latitude, or what measures need to be taken and how soon, countries have pledged to take some actions to address the growth in greenhouse gas emissions. Signatories to the Framework Convention on Climate Change (FCCC), including Poland, have made a commitment to stabilize greenhouse gases (GHGs) to their 1990 (1988 for Poland) levels by the year 2000. Even if these countries are successful in stabilizing emissions, global emissions will increase as a result of expected increases in developing countries which have not committed to stabilization targets. In addition, many experts believe that greenhouse gas emissions must be reduced; small annual growth rates or even stabilization will only exacerbate the problem of accumulation in the atmosphere since many greenhouse gases decay very slowly in the atmosphere. Negotiations on additional reductions in GHG emissions in the next century are now underway.
A range of options for achieving reductions in greenhouse gases have been proposed including the following: (1) specific GHG targets for all countries, (2) use of carbon taxes to stimulate reductions that are less costly on a per ton basis than paying the tax (with numerous options for distributing revenues proposed), (3) development of a global emissions trading programme for GHGs, (4) specific GHG targets for all countries, augmented by joint implementation projects for credit against domestic targets.
Amajor concern about the first option, particularly among developed countries which have already achieved substantial reductions in GHGs, is the high cost of achieving further reductions. Because a one-ton reduction in GHG emissions is desirable from a global perspective, irrespective of where it is achieved, a number of developed countries are interested in exploring ways to achieve global emission reductions cost-effectively. Options (2), (3), and (4) enumerated above all provide, to a varying degree, incentives for reducing the global costs (and individual country burdens) of reducing GHG emissions. This paper will focus on Option (4) which is currently receiving serious discussion in the International Negotiating Committee of the FCCC. The next section provides a brief discussion of the joint implementation concept. Joint implementation is controversial and, while widely endorsed by many OECD countries, has been opposed by various NGOs including the Climate Network Europe. This section will try to summarize some of the criticisms of the mechanism as well as noting its strengths. The third section will include an overview of criteria that might be considered in determining whether joint implementation projects are desirable in Poland. The final section will summarize the next set of steps that Poland might undertake to be positioned as a host country for joint implementation projects.
http://rcin.org.pl

Joint Implementation Projects to Reduce.. 113
THE JOINT IMPLEMENTATION CONCEPT
Joint Implementation (JI) refers to a cooperative project involving two or more parties that achieves GHG emission reductions. One party (the donor), presumably an Annex I country under the FCCC, provides financial resources or capital equipment to achieve emission reductions in the territory of another party (the host). JI projects are attractive to donors because they provide the potential to achieve emission reductions at a lower cost/ton than investments in GHG emission reductions in their own country. However, donors would need to receive credit for making these investments vis a vis their domestic targets to make joint implementation attractive. Negotiations have been initiated to determine how credit for GHG emission reductions achieved by JI projects would be allocated between donor and host countries.
It is anticipated that Poland will most likely take the position of a host country if it participates in JI projects because the cost of reducing a ton of GHG in Poland will probably be substantially below options available to donors in their respective countries. Although there are numerous important details to be worked out, JI could be beneficial to Poland and other host countries. Some of these benefits might include the opportunity to obtain technology and expertise over and above current multilateral and bilateral assistance, encourage sustainable developments, particularly in energy utilization, achieve reductions in local and transboundary air pollution, and promote restructuring and modernization of energy-intensive industries.
Opponents of Joint Implementation have raised a number of important objections to the concept. Arecent statement, prepared by the Climate Network Europe, a consortium of European NGOs, in July of 1994, enumerates four major concerns about JI. First, there is a concern that JI investments will simply be substituted for other forms of donor assistance to economies in transition or developing countries. While this concern is valid, there may be ways to ensure that historical levels of assistance are maintained. The major problem will be instances where recent or current levels of assistance are not expected to continue in the future. For example, donor assistance to CEE countries increased after 1989 and will be sustained at current levels until these countries' have recovered from the recession and begun to see renewed growth. A second related issue is that the transfer of technologies to economies in transition and developing countries for JI credit would substitute for obligations under the climate convention. Again, certain monitoring measures might be implemented to address this problem. The third concern relates to the uncertainty of GHG emission reductions in JI projects, and the likelihood that — because these uncertainties will tend to be asymmetrical (greater level of GHG emissions predicted than achieved) — OECD countries will fail to meet their existing and future targets. Whether this issue can be successfully resolved by the conference of parties to the FCCC will depend on the possible use of non-performance sanctions or remedies. The use of intermediate targets for national GHG emission
http://rcin.org.pl

114 G. D. Anderson
reductions at more frequent time intervals could provide a mechanism for adjusting policies. This problem could also be overcome if monitoring and verification requirements for Jl-based GHG credits are made more restrictive. This could lead to a more narrow definition of JI projects or reduce the number of JI projects that could be undertaken without incurring very high administrative costs or exposing the donor country to stiff penalties. Fourth, there is a concern that JI will represent only a small proportion of total new investments in host countries and that, because of low energy prices in developing countries and economies in transition, many other investments will be unsustainable, and may wipe out the gains from JI projects. Thus, host countries need to commit to sustainable development paths at the national level and ensure that investments are not unsustainable. This requirement could be difficult to implement in the climate change convention unless it focuses narrowly on GHG emissions in investment projects; JI projects might only be undertaken in countries which have committed to quantitative GHG emission reduction targets. An additional requirement that countries must pursue a sustainable development path — whatever that means — in order to establish eligibility for JI projects would need to apply to both host and donor countries and would likely be difficult to implement or find support among parties to the climate convention.
While these are serious concerns, some can be addressed without significantly reducing the potential benefits of JI. However, other concerns could be very costly to address, limiting the potential benefits and number of acceptable JI projects.1 A more fundamental question needs to be resolved by opponents of joint implementation (or other options that provide some flexibility and promote cost-effectiveness): if no flexibility is provided to developed countries are they likely to commit to the deep cuts in GHG emissions that are needed? Hopefully, all parties will work together to try to resolve these issues without losing the potential for cost-effective reductions.
ENVIRONMENTAL AND ECONOMIC CRITERIA FOR JOINT IMPLEMENTATION PROJECTS
Although JI projects may be implemented by private companies in both the donor and host countries, it is the countries that will make commitments to achieve GHG emission reduction targets. Thus, it will be necessary for donor and host countries to assess proposed JI projects in terms of a set of criteria that ensure that JI projects promote the respective countries' efforts to meet their targets. The criteria that might be used to evaluate proposed joint implementation projects (JIPs) in Poland might serve five purposes:
1 Opponents of JI have suggested that GHG reductions resulting from JI projects should reflect the direct and indirect effects on emissions as well as estimates of "upstream" emissions (i.e., those used to produce the capital equipment, provide alternative fuels, etc.). Such estimates for every JI project could be very costly, a requiring considerable oversight. In all likehood, the range of acceptable JI projects would be very limited.
http://rcin.org.pl
Joint Implementation Projects to Reduce.. 115
— Ensure that JIPs comply with the standards or guidelines adopted by the Conference of Parties (COP).
— Ensure that public and private financial resources for implementing JIPs are used cost-effectively.
— Provide information to Donor Countries that would enable them to identify potential JIPs that might be most suitable and acceptable in Poland.
— Provide transparent, unambiguous rules to help private JIPs partners (and financial intermediaries) develop acceptable project proposals.
— Ensure that JIPs are consistent with the National Environmental Policy of Poland, promote the principles of sustainable economic development, natural resource allocation, and protection of the environment, and are profitable for Poland from a long time horizon, wide system perspective.
While it is possible that future negotiations on joint implementation by parties to the FCCC will lead to a set of evaluation criteria that would be acceptable to all parties, it seems more likely that criteria approved by the COP will be more general than the criteria that individual countries might develop. Thus, it is desirable for Poland to develop a set of JIP criteria for reviewing projects proposed by donor countries.
GHG EMISSION REDUCTIONS
ADDITIONALITY
The basic notion that has been discussed by the COP is that JIPs prior to 2000 should result in reductions in GHG emissions that are "in addition" to those actions necessary to fulfill targets established for Annex I countries (including Poland). The seemingly simple concept of additionality requires each implementing or recipient country to conduct an assessment of the actions needed (and likely to be implemented) to reach the GHG target for the year 2000 (for Poland, stabilization of GHG levels to the level in 1988). Without such preliminary assessment, Poland cannot determine whether the proposed project is, in fact, additional to other actions. The actions taken by Poland to reduce GHGs will be motivated not only by Poland's commitments on GHG but also by a number of other international commitments and national policies: harmonization with European Union environmental directives; other international environmental commitments (e.g., sulfur protocol); the Implementation Programme for the National Environmental Policy until the Year 2000; and macroeconomic policies such as removal of energy subsidies. The first step in assessing additionality will be to estimate GHG emissions in 2000 under the most likely scenarios wherein Poland fulfills these other commitments and policies. This analysis would need to include sensitivity analysis where key assumptions are varied (e.g., annual change in GDP), and the determination of a "safety" margin in the estimates. The view among Polish experts is that Poland will meet its commitments
http://rcin.org.pl

116 G. D. Anderson
to stabilize GHGs without taking additional actions beyong current domestic and international commitments. Nevertheless, a demonstration of this result may be required by the COP during the pilot phase of JI.
Based on the proposed analysis above, a proposed JIP can be assessed in terms of the level of GHG reductions vis a vis the safety margin. If the JIP's GHG reductions are within the bounds of the safety margin, the project can be considered to be additional. Some additional problems arise, however:
(1) Is it necessary to rank all actions in terms of their marginal cost/ton reduction in GHG and restrict JIPs to those projects which have marginal costs/ton that are greater than the marginal costs of the investment that just meets the GHG target? For practical purposes, it may be difficult to develop the marginal abatement cost curve for Poland. Furthermore, while investments might be compared in terms of GHG reductions, these actions may have other important economic and environmental benefits that need to be netted out of costs since these other benefits are jointly produced with GHG emission reductions.
(2) Estimates of GHG levels in 2000 will be based on assumptions made at the time the assessment is performed. However, these projections could prove to be erroneous because of more rapid economic growth, slower progress in meeting environmental goals, or faulty assumptions about emission factors. Thus, while a JIP may appear to be additional at the time it is proposed, it might not be in 2000. Three options for dealing with this potential problem might be considered. First, if the initial analysis of anticipated GHG levels is supported by the COP (or other body created to monitor JIP), then no contingency action is required. Second, Poland might require that JIPs do not exhaust the safety margin (e.g., preserve 50% of the margin). Third, Poland might develop a list of contingency measures that would be implemented in the event that the GHG target cannot be reached in 2000. It is unlikely that JIPs will be more than a small component of the safety margin, at least during the pilot stage. Nevertheless, a list of contingency measures is probably worth developing (and might be needed in any event once commitments beyond 2000 are negotiated).
ESTIMATION OF GHG EMISSION REDUCTIONS
It will be necessary to accurately estimate and monitor the level of GHG emission reductions achieved by the JIP. During the Pilot Programme, this will primarily be an issue for Poland and other recipient countries, since donor countries will not receive credits for GHG reductions achieved through JIP. It is not clear whether it will be necessary to accurately estimate GHG emission reductions from JIP in the pilot phase and demonstrate that these reductions are additional. Presumably, a limited number of JIPs will be undertaken during the pilot phase and the resulting GHG emission reductions will be small and will not be necessary for Poland to reach its stabilization target. Estimation
http://rcin.org.pl
Joint Implementation Projects to Reduce.. 117
of potential reductions and monitoring/ex post analysis of emission reductions, once the project is implemented, will provide valuable insights into the problems of developing and implementing a system of GHG credits after the pilot phase.
There may be substantial costs involved to estimate and monitor the level of GHG reductions achieved by JIP. It is recommended that a study be conducted to categorize the various types of JIPs in terms of (1) costs to estimate GHG reductions (see footnote 1); (2) costs to monitor GHG reductions; and (3) tradeoffs between costs and accuracy of estimation and measurement options. These "transaction" costs should be reflected in the assessment of overall JIP costs and benefits. In addition, the issue of accuracy and the implications for receiving credits for GHG reductions will need to be addressed in intergovernmental negotiations.
CONSISTENCY WITH ENVIRONMENTAL AND ECONOMIC OBJECTIVES
NON-DETERIORATION OF THE LOCAL OR REGIONAL ENVIRONMENT
JIPs should not lead to increases in other local/regional environmental quality indicators at the expense of achieving reductions in GHG emissions. It is important to recognize the differences in time preferences for environmental quality within Poland and the benefits to Poland of stabilization of GHG emissions in the atmosphere. Where proposed JIPs might lead to increases in other air emissions, water discharges, or waste disposal, appropriate mitigation measures should be incorporated into the JIP.
COST-EFFECTIVE ATTAINMENT OF ENVIRONMENTAL GOALS
JIPs should directly or indirectly motivate cost-effective realization of environmental goals. Where JIPs involve the installation of new capital equipment, they should also lead to a net reduction (or at least no increase) in the facility's costs of meeting current and anticipated environmental standards (e.g., resulting from harmonization with the European Union environmental directives, other international treaty commitments). Thus, process changes and new technologies which prevent pollution will be desirable.
SUSTAINABLE UTILIZATION OF NATURAL RESOURCES
JIPs should encourage the prudent use of natural resource stocks and reuse or recycling of waste materials. In effect, as Poland develops a plan for implementing Agenda 21 provisions from UNCED, it will strive to meet certain goals for using its natural resources as efficiently as possible.
http://rcin.org.pl

118 G. D. Anderson
COMPATIBILITY OF JIP WITH RESTRUCTURING AND MODERNIZATION
JIPs should be compatible with, and promote to the greatest extent possible, utilization of modern production processes. To compete in European and international markets, Poland needs to identify and implement least cost technologies, while simultaneously improving or maintaining product quality.
COMPATIBILITY WITH MACROECONOMIC POLICIES
JIPs should be sensitive to and compatible with macroeconomic policies at the national and voivod levels. Where Poland is making a financial commitment in the JIP, total benefits and costs as well as distribution of those benefits and costs, should be taken into account. Both direct and indirect effects on employment and the viability of enterprises should be considered. For example, does the JIP reduce employment significantly in the enterprise? Does the JIP lead to market power for the enterprise that would reduce the competitiveness of other Polish firms? Have appropriate mitigation options been built into the JIP to minimize the negative macroeconomic impacts?
VIABILITY OF THE RECIPIENT ENTERPRISE
Where a JIP is proposed, what is the prospect that the enterprise will be viable in the long term or that the product lines or production methods will be continued into the future. In effect, to maximize the prospects for achieving and sustaining the GHG reductions, a financial audit of the enterprise should be conducted. Where there are alternative sites for the JIP project, an assessment of the relative advantages of alternative sites should be made.
NEXT STEPS
Poland has accumulated a substantial body of experience in carrying out environmental projects in cooperation with foreign sponsors. These projects are either bilateral or multilateral. For both types of assistance, Poland has established mechanisms to develop, assess, select and monitor projects financed through these types of assistance. These mechanisms are a natural starting point for identifying the types of mechanisms that might be appropriate for JI. As a rule, however, the sponsors of traditional assistance projects do not earn any credits towards fulfilling certain abatement objectives. Consequently, there was no need to develop formal principles of sharing benefits that might result from such projects. These rules will decisively influence the shape of the institution(s) established to carry out JI projects. Thus the experience gathered in the course of administering traditional cooperative projects may not be fully relevant in this case.
http://rcin.org.pl

Joint Implementation Projects to Reduce.. 119
CREATION OF A JOINT IMPLEMENTATION SECRETARIAT
The following are key organizational issues that need to be solved in order to devise an effective and efficient structure for JIPs called here tentatively "JIP Secretariat".
— Design performance criteria for the Secretariat. — Ensure the professional excellence of its staff. — Establish procedures for monitoring progress in implementing JI
projects and conducting evaluations of project results. — Establish a reporting structure with particular reference to the problem
of integration of interests of Poland and those of a donor country. — Establish proposal for sharing GHG emission reduction credits. — Develop procedures to tackle all the stages of project development
and administration. — Establish methods of cooperation with other Polish agencies with
responsibilities for administering or implementing projects. One way to proceed would be to attach the JI Secretariat to an existing
agency like the Ministry of Environmental Protection. By doing so a high level of integration with Poland's environmental programmes would be achieved. Likewise, the Secretariat could benefit from the experience of its host agency. At the same time, however, it might prove difficult in practice to work out performance criteria if the Secretariat were to be part of a larger organization charged with different tasks. Moreover, it may be difficult to ensure the professional excellence of the staff, especially if certain public sector rules (e.g. remuneration levels) were to be applied.
An alternative would be to create a new organization, preferably with the status of a foundation established by a government body (i.e. the Minister of Environmental Protection or the Minister of Industry). If properly designed, this new institution could then solve the problems of integration of foreign and Polish interests, as well as guarantee the professional excellence of its staff. One important objection that could be raised in this case is that there might be unnecessary duplication and overlap with other agencies.
A solution which has garnered support of the Minister of Environmental Protection is to locate the secretariat in the National Fund for Environmental Protection and Water Management. The National Fund has five years of experience in reviewing proposals and has the technical capabilities for reviewing JI proposals. Because GHG emissions fall outside the normal purview of the National Fund, it might be useful to establish a JI technical review board to comment on the GHG emission reduction benefits of proposed JIPs and provide input to the JI Secretariat on individual projects.
INTERGOVERNMENTAL COOPERATION ON JOINT IMPLEMENTATION
While JIPs will be implemented by individual enterprises and their donor counterparts, cooperation between Poland and donor governments will be a critical
http://rcin.org.pl

120 G. D. Anderson
component contributing to the success and legitimacy of JIPs. Three major types of cooperation are anticipated: (1) review of JIP documents; (2) inter-governmental negotiations; and (3) monitoring of implementation and dispute resolution.
REVIEW OF THE JIP PROPOSAL AND SUPPORTING DOCUMENTS
While it is likely that the JIP proposals will be prepared by donor companies and recipient enterprises in Poland, the donor government (or their designated agent) and the Government of Poland will have to review and approve the proposed JIP. In particular, the two parties must ensure that the proposed project satisfies the conditions enumerated for JIP by the COP. In addition, Poland will review the JIP in terms of the environmental and economic criteria discussed above, while the donor government will have established JIP criteria for its companies (particularly if the donor company will receive tax or other benefits for its role in the JIP). Like any investment proposal, the JIP proposal should define the objectives of the projects, enumerate benefits and costs including GHG credits, estimate anticipated GHG emission reductions, identify environmental, social, and economic impacts of the project, identify sources of funding, articulate the roles of the respective donor and recipient companies, and propose a monitoring protocol. The elements of the proposal will form the basis of negotiations between the two governments.
NEGOTIATIONS
There will be a number of issues that will need to be negotiated by the two countries. Most important will be the division of emission benefits resulting from the JIP. Comments provided to the FCCC Secretariat on JIP seem to imply that all of the GHG emission reductions realized by the project would be credited to the donor country. This viewpoint is unlikely to be shared by Poland or other recipient countries for a number of reasons. First, the assessment and implementation of JIP will involve costs for the recipient government and implementing company(ies). The introduction of new technologies may require recipient companies to share in the costs of investments (e.g., construction of buildings, modification of production lines, etc.) or result in new operating costs. Also, it may be difficult to precisely allocate emission reductions to donor contributions, necessitating negotiations on the relative shares. Even if the JIP is largely financed by the donor company and government, there may be compelling reasons for sharing the benefits. For example, a proposed JIP may open up new markets for the company in the donor country or the JIP might result in environmental benefits for the donor country (e.g., reduction of transboundary S02 emissions). After 2000, assuming donor countries are credited for JIP emission reductions and assuming that the costs per ton of GHG reductions for JIP are lower
http://rcin.org.pl

Joint Implementation Projects to Reduce.. 121
than comparable costs of actions in the donor country, there should be some basis for negotiating the distribution of credits between the two countries. This issue is complicated by the fact that a GHG credit programme has not been developed or endorsed by the COP.
Other issues that will be part of negotiations will include: (1) defining the respective roles of the donor and recipient governments and companies; (2) defining responsibilities and liabilities of the parties; (3) delineating sanctions for non-performance; (4) setting up an implementation schedule; and (5) determining procedures for the settlement of disputes.
MONITORING AND DISPUTE RESOLUTION
The donor and recipient governments will also be required to monitor implementation, conduct inspections, and review records and reports pertaining to the JIP. The governments may also be required to arbitrate disputes between the companies, and assess or issue sanctions. The two governments may be required to report on progress in implementing the JIP to the COP or other international body established to implement JIP worldwide.
AGREEMENTS BETWEEN THE GOVERNMENT OF POLAND AND IMPLEMENTING ENTERPRISES
While JI will be negotiated between the representatives of the donor and host countries, the JI projects will be implemented by individual private companies, state-owned enterprises, or regional/local governments. To ensure that implementors abide with the conditions specified in intergovernmental agreements on JI, the government of Poland will need to execute an agreement with the implementor specifying respective responsibilities of all parties for designing, assessing, implementing, and monitoring the project.
Since at least some part of the GHG emission reductions achieved by the JI project will be "credited" to the donor country (beyond the pilot project phase), monitoring protocols will be needed that allow the various parties and possibly an outside agency established under the FCCC to have access to the facility(ies) and records pertaining to the project. The agreement should also specify time frames, reporting and recordkeeping, sanctions for non-performance, processes for resolving disputes or clarifying analysis, and conducting inspections. The legal aspects of these agreements still need to be explored. A follow-up activity will be needed to draft model agreements and subject these agreements to scrutiny by experts on Polish Law.
ADDITIONAL TASKS
While the preceding sections provide background on JI and an introduction to issues that Poland must address prior to participation in JI projects, some additional legal and economic analysis is needed. In addition, further discussions within the government are needed to determine what organizational
http://rcin.org.pl

122 G. D. Anderson
form the JI secretariat might take and the scope of its activities. A list of additional tasks is provided below.
Task 1 — Examine legal aspects of intergovernmental cooperation on J I Discussion: A number of issues pertaining to intergovernmental cooperation
including the division of GHG emission credits, procedures for evaluating JI projects, definition of the roles of the various parties participating in the project, and monitoring responsibilities of the respective parties should be analyzed in greater detail.
Task 2 —Analyze possible relationships between the Government of Poland and J I project implementors and prepare model agreement(s)
Discussion: The government of Poland would be the signatory on JI projects and needs to develop or adopt legal agreements between the government and the Polish implementor of the JI project. A discussion of the elements to be included in these agreements, options for addressing issues of particular importance to the legality of the agreement, and examples of model agreements would be useful.
Task 3 — Assess GHG emission levels to the year 2000 under alternative policy scenarios to support discussion of additionality
Discussion: In order to judge whether a proposed JI project is additional, an assessment needs to be made on the likely effect of current policies and programmes — taking into consideration economic trends — on GHG emissions in the year 2000. This analysis is only required for review of JI projects during the pilot stage. In addition, it would be useful to develop a methodology for relating environmental and economic policies and programmes to GHG emission levels, taking into consideration general levels of economic performance. If JI projects are to be used beyond the pilot phase, it will be necessary to make additionality calculations several years before targets are to be achieved.
Task 4 — Develop environmental and economic criteria for selecting I approving J I projects
Discussion: A starting point for this analysis is a paper prepared by R. Ja-nikowski entitled "Joint Implementation in Poland: Criteria and Opportunities" that proposes a few criteria (though not exclusively for the host country). A set of criteria would be developed and analyzed and a few generic types of potential JI projects would need to be evaluated in terms of the criteria to better assess their usefulness.
http://rcin.org.pl

http://rcin.org.pl

I N S T R U C T I O N S T O A U T H O R S
Submission. Submit to the Editor on address given. The manuscript in duplicate must be typewritten in English or French, double-spaced (abstract and references triple-spaced) on one side only of International Standard Size A4 paper with a lefthand margin of 40 mm.
All articles are reviewed and they are expected to be original and not yet published elsewhere unless in other languages than stated above. Authors are responsible for submitting accurately typed manuscripts.
Along with typewritten version of the text please submit electronic version on floppy disk prepared as ASCII Code with possible export to ASCII Code with name extension TXT, i.e. Data Base TXT. Enclose the Disk Specification Form.
Tables, explanations of figures and notes should be on separate files with name extension. Pi-esentation. Manuscript should be arranged in the following order of presentation. First
sheet: title, author (authors) name, affiliation, full postal address, telephone, fax numbers. Same refers to all co-authors, if appropriate. Second sheet: Abstract of 100 words, Key words, 3-10. Subsequent sheets: Introduction, the text, conclusion (conclusions). Then on separate sheets: number one — acknowledgement (if desired); number two — notes; number three -— references.
Appendixes, tables, figures, captions to illustrations should be also given on separate sheets. Words or text passages should not be underlined.
Do not use indents. For paragraphs enter a line space. The main text may be organized in sections under approporiate heading without numerals.
All measurements should be given in metric units. Authors are expected to write as concisely as possible and avoid footnotes whenever possible.
References should be listed triple-spaced in one alphabetical sequence at the end of the text. Write name of author (authors), initials, date of publication in round brackets (), the publisher and place of publication. If applicable, indicate pages reffered to. Names of journals, in italics, abbreviated in accordance with International List of Abbreviations.
References should be indicated in text by giving, in parenthesis, the author's name followed by the data of the paper, publication, or book as (Smith 1992).
Use the form (Smith at al. 1994) where there are more than two autors, but list all authors in the references. Definite quotations should state the source and page number; i.g. (Smith 1994:58). Notes should be refered to by superscript letters.
Figures (e.g. all maps, graphs, diagrams, drawings in black and white colour, by laser printer or clear drawings in Indian ink on transparent paper) should be numered and prepared on separate sheets. Their position should be indicated in the text.
Equations and mathematical formulas-symbols used must be clearly explained. Axes should be clearly described, use only units and abbreviations approved by International List.
All illustrations — photographs and figures, submitted in duplicate — must be in a form suitable for reproduction, camera-ready. The exact drawn lines and clear symbols should allow for size reduction, if required, in print.
Authors are responsible for reservation of their proper copyright and the permission from the copyright holder to reproduce any texts, figures, illustrations for which copyrights exist.
Articles published in Geographia Polonica are not financially honoured. Each author of the article receives after publication one copy of the journal free of charge.
http://rcin.org.pl

RECENT VOLUMES GEOGRAPHIA POLONICA
Subscription orders for the GEOGRAPHIA POLONICA should be placed with
ARS POLONA 00-068 Warszawa, Krakowskie Przedmieście 7, Poland
Cables ARS POLONA, Warszawa