l-b-systemtechnik contribution to aspo-workshop 2003, paris renewable energy in europe - past and...
Post on 18-Dec-2015
214 views
TRANSCRIPT

L-B-Systemtechnik
Contribution to ASPO-Workshop 2003, Paris
Renewable Energy in Europe - past and FutureJuly 27, 2003 Paris
Dr. Werner Zittel, L-B-Systemtechnik GmbH, Germany
- Development over the past decade and trend extrapolations
- Renewables and transport sector

L-B-Systemtechnik
Renewable Energy in Europe - past and Future
• Most official energy forecasts extrapolate „business as usual scenarios“
• If no structural problem in conventional energy supply is perceived, there is no need to change to renewable fuels
• Under present economic conditions renewable energy sources are uneconomic or marginally economic (neglecting external costs and subsidies of fossil and nuclear fuels)
• However, if climate change is a real issue, if nuclear has serious problems and if oil becomes a scarce commodity, economic conditions will change in favor of renewable energy technologies

L-B-Systemtechnik
Renewables and the Energy Sector - a different view
• If oil production will peak soon, this will have serious consequences on economy and energy prices
• In contrast to 1980, energy efficiency as well as renewable energy is at a much more sophisticated technological and economic level which allows for market introduction on a broad scale
• The future will show which perspective is closer to reality: The IEA-forecast or the LBST-forecast! It is not unlikely that future energy supply develops as seen by LBST:

L-B-Systemtechnik
Renewables and the Energy Sector - a differentl view!
90 Mbpd
75 Mbpd80 Mbpd
2020: IEATPES 13500oil 39 %gas 26 %coal 25 %nuclear 5 %solar 5 %

L-B-Systemtechnik
Renewables and the Energy Sector - a differentl view!
90 Mbpd
75 Mbpd80 Mbpd
: BP Statistical Review of World Energy
2020: IEATPES 13500oil 39 %gas 26 %coal 25 %nuclear 5 %solar 5 %

L-B-Systemtechnik
Renewables and the Energy Sector - a differentl view!
90 Mbpd
75 Mbpd80 Mbpd
: BP Statistical Review of World Energy
: LBST most likely forecast
2020: IEA LBSTTPES 13500 12500oil 39 % 25 %gas 26 % 33 %coal 25 % 14 %nuclear 5 % 5%solar 5 % 23 %
coal

L-B-Systemtechnik
0
100000
200000
300000
400000
1980 1990 2000 2010 2020
UK
Sweden
Spain
Portugal
Netherlands
Luxembourg
Italy
Ireland
Greece
Germany
France
Finland
Denmark
Belgium
Austria
GWhel
EU-Electricity Production 2002: ~ 2500 TWh
EU-15: Electricity from hydro power
OECD Energy balances
~12 % of
Change of statistical base

L-B-Systemtechnik
0
100000
200000
300000
400000
1980 1990 2000 2010 2020
UK
Sweden
Spain
Portugal
Netherlands
Luxembourg
Italy
Ireland
Greece
Germany
France
Finland
Denmark
Belgium
Austria
GWhel
EU-Electricity Production 2002: ~ 2500 TWh
EU-15: Electricity from hydro power - adapted
OECD Energy balances
~12 % of
Change of statistical base (corrected)
Statisticsunclear

L-B-Systemtechnik
EU-15 Electricity Production from Wind energy
• In the 1980ies, Denmark started to establish a wind energy industry Today the Danish wind energy industry has more employees than the ship building industry
• In the 1990ies, Germany supported the wind energy industry by feed-in rules [Renewable Energy Act] which gave marginal earnings (at favorable sites and with good planning the return on investment is reasonable, at poor sites or with poor management the return on investment is negative)
• Most European Countries have not yet even started to use its wind energy potentials
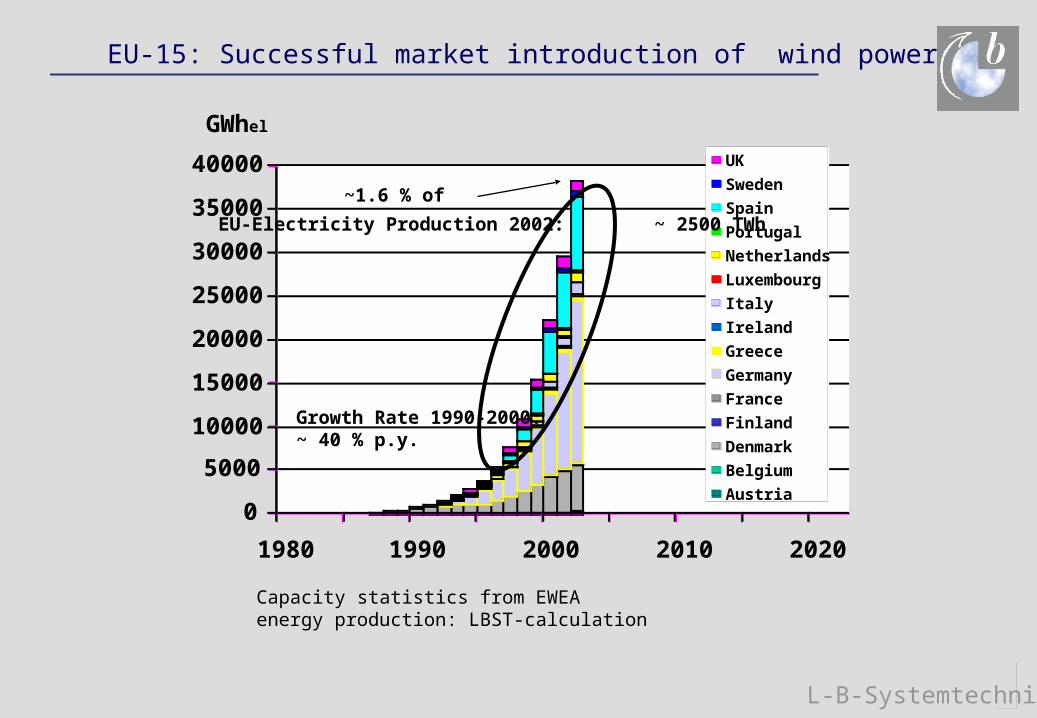
• Even under „poor“ economic conditions wind energy has growth rates at about 40 percent p.y. since more than a decade. Already today the share of wind energy in electricity generation is above 1.5 %.
• As soon as even pure market economics are in favor of wind energy, the growth rates could enhance and swap over to those countries with vast resources

L-B-Systemtechnik
0
5000
10000
15000
20000
25000
30000
35000
40000
1980 1990 2000 2010 2020
UK
Sweden
Spain
Portugal
Netherlands
Luxembourg
Italy
Ireland
Greece
Germany
France
Finland
Denmark
Belgium
Austria
GWhel
Growth Rate 1990-2000: ~ 40 % p.y.
EU-Electricity Production 2002: ~ 2500 TWh
EU-15: Successful market introduction of wind power
Capacity statistics from EWEAenergy production: LBST-calculation
~1.6 % of

L-B-Systemtechnik
0
5000
10000
15000
20000
25000
30000
35000
40000
1980 1990 2000 2010 2020
UK
Sweden
Spain
Portugal
Netherlands
Luxembourg
Italy
Ireland
Greece
Germany
France
Finland
Denmark
Belgium
Austria
GWhel
Growth Rate 1990-2000: ~ 40 % p.y.
EU-15: Successful market introduction of wind power
Capacity statistics from EWEAenergy production: LBST-calculation
Equivalent tooil field with 200 kb/dayor 1.4 Gb size

L-B-Systemtechnik
EU-15: How much wind energy is it?
• In 2002 Europe added wind capacity which was five times as much as that of an average nuclear plant.
• The electricity generated in 2002 will be equal to that of five nuclear power plants
• If this amount would be produced from oil fired power plants, it would consume 75 mio barrel/year or 200 kb/day.
• Over 20 years life time this saves about 1.5 Gb of oil
• Planning times of new wind parks are in the range of 2 - 3 years before grid connection is achieved
• Within the last ten years 40 TWh/yr electricity from wind are added. This is equivalent to the planning, construction and connection of five large nuclear power plants. Would it be possible, to add five nuclear power plants within ten years (including planning, construction and grid connection)?

L-B-Systemtechnik
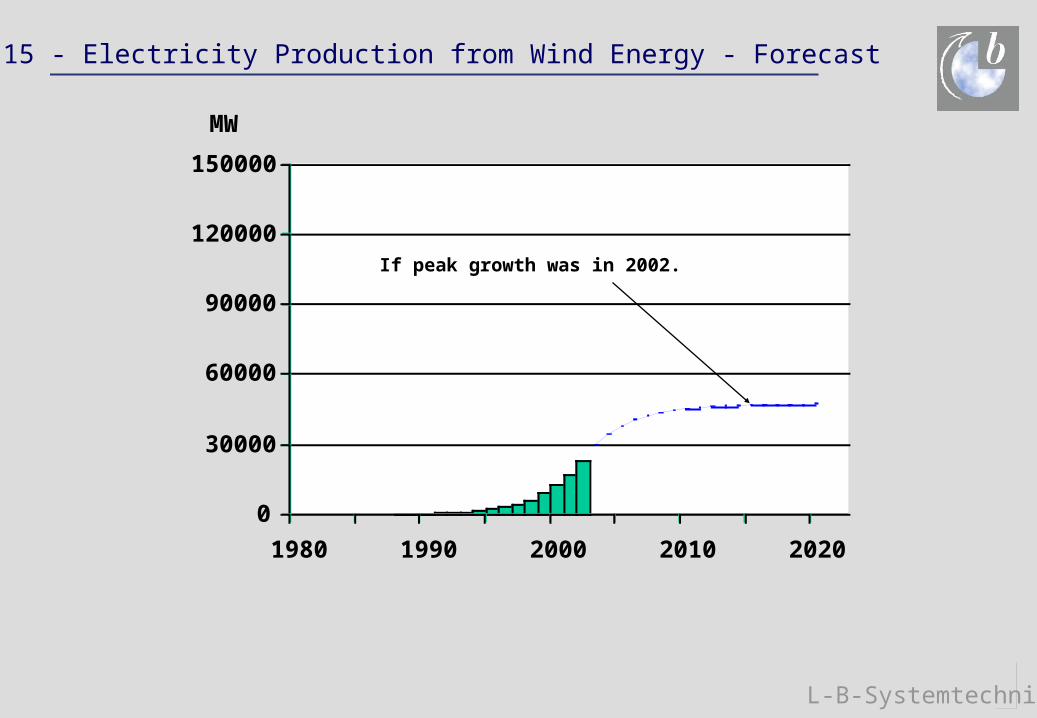
EU 15 - Electricity Production from Wind Energy - Forecast
•If 2002 would mark the peak year of new wind capacity additions and the decline would be symmetric to the growth, then wind energy in Europe would end up with about 4 percent share on electricity production •The European Wind Energy Association expects wind energy to contribute about 5 % of EU-15 electricity supply until 2010 and above 10 percent until 2020. This is equivalent to 16 % annual growth
• The actual growth rate is even twice as much (35 % p.y.)
L-B-Systemtechnik
0
30000
60000
90000
120000
150000
1980 1990 2000 2010 2020
MW
If peak growth was in 2002.
EU 15 - Electricity Production from Wind Energy - Forecast

L-B-Systemtechnik
0
30000
60000
90000
120000
150000
1980 1990 2000 2010 2020
MW
35 % p.a.
EU 15 - Electricity Production from Wind Energy - Forecast
If present growth continues

L-B-Systemtechnik
0
30000
60000
90000
120000
150000
1980 1990 2000 2010 2020
MW
35 % p.a.
EWEA-Target2000
Onshore
offshore
EU 15 - Electricity Production from Wind Energy - Forecast

L-B-Systemtechnik
0
30000
60000
90000
120000
150000
1980 1990 2000 2010 2020
MW
16 % p.a.
35 % p.a.
EWEA-Target2000
Onshore
offshore
Share on EU-Electricity Production 5 %
EU 15 - Electricity Production from Wind Energy - Forecast

L-B-Systemtechnik
Worldwide wind energy capacity
• Forecasts by the IEA for oil, gas or nuclear energy were always much too optimistic Forecasts by the IEA for renewable energy are always bullish pessimistic
• The IEA World Energy Outlook 1998 forecast for the year 2010 could be proofed to be wrong almost three years after its publication
• With respect to the IEA world energy outlook 2002 forecast even at end 2002 reality was about five years ahead of the forecast
• In 1999 BTM consult published a road map for achieving a share of 10 percent on world electricity production in 2020 by wind energy. („Windforce ten“) Already in 2002 the reality is ahead of that road map

L-B-Systemtechnik
0
20
40
60
80
100
120
140
160
180
200
1980 1990 2000 10 20
GW
Reality 1997
IEA World Energy Outlook 1998
Worldwide wind energy capacity

L-B-Systemtechnik
0
20
40
60
80
100
120
140
160
180
200
1980 1990 2000 10 20
IEA World Energy Outlook 1998
Reality 1999
GW
Worldwide wind energy capacity

L-B-Systemtechnik
0
20
40
60
80
100
120
140
160
180
200
1980 1990 2000 10 20
IEA World Energy Outlook 1998
Reality 1999
GW
Windforce 10 (202010 % electricity share)[1999]
Worldwide wind energy capacity

L-B-Systemtechnik
0
20
40
60
80
100
120
140
160
180
200
1980 1990 2000 10 20
IEA World Energy Outlook 1998
Reality 1999
GW
IEA World Energy Outlook 2002
Windforce 10 (202010 % electricity share)[1999]
Worldwide wind energy capacity

L-B-Systemtechnik
0
20
40
60
80
100
120
140
160
180
200
1980 1990 2000 10 20
IEA World Energy Outlook 1998
Reality 2002
GW
IEA World Energy Outlook 2002
Windforce 10 (202010 % electricity share)[1999]
1% share ofelectricity production
Worldwide wind energy capacity

L-B-Systemtechnik
EU-15 Electricity Production from Biomass
• Sweden, Finland and Austria have the largest share of biomass in electricity production
• The growth rate in Finland was about 10 % annually
• The share of biomass in electricity generation is about 1.1 percent
• In latest years biomass gasification helped to increase the share

L-B-Systemtechnik
0
5000
10000
15000
20000
25000
30000
35000
40000
1980 1990 2000 2010 2020
GWhel
Growth Rate 1990-2000: ~ 10 % p.y.
Austria
Finland
Sweden
EU-15: Successful market introduction of Biomass
Source: 1989-2000 OECD Statistics 2002 2001/2002 various country statistics from national instituts
and own estimates
~1.1 % of
Germany
UK
EU-Electricity Production 2002: ~ 2500 TWh

L-B-Systemtechnik
0
20000
40000
60000
80000
100000
120000
140000
160000
180000
200000
1980 1990 2000 2010 2020
GWhel
Growth Rate 1990-2000: ~ 10 % p/yr
EU-Electricity Production 2002: ~ 2500 TWh
10 % p.y.
7 % p.y.
20 % p.y.
Share on EU-Electricity Production 5 %
EU-15 Electricity Production from Biomass - Forecast

L-B-Systemtechnik
EU-15 Electricity Production from Photovoltaics
• The growth of PV was largest in Germany over the last decade (~ 30 %) Since the existence of the feed-in law in 1999 the growth rate increased strongly
• Today, installed PV capacity in Germany is at the same level as wind energy was ten years ago
• The costs of grid connected PV systems have reduced by a factor of three over the last 15 years and today are close to 0.6 EUR/kWh in middle Europe. Since the introduction of the German feed in law in 1999 total cost of grid connected PV reduced by about 15 percent or 5 percent annualy.
• Presently, BP alone employs more than 1000 employees in the PV business

L-B-Systemtechnik
0
100
200
300
400
500
600
700
800
900
1000
1980 1990 2000 2010 2020
GWhel
Growth Rate 1991-2000: ~ 20-30 % p.a.
EU-Electricity Production 2002: ~ 2500 TWh
Germany
PV-Share on Electricity Production in 2002: ~ 0,012 %
EU-15: Beginning market introduction of photovoltaics
20 % p.a.
30 % p.a.
Capacity statistics from various statistical sourcesenergy production: LBST-calculation

L-B-Systemtechnik
EU-15 Electricity Production from Photovoltaics - Forecast
• BP expects to reduce costs by another factor of two within next five years Shell expects annual cost reductions by 5 - 6 percent
• RWE Schott Solar expects 15-18 percent cost reduction with each doubling of production volume.
• Swiss bank Sarassin expects the growth rate of PV to increase substantially over the next few years (comparable to the cellular phone or PC market in the last years)
• If the growth rate over the next ten years is the same as the growth rate of wind energy over the past ten years, PV will contribute more than 1 percent to EU electricity in 2010

L-B-Systemtechnik
0
25000
50000
75000
100000
125000
150000
1980 1990 2000 2010 2020
GWhel
Growth Rate 1991-2000: ~ 20-30 % p.a.
EU-Electricity Production 2002: ~ 2500 TWh 40 % p.a.
20 % p.a.
Share on EU-Electricity Production 1 %
Share on EU-Electricity Production 5 %
50 % p.a.
EU-15 Electricity Production from Photovoltaics - Forecast
30 % p.a.

L-B-Systemtechnik
Cum. Photovoltaics worldwide 2002
0
500
1000
1500
2000
2500
3000
1975 1980 1985 1990 1995 2000
MW
Jahr
Quelle: WWI 1993; Sonnenergie & Wärmetechnik 1/98, Photon 1/98
0
50
100
150
200
250
300
1980 1985 1990 1995 2000 2005
BRD
worldVdEW 95
Substitutes 30 kb/dayoil sourcesor 300 Mb
field size

L-B-Systemtechnik
EU-15 Electricity Production from Geothermal Energy
• Electricity production from geothermal grew about 3 percent annually
•Today only Portugal, France and Italy use geothermal electricity
• New methods (e.g. hot-dry rock; ORC electricity generation) open a huge potential for electricity generation
• The Geothermal Society expects electricity generation from geothermal sources at 16 TWh in 2010 and between 24 - 64 TWh in 2020 (Ferrara- Declaration 1999)

L-B-Systemtechnik
0
1000
2000
3000
4000
5000
6000
7000
8000
9000
10000
1980 1990 2000 2010 2020
GWhel
Growth Rate 1991-2000: ~ 3 % p.a.
EU-Electricity Production 2002: ~ 2500 TWh
Italy
Geothermal-Share on Electricity Production 2000: ~ 0,17 %
Portugal Growth Rate 1991-1998: ~ 30 % p.a.
3 % p.a.
5 % p.a.
EU-15 Electricity Production from Geothermal Energy

L-B-Systemtechnik
EU-15 Electricity Production from All Renewables 2002
0
50
100
150
200
250
300
350
400
450
renewable electricity
Geothermal
Solar
Biomass
Wind
Hydro
TWh/yr
~16 % share of electricity consumption

L-B-Systemtechnik
EU-15 Electricity Production from All Renewables
• Today Renewable Electricity supply has a share of 14 - 15 percent
• If present trends continue for the next 20 years, this share will increase to more than 20 percent in 2010 and to more than 50 percent in 2020 (provided total electricity supply will remain constant; note that this holds even when hydro is kept constant and when wind energy will rise at half of its historical growth rate)
• If trends of „best practice countries“ apply to all EU countries this share could rise even faster

L-B-Systemtechnik
0
500
1000
1500
1990 2000 2010 2020
TWhel
Hydro 0 % p.a.
Wind 17 % p.a.
Biomass 7 % p.a.
Solar 30 %p.a.Geothermal 3 %p.a.
0
500
1000
1500
2000
2500
1990 2000 2010 2020
TWhel
EU-15 Electricity Production from All Renewables - Two scenarios
Precautious Trend extrapolation
Market introductionof wind power
Hydro 0 % p.a.
Wind 20 % p.a.
Biomass 10 % p.a.
Solar 40 %p.a.
Geothermal 30 %p.a.
EU-Electricity Production 2002: ~ 2500 TWh
Optimistic Trend extrapolation from „best practice“ countries

L-B-Systemtechnik
0
500
1000
1500
1990 2000 2010 2020
TWhel
Hydro 0 % p.a.
Wind 17 % p.a.
Biomass 7 % p.a.
Solar 30 %p.a.Geothermal 3 %p.a.
0
500
1000
1500
2000
2500
1990 2000 2010 2020
TWhel
EU-15 Electricity Production from All Renewables - Two scenarios
Precautious Trend extrapolationMarket penetration of wind power
Market introductionof wind power
Hydro 0 % p.a.
Wind 20 % p.a.
Biomass 10 % p.a.
Solar 40 %p.a.
Geothermal 30 %p.a.
EU-Electricity Production 2002: ~ 2500 TWh
Optimistic Trend extrapolation from „best practice“ countries

L-B-Systemtechnik
0
500
1000
1500
1990 2000 2010 2020
TWhel
Hydro 0 % p.a.
Wind 17 % p.a.
Biomass 7 % p.a.
Solar 30 %p.a.Geothermal 3 %p.a.
0
500
1000
1500
2000
2500
1990 2000 2010 2020
TWhel
EU-15 Electricity Production from All Renewables - Two scenarios
Precautious Trend extrapolationMarket penetration of wind power and biomass
Market introductionof wind power
Hydro 0 % p.a.
Wind 20 % p.a.
Biomass 10 % p.a.
Solar 40 %p.a.
Geothermal 30 %p.a.
EU-Electricity Production 2002: ~ 2500 TWh
Optimistic Trend extrapolation from „best practice“ countries
Market introductionof solar electricity

L-B-Systemtechnik
0
500
1000
1500
1990 2000 2010 2020
TWhel
Hydro 0 % p.a.
Wind 17 % p.a.
Biomass 7 % p.a.
Solar 30 %p.a.Geothermal 3 %p.a.
0
500
1000
1500
2000
2500
1990 2000 2010 2020
TWhel
EU-15 Electricity Production from All Renewables - Two scenarios
Precautious Trend extrapolationMarket penetration of wind power and biomass
Market introductionof wind power
Hydro 0 % p.a.
Wind 20 % p.a.
Biomass 10 % p.a.
Solar 40 %p.a.
Geothermal 30 %p.a.
EU-Electricity Production 2002: ~ 2500 TWh
Optimistic Trend extrapolation from „best practice“ countries
Market penetration of solar and geothermalelectricity ?Market introduction
of solar electricity

L-B-Systemtechnik
EU-15 Thermal End Use Energy Supply by Biomass
• Contribution of biomass to thermal energy supply is about 6 %.
• The annual growth rate varies between 2 - 5 percent annually
• At present growth rate this could increase to 10-20 percent in 2020

L-B-Systemtechnik
0
250000
500000
750000
1000000
1250000
1500000
1980 1990 2000 2010 2020
GWhth
Growth Rate 1991-1998: ~ 2 % p.a.
Thermal End Use Energy Demand 2000: ~ 6000 TWh
5 % p.a.Growth Rate
Share on EU Themal Energy Demand 10 %
10 % p.a.Growth Rate
2 % p.a.Growth Rate
EU-15 Thermal End Use Energy Supply by Biomass
~0.77 Mb/day

L-B-Systemtechnik
EU-15 Thermal End Use Energy Supply by Solar Energy
• Average growth rate of Solar thermal energy use is about 10 % annually
• In Greece Solar thermal energy has a much higher share than in Italy, Portugal or Spain with comparable solar isolation. This is mainly due to different political support
• The contribution in 2020 could rise to between 0.5 - 3 % if present trends continue (lower figure 10 % annual growth rate, upper figure 20 % annually)

L-B-Systemtechnik
0
2000
4000
6000
8000
10000
1980 1990 2000 2010 2020
GWhth
Growth Rate 1991-2000: ~ 10 % p.a.
Solar Share on Thermal End Use EnergySupply 2002: ~ 0,095 %
Thermal End Use Energy Demand EU 2000: ~ 6000 TWh
2002-Zahlen: LBST-Schätzung mit BRD-Zahlen aus SW&T1/02
EU-15 Thermal End Use Energy Supply by Solar Energy
Capacity statistics from various statistical sourcesenergy production: LBST-calculation
~10 kb/day

L-B-Systemtechnik
0
2000
4000
6000
8000
10000
1980 1990 2000 2010 2020
GWhth
Growth Rate 1991-2000: ~ 10 % p.a.
Solar Share on Thermal End Use EnergySupply 2002: ~ 0,095 %
Thermal End Use Energy Demand EU 2000: ~ 6000 TWh
Growth Rate in Germany1991-2000: ~ 20 % p.a.
Growth Rate in Austria1991-2000: 15 % p.a.
Greece
2002-Zahlen: LBST-Schätzung mit BRD-Zahlen aus SW&T1/02
EU-15 Thermal End Use Energy Supply by Solar Energy
Capacity statistics from various statistical sourcesenergy production: LBST-calculation
~10 kb/day

L-B-Systemtechnik
The Potential of Renewable Energy in the European Community
• At the present growth rate, renewable energy will rise to a share of about 10 percent of thermal energy use in 2020
• At growth rates applicable to „best practice“ countries the share could rise to about 20 - 25 %
• On the other hand: Thermal energy is mainly used in buildings where in general the highest potential for increased efficiency exists

L-B-Systemtechnik
The Potential of Renewable Energy in the European Community
0
500
1000
1500
2000
2500
3000
1990 2000 2010 2020
Biomasse 5% p.a.
Solar 20 %p.a.Geothermal 10 % p.a.
TWh th0
500
1000
1500
2000
2500
3000
1990 2000 2010 2020
Biomass 2 % p.a.
Solar 15 %p.a.Geothermal 3 %p.a.
EU-thermal energy demand 2002: ~ 6000 TWh

L-B-Systemtechnik
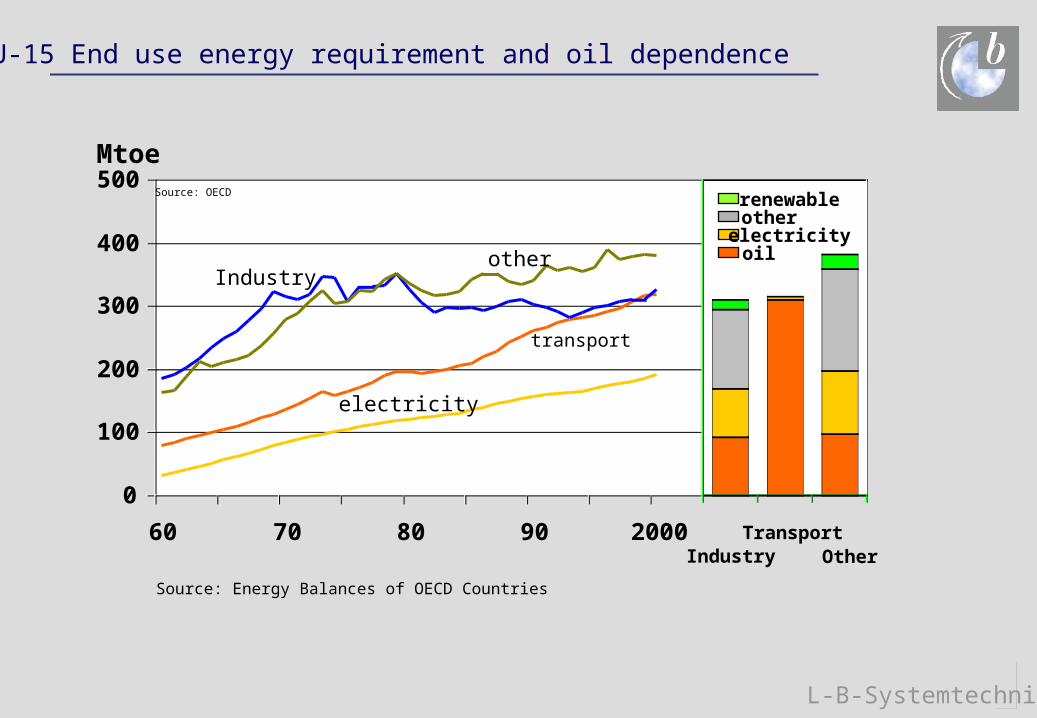
EU-15 End use energy requirement and oil dependence
• The industry learned from the 1970ies oil crises to reduce its energy consumption
• Only the transport sector grew steadily over the last 40 years
• The share of electricity on final energy supply is rising
• The transport sector is most vulnerable to oil supply disruptions
• The whole industry depends on cheap transport („just in time“ is cheaper than large store houses)
L-B-Systemtechnik
0
500
0
100
200
300
400
500
60 70 80 90 2000
EU-15 End use energy requirement and oil dependence
otherIndustry
transport
Source: OECD
Mtoe
electricity
IndustryTransport
Other
renewableotherelectricityoil
Source: Energy Balances of OECD Countries

L-B-Systemtechnik
0
500
0
100
200
300
400
500
60 70 80 90 2000
EU-15 End use energy requirement and oil dependence
otherIndustry
transport
Source: OECD
Mtoe
electricity
IndustryTransport
Other
renewableotherelectricityoil
Source: Energy Balances of OECD Countries
Transport (only Germany)
-1.5 % p.yr.

L-B-Systemtechnik
EU- oil consumption in Transport and scenario for future reductions
Assumption:
• Each year ten percent of cars are replaced
• The average fuel consumption of new cars reduces by x percent with respect to the preceeding year
• In Germany the average fuel consumption of all passenger cars grew from 8.1 l/100km in 1960 to ~10 l/100km in 1975; it was almost constant until 1985 and reduced to 9.4 l/100 km in 1990 and to ~8.5 l/100 km in 2000. However most of this was offset by higher traveling volumes.

L-B-Systemtechnik
0
100
200
300
400
60 70 80 90 2000 10 20
Mto
Assumptions- Average life time of cars 10 years- each year fossil fuel consumption of all new cars decreases by x %
X=0.5 %
Fuel consumption of new carsin 2020 with respect to 2000 fuel consumption
90 %Oil consumptionof Traffic
EU- oil consumption in Transport and scenario for future reductions

L-B-Systemtechnik
0
100
200
300
400
60 70 80 90 2000 10 20
Mto
Assumptions- Average life time of cars 10 years- each year fossil fuel consumption of all new cars decreases by x %
X=0.5 %
X=1 %
X=5 % X=2 %
Fuel consumption of new carsin 2020 with respect to 2000 fuel consumption
37 %
67 %
82 %90 %
Oil consumptionof Traffic
EU- oil consumption in Transport and scenario for future reductions

L-B-Systemtechnik
0102030405060708090
100
70 80 90 2000
01002003004005006007008009001000
Transport oil consumption: USA / Germany
Germany
USA
Mtoe / Germany Mtoe / USA
Oil crisis
Germanunification
1st gulf war
Source: OECD-Statisticssince 2000: USA-DoE; Germany- MWV (2003 data extrapolated from January-April)
year
-1.5 % p.yr.
L-B-Systemtechnik
Technical Potentials of Renewable Energy Sources in the EU
• The potential for biomass includes only biogenic waste, residues and sludge
• The wind power potential minimum includes offshore sites up to 10 km distance from cost line and 10 m water depth
• The wind power potential maximum includes offshore sites up to 30 km distance from cost line and 30 m water depth
• The PV potential minimum includes only roof mounted solar cells
• The PV potential maximum includes facade mounted modules
• The Solar Thermal potential includes only sites south of 40 °

L-B-Systemtechnik
0
500
1000
1500
2000
2500
3000
3500
4000
min max min max Hydro min max min max SOT
Forest ResidueIndustrial Wood Res.
Lower Value
Upper Value
Wind onshore
Wind offshore
Straw Residue
*
* still to tap potential in the EU** only EU
**
Agriculture
Bio Waste
SludgeconventionalTidal Power
Biogas(Methane)
Biomass Wind Power
TWh/aEU Electricity Consumption 2002: 2.478 TWh(Source: IEA 2002)
(Biomass: Thermal Energy; Hydro Power, Wind, PV und SOT: Electric Energy)
Technical Potentials of Renewable Energy Sources in the EU
Wood Residues, other
PV
Roof mounted
Roof mounted+ house frontswith todays technology
Technological Progress

L-B-Systemtechnik
Future fuels for cars
Renewable Fuel: - hydrogen - electricity - Biofuels
Future Challanges: - reduction of demand - change of mode (modal split) - downsizing of cars
- hybrid vehicles - switch to renewable fuel

L-B-Systemtechnik
0
500
1000
1500
2000
2500
3000
3500
Demand min max min max min max min max min max min max
TWh/a
(Transport)1998 *
Road Transport
Aviation
Rail Transport
Inland Navigation
Wood and Straw Residues
*Source: IEA-Statistics 1997-1998
Via Biogas
Biogas(Methane)
Hydrogen(pressurized)
Methanol Synfuel
Plant Oil Ethanol fromLignocellulose
Cultivation (fast growing plants)
Potentials show possible alternatives and cannot be added.Available area for cultivation of energy plants in the EU: 3,3 - 26,4 Mio ha
Technical Potentials: Fuels derived from Biomass in the EU - range

L-B-Systemtechnik
Comments on the available area for cultivation for the growing of energy plants:
• The upper value (26.4 Mio ha) assumes an increased intensification of agricultural production (FfE 1998).
• A further intensification of agricultural production is not sustainable. Therefore the EU aims at extensification.
• Oil plants: The share of rape seed may not exceeed 25% within the rotation cycle of a given crop. With biological agriculture method this limit is lower.
• An assignment of 26.4 Mio ha to the growing of energy plants would represent 30% of the arable land in the EU
• The area not cultivated (laid off) at present has a size of about 7.2 Mio ha (FfE 1998).
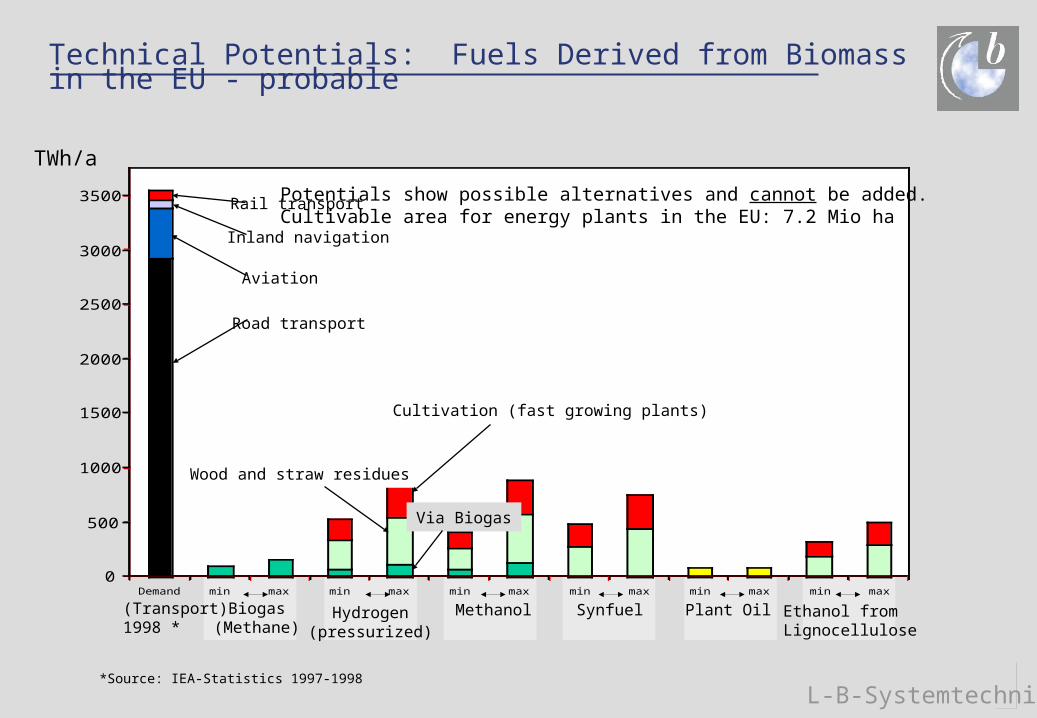
Technical Potentials: Fuels Derived from Biomass in the EU
L-B-Systemtechnik
0
500
1000
1500
2000
2500
3000
3500
Demand min max min max min max min max min max min max
TWh/a
(Transport)1998 *
Road transport
Aviation
Rail transport
Inland navigation
Wood and straw residues
*Source: IEA-Statistics 1997-1998
Via Biogas
Biogas(Methane)
Hydrogen(pressurized)
Methanol Synfuel Plant Oil Ethanol fromLignocellulose
Cultivation (fast growing plants)
Potentials show possible alternatives and cannot be added.Cultivable area for energy plants in the EU: 7.2 Mio ha
Technical Potentials: Fuels Derived from Biomass in the EU - probable
L-B-Systemtechnik
Technical Potentials: Fuels Derived from Renewable Electricity (EU)
Warning: The following technical potential does not take care of alternative use of the renewable source.

L-B-Systemtechnik
0
1000
2000
3000
4000
min max min max min max
[TWh/a]
Technical Potentials: Fuels Derived from Renewable Electricity (EU)
Wind on-shore
Wind off-shore
1) Source: IEA-Statistics 1997-19982) still to tap potential3) within the EU
Road transport
Aviation
Inland navigation
Rail transport
Hydro power2)
PV (roofs)
Solar thermalpower stations 3)
Consumption(Transport)
1998 1)
CGH2 LH2Methanol
PV (+house fronts)
PV (+new technology)

L-B-Systemtechnik
0
50
100
150
200
250
300
350
400
450
GasolineDiesel
Methanol NG
Methanol Wood ResidueCNG, p(in) = 0,1 MPaCNG, p(in) = 4,0 MPa
LNGCGH2 NG
CGH2 Wood ResidueCGH2 Wind off-shore
LH2 NG
LH2 Wood ResidueLH2 Wind off-shore
LH2 SOT
LH2 Geothermal
CO2-Equivalent [g/kWh]
Tank-to-wheel
Well-to-tank
Hydrogen / Methanol: Green-House-Gas Emissions (CO2-Equivalents)

L-B-Systemtechnik
0
0,05
0,1
0,15
0,2
0,25
GasolineDiesel
Methanol NG
Methanol Wood Residue
CGH2 NG
CGH2 Wood ResidueCGH2 Wind off-shore
LH2 NG
LH2 Wood ResidueLH2 Wind off-shore
LH2 SOT
LH2 Geothermal
Fuel Costs [EUR/kWh]
Tax
Without Tax
Hydrogen / Methanol: Fuel Costs

L-B-Systemtechnik
Fuel Costs and GHG Emissions of Compressed Gaseous Hydrogen (EU)
0
100
200
300
0 1 2 3 4
Costs [EUR/lgasoline equivalent]
CO 2
- eq
uiv
ale
nt [g
/kW
h]
gasoline/diesel
without With tax
CGH2 from...
Biomass
Hydro
Windpoweroffshore
Solarthermal
Source: LBST, 2001 0.5 1.0 1.5 2.0
L-B-Systemtechnik
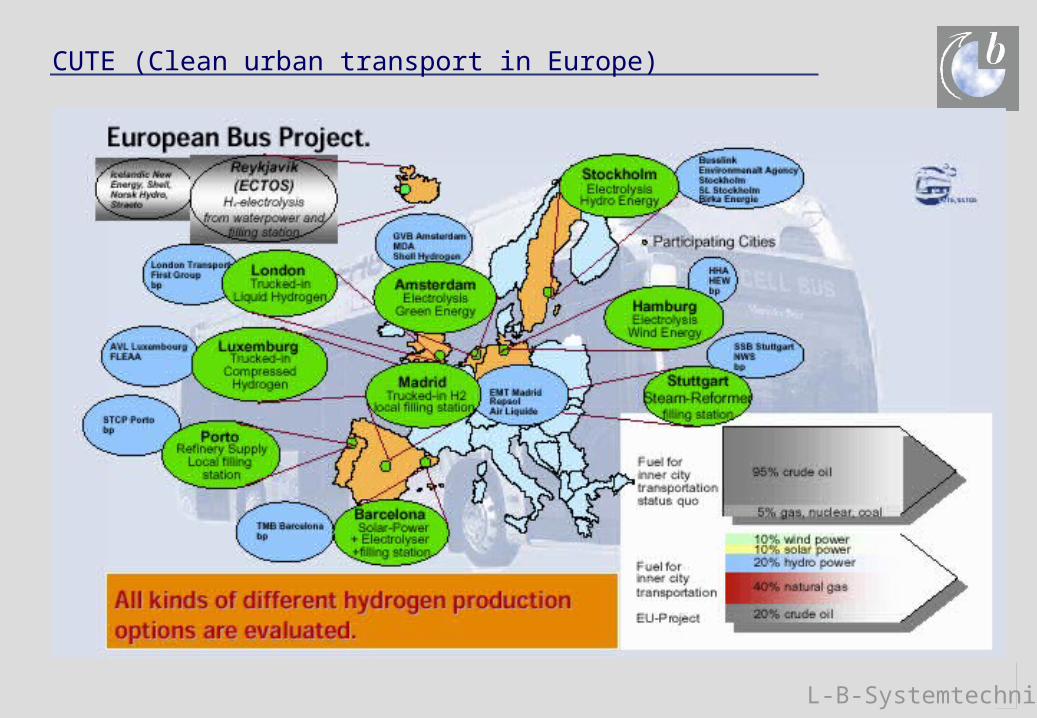
CUTE (Clean urban transport in Europe)

L-B-Systemtechnik
CUTE (Clean urban transport in Europe)

L-B-Systemtechnik
Hydrogen filling stations in Europe
BVG/TFE Berlin LH2 and 25 MPa CGH2
H2 Vehicle Demonstration at Munich Airport[Source: H2MUC 1999]
Reykjavik, April 2003
Mainz, 70 MPa, by Linde, April 2003
Oct 2002
CEP BerlinLH2 and 70 MPa CGH2
Summer 2003

L-B-Systemtechnik
0
1
2
3
4
5
6
7
1989 1991 1993 1995 1997 1999 2001 2003
Boe/day
Hydrogen fuel consumption for Transport - Europe
Spring 2003: 19 fueling stationsSpring 2004 27 fueling stations

L-B-Systemtechnik
Summary
• The growth of renewables in Europe was different in all countries due to different political support
•Simple trend extrapolation exhibits that at present growth rates about 20 percent of electricity will be renewable in 2010. This share would rise to about 50 percent in 2020
• Even in countries supporting renewables they are still close to „being marginally economic“. As soon as market economics change (e.g. by passing oil peak production) the growth rates could enhance
• The potential is sufficient to ensure a 100 percent renewable energy supply
• The transport sector will be hit strongest by oil scarcity. Introduction of new fuels is most urgent but also most difficult here
• The future will show which growth rates will be realised and which energy mix will be achieved
• Detailed strategies exist how to substitute fossil and nuclear fuels completely by 2050 [e.g. EU financed LTI-Study 1998]