l-30 briefing – november 10, 2016 - nasa · national aeronautics and space administration. l-30...
TRANSCRIPT

National Aeronautics and Space Administration
L-30 BRIEFING – NOVEMBER 10, 2016
PRESS KIT

2 | P a g e
Table of Contents
Media Contacts ................................................................................................................................... 3
Press Release ...................................................................................................................................... 4
Quick Facts .......................................................................................................................................... 6
CYGNSS Mission Overview .............................................................................................................. 8
Microsatellite Observatories ............................................................................................................ 9
Estimation of Ocean Surface Wind Speed ................................................................................... 11
Flight Plan .......................................................................................................................................... 13
CYGNSS Ground System1............................................................................................................... 15
NASA Explores Our Home Planet ................................................................................................. 18
CYGNSS on the Leading Edge of Innovation .............................................................................. 19
Contributions to the information contained within this document have been provided courtesy of the members of the CYGNSS project team. Cover Art: Courtesy of NASA.

3 | P a g e
Media Contacts
National Aeronautics and Space Administration Sean Potter Office of Communications NASA Headquarters, Washington, DC (202) 358-1536 [email protected] Joe Atkinson NASA Langley Research Center, Hampton, Virginia (757) 864-5644 [email protected] George Diller NASA Kennedy Space Center (321) 861-7643 [email protected]
University of Michigan Frank J. Marsik University of Michigan, Ann Arbor, MI (734) 763-5369 [email protected] E.J. Olsen University of Michigan, Ann Arbor, MI (734) 764-5235 [email protected]
Southwest Research Institute Maria M. Stothoff Southwest Research Institute, San Antonio, TX (210) 522-3305 [email protected]
Orbital ATK Trina Helquist Orbital ATK, Chandler, AZ (480) 814-6504 [email protected]
4 | P a g e
Press Release Nov. 10, 2016 RELEASE: 16-106 NASA Set to Launch New Fleet of Hurricane-Tracking Small Satellites NASA is set to launch its first Earth science small satellite constellation, which will help improve hurricane intensity, track, and storm surge forecasts, on Dec. 12 from Cape Canaveral Air Force Station in Florida. The Cyclone Global Navigation Satellite System (CYGNSS) hurricane mission will measure previously unknown details crucial to accurately understanding the formation and intensity of tropical cyclones and hurricanes. “This is a first-of-its-kind mission,” said Thomas Zurbuchen, associate administrator for NASA’s Science Mission Directorate at the agency’s headquarters in Washington. “As a constellation of eight spacecraft, CYGNSS will do what a single craft can’t in terms of measuring surface wind speeds inside hurricanes and tropical cyclones at high time-resolution, to improve our ability to understand and predict how these deadly storms develop.” The CYGNSS mission is expected to lead to more accurate weather forecasts of wind speeds and storm surges -- the walls of water that do the most damage when hurricanes make landfall. Utilizing the same GPS technology that allows drivers to navigate streets, CYGNSS will use a constellation of eight microsatellite observatories to measure the surface roughness of the world’s oceans. Mission scientists will use the data collected to calculate surface wind speeds, providing a better picture of a storm’s strength and intensity. Unlike existing operational weather satellites, CYGNSS can penetrate the heavy rain of a hurricane’s eyewall to gather data about a storm’s intense inner core. The eyewall is the thick ring of thunderstorm clouds and rain that surrounds the calm eye of a hurricane. The inner core region acts like the engine of the storm by extracting energy from the warm surface water via evaporation into the atmosphere. The latent heat contained in the water vapor is then released into the atmosphere by condensation and precipitation. The intense rain in eyewalls blocks the view of the inner core by conventional satellites, however, preventing scientists from gathering much information about this key region of a developing hurricane. “Today, we can’t see what’s happening under the rain,” said Chris Ruf, professor in the University of Michigan’s Department of Climate and Space Sciences and Engineering and principal investigator for the CYGNSS mission. “We can measure the wind outside

5 | P a g e
of the storm cell with present systems. But there’s a gap in our knowledge of cyclone processes in the critical eyewall region of the storm – a gap that will be filled by the CYGNSS data. The models try to predict what is happening under the rain, but they are much less accurate without continuous experimental validation.” The CYGNSS small satellite observatories will continuously monitor surface winds over the oceans across Earth’s tropical hurricane-belt latitudes. Each satellite is capable of capturing four wind measurements per second, adding as much as 32 wind measurements per second for the entire constellation. CYGNSS is the first complete orbital mission competitively selected by NASA’s Earth Venture program. Earth Venture focuses on low-cost, rapidly developed, science-driven missions to enhance our understanding of the current state of Earth and its complex, dynamic system and enable continual improvement in the prediction of future changes. The Space Physics Research Laboratory at the University of Michigan College of Engineering in Ann Arbor leads overall mission execution in partnership with the Southwest Research Institute in San Antonio, Texas, and its Climate and Space Sciences and Engineering department leads the science investigation. The Earth Science Division of NASA’s Science Mission Directorate oversees the mission. For more information about NASA’s CYGNSS mission, visit:
http://www.nasa.gov/cygnss
-end- Sean Potter Headquarters, Washington 202-358-1536 [email protected] E.J. Olsen University of Michigan, Ann Arbor, Mich. 734-764-5235 [email protected]

6 | P a g e
Quick Facts
CYGNSS Microsatellites
• Designed and built by Southwest Research Institute, San Antonio, TX, and University of Michigan, Ann Arbor, MI.
Microsatellite Characteristics
• Length: 163.5 cm (deployed); Width: 52.1 cm; Depth: 22.9.6 cm
• Power requirements: Less than 50 Watts
• Mass (each): 28.9 kg
Deployment Module
• Built by Sierra Nevada Corporation, Sparks, NV, USA
Science Instrument
• Each microsatellite will contain one Delayed Doppler Mapping Instrument (DDMI) built by Surrey Satellite Technology, U.S., Englewood, CO, USA.
• Each DDMI consists of one Delay Mapping Receiver (DMR), one Zenith (upward pointing) L-Band Antenna, two Nadir (downward pointing) L-Band Science Antennas, and three Low Noise Amplifiers (LNAs).
Microsatellite Lifetime
• The microsatellites have a minimum design life of two years.
Launch Date/Window
• December 12, 2016, L-1011 Stargazer liftoff will be at 1200 UTC (0700 EST), Pegasus XL drop from L-1011 Stargazer will be at 1305 UTC (0805 EST). The launch window is 60 minutes in duration.
Launch Vehicle
• Orbital ATK Pegasus XL rocket • Pegasus is used to deploy small
satellites weighing up to 1,000 pounds into low-Earth orbit.
• Pegasus XL is carried aloft by the Stargazer L-1011 aircraft to approximately 40,000 feet over the open ocean, where it is released and free-falls five seconds before igniting its first-stage rocket motor.
• Pegasus XL typically delivers satellites into orbit in a little over 10 minutes following its drop from the Stargazer L-1011.
• Pegasus XL dimensions: Length: 17.5 meters; Diameter: 1.27 meters
• Pegasus XL mass: 24,000 kg
Launch Sequence Events
• L-1011 Stargazer is scheduled for take-off from Cape Canaveral Air Force Station at 0700 EST on December 12, 2016.
• Takeoff + 65 minutes: Pegasus XL drop from L-1011 Stargazer (Launch)
• Launch + 12 min 56 Sec: CYGNSS Microsatellites A and C Deployments
• Launch + 13 min 26 Sec: CYGNSS Microsatellites E and G Deployments
• Launch + 13 min 56 Sec: CYGNSS Microsatellites F and H Deployments
• Launch + 14 min 26 Sec: CYGNSS Microsatellites B and D Deployments

7 | P a g e
First Satellite Signal Acquisition
• First contact: Approximately three hours after microsatellite separation
• Data downlink services will be provided by the SSC Space USA, Inc.
Spacecraft Orbit
• The CYGNSS Microsatellite will employ a 510km circular low-Earth orbit (LEO) at an inclination of 35˚ with the equator.
Launch Site
• Cape Canaveral Air Force Station, Cape Canaveral, FL, USA
Launch Operations
• NASA Launch Services Program, Kennedy Space Center, Merritt Island, FL, USA
Mission Management
• The Principal Investigator is based at the University of Michigan and has teamed up with the Southwest Research Institute for project management and implementation.
Mission Operations Center
• Southwest Research Institute, Boulder, CO, USA
Science Operations Center
• University of Michigan, Ann Arbor, MI, USA
NASA Investment
• $157 million
Once the deployment module on the Orbital ATK Pegasus XL launch vehicle reaches its final altitude of approximately 510 kilometers above the Earth’s surface, the eight CYGNSS microsatellite observatories will be deployed in opposing pairs over a two minute period. (Image credit: University of Michigan)
8 | P a g e
CYGNSS Mission Overview
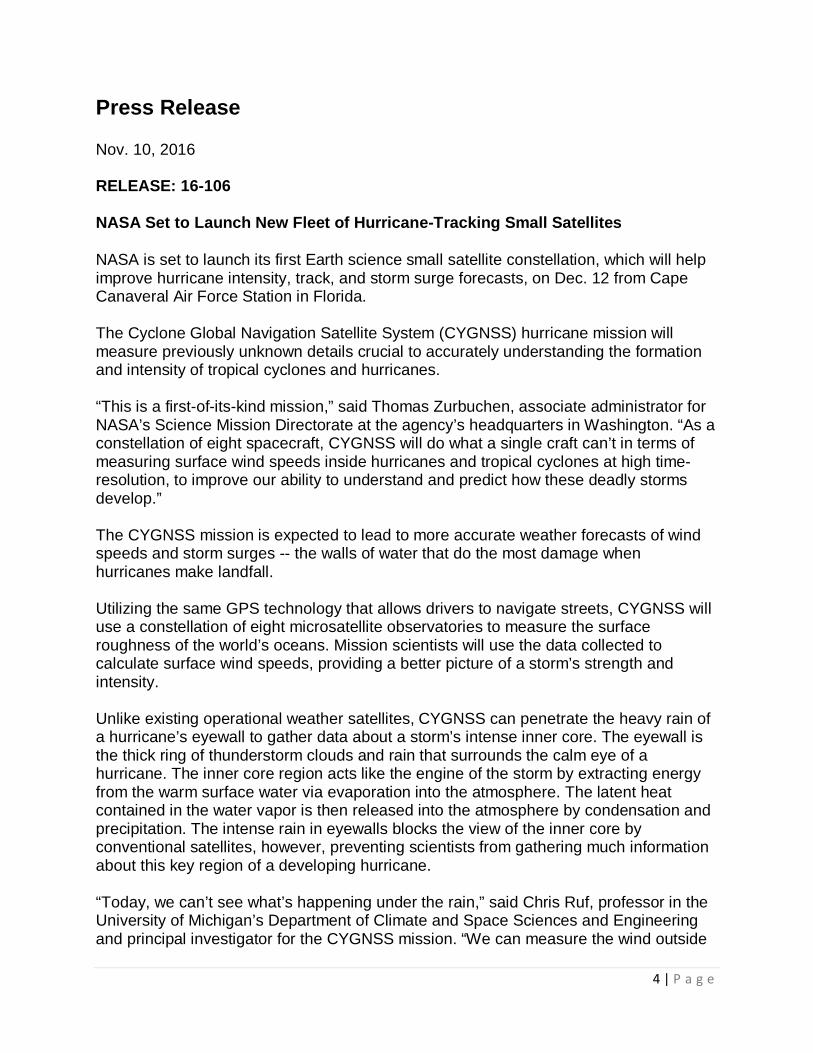
Example of a CYGNSS Microsatellite Observatory
(Image credit: Southwest Research Institute)
The Cyclone Global Navigation Satellite System (CYGNSS) consists of a constellation of eight microsatellite observatories that will collectively provide a measure of ocean surface wind speeds within the core of hurricanes from space. Previous space-borne instruments have been unable to accurately measure ocean surface winds in the inner core of hurricanes because their signals are degraded in regions of heavy precipitation. The lack of accurate wind speed estimates in the inner core of hurricanes has limited the ability of scientists to understand the complex processes associated with intensification of hurricanes. As a result, while hurricane track forecasts have improved in accuracy by about 50% since 1990, during that same period there has been very little improvement in the accuracy of the hurricane intensity forecasts. The data collected by CYGNSS will have significant applications for both the scientific community and the general public. The added quality and quantity of surface wind data to be provided by CYGNSS, combined with precipitation fields produced by NASA’s Global Precipitation Measurement mission, will provide data that will allow hurricane forecasters to improve weather forecast models used to predict both the track and intensity of land-falling hurricanes. Given that the track and intensity of hurricanes play a key role in the development of storm surge, improvements in the forecast of these variables will provide emergency managers a powerful tool in their efforts to provide adequate warning to the general public regarding the likely location and magnitude of dangerous hurricane storm surge. Such advanced warning will be vital in the implementation of action plans designed to protect the human health and welfare of coastal communities. The CYGNSS Science Applications team is working with groups and individuals that will likely be the first users of the data generated by the constellation. These “early adopters” include individuals from the National Oceanic and Atmospheric Administration (NOAA),

9 | P a g e
the Federal Emergency Management Agency (FEMA), university scientists and private research organizations.
Microsatellite Observatories1
The CYGNSS mission will utilize a constellation of eight microsatellite observatories that will be placed in a circular orbit, 510 km above the Earth’s surface and at an inclination of 35° with the equator. A key benefit of using a constellation of microsatellites is that they will pass over a given location on the Earth’s surface more frequently than a single satellite would, resulting in a more detailed view of changes in the ocean winds. The median revisit time for the constellation over a given area will be three hours, with a mean revisit time of approximately seven hours. Each microsatellite observatory is a three-axis stabilized, nadir (downward) pointed vehicle using a star tracker for primary attitude knowledge and a reaction wheel triad for control. Each observatory utilizes fixed solar arrays, stowed for launch and then deployed soon thereafter, to provide power to the on-board electronics for battery charging. Once deployed, the zenith (upward) pointed solar cell array will have a span of 163.5 cm and a width of 52.1 cm. Each observatory has a 28.9 kg mass and requires less than 50 Watts of power to operate. The avionics bay, which contains the primarily electronics for the observatory, has a depth of 22.9 cm. Communications will be provided by an S-band transceiver and low-gain patch antennas.
Image credit: Southwest Research Institute

10 | P a g e
Delay Doppler Measurement Instrument (DDMI)
The primary science instrument on each microsatellite observatory is the delay Doppler mapping instrument (DDMI), which will provide unprecedented high-temporal-resolution wind field imagery of tropical cyclone genesis, intensification and decay. Each DDMI consists of one Zenith (upward pointing) L-Band Antenna which receives direct signals from GPS satellites, two Nadir (downward pointing) L-Band Science Antennas which receive signals reflected off the ocean surface, and one delay mapping receiver (DMR) which processes the GPS signals received by the Zenith and Nadir antennas. The DMR generates maps of GPS signals scattered from the ocean surface. These maps are called Delay Doppler Maps (see below) and the DDMI is capable of generating four DDMs simultaneously. The direct and reflected signals are measured at 1Hz (once per second), and each of the eight microsatellite observatories is capable of measuring four simultaneous reflections, resulting in 32 wind measurements per second around the globe. This provides the ability to measure ocean surface winds with unprecedented temporal resolution and spatial coverage under all precipitating conditions, including those experienced in the hurricane eyewall.
Commissioning
The commissioning phase is the period of initial operations that includes deployment of solar arrays, checkout of the spacecraft subsystems and payload, and drag maneuvers to spread the constellation into the desired spacing. The baseline constellation configuration will be an even spacing of ~45º between observatories. The science coverage requirement for the mission can be met when the observatories are > 20º apart from each other. The commissioning phase extends from launch until both the ground elements and the spacecraft and instrument subsystems are fully functional and have demonstrated the required on-orbit performance to begin routine science data collection. The mission requirements call for these activities to be completed within 60 days after launch. 1CYGNSS Mission Handbook, Michigan Publishing, Ann Arbor, MI., April 2016.

11 | P a g e
Estimation of Ocean Surface Wind Speed
Using the onboard DDMI, each CYGNSS microsatellite observatory will receive direct signals from GPS satellites, as well as signals reflected off the ocean surface. As depicted in the image below, the direct signal is transmitted from the orbiting GPS satellite and received by the single zenith-pointing antenna (i.e., top side), while the scattered GPS signal scattered off the ocean surface is received by the two nadir-pointing antennas (i.e., bottom side). The direct signal is used to pinpoint the location of the observatory, while the reflected signals respond to ocean surface roughness, from which the ocean surface wind speed is derived. The specular point is the location on the ocean surface where all of the scattering originates if the surface is perfectly smooth. With a roughened surface, the scattering originates from a diffuse region called the glistening zone that is centered on the specular point.
Image credit: University of Michigan
The power in the signals scattered by the ocean surface and received by the DDMI is used to create a series of Delay Doppler Maps, examples of which are shown below. The y-axis represents the time delay between the direct (from the GPS) and scattered (from the ocean) received signals, while the x-axis represents the shift in frequency between the direct and scattered received signals. The two axes are normalized with respect to the delay and Doppler shift at the specular point, the spot on the ocean surface where the scattered signal strength is largest. The wind speed is estimated from the DDM by relating the region of strongest scattering (the dark red region) to the ocean surface roughness. A smooth ocean surface will reflect a GPS signal directly up toward the CYGNSS observatory, producing a strong received signal. A roughened ocean will result in more diffuse scattering of the signal in all directions, resulting in a weaker received signal. Therefore, strong received signals represent a smooth ocean surface and calm wind conditions, while weak received signals

12 | P a g e
represent a rough ocean surface and high wind speeds. The exact relationship between received signal strength and wind speed is provided by the CYGNSS wind speed retrieval algorithm.
Example of Delay Doppler Maps for 2 and 10 meter per second (m/s) wind speeds (top and bottom, respectively). The images show how progressively stronger wind speeds, and therefore progressively rougher sea surfaces, produce a weaker maximum signal at the top of the “arch”. A perfectly smooth ocean surface would produce a concentrated red spot at the top of the arch. (Image credit: University of Michigan).

13 | P a g e
Flight Plan
The eight microsatellite observatories and deployment module (DM) are shipped to Vandenberg Air Force Base for integration with an Orbital ATK Pegasus XL three-stage launch vehicle. Once integrated, the Pegasus will be attached to the underside of Orbital ATK’s L-1011 Stargazer aircraft and subsequently flown to Cape Canaveral Air Force Station in Florida. On launch day, the L-1011 Stargazer aircraft will take off from Cape Canaveral and fly to a pre-determined drop location off the coast of Florida at an altitude of 39,000 feet. Once it is dropped from the L-1011 Stargazer aircraft, the Pegasus XL will carry the deployment module (DM) and its eight microsatellites to a target altitude of 510 km. Upon reaching the target altitude, the microsatellite observatories are deployed in opposite pairs from the DM. The total flight time from the drop of the Pegasus XL rocket to Stage-three burnout is approximately eight minutes. The sequence of launch events is provide in Table I.
Schematic diagram of Pegasus XL Launch Vehicle (Image credit: Orbital ATK)

14 | P a g e
Launch Sequence for deployment of CYGNSS microsatellite observatories (Information source: Orbital ATK)
Event Time After Drop (mm:ss) Altitude (km) Inertial Speed (km/s)Launch 0:00 12.4 0.66Stage 1 Ignition 0:05 12.3 0.66Maximum Dynamic Pressure 0:36 16.9 1.29Stage 1 Burnout 1:17 53.5 2.91Stage 1/2 Separation 1:33 70.5 2.85Stage 2 Ignition 1:34 71.4 2.85Payload Fairing Jettison 2:12 115.9 4.05Stage 2 Burnout 2:48 174.3 5.80Stage 2/3 Separation 6:37 478.1 5.32Stage 3 Ignition 6:48 486.8 5.30Stage 3 Burnout 7:56 512.4 7.60CYGNSS Obs A-C Deployments 12:56 510.5 7.60CYGNSS Obs E-G Deployments 13:26 510.3 7.60CYGNSS Obs F-H Deployments 13:56 510.1 7.60CYGNSS Obs B-D Deployments 14:26 509.9 7.60

15 | P a g e
CYGNSS Ground System1
The CYGNSS Ground System will consist of the following components:
• Mission Operations Center (MOC) • Science Operations Center (SOC) • Ground Data Network (GDN)
Mission Operations Center (MOC)
The MOC will be located within the Southwest Research Institute’s (SwRI) Planetary Science Directorate in Boulder, Colorado.
Boulder Missions Operations Center (Image credit: Southwest Research Institute)
During the mission the CYGNSS MOC will be responsible for mission planning, flight dynamics, and command and control tasks for each of the microsatellite observatories in the constellation. Among the primary task that the MOC will be responsible for are:
o coordinating activity requests o scheduling ground network passes o collecting and distributing engineering and science data o tracking and adjusting the orbit location of each observatory in the constellation o trending microsatellite data o creating real-time command procedures or command loads required to perform
maintenance and calibration activities, and

16 | P a g e
o maintaining configuration of onboard and ground parameters for each observatory.
Science Operations Center (SOC)
The SOC will be located within the University of Michigan’s Space Physics Research Laboratory in Ann Arbor, MI.
Science Operations Center (Image credit: University of Michigan)
The CYGNSS SOC will be responsible for the following items related to calibration/validation activities, routine science data acquisition and special requests, and data processing and storage:
o Supporting DDMI testing and validation both prelaunch and on-orbit, o providing science operations planning tools, o generating instrument command requests for the MOC, o processing Levels 0 through 3 science data, and archiving Level 0-3 data
products, DDMI commands, code, algorithms, and ancillary data at a NASA Distributed Active Archive Center.
The Level 0 data products will primarily consist of the raw data and DDMs that are computed onboard the each microsatellite observatory, Level 1 data products will include calibrated DDMs and mean square slope (ocean surface roughness) information, while Level 2 data products will include gridded ocean surface roughness and wind speed data. The CYGNSS science team members will use the fully calibrated L2 data for their own research and make it available to the external user science community and eventually to operational users. The Level 3 data products will include data products that have been optimized for the greater user community. The data from CYGNSS will be made freely available via the NASA Jet Propulsion Laboratory’s Physical Oceanography Distributed Active Archive Center (PODAAC).

17 | P a g e
Ground Data Network (GDN)
The CYGNSS mission team has selected the SSC Universal Space Network (USN) to handle ground communications for the mission, given their extensive previous experience with missions similar to CYGNSS. The GDN for the mission will consist of PrioraNet ground stations located in: (a) South Point, HI, USA, (b) Santiago, Chile, and (c) in Western Australia, approximately 400 km to the south of Perth. Each of the CYGNSS microsatellite observatories will be visible to the three ground stations within the SSC USN for periods that average between 470 and 500 seconds of visibility per pass. Given that each observatory will pass over each of the three ground stations five-to-six times each day, there will be a large number of scheduling opportunities for communications passes. MOC personnel will schedule passes, as necessary, to support the commissioning and operational activities of the mission. Each of the microsatellite observatories can accommodate extended gaps in contacts with the SSC USN ground stations, given that they are equipped with a storage capacity that can archive greater than ten days’ worth of data with no interruption of science activities. This extended storage capability is important, given that frequent downloads of mission data from a given microsatellite observatory would result in considerable drainage of the onboard batteries which power the observatory.
Image credit: www.sscspace.com
18 | P a g e
NASA Explores Our Home Planet
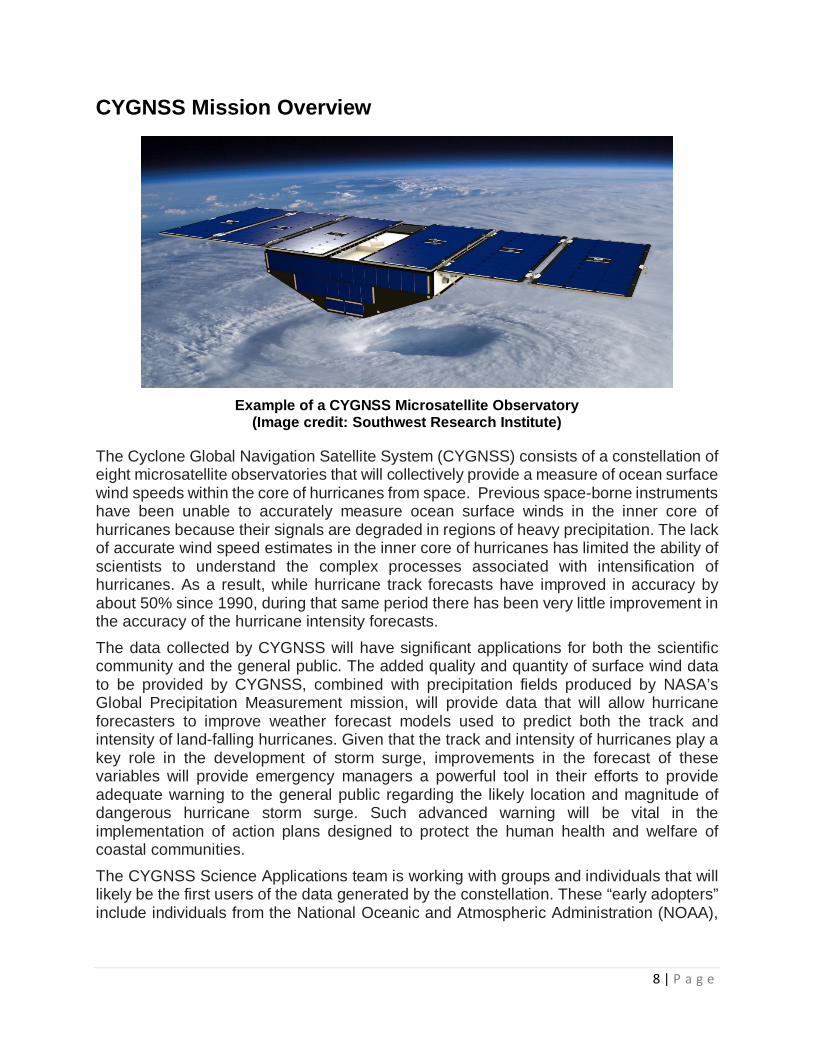
NASA uses the vantage point of space to increase our understanding of our home planet, improve lives, and safeguard our future
• NASA’s work in Earth science is making a difference in people’s lives around the world
every day. From farms to our national parks, from today’s response to natural disasters to tomorrow’s air quality, from the Arctic to the Amazon, NASA is working for you 24/7.
• Scientists worldwide use NASA data to tackle some of the biggest questions about how our planet is changing now and how Earth could change in the future. From rising sea levels to the changing availability of freshwater, NASA enables studies that unravel the complexities of our planet from the highest reaches of Earth’s atmosphere to its core.
• NASA’s expertise in space and scientific exploration contributes to essential services provided to the American people by other federal agencies, such as weather forecasting and natural resource management.
Greenland ice sheet (left) as seen from the Moderate Resolution Imaging Spectroradiometer (MODIS) on NASA’s Aqua satellite and Hurricane Matthew (right) as seen from the MODIS instrument on NASA’s Terra satellite. Image credit: NASA.
http://www.nasa.gov/topics/earth/index.html
#nasaearth

19 | P a g e
CYGNSS on the Leading Edge of Innovation
The following short articles highlight the many ways in which the CYGNSS mission is on the cutting edge of new space-based measurement approaches.
The History and Utility of Small Satellites
A. Ridley, University of Michigan, Ann Arbor, MI 48109
SUMMARY: From its humble beginnings as ballast material for larger satellite missions, small satellites have come into their own as important players in the development of low-cost, innovative space-based technologies for scientific discovery. Standing upon the shoulders of such innovations, the Cyclone Global Navigation Satellite System (CYGNSS) is helping NASA enter into a new chapter in small satellite Earth science missions.
In NASA’s early years, getting to space and operating in space were both extremely dangerous and there was much uncertainty about how best to do it. There was a general acknowledgement and acceptance of a large amount of risk. At that time, there was also a very large amount of money invested in NASA – at one point, NASA’s budget was 6% of the total federal budget. This allowed NASA to rapidly and aggressively solve problems by trying new and innovative things and by iterating on a design over and over until it worked. For example, the Atmospheric Explorer satellites, built in the 1970s, had four versions that each lasted only a few months until the fifth one, AE-E, lasted for many years. Likewise, there were seven IMP satellites that lasted only a few months before IMP-8 lasted 30+ years. One reason NASA could do this was because the ratio between the cost of a satellite and the total budget of the agency was quite small. Therefore, the cost of failures by a few satellites could be easily absorbed.
NASA today is quite different. The budget is about 0.5% of the total federal budget. The total number of satellites launched is significantly smaller, and the tolerance for risk is also much smaller since their individual costs are a much larger part of NASA’s total budget. While launch and on-orbit failures still happen at NASA, they are now viewed less as learning opportunities and more simply as failures. Today’s development process for NASA satellite missions include many rules that need to be followed and reviews that must be held to move the mission to the next phase. While this helps to ensure success and is a natural outcome of a system with limited budgets, it can slow or even stifle innovation.
When a satellite is launched, the rocket (or launch vehicle) has a certain lift capability. For example, a rocket may be able to launch a satellite with a mass of 1000 kg to a 700
20 | P a g e
km altitude. If a particular satellite is only 950 kg, the rocket then has excess capacity and, in order to get the satellite to the exact desired orbit, 50 kg of ballast is added to the rocket. Sometimes, this ballast can be another satellite.
The idea of a CubeSat was created when someone suggested using a standardized deployer for very small satellites that could be used as ballast on almost any launch vehicle. The deployer could be very strong to ensure that, if anything went wrong with the little satellite inside it, the primary payload (i.e. the large satellite) would not be affected. The P-POD deployer was invented to allow cheap access to space for extremely small satellites as secondary payloads. It created a standard for tiny satellites, dubbed “CubeSats”, that could fit into the P-POD deployer and be launched into space wherever a P-POD could be used. A P-POD accepts a satellite that is roughly 4 inches by 4 inches by 12 inches, or 3 satellites that are roughly 4 inches on a side (hence the name CubeSat).
The invention of the P-POD deployer has revolutionized access to space, since is allows almost anyone to build a satellite so long as it fits. At first, CubeSats were considered too small to do any real science. This has since changed. The National Science Foundation has embraced CubeSats as both an educational and a science tool. They have funded over ten CubeSats that have been used to conduct science ranging from lighting detection to radiation belt monitoring.
CubeSats have been so successful because that have returned the community to a place where satellites are once again quite cheap compared to the total budget of the funding agency. This has allowed innovation and rapid technology development to reenter the satellite industry. Because of this, a large number of companies have been created to develop smaller and better supporting hardware for tiny satellites. For example, small, high-speed radios have recently been introduced that can be used to downlink large amounts of data. Without such radios, it would be extremely expensive to get all of the data from the satellite to the ground.
With the emergence of small-satellite hardware, government agencies such as NASA and the Department of Defense have started to create missions that are designed in a radically different way - instead of launching a single satellite that was quite expensive, they can explore how to get the same science return with one or more smaller, cheaper, satellites.
Another technology that has led to the creation of missions such as CYGNSS is the Global Navigation Satellite System (GNSS), which refers to satellite constellations such as GPS. GPS was originally designed to provide precise position and time information for military systems, but its uses have expanded significantly. GPS has become ubiquitous in modern society. This has done two things – it has pushed GPS receivers to smaller sizes and lower power, and it has lowered the price of each receivers.

21 | P a g e
In space, a GPS receiver can be used to do different things. One of the most common is to determine the position and velocity of a satellite, much as receivers do on the ground. The most common scientific applications of GPS make use of the time delay between when the GPS satellite sent the signal and when the monitoring satellite received it. The delay is affected by the atmosphere along the path between the transmitter and receiver and its properties, such as the humidity and the degree of ionization in the atmosphere, can be inferred from the delay. This technique is called GNSS radio occultation and is the primary scientific use of GPS on satellites today. The COSMIC satellites are an example.
The CYGNSS satellites use GPS signals, too, but in a different way. They measure the signal that is scattered from the ocean’s surface, which is affected by the roughness of the ocean. The amount of scattered signal is dependent upon the surface roughness, which itself is dependent upon the winds over the water. The wind speed is determined by CYGNSS from the strength of the scattered GPS signal.
Most past satellites that have measured wind speed over the ocean have had to both transmit and receive the radio signal. . The transmitters need to be large and powerful. Since CYGNSS does not contain the transmitter, it can be significantly smaller. In addition, CYGNSS takes advantage of a number of components that were designed for very small satellites, such as the radio for communication with the ground, the star trackers that provide information on the orientation of the satellite, the momentum wheels which keep the CYGNSS satellites oriented in the proper direction, and the computer system that runs everything on the satellite. This has allowed NASA to launch eight very small satellites for cheaper than a single large satellite. One advantage of having many satellites in a constellation is that they are able to observe much more of the Earth simultaneously, and they will return to observe the same spot on the Earth much more often. These sampling properties are necessary to detect and track extreme weather events such as hurricanes which occur infrequently and change rapidly.

22 | P a g e
History of GNSS-R from Space S. Gleason, Southwest Research Institute, Boulder, CO 80305
SUMMARY: The first space-based measurement of an Earth reflected Global Navigation Satellite System Reflectometry (GNSS-R) signal was made from the NASA Space Shuttle in 2002. Since that time, researchers have sought to apply this approach to geophysical applications such as the measurement of ocean surface roughness, soil moisture and sea ice. The United Kingdom – Disaster Monitoring Constellation (UK-DMC) satellite explored the use of this technology for the measurement of ocean surface roughness, from which ocean surface wind speed could be determined. This work opened the door for a dedicated and more extensive application of this technique as part of the Cyclone Global Navigation Satellite System (CYGNSS).
The two principle Global Navigation Satellite System (GNSS) Earth remote sensing techniques, atmospheric sensing using Radio Occultation (GNSS-RO) and surface sensing (ocean, land and ice) using Reflectometry (or bi-static radar) (GNSS-R) were both discovered at approximately the same time, in the early 1990s. However, the RO technique made its way to satellites, including into operational satellite missions, much quicker than remote sensing with surface reflections. From the time the GNSS-R technique was first proposed (for surface altimetry) by the European Space Agency in 1992 until the NASA Jet Propulsion Laboratory first detected a signal in space in 2002, all of the advancements in GNSS-R remote sensing were accomplished by ground, tower or airborne experiments.
The 2002 detection of an Earth reflected GPS signal by a low-Earth orbit satellite was accomplished using raw data collections by the Shuttle Imaging Radar (SIR-C). SIR-C recorded short durations of raw samples in the GPS part of the radiowave spectrum. Additionally, SIR-C had a very high gain antenna that was well suited for detecting GPS surface reflections. After an exhaustive search, three seconds of SIR-C data revealed very strong and clean reflected GPS signals from the L1 P(Y) encrypted signal. This unexpected discovery resulted in a paradigm shift in how researchers viewed the potential applications of GNSS-R. If GPS reflected signals can be detected from space, this opened up a new horizon of possibilities for global remote sensing using a potentially very low cost technique.
The next big questions for spaceborne GNSS-R were to determine what geophysical parameters were observable using these reflected signals, and what were the satellite and instrument requirements for capturing enough reflected signal power to make scientifically useful measurements. The satellite and instrument design requirements are highly dependent on the particular scientific application. Performing ocean altimetry with GNSS-R requires a larger satellite and larger (higher gain) instrument antenna, while

23 | P a g e
GNSS-R ocean scatterometry applications may suffice with more modest instrument hardware. The requirements for many spaceborne GNSS-R applications, such as soil moisture and sea ice, are still areas of active research.
In an attempt to answer these questions, researchers at Surrey Satellite Technology Limited (SSTL) in Guildford, England devised another GNSS-R experiment on an existing imaging satellite known as the United Kingdom – Disaster Monitoring Constellation (UK-DMC) satellite. The UK-DMC satellite was the U.K. contribution to a larger constellation of large swath imaging satellites whose primary purpose was to image disaster areas. However, like all satellites launched by SSTL, the satellite carried a space GPS receiver (SGR) for navigation purposes. Acting on this opportunity, SSTL managed to add a GNSS-R experiment to the UK-DMC satellite by adding a modest gain antenna to the downward looking face of the satellite (luckily there was room available on the satellite), making small modifications to the SGR, and adding an experimental data recorder located next to the SGR. Once on orbit, some limited operational time was obtained to log raw samples from the Earth facing antennas and downlink them to the ground for post-processing. The ground processing searched for (and found!) Earth reflections using the recent emerging technology of GPS software defined radio processors. An exhaustive signal search (in the same spirit as the SIR-C data processing) of the ~100 data sets of approximately 20 seconds duration each revealed the reflected surface signals. The majority of these data collections were targeted over National Data Buoy Center (NDBC) ocean buoys with the goal of linking the received signal power in the reflections to the ocean wind and wave conditions on the surface near the buoy observations. Comparisons between the received signal power and the buoy measured surface winds clearly showed the feasibility of GNSS-R ocean wind speed estimation from low Earth orbit. The UK-DMC experiment was able to estimate ocean surface winds to better than 2 m/s RMS. In addition to linking the surface reflections with ocean winds, a small number of data collections were also made over land and ice. These data show some tantalizing potential scientific applications there as well. Reflections from sea ice were demonstrated to be linked with ice concentration, and the reflected signals from ice were surprisingly strong. Signals from land show dramatic variation as the reflected signal traverses different terrain and surface water, including large jumps in signal strength as the location of the reflection crosses rivers. The combination of a definitive demonstration of ocean wind sensing from space and the huge potential for sea ice and land-based remote sensing opened the horizon even further to the potential applications of GNSS-R.
The stage was now set for a larger, dedicated mission that uses the GNSS-R technique. NASA selected the Cyclone Global Navigation Satellite System (CYGNSS) mission in 2012. The eight satellite CYGNSS mission led by the University of Michigan is an obvious marriage of the primary strengths of GNSS-R from space (ocean wind sensing with a modest antenna gain) and a pressing need in both the Earth remote sensing community, and society in general, for better hurricane forecasting. The added benefit of GPS signals to make measurements through intense hurricane rains is the icing on the constellation cake.

24 | P a g e
The reflectometry instrument flying on CYGNSS consists of an upgraded and improved version of the SSTL SGR. During the pre-launch design and development phase of the CYGNSS mission, SSTL was able to fly the new remote sensing instrument as a part of a suite of experiments on its TechDemoSat (TDS) satellite, launched in July 2014. TDS has been used extensively in its own right, and by the CYGNSS team, to qualify the new instrument and demonstrate additional GNSS-R applications in space, such as soil moisture sensing, where the earlier suspicions turned out to be true that the surface reflected power does indeed respond to differences in surface soil moisture.
Following and in parallel with CYGNSS, other dedicated satellites and constellations are being developed. There is Universitat Politècnica de Catalunya-Barcelona's “3cat2” CubSat which will attempt to demonstrate the GPS interferometric altimetry technique, scheduled for launch near the same time as CYGNSS. ESA's GEROS mission will hopefully fly on the International Space Station in approximately 2019 to perform both GNSS-R surface and -RO atmospheric sensing, and will include a high gain antenna to demonstrate spaceborne GNSS-R altimetry. In Japan, a large consortium of researchers across multiple universities have started ground based and future satellite missions planning using GNSS-R, including a UK-DMC like data sampling experiment to launch soon.
Last but not least, the commercial world has begun to grasp the potential of spacecraft GNSS-R with Spire Global undertaking research and development in the areas of instrument and algorithm development for a planned series of four GNSS-R ocean wind sensing CubeSats scheduled for launch in 2017.

25 | P a g e
Review of Ocean Wind Measurements Using GNSS Reflectometry
V. U. Zavorotny, NOAA/ESRL, Boulder CO, 80305
SUMMARY: The Cyclone Global Navigation Satellite System (CYGNSS) will utilize existing Global Positioning System (GPS) satellites to obtain ocean surface wind speeds within the inner core of hurricanes. Over the past three decades, the technology required to perform these measurements has been developed through a series of airborne- and space-based experiments. The algorithms needed to convert the scattered GPS signals measured by CYGNSS into estimates of ocean surface wind speed have been developed using theoretical modeling simulations, as well as comparisons with buoy-based, ocean surface wind speed observations.
The Global Positioning System (GPS), which is now a part of the Global Navigation Satellite System (GNSS), was created about 25 years ago solely for global navigation purposes. In 1998, Garrison and Katzberg demonstrated from an aircraft experiment that the GPS signal reflections can sense ocean surface roughness and related wind [1], [2]. Soon, more elaborate aircraft campaigns with bistatic GPS radars measured sea-surface roughness. These data were used to retrieve wind speed and later wind vector above rough seas using reflected signals from multiple GPS satellites [3]-[6]. The retrieval algorithm used a theoretical model in the form of a bistatic radar equation which related the reflected waveforms to mean-square slopes, and from there, to wind speed [7]. A significant body of GPS reflection data obtained with a NASA Langley GPS receiver was collected during multiple flights on the NOAA P-3 “hurricane hunter” aircraft through tropical cyclones [8]-[10]. A large body of experimental work was compiled on wind retrieval under hurricane-like conditions, achieving ~4 m/s precision in retrievals of high winds [11]. This enabled development of an empirical model which related the L-band filtered variance of the surface slopes (mean square slopes, MSS) of waves to wind speed over a large range of wind speeds [10].
Several algorithms have been implemented to extract ocean surface roughness and wind state from the GNSS reflection observables. Some of them are based on fitting measurements with theoretical model predictions. After renormalizing and realigning the GNSS reflected waveform, the best fit against a theoretical model gives an estimate for the geophysical and instrumental-correction parameters, such as the 10-meter altitude wind speed, or isotropic sea-surface L-band filtered MSS. Some of the work done with this methodology include: (e.g., [5], [6], [8], [12], [14]). The fit also can be constrained to the trailing edge of the waveform, as suggested in [7], and implemented in [5]. This technique works best for airborne altitudes and is not feasible for ground-based receivers
26 | P a g e
because the effect of waveform spreading due to roughness is diminished for low altitudes. It was suggested and tested in airborne campaigns in [4], [6]. It is rather straightforward for the case of a single airborne platform, when different satellite reflections arrive to the receiver from relatively close surface areas with the presumably same surface roughness state. For spaceborne receiving systems, this method would lose spatial resolution because the trailing edge of the reflected waveform originates from a very large glistening zone. Instead, one can look into the change of the peak power as suggested in [15]. The CYGNSS mission baseline retrieval algorithms will be mainly based on this approach [16], [17]. In order to estimate wave anisotropy (wind direction) a multi-satellite constellation would be required to invert simultaneously (or close in time) several GNSS reflections assuming they all sense the same surface roughness at different angles. Alternatively, a possibility for obtaining wave anisotropy information from a single GNSS reflection observation by using the Doppler domain of the signal, that is, the delay-Doppler map (DDM), was discussed in [13], [18]. Then, the applicability extends to spaceborne systems (in addition to airborne scenarios).
The first analysis of wind speed measurements from spaceborne GNSS-R based on UK-DMC data was investigated in [15]. The performance obtained was 1.8 m/s rms error for weak and moderate winds. The most recent re-validation study of the UK-DMC results is presented in [16]. It is based on a wind retrieval approach that combines five different GNSS-R observables applied to UK-DMC low-Earth orbiter GNSS-R data, and compares the inferred values to collocated buoy information. The performance obtained is of the order of 1.7 m/s error in a range of winds from 2.4 to 10.7 m/s, which is very close to the results obtained in [15]. This is also consistent with former estimates of the scatterometric performance for airborne platforms such as in [1] and [12]. The wind-speed uncertainties found in [12], using stratospheric GNSS-R data, resulted in precision from 0.1 to 2 m/s in a range of wind speeds from 1 to 8 m/s. Additional information on ocean wind measurements with the GNSS reflectometry can be found in [19].
REFERENCES
[1] J. L. Garrison, S. J. Katzberg, M. I. Hill, “Effect of sea roughness on bistatically scattered range coded signals from the Global Positioning System”, Geophys. Res. Lett., vol. 25, no. 13, pp. 2257–2260, Jul. 1998. [2] B. Lin, S. J. Katzberg, J. L. Garrison, and B. Wielicki, “The relationship between the GPS signals reflected from sea surface and the surface winds: modeling results and comparisons with aircraft measurements,” J. Geophys. Res., vol. 104, no. C9, pp. 20713–20728, 1999. [3] A. Komjathy, V. U. Zavorotny, P. Axelrad, G. H. Born, and J. L. Garrison, “GPS signal scattering from sea surface: wind speed retrieval using experimental data and theoretical model,” Remote Sens. Environ., vol. 73, no.1, pp.162–174, 2000. [4] M. Armatys, M., Estimation of Sea Surface Winds Using Reflected GPS Signals, PhD Thesis, University of Colorado, Boulder, CO, 2001.

27 | P a g e
[5] J. L. Garrison, A. Komjathy, V.U. Zavorotny and S.J. Katzberg, “Wind speed measurements using forward scattered GPS signals,” IEEE Trans. Geosci. Remote Sens., vol. 40, no. 1, pp. 50–65, Jan. 2002. [6] A. Komjathy, M. Armatys, D. Masters, P. Axelrad, V. Zavorotny, and S. Katzberg, “Retrieval of ocean surface wind speed and wind direction using reflected GPS signals,” J. Atmos. Ocean. Tech., vol. 213, pp. 515–526, 2004. [7] V. U. Zavorotny, and A. G. Voronovich, “Scattering of GPS signals from the ocean with wind remote sensing application,” IEEE Trans. Geosci. Remote Sensing, vol. 38, no. 1, pp. 951–964, Mar. 2000. [8] S. J. Katzberg, R. A. Walker, J. H. Roles, T. Lynch, and P. G. Black.” First GPS signals reflected from the interior of a tropical storm: Preliminary results from hurricane Michael.” Geophys. Res. Lett., vol. 28, pp. 1981–1984, 2001. [9] S. J. Katzberg, O. Torres, and G. Ganoe. “Calibration of reflected GPS for tropical storm wind speed retrievals,” Geophys. Res. Lett., vol. 33, p. L18602, 2006. [10] S. J. Katzberg and J. Dunion, “Comparison of reflected GPS wind speed retrievals with drop-sondes in tropical cyclones,” Geophys. Res. Lett., vol.36, page 95–109, 2009. [11] S. J. Katzberg, J. Dunion, and G. Ganoe, “The use of reflected GPS signals to retrieve ocean surface wind speed in tropical cyclones,” Radio Sci., vol. 48, no. 4, pp. 371–387, July/Aug. 2013. [12] E. Cardellach, G. Ruffini, D. Pino, A. Rius, A. Komjathy, and J. L. Garrison, “Mediterranean balloon experiment: Ocean wind speed sensing from the stratosphere using GPS reflections,” Remote Sens. Environ., vol. 88, no. 3, pp. 351–362, 2003. [13] O. Germain, G. Ruffini, F. Soulat, M. Caparrini, B. Chapron, and P. Silvestrin, “The eddy experiment: GNSSR speculometry for directional sea roughness retrieval from low altitude aircraft,” Geophys. Res. Lett., vol. 31, p. L21307, 2004. [14] C. Zuffada, T. Elfouhaily, and S. Lowe, “Sensitivity analysis of wind vector measurements from ocean reflected GPS signals,” Remote Sens. Environ., vol. 88, no. 3, pp. 341–350, 2003. [15] S. Gleason, “Space based GNSS scatterometry: ocean wind sensing using empirically calibrated model,” IEEE Trans. Geosci. Remote Sens., vol. 51, no. 9, pp. 4853–4863, 2013. [16] M. P. Clarizia, C. S. Ruf, P. Jales, and C. P. Gommenginger, “Spaceborne GNSS-R minimum variance wind speed estimator,” IEEE Trans. Geosci. Remote Sens., vol. 52, no. 11, pp. 6829–6843, 2014. [17] M. P. Clarizia, and C. S. Ruf, “Wind speed retrieval algorithm for the Cyclone Global Navigation Satellite System (CYGNSS) mission,” IEEE Trans. Geosci. Remote Sens., vol. 54, no. 8, pp. 4419–4432, 2016. [18] M. P. Clarizia, C. Gommenginger, S. Gleason, M. Srokosz, C. Galdi, and M. Di Bisceglie, “Analysis of GNSS-R delay-Doppler maps from the UK-DMC satellite over the ocean,” Geophys. Res. Lett., vol. 36, p. L02608, Jan. 2009. [19] V. Zavorotny, S. Gleason, E. Cardellach, and A. Camps, Tutorial on remote sensing using GNSS bistatic radar of opportunity, IEEE Geosci. Remote Sens. Magazine, vol. 2, No. 4, pp.8-45, Dec. 2014
OTHER RELEVANT RESOURCES

28 | P a g e
T. Elfouhaily, D. R. Thompson, and L. Linstrom, “Delay-Doppler analysis of bistatically reflected signals from the ocean surface: Theory and application,” IEEE Trans. Geosci. Remote Sens., vol. 40, no. 3, pp. 560–573, 2002. J. Marchan-Hernandez, N. Rodriguez-Alvarez, A. Camps, X. Bosch-Lluis, I. Ramos-Perez, and E. Valencia, “Correction of the sea state impact on the L-band brightness temperature by means of delay-Doppler maps of global navigation satellite signals reflected over the sea surface,” IEEE Trans. Geosci. Remote Sens., vol. 46, no. 10, pp. 2914–2923, 2008. E. Valencia, A. Camps, X. Bosch-Lluis, N. Rodriguez-Alvarez, I. Ramos-Perez, F. Eugenio, and J. Marcello, “On the use of GNSS-R data to correct L-band brightness temperatures for sea-state effects: Results of the ALBATROSS field experiments,” IEEE Trans. Geosci. Remote Sens., vol. 49, no. 9, pp. 3225–3235, Sept. 2011. N. Rodriguez-Alvarez, D. M. Akos, V. U. Zavorotny, J. A. Smith, A. Camps, and C. W. Fairall, “Airborne GNSS-R wind retrievals using delay-Doppler maps,” IEEE Trans. Geosci. Remote Sens., vol. 51, no. 1, pp. 626–641, Jan. 2013. E. Valencia, V. U. Zavorotny, D. M. Akos, and A. Camps, “Using DDM asymmetry metrics for wind direction retrieval from GPS ocean-scattered signals in airborne experiments,” IEEE Trans. Geosci. Remote Sens., vol. 52, no. 7, pp. 3924–3936, 2014. E. Cardellach and A. Rius, “A new technique to sense non-Gaussian features of the sea surface from L-band bi-static GNSS reflections,” Remote Sens. Environ., vol. 112, no. 6, pp. 2927–2937, Jun. 2008. G. Schiavulli, D. Nunziata, F. Pugliano, and M. Migliaccio, “Reconstruction of the normalized radar cross section field from GNSS-R delay-Doppler map,” IEEE J. Select. Topics Appl. Earth Observ. Remote Sens., vol. 7, no. 5, pp. 1573–1583, May 2014. E. Cardellach, Sea surface determination using GNSS reflected signals. Ph.D. dissertation. Univ. Politecnica de Catalunya. Barcelona, Spain, 2002. [Online]. Available: https://www.ice.csic. es/files/estel/Cardellach_PhD.pdf. N. Rodriguez-Alvarez and J. L. Garrison, “Generalized linear observables for ocean wind retrieval from calibrated GNSS-R delay–Doppler maps,” IEEE Trans. Geosci. Remote Sens., vol. 54, no. 2, pp. 1142-1155, Feb. 2016. F. Soulat, M. Caparrini, O. Germain, P. Lopez-Dekker, M. Taani, and G. Ruffini, “Sea state monitoring using coastal GNSS-R,” Geophys. Res. Lett, vol.31, p. L21303, 2004. E. Valencia, A. Camps, J.F. Marchan-Hernandez, N. Rodriguez-Alvarez, I. Ramos-Perez, and X. Bosch-Lluis, “Experimental determination of the sea correlation time using GNSS-R coherent data,” IEEE Geosci. Remote Sens. Lett., vol. 7, no. 4, pp. 675–679, 2010.