kwg group holdings limited 合景泰富集團控股 …...2020/03/25 · accounting standards...
TRANSCRIPT

– 1 –
Hong Kong Exchanges and Clearing Limited and The Stock Exchange of Hong Kong Limited take no responsibility for the contents of this announcement, make no representation as to its accuracy or completeness and expressly disclaim any liability whatsoever for any loss howsoever arising from or in reliance upon the whole or any part of the contents of this announcement.
KWG GROUP HOLDINGS LIMITED合 景 泰 富 集 團 控 股 有 限 公 司(Incorporated in the Cayman Islands with limited liability)
(Stock Code: 1813)
ANNOUNCEMENT OF ANNUAL RESULTS FOR THE YEAR ENDED 31 DECEMBER 2019
HIGHLIGHTS
• The pre-sales for the year ended 31 December 2019 of RMB86,107.0 million, representing an increase of 31.5% as compared with the financial year of 2018.
• Proportionate revenue for the year ended 31 December 2019 amounted to RMB38,954.1 million, an increase of 72.4% as compared with the financial year of 2018.
• Profit attributable to owners of the Company amounted to RMB9,805.8 million, an increase of 143.0% as compared with the financial year of 2018.
• Core profit of the Company for the year amounted to RMB5,214.5 million, representing an increase of 36.8% as compared with the financial year of 2018.
• Proportionate core gross profit margin and proportionate net profit margin were 31.8% and 25.8%, respectively.
• Earnings per share increased by 141.4% to RMB309 cents as compared with the financial year of 2018.
• Proposed to declare final dividend of RMB42 cents per ordinary share. Including interim dividend, full year dividend was equivalent to RMB74 cents per ordinary share.
The board (the “Board”) of directors (the “Directors”) of KWG Group Holdings Limited (the “Company”) is pleased to announce the consolidated results of the Company and its subsidiaries (collectively, the “Group”) for the year ended 31 December 2019. The annual results have been reviewed by the audit committee of the Company.

– 2 –
CONSOLIDATED STATEMENT OF PROFIT OR LOSS Year ended 31 December 2019
2019 2018Notes RMB’000 RMB’000
REVENUE 6 24,956,261 7,477,471Cost of sales (17,090,481) (5,026,202)
Gross profit 7,865,780 2,451,269
Other income and gains, net 6 2,858,916 2,703,427Selling and marketing expenses (1,007,351) (532,080)Administrative expenses (1,726,064) (1,313,835)Other operating expenses, net (4,456) (1,727)Fair value gains on investment properties, net 3,716,461 1,714,657Finance costs 7 (1,531,336) (1,070,059)Share of profits and losses of:
Associates 513,706 (279)Joint ventures 2,933,397 1,439,857
PROFIT BEFORE TAX 8 13,619,053 5,391,230Income tax expenses 9 (3,562,969) (1,236,396)
PROFIT FOR THE YEAR 10,056,084 4,154,834
Attributable to:Owners of the Company 9,805,813 4,035,415Non-controlling interests 250,271 119,419
10,056,084 4,154,834
Earnings per share attributable to owners of the Company 11
– Basic RMB309 cents RMB128 cents
– Diluted RMB309 cents RMB127 cents
Details of the dividends proposed for the year are disclosed in note 10.

– 3 –
CONSOLIDATED STATEMENT OF COMPREHENSIVE INCOME Year ended 31 December 2019
2019 2018RMB’000 RMB’000
PROFIT FOR THE YEAR 10,056,084 4,154,834
OTHER COMPREHENSIVE LOSSOther comprehensive loss that may be reclassified
to profit or loss in subsequent periods:Exchange differences on translation into presentation currency (373,071) (792,154)Share of exchange differences on translation of joint ventures (72,871) (183,622)
Net other comprehensive loss that may be reclassified to profit or loss in subsequent periods (445,942) (975,776)
Other comprehensive loss that will not be reclassified to profit or loss in subsequent periods:
Exchange differences on translation into presentation currency (182,383) (277,393)
Net other comprehensive loss that will not be reclassified to profit or loss in subsequent periods (182,383) (277,393)
OTHER COMPREHENSIVE LOSS FOR THE YEAR, NET OF TAX (628,325) (1,253,169)
TOTAL COMPREHENSIVE INCOME FOR THE YEAR 9,427,759 2,901,665
Attributable to:Owners of the Company 9,177,488 2,782,246Non-controlling interests 250,271 119,419
9,427,759 2,901,665

– 4 –
CONSOLIDATED STATEMENT OF FINANCIAL POSITION 31 December 2019
2019 2018Notes RMB’000 RMB’000
NON-CURRENT ASSETSProperty, plant and equipment 12 6,411,151 5,351,448Investment properties 27,263,329 17,490,590Land use rights 1,152,384 1,109,471Interests in associates 4,670,441 3,452,270Interests in joint ventures 42,996,460 34,715,581Deferred tax assets 1,872,238 1,642,044Other non-current assets 211,928 —
Total non-current assets 84,577,931 63,761,404
CURRENT ASSETSProperties under development 51,760,690 47,302,324Completed properties held for sale 10,928,887 8,919,658Trade receivables 13 2,166,759 957,665Prepayments, other receivables and other assets 7,401,565 6,406,463Due from a joint venture 30,062 30,069Tax recoverables 722,780 482,606Restricted cash 5,356,141 4,099,329Cash and cash equivalents 51,377,864 52,577,643
Total current assets 129,744,748 120,775,757
CURRENT LIABILITIESTrade and bills payables 14 9,072,301 4,077,063Lease liabilities 230,445 —Other payables and accruals 27,627,042 22,517,471Due to joint ventures 37,742,306 39,294,914Due to associates 1,345,495 592,204Interest-bearing bank and other borrowings 23,728,043 17,363,932Tax payables 9,926,137 6,851,772
Total current liabilities 109,671,769 90,697,356
NET CURRENT ASSETS 20,072,979 30,078,401
TOTAL ASSETS LESS CURRENT LIABILITIES 104,650,910 93,839,805
NON-CURRENT LIABILITIESLease liabilities 1,895,326 —Interest-bearing bank and other borrowings 61,849,507 60,418,315Deferred tax liabilities 2,661,444 1,647,439Deferred revenue 2,042 2,042
Total non-current liabilities 66,408,319 62,067,796
NET ASSETS 38,242,591 31,772,009

– 5 –
2019 2018RMB’000 RMB’000
EQUITYEquity attributable to owners of the CompanyShare capital 303,972 303,784Reserves 35,490,786 28,474,780
35,794,758 28,778,564Non-controlling interests 2,447,833 2,993,445
TOTAL EQUITY 38,242,591 31,772,009

– 6 –
Notes:
1. CORPORATE AND GROUP INFORMATION
The Company was a limited liability company incorporated in the Cayman Islands. The registered office address of the Company is Cricket Square, Hutchins Drive, P.O. Box 2681, Grand Cayman KY1-1111, Cayman Islands.
During the year, the Group was involved in the following principal activities:
• Property development
• Property investment
• Property management
• Hotel operation
In the opinion of the Directors, the immediate and ultimate holding company of the Company is Plus Earn Consultants Limited, which is incorporated in the British Virgin Islands.
2. BASIS OF PREPARATION
These financial statements have been prepared in accordance with Hong Kong Financial Reporting Standards (“HKFRSs”) (which include all Hong Kong Financial Reporting Standards, Hong Kong Accounting Standards (“HKASs”) and Interpretations) issued by the Hong Kong Institute of Certified Public Accountants (“HKICPA”), accounting principles generally accepted in Hong Kong and the disclosure requirements of the Hong Kong Companies Ordinance. They have been prepared under the historical cost convention, except for investment properties which have been measured at fair value. These financial statements are presented in Renminbi (“RMB”) and all values are rounded to the nearest thousand except when otherwise indicated.
Basis of consolidation
The consolidated financial statements include the financial statements of the Group for the year ended 31 December 2019. A subsidiary is an entity (including a structured entity), directly or indirectly, controlled by the Company. Control is achieved when the Group is exposed, or has rights, to variable returns from its involvement with the investee and has the ability to affect those returns through its power over the investee (i.e., existing rights that give the Group the current ability to direct the relevant activities of the investee).
When the Company has, directly or indirectly, less than a majority of the voting or similar rights of an investee, the Group considers all relevant facts and circumstances in assessing whether it has power over an investee, including:
(a) the contractual arrangement with the other vote holders of the investee;(b) rights arising from other contractual arrangements; and(c) the Group’s voting rights and potential voting rights.

– 7 –
The financial statements of the subsidiaries are prepared for the same reporting period as the Company, using consistent accounting policies. The results of the subsidiaries are consolidated from the dates on which the Group obtains control, and continue to be consolidated until the dates that such control ceases.
Profit or loss and each component of other comprehensive income (“OCI”) are attributed to the owners of the Group and to the non-controlling interests, even if this results in the non-controlling interests having a deficit balance. All intra-group assets, liabilities, equity, income, expenses and cash flows relating to transactions between members of the Group are eliminated in full on consolidation.
The Group reassesses whether or not it controls an investee if facts and circumstances indicate that there are changes to one or more of the three elements of control described above. A change in the ownership interest of a subsidiary, without a loss of control, is accounted for as an equity transaction.
If the Group loses control over a subsidiary, it derecognises (i) the assets (including goodwill) and liabilities of the subsidiary, (ii) the carrying amount of any non-controlling interest and (iii) the cumulative translation differences recorded in equity; and recognises (i) the fair value of the consideration received, (ii) the fair value of any investment retained and (iii) any resulting surplus or deficit in profit or loss. The Group’s share of components previously recognised in OCI is reclassified to profit or loss or retained profits, as appropriate, on the same basis as would be required if the Group had directly disposed of the related assets or liabilities.
The Company has set up a trust (the “Trust”) for the purpose of purchasing, administering and holding the Company’s shares for the share award scheme adopted on 19 January 2018. The Group has the power to govern the financial and operating policies of the Trust and derive benefits from the services of the employees who have been awarded the awarded shares through their continued employment with the Group. The assets and liabilities of the Trust are included in the consolidated statement of financial position and the shares held by the Trust are presented as a deduction in equity as shares held for the share award scheme.
3. CHANGES IN ACCOUNTING POLICIES AND DISCLOSURES
The Group has adopted the following new and revised HKFRSs for the first time for the current year’s financial statements.
Amendments to HKFRS 9 Prepayment Features with Negative CompensationHKFRS 16 LeasesAmendments to HKAS 19 Plan Amendment, Curtailment or SettlementAmendments to HKAS 28 Long-term Interests in Associates and
Joint VenturesHK(IFRIC)-Int 23 Uncertainty over Income Tax TreatmentsAnnual Improvements to HKFRSs
2015–2017 Cycle Amendments to HKFRS 3, HKFRS 11, HKAS 12 and
HKAS 23

– 8 –
Other than as explained below regarding the impact of HKFRS 16 Leases , the adoption of the above new and revised standards has had no significant financial effect on these consolidated financial statements.
HKFRS 16
HKFRS 16 replaces HKAS 17 Leases , HK(IFRIC)-Int 4 Determining whether an Arrangement contains a Lease , HK(SIC)-Int 15 Operating Leases — Incentives and HK(SIC)-Int 27 Evaluating the Substance of Transactions Involving the Legal Form of a Lease . The standard sets out the principles for the recognition, measurement, presentation and disclosure of leases and requires lessees to account for all leases under a single on-balance sheet model. Lessor accounting under HKFRS 16 is substantially unchanged from HKAS 17. Lessors will continue to classify leases as either operating or finance leases using similar principles as in HKAS 17. Therefore, HKFRS 16 did not have any financial impact on leases where the Group is the lessor.
The Group adopted HKFRS 16 using the modified retrospective method of adoption with the date of initial application of 1 January 2019. Under this method, the standard is applied retrospectively with the cumulative effect of initial adoption as an adjustment to the opening balance of retained earnings at 1 January 2019, and the comparative information for 2018 was not restated and continues to be reported under HKAS 17.
New definition of a lease
Under HKFRS 16, a contract is, or contains a lease if the contract conveys a right to control the use of an identified asset for a period of time in exchange for consideration. Control is conveyed where the customer has both the right to obtain substantially all of the economic benefits from use of the identified asset and the right to direct the use of the identified asset. The Group elected to use the transition practical expedient allowing the standard to be applied only to contracts that were previously identified as leases applying HKAS 17 and HK(IFRIC)-Int 4 at the date of initial application. Contracts that were not identified as leases under HKAS 17 and HK(IFRIC)-Int 4 were not reassessed. Therefore, the definition of a lease under HKFRS 16 has been applied only to contracts entered into or changed on or after 1 January 2019.

– 9 –
At inception or on reassessment of a contract that contains a lease component, the Group allocates the consideration in the contract to each lease and non-lease component on the basis of their standard-alone prices. A practical expedient is available to a lessee, which the Group has adopted, not to separate non-lease components and to account for the lease and the associated non-lease components (e.g., property management services for leases of properties) as a single lease component.
As a lessee — Leases previously classified as operating leases
Nature of the effect of adoption of HKFRS 16
The Group has lease contracts for various items of properties, vehicles, leasehold land and buildings. As a lessee, the Group previously classified leases as either finance leases or operating leases based on the assessment of whether the lease transferred substantially all the rewards and risks of ownership of assets to the Group. Under HKFRS 16, the Group applies a single approach to recognise and measure right-of-use assets and lease liabilities for all leases, except for two elective exemptions for leases of low-value assets (elected on a lease by lease basis) and short-term leases (elected by class of underlying asset). The Group has elected not to recognise right-of-use assets and lease liabilities for (i) leases of low-value assets (e.g., laptop computers and telephones); and (ii) leases, that at the commencement date, have a lease term of 12 months or less. Instead, the Group recognises the lease payments associated with those leases as an expense on a straight-line basis over the lease term.
Impacts on transition
Lease liabilities at 1 January 2019 were recognised based on the present value of the remaining lease payments, discounted using the incremental borrowing rate at 1 January 2019.
The right-of-use assets were measured at the amount of the lease liability, adjusted by the amount of any prepaid or accrued lease payments and initial direct costs relating to the lease recognised in the statement of financial position immediately before 1 January 2019. All these assets were assessed for any impairment based on HKAS 36 on that date. The Group elected to present the right-of-use assets included in property, plant and equipment, investment properties, land use rights, properties under development and completed properties held for sale in the statement of financial position.
For the leasehold land and buildings (that were held to earn rental income) previously identified as operating leases, the Group included them as investment properties at 1 January 2019. They are measured at fair value applying HKAS 40.
The Group has used the following elective practical expedients when applying HKFRS 16 at 1 January 2019:
• Applied the short-term lease exemptions to leases with a lease term that ends within 12 months from the date of initial application
• Used hindsight in determining the lease term where the contract contains options to extend/terminate the lease

– 10 –
The impacts arising from the adoption of HKFRS 16 as at 1 January 2019 are as follows:
Increase/(decrease)RMB’000
AssetsIncrease in property, plant and equipment 437,847Increase in investment properties 1,406,000Increase in land use rights 31,465Decrease in prepayments, other receivables and other assets (44,542)
Increase in total assets 1,830,770
LiabilitiesIncrease in lease liabilities 2,097,472Increase in deferred tax liabilities 12,959Decrease in other liabilities (318,538)
Increase in total liabilities 1,791,893
Increase in retained earnings 38,877
The lease liabilities as at 1 January 2019 reconciled to the operating lease commitments as at 31 December 2018 is as follows:
RMB’000
Operating lease commitments as at 31 December 2018 2,206,028Weighted average incremental borrowing rate as at 1 January 2019 5.00%Discounted operating lease commitments as at 1 January 2019 1,781,603Add: Other lease commitments 315,869
Lease liabilities as at 1 January 2019 2,097,472

– 11 –
Summary of new accounting policies
The accounting policy for leases as disclosed in the annual financial statements for the year ended 31 December 2018 is replaced with the following new accounting policies upon adoption of HKFRS 16 from 1 January 2019:
Right-of-use assets
Right-of-use assets are recognised at the commencement date of the lease. Right-of-use assets are measured at cost, less any accumulated depreciation and any impairment losses, and adjusted for any remeasurement of lease liabilities. When the right-of-use assets relate to interests in leasehold land held as properties under development and completed properties held for sale, they are subsequently measured at the lower of cost and net realisable value in accordance with the Group’s policy for “property under development” and “completed properties held for sale”. The cost of right-of-use assets includes the amount of lease liabilities recognised, initial direct costs incurred, and lease payments made at or before the commencement date less any lease incentives received. Unless the Group is reasonably certain to obtain ownership of the leased assets at the end of the lease term, the recognised right-of-use assets are depreciated on a straight-line basis over the shorter of the estimated useful life and the lease term. When a right-of-use asset meets the definition of investment property, it is included in investment properties. The corresponding right-of-use asset is initially measured at cost, and subsequently measured at fair value, in accordance with the Group’s policy for “investment properties”.
Lease liabilities
Lease liabilities are recognised at the commencement date of the lease at the present value of lease payments to be made over the lease term. The lease payments include fixed payments (including in-substance fixed payments) less any lease incentives receivable, variable lease payments that depend on an index or a rate, and amounts expected to be paid under residual value guarantees. The lease payments also include the exercise price of a purchase option reasonably certain to be exercised by the Group and payments of penalties for termination of a lease, if the lease term reflects the Group exercising the option to terminate. The variable lease payments that do not depend on an index or a rate are recognised as an expense in the period in which the event or condition that triggers the payment occurs.
In calculating the present value of lease payments, the Group uses the incremental borrowing rate at the lease commencement date if the interest rate implicit in the lease is not readily determinable. After the commencement date, the amount of lease liabilities is increased to reflect the accretion of interest and reduced for the lease payments made. In addition, the carrying amount of lease liabilities is remeasured if there is a modification, a change in future lease payments arising from change in an index or rate, a change in the lease term, a change in the in-substance fixed lease payments or a change in assessment to purchase the underlying asset.

– 12 –
Significant judgement in determining the lease term of contracts with renewal options
The Group determines the lease term as the non-cancellable term of the lease, together with any periods covered by an option to extend the lease if it is reasonably certain to be exercised, or any periods covered by an option to terminate the lease, if it is reasonably certain not to be exercised.
Amounts recognised in the consolidated statement of financial position and profit or loss
The movement of the carrying amounts of the Group’s right-of-use assets (excluded the lands and buildings owned by the Group within the property, plant and equipment, land use rights, properties under development, completed properties held for sale and investment properties) and lease liabilities and the movement during the year are as follow:
Right-of-use assets
Buildings Vehicles
Property, plant and
equipment sub-total
Investment properties
Lease liabilities
RMB’000 RMB’000 RMB’000 RMB’000 RMB’000
As at 1 January 2019 437,847 474,336 912,183 1,406,000 2,097,472Additions 131,673 — 131,673 75,692 146,789Depreciation charge (58,752) (30,525) (89,277) — —Interest expense — — — — 128,262Decrease in fair value — — — (35,692) —Payments — — — — (246,752)
As at 31 December 2019 510,768 443,811 954,579 1,446,000 2,125,771
The Group recognised rental expenses from short-term leases and leases of low-value assets of approximately RMB8,271,000, no variable lease payments and rental income from subleasing right-of-use assets, which were subsequently transferred to investment properties, of approximately RMB37,074,000 for the year ended 31 December 2019.

– 13 –
4. ISSUED BUT NOT YET EFFECTIVE HKFRSs
The Group has not applied the following new and revised HKFRSs, that have been issued but are not yet effective, in these financial statements.
Amendments to HKFRS 3 Definition of a Business1
Amendments to HKFRS 9, HKAS 39 and HKFRS 7
Interest Rate Benchmark Reform1
Amendments to HKFRS 10 and HKAS 28 (2011)
Sale or Contribution of Assets between an Investor and its Associate or Joint Venture3
HKFRS 17 Insurance Contracts2
Amendments to HKAS 1 and HKAS 8 Definition of Material1
1 Effective for annual periods beginning on or after 1 January 20202 Effective for annual periods beginning on or after 1 January 20213 No mandatory effective date yet determined but available for adoption
The Group is in the process of making an assessment of the impact of these new and revised HKFRSs upon initial application. So far, the Group considers that, these new and revised HKFRSs are unlikely to have a significant impact on the Group’s results of operations and financial position.
5. OPERATING SEGMENT INFORMATION
For management purposes, the Group is organised into four reportable operating segments as follows:
(a) Property development: Sale of properties(b) Property investment: Leasing of properties(c) Hotel operation: Operation of hotels(d) Property management: Provision of property management services
The property development projects undertaken by the Group during the year are mainly located in Mainland China and Hong Kong.
Management monitors the results of the Group’s operating segments separately for the purpose of making decisions about resources allocation and performance assessment. Segment performance is evaluated based on reportable segment profit/loss, which is a measure of adjusted profit/loss before tax. The adjusted profit/loss before tax is measured consistently with the Group’s profit before tax except that interest income, finance costs, as well as head office and corporate income and expenses are excluded from such measurement.
The Group’s revenue from external customers is derived solely from its operations in Mainland China.
During 2019 and 2018, no revenue from transactions with a single external customer amounted to 10% or more of the Group’s total revenue.

– 14 –
Year ended 31 December 2019
Property development
Property investment
Hotel operation
Property management Total
RMB’000 RMB’000 RMB’000 RMB’000 RMB’000
Segment revenue:Sales to external customers 22,761,946 626,909 553,098 1,014,308 24,956,261
Segment results 9,189,911 4,174,760 188,160 406,129 13,958,960
Reconciliation:Interest income and unallocated
income 2,858,916Unallocated expenses (1,667,487)Finance costs (1,531,336)
Profit before tax 13,619,053Income tax expenses (3,562,969)
Profit for the year 10,056,084
Other segment information:Depreciation and amortisation 91,491 13,922 149,145 8,539 263,097Fair value gains on investment
properties, net — 3,716,461 — — 3,716,461Share of profits and losses of:
Associates 513,706 — — — 513,706Joint ventures 2,933,397 — — — 2,933,397
– 15 –
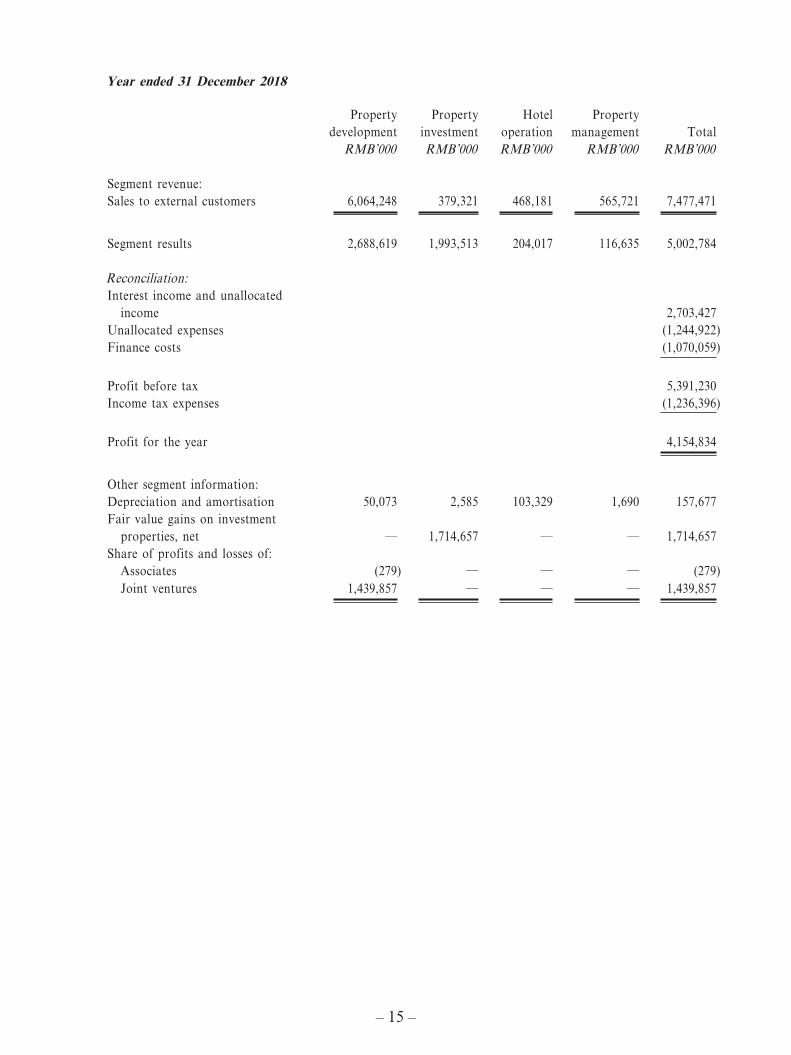
Year ended 31 December 2018
Property development
Property investment
Hotel operation
Property management Total
RMB’000 RMB’000 RMB’000 RMB’000 RMB’000
Segment revenue:Sales to external customers 6,064,248 379,321 468,181 565,721 7,477,471
Segment results 2,688,619 1,993,513 204,017 116,635 5,002,784
Reconciliation:Interest income and unallocated
income 2,703,427Unallocated expenses (1,244,922)Finance costs (1,070,059)
Profit before tax 5,391,230Income tax expenses (1,236,396)
Profit for the year 4,154,834
Other segment information:Depreciation and amortisation 50,073 2,585 103,329 1,690 157,677Fair value gains on investment
properties, net — 1,714,657 — — 1,714,657Share of profits and losses of:
Associates (279) — — — (279)Joint ventures 1,439,857 — — — 1,439,857

– 16 –
6. REVENUE, OTHER INCOME AND GAINS, NET
An analysis of revenue, other income and gains, net is as follows:
2019 2018RMB’000 RMB’000
Revenue:Revenue from contracts with customers
Sale of properties 22,761,946 6,064,248Hotel operation income 553,098 468,181Property management fee income 1,014,308 565,721
Revenue from other sourcesGross rental income 626,909 379,321
24,956,261 7,477,471
Other income and gains, net:Interest income 949,330 482,259Foreign exchange differences, net 96,405 683,693Management fee income 366,105 213,520Gains on derecognition of subsidiaries 691,361 —Gain on acquisition of a joint venture 129,350 —Gain on disposal of a joint venture 134,095 —Gain on disposal of a subsidiary — 1,167,368Others 492,270 156,587
2,858,916 2,703,427
Set out below is the disaggregation of the Group’s revenue from contracts with customers for the year ended 31 December 2019:
Property development
Hotel operation
Property management Total
RMB’000 RMB’000 RMB’000 RMB’000
Type of revenue recognition:Sales of properties 22,761,946 — — 22,761,946Provision of services — 553,098 1,014,308 1,567,406
Total revenue from contracts with customers 22,761,946 553,098 1,014,308 24,329,352
Timing of revenue recognition:Recognised at a point in time 19,517,733 — — 19,517,733Recognised over time 3,244,213 553,098 1,014,308 4,811,619
Total revenue from contracts with customers 22,761,946 553,098 1,014,308 24,329,352

– 17 –
Set out below is the disaggregation of the Group’s revenue from contracts with customers for the year ended 31 December 2018:
Property development
Hotel operation
Property management Total
RMB’000 RMB’000 RMB’000 RMB’000
Type of revenue recognition:Sales of properties 6,064,248 — — 6,064,248Provision of services — 468,181 565,721 1,033,902
Total revenue from contracts with customers 6,064,248 468,181 565,721 7,098,150
Timing of revenue recognition:Recognised at a point in time 3,932,535 — — 3,932,535Recognised over time 2,131,713 468,181 565,721 3,165,615
Total revenue from contracts with customers 6,064,248 468,181 565,721 7,098,150
7. FINANCE COSTS
An analysis of the Group’s finance costs is as follows:
2019 2018RMB’000 RMB’000
Interest on bank and other borrowings 6,209,762 4,424,211Interest on lease liabilities 128,262 —Less: Interest capitalised (4,806,688) (3,354,152)
1,531,336 1,070,059

– 18 –
8. PROFIT BEFORE TAX
The Group’s profit before tax is arrived at after charging/(crediting):
2019 2018RMB’000 RMB’000
Cost of properties sold 16,101,134 4,419,555Less: Government grant released (261) (336)
16,100,873 4,419,219
Cost of services provided 989,608 606,983Depreciation 252,059 148,916
Amortisation of land use rights 34,018 31,464Less: Amount capitalised in assets under construction (22,980) (22,703)
11,038 8,761
Employee benefit expense* (excluding Directors’ and chief executive’s remuneration):Wages and salaries 1,489,282 1,036,599Share based compensation expenses 18,858 24,905Pension scheme contributions (defined benefit plans) 133,748 99,028
1,641,888 1,160,532Less: Amounts capitalised in assets under construction,
properties under development and investment properties under development (492,318) (255,208)
1,149,570 905,324
Foreign exchange difference, net (96,405) (683,693)Loss on disposal of items of property, plant and equipment** 314 112Direct operating expenses (including repairs and maintenance
arising on rental investment properties) 43,765 30,708
* Employee benefit expenses are included in “Cost of sales”, “Selling and marketing expenses” and “Administrative expenses” in the consolidated statements of profit or loss.
** These items are included in “Other operating expenses, net” in the consolidated statement of profit or loss.

– 19 –
9. INCOME TAX EXPENSES
2019 2018RMB’000 RMB’000
Current – PRCCorporate income tax (“CIT”) 1,802,280 732,340Land appreciation tax (“LAT”) 1,008,773 322,156
2,811,053 1,054,496Deferred 751,916 181,900
Total tax charge for the year 3,562,969 1,236,396
Hong Kong profits tax
No Hong Kong profits tax has been provided because the Group did not generate any assessable profits arising in Hong Kong during the years ended 31 December 2019 and 2018.
PRC CIT
PRC CIT in respect of operations in Mainland China has been calculated at the applicable tax rate on the estimated assessable profits for the years ended 31 December 2019 and 2018, based on existing legislation, interpretations and practices in respect thereof.
PRC LAT
PRC LAT is levied at progressive rates ranging from 30% to 60% on the appreciation of the land value, being the proceeds of sale of properties less deductible expenditures including amortisation of land use rights, borrowing costs and all property development expenditures.
10. DIVIDENDS
2019 2018RMB’000 RMB’000
Proposed final dividend (with scrip option) – RMB42 cents (2018: final dividend (with scrip option) of RMB31 cents) per ordinary share 1,334,235 983,962
Interim dividend declared – RMB32 cents (2018: RMB25 cents) per ordinary share 1,020,309 788,789
2,354,544 1,772,751

– 20 –
On 28 August 2019, the Board declared the payment of the 2019 interim dividend of RMB32 cents per share (30 June 2018: RMB25 cents), totalling approximately RMB1,020,309,000. The interim dividend for the year is made out of the share premium account of the Company.
The proposed final dividend for the year, to be made out of the share premium account of the Company, is subject to the approval of the Company’s shareholders at the forthcoming annual general meeting (the “2020 AGM”).
11. EARNINGS PER SHARE ATTRIBUTABLE TO OWNERS OF THE COMPANY
The calculation of the basic earnings per share amounts is based on the profit for the year attributable to owners of the Company, and the weighted average number of ordinary shares of 3,174,303,108 (2018: 3,162,393,416) in issue during the year.
For the year ended 31 December 2019, the calculation of the diluted earnings per share amounts is based on the profit for the year attributable to owners of the Company, and the weighted average number of ordinary shares used in the calculation is the number of ordinary shares in issue during the year, as used in the basic earnings per share calculation of 3,174,303,108 (31 December 2018: 3,162,393,416) plus the weighted average number of ordinary shares assumed to have been issued at no consideration on the deemed exercise or conversion of all dilutive potential ordinary shares into ordinary shares of 4,228,916 (31 December 2018: 4,049,519).
The calculations of basic and diluted earnings per share amounts are based on:
2019 2018RMB’000 RMB’000
EarningsProfit attributable to owners of the Company 9,805,813 4,035,415
Number of shares2019 2018
SharesWeighted average number of ordinary shares in issue during the
year used in basic earnings per share calculation 3,174,303,108 3,162,393,416Effect of dilution – awarded shares 4,228,916 4,049,519
Weighted average number of ordinary shares used in diluted earnings per share calculation 3,178,532,024 3,166,442,935
12. PROPERTY, PLANT AND EQUIPMENT
For the year ended 31 December 2019, the Group had additions of property, plant and equipment at a total cost of approximately RMB938,234,000 (2018: approximately RMB1,036,927,000).

– 21 –
13. TRADE RECEIVABLES
Trade receivables mainly consist of receivables from the sale of properties, rentals under operating leases, provision of property management services and hotel operation. The payment terms of the sale of properties are stipulated in the relevant sale and purchase agreements, whilst the Group’s trading terms with its customers in relation to the provision of rental, property management and other services are mainly on credit, except for new customers, where payment in advance is normally required. The credit period is generally within 12 months for major customers. An ageing analysis of the trade receivables as at the end of the reporting period is as follows:
2019 2018RMB’000 RMB’000
Within 3 months 1,654,053 800,6534 to 6 months 22,434 32,3567 to 12 months 363,656 87,605Over 1 year 126,616 37,051
2,166,759 957,665
14. TRADE AND BILLS PAYABLES
An ageing analysis of the trade and bills payables as at the end of the reporting period is as follows:
2019 2018RMB’000 RMB’000
Within one year 9,072,301 4,077,063
The trade and bills payables are non-interest-bearing and are normally settled on demand.
15. SUBSEQUENT EVENTS
On 13 January 2020, the Company issued 7.4% senior notes with an aggregate principal amount of US$300,000,000 (equivalent to approximately RMB2,077,890,000). The senior notes are redeemable at the option of the Company at certain predetermined prices in certain specific periods prior to the maturity date of 13 January 2027. The senior notes carry interest at a rate of 7.4% per annum, which is payable semi-annually in arrears on 13 January and 13 July of each year commencing on 13 July 2020. For further details on the senior notes, please refer to the related announcements of the Company dated 7 January 2020 and 13 January 2020.
On 17 March 2020, Guangzhou Hejing Holdings Group Limited* (廣州合景控股集團有限公司), a wholly-owned subsidiary of the Group, issued domestic corporate bonds in the PRC with an aggregate principal amount of RMB1,000,000,000.
* for identification purposes only

– 22 –
MANAGEMENT DISCUSSION AND ANALYSIS
Financial Review
Revenue
Revenue of the Group comprises primarily the (i) gross proceeds from the sale of properties, (ii) gross recurring revenue received and receivable from investment properties, (iii) gross revenue from hotel room rentals, food and beverage sales and other ancillary services when the services are rendered and (iv) property management fee income. The revenue is primarily generated from its four business segments: property development, property investment, hotel operation and property management.
The revenue amounted to approximately RMB24,956.3 million in 2019, representing a significant increase of 233.8% from approximately RMB7,477.5 million in 2018.
In 2019, the revenue generated from property development, property investment, hotel operation and property management were approximately RMB22,761.9 million, RMB626.9 million, RMB553.1 million and RMB1,014.4 million, respectively.
Proportionate revenue amounted to approximately RMB38,954.1 million in 2019, representing an increase of 72.4% from approximately RMB22,594.4 million in 2018.
Property development
Revenue generated from property development significantly increased by 275.3% to approximately RMB22,761.9 million in 2019 from approximately RMB6,064.2 million in 2018, primarily due to an increase in the total gross floor area (“GFA”) delivered to 1,771,190 sq.m. in 2019 from 400,602 sq.m. in 2018.
Despite the increase in GFA delivered, the average selling price (“ASP”) decreased from 15,137 per sq.m in 2018 to RMB12,851 per sq.m in 2019, reflecting a change in delivery portfolio with different city mix and product mix as compared with that for the corresponding period in 2018.
Proportionate revenue generated from property development increased by 72.5% to approximately RMB36,544.9 million in 2019 from approximately RMB21,181.1 million in 2018.

– 23 –
Property investment
Revenue generated from property investment significantly increased by 65.3% to approximately RMB626.9 million in 2019 from approximately RMB379.3 million in 2018, primarily due to an increased leaseable GFA from leased investment properties.
Hotel operation
Revenue generated from hotel operation increased by 18.1% to approximately RMB553.1 million in 2019 from approximately RMB468.2 million in 2018, primarily due to an increase in occupancy rate of the hotels.
Property management
Revenue generated from property management increased by 79.3% to approximately RMB1,014.4 million in 2019 from approximately RMB565.8 million in 2018, primarily due to an increase in the number of properties under management.
Cost of Sales
Cost of sales of the Group primarily represents the costs incurred directly for the Group’s property development activities. The principal component of cost of sales is cost of properties sold, which includes the direct cost of construction, cost of obtaining land use rights and capitalised borrowing costs on related borrowed funds during the period of construction.
Cost of sales significantly increased by 240.0% to approximately RMB17,090.5 million in 2019 from approximately RMB5,026.2 million in 2018, mainly due to the increase in total GFA delivered in sales of properties.
Land cost per sq.m. decreased from RMB3,750 in 2018 to RMB3,102 in 2019.
Construction cost per sq.m. decreased from RMB5,829 in 2018 to RMB4,626 in 2019, due to the change in delivery portfolio with different city mix compared with that in 2018.
Proportionate core cost of sales increased by 82.4% to approximately RMB26,580.1 million in 2019 from approximately RMB14,574.8 million in 2018, primarily due to the increase of total proportionate GFA delivered in sales of properties.
Gross Profit
Gross profit of the Group significantly increased by 220.9% to approximately RMB7,865.8 million in 2019 from approximately RMB2,451.3 million in 2018. The increase of gross profit was principally due to the increase in the total revenue in 2019. The Group reported gross profit margin of 31.5% for 2019 as compared with 32.8% for 2018.

– 24 –
Proportionate core gross profit of the Group increased by 54.3% to approximately RMB12,374.0 million in 2019 from approximately RMB8,019.6 million in 2018. The Group reported proportionate core gross profit margin of 31.8% in 2019 (2018: 35.5%).
Other Income and Gains, Net
Other income and gains increased by 5.8% to approximately RMB2,858.9 million in 2019 from approximately RMB2,703.4 million in 2018, mainly comprising interest income and gains on derecognition of subsidiaries of approximately RMB949.3 million and RMB691.4 million respectively.
Selling and Marketing Expenses
Selling and marketing expenses of the Group increased by 89.3% to approximately RMB1,007.4 million in 2019 from approximately RMB532.1 million in 2018, mainly due to the increase in sales commission with the rapid growth of revenue, and an increase in advertising expenses in conjunction with launching of 36 new grand projects during 2019.
Administrative Expenses
Administrative expenses of the Group increased by 31.4% to approximately RMB1,726.1 million in 2019 from approximately RMB1,313.8 million in 2018, primarily attributable to increased headcounts to catch up with the rapid development of the Group in various regional offices in order to achieve its long term goal. The Group believes that people are key elements for future growth and grasping the opportunities ahead. The Group also provided extensive training, built incentive schemes as well as a teamwork-oriented corporate culture with high sense of belonging to retain experienced employees.
Other Operating Expenses, Net
Other operating expenses of the Group was approximately RMB4.5 million in 2019 (2018: approximately RMB1.7 million).
Fair Value Gains on Investment Properties, Net
The Group reported fair value gains on investment properties of approximately RMB3,716.5 million for 2019 (2018: approximately RMB1,714.7 million), mainly related to various leaseable commercial properties in various regions.
– 25 –
Finance Costs
Finance costs of the Group being approximately RMB1,531.3 million in 2019 (2018: approximately RMB1,070.1 million), were related to the borrowing costs on certain general corporate loans and partial senior notes. Since such borrowings were not earmarked for project development, thus they have not been capitalised.
Income Tax Expenses
Income tax expenses increased by 188.2% to approximately RMB3,563.0 million in 2019 from approximately RMB1,236.4 million in 2018, primarily due to an increase in provision of LAT and CIT as a result of the increase in the total GFA delivered from sales of properties in 2019.
Profit for the Year
The Group reported profit for the year of approximately RMB10,056.1 million in 2019 (2018: approximately RMB4,154.8 million). Proportionate net profit margin was 25.8% (2018: 18.4%).
Liquidity, Financial and Capital Resources
Cash Position
As at 31 December 2019, the carrying amounts of the Group’s cash and bank balances were approximately RMB56,734.0 million (31 December 2018: approximately RMB56,677.0 million).
Pursuant to relevant regulations in the PRC, certain property development companies of the Group are required to place a certain amount of pre-sales proceeds received at designated bank accounts as guarantee deposits for construction of the relevant properties. As at 31 December 2019, the carrying amount of the restricted cash was approximately RMB5,356.1 million (31 December 2018: approximately RMB4,099.3 million).
Borrowings and Charges on the Group’s Assets
As at 31 December 2019, the Group’s bank and other loans, senior notes and domestic corporate bonds were approximately RMB35,573.9 million, RMB25,191.6 million and RMB24,812.1 million respectively. Amongst the bank and other loans, approximately RMB8,219.7 million will be repayable within 1 year, approximately RMB18,565.0 million will be repayable between 2 and 5 years and approximately RMB8,789.2 million will be repayable over 5 years. Amongst the senior notes, approximately RMB3,811.6 million will be repayable within 1 year, approximately RMB21,380.0 million will be

– 26 –
repayable between 2 and 5 years. Amongst the domestic corporate bonds, approximately RMB11,696.8 million will be repayable within 1 year and approximately RMB13,115.3 million will be repayable between 2 and 3 years.
As at 31 December 2019, the Group’s bank and other loans of approximately RMB31,493.1 million were secured by buildings, land use rights, investment properties, properties under development, completed properties held for sale and time deposits of the Group with total carrying value of approximately RMB34,620.7 million, and equity interests of certain subsidiaries of the Group. The senior notes were jointly and severally guaranteed by certain subsidiaries of the Group and were secured by the pledges of their shares. The Group’s domestic corporate bonds were guaranteed by the Company.
The carrying amounts of all the Group’s bank and other loans were denominated in RMB except for certain loan balances with an aggregate amount of approximately RMB5,813.2 million as at 31 December 2019 which were denominated in Hong Kong dollar of approximately RMB3,348.3 million and denominated in U.S. dollar of approximately RMB2,464.9 million respectively. All of the Group’s bank and other loans were charged at floating interest rates except for loan balances with an aggregate amount of RMB6,914.6 million which were charged at fixed interest rates as at 31 December 2019. The Group’s senior notes were denominated in U.S. dollar and charged at fixed interest rates as at 31 December 2019. The Group’s domestic corporate bonds were denominated in RMB and charged at fixed interest rates as at 31 December 2019.
Gearing Ratio
The gearing ratio is measured by the net borrowings (total borrowings net of cash and cash equivalents and restricted cash) over the total equity. As at 31 December 2019, the gearing ratio was 75.4% (31 December 2018: 66.4%).
Risk of Exchange Rate Fluctuation
The Group mainly operates in Mainland China, so most of its revenues and expenses are measured in RMB. In addition, except for the above mentioned, the Company’s domestic corporate bonds were denominated in RMB. The value of RMB against the U.S. dollar and other currencies may fluctuate and is affected by, among other things, changes in the PRC’s political and economic conditions. The conversion of RMB into foreign currencies, including the U.S. dollar and the Hong Kong dollar, has been based on rates set by the People’s Bank of China.
During 2019, the exchange rates of RMB against the U.S. dollar and the Hong Kong dollar decreased and the Board expects that any fluctuation of RMB’s exchange rate will not have material adverse effect on the operation of the Group.

– 27 –
Contingent Liabilities
(i) As at 31 December 2019, the Group had the following contingent liabilities relating to guarantees in respect of mortgage facilities for certain purchasers amounting to approximately RMB16,765.5 million (31 December 2018: approximately RMB8,117.1 million). This represented the guarantees in respect of mortgage facilities granted by banks relating to the mortgage loans arranged for purchasers of the Group’s properties. Pursuant to the terms of the guarantees, upon default in mortgage payments by these purchasers, the Group is responsible to repay the outstanding mortgage principals together with accrued interests and penalties owed by the defaulting purchasers to the banks and the Group is entitled to take over the legal title and possession of the related properties. The Group’s guarantee period starts from the dates of grant of the relevant mortgage loans and ends upon issuance of real estate ownership certificates which will generally be available within one to two years after the purchasers take possession of the relevant properties.
The fair value of the guarantees is not significant and the Board considers that in case of default in payments, the net realisable value of the related properties will be sufficient to cover the repayment of the outstanding mortgage principals together with the accrued interests and penalties and therefore no provision has been made in the financial statements as at 31 December 2019 and 2018 for the guarantees.
(ii) As at 31 December 2019 and 2018, the Group had provided guarantees in respect of certain bank loans for joint ventures and associates.
Market Review
Under the guiding principles of “differentiated regulatory policies for different cities” and “housing properties for accommodation, not for speculative trading”, the nationwide property market reached a record-high industry scale in 2019. Nationwide property development investment increased 9.9% year-on-year to RMB13 trillion, while nationwide commodity properties sales increased 6.5% year-on-year to around RMB16 trillion. Under the circumstances, “stability” remained the emphasis of the government’s regulatory policy of the real estate industry. Market regulation was gradually normalised as the grip on credit supply continued to tighten. The polarisation of property developers remained evident as leading players continued to expand, while small and medium enterprises faced escalating fragmentation in scale. The overall property market remained stable.
In 2019, the China-U.S. trade war remained uncertain, while international exchange rates were subject to notable volatility. Against such macro-environment, China reported a 6.1% year-on-year GDP growth in continuation of general stability with moderate growth. In connection with the real estate industry, the Central Government continued to emphasise the principle of “housing properties for accommodation, not speculative trading” and adopted the policies of “each city adopting its own customised

– 28 –
measures” and “differentiated regulatory policies for different cities”. Specifically, the overall policy of the government had encouraged optimistic market expectations in the first quarter, orchestrating a turnaround to growth from the overall downward trend dominating the second half of 2018. With the resurgence of consumer confidence and positive sentiments, the land market saw a noticeably stronger enthusiasm during the second quarter, which was immediately met by government actions to escalate restrictions against property purchase and sales for cities where markets were considered overheated, and land acquisition policies in some cities were also adjusted. Financing was further tightened during the third quarter. Property sales in selected cities were boosted during the fourth quarter as many cities relaxed their policy for talents residency registration. For example in Greater-Bay-Area, cities such as Guangzhou, Shenzhen, Foshan, Dongguan, Zhongshan, Jiangmen, Zhuhai, Hong Kong and Macau, the direct measure of moderately relaxing purchase restrictions was complemented by the easing of talents residency registration and raising the cap for provident fund loans. Subject to overall market stability, a policy of relaxing purchase restrictions to an extent controllable was implemented.
Business Review
The Group’s pre-sales for 2019 amounted to RMB86.1 billion in aggregate, representing a year-on-year increase of 31.5%. ASP stood at approximately RMB17,500 per sq.m., a mild increase by 6% compared to 2018. Analysed by contribution to pre-sales amount, among the 118 projects currently for sale, 43% were from Yangtze-River-Delta Area and 30% were from Greater-Bay-Area; analysed by the ranking of cities, 89% were from tier-one and tier-two cities.
In 2019, the Group launched 36 brand new projects, including Guangzhou The Jadeite, Guangzhou Montkam, Foshan Apex, Jiangmen Apex, Hong Kong Upper RiverBank, Beijing Niulanshan 1107# Project, Hangzhou Malus Moon, Suzhou Swan Harbor Park, Taizhou Star Mansion, Jiaxing Noble Peak, Wuxi Exquisite Palace, Chongqing The Moon Mansion and Nanning Impression Discovery Bay, etc. In particular, Guangzhou The Jadeite and Hong Kong Upper RiverBank have attracted wide attention from the market with their prestigious locations and premium product quality.
Guangzhou The Jadeite is a rare premium residential site located in the Tianhe Park area in Guangzhou Tianhe District. The project is in proximity to Tianhe Park Metro Station, an interchange point for Guangzhou Metro Lines 21, 11 and 13, and just 10 minutes’ drive accessible from Pearl River New Town. Surrounded by high-rise towers in the CBD yet embracing the green views of the 700,000 sq.m. Tianhe Park, the development has attracted Shunmyō Masuno, the renowned Japanese garden designer to craft the garden landscape for the project, “using stones in place of hills and sand in place of water”, allowing residents to enjoy the beauty of nature amidst the hustle and bustle of city life.

– 29 –
Hong Kong Upper RiverBank is located in Kai Tak, Hong Kong Kowloon East, a widely-acclaimed development initiative of the city commanding multi-billion investments. It is backed by innovative planning and infrastructure construction, which is complemented by ease of access from various transportation networks. The residential project is within two minutes’ walk from the Kai Tak MTR Station. The high-rise twin towers on the flanks capture a panoramic view, while the low-rise mansions alongside the Kai Tak River enjoy waterside tranquility and blend into the garden landscapes. Major upgrades in interior layout design, smart home living, ancillary facilities and building materials have ensured sustained interest of buyers. Residents will also be able to enjoy entertainment at the one-of-a-kind British-style Twin Clubhouse and children’s clubhouse.
The Group seeks qualitative growth by persisting with a customer-centric approach and the quest for innovative changes. With the consistent supply of premium products and effort to improve service standards for better customer experience, the Group has enhanced customer loyalty and extensive brand recognition in the industry. In 2019, the Group claimed a number of accolades in the brand, residential and commercial categories hosted by renowned institutions such as China Index Academy, Guandian and The Time Weekly, etc.: 2019 Top 30 Listed PRC Property Developers, 2019 China Mainland Top 10 Real Estate Companies Listed in Hong Kong by Comprehensive Strengths, 2019 Top 500 Chinese Private Enterprises, Gold Medal Competitiveness Award of Greater-Bay-Area, Yangtze-River-Delta Area Outstanding Contribution Award of Property Companies, Asia’s Best Growth Potential Hotel Group (The Mulian Hotels), Excellent Commercial Real Estate Operator of the Year and 2019 China’s Top 100 Property Services Enterprises Top 18.
In 2019, the Group continued to further explore opportunities in Greater-Bay-Area and Yangtze-River-Delta Area with a strong focus on tier-one and tier-two cities. The Group acquired premium land sites through tenders, auctions and listings in the public market while also actively participating in mergers and acquisitions and joint developments to obtain land at more favourable costs. During the reporting period, the Group successfully acquired 26 projects in tier-one cities such as Guangzhou, Beijing, Shanghai and Shenzhen and top tier-two cities such as Hangzhou, Chongqing and Nanning, adding 3.74 million sq.m. of gross GFA for a total gross land cost of RMB27.6 billion, which increased the gross sellable resources by approximately RMB73 billion. Analysed by GFA, approximately 74% of the new GFA was acquired through mergers and acquisitions and joint developments to enable us to replenish premium land reserves at lower costs.
As at 31 December 2019, the Group owned 156 projects in 39 cities across Mainland China and Hong Kong with an attributable land bank of approximately 17.01 million sq.m. and gross sellable resources of approximately RMB510 billion, which is sufficient for the Group’s development in the next 3 to 5 years.

– 30 –
Recurring Income
Originally based in Guangzhou and expanded throughout China with a focus on core regions such as Greater-Bay-Area, Yangtze-River-Delta Area, Bohai-Rim Region, Chengdu, Chongqing and Nanning, KWG Group has a number of commercial projects in operation, including 8 shopping malls, 8 office buildings and 17 hotels after years of development. KWG has now become an operator to impart energy into city life by identifying the commercial potential and delivering long-term commercial value.
The Group’s attributable recurring income for 2019 amounted to RMB2.43 billion, a significant growth of 49% as compared to the corresponding period of last year. All commercial properties currently in operation are located in core areas and new CBDs in tier-one and tier-two cities, providing assurance for the Group’s stable recurring income. Matured operating shopping malls have a 52% operating profit margin, while the operating profit margin could be up to 86% for matured office buildings. Such projects have provided the Group with stable cash inflow and profit on an ongoing basis.
(1) Shopping mall
The Group is aspired to build an image and character of a city. Based on in-depth research on consumers’ experiences, the Group seeks to develop comprehensive shopping experience by providing a rich variety of brands, with a sensitive commercial space and a highly distinctive city footprint. As the two main shopping mall brands of the Group, “U Fun” is focused on fostering a fashionable, healthy and refined LOHAS lifestyle that embodies the enjoyment and passion for life, while “M • Cube” provides a venue where the young and fashionable get a definitive taste of latest trends and fashions.
In 2019, the Group welcomed the grand openings of Guangzhou Nansha U Fun and Foshan U Fun Shopping Malls. Designed to be a pedestrian walk zone for leisure metropolitan life within The Horizon Nansha, Guangzhou Nansha U Fun is currently hosting about 200 brand names to provide a refined and fashionable leisure space for people working and living in the neighbourhood. Foshan U Fun is located within Foshan Oriental Bund adjacent to Lanshi Metro Station of the Guangzhou-Foshan Metro Line and designed to be an exquisite neighbourhood facility that provides fine dining, family activities, leisure and pet space for residents living nearby.
Currently, the Group has 8 shopping malls in operation, variously located in Guangzhou, Beijing, Shanghai, Chengdu, Suzhou and Foshan with an aggregate GFA of 700,000 sq.m. in operation. These shopping malls reported significant increase in shopper flow and retail sales for the year with stable growth in occupancy rate.

– 31 –
In 2020, we will welcome the opening of three brand new projects alongside Chengdu U Fun, which is already in operation — Chengdu M • Cube, Chengdu U8 Pub Street and Chengdu W Hotel. Together with Chengdu U Fun, these three new projects will form a larger commercial cluster by providing a more comprehensive business coverage in the Financial High-tech District of Chengdu. They are set to stimulate retail spending and enrich the commercial activities in the area, creating commercial bustle which combines purposeful spending with casual shopping to unleash the city’s energy and spending powers.
In the future, more new shopping malls will be coming on stream in tier-one and tier-two cities such as Beijing, Guangzhou, Chengdu, Suzhou, Nanning and Chongqing. Given the steady growth in rental and occupancy rates for shopping malls in operation as they become well-developed, coupled with the shopping malls to be opened in the future providing a new engine for rental income growth, the Group is expected a significant growth in rental income generated from shopping malls in the coming two to three years.
(2) Hotel
In 2019, the Group’s hotel segment opened 8 new Mulian Hotels with an asset-light model, including Mulian Hotels at Canton Fair, Nansha Phoenix Lake and Luogang Science City in Guangzhou, Bantian in Shenzhen, Xixi Lingyin Temple in Hangzhou, International Expo Centre in Wuhan, Wanxianghui in Xi’an and Dayi in Chengdu.
The Mulian Hotel at Guangzhou Canton Fair is located on the Guangzhou International Biological Island, a key incubation base for bio-technology and pharmaceutical research. The hotel is within a 15-minute drive from Canton Fair, Pearl River New Town and Financial City. The Mulian Hotel at Guangzhou Nansha Phoenix Lake is located within the well-developed complex of The Horizon in Nansha, complemented by Nansha U Fun which provides a wide range of entertainment facilities. The Mulian Hotel at Guangzhou Luogang Science City, situated next to the Huangpu District Government Office and close to Wanda Plaza, provides a convenient stopover for business travelers. The Shenzhen Bantian Mulian Hotel near the Huawei Headquarters in Longgang offers convenient and enjoyable accommodation to business travelers. The Mulian Hotel at Hangzhou Xixi Lingyin Temple near Lingyin Temple and Xixi Wetland Park is a perfect blend of natural landscape and the thriving business districts in the neighbourhood. The Mulian Hotel at Wuhan International Expo Centre is located within Hanyang Commercial Centre with a complete range of ancillary facilities. The Mulian Hotel at Xi’an Wanxianghui is located within the busiest CBD in High-tech District. The Chengdu Dayi Mulian Hotel distinguishes itself with a Chinese-styled garden landscape blending with natural scenery that offers patrons a haven of tranquility.

– 32 –
Currently, the Group has 17 hotels in operation with an aggregate GFA of 360,000 sq.m. which include hotels managed and operated under international brands such as Marriot, Hilton and Hyatt, as well as our own brand of The Mulian Hotels. As the proprietary hotel brand of KWG Group, The Mulian Hotels are positioned to serve the middle- to high-end market. Product line currently in operation comprises mainly light-luxury business hotels targeted at business travelers. In the future, the Group is planning to open boutique hotels, resort hotels and cultural B&Bs as three new product lines, aiming to provide lively and inspiring accommodation designed for young patrons from all walks of life.
In 2020, we will welcome the opening of Chengdu W Hotel, while The Mulian Hotel will continue to expand in major tier-one and tier-two cities in China with an asset-light approach. As The Mulian Hotels in operation grow in maturity, their room rates and occupancy rates will improve steadily, while the opening of new hotels in the future will also boost the growth in hotel revenue. From the earlier model of asset-heavy operation within property complexes to the asset-light model combining lease and franchise adopted during the past year, the business development, marketing and operation teams of The Mulian Hotel has delivered notable results through their creative approach. The Mulian Hotel brand has proved to be a success in the building of brand value and market influence and more can be expected in the future.
(3) Office
At present, the Group owns 8 offices with an aggregate GFA of 350,000 sq.m. in operation in the CBDs of tier-one and top tier-two cities, such as Guangzhou, Shanghai, Chengdu, Suzhou and Nanning. The offices have provided stable cash flow to the Group with rental income. Offices in Guangzhou that have commenced operation include International Finance Place and International Metropolitan Plaza in Pearl River New Town, International Commerce Place in Pazhou and Colorland Center in Nansha. Office in Shanghai is International Metropolitan Plaza in Pudong Bund. Offices in Chengdu, Suzhou and Nanning include Chengdu International Commerce Place in the Financial High-tech District, Leader Plaza in Suzhou Industrial Park and Guangxi International Finance Place at the headquarters in Nanning Wuxiang New District. All of the offices mentioned above are located within the CBDs of tier-one and tier-two cities, boasting high occupancy rates on the back of their prestigious locations, convenient transportation access, strong pedestrian flow, vigorous commercial activities and well-developed office operations. While internationally advanced standards of the design and quality of our A+ office towers are an indication of the Group’s solid strengths in office tower construction, the stringent and detailed property management and brand value serve as a fine testament to the Group’s soft strengths in office operation. Following years of meticulous effort, A+ office towers built by the Group have become landmarks mirroring the images of the cities where they are located.

– 33 –
In the future, more office buildings will come into operation, such as KWG Center in the core canal zone of Tongzhou District, a sub-civic centre in Beijing, and KWG Center in Guangzhou Development Zone, which will contribute to the rapid growth of recurring income.
The Group will continue to further explore the business opportunities of commercial properties for a profitable future. Over years of operations in the market, the commercial segment of KWG has developed a complete business chain. The Group’s commercial projects will continue to expand over the next few years, and commercial GFA in operation will continue to grow. In the future, the KWG commercial segment will seek optimisation in resource allocation and delicacy management through its sophisticated regimes, platforms, teams and brands, as it continues to share with consumers the idea of a refined lifestyle with a strong cultural aura.
Enhancement in Management Ability
Launch of the SAP system
In 2019, the Group started the SAP project as a key initiative of the year for the development of information systems. The aim was to drive ongoing business improvements, reformation and management efficiency through informatisation, in order to fulfill the Group’s objective in leaping development, namely, to engage in large-scale operation in higher efficiency. By establishing a multi-tier management regime covering the Group, regional companies and project companies, an operational management platform integrating business and finance is underpinned by business standardisation, delicacy management and systematic cost management. It was built on the basis of operational support, with a view to the full-scale unification of operations, financial reporting, treasury and business. The operation of the SAP system will take the management of the Group to a new level where it could achieve qualitative growth, while providing a solid foundation and platform support.
With a strong focus on internal management as well as external development, KWG Group is looking at expansion in scale of an even stronger magnitude as it continues with the process of digitalisation-based transformation, which will put it in a more dominant position in future market competition.
“CoKWG” APP
In view of the call for stability in the government’s property sector policy and the Group’s business diversification and taking account of market trends, the Group launched the “CoKWG” APP in 2019 to consolidate the services under various business segments. A cross-sector business ecosphere was created to deliver greater value to KWG members. As a guide to the integration of memberships from multiple business sectors, the “CoKWG” APP customises the commercial city service based on user

– 34 –
requirements, taking advantage of a well-developed O2O industry chain. Through the integration of various business segments and services, application of big-data analysis and upgrade of the membership management service regimes, members are provided with a multi-dimensional value regime underpinned by the diversification in services, integration of daily-life aspects and enrichment of experience.
The “CoKWG” APP has successfully integrated the Group’s diverse range of business segments, such as property development, shopping mall, office, property management, education and big-data healthcare, whereby members are able to apply their points across all segments to enjoy genuine one-stop services.
Outlook
The Central Politburo meeting has called for the implementation of a long-term mechanism for the administration of the real estate sector and ruled out the reliance on property transactions as a short-term economic stimulus. In the meantime, the Central Economic Work Conference has reiterated the application of a permanent mechanism for management and regulation aimed at stabilising land premium, property prices and expectations, with a view to the sound and stable development of the property market.
Property markets nationwide has been considerably affected by the outbreak of the novel coronavirus epidemic in early 2020. In response, the Central Government and local governments have introduced a range of comprehensive, multi-dimensional relief policies, such as support for the land market, business resumption support, tax relief, reduction or exemption, financing support and relaxation of sales, etc. Such policies have been designed to regulate in a positive manner the business environments of all sectors including real estate enterprises, so as to ensure the stable and healthy development of the economy as a whole and the steady operation of the real estate market.
As the Central Politburo and the Ministry of Housing and Urban-Rural Development have repeatedly emphasised that the primary principle of “housing properties for accommodation but not speculative trading, stability in prices and permanent mechanism” should continue to prevail, the dominant trend in 2020 is expected to be “stability”. As the future underlying demand for home purchase or upgrade is expected to be stronger in tier-one and tier-two cities given their strengths in economic fundamentals, market resources, population bases and talent recruitment policies, the Group will continue to further explore opportunities in Greater-Bay-Area and Yangtze-River-Delta Area with a strong focus on tier-one and tier-two cities. Following years of development in the two aforesaid main regions, our land bank and sellable resources in these two regions account for 57% and 68% of our total attributable land bank and total gross sellable resources. Looking into 2020, the Group expects to launch a number of brand new projects, including Guangzhou New Financial City Project, Beijing New

– 35 –
Chang’an Mansion, Hangzhou Oriental Dawn, Ningbo Cloud Mansion, Chongqing The Riviera, Nanning The Horizon, Kunming Salar de Uyuni, Xi’an Yanta Project and Hong Kong Ap Lei Chau Project, etc.
Taking into account the probable impact of the epidemic and based on the Group’s existing land bank, project construction schedule and launch plan, the Group’s gross sellable resources for 2020 will amount to approximately RMB170 billion.
We believe our strong presence in Greater-Bay-Area and Yangtze-River-Delta Area and our premium sellable resources in tier-one and tier-two cities will provide strong support for continuous sales growth in the future. Analysed by geographic region, Greater-Bay-Area and Yangtze-River-Delta Area accounted for 42% and 28% respectively of the sellable resources in 2020; analysed by the ranking of cities, 88% were from tier-one and tier-two cities.
The Group will seek qualitative growth by persisting with a customer-centric approach and the quest for innovative changes. In connection with the property development segment, we will enhance market development in the two main economic regions with a strong focus on tier-one and tier-two cities. As a result of the prudent land bank investment and expansion, the Group is currently holding sufficient premium land reserve and sellable resources, which will provide strong support for continuous sales growth in the future. In connection with the investment property segment, the Group will focus on core districts in tier-one and tier-two cities, where new shopping malls and hotels will be opened in the future to drive rapid growth in recurring income. Looking ahead, the Group will continue to enhance its customer service standards and make improvements to its operating structure and management system, as it continues to seek qualitative growth by persisting with a customer-centric approach and the quest for innovations.

– 36 –
Overview of the Group’s Property Development
As at 31 December 2019, the Group’s major projects are located in Guangzhou, Suzhou, Chengdu, Beijing, Hainan, Shanghai, Tianjin, Nanning, Hangzhou, Nanjing, Foshan, Hefei, Wuhan, Xuzhou, Jiaxing, Taizhou, Jinan, Changshu, Lishui, Chongqing, Taicang, Wuxi, Zhaoqing, Zhongshan, Nantong, Liuzhou, Shenzhen, Huizhou, Jiangmen, Wenzhou, Dongguan, Yangzhou, Ningbo, Meishan, Chenzhou, Wuzhou, Xi’an, Kunming and Hong Kong.
Total GFA Attributable
to the Group’s Interest
Interest Attributable
to the GroupNo. Project District Type of Product (‘000 sq.m.) (%)
1 The Summit Guangzhou Residential/villa/serviced apartment/office/commercial
1,419 100
2 International Metropolitan Plaza Guangzhou Office/commercial 40 503 Tian Hui Plaza (including The
Riviera and Top Plaza)Guangzhou Serviced apartment/office/
commercial/hotel45 33.3
4 The Star Guangzhou Office/commercial 84 1005 Top of World Guangzhou Villa/serviced apartment/office/
commercial/hotel358 100
6 The Eden Guangzhou Residential/commercial 2 507 Zengcheng Li Lake (formerly
known as Zengcheng Gua Lv Lake)
Guangzhou Villa/hotel 43 100
8 Essence of City Guangzhou Residential/villa/commercial 140 1009 International Commerce Place Guangzhou Office/commercial 50 5010 CFC (including Mayfair and
International Finance East)Guangzhou Serviced apartment/office/
commercial79 33.3
11 The Horizon Guangzhou Residential/villa/serviced apartment/office/commercial/hotel
15 50
12 Blooming River (formerly known as Fortunes Season)
Guangzhou Residential/villa/commercial 170 50
13 Nansha River Paradise Guangzhou Residential/commercial 25 3614 The Jadeite Guangzhou Residential 15 4015 V-city Guangzhou Serviced apartment/commercial 182 7016 Montkam (formerly known as
Montkam Garden)Guangzhou Residential/villa 26 30
17 E-city Guangzhou Serviced apartment/commercial 506 6718 Guangzhou Luogang M.Cube Guangzhou Commercial/hotel 15 6019 KWG Center Guangzhou Office/commercial 8 5020 Guangzhou Science City Hotel A
Project (formerly known as Guangzhou Science City Hotel Project)
Guangzhou Villa/serviced apartment/commercial/hotel
14 60
21 Guangzhou Science City Hotel B Project
Guangzhou Villa/serviced apartment/office/commercial
16 60
22 Guangzhou New Financial City Project
Guangzhou Residential/serviced apartment/commercial
99 100

– 37 –
Total GFA Attributable
to the Group’s Interest
Interest Attributable
to the GroupNo. Project District Type of Product (‘000 sq.m.) (%)
23 Fragrant Seasons (formerly known as Guangzhou Huadu Shiling Project)
Guangzhou Residential/commercial 78 62.5
24 Guangzhou Zengcheng Luogang Project
Guangzhou Residential 86 100
25 Guangzhou Southern Medical Industrial Park
Guangzhou Villa/serviced apartment/office/commercial
192 80
26 IFP Guangzhou Office/commercial 61 10027 Four Points by Sheraton
Guangzhou, DongpuGuangzhou Hotel 35 100
28 The Mulian Huadu Guangzhou Hotel 25 10029 W Hotel/W Serviced Apartments Guangzhou Hotel/serviced apartment 80 10030 The Mulian Guangzhou Guangzhou Hotel 8 10031 The Sapphire Suzhou Residential/serviced apartment/
office/commercial/hotel38 100
32 Suzhou Apex Suzhou Residential/serviced apartment/commercial/hotel
115 100
33 Suzhou Emerald Suzhou Residential/commercial 2 10034 Leader Plaza Suzhou Serviced apartment/office/
commercial26 100
35 Fortune Building (formerly known as Wan Hui Plaza)
Suzhou Office/commercial/hotel 32 100
36 Suzhou Jade Garden Suzhou Residential/commercial 2 10037 Orient Aesthetics Suzhou Residential/commercial 23 2038 Orient Moon Bay Suzhou Residential 19 5039 Swan Harbor Park (formerly
known as Suzhou Taihu New Town Project)
Suzhou Residential/serviced apartment/office/commercial
67 20
40 The Vision of the World Chengdu Residential/serviced apartment/commercial
54 100
41 Chengdu Cosmos Chengdu Residential/serviced apartment/office/commercial/hotel
287 100
42 Chengdu Sky Ville Chengdu Residential/serviced apartment/office/commercial
147 50
43 Yunshang Retreat Chengdu Residential/villa/serviced apartment/commercial/hotel
600 55
44 Fragrant Seasons Beijing Residential/villa/serviced apartment/commercial
2 100
45 La Villa Beijing Residential/villa/commercial 10 5046 Beijing Apex Beijing Residential/villa/serviced
apartment/commercial28 50
47 M • Cube Beijing Commercial 16 10048 Summer Terrace Beijing Residential/commercial 18 10049 KWG Center I Beijing Serviced apartment/office/
commercial128 100
50 KWG Center II Beijing Serviced apartment/office/commercial
124 100

– 38 –
Total GFA Attributable
to the Group’s Interest
Interest Attributable
to the GroupNo. Project District Type of Product (‘000 sq.m.) (%)
51 Rose and Ginkgo Mansion Beijing Residential/villa/office/commercial
27 33
52 The Core of Center Beijing Residential/villa/serviced apartment/commercial/hotel
201 100
53 Beijing Niulanshan 1107# Project
Beijing Residential 31 80
54 New Chang'an Mansion (formerly known as Link Chang'an)
Beijing Residential/office/commercial/hotel
29 51
55 Pearl Coast Hainan Residential/villa/hotel 122 10056 Villa Como Hainan Residential/villa/commercial/
hotel351 100
57 Hainan Lingao Project Hainan Residential 34 2058 International Metropolis Plaza Shanghai Office/commercial 30 75.559 Shanghai Apex Shanghai Residential/serviced apartment/
commercial/hotel37 100
60 Shanghai Sapphire Shanghai Serviced apartment/commercial 51 10061 Amazing Bay Shanghai Residential/serviced apartment/
office/commercial/hotel50 50
62 Vision of World Shanghai Residential/serviced apartment/commercial/hotel
116 100
63 Glory Palace Shanghai Residential 67 10064 Shanghai Qingpu Project Shanghai Office/commercial 121 9065 Jinnan New Town Tianjin Residential/villa/serviced
apartment/commercial421 25
66 Tianjin The Cosmos Tianjin Residential/villa/commercial 262 10067 Tianjin Apex Tianjin Residential/office/commercial/
hotel105 100
68 The Core of Center Nanning Residential/villa/serviced apartment/commercial
266 100
69 International Finance Place Nanning Office/commercial 61 10070 Top of World Nanning Residential/villa/serviced
apartment/commercial/hotel205 100
71 Fragrant Season Nanning Residential/villa/commercial 144 10072 Impression Discovery Bay I Nanning Residential/commercial 101 3473 Impression Discovery Bay II Nanning Residential/commercial 50 3474 Emerald City (formerly known
as The Horizon)Nanning Residential/serviced apartment/
commercial428 100
75 The Mulian Hangzhou Hangzhou Commercial/hotel 18 10076 The Moon Mansion Hangzhou Residential/villa 2 5177 Sky Ville Hangzhou Residential/villa 39 10078 Puli Oriental Hangzhou Residential/commercial 8 5079 Hangzhou Linping Project Hangzhou Serviced apartment/commercial 15 6080 Malus Moon (formerly known as
Hangzhou Tangqi Project)Hangzhou Residential/commercial 46 100
81 Oriental Dawn Hangzhou Residential/commercial 64 5082 Shine City Nanjing Residential/office/commercial 7 5083 Nanjing Yuhuatai Project Nanjing Residential/commercial 15 19.75

– 39 –
Total GFA Attributable
to the Group’s Interest
Interest Attributable
to the GroupNo. Project District Type of Product (‘000 sq.m.) (%)
84 Ruyi Palace (formerly known as Nanjing Lukou Project)
Nanjing Residential/commercial 21 50
85 Oriental Bund Foshan Residential/villa/serviced apartment/office/commercial
1,098 50
86 The Riviera Foshan Residential/commercial 113 5187 One Palace Foshan Residential/serviced apartment/
commercial89 33.3
88 Foshan Apex Foshan Residential/serviced apartment/commercial
21 50
89 China Image Foshan Residential/commercial 38 3490 Water Moon Hefei Residential/commercial 139 10091 City Moon Hefei Residential/commercial 78 10092 The One Hefei Residential/commercial 145 10093 Park Mansion Hefei Residential 25 5094 Joyful Season Wuhan Residential/villa/commercial 88 6095 The Buttonwood Season I Wuhan Residential/villa/commercial 76 10096 The Buttonwood Season II Wuhan Residential/villa/commercial 142 10097 Exquisite Bay Xuzhou Residential/commercial 16 5098 Fragrant Season Xuzhou Residential/commercial 41 5099 Xuzhou Tongshan Project I Xuzhou Residential 21 33100 Xuzhou Tongshan Project II Xuzhou Residential/commercial 34 33101 Majestic Mansion Jiaxing Residential/commercial 32 100102 Star City Jiaxing Residential 8 25103 Noble Peak (formerly known as
Jiashan Yaozhuang Project)Jiaxing Residential 58 100
104 Top of World Residence I Taizhou Residential 80 100105 Top of World Residence II Taizhou Residential/commercial 77 80106 Linhai Mansion Taizhou Residential/commercial 95 100107 Star Mansion Taizhou Residential/commercial 16 33108 Lead Peak Mansion (formerly
known as Linhai CBD Project)
Taizhou Residential/commercial 33 100
109 Jinan Zhangqiu Project Jinan Residential 151 49110 Jinan Zhang Ma Tun C6#
ProjectJinan Residential/commercial 26 20
111 Jinan Zhang Ma Tun C8# Project
Jinan Residential/commercial 26 20
112 Fragrant Season Changshu Residential 15 40113 Changshu Qinhu Project Changshu Residential 16 25114 Liu Xiang Mansion Lishui Residential/commercial 8 49115 The Riviera Chongqing Chongqing Residential/commercial 47 100116 The Cosmos Chongqing Chongqing Residential/serviced apartment/
office/commercial/hotel379 100
117 The Moon Mansion Chongqing Residential/commercial 27 39118 Splendid City (formerly known
as Chongqing Jiangzhou Jinyun Project)
Chongqing Residential/commercial 47 50

– 40 –
Total GFA Attributable
to the Group’s Interest
Interest Attributable
to the GroupNo. Project District Type of Product (‘000 sq.m.) (%)
119 Mansion of Jasper (formerly known as Chongqing Longjing Xuefu Project)
Chongqing Residential 36 50
120 Jade Moon Villa (formerly known as Chongqing Jingyuetai Project)
Chongqing Residential/commercial 71 50
121 Jinzhu Tianyi Huayuan (formerly known as Jiangsu Taicang Project)
Taicang Residential 118 100
122 Oriental Mansion Wuxi Residential/commercial 23 20123 Exquisite Palace Wuxi Residential/commercial 40 45124 Star Mansion Wuxi Residential/commercial 26 50125 Vision of World Zhaoqing Residential/commercial 147 100126 River View Mansion Zhaoqing Residential/commercial 59 33127 The Moon Mansion Zhongshan Residential/commercial 65 50128 Serenity in Prosperity Nantong Residential/villa/commercial 82 51129 Oriental Beauty Nantong Residential 51 70130 The Moon Mansion Liuzhou Residential/villa/commercial 157 100131 Fortunes Season Liuzhou Residential/commercial/hotel 1,121 100132 Shenzhen Bantian Project Shenzhen Serviced apartment/office/
commercial119 100
133 KWG Topchain City Center Shenzhen Serviced apartment/office/commercial
68 51
134 Shenzhen Nanshan Project Shenzhen Serviced apartment/office/commercial/hotel
46 55
135 Shenzhen Longhua Project Shenzhen Residential 90 50136 Life in Yueshan County Huizhou Residential/commercial 370 100137 Huizhou Longmen Project
— Educational#[2019]011Huizhou Educational 11 100
138 Huizhou Longmen Project — Educational#[2019]014
Huizhou Educational 61 100
139 The Horizon Jiangmen Residential 36 100140 Jiangmen Apex Jiangmen Residential/serviced apartment/
commercial131 100
141 Cullinan Mansion Wenzhou Residential/commercial 111 100142 Art Wanderland Dongguan Residential/villa/commercial 26 12.5143 Dongguan Hengli Project Dongguan Residential/commercial 50 20144 Yangzhou Apex Yangzhou Residential/commercial 196 100145 Parkview Place Ningbo Residential 52 49146 Cloud Mansion (formerly known
as Ningbo Yinzhou Project)Ningbo Residential 42 50
147 Meishan Apex Meishan Residential/commercial 125 100148 River State (formerly known as
Meishan Nanhu Peninsula Project)
Meishan Residential/commercial 116 34
149 Chenzhou Wangxian Eco-tourism Project
Chenzhou Residential/villa 73 50

– 41 –
Total GFA Attributable
to the Group’s Interest
Interest Attributable
to the GroupNo. Project District Type of Product (‘000 sq.m.) (%)
150 KWG TusWorld Ice Town (formerly known as KWG Qidi Ice Town)
Wuzhou Residential/commercial 285 75
151 Xi'an Yanta Project Xi'an Serviced apartment/commercial/hotel
37 100
152 Salar de Uyuni Kunming Residential/commercial/hotel 260 51153 Hong Kong Ap Lei Chau
ProjectHong Kong Residential 35 50
154 Upper RiverBank Hong Kong Residential 27 50
EMPLOYEES AND EMOLUMENT POLICIES
As at 31 December 2019, the Group employed a total of approximately 11,400 employees. Employee benefit expense (excluding Directors’ and chief executive’s remuneration) of the Group incurred was approximately RMB1,641.9 million during the year ended 31 December 2019. The remuneration of employees was determined based on their performance, skill, experience and prevailing industry practices. The Group reviews the remuneration policies and packages on a regular basis and will make necessary adjustment to be commensurate with the pay level in the industry. In addition to basic salary, the provident fund scheme (according to the provisions of the Mandatory Provident Fund Schemes Ordinance for Hong Kong employees) or state-managed retirement pension scheme (for the PRC employees), employees may be offered with discretionary bonus and cash awards based on individual performance.
The Company has adopted the share option scheme and the share award scheme in order to recognize and motivate the contributions by the eligible participants of the Group, and help in retaining them for the Group’s further development. Details of the share option scheme and the share award scheme of the Company are set out in the sections headed “Share Option Scheme” and “Share Award Scheme” of the Annual Report respectively.
In addition, training and development programmes are provided on an on-going basis throughout the Group.
FINAL DIVIDEND
The Board resolved to recommend the payment of a final dividend of RMB42 cents per share (2018: RMB31 cents per share) for the year ended 31 December 2019. Including the interim dividend of RMB32 cents per share paid (2018: RMB25 cents per share), the total dividend for the year amounts to RMB74 cents per share (2018: RMB56 cents per share). The proposed final dividend, if approved at the 2020 AGM, will be payable on

– 42 –
or around Friday, 7 August 2020 to the shareholders of the Company (the “Shareholders”) whose names appear on the register of members of the Company on Tuesday, 16 June 2020.
The proposed final dividend shall be declared in RMB and paid in Hong Kong dollars. The final dividend payable in Hong Kong dollars will be converted from RMB at the average closing rate of the five business days preceding the date of declaration of dividend as announced by the People’s Bank of China.
A circular containing details of the proposed final dividend together with the relevant form of election will be published on the Company’s website (www.kwggroupholdings.com) and the HKEXnews website (www.hkexnews.hk), and despatched to the Shareholders, on or before Tuesday, 30 June 2020.
ANNUAL GENERAL MEETING
The 2020 AGM will be held on Friday, 5 June 2020 A circular containing the information required by the Rules Governing the Listing of Securities on The Stock Exchange of Hong Kong Limited (the “Listing Rules”), together with the notice of the 2020 AGM, will be published on the Company’s website (www.kwggroupholdings.com) and the HKEXnews website (www.hkexnews.hk), and despatched to the Shareholders in due course.
CLOSURE OF REGISTER OF MEMBERS
(a) For the purpose of determining the Shareholders’ entitlement to attend and vote at the 2020 AGM, the register of members of the Company will be closed from Tuesday, 2 June 2020 to Friday, 5 June 2020, both days inclusive, during which period no transfer of Shares will be registered. In order to qualify for attending and voting at the 2020 AGM, all transfer documents accompanied by the relevant share certificates must be lodged with the Company’s Hong Kong branch share registrar, Computershare Hong Kong Investor Services Limited at Shops 1712–16, 17th Floor, Hopewell Centre, 183 Queen’s Road East, Wan Chai, Hong Kong not later than 4:30 p.m. on Monday, 1 June 2020.
(b) For the purpose of determining the Shareholders’ entitlement to the proposed final dividend, the register of members of the Company will be closed from Friday, 12 June 2020 to Tuesday, 16 June 2020, both days inclusive, during which period no transfer of Shares will be registered. In order to qualify for the proposed final dividend, all transfer documents accompanied by the relevant share certificates must be lodged with the Company’s Hong Kong branch share registrar, Computershare Hong Kong Investor Services Limited at Shops 1712–16, 17th Floor, Hopewell Centre, 183 Queen’s Road East, Wan Chai, Hong Kong not later than 4:30 p.m. on Thursday, 11 June 2020.

– 43 –
PURCHASE, SALE OR REDEMPTION OF LISTED SECURITIES OF THE COMPANY
During the year ended 31 December 2019, neither the Company nor any of its subsidiaries has purchased, sold or redeemed any of the Company’s listed securities.
MODEL CODE FOR SECURITIES TRANSACTIONS BY DIRECTORS
The Company has adopted the Model Code for Securities Transactions by Directors of Listed Issuers (the “Model Code”) as set out in Appendix 10 to the Listing Rules as its code of conduct regarding securities transactions of the Directors. All Directors have confirmed, following specific enquiry by the Company, that they have complied with the required standards set out in the Model Code throughout the year ended 31 December 2019.
CORPORATE GOVERNANCE CODE
During the year ended 31 December 2019, the Company has complied with all applicable code provisions of the Corporate Governance Code (the “CG Code”) as set out in Appendix 14 to the Listing Rules, save and except for code provisions A.1.7 and F.1.2.
Code provision A.1.7 stipulates that if a substantial shareholder or a director has a conflict of interest in a matter to be considered by the board which the board has determined to be material, the matter should be dealt with by a physical board meeting rather than a written resolution. Independent non-executive directors who, and whose close associates, have no material interest in the transaction should be present at that board meeting. During the year ended 31 December 2019, the Board approved the continuing connected transaction in relation to the lease of properties to Guangzhou Kai Chuang Business Investments Company Limited* (廣州凱創商務投資有限公司) (“Guangzhou Kai Chuang”) and its wholly-owned subsidiaries, by way of passing a written resolution. Mr. KONG Jiantao, being the Executive Director and Chief Executive Officer of the Company and a director and the ultimate beneficial owner of Guangzhou Kai Chuang, was regarded as having material interests therein. Prior to the formal execution of such written resolution, all Directors had discussed the matters via electronic means and the Directors (including the Independent Non-executive Directors) are of the view that such property lease and the transactions contemplated thereunder are fair and reasonable, are on normal commercial terms or better and are in the interests of the Company and the Shareholders as a whole. In addition, Mr. KONG Jiantao had abstained from voting on the relevant resolution pursuant to the Company’s Articles of Association and the Listing Rules. The Board considered that the adoption of written resolutions would facilitate and maximize the effectiveness of its operation. The Board shall nevertheless review its Board meeting arrangement from time to time to ensure the appropriate arrangement is being taken to comply with the requirements under the CG Code.
* for identification purpose only

– 44 –
Code provision F.1.2 stipulates that the appointment of the company secretary should be dealt with by a physical board meeting rather than a written resolution. The appointment of the current company secretary of the Company was approved by a written resolution of all Directors instead of a physical Board meeting. Prior to such appointment, all Directors were individually consulted without any dissenting opinion. It was considered that there was not necessary to hold a physical Board meeting for approving the said appointment.
AUDIT COMMITTEE
The audit committee of the Company (the “Audit Committee”) comprises three members who are Independent Non-executive Directors.
The Audit Committee has reviewed the consolidated financial statements of the Group for the year ended 31 December 2019.
SCOPE OF WORK OF INDEPENDENT AUDITOR
The figures in respect of the Group’s consolidated statement of financial position, consolidated statement of profit or loss, consolidated statement of comprehensive income, and the related notes thereto for the year ended 31 December 2019 as set out in the preliminary announcement have been agreed by the Company’s auditors, Ernst & Young, to the amounts set out in the Group’s draft consolidated financial statements for the year. The work performed by Ernst & Young in this respect did not constitute an assurance engagement in accordance with Hong Kong Standards on Auditing, Hong Kong Standards on Review Engagements or Hong Kong Standards on Assurance Engagements issued by the Hong Kong Institute of Certified Public Accountants and consequently no assurance has been expressed by Ernst & Young on the preliminary announcement.
ANNUAL REPORT
The 2019 annual report containing all the information required by the Listing Rules will be published on the Company’s website (www.kwggroupholdings.com) and the HKEXnews website (www.hkexnews.hk), and despatched to the Shareholders in due course.
By Order of the Board KWG Group Holdings Limited
KONG Jianmin Chairman
Hong Kong, 25 March 2020
As at the date of this announcement, the Board comprises seven Directors, of which are Mr. KONG Jianmin (Chairman), Mr. KONG Jiantao, Mr. KONG Jiannan and Mr. CAI Fengjia are Executive Directors; and Mr. LEE Carmelo Ka Sze, JP, Mr. TAM Chun Fai and Mr. LI Binhai are Independent Non-executive Directors.