ksch for universityetheses.saurashtrauniversity.edu/623/1/chavada_ks_thesis_economics.pdf · other...
TRANSCRIPT

Saurashtra University Re – Accredited Grade ‘B’ by NAAC (CGPA 2.93)
Chavada, Karshan S., 2006, “Changes in Level and Pattern of Economic
Growth in Gujarat”, thesis PhD, Saurashtra University
http://etheses.saurashtrauniversity.edu/id/eprint/623 Copyright and moral rights for this thesis are retained by the author A copy can be downloaded for personal non-commercial research or study, without prior permission or charge. This thesis cannot be reproduced or quoted extensively from without first obtaining permission in writing from the Author. The content must not be changed in any way or sold commercially in any format or medium without the formal permission of the Author When referring to this work, full bibliographic details including the author, title, awarding institution and date of the thesis must be given.
Saurashtra University Theses Service http://etheses.saurashtrauniversity.edu
© The Author
1
Ph.D. Thesis
CHANGES IN LEVEL AND PATTERN OF ECONOMIC GROWTH IN GUJARAT
A thesis submitted to the
Saurashtra University for the Degree of
Doctor of Philosophy (Economics)
in the Faculty of Arts
By
Chavada K. S. Lecturer in Economics
Smt. Kusumben Kadakiya Arts & Commerce College Ankleshwar (Gujarat)
Guide
Dr. Hathi Tushar R. Principal
Smt. S. I. Patel - Ipcowala College of Commerce Petlad (Gujarat)
September - 2006

2
STATEMENT UNDER UNIVERSITY Ph.D. RULES ORDI. Ph.D. 7
I here by declare that, (a) the research work embodied in this thesis on
"CHANGES IN LEVEL AND PATTERN OF ECONOMIC GROWTH IN GUJARAT" submitted for Ph.D. degree has not been submitted for any other degree of this or any other University on any previous occasion.
(b) to the best of my knowledge no work of this type has
been reported on the above subject, since I have discovered new relation of facts, this work can be considered to be contributory to the advancement of knowledge on economics; and
(c) all the work presented in the thesis is original and
wherever references have been made to the work of
others it has been clearly indicated as such and the
sources of information included in the bibliography.
Signature of the Counter Signed by Research Student The Guiding Teacher Date : Date :
3
Certificate
This is to certify that research work undertaken by
Chavada Karshan Sondabhai on the title "CHANGES IN
LEVEL AND PATTERN OF ECONOMIC GROWTH IN
GUJARAT" is his own work. To the best of my knowledge
he has not submitted such work to this University or any
other University previously for any other degree or
diploma.
Place : Petlad Name and Signature of Guide Date :
Hathi Tushar R. Principal
Smt. S. I. Patel - Ipcowala College of Commerce
Petlad (Gujarat)

4
ACKNOWLEDGEMENT
At the outset I humbly pray to God to have His Divine Grace
forever. This work is made possible because of my parents Vakhatben
and Sondabhai's loving care right from my birth till this date. I am
indebted to them.
I appreciate and acknowledge with thanks to Dr. Tushar R.
Hathi, Principal, Commerce College, Petlad for valuable guidance I
have received time to time during the course of my study.
I would be failing in my duty if I fail to express thanks to the
Principal, staff members of my college and my respected elderly
Trustee Prof. Niranjan Pandya and Managing Trustee Shri
Pankajbhai Kadakiya for their encouraging support throughout my
career. I am also thankful to Dr. B. V. Acharya - Prof. & Head,
Department of Economics, Veer Narmad South Gujarat University,
Surat.
I am grateful to Dr. K. K. Khakhkhar - Retired Professor and
Head, Department of Economics, Saurashtra University, Rajkot. I
also express thanks with regards to Dr. B. M. Jani (Prof. & Head),
Dr. P. G. Marvaniya. I am thankful to all my friends well wishers
who co-operated me during my career. To take note of few,

5
specially Dr. R. R. Tanchak. I am also thankful to the
Administrative Staff of Saurashtra University, Rajkot.
I duly respectfully take note of Kailash - my wife, who besides
being a working woman shared extra responsibility to be enable me to
complete the task. Nikunja, Ayushi and Abhigna - my kids, allowed
me to complete my work though they all were deprived of the warmth
required for their education and growth.
I am also thankful to the officers of the different departments
of Government of Gujarat for having allowed me to have access to
the rich and very useful publications.
I take note of Kamlesh Commercial Centre, Jamnagar for
neat and clean work and make it possible to complete in stipulated
time limit.
Ankleshwar
Dt. 7/9/2006
Chavada K. S.
6
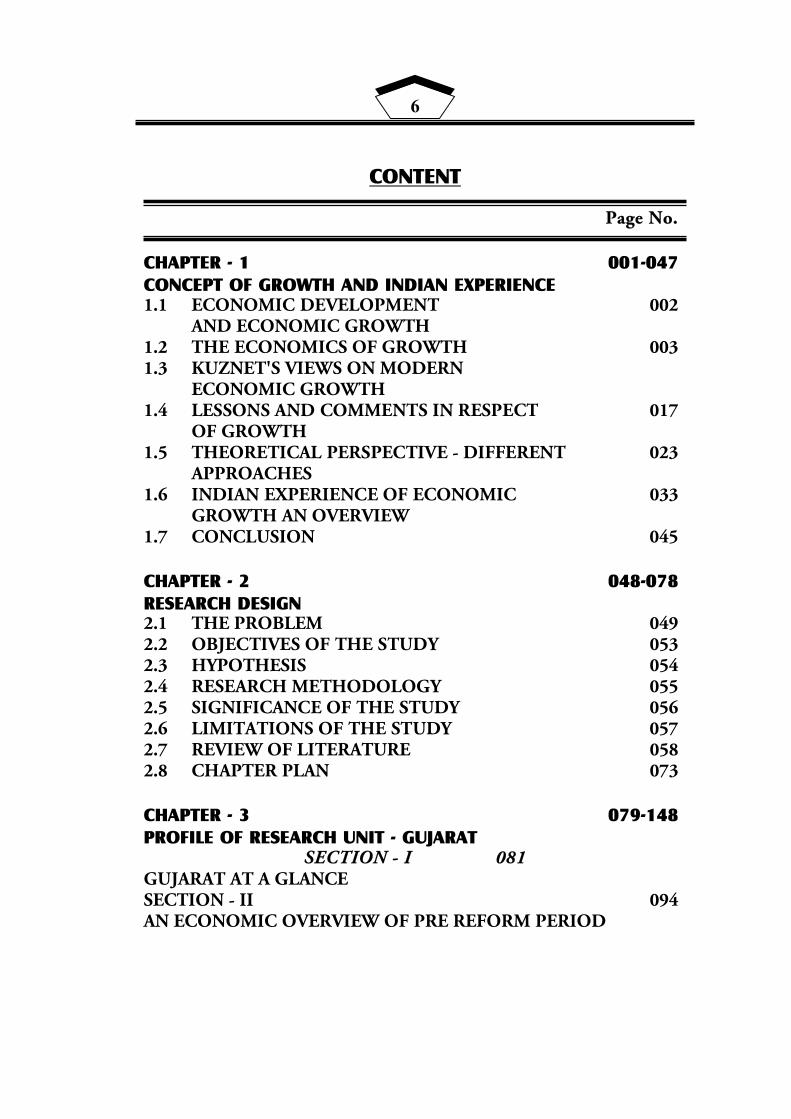
CONTENT
Page No. CHAPTER - 1 001-047 CONCEPT OF GROWTH AND INDIAN EXPERIENCE 1.1 ECONOMIC DEVELOPMENT 002 AND ECONOMIC GROWTH 1.2 THE ECONOMICS OF GROWTH 003 1.3 KUZNET'S VIEWS ON MODERN ECONOMIC GROWTH 1.4 LESSONS AND COMMENTS IN RESPECT 017 OF GROWTH 1.5 THEORETICAL PERSPECTIVE - DIFFERENT 023 APPROACHES 1.6 INDIAN EXPERIENCE OF ECONOMIC 033 GROWTH AN OVERVIEW 1.7 CONCLUSION 045 CHAPTER - 2 048-078 RESEARCH DESIGN 2.1 THE PROBLEM 049 2.2 OBJECTIVES OF THE STUDY 053 2.3 HYPOTHESIS 054 2.4 RESEARCH METHODOLOGY 055 2.5 SIGNIFICANCE OF THE STUDY 056 2.6 LIMITATIONS OF THE STUDY 057 2.7 REVIEW OF LITERATURE 058 2.8 CHAPTER PLAN 073 CHAPTER - 3 079-148 PROFILE OF RESEARCH UNIT - GUJARAT
SECTION - I 081 GUJARAT AT A GLANCE SECTION - II 094 AN ECONOMIC OVERVIEW OF PRE REFORM PERIOD

7
CHAPTER - 4 149-354 ANALYTICAL STUDY OF ECONOMIC GROWTH IN GUJARAT UNDER REFORM PERIOD SECTION - I 150 ACGR - GSDP PER-CAPITA GSDP SECTION - II 161 ACGR - NSDP PER-CAPITA NSDP SECTION - III 170 QUINQUENNIUM COMPOUND GROWTH RATE SECTION - IV 177 GSDP - NSDP AT 1993-94 PRICE SECTION - V 189 PER-CAPITA GSDP - NSDP SECTION - VI 198 SECTORAL SHARE IN GSDP SECTION - VII 215 AGRICULTURAL GROWTH IN GUJARAT SECTION - VIII 240 INDUSTRIAL GROWTH IN GUJARAT SECTION - IX 271 ECONOMIC INFRASTRUCTURE IN GUJARAT SECTION - X 290 SOCIAL SECTOR DEVELOPMENT IN GUJARAT SECTION - XI 326 BROAD ECONOMIC INDICATORS OF GUJARAT SECTION - XII 342 GROWTH AND PUBLIC FINANCE - GUJARAT AT A GLANCE
SECTION - XIII 351 ECONOMIC GROWTH AND NATURAL CALAMITY CHAPTER - 5 355-378
CONCLUSIONS - SUGGESTIONS 5.1 MAJOR CONCLUSIONS 356 5.2 POLICY PERSPECTIVE 363 5.3 BROAD SUGGESTIONS 369 5.4 FURTHER SCOPE 378
BIBLIOGRAPHY 379-385

8
LIST OF TABLES Table No. Title Page No.
1.1 ANNUAL AVERAGE GROWTH RATES OF
NATIONAL INCOME (NNP) AND PER CAPITA
INCOME IN INDIA
34
1.2 DISTRIBUTION OF GROSS DOMESTIC
PRODUCT AT FACTOR COST PERCENTAGE
DISTRIBUTION (AT 1980-81 AND 1993-94)
39
1.3 GROWTH RATE OF GDP AT FACTOR COST
(AT 1993-94 PRICE)
43
3.1.1 DISTRICT WISE (CENTRE WISE) AVERAGE
RAIN FALL AND RAIN FALL (in Milimetres)
89
3.1.2 LAND UTILIZATION 92
3.1.3 GUJARAT STATE DISTRICTS WITH
HEADQUARTERS
93
3.2.1 GROWTH OF POPULATION - GUJARAT AND
INDIA - 1961 TO 2001
94
3.2.2 DISTRICT WISE POPULATION GROWTH RATE 97
3.2.3 IMPORTANT DEMOGRAPHIC INDICATORS
(DISTRICTS OF GUJARAT)
99
3.2.4 ANNUAL BIRTH RATES AND DEATH RATES -
RURAL / URBAN
105
3.2.5 DISTRICT WISE PERCENTAGE
DISTRIBUTION OF POPULATION BY MAIN,
MARGINAL, TOTAL WORKERS AND NON
WORKER - 2001
108
3.2.6 N.S.D.P. GUJARAT (1960S TO 1980S) 112
3.2.7 AVERAGE GROWTH RATES IN REAL S.D.P. IN
GUJARAT BY SECTOR (1980-81 PRICE)
113
3.2.8 PERCENTAGE SHOW OF PRIMARY
SECONDARY AND TERTIARY SECTION TO
TOTAL NSDP AT 1980-81 PRICE
114
3.2.9 AGRICULTURAL PROGRESS (MAJOR CROPS) 115
3.2.10 CROPPING PATTERN : 116

9
3.2.11 YIELD LEVEL FOR MAJOR CROPS (KG/HA -
TRIENNIUM ENDING)
118
3.2.11(A) FLUCTUATION IN YIELD AMONG MAJOR
CROPS 1949-97, 1987-91
119
3.2.12 DISTRICT WISE LEVEL OF INPUT USED 120
3.2.13 DISTRICT WISE LEVEL AND GROWTH OF
MALE AGRICULTURE WORKERS
PRODUCTIVITY
122
3.2.14 DISTRICT WISE LEVEL AND GROWTH AREA
(G.C.A.)
124
3.2.15 NET SOWN AREA 125
3.2.16 RELATIVE POSITION OF GUJARAT IN
FACTORY SECTOR IN INDIA - 1981 TO 1995 :
127
3.2.17 INTER SCALE GROWTH OF INDUSTRIAL
SECTORS IN GUJARAT (ANNUAL
COMPOUND RATE OF GROWTH IN
PERCENTAGE)
129
3.2.18 INDUSTRIAL INVESTMENT IN GUJARAT IN
MEDIUM AND LARGE SCALE INDUSTRIES :
131
3.2.19 CONCENTRATION RATIO OF TOTAL
INVESTMENT FOR TOP 25 TALUKAS OF
GUJARAT (PERCENTAGE INVESTMENT)
133
3.2.20 CONCENTRATION RATIO OF NEW
INVESTMENT IN TALUKAS OF GUJARAT
134
3.2.21 POLARITY OF INVESTMENTS IN FACTORY
SECTOR ACROSS TALUKAS SURROUNDING
GROWTH POLES IN GUJARAT
137
3.2.22 OCCUPATIONAL DISTRIBUTION BY BROAD
INDUSTRY GROWTH
142
3.2.23 WORKERS CLASSIFICATION BY RESIDENT 143
4.1 GSDP AT 1980-81 PRICES - 1980-81 TO 1993-
94
151
4.2 GSDP AT 1993-94 PRICES : 1993-94 TO 2000-01 152

10
4.3 GSDP AT 1980-81 PRICES : 1980-81 TO 1993-94 154
4.4 GSDP AT 1993-94 PRICES : 1993-94 TO 2000-01 155
4.5 GSDP AT 1980-81 PRICES : 1980-81 TO 1990-
91
157
4.6 GSDP AT 1990-91 PRICES : 1990-91 TO 2000-01 158
4.7 GSDP AT 1980-81 PRICES : 1980-81 TO 1990-91 159
4.8 GSDP AT 1990-91 PRICES : 1990-91 TO 2000-01 160
4.9 NSDP AT 1980-81 PRICES : 1980-81 TO 1993-94 162
4.10 NSDP AT 1993-94 PRICES : 1993-94 TO 2000-01 163
4.11 NSDP AT 1980-81 PRICES : 1980-81 TO 1993-94 164
4.12 NSDP AT 1993-94 PRICES : 1993-94 TO 2000-01 165
4.13 NSDP AT 1980-81 PRICES : 1980-81 TO 1990-91 166
4.14 NSDP AT 1993-94 PRICES : 1990-91 TO 2000-01 167
4.15 NSDP AT 1980-81 PRICES : 1980-81 TO 1990-91 168
4.16 NSDP AT 1993-94 PRICES : 1990-91 TO 2000-01 169
4.17 GSDP 1990-91 TO 1995-96 : 1995-96 TO 2000-01 171
4.18 PER-CAPITA GSDP 1990-91 TO 1995-96 : 1995-96
TO 2000-01
172
4.19 NSDP 1990-91 TO 1995-96 : 1995-96 TO 2000-01 174
4.20 PER-CAPITA NSDP 1990-91 TO 1995-96 : 1995-96
TO 2000-01
176
4.21 GROSS DOMESTIC PRODUCT (GSDP) AT
CONSTANT (1993-94) PRICE
178
4.22 GROSS DOMESTIC PRODUCT (GSDP) AT
CURRENT PRICE (1993-94) PRICE
181
4.23 NET DOMESTIC PRODUCT (NSDP) AT
CONSTANT PRICE
184
4.24 NET DOMESTIC PRODUCT (NSDP) AT
CURRENT PRICE
187
4.25 PER-CAPITA GSDP AT CONSTANT (1993-94)
PRICE
190
4.26 PER-CAPITA GSDP AT CURRENT PRICE 192
4.27 PER-CAPITA NSDP AT CONSTANT (1993-94) 194

11
PRICE
4.28 PER-CAPITA NSDP AT CURRENT PRICE 196
4.29 GROSS STATE DOMESTIC PRODUCT BY
INDUSTRY GROUP AT CONSTANT PRICE :
GUJARAT
199
4.29(A) SECTOR WISE GROWTH OVER IN
PERCENTAGE AND AGGREGATE
206
4.30 GROSS STATE DOMESTIC PRODUCT BY
INDUSTRY GROUP AT CURRENT PRICE :
GUJARAT
209
30(A) SECTOR WISE GROWTH OVER IN
PERCENTAGE AND AGGREGATE GROWTH IN
GSDP IN PERCENTAGE (AT CURRENT PRICE)
213
4.31 AGRICULTURAL GROWTH GUJARAT TO
INDIA
216
4.32 CEREAL'S PRODUCTION, CHANGES IN AREA
PRODUCTION AND YIELD
220
4.33 CHANGING TRENDS IN PULSE PRODUCTION 222
4.34 CHANGING TRENDS IN AREA / PRODUCTION
(YIELDS OF OIL SEEDS)
224
4.35 DECADE RATE OF STABILITY IN
AGRICULTURAL PRODUCE (1990-91 TO 1999-
2000)
225
4.36 AREA ('00 HECTARES) IRRIGATED BY SOME
IMPORTANT CROPS
228
4.37 INDIA NUMBERS OF AREA, PRODUCTION AND
YIELD OF FOOD GRAIN, PULSES AND OIL
SEEDS IN GUJARAT (Based: Triennium ending
1981-82 = 100)
230
4.38 CHEMICAL FERTILIZER CONSUMPTION 233

12
4.39 STATISTICS ON MILK COLLECTION /
PRODUCTION / SALES CHILLING CENTERS
AND THEIR CAPACITY
236
4.40 MARINE AND INLAND FISH PRODUCTION 238
4.41 INDUSTRY SECTOR GROWTH AT A GLANCE
GUJARAT RELATION OF INDIA
240
4.42 SELECTED INDUSTRY SECTOR - INDICATORS 243
4.43 INVESTMENT FLOW : DISTRICT- SUB-REGION
AUGUST 1991 TO MARCH 2002
245
4.44 NUMBER OF REGISTERED SMALL SCALE
INDUSTRIAL UNITS
248
4.44(A) NUMBER OF REGISTERED SMALL SCALE
INDUSTRIAL UNITS (SUB-REGIONAL
STATUS)
250
4.45 INDUSTRY GROUP WISE SSI REGISTRATION
DURING THE YEAR - RECENT TREND
251
4.46 SMALL SCALE INDUSTRIES CENSUS, 1999-2000
DISTRICTWISE WORKIG UNITS, INVESTMENT,
PRODUCTION AND EMPLOYEES
254
4.46(A) SMALL SCALE INDUSTRIES CENSUS, 1999-
2000 DISTRICTWISE WORKIG UNITS,
INVESTMENT, PRODUCTION AND
EMPLOYEES (SUB-REGIONAL STATUS)
255
4.47 SMALL SCALE INDUSTRIES CENSUS, 1999-
2000 INDUSTRY GROUPWISE WORKIG
UNITS, FIXED INVESTMENT, PRODUCTION
AND EMPLOYEES
257
4.48 SMALL SCALE INDUSTRIES CENSUS, 1999-
2000 DISTRICTWISE WORKI
262
4.49 REGIONAL BREAKUP OF THE STATUS OF
MEDIUM AND LARGE SCALE INDUSTRIES
2000-01
263
4.50 RESULTS OF ANNUIAL SURVEY OF
INDUSTRIES - FACTORY SECTOR - ALL
267
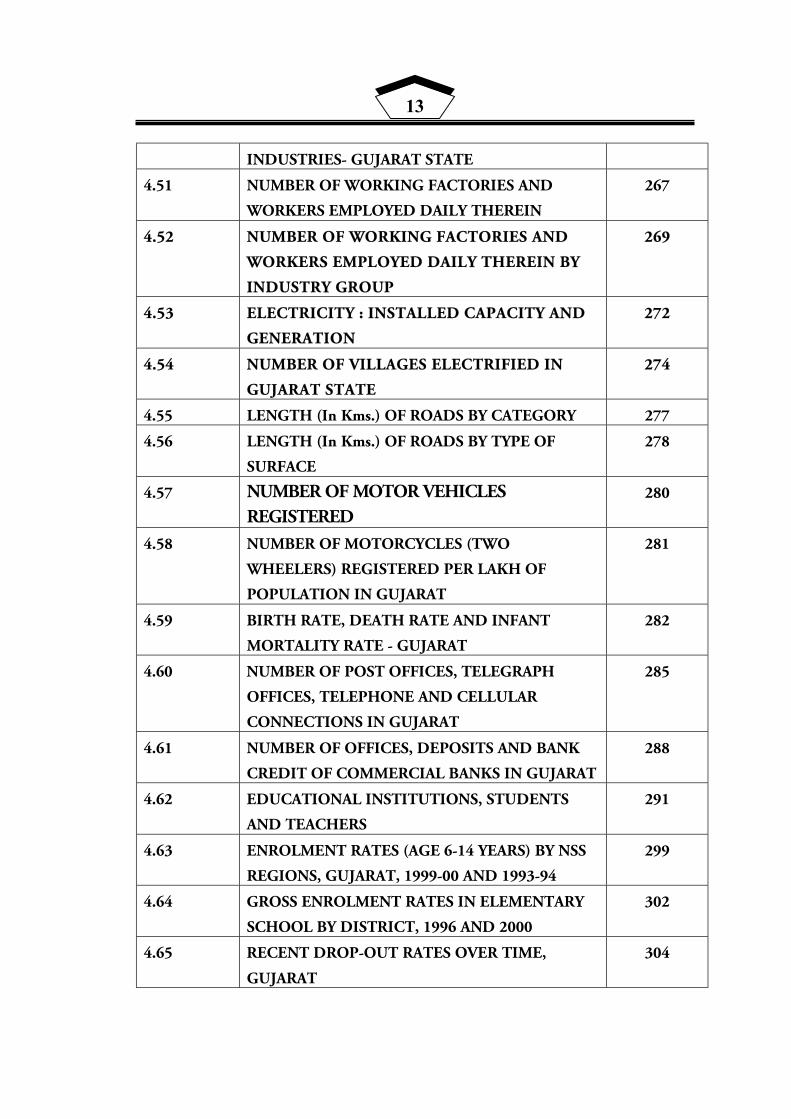
13
INDUSTRIES- GUJARAT STATE
4.51 NUMBER OF WORKING FACTORIES AND
WORKERS EMPLOYED DAILY THEREIN
267
4.52 NUMBER OF WORKING FACTORIES AND
WORKERS EMPLOYED DAILY THEREIN BY
INDUSTRY GROUP
269
4.53 ELECTRICITY : INSTALLED CAPACITY AND
GENERATION
272
4.54 NUMBER OF VILLAGES ELECTRIFIED IN
GUJARAT STATE
274
4.55 LENGTH (In Kms.) OF ROADS BY CATEGORY 277
4.56 LENGTH (In Kms.) OF ROADS BY TYPE OF
SURFACE
278
4.57 NUMBER OF MOTOR VEHICLES REGISTERED
280
4.58 NUMBER OF MOTORCYCLES (TWO
WHEELERS) REGISTERED PER LAKH OF
POPULATION IN GUJARAT
281
4.59 BIRTH RATE, DEATH RATE AND INFANT
MORTALITY RATE - GUJARAT
282
4.60 NUMBER OF POST OFFICES, TELEGRAPH
OFFICES, TELEPHONE AND CELLULAR
CONNECTIONS IN GUJARAT
285
4.61 NUMBER OF OFFICES, DEPOSITS AND BANK
CREDIT OF COMMERCIAL BANKS IN GUJARAT
288
4.62 EDUCATIONAL INSTITUTIONS, STUDENTS
AND TEACHERS
291
4.63 ENROLMENT RATES (AGE 6-14 YEARS) BY NSS
REGIONS, GUJARAT, 1999-00 AND 1993-94
299
4.64 GROSS ENROLMENT RATES IN ELEMENTARY
SCHOOL BY DISTRICT, 1996 AND 2000
302
4.65 RECENT DROP-OUT RATES OVER TIME,
GUJARAT
304
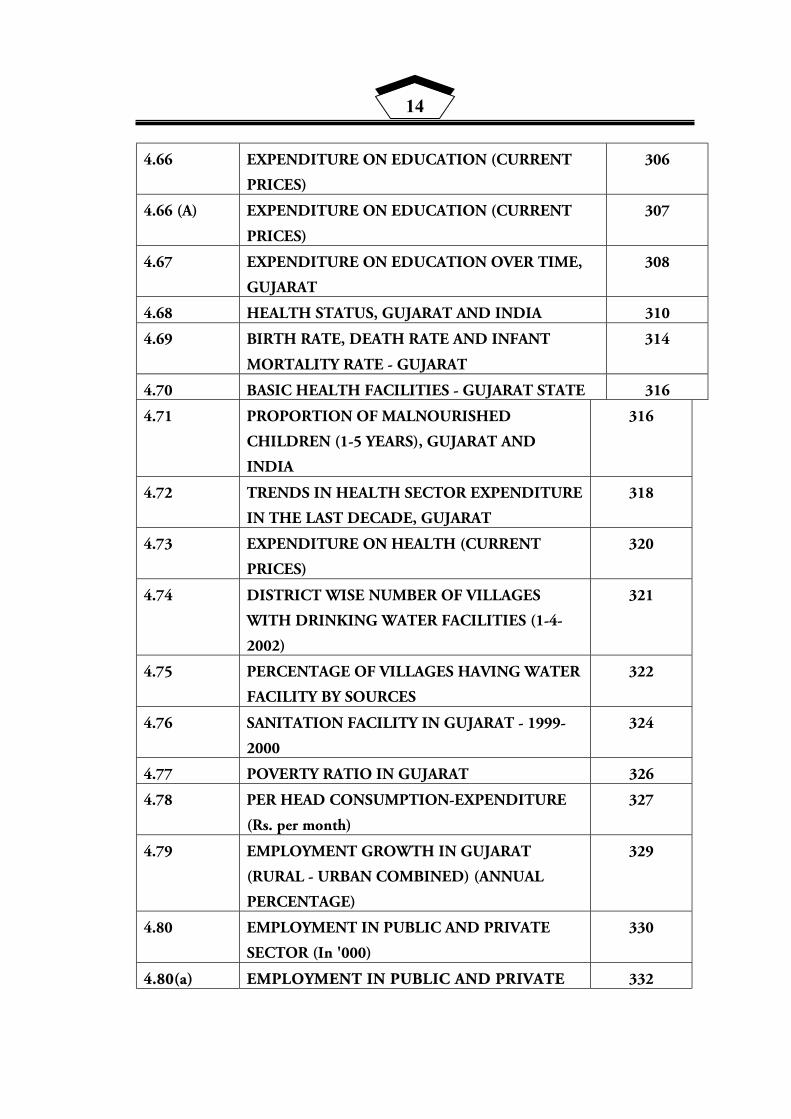
14
4.66 EXPENDITURE ON EDUCATION (CURRENT
PRICES)
306
4.66 (A) EXPENDITURE ON EDUCATION (CURRENT
PRICES)
307
4.67 EXPENDITURE ON EDUCATION OVER TIME,
GUJARAT
308
4.68 HEALTH STATUS, GUJARAT AND INDIA 310
4.69 BIRTH RATE, DEATH RATE AND INFANT
MORTALITY RATE - GUJARAT
314
4.70 BASIC HEALTH FACILITIES - GUJARAT STATE 316
4.71 PROPORTION OF MALNOURISHED
CHILDREN (1-5 YEARS), GUJARAT AND
INDIA
316
4.72 TRENDS IN HEALTH SECTOR EXPENDITURE
IN THE LAST DECADE, GUJARAT
318
4.73 EXPENDITURE ON HEALTH (CURRENT
PRICES)
320
4.74 DISTRICT WISE NUMBER OF VILLAGES
WITH DRINKING WATER FACILITIES (1-4-
2002)
321
4.75 PERCENTAGE OF VILLAGES HAVING WATER
FACILITY BY SOURCES
322
4.76 SANITATION FACILITY IN GUJARAT - 1999-
2000
324
4.77 POVERTY RATIO IN GUJARAT 326
4.78 PER HEAD CONSUMPTION-EXPENDITURE
(Rs. per month)
327
4.79 EMPLOYMENT GROWTH IN GUJARAT
(RURAL - URBAN COMBINED) (ANNUAL
PERCENTAGE)
329
4.80 EMPLOYMENT IN PUBLIC AND PRIVATE
SECTOR (In '000)
330
4.80(a) EMPLOYMENT IN PUBLIC AND PRIVATE 332

15
SECTOR BY INDUSTRIAL CLASSIFICATION
(In '000)
4.81 WOMEN EMPLOYMENT IN PUBLIC AND
PRIVATE SECTOR (In '000)
334
4.82 WORKING OF EMPLOYMENT EXCHANGES
(In '000)
336
4.83 NUMBER OF JOB SEEKERS BY LEVEL OF
EDUCATION REGISTERED WITH
EMPLOYMENT EXCHANGES
338
4.83(A) EDUCATIONAL AND UNEDUCATIONAL
UNEMPLOYMENT (PERCENTAGE)
339
4.84 CONSUMER PRICE INDEX FOR
AGRICULTURAL LABOURERS AND RURAL
LABOURERS IN GUJARAT AND INDIA
339
4.85 CONSUMER PRICE INDEX OF RURAL
LABOURERS IN MAIN CITIES OF GUJARAT
341
4.86 EXPENDITURE RATIOS IN GUJARAT - 1990-
91 TO 2000-02
343
4.87 SECTOR WISE EXPENDITURE UNDER
PLANNING (Rs. Lakh)
345
4.88 DIFFERENT DEFICIT % OF GSDP 347
4.89 DEBT / GDP RATIO COMPARISON OF
GUJARAT AND INDIA
348
4.90 GOVERNMENT SUBSIDIES IN GUJARAT -
1993-94 TO 1999-2000
349
4.91 SUMMARY AND FINANCIAL BURDEN ON
STATE ECONOMY
353
16
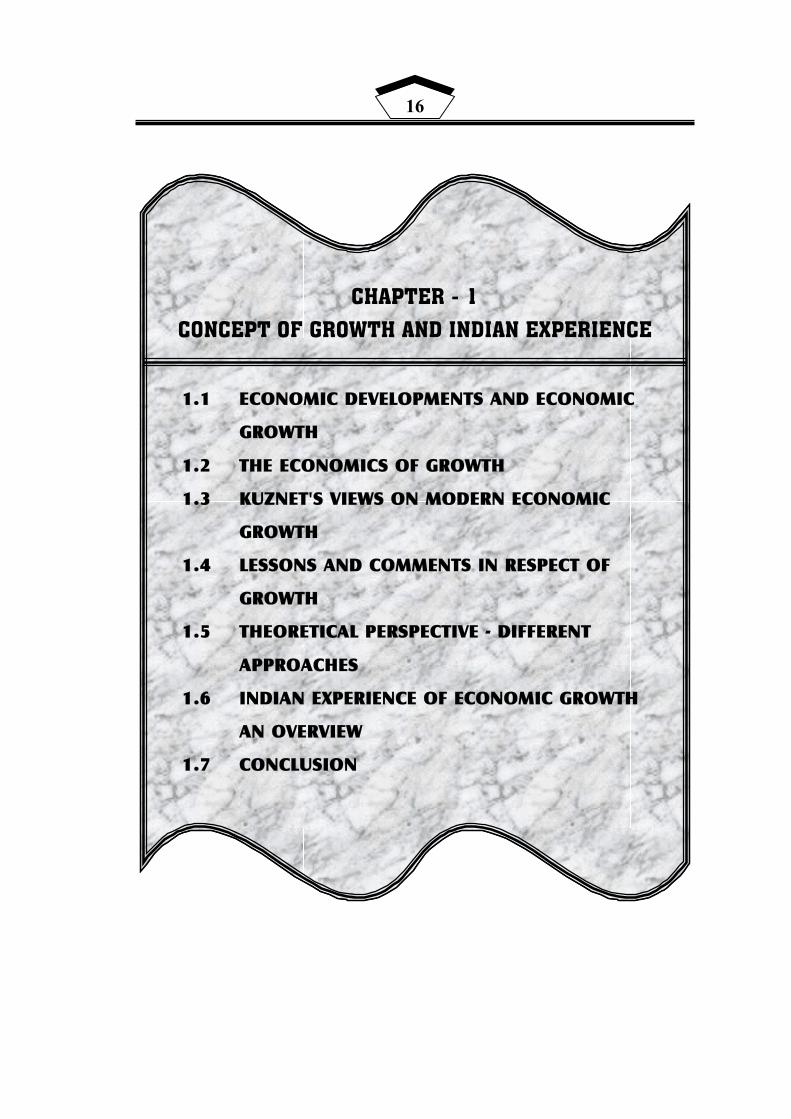
CHAPTER - 1
CONCEPT OF GROWTH AND INDIAN EXPERIENCE
1.1 ECONOMIC DEVELOPMENTS AND ECONOMIC
GROWTH
1.2 THE ECONOMICS OF GROWTH
1.3 KUZNET'S VIEWS ON MODERN ECONOMIC
GROWTH
1.4 LESSONS AND COMMENTS IN RESPECT OF
GROWTH
1.5 THEORETICAL PERSPECTIVE - DIFFERENT
APPROACHES
1.6 INDIAN EXPERIENCE OF ECONOMIC GROWTH
AN OVERVIEW
1.7 CONCLUSION

17
CHAPTER - 1
CONCEPT OF GROWTH AND INDIAN EXPERIENCE
1.1 ECONOMIC DEVELOPMENTS AND ECONOMIC GROWTH
Generally speaking, economic development refers to the problems
of underdeveloped countries and economic growth to those of developed
countries. Maddison makes the distinction between two terms in this
sense when he writes, "The rising of income level is generally called
economic growth in rich countries and in poor ones it is called economic
development". But this view does not specify the underlying forces,
which raise the income levels in the two types of economies.
In fact the terms "development" and "growth" have nothing to do
with the type of economy. Schumpiter relates the distinction between
the two the nature and causes, when be defines development as a
discontinuous and spontaneous change in the stationary state which
forever alters and displaces the equilibrium state previously existing;
while growth is a gradual and steady change in the long run which
comes about by a gradual increase in the rate of savings and population.
This view of Schumpiter has been widely accepted and elaborated by
the majority of economists. According to Kindleberger; "Economic
growth means more output and changes in the technical and institutional
arrangements by which it is produced and distributed". Friedman defines
growth as an expansion of the system in one or more dimensions
18
without a change in the structure and development as an innovative
process leading to the structural transformation of social systems.
Thus economic growth is related to a quantitative sustained
increase in the country per-capita output or income accompanied by
expansion in its labour force, consumption, capital and volume of trade.
On the other hand, economic development is a wider term. The concept
of development is not merely quantitative but it is qualitative also. In the
qualitative aspects it coincides with the welfare objectives. Thus it is not
enough to see what is produced but we have also to see how it is
produced and distributed. It is related to qualitative change in economic
wants, goods, incentives and institutions. It describes the underlying
determinants of growth such as technological and structural changes
Development embraces both growth and decline. An economy can grow
but it may not develop because poverty unemployment and inequality
may continue to prevail due to absence of technological and structural
changes. But it is difficult to imagine development without economic
growth in the absence of an increase in output per-capita particularly
when population is growing rapidly.
1.2 THE ECONOMICS OF GROWTH
Economic growth of any society is largely determined by the
integration of three major factors on components. They are identified as-
(A) Capital accumulation, including all new investments in land,
physical equipment and human resources.
(B) Growth in population and thus although delayed growth in labour
force.

19
(C) Technological progress.
These can be studied in brief as under :
Capital accumulation results when some proportion of present
income is saved and invested in order to augment future output and
income. Nation's physical "capital stock" is increased by induction of
new factories, machinery, equipment and materials. It enables the
economy to achieve expanded output level. It is important to note that
such directly productive investments are supplemented by investments
in social and economic infrastructure like - roads, electricity, water and
sanitation, communication - these investments facilitate and integrate
economic activities. For example, investment by a farmer in a new
tractor may increase the total output of the vegetables he can produce,
but without adequate transport facilities to get this extra product to local
commercial markets, his investment may not add anything to national
food production.
Economy can be strengthened by some supplementary or indirect
ways investment in a nation's resource. The installation of irrigation
facilities may improve the quality of nation's cultivable land and thereby
raising the productivity per hectare. 56 hectares of irrigated land may
product the same output with equal amount of other input that which can
be produced in 100 hectares of non-irrigated land. Such could be the
result by way of application of innovations in cultivations and or by way
of usage of chemical fertilizers and or hybrid seeds. These are but the
important forms of investment through which the quality of land
resource gets improved and thereby increased level of productivity is
achieved.
20
Another important form of investment is found in the form of
investment in human resources. This type of investments brings greater
amount of change in human potentials and thereby influencing
productivity of manpower. Varied examples are found where in certain
vocational programmes, on the job training, adult or informal
educational programmes have resulted into diversity and additions in
skills and resources. This has its direct impact on quality of physical and
or human assets. It is this kind of investment, which has drawn the
attention of planners and policy makers while planning for future
development. Diversified multiple programmes of orientation are
considered as investment in human resources to achieve higher level of
growth.
These all types of investments lead the economy towards "Capital
accumulation". Capital accumulations add new resources to the existing
one and or upgrade the quality of existing resources. However it is
important to note that its essential feature is that, it involves a tradeoff
between present and future consumption giving up a little now so that
more can be had later.
Population and labour force growth :
In general population growth leading to additional labour force is
considered stimulant to economic growth. It is generally known that a
larger labour force means more productive manpower, while a large
overall population increases the potential size of domestic markets.
However there is unending debate prevailing over the issue of pros and
cons of population growth or labour force. It is understood that it

21
depends on the ability of economic system to absorb and productively
employ these added workers. This however is again associated with the
rate and kind of capital accumulation and the availability of related
factors such as managerial and administrative skills.
Given an initial understanding of the first two components
(capital accumulation and population growth) and disregarding for a
moment the third (technology) let us try to understand production
possibility curve to expand society's potential total output of all goods.
Assuming given rate of technology and double the quality of
capital stock and human resources - leads to total shift in the production
possibility curve. It may shift uniformly outward from P-P to P'-P'.
Assuming this for two commodities like cycle and sugar - it means that
the gross national product will be higher than before. The other words,
the process of economic growth is underway.
This relationship can be understood even in case of the country in
question operates at with under utilized physical and human resources -
a growth of productive resources can result in a higher total output
combination. This can be well be demonstrated through a hypothetical
curve as under :

22
Fig. 1.1
HISTORIC GROWTH AND CONTEMPORARY DEVELOPMENT
The Effect of Increases in Physical and Human Resources on the
Production - Possibility Frontier
It is found clearly in the above figure 1.1 that even if there is
widespread unemployment or underutilized or idle capital and land,
productive resources can result in a higher total output. This also
illustrates the economic fact that resource growth is not necessary
condition for short run economic growth. However, in the long run the
improvement and up gradation of the quality of existing resources and
new investments designed to expand the quantity of these resources are
principal means of accelerating the growth of national output.
This relationship can again be examined through curve under
different conditions. Instead of assuming the proportionate growth of all
factors of productivity if only capital or only land is increased in quality
and quantity. The production possibility suggests different things.
Diagram 1.2 (a) shows that if cycle manufacturing is relatively large
user of capital equipment while sugar production is relatively land
intensive process, then the shift in society's production possibilities
curve will be more pronounced for cycles when capital grows rapidly
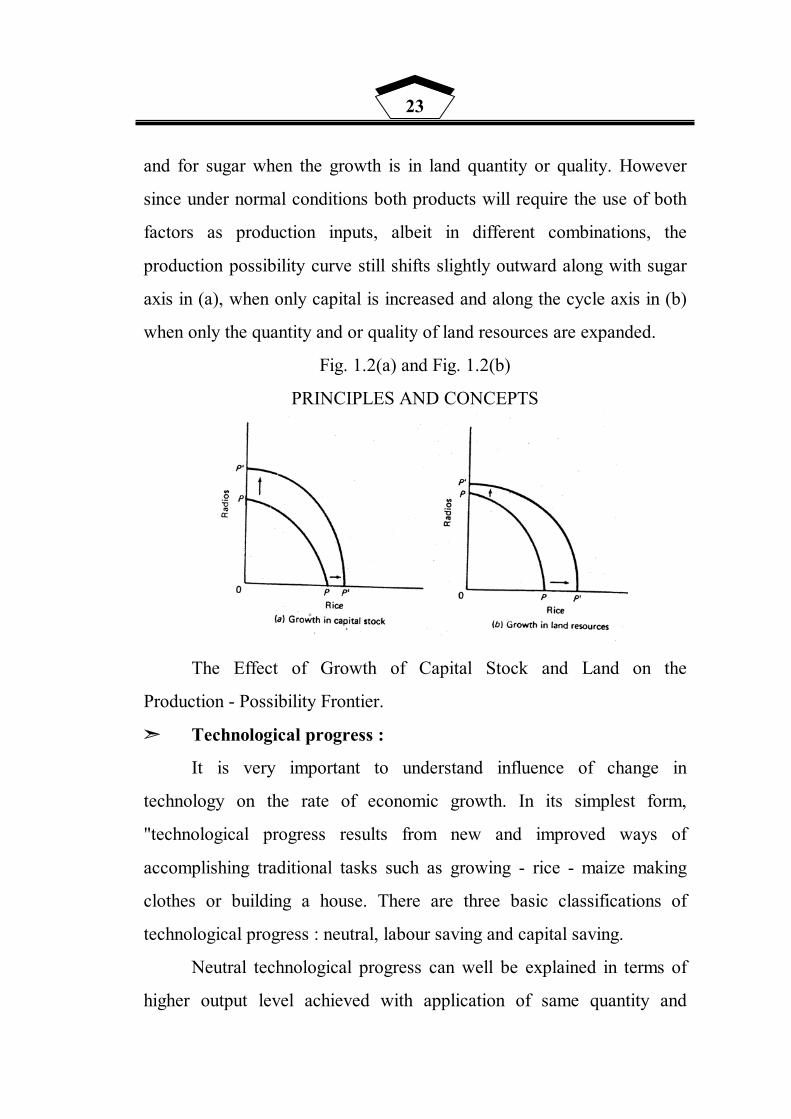
23
and for sugar when the growth is in land quantity or quality. However
since under normal conditions both products will require the use of both
factors as production inputs, albeit in different combinations, the
production possibility curve still shifts slightly outward along with sugar
axis in (a), when only capital is increased and along the cycle axis in (b)
when only the quantity and or quality of land resources are expanded.
Fig. 1.2(a) and Fig. 1.2(b)
PRINCIPLES AND CONCEPTS
The Effect of Growth of Capital Stock and Land on the
Production - Possibility Frontier.
Technological progress :
It is very important to understand influence of change in
technology on the rate of economic growth. In its simplest form,
"technological progress results from new and improved ways of
accomplishing traditional tasks such as growing - rice - maize making
clothes or building a house. There are three basic classifications of
technological progress : neutral, labour saving and capital saving.
Neutral technological progress can well be explained in terms of
higher output level achieved with application of same quantity and

24
combination of factor inputs. This expresses the result of simple division
of labour leading to total output levels and grater consumption for all
individuals. In terms of production possibility analysis it is just a neutral
technological change which doubles total output equal to doubling of all
productive inputs. The outward shifting production possibility curve
could be the same as that is presented earlier in figure 1.1
There could be other form of technological progress - in the form
of labour saving or capital saving. The use of electronic computers,
automated textile looms, highly speed electric drills, tractors and
mechanical ploughs and or all such modern machinery is known as
labour saving technology. The history of economic progress in 20th
century is largely the outcome of these single important parameters.
Capital saving technological progress is much rare phenomenon.
It is because of the fact that world's scientific and technological research
is conducted in developed countries where there is scarce of labour.
However third world countries or known as developing countries are
labour abundant countries, where capital is scarce and therefore capital
saving technological progress resulting into more efficient labour
intensive methods of production like - hand or rotary powered weeders
and threshers, foot operated bellows pumps and back mounted
mechanical sprayers for small scale agriculture is found.
Technological progress can also be visualized in the form of
labour or capital augmentation. Labour augmenting technological
progress can be found when an attempt is made to upgrade or improve
the skill of labour, audio visual aids application in conferences
classroom teaching is the best example of this.
25
This form of technological progress and its impacts on production
can again be shown through different production possibility curves.
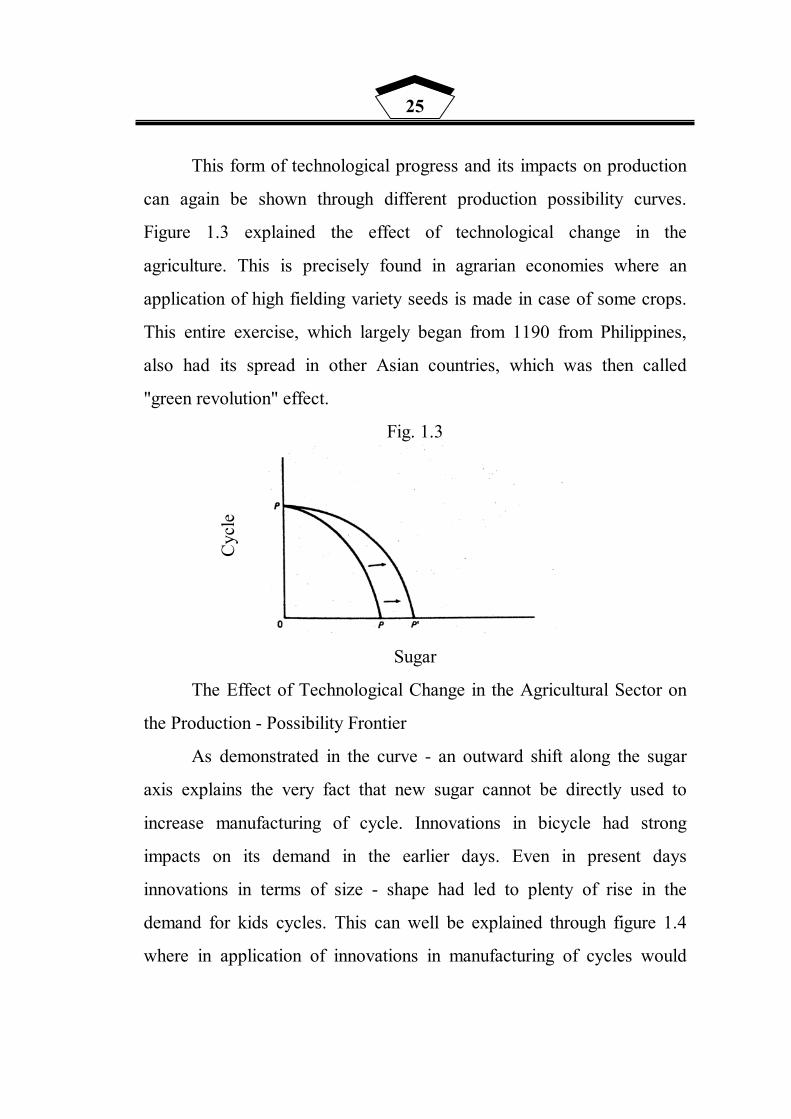
Figure 1.3 explained the effect of technological change in the
agriculture. This is precisely found in agrarian economies where an
application of high fielding variety seeds is made in case of some crops.
This entire exercise, which largely began from 1190 from Philippines,
also had its spread in other Asian countries, which was then called
"green revolution" effect.
Fig. 1.3
Sugar
The Effect of Technological Change in the Agricultural Sector on
the Production - Possibility Frontier
As demonstrated in the curve - an outward shift along the sugar
axis explains the very fact that new sugar cannot be directly used to
increase manufacturing of cycle. Innovations in bicycle had strong
impacts on its demand in the earlier days. Even in present days
innovations in terms of size - shape had led to plenty of rise in the
demand for kids cycles. This can well be explained through figure 1.4
where in application of innovations in manufacturing of cycles would
Cyc
le
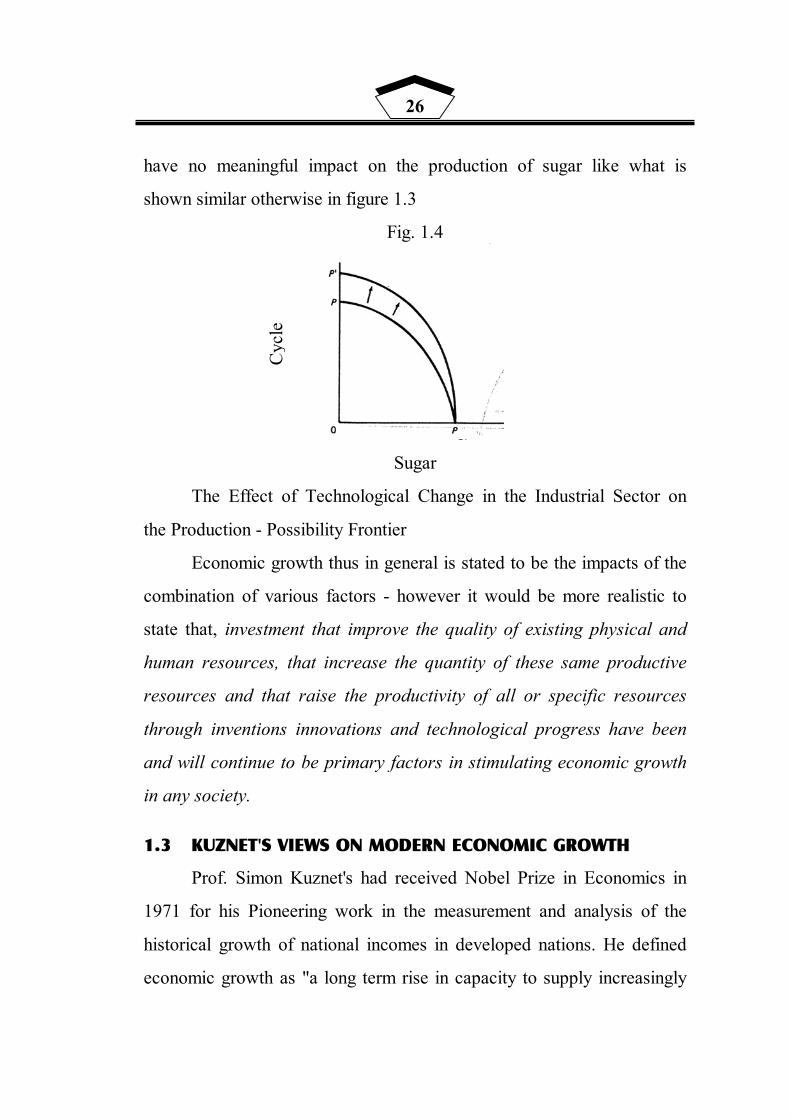
26
have no meaningful impact on the production of sugar like what is
shown similar otherwise in figure 1.3
Fig. 1.4
Sugar
The Effect of Technological Change in the Industrial Sector on
the Production - Possibility Frontier
Economic growth thus in general is stated to be the impacts of the
combination of various factors - however it would be more realistic to
state that, investment that improve the quality of existing physical and
human resources, that increase the quantity of these same productive
resources and that raise the productivity of all or specific resources
through inventions innovations and technological progress have been
and will continue to be primary factors in stimulating economic growth
in any society.
1.3 KUZNET'S VIEWS ON MODERN ECONOMIC GROWTH
Prof. Simon Kuznet's had received Nobel Prize in Economics in
1971 for his Pioneering work in the measurement and analysis of the
historical growth of national incomes in developed nations. He defined
economic growth as "a long term rise in capacity to supply increasingly
Cyc
le

27
diverse economic goods to its populations this growing capacity based
on advancing technology and the institutional and ideological
adjustments that it demands" This definition thus concentrates mainly on
the following three components.
(1) The sustained rise in national output :
It is manifestations of economic growth and the ability to provide
a wide range of goods is a sign of economic maturity.
(2) Advancing technology :
It provides the basis of preconditions for continuous economic
growth - a necessary but not sufficient condition.
(3) Relevance of institutional, attitudinal and ideological
adjustments :
In order to realize the potential for growth inherent in new
technology - such adjustments are but to be accepted. Technological
innovations without concomitant social innovations are like a light bulb
without electricity. Without complementary input nothing can be
achieved despite plenty of potentials.
Prof. Kuznet's has made exhaustive analysis of economic growth.
He has exposed in detail six characteristics, which are largely reflected
in the growth process of developed nations. They are mainly as under :
Two aggregate economic variables :
1. High rates of growth of per capita output and population :
Recent experiences within the last two decades of contemporary
developed countries reveal the historical fact that non communist
28
developed countries' annual growth rates over the past 200 years
averaged almost 2% for per capital output and 1% for population,
therefore 3% for total output. These rates were for greater than those
experienced during the entire era, therefore the start of the industrial
revolution in the late 18th. For example, per capita output during the last
two centuries has been estimated to be at almost 10 times that of the pre-
modern era; population has grown at a multiple of 4 or 5 times its level
in the earlier period, and the acceleration in the growth rate of total
output or GNP therefore estimated to have been some 40 or 50 times as
large as that experienced before the 19th century.
High rates of productivity increase :
It is found that modern economic growth refers to relatively high
rate of rise in total factor productivity. Currently rates of productivity
increase have also been large multiples of the rates in the pre-modern
era. It is found that technological progress including the upgrading of
existing physical and human resources accounts for most of the
measured historical in per capita GNP.
High rates of economic structural transformation :
The third important characteristic of modern economic growth is
the high rate of structural and sectoral change inherent in the growth
process. March towards economic progress reveals the fact that in the
first stage of transformation countries shifted gradually from agriculture
to industry sector and in the current round now this has moved clearly
from industry to services. This has also brought about a significant
change in the scale of average size of productive units. This journey
29
towards progress in that way is also found diverted from rural
agricultural economy to urban service economy, comparative study
indicates that the magnitude and intensity of this kind of structural
transformation is found more and more rapidly in developed countries
like U.K., U.S.A., Germany, Japan etc.
High rates of social, political and ideological transformation :
Any society enters into the stage of structural transformation
provided if the society in general is able to bring about changes in
attitudes, institutions and ideologies, Gunnar Myrdal has exposed in
detail the significance of attitude, institutional changes that plays key
rate in shaping the future of the society. Certain parameters are note
worthy in this regard.
(a) Rationality :
This indicates the significance of modern thinking, intellectual
process in arriving at important decision, transformation is not outcome
of modern tools only - it also and more importantly envisages -
visionary approach, broad thinking, wider horizon. This leads to the
policy decisions based on logical convictions with sound and deep
rooted thinking.
(b) Planning :
Wider horizon, deep thinking alone does not suffice the purpose.
There is need for planned actions in the appropriate direction.
(c) Social economic equality :
Journey towards progress does not materialize in practice without
environment of equal opportunistic for higher, better standard of living.
30
(d) Improved institution attitudes :
Institutional environment, attitudes change must be conducive to
increase labor efficiency and diligence and to promote effective
competition and social and economic mobility. In a developed economy
the true meaning of the concept of "Modern Man" has to do more with
internal integrated approach and less with external mode of living.
INTERNATIONAL ECONOMIC OUTREACH :
This characteristic of modern economic growth is more closely
related with the role of developed countries in international spectrum. It
depends on propensity of developed countries to reach to the less
developed countries to facilitate them with primary, secondary product
and to penetrate into such markets. With higher propensity to each - the
modern technology, tools of communications are made extensively
applicable to make this process more feasible with more economy.
Historically it is found that before 19th Century very little efforts were
made or were made feasible in this respect. But in the end of the 20th
century this process has become more common easily acceptable and
greatly acknowledged by the recipients of less developed countries.
LIMITED INTERNATIONAL SPREAD OF ECONOMIC
GROWTH :
It is true that there has been enormous increase in the world
output over the past two centuries. However the spread of modern
economic growth is still largely limited to less than one fourth of the
world's population. This is reflected through the other fact that minority
of world's total population enjoys more than 80% of world's economic

31
wealth. Globally as well as locally one finds greater amount of
inequality between the nations and within the nation in respect of
distribution or economic power. All patients of development at large
have resulted by and large into widening the gap between the rich and
the poor in less developed countries.
CLOSE INTER DEPENDENCE :
The six characteristics and moderate economic growth explained
in the previous sections suggest that there is in built close
interdependence between these characteristics. Growth process in
general cannot be made possible in isolation. It is per labour
productivity, which generates high rates of per-capita output. This in
turn leads to higher level of per-capita consumption. This provides the
incentives for structural transformation structural transformation
influences organizations and locations. This in general creates the
platform for societal transformation. Ultimately this social
transformation boosts development activities augmenting the growth
process. Simon Kuzuet's appropriately remarks "Rapid economic growth
makes possible basic scientific research, which in turn leads to
technological inventions and innovations which propel economic growth
even further.
This logic in itself is a cause for the greater disparity between
already grown countries and countries to grow now. As scientific
innovations in general takes place more in magnitude and deep in
intensity in economically grown countries resulting into solutions to
their problems and having very little impacts on the country to grow

32
now. This means that developed countries can therefore provide a
continuous mechanism for self-sustaining technological and economic
advance countries.
1.4 LESSONS AND COMMENTS IN RESPECT OF GROWTH :
The new economic view of development largely evolved after the
experience of 1950-60 is, when a large number of third world nations
did achieve the overall UN growth target but the levels of the living of
the masses of people remained for the most part unchanged. Therefore
the redefined context of development includes reduction of poverty
inequality and unemployment.
Denis Gouler says, "Underdevelopment is shocking phenomenon.
It is in a way the culture of poverty. Development must therefore be
considered of as a multidimensional process involving major change in
social structure, popular attitudes and national institutions as well as
acceleration of economic growth, the reduction of inequality and the
eradication of absolute poverty.
Looking globally one finds very clearly that stages of economic
growth theories and related models of rapid industrialization gave too
little emphasis on the very different and less favourable initial
economic, social and political conditions of today developing countries.
Very close examination of the growth process of less developed
countries highlights the fact that the growth process and position of
these countries today is in many important ways significantly different
from that of the currently developed countries - as they embarked on
their era of modern economic growth.

33
Michel Todaro has elaborated eight significant differences in
initial conditions, which requires to addressed and understood to
accelerate the growth process of less developed countries.
These points of differences in the initial conditions of respective
nations can be examined in brief as under :
[I] RESOURCE ENDOWMENTS, PHYSICAL AND HUMAN :
Looking at the recent past of the growth process that existed
between developed and less developed nations it is clearly found that the
Third World Countries in 80's were not found well endowed with
natural resources than were the currently developed nations when they
began their growth. From amongst less developed countries except few
countries which were blessed with plenty of petroleum and other natural
resources - most of the Asian nations were having plenty of population
on one hand and were holding very little natural resources. Finance was
a major constrain to less developed countries to exploit the less available
resources in comparison with developed nations.
The key differentiation was also found in respect of available
skilled human resources. Country has to depend on human resource
having managerial and technical skills to exploit the available resources.
Western developed nations have clear-cut edge over Asian less
developed countries in this respect.
[II] RELATIVE LEVELS OF PER CAPITA IN COME AND
GNP :
The three fourths of the world population at present living in
developing countries have on the average a much lower level of real per-
34
capita income than their counter parts had in the 19th century. 75% third
world countries even in the mid of 90's were found be living below the
level of subsistence. It is also important to note that at the initiation of
growth process developed countries were economically well advanced
in comparison with the initial condition of less developed countries at
the time of growth process.
[III] CLIMATIC DIFFERENCE :
The most important fact to take into consideration is that almost
every successful example of modern economic growth has occurred in a
temperature zone country while all the Third world countries are
situated in tropical or subtropical climatic zones. Difference in the
climatic conditions has stronger influence on the level and nature of
growth. Extreme heat and humidity in most poor countries contribute to
deteriorating soil qualities and rapid depreciation of many natural goods.
While countries in temperature zone have also added advantage of
sound health yielding more efficiency to promote productivity.
[IV] POPULATION SIZE DISTRIBUTION AND GROWTH :
Third world population size, density and growth constitute
another important difference between less developed and developed
countries while this population syndrome in developed countries -
before and during their growth process was not found hurdle-some as
the rate of population growth in such countries was very low and slow.
Most of the third world countries population was found increasing at
annual rate in excess of 2.5% in the later part of 80's and early part of
35
90's even in the later part of 90's this tend to have an increase at the rate
of about 2% per year.
[V] ROLE OF MIGRATION :
One of the most striking facts pertaining to the differing rates of
natural population increase is of international migration which begun
late in the 19th century and in the 20th century. International migration
was found both widespread and large in scale.
Because of severe famine periods and years rural unskilled
workers from Italy, Germany and Ireland migrated heaving in labour
search nations of North America and Australia. This has been widely
depicted by Brinley Thomas in his treatise on migration and economic
growth. It is also important to note that Asians and Africans have not
shown that much tendency for migration towards western nations in
comparison with European nations.
Besides institutional factors - geographical distance leading to
economic distance and or strict modern immigration laws have also
affected the nature and rate of migration from developing nations to the
developed nations.
THE GROWTH STIMULUS OF INTERNATIONAL TRADE :
International trade is known as "Engine of growth" as it propels
the development of currently economically advanced nations during 19th
and 20th centuries. Rapidly expanding export market works as stimulant
to growth. In early 19th century developed nation were relatively in a
sound position because of stable political structure and flexible social
36
institutional. This enabled such countries borrowing capacity, which in
turn influenced international trade. This capital accumulation stimulated
exportable production. As against this scenario - today less developed
countries face formidable challenge in generating rapid economic
growth on the basis of international trade. Their terms of trade as against
the then developed nations' terms of trade have declined steadily
amounting to reduction in export capacity. It is also found that in certain
products where LDC's are in a sound position by lowering cost of
production, the developed nations have played unfair attitude by way of
entering into tariff and non-tariff etc.
BASIC SCIENTIFIC - TECHNOLOGICALLY RESEARCH
AND DEVELOPMENT CAPABILITIES :
It is but the tact that scientific and technological research plays
crucial role in augmenting and diversifying growth process of the
economy. History says that the developed economies were having the
sound position at the initiation in growth by way of relatively better
economic position and also in terms of skilled human resources. Their
position in this respect seemed to be much stronger as against the
position of less developed countries position today at the initiation in
this respect. This gap has obviously influences the rate and nature of
progress of currently developing countries. Third world nations are in
general at much disadvantageous situation, which restricts the growth
process and affects the speed of the progress.
37
STABILITY AND FLEXIBILITY OF POLITICAL AND
SOCIAL INSTITUTIONS :
Looking at the initial condition of developed nations and third
world nations, important difference is found in the nature of political
and social institutions. The most important difference to note is that
currently developed nations were having political freedom and
consolidations much before they entered into the growth process - while
third world nations are relatively late free countries in respect of
political freedom. Because of late freedom the process of consolidation
the form of political maturity is yet to be gained which slows the
progress. Socially and culturally too, developed nations have obtained
homogeneity within and between them. This element is also less present
in case of less developed countries. Their limitations in this regard has
restricted the horizon, out look towards material progress, influence of
rationality in the decision making updating in work ethics - which have
in combined affected the growth process of third world nations.
SUMMARY :
From the above discussion it can be stated that there had been
vast differentiation found at the initial period of growth between
developed western nation and developing Asian nations. The most
important differential is the gap between the globes specially, existed
and which prevails even today in respect of required technological social
and institutional changes. Such transformation is to be taken into
consideration within the nation at micro level and between the nations at
38
macro level. This leads to the emerging demand for "New International
Economic Order" for the third world nations.
1.5 THEORETICAL PERSPECTIVE - DIFFERENT
APPROACHES :
1.5.1 AN OVERVIEW ON LEADING THEORIES :
Looking at the recent literature on economic development -
precisely in the beginning of second half of twentieth century, it is found
that there are 4 major and little competing strands of thought. They are :
(1) The linear stages of growth model, (2) Theories and patters of
structural change, (3) The international dependence revolution and (4)
The neoclassical-free market counter revolution.
We find much discussion in depth on the concept of stages of
economic growth during the 1950's and early 1960's. This concept
largely manifested a series of successive stages through which all
countries must pass. This mainly focused on the theory of development
which insisted for the right quantity and an appropriate mix of saving,
investment and foreign aid necessary for the Third World nations to
enable them for the rapid development - the process through which
developed countries in the recent past have undergone. It calls for the
development synonymous with rapid - aggregate economic growth.
The major thought, concepts of development as entitled above can
be explained in brief as under :

39
(A) The linear stage theory :
Soon after the end of Second World War, many nations found
collapse of the economy. Industrialized nations could not immediately
workout the strategy to rebuild the collapsed agrarian nations. There was
scarce of tools or technologies to be applied to rebuild the destroyed
economics. Amidst this puzzle sum environment there arose some
intellectual thoughts generating intellectual environment to inject
growth dosages in the destroyed economics.
American Economic Historian W. W. Rostow was amongst the
top dives who initiated for conceptual presentation on the doctrine of
economic growth. According to the Rostow doctrine, the transition from
underdevelopment to development can be described in terms of a series
of steps or stages through which all countries must proceed. He has
advocated for the theory of economic growth by way of entering into
"Take off" stage. According to him advanced countries have passed the
stage of, "take off into self sustaining growth" and the underdeveloped
countries that were till in either the traditional society or the "pre
conditions" stage had only to follow a certain set of rules of
development to take off in their turn into self sustaining economic
growth.
In follow through a mechanism for development and growth was
suggested by Harrod - Domar. Harrod Domar growth model talks of
more investment leading to more economic growth.
40
(B) Harrod - Domar Growth Model :
According to this model every economy must save a certain
proportion of its national income, if only to replace warn out or impaired
capital goods. However, in order to grow, new investments representing
net additions to the capital stock are necessary. It states that the rate of
growth of GNP (AY/Y0 is determined jointly by the national savings
ratio "S" and then national capital output ratio "k" - more specifically, it
says that the growth rate of national income will be directly or more
positively related to the saving ratio (i.e. - the more an economy is able
to save - and invest, out of given GNP, the greater will be the growth of
that GNP) and "inversely" or "negatively" related to the economy's
capital output ratio (i.e., the higher is "k", the lower will be the rate of
GNP growth).
The theory explains the significance of national savings and
investment. The main obstacle to or constraint on development
according to this theory was the relatively low level of new capital
formation in most poor countries. However experiences of several
countries over the time indicates the fact that saving and investment is
not a necessary condition for accelerating rate of economic growth.
1.5.2 INTERSECTORAL RELATIONS AND ECONOMIC
GROWTH
It is usually found that the growth process of economy primarily
reflects shift of its majority of population from agriculture to industry of
rural to urban setting. This process virtually demonstrates change in the
value addition of industrial sector and there by its contribution to

41
national income. This trend is explained theoretically with the help of
Engel's law. He discovered that with the rise in the incomes of family,
the proportion of their budget spent on food decline. As the main
function of the agricultural output would not grow as rapidly as demand
for industrial products and services, therefore the share of agriculture in
national product would decline. The second reason is that the
productivity in the agriculture sector gradually leads to the rise in the
demand for the use of machinery and new modes of cultivation bringing
change in the industrial sector. This relationship held for all countries of
the world that have experienced sustained development.
Chernery and Syrquin explain that in reality a deviation in trend
of development should be regarded as average pattern. He has tried to
examine this relationship with the actual historical performance of
several European countries plus Japan.
Even before the concept of Gross National Product was invented,
the industry agriculture relations appeared to have been found in David
Richardo's. The Principles of Political Economy and Taxation" -
published in 1870, He had tried to explain in his own model this concept
in respect of assumption of "diminishing return" and "Labour surplus".
Later on the concept of labour surplus in context of sectoral relationship
is found redefined in the literature of W. Arthur Lewis, Rugar Nurkse,
John Fri and Aster Ranis.
These various models provide as some important understanding.
If an economy starts with its entire population in agriculture, it can
move a large part of that population to industry or other employment
without any reduction in form output. Industry will have to pay a labour
42
wage, a beat more than minimum to get it to move, but as long as there
is someway of moving the food consumers by this labour from rural to
urban areas, industrialization can proceed without putting any demands
on agriculture is completely stagnant, industry can grow. As industry
continues to grow, however it will have eventually excess supply of
surplus labour, such removals of labour from agriculture will lead to a
reduction in form output. This entire relationship i.e. "Two sector labour
surplus model" is illustrated by Gillis, Parkins, Romer and Snodgrass.

43

44
How fast agricultural production must grow depends on what
happens to a number of different variables. If industry is growing very
rapidly, Agricultural productivity must grow rapidly enough to keep the
terms of trade from turning sharply against industry, thereby cutting into
industrial profits and slowing or halting industrial growth. On the other
hand as long as there is a surplus of labour and no population growth, it
is possible to ignore agricultural productivity growth and concentrate
one's resource on industries.
The neoclassical model is quieting different in respect of
examining the implications of populations or labour force growth.
According to this model an increase in population and labour in
agriculture will it self raise farm output and only of labour from
agriculture will cause farm output to full.
The increase in labour is much less of a drain on the food supply
because it is able to produce much or all of its own requirements, and
there is no surplus of labour that can be transferred at no cost to
agricultural output. If industry is to develop successfully, similar effort
must be made to ensure that agriculture grows fast enough to feed
workers in both the rural and urban sectors at ever higher level of
consumption and to prevent the terms of trade from turning sharp
against industry. Thus the neoclassical model explains the balance
between industry and agriculture from the beginning.

45
46
Underdeveloped countries are very much concerned about their
attainment or economic development. Sectoral shift also necessitates a
suitable environment for initiating, maintaining and accelerating the
pace of economic development. Prof. Arthur Lewis in this connection
rightly observed, The proximate causes of economic growth are, the
effort to economize, the increase of knowledge or its application in
production and increasing the amount of capital or other resources per
head. These three causes, though clearly distinguishable conceptually or
usually found together.
Economic growth process, which envisages structural
transformation, is not concerned with monetary aspects only. Besides
terms of trade and investment aspects this process is very much related
to social attitudes, political condition, human resources, psychological
social and cultural requirements of the country. Prof. A. K. Cairncross
has rightly observed that economic development is not just a matter of
having plenty of money nor it is purely an economic phenomenon. It
embraces all aspects of social behaviour the establishment of law and
order, scrupulousness in business dealing, including dealings with the
revenue authorities, relationships between the family literacy, familiarity
with mechanical gadgets and so on.
1.5.3 INTERNATIONAL DEPENDENCE PERSPECTIVE :
Historical references regarding theoretical perceptions provide
some more insight during the 1970s. During this period international -
dependence models gained increasing support - especially among Third
World Intellectuals. This was largely the outcome of growing
47
disenchantment with previous stages and the structural - change models.
Basic premises for general approach in this respect are centered on
institutional, political and economic rigidities at domestic and
international level. Within this approach there are mainly three major
streams of thought - namely, the neoclassical dependence model, The
false paradigm model and The dualistic development thesis.
(a) The first one "The neoclassical dependence model" - is found to
have its origin in the Marxist thinking. It is rented in evolutionary
growth story of rich country poor country relationship. This
relationship reveals the level of inequality between the rich nation
and less developed countries. A small elite group having
consolidated resources from within the poor nation serves with
and they are rewarded by certain groups of the developed - rich
nations. This theory mainly attributes underdevelopment to
largely externally induced phenomenon unlike the previous
theories of linear stages and structural change models.
(b) Second kind of international dependence approach to
development is known as "False Paradigm Model". It implicitly,
suggests that inappropriate 'advice' by certain self catered experts
and misguided actions that leads to the activities which indirectly
results into the kind of inequality between the groups and regions.
This is found inadequate to meet with any required changes to
bring stability and equality.
(c) The third is the notion of the dualist nature of development. This
is observed implicitly in structural change theories and explicit in
international dependence theories. It primarily represents the
48
existence and persistence of increasing divergence between rich
and poor nations and rich and poor people on various levels. It
considers mainly four elements. They are largely known as - "Co-
existence of superior and inferior groups - chronic and not merely
transitional co-existence, largely observed tendency of increasing
the degrees of superiority or inferiority more the trend of 'Push
down' rather 'pull up' the development of underdeveloped groups.
It is however important to note that theories pronounced and
interpreted by the scholars and institutional - political realities that are in
existence in less developed countries be distinguished appropriately
while examining and analyzing the trends of development of a particular
nation on a group.
1.6 INDIAN EXPERIENCE OF ECONOMIC GROWTH AN
OVERVIEW
Size of national income and its structural composition is key
parameters to understand and examine the growth process of economy.
In order to study the extent of changes in the national income during
different periods it is quite essential to study the annual average growth
rate of national income and per-capita income in India. The following
picture reveals a clear picture about the annual average rates of growth
of both national income and per-capita income India during different
plan periods as well as during different decades.
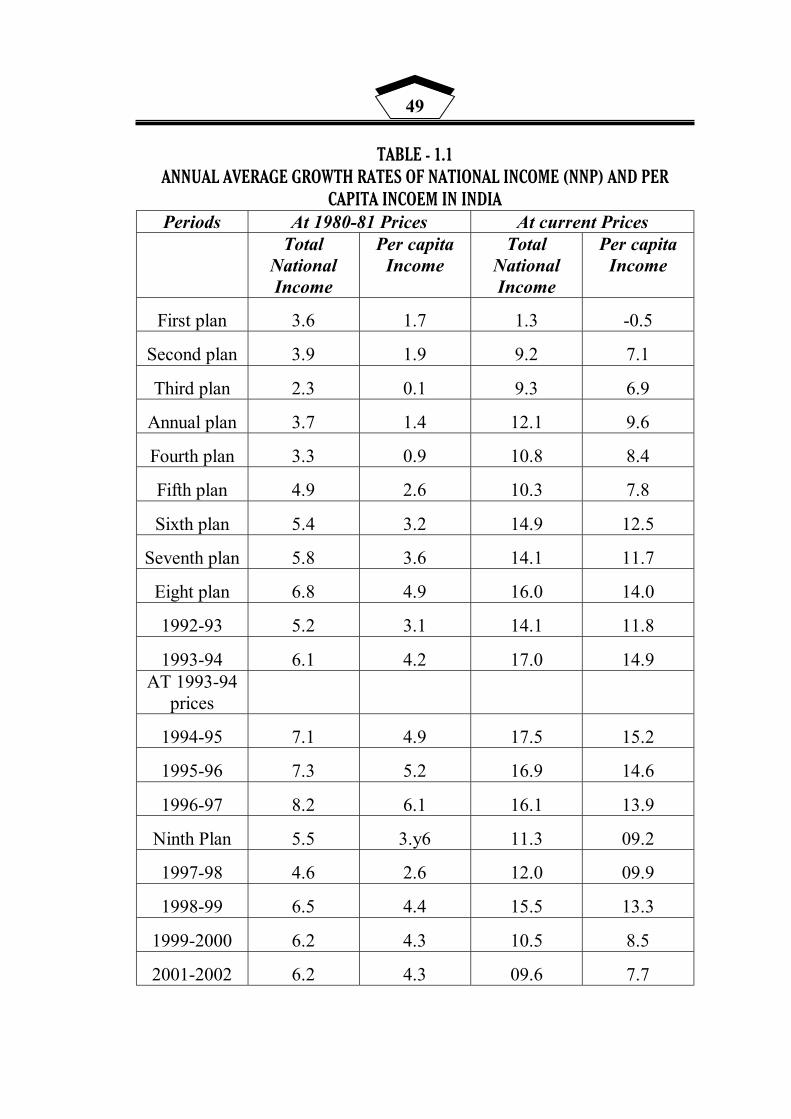
49
TABLE - 1.1
ANNUAL AVERAGE GROWTH RATES OF NATIONAL INCOME (NNP) AND PER
CAPITA INCOEM IN INDIA
Periods At 1980-81 Prices At current Prices Total
National Income
Per capita Income
Total National Income
Per capita Income
First plan 3.6 1.7 1.3 -0.5
Second plan 3.9 1.9 9.2 7.1
Third plan 2.3 0.1 9.3 6.9
Annual plan 3.7 1.4 12.1 9.6
Fourth plan 3.3 0.9 10.8 8.4
Fifth plan 4.9 2.6 10.3 7.8
Sixth plan 5.4 3.2 14.9 12.5
Seventh plan 5.8 3.6 14.1 11.7
Eight plan 6.8 4.9 16.0 14.0
1992-93 5.2 3.1 14.1 11.8
1993-94 6.1 4.2 17.0 14.9 AT 1993-94
prices
1994-95 7.1 4.9 17.5 15.2
1995-96 7.3 5.2 16.9 14.6
1996-97 8.2 6.1 16.1 13.9
Ninth Plan 5.5 3.y6 11.3 09.2
1997-98 4.6 2.6 12.0 09.9
1998-99 6.5 4.4 15.5 13.3
1999-2000 6.2 4.3 10.5 8.5
2001-2002 6.2 4.3 09.6 7.7
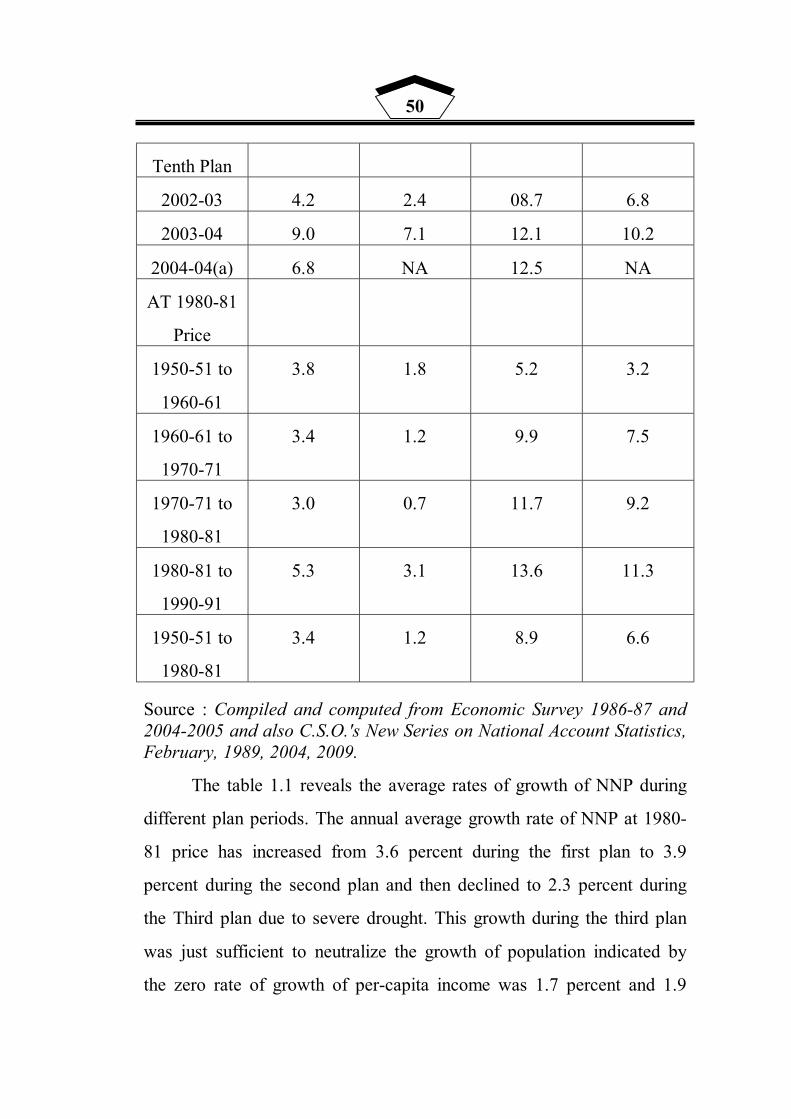
50
Tenth Plan
2002-03 4.2 2.4 08.7 6.8
2003-04 9.0 7.1 12.1 10.2
2004-04(a) 6.8 NA 12.5 NA
AT 1980-81
Price
1950-51 to
1960-61
3.8 1.8 5.2 3.2
1960-61 to
1970-71
3.4 1.2 9.9 7.5
1970-71 to
1980-81
3.0 0.7 11.7 9.2
1980-81 to
1990-91
5.3 3.1 13.6 11.3
1950-51 to
1980-81
3.4 1.2 8.9 6.6
Source : Compiled and computed from Economic Survey 1986-87 and 2004-2005 and also C.S.O.'s New Series on National Account Statistics, February, 1989, 2004, 2009.
The table 1.1 reveals the average rates of growth of NNP during
different plan periods. The annual average growth rate of NNP at 1980-
81 price has increased from 3.6 percent during the first plan to 3.9
percent during the second plan and then declined to 2.3 percent during
the Third plan due to severe drought. This growth during the third plan
was just sufficient to neutralize the growth of population indicated by
the zero rate of growth of per-capita income was 1.7 percent and 1.9

51
percent respectively. During the three Ad-hoc Annual Plans, the
economy of the country gradually started to pick up resulting in increase
in the growth rates of national income and per-capita income to 3.7
percent and 1.6 percent respectively. During the fourth plan the annual
average growth rate, of both national income and growth per-capita
income gradually declined to 3.3 percent and 0.9 percent respectively
and the same rate again gradually increased to 4.9 percent and 2.6
percent respectively during the 5th plan showing an improvement in its
performance. During the sixth plan period, the national income and per
capita income in India again recorded a growth rate of 5.4 percent and
2.3 percent respectively. Again during the seventh plan at 1980-81
prices, the national income and per capita income in India recorded a
growth rate of 5.8 percent and 3.6 percent respectively. Again during the
8th plan at 1980-81 prices, the national income and per-capita income in
India recorded a growth rate of 6.8 percent and 4.9 percent respectively
and in 1993-94 the same rate reached the level of 6.1 percent and 4.2
percent respectively.
Again as per the C.S.O.'s new series of estimates of national
income with 1993-94 as base year, it is found that the national income
and per capita income in India at 1993-94 prices recorded a growth rate
of 7.1 percent and 4.9 percent respectively in 1994-95. But the same
growth rate has declined significantly to 6.2 percent and 4.3 percent
respectively in 2001-02. The same growth rate again increased to 9.0
percent and 7.1 percent in 2003-04 and then again declined to 6.8
percent in 2004-05.
52
This table further reveals that during the first 30 years period i.e.
from 1950-51 to 1980-81, the annual average growth rates of both
national income and per capita income at 1980-81 prices were 3.4
percent and 1.2 percent respectively. But at current prices, the same
rates of growth were of the orders of 8.9 percent and 6.6 percent
respectively. This increase in the growth rates of NNP and per-capita
income at current prices during the above period was mainly due to
sharp rise in price level of the country more particularly after the Third
plan.
Moreover a further breakup of the same data into three periods
shows that during the decade of planning (1950-51 to 1960-61), the
NNP and per capita income increased at the average annual rate of 3.8
percent and 1.8 percent respectively. After that the performance of the
economy started to show a decline. During the second decade of
planning (1960-61 to 1970-71) the annual rate of growth NNP gradually
declined to 3.4 percent and that of per capita NNP to 1.2 percent. In the
next 10 year period of our planning (1970-71 to 1980-81) the annual
average growth rate of NNP and per capita NNP declined further to 3.0
percent and 0.7 percent respectively.
But during the eighties, the economy registered a spectacular
improvement in achieving its growth rate. During the period 1980-81 to
1990-91, the net national product at 1980-81 prices registered a growth
rate of 5.3 percent per annum and that of per-capita income to 3.1
percent per annum. The same growth rates of NNP and per capita NNP
at current prices showed a perceptible increase to 13.6 percent and 11.3
53
percent respectively per annum in comparison to that of 8.9 percent and
6.6 percent respectively per annum during the period of 30 years.
SECTORAL DISTRIBUTION NATIONAL INCOME :
Sectoral contribution of national income depicts a clear picture
about the composition of distribution of national income by industrial
origin. Thus is shows the contribution made by different sectors towards
the national income of the country. In India among the different sectors,
the primary sector and more particularly agriculture still play a dominant
role in contributing the major portion of the national income of India.
The following table shows the changes in the sectoral contribution
towards the national income of the country since 1950-51.

54
TABLE - 1.2
DISTRIBUTION OF GROSS DOMESTIC PRODUCT AT FACTOR COST PERCENTAGE
DISTRIBUTION (AT 1980-81 AND 1993-94) Sector 1950-51 1970-71 1990-91 1996-97 2003-04*
(A) Primary sector 56.4 45.8 33.4 27.8 24.0
1. Agriculture 48.6 39.7 29.5 24.0 N.A.
2. Forestry 06.0 40.0 01.4 2.1 N.A.
3. Fishing 00.7 00.8 00.8 N.A. N.A.
4. Mining - Querying 01.1 01.3 01.7 1.7 N.A.
(B) Secondary sector 15.0 22.3 27.0 29.3 24.05
5. Manufacturing 11.4 16.1 20.6 22.5 N.A.
6. Construction 03.3 05.0 04.1 4.3 N.A.
7. Electricity water supply 0.3 01.2 02.3 2.5 N.A.
(C) Tertiary sector 28.5 31.8 39.6 42.7 51.1
8. Trade Transport 11.0 14.2 18.1 20.2 25.5
9. Finance Real Estate 09.0 08.0 10.3 12.2 12.8
10. Community and personal
service
08.50 09.20 11.2 10.4 13.0
11. Total GDP (A+B+C) 100.0 100.0 100.0 100.0 100.0
Source : Compiled from NAS - 1990 and New Series on NAS (1980 to
81) C.S.O. Quick estimates, C.M.I.E. 1992 Economic Services 1997-98,
2004-05.
55
Above table No 1.2 reveals following trend :
1. Primary Sector :
The contribution of primary sector which is composed of
agricultural forestry, fishing and mining and quarrying has gradually
declined from 56.7% of GDP in 1950-51 and 45.8 percent in 1970-71
and then finally 24.0 percent in 2003-04. It is also interesting to look at
the trend in the contribution of agricultural which is contributing the
major share (nearly above 90 percent) to the primary sector. Thus
agriculture contributed about 46.6 percent of GDP in 1950-51 and then
its share however declined to 397 in 1950-51 and then to 29.5 declined
to 39.7 percent in 1970-71 and then to 29.5 percent in 1990-91 and then
finally so 24.0 percent in 1996-97. The share of forestry has also
considerably declined from 6.0 percent in 1950-51 to nearly 1.9 percent
in 199-91. But the contribution of fishing and mining has more or less
remained stable varying between 1 to 2 percent of GDP during the entire
period of 53 years.
2. Secondary Section :
Secondary sector is composed of manufacturing industries,
construction, electricity gas and water supply has increased its share of
GDP from 15.0 percent in 1950-51 to 22.3 percent in 1970-71 and then
to 24.5 percent in 2003-04. Among the major constituents of the
secondary sector, the share of manufacturing industries to GDP has also
increased from 11.9 percent in 1950-51 to 22.5 percent in 1996-97. But
the share of construction to GDP has marginally increased from 3.3

56
percent in 1950-51 to 5.5 percent in 1980-81 and then slightly declined
to 4.3 percent in 1996-97.
3. Tertiary Sector :
The share of tertiary sector which is constituted by trade,
transport, storage communication banking, insurance, real estate,
community and personnel service has gradually increased from 28.5
percent in 1950-51 to 31.8 percent in 1970-71 and then finally to 51.5
percent in 2003-04. The share of community and personnel service to
GDP has marginally increased from 8.5 percent in 1950-51 to 13.0
percent in 2003-04.
4. Growth of GDP at factor Cost :
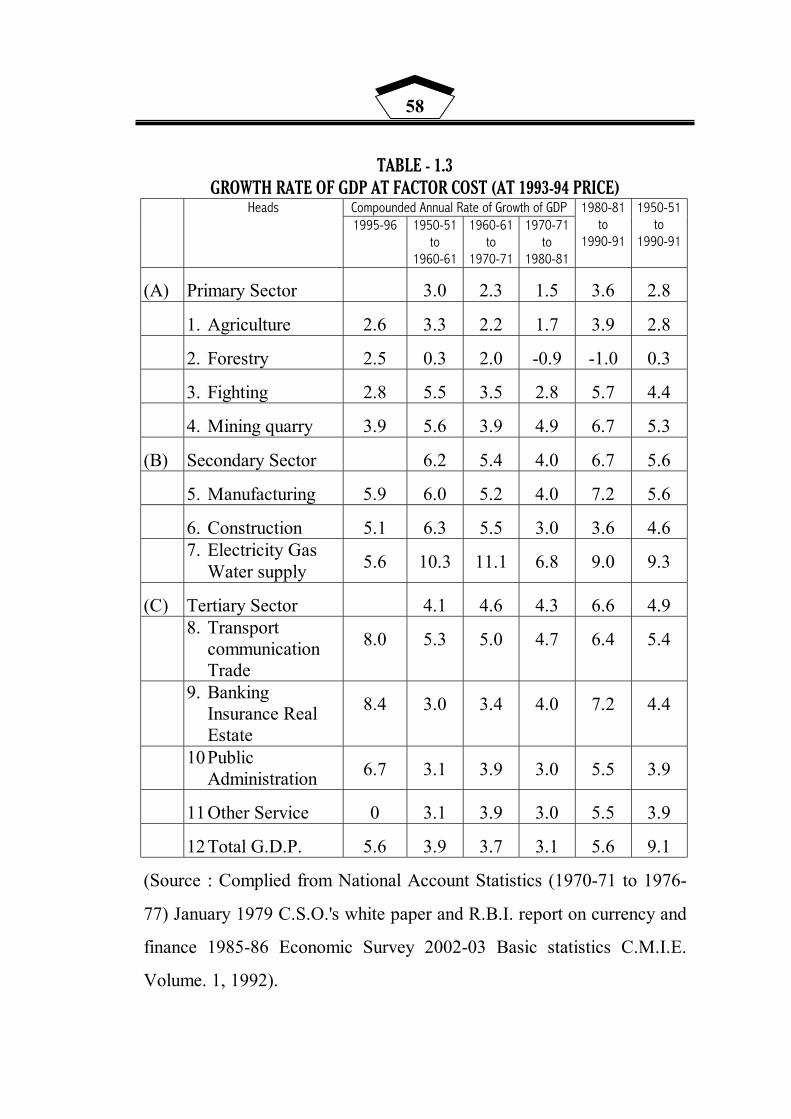
The table 1.3 reveals that the annual average rate of growth of the
primary sector which was 3.0 percent during 1950-51 to 1960-61
gradually declined to 1.5 percent during 1970-71 to 1980-81 and then
the same rate increased to 3.6 percent during 1980-81 to 1990-91
similarly the annual average growth rate of agricultural output alone
gradually declined from 3.3 percent during 1950-51 to 1960-61 and to
1.7 percent during 1970-71 to 1980-81 then the same rate increased to
3.9 percent during 1980-81 to 1990-91. Thus the agricultural sector did
not experience any faster rate of growth. Again during the 40 year
period (1950-51, 1990-91) the average rates of growth of the primary
sector as well as of the agricultural sector were 2.6 percent and 2.8
percent respectively.
Again the process of transformation of Indian Economy from an
agricultural economy to an industrial economy has also remained slow.
57
The annual and the manufacturing industry which were 6.4 percent and
6.0 percent respectively during 1950-51 to 1960-61 gradually declined
to 4.0 percent each during 1970-71 to 1980-81 and then it rose to 6.78
percent 7.2 percent respectively during 1980-81 to 1990-91. Again
during the last 40 years period (1950-51 to 1990-91) the average rate of
growth of both the secondary sector and manufacturing industry was 5.6
percent only. More over the annual average growth rate of the tertiary
sector gradually increased from 4.1 percent during 1950-51 to 1980-81
to 6.6 percent during 1980-81 to 1990-91. During the 40 years period
(1950-51 to 190-91) the annual average growth rate of the tertiary sector
was 4.9 percent and that of transport and communication and trade was
5.4 percent and that of banking, insurance and real estate was 4.4
percent.
58
TABLE - 1.3
GROWTH RATE OF GDP AT FACTOR COST (AT 1993-94 PRICE) Compounded Annual Rate of Growth of GDP Heads 1995-96 1950-51
to 1960-61
1960-61 to
1970-71
1970-71 to
1980-81
1980-81 to
1990-91
1950-51 to
1990-91
(A) Primary Sector 3.0 2.3 1.5 3.6 2.8
1. Agriculture 2.6 3.3 2.2 1.7 3.9 2.8
2. Forestry 2.5 0.3 2.0 -0.9 -1.0 0.3
3. Fighting 2.8 5.5 3.5 2.8 5.7 4.4
4. Mining quarry 3.9 5.6 3.9 4.9 6.7 5.3
(B) Secondary Sector 6.2 5.4 4.0 6.7 5.6
5. Manufacturing 5.9 6.0 5.2 4.0 7.2 5.6
6. Construction 5.1 6.3 5.5 3.0 3.6 4.6
7. Electricity Gas Water supply 5.6 10.3 11.1 6.8 9.0 9.3
(C) Tertiary Sector 4.1 4.6 4.3 6.6 4.9
8. Transport communication Trade
8.0 5.3 5.0 4.7 6.4 5.4
9. Banking Insurance Real Estate
8.4 3.0 3.4 4.0 7.2 4.4
10 Public Administration 6.7 3.1 3.9 3.0 5.5 3.9
11 Other Service 0 3.1 3.9 3.0 5.5 3.9
12 Total G.D.P. 5.6 3.9 3.7 3.1 5.6 9.1
(Source : Complied from National Account Statistics (1970-71 to 1976-
77) January 1979 C.S.O.'s white paper and R.B.I. report on currency and
finance 1985-86 Economic Survey 2002-03 Basic statistics C.M.I.E.
Volume. 1, 1992).
59
More over during 1990-91 to 2000-01 these rates of growth were
2.6 percent in the primary sector, 6.0 percent in the secondary sector.
Thus with the growing industrialization the country, Indian
Economy is gradually being transformed from an agricultural one to an
industrialized one. All this has resulted structural change in the
composition of the national income of the country. Thus there is the
special need for the enhancement of the growing process both in
agriculture and industry.
SECTORAL TRENDS IN EMPLOYMENT :
The structure of employment clearly demonstrates the fact that
there has been significant change in structural composition of
employment. Based on the NSS data estimation it is clear that there are
four major sector - agriculture, manufacturing, trade and community -
social and personal services. These sectors together accounted for 89.3%
of employment in 1999-2000. Mining and quarrying, electricity, gas and
water supply, construction, transport storage and communication and
financial sectors do not absorb much labour force. These industries
together accounted for a near 10.7% of employment in 1999-2000. From
sectoral point of view employment data clearly reveals the fact that there
has been a decline in employment in agriculture in percentage terms. In
fact even absolute number of employed workers declined in these
sectors over the six years period i.e. 1993-94 to 1999-2000. Agriculture
accounted for 59.8% of the employment.
The number of workers employed in manufacturing rose from
34.03 million in 1983 to 42.50 million to 1993-94 and further to 48.01
60
million in 1999-2000 in absolute terms this is an impressive account.
But in percentage terms the importance of manufacturing, as provider of
employment has not changed significantly.
The other important sector of employment is trade. In 1999-2000,
this accounted for 9.4% of the employed workers as against 6.3% in
1983. In absolute terms the number of workers increased from 19.22
million in 1983 to 37.72 million in 1999-2000. Thus the annual growth
rate of employment in trade was 3.98% in no other major sectors
employment increased at this rate.
Community, social and personal services accounted for 8.4% of
employment workers in 1999-2000 Employment in these subsectors
increases from 22.8 million in 1983 to 35.13 million in 1993-94.
Thereafter there was a declining trend, which resulted into 33.2
million in 1999-2000. This reduction in employment is largely due to
the liberalization policy. Government as part of fiscal reforms does not
increase fresh appointment and on the other hand increases retirement
under VRS (Voluntary Retirement Schemes).
There was very modest rise in employment in mining, quarrying,
electricity, gas and water supply, construction industry also indicated
very slow rise in last decade. Transport, storage and communications are
important segments of infrastructure but their employment potential is
very limited.
1.7 CONCLUSION
This introductory chapter thus focuses on theoretical aspects,
conceptual analysis of economic growth. Important characteristics of

61
economic growth have been narrated in brief with some illustration.
Sectoral transformation is a subject of concern with regard to the growth
process of the economy. In the concluding part therefore some
experiences of Indian economy in respect of growth process have been
examined.
It is important to note that differentiation that prevails between
the two nations may be reflected within the nation like India. It requires
critical examination of the level and nature of growth process that is
visualized in any political economy of a nation of the world or a
political economy of the vast state of a huge country like India.

62
REFERENCES
1. Cainncross, A.K. : "Factors in Economic Development" p. 229.
2. Gustav Ranis and John C.H. Fei - "Development of the labour
surplus Economy (Home Wood - III< Richard Irwin - 1964).
3. H. B. Chenery and Syrquin : "Pattern of Development" 1950-
1970 (London Oxford University Press, 1975).
4. Kindleberger : Economic Development : Mcgraw Hill Publication
(1965) pg. No. 18.39.
5. M. L. Jinghan : Economics of Development and Planning -
Konark Publication Pg. No. 1.37.
6. Malcom Gillis and Others "Economic Development" w.w.Norton
company London (1983) g. No. 3.37.
7. Michael P. Todaro : Economic Development in the Third World.
Orient Longman Limited - 4th Edition, Page 114 to 125.
8. P. K. Dhar : "Indian Economy" Its Growing Dimensions -
Kalyani Publishers - Delhi, Thirtieth Enlarged Edition, 2005.
9. Simmonkuznet : "Modern Economic Growth Findings and
Reflections - Nobel lecture delivered in Stockholm, Sweden -
December 1971 and published in the "American Economic
Review - 63, No.3 (1973).
10. V. G. Mankar : "Economic Policy and Planning" New Age
International Publishers (1994).
11. W. Arthur Lewis : "The Theory of Economic Growth"
(Homewood - III, Richard Irwin - 1955).

63
CHAPTER - 2
RESEARCH DESIGN
2.1 THE PROBLEM
2.2 OBJECTIVES OF THE STUDY
2.3 HYPOTHESIS
2.4 RESEARCH METHODOLOGY
2.5 SIGNIFICANCE OF THE STUDY
2.6 LIMITATIONS OF THE STUDY
2.7 REVIEW OF LITERATURE
2.8 CHAPTER PLAN
2.8 REFERENCES
64
CHAPTER - 2
RESEARCH DESIGN
2.1 THE PROBLEM :
The global economy is at large left open to the market forces. It is
observed that opening up of economy at global level has resulted into
several mixed implications on the growth process of economies. On one
hand it is found that opening of the economy has accelerated economic
growth - growth in terms of physical indicators but on the other hand
experiences demonstrate the fact that this has severe implications on the
distributive justice in the economy. Historically speaking, the study of
economic growth is restricted to certain physical indicators mainly
national income, per-capita income and other related indicators. These
do not in general permit one to study the distributive and welfare
aspects. It is mainly so because of the fact that in a regional political
economy it is extremely difficult to estimate all income actual. The
estimation of production and income originating within the region is
easy.
Looking at the growth process of global economy, national
economy and or regional economy, it is found that some element, are
common - which are reflected as indicators of change while some are
restrictive in nature. Economic growth of GNP, NNP or NDP, GDP is
considered as absolute economic change or phenomenon. This change is
studied in context of time period, sectoral composition, current price and
constant price. But this change has its positive or negative impacts on

65
other aspects of economy. Integrated transformation of economy is a
matter of concern more today than it was in the past. Only quantitative
aspects of growth process are not the subjects of study today - present
study also includes qualitative aspects of growth.
Economic growth balancing the development of various sectors
and bringing about positive impacts on distributive justice and welfare is
accepted and recognized as the most ideal era. In the last decade of 90's
- this has been discussed amongst planners and policymakers. There is a
growing concern amongst intellectual elites for the growth, which
augments justice and welfare and that which is more sustainable.
In a democratic political economy those objectives are difficult
one though not impossible to attain. With the changes in the
fundamentals of economy there have been mixed implications observed
across the countries of the world and across the regions of a nation.
Indians economy and economy of different states of Indian union is not
an exception to this phenomenon.
Most important aspects of studying and examining the growth
process are level and pattern of economic growth. What level of growth
do we find in a regional economy ? Is the growth process steady one or
that it reflects recurrent fluctuations ? What are the causes responsible
for the particular level of growth ? Is the rate of growth sustainable one
? These are but the questions which need to be answered while studying
the level of growth of a regional economy.
While studying the pattern of growth issues that emerges are -
what kind of pattern of growth is visualized in the economy ? Does the
pattern of growth indicated change ? What kind of changes are
66
observed ? Is the pattern of growth conducive to rapid growth ? What
are the hindrances in changing the pattern of growth ? To what extent
policy measures are responsible for positive of negative impacts on
pattern of growth ?
Detailed study and examination of growth process leads us to
address the issues that we come across during the process of growth. It
is often said that present economic growth is jobless growth. Is it true ?
To what extent job is attained with growth ? Or is it true that policy
measures result into otherwise - growth less job ?
Deep concern is expressed at the governmental policy approach.
It is believed that policy of Minimum or less intervention has resulted
into deteriorating social sector environment. How far does this hold
true ? This policy of liberalization is believed to have widened the
choices for human being for better living. Does this hold true in respect
of affordability ?
Structural transformation in a regional economy is but the result
of single factor like new economic order. Do we find this in reality
while studying the growth process of regional economy ?
Political economy of Gujarat is at the crossroads. There are
multiple issues involved in the growth process of Gujarat State. Issues
discussed above are the pertinent one to be explored and analysed in
content of Gujarat state. Theoretical conceptions of growth process leads
to be understood in respect of changes that are found in the state of
Gujarat.
Close examinations of inter sectoral relationships in context of
changing growth dimensions also generate, certain issues. Though not

67
much in intensity but there is presence of underlying unrest in the
primary sector of economy. Despite good rainfall on an average in the
decade - growth rates have not percolated to the rural populations of
Gujarat and food insecurity still prevails in the state.
To have satisfaction in comparison with other states of Union of
India Gujarat does not reflect the dynamism that needs to be reflected
along with the growth process. Inflation (Price Index), Employment,
Rural Capabilities are but the problems that need to be studied in respect
of growth process of Gujarat State.
It is true that stability in policy formulation and execution has
helped the state economy to generate confidence among investors. But
an important element to be studied in this regard is equality in
opportunity between the districts of the state. Subsectoral changes
should be understood or these have strong combined influence for
attaining integrated growth.
It is also important to examine the level and pattern of economic
growth in context of certain aspects of demographic transition. What is
the theme of the process of urbanization in the state like Gujarat ?
"It would be of crucial importance to study and examine the
changes in the process of urbanization in relation to changes in the
structure of employment. Does this reflect the transitory picture
estimated to take place as concept ?
The planning commission of India has projected Gujarat as one of
the fastest growing states in the tenth plan. It is also found that despite
two draughts in the decade, an earthquake, devastating flood and civil
strike - the state has shown the resilience to bounce back. But the major

68
issue that needs to be examined is impacts of growth process on
available natural resources and environment. It is claimed that from the
Green Audit Point of view the nature of economic progress of the state
has remained at large imbalanced.
The most serious argument that is made against the growth
process is in respect of fiscal strength. It is claimed that on the whole
social sector is not given due weight age in the state finance and on the
other hand that state's fiscal consolidation is not found to be strong in
order in respect of tax collection. The growth in general has benefited
more to the wealthier groups in this respect in comparison with poor
people.
How do these factors of growth relate each other ? What are the
underlying hindrances in balancing the growth ? Is the growth process
conducive to lessen rural urban gap ? This research thus is necessitated
to make an in-depth exercise to and infusing into the problems
visualized as part of the growth process and to arrive at the possible
ways and approaches to over come the obstacles that hurt in balancing
the economy through growth process.
2.2 OBJECTIVES OF THE STUDY :
This research work to be undertaken is aimed at the following
main objectives :
(a) To highlight the growth characteristics of the state economy -
particularly during the post reform period.
(b) To understand and examine the level of growth of Gujarat more
particularly during the post reform period.
69
(c) To understand and examine the nature of growth process of the
state economy - during the post reform period.
(d) To make critical assessment of the growth of the state economy in
light of the broad objectives of economic reforms.
(e) To point out major limitations of growth and to point out some
suggestions to be implemented in the growth process.
2.3 HYPOTHESIS :
An attempt is to be made in the proposed research work to
examine the following hypothesis as null and void.
(a) Physical indicators of growth like SDP and NSDP show
continuous positive trend during the entire reform period in
Gujarat State.
(b) Structural transformation observed in the state economy during
the reform period is in conformity to the trends observed at
national level.
(c) Trends in occupational diversification show similarity with
national trends and also in relation to pre reform period.
(d) Basic indicators of economic growth and human develop index
tend to remain positive although out the reform period.
(e) Economic growth in the state during the reform period has
widened rural urban gap in comparison with pre reform period.
(f) Inflationary pressures during the growth in the post reform period
tend to show steady performance.
70
2.4 RESEARCH METHODOLOGY :
Primarily this proposed research work is based on secondary data.
An attempt is to be made to collect and compile the data from the
following sources and of the following period.
(A) Major Sources of Data :
(a) Socio economic review of Gujarat State published by Director -
Bureau of Economics and Statistics. Government of Gujarat -
GANDHINAGAR from 1981 to 2005-06.
(b) C.M.I.E. Volume on Indian and Regional Economy from 2002 to
2005.
(c) Human Development Report - Gujarat, 2004. Published by
Mahatma Gandhi Labour Institute, Amdavad.
(d) Domestic Products of States of India - 1960-61 to 2000-01.
Economic and Political Weekly Research Foundation, Mumbai,
2003.
(B) Methods :
Secondary database from the above sources will be collected and
compiled. This database of Gujarat State refers to the broad. Major
indicators of the growth, will be arranged into tables in order of the
years. 1st part will comprise an overview of the data pertaining to the
period of 1961 to 1990. This will reflect in general NSDP - Per-capita
income, structural composition of income, employment and
occupational diversification. 2nd part highlights the data of the year
1991-92 to 2004-05. This data would be presented year by year in case
of NSDP and its structural composition.
71
Data would be analysed in detail in respect of sub sector
classification. Occupational diversification of the basis of work force
will be examined in terms of variation in the same during 1991 to 2001.
Major changes observed in the state in respect of agriculture, industry
and service sector would also be comparatively examined in respect of
sub regions within the Gujarat State.
Time series data presentation would be strengthened by graphical
presentation of the same. Besides this the gap percentage to the total and
maximum ratio would be worked to highlight the main trend.
In order to understand the selective significance of the concept in
current context and to work out the trends in relation to the post, a
detailed exposition in form of review of literature is followed as part of
the research work.
Data presented in the thesis are in percentage, triennium average,
maximum ratio etc.
2.5 SIGNIFICANCE OF THE STUDY :
This study carries significance in terms of research work and
planning. Growth process of the state economy in respect of reform
period is not to be studied in exclusive form. This research work is but a
small attempt in that direction.
This work includes multiple dimensions of growth which also is
important to understand the inter linkages between the growth process
and the process of human development. The study throws light on the
variations between the districts within the region. Besides technical
aspects of growth, applied aspects in context of state finance are also
72
examined. This study also relates various trends of growth process in
context of national economy. Thus in a way the study examines position
of regional growth in comparison with national growth.
The most important element this study carries is of time relativity.
Political economy of Gujarat is to complete 49 years and to enter into
50th year in 2009. An attempt to have exhaustive data based study of the
state economy is likely to be of much use for the planners and policy
makers to evaluate the economy on the golden jubilee period and there
by to frame the blue print for the coming decade of the state. It is of
crucial importance as it encompasses not only physical indicators but
also other indicators, which have direct or indirect influence on the
growth of the state economy.
Thus this research study has both theoretical as well as practical
importance. A sound framework to reshape and the economy can be
head with this study at the back of the mind of planners and
policymakers.
2.6 LIMITATIONS OF THE STUDY :
Though exhaustive in nature of database - the study has some
inherent limitations :
(A) This research work does not depend on absolute econometrics.
This could have strengthened the quality of the work and could
have been more exact and perfect in analysis.
(B) The study does not examine 50 years period on a single year-to-
year basis. Instead of that, major analysis of first forty years is
73
made in decade terms while the post reform analysis however
expresses and examines year-to-year variations.
(C) This study is strictly in isolation. This is not a comparative study
of two or more than two neighbouring states - however in respect
of various parameters the state economy is highlighted in respect
of national economy.
(D) Growth process can be examined yet at micro level : i.e. changes
at the district level - but on account of limitations of data of all
districts in time series order the idea is not materialized into
action.
2.7 REVIEW OF LITERATURE :
Various studies have been undertaken in the past to understand
and examine economic growth in light of theoretical perceptions.
Studies have also been undertaken as empirical ones to inquire into the
growth process at grass root level. Studies concerning intersectoral
linkage in economic growth also provide a ground to inquire further into
such problems. Prior to examining this growth process as part of the
research work, some important feedback is made available through
reviewing some past literature concerning the area of research.
(1) Simon Kuznets had made the pioneering attempt to measure the
contribution of a sector to economic development. He had
classified the contribution of a sector to economic development
into three distinct categories, product contribution, factor
contribution and market contribution. In his empirical analysis of
the distribution of product and labour force by sectors at different
74
levels of per-capita income for 59 countries has shown rising
share of manufacturing, construction, transportation, commerce,
finance and services in national product as per capita income rises
and it is explained in terms of shifts in consumer demand at
higher levels of real income and changes in the organization of
production.
(2) Prof. Colin Clerk in his research work assigns two reasons for the
shifts of labour force firstly with the increasing real income; less
is spent on consumption because of low-income elasticity of
demand for primary product. Secondly output in the secondary
sector.
(3) Prof. A.G.B. Fisher and Prof. J. Faurosite have also maintained
that the shift to the secondary and then to the tertiary is the
inescapable reflection of economic progress. Prof. Faurosite has
organic that apart from the higher income elasticity of demand to
tertiary products as compared to that for the secondary produce
apart comes in the process of economic growth when the
industrial sector will be saturated and so people will be shifted to
the tertiary sector where the goods and services contribute to be in
high demand.
(4) Empirical studies by Kuznets Johnson and Kilbee have revealed a
number of significant trends in respect of the sectoral
productivity. In the first place intersectoral productivity
differences are the greatest in the beginning of development
process with agriculture having the lowest average production of
labour but as per capita income rises these differences get

75
narrowed down. In the beginning of development process all non-
agricultural sector have labour productivity above the national
average. But there is fast rate of convergence towards the national
average. Thus the development process marked by a shift of
output and labour force to sectors with higher labour productivity.
(5) The growth models of Ranis, Fei and W.A. Lewis envisage the
growth of productivity in the farm sector to fuel the expansion of
non form sector and thus to contribute to the structural
transformation of developing economy. Lewis however envisaged
the rise in agricultural productivity to be important only after the
surplus labour of the agricultural sector has been absorbed in the
capitalist sector and the supply curve of labour tends to be
inelastic.
(6) Lewis Analyses the process of economic development
(expansion) in a dual economy composed of a capitalist sector
and socialist sector. The former is defined as that part of the
economy with huge reproducible capital, for the use of there of
and employee's wages are less for profit making purposes. The
substract sector does not produce reproducible capital. Here
output per head is much power than in the capitalist sector.
(7) Structural relationship among sector in an economy are generally
examined in three ways, the first is the input - output method,
which provide valuable insight into the interdependence of
various sectors. However Sony, Zakariah and Ahmed tend to
observe that the "result" based on such tables are generally static
and relate to the reference period.
76
(8) There is purely a statistical technique to examine structural
relationship. It involves rigorous casuality test. In the growth of
various sectors statistical test have been conducted by Chaudhari
and Chaudari, 1995 and Econometric models have been specified
and estimated by several researchers like Ahluwalia and
Rangrajan (1986), Pani (1984) and Starm (1977).
(9) While examining the growth process, J. K. Thorat explains the
theories of agricultural development. In his paper he has tried to
identify the several points of interaction between the agriculture
and the industrial sector as under (a) a substantial amount of
labour from the agriculture sector is transported to the industrial
sector. (b) The agriculture sector is a potential market for the
industrial output of consumer goods. (c) The creation of non form
jobs in the urban sector requires capital, and agriculture being the
dominant sector is in historical evidence, and an economic logic
an important source for such capital (d) Transformation of
traditional agriculture depends to a large extent on the
introduction of high pay of inputs, which most of necessity be
produced in the industrial sector.
(10) Hayaman and Rutan has exposed in detailed the technological
change and sectoral development process. Highlighting the
critical role of imbalance in inducing technological change and
economic growth, they express that the cumulative sequences
resulting from technological changes in agriculture also induced
change in other sectors of the economy. Imbalances within
agriculture and other sector of the economy are an important

77
source of backward and forward linkages in transmitting
technological progress in agriculture to overall economic
development.
(11) Samuelson remarks that in a mixed economy there is a
compromise between the pure capitalistic and socialistic
economic principles. This sort of compromises has G led to
uninterrupted growth of both the public sector and the private
sector simultaneously. The further observed that almost
unconsciously, undiluted capitalism had been evolving into a
mixed economy with both private and public initiatives and
control.
(12) Highlighting the role of non economic actors in the growth
process, United Nations experts observed, "Economic progress
will not occur unless the atmosphere is favourable to it. The
peoples of country must desire progress any their social,
economic, legal and political situations must be favourable to it.
(13) T.W. Schultz has expressed deep concern over the limitations of
poor nations to achieve high growth rate of the aptyly remarks
that "In most poor countries there is not much economic growth
to be had by merely taking up whatever slack may exist in the
way of the available resources being utilized.
(14) Meier and Baldwin has discussed in detail the role of social
institutional changes in accelerating the pace of growth.
According to them, "New Wants new motivations, new ways of
production, new institutions need to be created if national income
is to rise more rapidly. Where there are religious obstacles to

78
modern economic progress, the religious obstacles to modern
economic progress, the religion may have to be taken less
seriously or its character altered.
(15) Several studies have been made in context of distributive justice
along with the growth process. To take note of few of the studies
it can be said that increasing level of growth and changing pattern
of growth has led to the serious problem unequal distribution of
income in respect of the growth process.
(A) D. K. Rangnekar has rightly observed, "black incomes are
accentuating a new class of "black rich" in a society which is
already hourly stratified. The inequalities are no longer below the
surface.
(B) Paul Stucten explains that initially, Indious Policies were mostly
influenced by the ideas of world Bank economists regarding he
possibilities of "spread effects" of over all growth. But at the end
of 1960's, the myth of "spread effect" strategy was dwindled as
the under developed countries face the problem of increasing
concentration of income and wealth. Under such a situation of
skewed or unequal distribution of wealth and means of
production, the strategy of growth failed to realize the goal of
redistribution of income and wealth and also of eradication of
poverty.
(C) S. D. Tendulkar, noted economist explicitly remarked that Indian
experience of economic growth has failed to benefit the weakers
sections of our society. Depending on such experience, Indian
Government has rightly introduced certain poverty alleviation
79
measures which have reflected a shift in its focus from degree of
inequality to absolute poverty".
(16) Commenting on the concept of growth of a regional political
economy Zweing correctly writes that, "Every country, whose
area is large needs a high degree of regional decentralization.
(17) The regional plan considers regional potentialities and
requirements and also ensues balances regional development for
the country. According to Dr. Balkrishna, "though national
planning may achiever the wider objectives of full employment
and an increase in national wealth, a territorial balance in respect
of economic programmes is not well within its reach. Besides the
units cost of production will not be at its minimum unless there is
correct regionalisation of industries. Therefore economic planning
ought to provide for interprovincial justice and unless this is
assured the distributive aspect of a planning cannot be made to
function.
(18) Professor Gunnar Myrdal has discussed in detail economic
growth process and regional inequality. In his theory of economic
underdevelopment through the concept of regional equalities
within and between the nations - he has analysed "backwash" and
"spread effects". According to him during the growth process of
economy in underdeveloped economy regional inequalities
prevail mainly because of the strong back wash effects" and
"Weak spread effects".
(19) The draft "Ninth five year plan" had acknowledged that "growth
has not been as regionally balance as it should have been" and

80
goes on to state that planned intervention is required to ensure that
large regional imbalances do not occur.
(20) Bhattacharya and Sakthivel (2004) has made an attempt to study
and analyse the growth rates of aggregate and fectoral domestic
product of major states in the pre and post reform decades. The
results indicate that while the growth rate of gross domestic
product has improved only marginally in the post reforms decade,
regional disparity in the state domestic product has widened much
more drastically.
(21) Barro (1981) has presented a covergence theorem, it postulates
that when the growth rate of economy accurates, initially some
regions with better resources would grow faster than others. But
after sometimes within the law of diminishing marginal returns
set in, first growth rates would converge, due to differential
marginal productivity of capital and thus in turn would bridge the
gaps in the levels of income across regions.
(22) Many studies have been undertaken to examine the impacts on
economic reforms on the level and nature of groth across the
country like India.
The study made by Ahluwalia (2001), Sachs, Bajpal and
Ramain (2002) are considered to be the latest ones in the series
using more recent data and they seem to belong to the same
genere of "Political economy" with one dealing with growth
performances of states against the backdrop of the newer policy
environment of economic reforms and the other with "the
differential economic performance of India's states, specially
81
under the forces of globalization in the 1990's. Both review the
extent study of others, but come of somewhat different
conclusions. Again in so far as SDP data are concerned, both use
the same set of statistics upto 1997-98 / 1998-99, but provide
interestingly different interpretations of their results.
Ahluwalia (2001) analysed in detail growth process
visualized across the regions of country. He also questioned the
role of geography like coastal locations as determining growth
performance - a theme which Jeffrey (2002) have been
canvassing. He has also observed the fact that, the states which
have achieved strong growth rates in GSDP in the 1990's are
fairly well distributed regionally. Gujarat and M. P. Maharashtra
in the West, M.P. and Rajasthan in the North, West Bengal in the
East and Tamilnadu, Karnataka and Kerala in the South.
(23) EPW research foundation report on Domestic products of states of
India has in its one sector summarized Interstate Comparisons of
growth performance. The major conclusions of the same are as
under :
(A) Though there are differences in the growth rates as between gross
SDP and net SDP total as well as per-capita, these differences are
not so significant as to alter the sequential order of states arranged
in descending order.
(B) All measures of SDP growth suggest that there has been an
overall acceleration as between the 1980's and the 1990s. All
states growth together has roughly improved to about 5.50 - 5.70

82
percent per annum in the 1990s from about 5.20 - 5.30 percent per
annum in per capita terms.
(C) In terms of both SDP and per-capita SDP growth, all states with a
few exceptions (Uttarpradesh, Assam and Punjab have shown
accelerated growth during the 1990's and many major states like
Gujarat New Bengal, Himachal Pradesh and Kerala have moved
up the cadder above the all states average SDP growth.
(D) The low income and poorly performing major states Uttarpradesh,
Madhyapradesh, Bihar, Orrisa and Assam have not only persisted
with their low growth syndrome but have also experienced further
downfall in growth late in 1990s
(E) With the general phenomenon of relatively higher population
growth in low income and low growth states, the growth of per-
capita incomes in such states is found to be relatively lower than
the growth of total state incomes. This phenomenon is however
found changed in case of the high income and middle income
countries.
(F) The inclusion of the first three years in the decade of the 1990s by
extending backward in the 1993-94 series through splitting alters
the relative growth rates of various states.
Different scholars over a period of different times have tried to
study the ongoing pattern of economic growth in Gujarat and
have tried to examine and analyze the issues emerged over the
periods as part of growth process.
(24) A historical pioncering work was undertaken specially by VakilC.
N.; D. J. Taldaulala and M. B. Desai in respect of Saurashtra

83
region of Gujarat State. In that pioneering study it was observed
that a little dominance of the towns over small towns had begun.
It was clearly mentioned that even in those days in comparison
with the district like Bhavnagar, Jamnagar and Junagadh, he
growth of Rajkot was quite phenomenal.
(25) Shri Trivedi A. B. in his work on ":Kathiawar Economy" had
made shop observation pertaining to the dominance of sector in
relation to the size of population. He had remarked that the
number of non workers had increased relatively to workers.
According to him it was because that industrialization had not
kept pace with the growth of population.
(26) Dr. Joshi V. H. in his detailed follow up survey on Saurashtra
economy had observed that the share of Saurashtra region in
Gujarat in respecting industries in organized sector in Gujarat was
then 22.15% in case of small scale sector if was 30.64% in respect
of working factories it was 27.13% and in respect of factory
workers it was 17.80%.
(27) In the occasional paper on the level and pattern of economic
growth in Gujarat, Mr. Sudarshan Iyengar has concluded that the
analysis of the growth experience in Gujarat does not bring out
any specific impacts of economic reforms on the regional
economy and its vulnerable sections. The growth pattern of
Gujarat suggests that are inherent in the structure of the economy.
The mean value of indices for primary sector is very low, despite
the fact that the share of commercial crops to gross cropped area
has been consistently high from the late 1960's. It is largely
84
because of lack of irrigation that agricultural production is not
stabilizied. The gestation period for the investment in large
irrigation projects appears to have been very high. The secondary
sector dominated by the manufacturing sector also experienced
slowing down of growth since eighties. The growth rate covering
1980-94 periods has been lower compared to earlier decades.
(28) Amita Shah in her review article on Rural industrialization in
Gujarat expressed the view that the consumption linkages though
important seems to have remained rather stagnant because of the
moderate but regionally uneven spread of agricultural growth.
And that whatever demand stimulated are generated they are
largely absorbed by the industrial sector in the urban rather than
in the rural areas.
(29) K. R. Shah has also worked on Economic growth and Human
Development in Gujarat. In such occasional published paper he
has tried to explain the relative low level of human development
of Gujarat and its slow pace of improvement during the eighties
by and large in the framework of form conclusions regarding the
relationship between HD and economic growth.
On account of the relative slow rate of growth of PCNSDP
during both the seventies and eighties in Gujarat, the level of
economic development between Gujarat and other high income
state has widened and that between Gujarat and all India
narrowed. Not only this, rural urban economic distance in Gujarat
has also widened in terms of PCNSDP from agriculture and non
85
agriculture sectors affecting two thirds of rural population. The
relative higher incidence of rural poverty bears testimony to this.
(30) Dholakiya Ravindra in his review article on "Liberalization in
Gujarat. Recent Experience" has observed that the development
strategy in Gujarat has accorded a high priority to
industrialization. The impact of economic liberalization on the
state economy also reveals the fact that Gujarat's secondary sector
has certainly gained from the national policy of liberalizing. The
state has also followed consistent policies and taken further
measures to liberalize the state economy and simplify certain
procedures to promote industrial activities in the state.
(31) Some scholars have tried to focus on different aspects of the
economy of Gujarat. In context of globalization Kundu (2000)
made an attempt to analyze the trends and pattern of urbanization
in Gujarat taking account of the changes in the labour market and
observed that the process of urbanization has many elements of
fragility. The study revealed that the state has experienced a high
rate of growth in employment during the past decade or so, but
this is associated with high incidence of casual unemployment's
among whom a larger percentage is likely to be poor. He has also
observed that employment growth is higher in sectors that have
low productivity and low wage rates and there is a high incidence
of poverty among the workers employed in them.
(32) Indira Hirway has concluded in her study that there were great
regional disparities in levels of development and claimed that the
nature of developments in Gujarat is biased in favour of
86
developed regions and relatively better off sections of the
population. In her other work (2000), she further observed that the
process of economic growth in Gujarat was associated with a
highly diversified economic structure during the post reform
period and government measures had contributed to that
diversification. She however explicitly expresses that the process
does not seem to be sustainable, as it has distorted the agriculture
industry linkage in the state. Besides this, environment has also
experienced severe degradation and that it has become a major
constraint on sustainable development.
(33) Mathur and Kashyap (2000) observed that in the agricultural
sector, the contribution of the area to the output growth has
declined in almost all districts in the state. The study further
found that the 1980s were marked by a major shift in the crop
pattern towards non food crops. They also found that the growth
in land productivity in the state had experienced a significant
declaration after the 1980s.
(34) Dinesh Awasthi (2000) has tried to focus on recent changes in
Gujarat industry. He subscribes to the view that Gujarat state has
responded well to economic reforms and industry has grown
especially manufacturing industry. He however suggests that for
long term growth, a greater emphasis on the infrastructure sector
is needed. Small scale industry can be helped by promoting
cluster. He also has passed a word of caution to the government
that mere fiscal incentives will not be able to attract industries to
87
the state. That could work only as auxiliary and not the primary
attraction for investment.
(35) Dholakiya Archana (2000) has tried to explore the issues that
have cropped up in respect of fiscal consolidation in the state
during the reforms process. She has highlighted the causes
responsible for fiscal imbalances in Gujarat. She expresses the
view that in order to accelerate the pace of growth with fiscal
consolidation Gujarat needs to raise its non-tax revenue to case
its fiscal visits. She has analyzed in her article Gujarat's non tax
revenues and subsidies to find possibilities of improvement.
Contrary to the state of reforms the state in Gujarat is more active
in areas from which it should withdraw as shown by high
economic subsidies, and it is less active in areas where
intervention is called for as shown by low social sector subsidies.
(36) Amiya Bagchi, P. Das and S.K. Chattopadhyay (2005) has tried to
examine in brief the growth and structural change in the economy
of Gujarat during the period of 1970-2000. A paper based
econometric and statistical analysis it is stated in the form of
summary that Gujarat appears to be a paradigmatic example of
the most disconcerting development of the 1990s in India. There
was no increase in organized sector employment during the
1990s. The primary sector particularly agriculture, has been
stagnant or even declining. In contradiction to that the secondary
and high rates of growth over the whole period. But the factory
sector in Gujarat has undergoing a higher degree of concentration
than in the rest of India. More importantly, the capital intensive

88
nature of the growth in the factory sector has been even more
pronounced in Gujarat. Looking at the sectoral growth rates, it
seems that the economy of Gujarat grew in an unbalanced and
volatile fashion over the period under consideration. There has
been a significant transformation in occupational structure.
However the said transformation is not in tune with the change in
incomes derived from different sectors. A mismatch in the
movement of income and employment shares is stronger in
Gujarat that the rest of India. It is also found that people living in
Rural Gujarat have become significantly proletarianised.
(37) Alagh Yogoudra has explicitly narrated the potentials of the state
economy to meet the challenges of globalization. He firmly
expressed the view that the economy has strong foundation to
build diversified structures of growth. However he two has
pointed out at the limitations in respect of HDI to match with
physical growth rate.
2.8 CHAPTER PLAN :
This research work is divided into five of the main chapters. The
first chapter includes an inquiry into the relationship between growth
and development besides throwing light on conceptual perspectives of
economic growth. The second chapter provides technical structure
inclusive of review of literature. The third chapter is broadly divided
into a two sections; the first one summarizes different aspects of the
economy of Gujarat, while the second part provides growth achieved in
the economy during the period from 1960 to 1990. Fourth chapter, the
89
core one highlights growth, visualize under the reform period. It
presents tabulation analysis along with graphical presentation. The fifth
and the last one discusses in brief the suggestions need to be incorporate
while framing the economic map of the state on the Eva of golden
jubilee of the state economy.
90
REFERENCES :
1. A. L. Marty Prof. Jargenson Model of a Duel Economy in Indian
Economic Journal - June, 1965, Page 439
2. AGB Fisher - Economic Progress and Social Security (1964)
3. Bhattacharya B. B. and Mitra Arup (1993) "Employment and
Structural Adjustment, A look at 1991 census Data". Economic
and Political Weekly Vol. No. 28, 38.
4. Chaudhari K. and M. B. Chaudhary - 1995, Sectoral Linkages and
Economic growth in Asia. Evidence from Granger Casualty Test,
The Indian Economic Journal Vo. 42, Page No. 59 to 75.
5. Collin Clerk : The conditions of economic progress, 1957.
6. Dr. Joshi V. H. : Changing Pattern of Sectoral Behaviour in a
Regional Economy" B. R. Publishing Corporation, New Delhi.
7. Hayamy and Ruttan : Agricultural Development in International
Perspective : John Hopkins Ress Page, 132, 1979.
8. Lewis Co. : Economic Development with unlimited supplies of
labour : The Manchester School May-1954 - Sinh (Ed.) Economic
of Underdevelopment.
9. Patel Gunvant A. "Gujarat's Agriculture" Oversea Book Traders -
1977.
10. Schultz T. W. : Transforming Traditional Agriculture, New
Heaven, Yale University Press 1964
11. Shah Amita (1986) : "Rural Industrialization in Gujarat" Indian
Journal of Rural Science Vol. 18, No. 1
91
12. Simon Kuznet - Johnston and Kilby - "Agriculture and Structural
Transformation (1975), Page 111, 203.
13. Sudarshan Iyengar : Level and Pattern of Economy growth in
Gujarat - 1980-1994, Occasional Paper Series, Gujarat Institute of
Development Research, January-2000.
14. Shah K. R., "Economic growth and Human Development in
Gujarat Lessons for long term sustainable growth occasional
paper G.I. D. R., January 2000
15. Tharat S. K. : "Theories of Agriculture Development Trends and
Perspective" Published in "Growth, Industrialization and New
Economic Reform in India". (Ed.) B, Satyanarayan, Page 116,
Concept Publishing.
16. Trivedi A. B. Kathiawar Economics, Khalsa College, Bombay
1943
17. Vakil C.N., D. T. Lakdawala, M.B. Desai = "Economics Survey
of Saurashtra" School of Economics and Sociology University of
Bombay, 1953.
18. Zakariah and E. E. Ahmad, 1990, Sources of Industries growth
during the factor decomposition approach" Malaysia 1978-87.
"The Developing Economies", Page 162 to 196
19. Ahluwalia and Chenery, "A conceptual Frame work for Economic
Analysis. Redistribution with growth" An approach to Policy (Ed)
H. B. Chenery, J. Duloy and R. Jolly, World Bank Washington
D.C.
20. Barro Robert J. (1991) : Economic growth in a cross section of
countries, Journal of Economics P. 106-2, May Pg. No. 407-443.

92
21. Gunnoar Myrdal - Economic Theory and Under developed
Regions, Duckworth London Pg. No. 12 and 34.
22. Ninth Five Year Plan Document Draft, Vol. 1, Pg. No. 3.
23. Domestic Product of States of India, 1960-61 to 2000-2001 EPW
Research Foundation, Bombay (2003), Page No. 21 to 33.
24. Dholakiya Ravindra H-7 "Liberalization" of Gujarat Review of
Recent Experience in Economic and Political Weekly (Aug. 26 -
Sept. 2 2000) Page NO. 3121 to 3124.
25. Mathur Niti and S. P. Kashyap - "Agriculture in Gujarat Problem
and Prospects", Economic and Political Weekly Aug. 26 Sep. 2
2000, Page No. 3137 to 3146.
26. Amitabh Kundu : Globalizing Gujarat urbanization, Employment
and Poverty" Economic and Political weekly Aug. 26 - Sep. 2,
2000 Page No. 3172 to 3182
27. Dinesh Awasthi : Recent, Changes in Gujarat Industry Issues and
Evidence "Economic and Political Weekly Aug. 26, Sept. 2, 2000,
Page No. 3183 to 3192
28. Archana Dholakiya - "Fiscal Imbalance in Gujarat (28), Non tax
revenues and Subsides in Economic and Political weekly Aug. 26
- Sept. 2, 2000, Page No. 3217-3227.
29. Amiya Bagchi, P. Das and S. KI. Chattopadhyay, Growth and
structural change in economy of Gujarat, 1970-2000, Economic
and Political Weekly, Vol. XI No. 28, P. 3029 to 3047.
30. Hirway Indira - Human Development Report and Darshini
Mahadevi, Gujarat 2004. Mahatma Gandhi Labour Institute
A'vad.
93
31. Schultr, T. W. : The State of the Social Sciences (1956) P. 372
32. Meier and Baldwin - Economic Development History and Policy
P. 112
33. Suresh D. Tendulkar - "Economic Inequalities and Poverty in
India" in : P. R. Brahmanand and V. R. Panchmukhi (Ed.) P. 128
34. D. K. Rangnkar Minute of Disscut in Direct tax inquiry
committee final report December 1971, P. 248
35. Paul Strectin First Things First Meeting Basic human needs in
Developing Countries (Washington, 1981)
36. Zweing - "Planning of Free Societies", P. 104
37. Ballerby - Economic Reconstruction, P. 287
38. Balkrishna : Regional Planning in India, P. 72-73 Quoted from P.
K. Dhar-7 Indian Economy It's growing dimensions, Kalyani
Publication, Delhi.
39. Alagh Y. K. Gujarat Economy, Globalization any Fast Trucks,
Pub. in Vishvanidam Gujarati Vol. 16, No. 56-59, 2003 Page 16
to 24.
94
CHAPTER - 3
PROFILE OF RESEARCH UNIT - GUJARAT
SECTION - I GUJARAT AT A GLANCE
3.1.1 HISTORICAL SKETCH OF GUJARAT IN BRIEF 3.1.2 GEOGRAPHICAL PROFILE OF THE STATE 3.1.3 DEMOGRAPHIC PROFILE 3.1.4 PHYSIOGRAPHY 3.1.5 CLIMATE AND RAINFALL 3.1.6 SOIL AND LAND UTILIZATION
SECTION - II AN ECONOMIC OVERVIEW OF PRE REFORM PERIOD
3.2.1 GROWTH OF POPULATION - GUJARAT AND
INDIA - 1961 TO 2001 3.2.2 DISTRICT WISE POPULATION GROWTH
RATE 3.2.3 IMPORTANT DEMOGRAPHIC INDICATIONS
(DISTRICTS OF GUJARAT) 3.2.4 ANNUAL BIRTH RATES AND DEATH RATES -
RURAL / URBAN 3.2.5 DISTRICT WISE PERCENTAGE
DISTRIBUTION OF POPULATION BY MAIN, MARGINAL, TOTAL WORKERS AND NON WORKER - 2001
3.2.6 N.S.D.P. GUJARAT (1960S TO 1980S) 3.2.7 AVERAGE GROWTH RATES IN REAL S.D.P.
IN GUJARAT BY SECTOR (1980-81 PRICE)
95
3.2.8 PERCENTAGE SHARE OF PRIMARY
SECONDARY AND TERTIARY SECTION TO TOTAL NSDP AT 1980-81 PRICE
3.2.9 AGRICULTURAL PROGRESS (MAJOR CROPS) 3.2.10 CROPPING PATTERN 3.2.11 YIELD LEVEL FOR MAJOR CROPS
(KG/HA - TRIENNIUM ENDING) 3.2.12 DISTRICT WISE LEVEL OF INPUT USED
3.2.13 DISTRICT WISE LEVEL AND GROWTH OF MALE AGRICULTURE WORKERS PRODUCTIVITY
3.2.14 DISTRICT WISE LEVEL AND GROWTH AREA (G.C.A.)
3.2.15 NET SOWN AREA INDUSTRIAL ECONOMY OF GUJARAT
3.2.16 RELATIVE POSITION OF GUJARAT IN FACTORY SECTOR IN INDIA - 1981 TO 1995
3.2.17 INTER SCALAR GROWTH OF INDUSTRIAL SECTORS IN GUJARAT (ANNUAL COMPOUND RATE OF GROWTH IN PERCENTAGE)
3.2.18 INDUSTRIAL INVESTMENT IN GUJARAT IN MEDIUM AND LARGE SCALE INDUSTRIES
3.2.19 CONCENTRATION RATIO OF TOTAL INVESTMENT FOR TOP 25 TALUKAS OF GUJARAT (PERCENTAGE INVESTMENT)
3.2.20 CONCENTRATION RATIO OF NEW INVESTMENT IN TALUKAS OF GUJARAT
3.2.21 POLARITY OF INVESTMENTS IN FACTORY SECTOR ACROSS TALUKAS SURROUNDING GROWTH POLES IN GUJARAT
INFRASTRUCTURE IN THE STATE ECONOMY
3.2.22 OCCUPATIONAL DISTRIBUTION BY BROAD INDUSTRY GROWTH
3.2.23 CONCLUSION

96
CHAPTER - 3
PROFILE OF RESEARCH UNIT - GUJARAT
SECTION - I
GUJARAT AT A GLANCE
3.1.1 HISTORICAL SKETCH OF GUJARAT IN BRIEF :
Gujarat has a long and eventful history. The history of Gujarat
refers to the rise and fall of various Kingdom and changes in
administration and territorial jurisdiction. It has been found in the
history that during the Maitraka period (470 A.D. to 643 A.D.) the
territory North of Abu was known as "Gurjara Desh" or "Gurjara
Bhoomi". It is said that the history began from the track known as
"Gurjara Desa" in Rajputana. The then rulers were known as
"Gunjaresha". "Gujarat" - the name known today was recognized from
10th Century A.D., during the Solanki period when Mulraja, the first
Chanukya Rulers laid down the foundation of his Kingdom with its
capital as Anhilwad Patan. Then followed the Muslim period, the
Maratha Period and the regime of East India Company.
With the foundation of British Rules in India, Gujarat ceased to
be an independent province and was included in much bigger Bombay
Presidency that extended from Karachi to Karnataka. The area of
Gujarat was divided into the British Districts of Ahmedabad, Bharuch
and Panchmahals, Kheda and Surat and a large number of native states
and estates.
97
Looking at the post independence period - in 1947, the Princely
States - like their counterparts elsewhere in the country, merged into the
Indian Union. The present Gujarat State then consisted of three
administrative units. The British district together with a few states
including the Gaekwad State remained a part of the largest Bombay
State, Saurashtra was a part "B" State and Kachchha was centrally
administered "C" State.
Later on Part "B" and "C" got dissolved and were recognized into
one state, the districts of Gujarat, Saurashtra and Kachchh were included
in the then Bilingual Bombay State. It was as part of linguistic state
formula, that the then "Bilingual Bombay State" was bifurcated into
Maharashtra and Gujarat. On 1st May, 1960 - a veteran Sarvodaya leader
late Ravishankar Maharaj laid the foundations of present Gujarat State.
At the time of formation of Gujarat State, there were 17 districts. Soon
after the formations Surat was bifurcated into two districts namely Surat
and Valsad while Gandhinagar was carried out as a separate district
from Ahmedabad to provide a suitable site for new capital of the State.
Lastly in 1998 - 6 districts were framed from the earlier existing 19
districts. Thus in total there are 25 districts in the state at presents.
3.1.2 GEOGRAPHICAL PROFILE OF THE STATE :
Gujarat State is situated on the West coast between 26° - 6' North
to 24° 42' North latitude and 68° - 10' East to 74° - 28' East longitude. It
is bounded by the Arabian Sea in the West, by the State of Rajasthan in
the North and North - East, by Madhyapradesh in the East and by
Maharashtra in the South and South-East.

98
Gujarat Shares both the sea frontiers and the land frontiers of the
country. Tidal flats and saline waste, excluding South Saurashtra, in
general characterize the long cost line of the state. The West and South
Coasts of Kachchh have a marshy zone with a width ranging from 10
km to 13 kms. The whole of Gujarat coast from the head of the gulf of
Khambhat to Valsad is irregular in outline, broken by the estuaries of
the Mahi, the Narmada the Kim and the Tapi rivers. The saline marshes
lying on the coastline locally known as "Khar Lands" are unsuitable for
cultivated.
The state has an international boundary and has a common border
with the Pakistan at the North Western Fringe. The two Ranns, one
North of Kachchh and the other between Kachchh and the mainland
Gujarat are saline wastes.
Between the Marshy coastal zone and the plateaus and the
mountains in the interior, lie the plains of Gujarat drained principally by
the rivers of the Sabarmati, the Mahi, the Narmada, the Tapi and their
tributaries. The plain is well demarcated by its confinement between the
coastal marshes on the West and a rupture of slope on the east rising
upto the mountains.
The eastern hill region consists of the outliers of the Aravalli
system, the Vindhyas ,the Saputaras and the Sahyadris. The highlands
that encircle the state from the North, the North East and East occupy
parts of Sabarkantha, Panchmahals, Vadodara, Bharuch, Surat and
Dangs districts which constitute the forest area and tribal region of the
state. The international, state, district and taluka boundaries and the
capital, district and taluka headquarters are shown in the Map.
99
3.1.3 DEMOGRAPHIC PROFILE :
Administratively Gujarat is having total area of 196,024 sq. kms
which holds 5.96% of the total area of India. Gujarat State at present
comprises of 24 districts of total 593 districts of India. This means
4.21% of districts of India are in Gujarat. There are 5,463 sub districts in
the country, of which 226 sub districts 4.13% are in Gujarat state.
According to census report there are 6,38,588 villages in India. In
Gujarat State the number of villages are 18,539 i.e. 2.90% villages are
there in the state. Number of inhabited villages in country are 593,731
while in Gujarat it is 18066 i.e. 3.04%. Total number of towns in the
whole country is 5,161, of which 242 (4.69%) are in Gujarat State.
There are 384 urban areas in the country - this number in Gujarat is 42.
In respect of total population Gujarat state is having the
population of 50671000 i.e. 4.92% of the total population of India.
Density of population in the state per sq. km is 258 which is less than
national figure 325. Demographic picture of the state at a glance is given
in the separate table along with population map of the state.
3.1.4 PHYSIOGRAPHY :
Physiography of Gujarat indicates that the state be divided into 3
units - namely Mainland Gujarat, Saurashtra and Kachchh.
The mainland of Gujarat includes two district zones (a) highland
on the eastern border and (b) the coastal alluvial plain on the western
side. Border highlands ranging between 300 and 1090 meters in height
(are the foot hills of the ranges that are the continuations of the major
outlying chains like Sahyadris in the southern extremity, Satpuras in

100
Tapi divide, Vindhyas in Narmada divide area and Aravallies in
Sabarmati - Banas source region. The plain of Gujarat main land is a
deep depositional plain. Many streams and the marine process of
deposition have worked in unison to develop this remarkable plain
which is quite fertile and due to its structural characteristics forms are of
the most rich aquifers of western India merges with the Saurashtra
coastal plain to the month of the Gulf of Khambhat.
Saurashtra the other unit is popularly known as "Kathiawad". It is
consisted of two distinct areas, (a) High lands, Rajkot and Girnar range
and (b) Low lands Girnar is 1117 meters above the sea level which is
highest peak in the area. Rajkot highlands are relatively broad and low
in height. These two high levels form the major water divide of
Saurashtra. Deep alluviums cover the central highland on all side.
Kachchh is in the north of Saurshtra. The Rann of Kachchh on the
Northern and Eastern sides encloses it and by Gulf of Kachchh on the
South, Kuchchh is not completely a sandy area, but it has got a hill
range running east west in the central region.
The other important parameter reflecting physiography and
climate of the region is Drainage pattern. This drainage pattern of
Gujarat State is more influenced by physioclimatic factors.
Physioclimatic condition of the state mainly refers to the Gujarat Plain,
Saurashtra and Kachchh.
In context of drainage pattern Gujarat plain mainly includes - The
Damanganga - in the extreme south with heavy floods and tidal rise -
little further north we find the Kolak, the Par, the Purna, the Auranga,

101
the Ambika and the Mindhola. From amongst these Ambika is known to
be important river.
The Tapi is extended more in the areas of Gujarat State while the
Narmada rising in the hills of Amarkantak in Bilaspur, 1150 metres
above sea level, cuts through between the Saputaras and the Vindhya
before entering Gujarat. The Narmada runs for over 150 kilometres in
the State before debouching into the Gulf of Khambhat near Bharuch.
Apart from the Narmada, the Mahi is the third largest river in
Gujarat after Narmada and Tapi. The main branch of the Mahi river
rises about 600 metres above sea level in the Malwa region. This river is
noted fro its floods Sabarmati are other important rivers. It transverses
through, Sabarkantha, Ahmedabad and Kheda district. This river has a
length of over 300 kilometres and an extreme catchments area. This
widely swinging river has left occasional mud deposits in its lower
course and these deposits are locally known as "Bhathas" which are very
fertile.
There are some tributaries of Sabarmati and Mahi which form
Doab highly fertile area - agriculturally well productive and industrially
well developed. Apart from these main rivers there are rivers like
Rupen, Saraswati and Banas - which exceptionally fall into the Rann of
Kachchh. Besides rivers one lake worthy of mentions is Nalsarovar
which might have been once upon a time an arm of the sea.
In Saurashtra region Bhadar is the longest river with a length of
260 kilometres. This river originates in the central high land east of
Jasdan and flows west wards. Shetrunjai is another major river rises in
the Dhundhi hills of Gir ranges which flows east ward and joins the sea

102
at there are other small rivers like streams - they are Dhanwantari,
Rawal and the Machhiudri which flows South ward. Hiran and
Saraswati rise in Gir hills and flow into the Arabian sea. The Machchhu
flows into the Rann of Kachchh which stands on the town of Marvi. The
Aji river is smaller in length which rises near Sardhar and flows through
Rajkot. There are also some small rivers in this belt namely Bhogawo,
Sukhbhadar, Demi and Und.
Besides these rivers - Ghed near Madhupur is important lake and
small creeks like Hansthal, Sundari, Dhalera and Vartu.
Kuchchh rivers are non perennial. They have steep gradients form
deep cuts, along their courses and rarely spill over their banks. All the
rivers of streams of Kuchchh start from is central portion and flow
towards the sea in the south and the Great Rann in the north and the
little Rann in the South East.
Among the lakes, Narayan Sarovar is note worthy. It is situated
on the Western border of Kachchh district.
3.1.5 CLIMATE AND RAINFALL :
Climate is one of the most influential factors, which govern the
natural resources of a region and also the mode of human activity. It has
a decisive effect on the nature of cropping pattern and agricultural
practices, livestock and forest resources.
The entire state lies in the monsoon area and the climate is
acknowledged as "Monsoon climate". The rainfall is confined to four
month from middle of June to middle of October. The monsoon breaks
in June reaches its maximum intensity in July and retreats by the end of
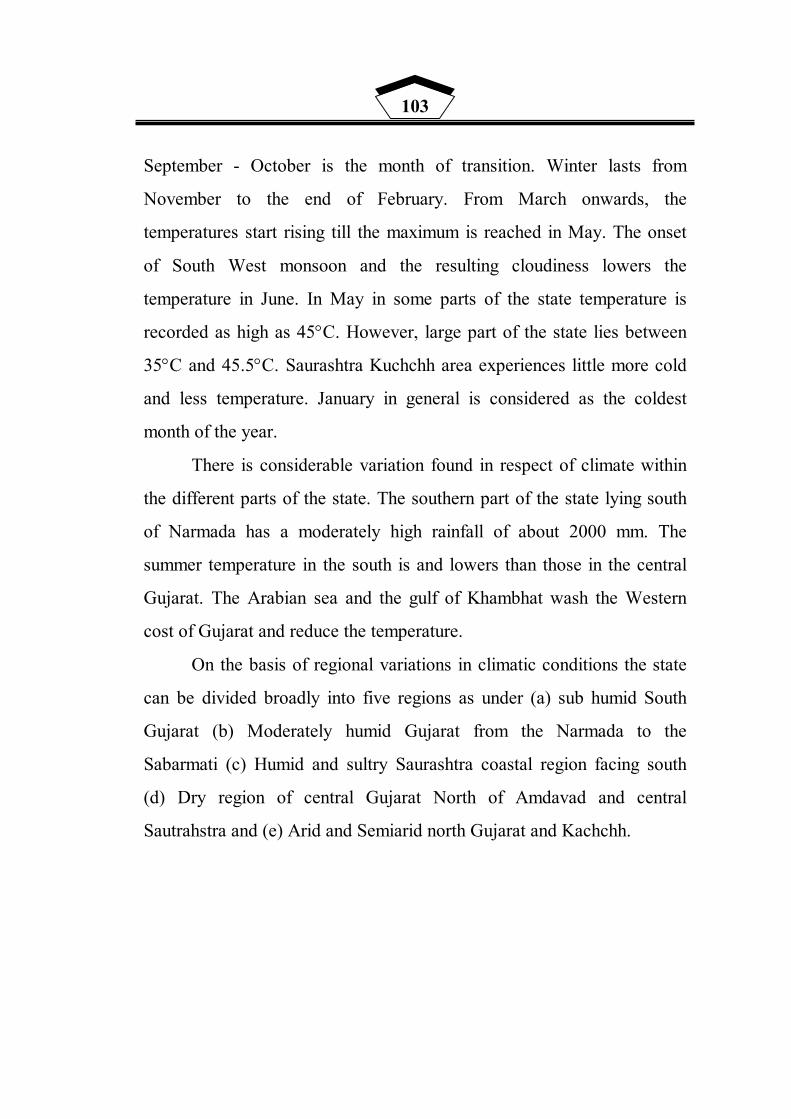
103
September - October is the month of transition. Winter lasts from
November to the end of February. From March onwards, the
temperatures start rising till the maximum is reached in May. The onset
of South West monsoon and the resulting cloudiness lowers the
temperature in June. In May in some parts of the state temperature is
recorded as high as 45°C. However, large part of the state lies between
35°C and 45.5°C. Saurashtra Kuchchh area experiences little more cold
and less temperature. January in general is considered as the coldest
month of the year.
There is considerable variation found in respect of climate within
the different parts of the state. The southern part of the state lying south
of Narmada has a moderately high rainfall of about 2000 mm. The
summer temperature in the south is and lowers than those in the central
Gujarat. The Arabian sea and the gulf of Khambhat wash the Western
cost of Gujarat and reduce the temperature.
On the basis of regional variations in climatic conditions the state
can be divided broadly into five regions as under (a) sub humid South
Gujarat (b) Moderately humid Gujarat from the Narmada to the
Sabarmati (c) Humid and sultry Saurashtra coastal region facing south
(d) Dry region of central Gujarat North of Amdavad and central
Sautrahstra and (e) Arid and Semiarid north Gujarat and Kachchh.
104
TABLE - 3.1.1 DISTRICT WISE (CENTRE WISE) AVERAGE RAIN FALL AND
RAIN FALL (in Milimetres)
District Centre Average Rainfall (1995 to
2005)
1985 1990 1999 2000 2001 2002 2003 2004 2005
Amdavad Amdavad 724 803 1035 608 569 658 397 883 814 1138 Amreli Amreli 488 311 640 414 260 509 573 667 413 1089 Anand Anand 617 - - 319 341 525 547 1063 855 1295
Banaskantha Palanpur 553 322 770 219 339 694 251 807 426 744 Bharuch Bharuch 831 686 881 523 536 885 1023 889 1085 889
Bhavnagar Bhavnagar 572 657 736 449 173 622 831 537 549 927 Dahod Dahod 692 - - 352 303 530 750 1055 1127 560
The Dangs Ahwa 2545 2497 1828 3111 1636 2200 2442 2129 2640 3825 Gandhinagar Gandhinagar 607 554 1125 558 326 421 373 1031 806 1369
Jamnagar Jamnagar 603 208 239 251 252 583 433 1429 869 618 Junagadh Junagadh 799 449 787 442 544 896 589 1178 890 967 Kachchh Bhuj 277 118 281 310 219 243 78 712 227 304 Kheda Kheda 785 385 679 738 491 725 479 1091 759 1271
Mahesana Mahesana 718 189 900 664 428 9320 437 720 632 1218 Narmada Dediapadi 898 - - 455 617 822 802 1275 1255 1164 Navsari Navsari 1804 - - 984 1258 2014 1396 2933 2492 2865
Panchmahal Godhra 903 407 1542 331 385 677 735 1353 927 873 Patan Patan 460 - - 156 267 540 282 720 603 749
Porbandar Porbandar 534 - - 164 438 623 271 666 477 827 Rajkot Rajkot 599 278 463 311 345 429 373 989 719 739
Sabarkantha Himmatnagar 660 521 957 437 425 593 431 957 499 1035 Surat Surat 1255 761 1046 896 684 1126 1130 1730 1972 2319
Surendranagar Wadwan 479 423 627 195 326 671 636 525 550 96 Vadodara Vadodara 686 634 879 358 491 826 835 2014 1151 137
Valsad Valsad 1748 1305 1562 1573 1488 2104 1024 2100 2246 3130
Source : Socio-Economic Review : Feb 2006
3.1.6 SOIL AND LAND UTILIZATION :
The soils of Gujarat can be broadly classified into seven groups
on the basis of standards adopted and the groups established by the All
India Soil and Land use Survey Organizations. These seven groups are
(1) Black soils, (2) Alluvial soils (3) Saline Alkaline soils (4) Desert
soils (5) Lateritic soils (6) Hilly soils and (7) Forest soils.

105
The first two soil groups, viz. black and Alluvial soils cover the
major par of the arable land in Gujarat, while the remaining soil groups
are scattered all over the state.
As per the report of 1982 total area of land utilization in Gujarat
was about 18.81 million hector of which about 12.45 million hectors
was cultivable. In 2001-02 total gross cropped area was reported as
10.79 million hectors. Statement showing land utilization pattern of the
state during the last 20 years is presented separately for further
references. The state faces acute problems of soils erosion, loss of soil
moistures due to heavy runoff and problems of irrigation drainage and
land development. As per the and report of 1982 it was estimated that 4
million hectares of total area needed soil conservation measures 0.4
millions hectares would need ravine control and an area of 0.2 million
hectares needed to be covered under the Khar land reclamation.
Geology of Gujarat.
Geologically, Gujarat is considered to be a very young region. An
immense accumulation of volcanic rocks principally formed by basaltic
lavas known as the Deccan Trap is the single most important and
extensive geological formation within the state. At a few places,
particularly in the Panchmahals and Bharuch districts a few granites and
gneisses are occasionally seen. The geological formation of the whole
state is volcanic origin excepting North Gujarat, which is akin to Indo
Gangetic plains of North India. The Deccan Trap occurs extensively
over Kachchh, central and Southern parts of Peninsula Gujarat and over
the area of south of the Narmada river. The Tapi valley and the South
Gujarat plains are formed as a result of recent alluviums of trap origin.
106
Similarly the recent deposits carried by the southern rivers have
developed black cotton soils, while the Indo Gangetic type of plain of
North Gujarat consists of very deep alluvial deposit brought down by
the rivers of Banas, Saraswati and Rupen.
The original rock formation in Saurashtra was of granite type but
basaltic the volcanic effusions and spread of lava formed topography
followed by a long process of denudation. The Gir and other hill ranges
have a granite complex. The coastal regions abroad in Porbandar rock
and limestone of Dwarka, Kachchh surrounded by saline sandy
alluviums has volcanic rocks in the hilly interior.
The mineral constitutes the basis for industrial development of a
region. Minerals support many basic industries, which in turn supply
raw materials for engineering, metallurgical and chemical industries. It
is necessary to explore the mineral resources systematically and exploit
them judiciously, so as to get the abundance of non-metallic minerals.
The important minerals are limestone, Manganeze, Bentonites agate,
sand, quartz, Pipe clay, soap stone etc. These minerals have varied and
vast number of uses in industry and other spheres of life, Gujarat leads
in the production of a gate and salt, is second in calcite and third in
China clay in the country.

107
3.1.2 LAND UTILIZATION
(Area I '00 hectares) Sr. No.
Item 1980- 81
1990- 91
1995- 96
1997- 98
1998- 99
1999- 2000
2000- 01
2001- 02
1. Forests ($) 19655 18847 18628 18590 18647 18653 18653 18653 2. Barren and uncultivable
land 25034 26092 26008 26043 26034 26038 25997 25951 3. Area under non-agri.
use 10670 11221 11371 11401 11408 11414 11419 11439 4. Cultivable waste 19856 19700 19711 19802 19927 19818 19849 19855 5. Permanent posture -
Grazing land 8483 8457 8484 8490 8489 8491 8507 8503 6. Land under
miscellaneous tree crops and others groves not included in Net Area Sawn 41 40 40 40 40 40 40 40
7. Current fallows 5394 10379 7485 6750 6855 9109 9189 7325 8. Other fallows 3322 521 275 255 244 131 131 113 9. Net Area Sown (%) 95765 92962 96116 96741 96674 94429 94373 96217 10. Total Reporting Area 188220 188219 188118 188118 188118 188118 188118 188118 11. Area under forest crops 54871 52553 51677 52239 50749 47420 44165 46435 12. Area under non food
crops 52588 53795 58278 59891 61252 59597 60805 61475 13. Gross cropped Area 107459 106348 109955 112130 112001 107017 104970 107910
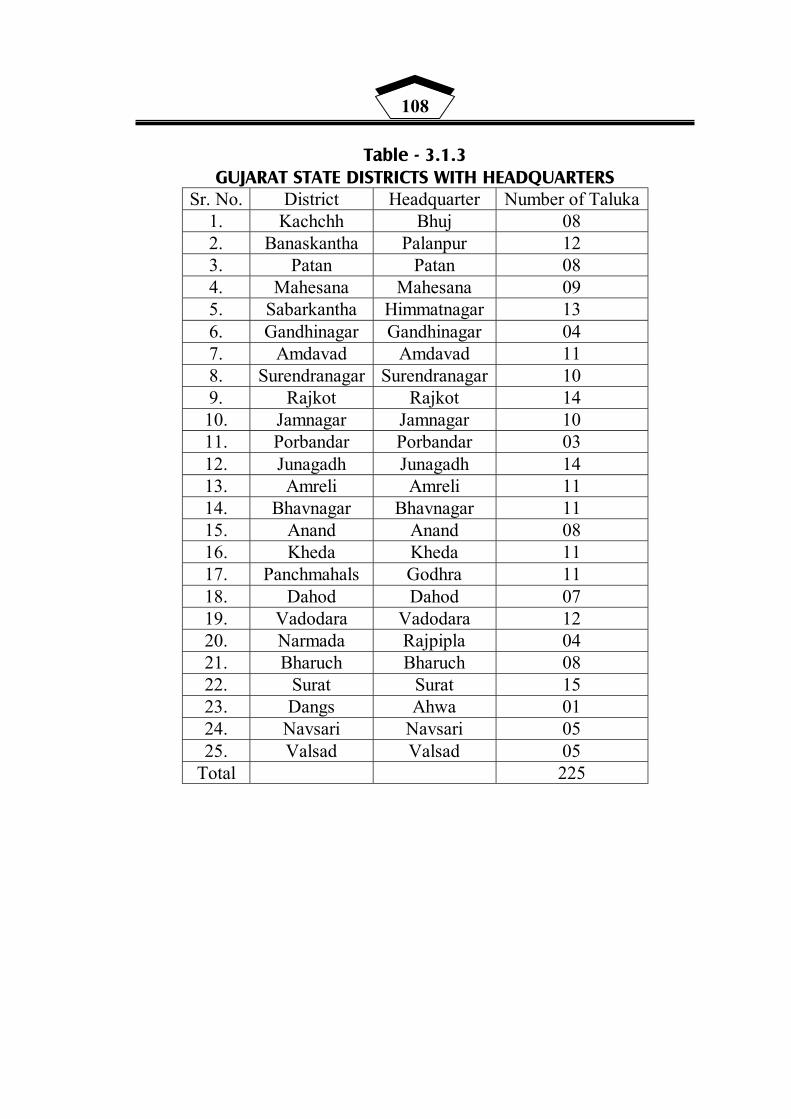
108
Table - 3.1.3 GUJARAT STATE DISTRICTS WITH HEADQUARTERS
Sr. No. District Headquarter Number of Taluka 1. Kachchh Bhuj 08 2. Banaskantha Palanpur 12 3. Patan Patan 08 4. Mahesana Mahesana 09 5. Sabarkantha Himmatnagar 13 6. Gandhinagar Gandhinagar 04 7. Amdavad Amdavad 11 8. Surendranagar Surendranagar 10 9. Rajkot Rajkot 14 10. Jamnagar Jamnagar 10 11. Porbandar Porbandar 03 12. Junagadh Junagadh 14 13. Amreli Amreli 11 14. Bhavnagar Bhavnagar 11 15. Anand Anand 08 16. Kheda Kheda 11 17. Panchmahals Godhra 11 18. Dahod Dahod 07 19. Vadodara Vadodara 12 20. Narmada Rajpipla 04 21. Bharuch Bharuch 08 22. Surat Surat 15 23. Dangs Ahwa 01 24. Navsari Navsari 05 25. Valsad Valsad 05
Total 225
109
SECTION - II
AN ECONOMIC OVERVIEW OF PRE REFORM PERIOD
3.2.1 GROWTH OF POPULATION - GUJARAT AND INDIA -
1961 TO 2001
TABLE - 3.2.1 GROWTH OF POPULATION - GUJARAT AND INDIA - 1961-2001
Year / Area
Total population
(Lakh)
Decade growth
rate
Density per
SqKm
Sex ratio
(Female per
1000 male)
Literary rate
Percentage of urban
populations
1961 Gujarat
206 (4.69)
+26.88 105 940 31.47 25.77
1961 India
4392 +21.64 142 941 28.30 17.97
1971 Gujarat
267 (4.87)
+29.39 136 934 36.95 28.08
1971 India
5482 +24.80 177 930 34.45 19.91
1981 Gujarat
341 (4.99)
+27.67 174 942 44.92 31.10
1981 India
6833 +24.66 216 934 43.57 23.34
1991 Gujarat
413 (4.89)
+21.19 211 934 61.29 34.49
1991 India
8434 +23.86 267 927 52.21 25.73
2001 Gujarat
507 (4.92
+22.66 258 920 69.14 37.36
2001 India
10286 +21.53 325 933 64.84 27.82
Source : Director of Census Operation Gujarat State. Primary Census Abstract Census of India. 2001.
110
Demographic trend in general from the above table - 3.2.1 reflects
mainly following facts.
(A) Decadal growth rate in the state, fluctuates regularly and tends to
fluctuate more than the national rate. However it is important to
note that during the last decade, population in the state shows
1.47% point rise while it shows fall in an increase India by 2.33%
point.
(B) Population of the state in percentage to total population of India
as shown in bracket demonstrates the fact the same share also
tends to vary at every decade. However percentage to total
population of India which showed declining trend during 81 to 91
did show increasing trend in the last decade during 1991 - 2001.
(C) Density of population per sq. km in the Gujarat State shows
steady increase however during the last decade that density has
increased more in comparison with the previous decades. It is
evidently found from the table that in the state density of
population is less than the national average of density. It is also
important to note that an increase in the density at National level
is more than the state level's increase.
(D) Sex ratio is considered to be one of the most important
demographic indicators. These indicators show fluctuating trends
both at the national level and state level. However at the state
level sex ratio is found to have declined more than the previous
period. While during this last decade sex ratio increase by +6 at
national level as against -14 at state level.

111
(E) Literary rate in the state level tends to show an increase at every
decade. But it would be important to understand the level of
change, which occurred between 1981 to 1991 and 1991 to 2001.
Between 1981 to 1991 it shows an increase of +16.37 percentage
point while in the last decade between 1991 to 2001 it shows an
increase of +7.85 percentage point. Thus it is revealed from the
table that during the last decade progress in literary rate has
slowed in comparison with the previous decade. This same if
examined at national level suggests constant rising trend. But
unlike the state level this rate tends to have increased maximum
by 12.63 percentage point. Thus it is clear that during the last
decade in the state of Gujarat total population increased more in
comparison with India but in respect of literacy rate an increase at
national level is found more than the increase at the state level.
(F) Percentage of urban population to the total population, if
examined suggests clearly the gap that prevails between the state
and the nation. This number at state level is significantly more
than the national level. Change in the percentage number during
the decade is also little more at state level than what it is at
national level. Both at the state and at national level this number
tends to have steady rise but proportion of increase at state level is
relatively found more than the national level. Thus it suggests
magnitude of convergence of political economy and the growth
process visualized at the regional economy.
112
3.2.2 DISTRICT WISE POPULATION GROWTH RATE
TABLE - 3.2.2 DISTRICT WISE POPULATION GROWTH RATE
District 1961-71 1971-81 1981-91 1991-2001 Banaskantha 27.03 31.81 29.66 26.38 Patan 14.16 Mehsana 28.14 21.81 15.26 12.05 Sabarkantha 29.29 26.49 17.23 18.25 Gandhingar 46.39 44.08 41.48 23.86 Amdavad 36.62 33.17 23.69 26.79 North Gujarat 33.49 31.47 27.46 20.24 Kachchh 22.02 23.58 20.20 25.40 Surendranagar 27.51 22.32 16.89 25.39 Rajkot 34.39 28.88 20.12 26.08 Jamnagar 34.15 25.35 12.24 21.79 Porbandar 14.35 Junagadh 33.00 26.80 14.00 17.07 Amreli 27.09 27.14 16.08 6.50 Bhavnagar 26.64 33.73 21.96 19.31 Saurashtra - Kachchh 29.25 26.82 17.35 19.48 Anand 13.04 Kheda 23.96 22.99 14.12 13.29 Panchmahal 26.86 25.58 27.39 20.39 Dahod 28.44 Vadodara 29.64 29.19 20.78 19.87 Central Gujarat 26.82 25.92 20.76 19.00 Narmad 14.47 Bharka 24.40 26.84 19.26 19.37 Surat 36.01 39.53 36.29 47.01 Dang 31.60 20.68 26.77 29.59 Navsari 13.24 Valsad 25.57 24.17 22.52 29.65 South Gujarat 26.77 27.81 26.21 25.55
Source : Director of Census Operation Gujarat State. Primary Census Abstract, Census of India. 2001.

113
Table - 3.2.2 refers to the decade growth rate in population of
various districts. Till 1997 there were 19 districts in the state. Hence
from 1961 to 1991 the figures are indicated of those 19 districts while
the last decade growth refers to the 25 districts of the state. An attempt
is also made to work out the average decade growth rate of the state in
context of sub regions. The table reveals the following picture.
(A) North Gujarat in general indicates average declining decade
growth rate, while Saurashtra - Kachchh regions indicates
deckling average growth rate till 1991 - but in the last decade it
again shows an increase in the average growth rate central Gujarat
also reflects continuous declining average growth trends while in
South Gujarat to it shows declining except during the decade of
71 to 81 which showed an upward trend.
(B) South Gujarat region indicates highest decade growth rate of
population during the last decade in comparison with the other
three regions of the state. It is followed by North Gujarat,
Saurashtra - Kachchh and Central Gujarat.
(C) In respect of individual districts, decadal growth rate from among
all 25 districts of the state, it is found maximum in Surat district
(47.01) followed by Valsad 29.65, Dang 29.54, Dahod 28.44 and
Amdavad 26.79. While this rate shows minimum numbers in the
districts Amreli 6.50, Mahesana - 12.05, Navsari 13.25, Kheda
13.29, and Anand 13.65.
114
3.2.3 IMPORTANT DEMOGRAPHIC INDICATORS (DISTRICTS OF GUJARAT)
TABLE - 3.2.3
IMPORTANT DEMOGRAPHIC INDICATIONS (DISTRICTS OF GUJARAT)
Sex ratio Density Literary status Percentage of urban District
1991 2001 1991 2001 1991 2001 1991 2001 Banaskantha 934 930 184 233 39.50 50.97 9.90 11.00 Patan 944 932 181 206 53.91 60.36 19.86 20.16 Mehsana 951 927 374 419 68.39 75.22 21.26 22.40 Sabarkantha 965 947 238 282 59.03 66.65 10.51 10.81 Gandhingar 934 912 498 617 73.78 76.59 29.21 35.02 Amdavad 987 892 567 719 73.64 79.50 77.50 80.18 North Gujarat 937 923 340 412 61.37 68.21 28.04 29.92 Kachchh 964 942 28 35 52.75 59.80 30.72 30.00 Surendranagar 921 924 115 144 54.77 61.61 30.01 26.56 Rajkot 946 930 224 283 66.96 74.16 47.09 51.29 Jamnagar 949 941 111 135 58.96 66.48 40.37 43.91 Porbandar 960 946 204 234 61.85 68.62 45.34 48.69 Junagadh 960 955 236 277 59.63 67.78 28.37 29.06 Amreli 985 987 177 188 60.46 66.09 23.59 22.45 Bhavnagar 944 937 207 247 57.75 66.20 35.70 37.86 Saurashtra-Kachchh 953 945 162 192 59.14 66.34 35.14 35.71 Anand 912 910 559 631 67.92 74.51 25.17 27.24 Kheda 924 923 424 480 63.97 71.96 20.78 20.08 Panchmahal 934 938 322 388 49.58 60.92 11.85 12.51 Dahod 976 985 349 449 35.84 45.15 8.97 9.55 Vadodara 913 919 402 482 63.73 70.76 43.71 45.20 Central Gujarat 931 935 411 486 56.20 64.66 22.09 22.94 Narmad 947 949 163 187 51.38 59.86 9.84 10.13 Bharuch 925 921 176 210 65.76 74.41 24.79 25.72 Surat 901 835 444 652 64.36 74.65 50.56 58.97 Dang 983 987 82 106 47.56 59.65 11.04 0.00 Navsari 958 955 491 557 68.29 75.83 28.26 27.36 Valsad 957 920 359 465 60.33 69.15 20.68 27.02 South Gujarat 945 927 285 362 59.61 68.92 24.19 25.03 Gujarat 934 920 211 258 61.29 69.14 34.49 37.36 Source: Socio-Economic Review of Gujarat by Directorate of Economics and Statistics, 2000-01 to 2005-06.

115
This exhaustive table (3.2.3) includes status of various important
demographic indicators that prevail in the districts of Gujarat State as
per last two census reports i.e. 1991 and 2001. Average numbers of sub
regions is also computed from the districts numbers. Following trends
are reflected from this table.
(A) Sex ratio as reported in the table demonstrates the fact that among
all the districts of the state it was highest in the year 1991 in
Amreli 985 followed by Dang (983). It was lowest in Amdavad
897 and Surat 901. In the census 2001 it is found that the sex ratio
was highest again in Amreli and Dang District 987 followed by
Dahod 985 Surat was at the bottom with 835 and Amdavad was
second from bottom with 892.
It is also revealed from this table that out of 25 districts of
the state in 18 districts this ratio has declined in 2001 in
comparison with 1991. While in the remaining of districts it has
increased. Downfall is again reported very high (66) in Surat
district while an increase is reported maximum of 9 in Dahod
district followed by Vadodara 6. These 25 districts in the state are
again divided into four sub regions. Based on district wise sex
ratio average number of sex ratio is commuted for sub-regions.
This as demonstrated in the table reflects the fact that in 1991
census Saurashtra Kachchh was at the top with 953, followed by
South 945 North 931 and central 931. This picture however
slightly changed as per the report of 2001. Though Saurashtra
showed declining trend to 945 it remained at the top But central
Gujarat reported an improvement of four leading to 935 from

116
earlier 931 with second best, south Gujarat went to third by
having dealing trends of 18 i.e. from 945 to 927. North Gujarat
was again of bottom declining further from 937 to 923. Central
Gujarat registered an increase, because three of the five districts
of the sub-region showed an upward trend and the two districts
showed very little down fall.
(B) Density of population is other important parameters. It shows
number of people residing per sq. km. in individual districts.
Following important trends are revealed in this regard from this
table. (A) All the district of the start show an increase in the
density of 2001 in comparison with 1991. (B) Density was
reported maximum in Amdavad district in 1991 and 2001 i.e. 567
and 719 respectively this reflects an increase of 152 per sq. km.
Second was the rank of Anand with 559 in 1991 however in 2001
Surat remained next best to Amdavad with 652.It means that
district reported an increase of 208 per 54 km. This was highest
increase between the two decades in the whole state. Kachchh
tends to be as usual the district with minimum (lowest) density
with 28 and 35 in 1997 and 2001 respectively. This showed an
increase of only 7 in the district during the decade.
Density if examined in respect of average number
commuted from each district number it can be stated central
Gujarat cluster remained the most densely populate the both in
1991 and 2001 with 411 and 486 respectively. Next cluster to
follow was North Gujarat which is showed an increase of 72 i.e.
412 from 340 respectively in 2001 and 1991. South Gujarat

117
indicated maximum variation of 77 from 285 to 362 respectively.
While Saurashtra and Kachchh cluster showed an increased of
only 30 during the decade. Apart from Kachchh - Dang and
Jamnagar are the other two districts with less densely populated
areas in the whole state.
(C) As per the census report of 1991 Gandhinagar district in the entire
state was at the top with 73.78 percentage of literacy rate.
Amdavad district was just a little behind to Gandhinagar with
73.64%. While in reverse to it Dahod was the area at the bottom,
with 35.84% rate of literacy and Banaskantha was second from
bottom range with 39.50% literacy rate. This trend as per 2001
census report reflects that Amdavad stood at the top with 79.52%
followed by Gandhinagar with 76.59% literacy rate. While again
Dahod and Banaskantha district remained at the bottom with
45.15% and 50.97% rate respectively. If difference in percentage
point examined between the two periods it is found that Dang
district showed maximum improvement of 12-35 point
percentage. This difference was also found much better in
Banaskantha district with 11.47 point percentage and
Panchmahals district showed an improvement of 11.34 percentage
point. Though Amdavad and Gandhinagar have remained at the
top during the last decade these two district have not improved
much the rate in literacy. The progress in these two districts tends
to be very meager of 2.81 point percentage and 5.86 point
percentage respectively.
118
In respect of average literacy rate of sub regions it is
revealed from the table that North Gujarat remained at the top in
1991 with 61.37. However in 2001 South Gujarat remained at the
top with 68.92% of literary rate. In 1991 South Gujarat as second
and Saurashtra was third. While in 2001 North Gujarat with
68.2% followed South Gujarat and Saurashtra registered literacy
rate of 66.34%. It would be important to examine the progress in
literacy in the last decade. The data commuted for sub region
indicates the fact that highest growth was reputed in literacy by
South Gujarat with 9.31 percentage point change followed by
Central Gujarat with 8.34 percentage point change Saurashtra and
Kachchh registered an increase of 7.20 percentage point while in
North Gujarat these was an improvement of 6.84 percentage
point.
(D) Looking at the column of percentage of urban populations it is
evidently found that in context of sub-regions in 1991 and in 2001
urban population in percentage to the total population was
maximum in Saurashtra region with 35.14% and 35.71%
respectively. It thus showed an increase of just 0.57 percentage in
the last decade. This was followed by North Gujarat region with
28.09 percentage and 28.92 percentage respectively that indicated
an increase of 88 percentage is the decade South Gujarat region
reported urban population in percentages 24.19 and 25.03
respectively.
This reflected an improvement of 0.84 percentage point and
central Gujarat had 22.9 percentage of urban population in 1991

119
and in 2001 it was 22.94% population. This indicated an increase
7.85% percentage.
While examining the data of each district it is revealed that
Amdavad and Surat these two districts show very high percentage
of urban population to the total population of the district,
Amdavad had 77.50 and 80.18 respectively as per census report
of 1991 and 2001 while Surat had 50.56 and 59.97 percentage. It
is thus clear that even between the two districts urban population
there prevails or wide gap. It is important to note that at present in
the State there are seven Municipal Corporations i.e. Amdavad,
Vadodara, Surat, Rajkot, Jamnagar, Bhavnagar and Junagadh.
However urbanization tends to be at very slow rate in corporate
cities other than Amdavad and Surat. Though Gandhinagar is a
state capital, the city has urban population in percentage to the
total population showed 29.21 and 35.02 respectively in 1991 and
2001, bringing change of 5.82 percentage point. As per the report
of 2001 Amdavad, Surat, Rajkot, Vadodara, Porbandar, Jamnagar,
Junagadh showed urban population more than the state average.
As per the revised definition of urbanization, the Dang is the
district which has zero (nil) urban population. Dahod, Narmada,
Sabarkantha and Banaskantha are the examples where very less
percentage of urban population is reported.

120
3.2.4 ANNUAL BIRTH RATES AND DEATH RATES -
RURAL / URBAN
TABLE - 3.2.4 ANNUAL BIRTH RATES AND DEATH RATES -
RURAL / URBAN Birth rate Death rate Sr. No. Year
Rural Urban Rural Urban 1 1971 41.5 35.8 17.6 10.0 2 1976 38.6 32.4 17.2 11.1 3 1981 36.1 29.8 12.4 10.7 4 1982 35.6 31.2 13.2 8.3 5 1985 33.8 31.2 11.8 8.7 6 1986 32.9 30.8 11.3 8.6 7 1987 31.6 29.0 10.8 7.6 8 1988 30.1 28.1 11.8 9.2 9 1989 29.6 26.6 10.0 8.9
10 1990 30.2 28.3 9.6 7.2 11 1991 28.2 25.9 8.8 7.9 12 1992 29.5 24.6 9.5 8.3 13 1993 29.1 25.8 8.9 6.8 14 1994 28.5 24.0 9.6 6.9 15 1995 27.9 24.0 8.3 6.2 16 1996 26.9 23.0 8.3 6.2 17 1997 27.0 22.6 8.3 6.2 18 1998 27.0 21.9 8.6 6.3 19 1999 27.0 22.0 8.8 5.9 20 2000 26.8 21.9 8.3 5.8
Source : Statistical Abstract of Gujarat State, Directorate of Economics and Statistics, Government of Gujarat, Gandhinagar
121
Annual birth rate and Death rate data is presented in the Table
3.2.4. It is revealed from the table that -
(A) Birth rate at large shows declining trend both in rural as well as
urban area. The gap between the rural and urban birth rate does
not indicate much difference in respect of time period e.g. This
gap was of 5.7 in 1971 which widened to 6.3 in 1981 but again in
1991 this gap was narrowed to 2.3 - again in 2000 it evidenced to
4.9. Thus the gap tends to fluctuate over the period of time
between rural and urban birth rate. Year wise gap if examined
during the last ten years it is in conformity with general decadal
gap i.e. year wise gap is reported as 2.3, 4.9, 3.3, 4.0, 3.9, 3.9, 4.4,
5.1, 5.0, 4.9 respectively.
(B) Death rate as reflected in the table also explains the status in rural
and urban Gujarat. This figure carries importance in view of the
problem of population explosion. It is true that death rate in
relation to birth rate tends to be much less. It means that on one
hand the state economy at large succeed in curtailing birth rate but
at a lower pace while on other hands death rate is lowered
comparatively with much progress.
Rural urban gap in death rate was of 7.6 point percentage in
1971, which was found as 1.7 point percentage in 1981 and again
1991 it was 0.9 point percentage only and as peer the available
report of 2000 again this gap is widened to 2.5 point percentage.
122
The gap between rural birth rate and death rate as revealed
from the table suggests that in 1971 this was of 23.5 in 1981 it
was 23.7 in 1991 this difference was of 19.4 which was reported
of 18.5 again 2000. In urban Gujarat too the gap existed between
urban death rate and birth rate was of 25.8 in 1971, 19.1 in 1981,
17.9 in 1991 and again in 2000 it was 16.1.
It is also observed from the table that rural urban gap in
death rate is found less in comparison with birth rate. In other
words progress in health facilities has led to narrowing rural
urban gap in death whole institutional in difference leading to less
awareness can be considered as important factor responsible for
much widened gap between urban and rural Gujarat in respect of
birth rate.
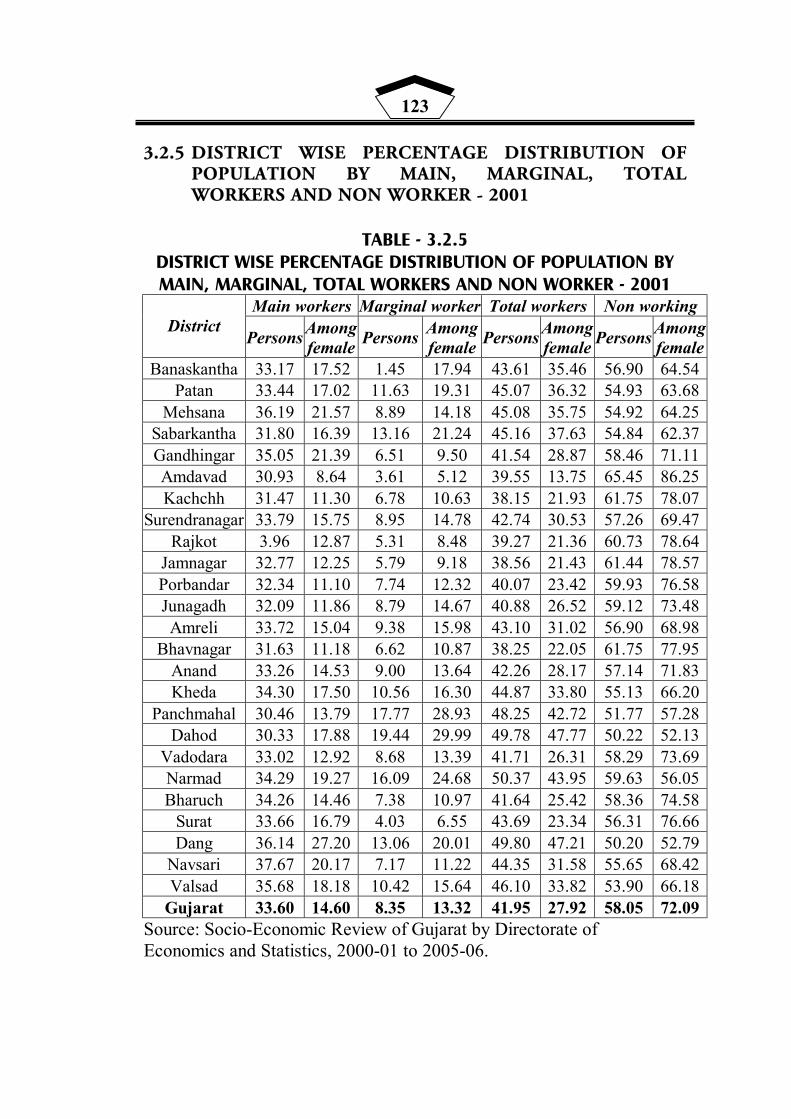
123
3.2.5 DISTRICT WISE PERCENTAGE DISTRIBUTION OF POPULATION BY MAIN, MARGINAL, TOTAL WORKERS AND NON WORKER - 2001
TABLE - 3.2.5
DISTRICT WISE PERCENTAGE DISTRIBUTION OF POPULATION BY MAIN, MARGINAL, TOTAL WORKERS AND NON WORKER - 2001
Main workers Marginal worker Total workers Non working District
Persons Among female Persons Among
female Persons Among female Persons Among
female Banaskantha 33.17 17.52 1.45 17.94 43.61 35.46 56.90 64.54
Patan 33.44 17.02 11.63 19.31 45.07 36.32 54.93 63.68 Mehsana 36.19 21.57 8.89 14.18 45.08 35.75 54.92 64.25
Sabarkantha 31.80 16.39 13.16 21.24 45.16 37.63 54.84 62.37 Gandhingar 35.05 21.39 6.51 9.50 41.54 28.87 58.46 71.11 Amdavad 30.93 8.64 3.61 5.12 39.55 13.75 65.45 86.25 Kachchh 31.47 11.30 6.78 10.63 38.15 21.93 61.75 78.07
Surendranagar 33.79 15.75 8.95 14.78 42.74 30.53 57.26 69.47 Rajkot 3.96 12.87 5.31 8.48 39.27 21.36 60.73 78.64
Jamnagar 32.77 12.25 5.79 9.18 38.56 21.43 61.44 78.57 Porbandar 32.34 11.10 7.74 12.32 40.07 23.42 59.93 76.58 Junagadh 32.09 11.86 8.79 14.67 40.88 26.52 59.12 73.48 Amreli 33.72 15.04 9.38 15.98 43.10 31.02 56.90 68.98
Bhavnagar 31.63 11.18 6.62 10.87 38.25 22.05 61.75 77.95 Anand 33.26 14.53 9.00 13.64 42.26 28.17 57.14 71.83 Kheda 34.30 17.50 10.56 16.30 44.87 33.80 55.13 66.20
Panchmahal 30.46 13.79 17.77 28.93 48.25 42.72 51.77 57.28 Dahod 30.33 17.88 19.44 29.99 49.78 47.77 50.22 52.13
Vadodara 33.02 12.92 8.68 13.39 41.71 26.31 58.29 73.69 Narmad 34.29 19.27 16.09 24.68 50.37 43.95 59.63 56.05 Bharuch 34.26 14.46 7.38 10.97 41.64 25.42 58.36 74.58
Surat 33.66 16.79 4.03 6.55 43.69 23.34 56.31 76.66 Dang 36.14 27.20 13.06 20.01 49.80 47.21 50.20 52.79
Navsari 37.67 20.17 7.17 11.22 44.35 31.58 55.65 68.42 Valsad 35.68 18.18 10.42 15.64 46.10 33.82 53.90 66.18
Gujarat 33.60 14.60 8.35 13.32 41.95 27.92 58.05 72.09 Source: Socio-Economic Review of Gujarat by Directorate of Economics and Statistics, 2000-01 to 2005-06.

124
Table - 3.2.5 provides the data pertaining to the number of
workers marginal, main and total number of non-workers in percentage,
percentage number of workers is further divided into persons and female
workers among the persons.
This table primarily reveals the following facts :
(A) Total number of workers in the state as whole in percentage is
41.95. As against this total of the state, district wise picture
indicates that out of 25 districts 10 districts have total number of
workers less than the state and 15 districts have total number of
workers more than the state number.
(B) From amongst the 25 districts maximums number of total workers
in percentage is found in Narmada District (50.37%) followed by
the Dangs (49.80%), and Dahod 49.70% while this is found
minimum in the districts like Amdavad 34.55, Kachchh and
Bhavnagar 38.25% and Jamnagar 38.50 percentage.
(C) Total number of workers when classified into the number of
female workers it is revealed further that the state level number of
percentage of total female workers, is 27.92. As against this
percentages of total female workers from among the total number
of workers, it is found less than that in 10 districts and more than
that in 15 districts district wise picture further demonstrates the
fact that it is found maximum in percentage numbers in the
districts like Dahod 47.79% followed by the Dangs. 47.21
percentage and Narmada 43.95 percentage. While in reveals to it
this percentage number is found minimum in the districts like
125
Amdavad 13.75, Rajkot 21.36 percentage and Kachchh 21.93
percentage
(D) From amongst the total number of workers in percentage number
of main workers at the state level 33.60 percentage. 13 districts
out of 25 districts have persons as main workers in percentage
number less than the state numbers. No district from within the
state is having main workers in percentage more than 39.66. This
maximum is found in Surat district Navsari with 37.67 percentage
and Gandhinagar with 35.05 follow Surat. Dahod District is at the
bottom with 30.33 percentage followed by Panchmahals 30.46
and Amdavad 30.93 percentage.
From amongst main workers, female in percentage at state
level is only 14.60 percentage. 11 districts have female workers as
main workers in percentage number less than he state level.
Minimum percentage female workers are found in Amdavad 8.64
followed by Porbandar 11.10 and Kachchuh 11.30. While this
percentage number is found maximum in the Dang 27.30
percentage followed by Mahesana 21.57 and Gandhinagar 21.39
percentage.
(E) It is revealed further form the table that percentage number of
marginal workers at the state level tends to be 8.35. 10 districts
have marginal workers in percentage numbers less than the state
index. This number is found minimum in Amdavad District 3.61
percentage followed by Surat with 4.03 percentage and Rajkot
5.31 percentage. Dahod district has maximum percentage of
marginal workers in the state i.e. 19.44 percentage. Next to Dahod

126
it is found in Panchmahals 17.17 percentage and Narmada district
16.09 percentage.
Percentage number of female workers from amongst total
marginal workers at the state level is 13.32 percentage much
better than total number of persons as marginal workers 10
districts however have female marginal workers in percentage
less than the state number. This percentage number is found
maximum in Dahod 29.99% Panchmahals 28.93 and Narmada
24.68 percentage, Amdavad is having minimum percentage of
marginal female workers 5.72 percentage and it is followed by
Surat 6.55 and Rajkot district 8.48 percentage.

127
3.2.6 N.S.D.P. GUJARAT (1960S TO 1980S)
TABLE - 3.2.6 N.S.D.P. GUJARAT (1960S TO 1980S)
Year Constant Rs. Current Rs.
1961 738 788
1972 2189 (+196.61) 2189
1981 6547 (199.08) 6547
1991 10839 (65.50) 24180 Source : Domestic Products of States of India - 1961 to 2001 (EPW Volume)
As reflected in the table the state experienced considerable
progress in respect of N.S.D.P. At constant price this has increased by
196.61% between 1961 to 1971, by 199.08% between 1971 to 1981 and
by 65.55% between 1981 to 1991. At current price major change is
found, only From 1981 to 1991, resulting into 269.33% increase.
In order to understand and examine sectoral change and progress
in the state economy following table is more helpful to arrive at the pre-
reform progress of Gujarat Economy.
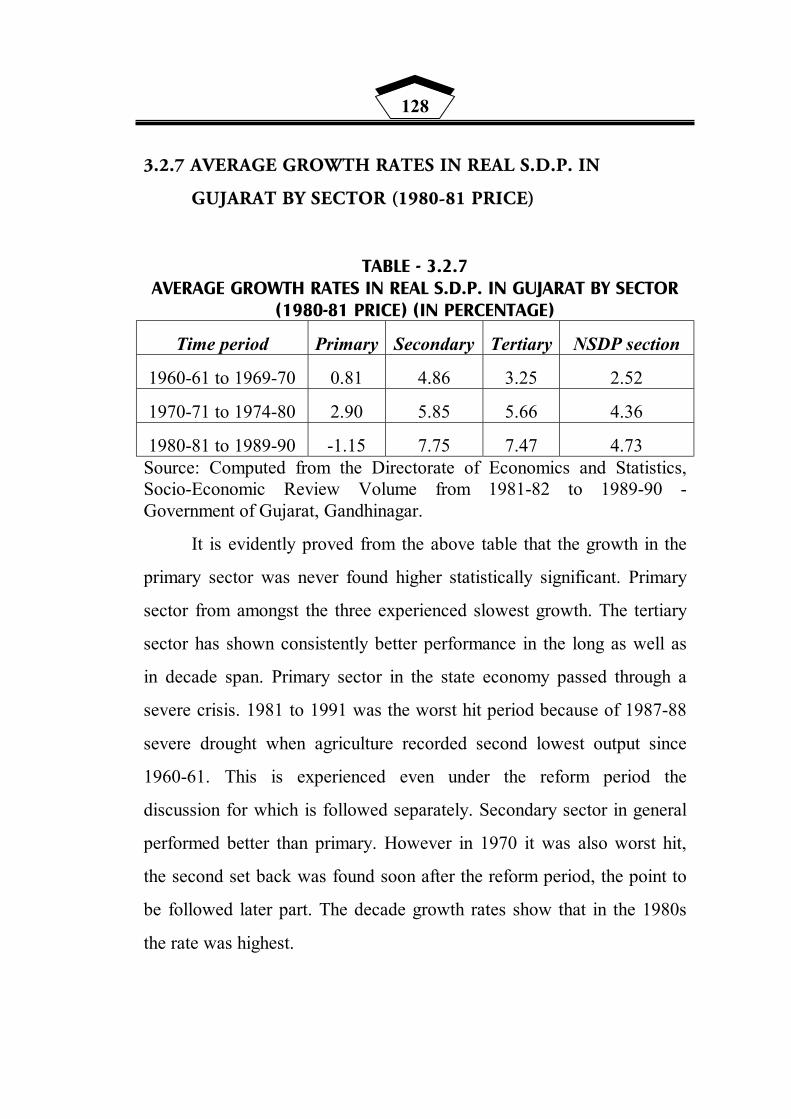
128
3.2.7 AVERAGE GROWTH RATES IN REAL S.D.P. IN
GUJARAT BY SECTOR (1980-81 PRICE)
TABLE - 3.2.7 AVERAGE GROWTH RATES IN REAL S.D.P. IN GUJARAT BY SECTOR
(1980-81 PRICE) (IN PERCENTAGE)
Time period Primary Secondary Tertiary NSDP section
1960-61 to 1969-70 0.81 4.86 3.25 2.52
1970-71 to 1974-80 2.90 5.85 5.66 4.36
1980-81 to 1989-90 -1.15 7.75 7.47 4.73 Source: Computed from the Directorate of Economics and Statistics, Socio-Economic Review Volume from 1981-82 to 1989-90 - Government of Gujarat, Gandhinagar.
It is evidently proved from the above table that the growth in the
primary sector was never found higher statistically significant. Primary
sector from amongst the three experienced slowest growth. The tertiary
sector has shown consistently better performance in the long as well as
in decade span. Primary sector in the state economy passed through a
severe crisis. 1981 to 1991 was the worst hit period because of 1987-88
severe drought when agriculture recorded second lowest output since
1960-61. This is experienced even under the reform period the
discussion for which is followed separately. Secondary sector in general
performed better than primary. However in 1970 it was also worst hit,
the second set back was found soon after the reform period, the point to
be followed later part. The decade growth rates show that in the 1980s
the rate was highest.
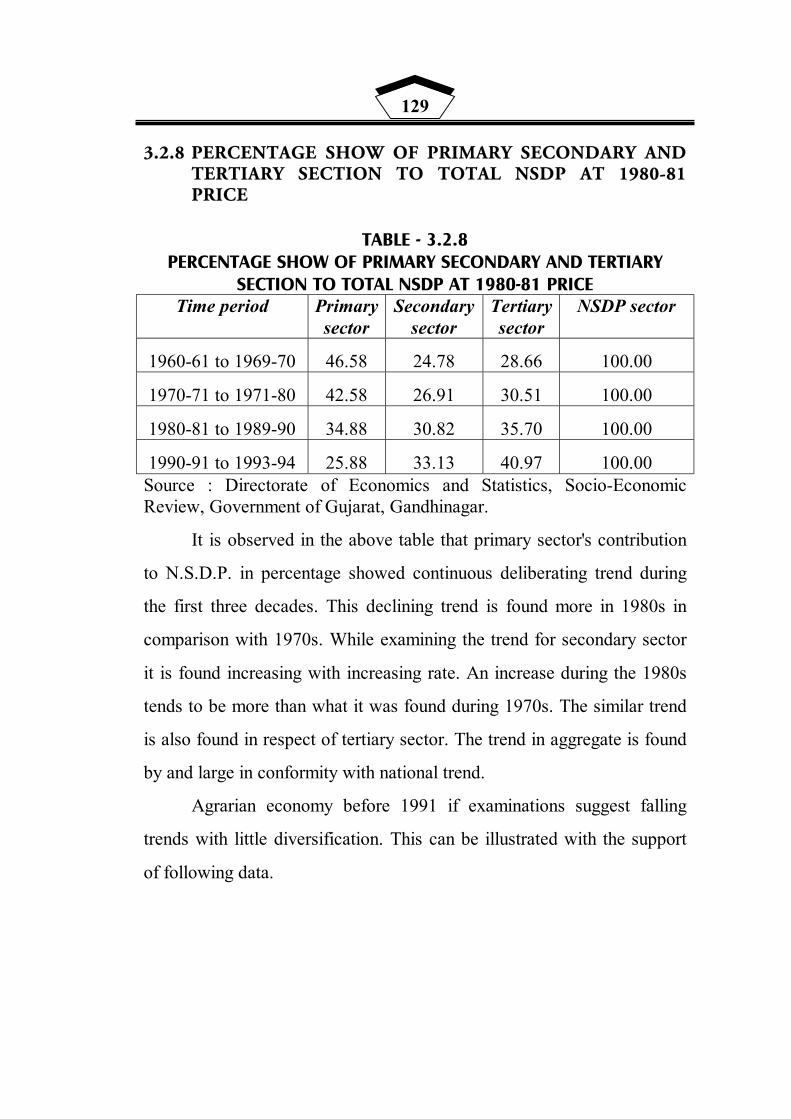
129
3.2.8 PERCENTAGE SHOW OF PRIMARY SECONDARY AND TERTIARY SECTION TO TOTAL NSDP AT 1980-81 PRICE
TABLE - 3.2.8
PERCENTAGE SHOW OF PRIMARY SECONDARY AND TERTIARY SECTION TO TOTAL NSDP AT 1980-81 PRICE
Time period Primary sector
Secondary sector
Tertiary sector
NSDP sector
1960-61 to 1969-70 46.58 24.78 28.66 100.00
1970-71 to 1971-80 42.58 26.91 30.51 100.00
1980-81 to 1989-90 34.88 30.82 35.70 100.00
1990-91 to 1993-94 25.88 33.13 40.97 100.00 Source : Directorate of Economics and Statistics, Socio-Economic Review, Government of Gujarat, Gandhinagar. It is observed in the above table that primary sector's contribution
to N.S.D.P. in percentage showed continuous deliberating trend during
the first three decades. This declining trend is found more in 1980s in
comparison with 1970s. While examining the trend for secondary sector
it is found increasing with increasing rate. An increase during the 1980s
tends to be more than what it was found during 1970s. The similar trend
is also found in respect of tertiary sector. The trend in aggregate is found
by and large in conformity with national trend.
Agrarian economy before 1991 if examinations suggest falling
trends with little diversification. This can be illustrated with the support
of following data.
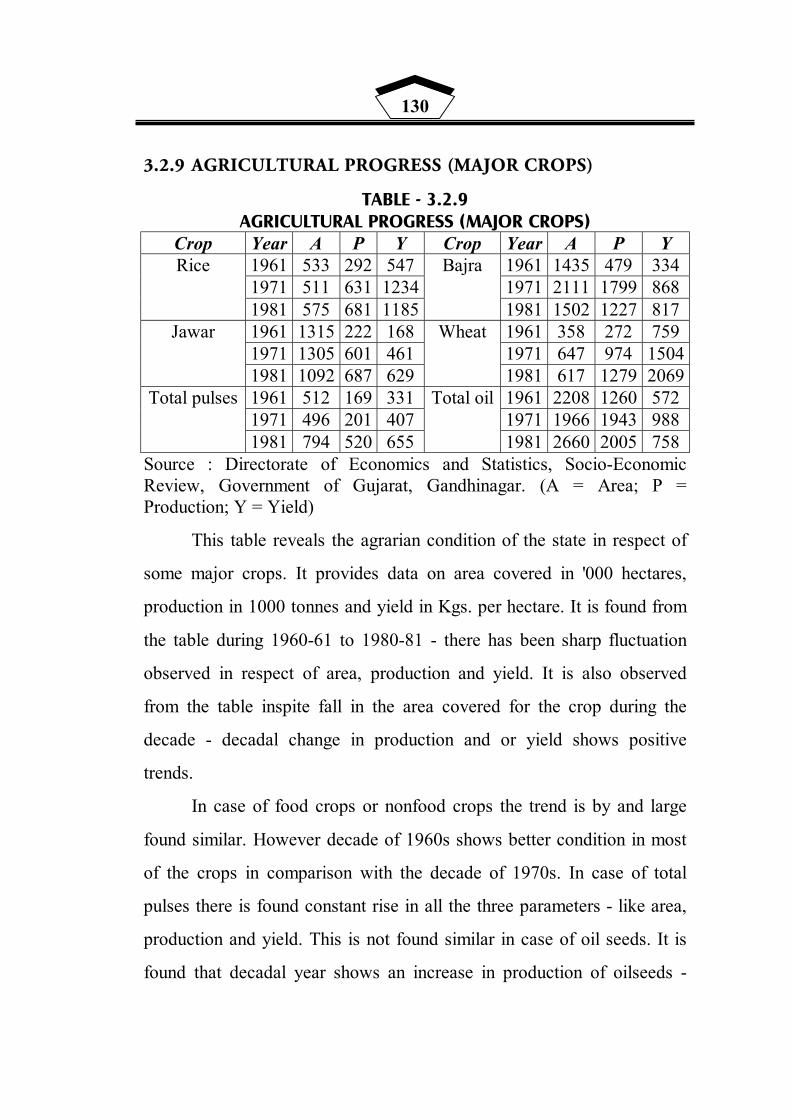
130
3.2.9 AGRICULTURAL PROGRESS (MAJOR CROPS)
TABLE - 3.2.9 AGRICULTURAL PROGRESS (MAJOR CROPS)
Crop Year A P Y Crop Year A P Y 1961 533 292 547 1961 1435 479 334 1971 511 631 1234 1971 2111 1799 868
Rice
1981 575 681 1185
Bajra
1981 1502 1227 817 1961 1315 222 168 1961 358 272 759 1971 1305 601 461 1971 647 974 1504
Jawar
1981 1092 687 629
Wheat
1981 617 1279 2069 1961 512 169 331 1961 2208 1260 572 1971 496 201 407 1971 1966 1943 988
Total pulses
1981 794 520 655
Total oil
1981 2660 2005 758 Source : Directorate of Economics and Statistics, Socio-Economic Review, Government of Gujarat, Gandhinagar. (A = Area; P = Production; Y = Yield) This table reveals the agrarian condition of the state in respect of
some major crops. It provides data on area covered in '000 hectares,
production in 1000 tonnes and yield in Kgs. per hectare. It is found from
the table during 1960-61 to 1980-81 - there has been sharp fluctuation
observed in respect of area, production and yield. It is also observed
from the table inspite fall in the area covered for the crop during the
decade - decadal change in production and or yield shows positive
trends.
In case of food crops or nonfood crops the trend is by and large
found similar. However decade of 1960s shows better condition in most
of the crops in comparison with the decade of 1970s. In case of total
pulses there is found constant rise in all the three parameters - like area,
production and yield. This is not found similar in case of oil seeds. It is
found that decadal year shows an increase in production of oilseeds -

131
though area and yield shows mixed trends over the decade. It is however
important to note that though Gujarat being the King for groundnut it
shows continuous falling trend in all the three parameter for groundnut.
3.2.10 CROPPING PATTERN :
The area shares for major crops / crop groups for the trienniums
ending 1963, 1973, 1983 and 1993 are depicted in the table.
TABLE - 3.2.10 CROPPING PATTERN CHANGES
(AREA SHARE AS PERCENT OF GCA)
Crops group Triennium
ending 1963
Triennium ending 1973
Triennium ending 1983
Triennium ending 1993
Rice 5.47 4.78 5.60 5.54 Wheat 4.03 4.75 6.08 4.72 Jowar 13.27 9.29 9.97 4.29 Bajra 14.21 13.09 1.55 11.38 Maize 2.75 2.49 3.41 3.38
Total cereals 42.55 42.18 41.23 29.79 Tur 0.09 0.95 3.12 3.85
Total pulses 5.14 4.67 9.28 8.38 Total food grains 47.69 49.85 49.55 38.17
Groundnut 21.31 18.65 19.84 18.41 Mustard 0.14 0.57 1.88 3.42
Total oil seeds 23.55 21.28 25.19 27.46 Sugar cane 0.22 0.48 1.07 1.18
Cotton 17.12 20.96 13.08 10.68 Other crops 11.42 7.43 11.11 22.51 GCA (Ha) 9982357 10085200 10838800 10646550
Source: Season and Crop Reports - Department of Agriculture, Gandhinagar. Economic and Political Weekly, Aug-26 to Sep-2, 2002. (GCA = Gross Crop Area)

132
It is found from this table that area under cereals declined in the
last three decades from 42.5 percent to 29.8 percent. This decline was
the sharpest in the last decade. This can be attributed to the fall in area
under coarse cereals. Area under Jowar and Bajra went down
remarkably. The total area under cereals declined by nearly 11.13 lakh
ha. Area under total food grains remained stagnant from 1963 to 1983
but declined dramatically in the last decade reaching 38 percent of the
gross cropped area. As highlighted in the table - in the last three decades
area under oilseeds moved from 23.5 percent to 27.5 percent. It was
largely due to increase in the share under mustard. While as mentioned
in earlier table's analysis groundnut is using its share falling from 21 to
18 percent. Share of cotton in GCA has also declined.
The trends clearly reveal the fact that, areas under food grain in
state at large is being replaced by other crop. Cash crops show clear
significance and are found more gaining in state's agriculture. During
the 1960s the share of other crops was found to be insignificant which
gradually gained significance and in the 1980s, the share of non-
traditional non-food crops including fruits / vegetables recorded a large
increase.

133
3.2.11 YIELD LEVEL FOR MAJOR CROPS (KG/HA - TRIENNIUM ENDING)
TABLE - 3.2.11
YIELD LEVEL FOR MAJOR CROPS (KG/HA - TRIENNIUM ENDING)
Crops group Triennium
ending 1963
Triennium ending 1973
Triennium ending 1983
Triennium ending 1993
Rice 873 918 1335 1332 Wheat 902 1651 2316 2119 Jawar 298 377 566 597 Bajra 435 744 1194 801 Maire 1062 1222 1397 1193 Tur 497 696 719 780 Groundnut 611 605 817 586 Mustard 520 938 1399 1052 Sugar cane 5461 5215 7422 8337 Other 136 163 205 239
Source: Season and Crop Reports - Department of Agriculture, Gandhinagar. Economic and Political Weekly, Aug-26 to Sep-2, 2002.
This shows yield level for major crops in respect of triennium
ending in 1963, 1973, 1983 and 1993. In 1963, sugarcane and cereals
hold the agrarian scenario which changed more towards crops like
wheat, Bajra and mustered mainly. Cereals like Rice, Wheat, Jowar,
Bajra and oilseeds crops also show significant positive changes. Period
of 1973 to 1983 shows considerable gain on all fruits of agriculture but
1980s in general shows more falling trend in yield of most of the crops.
It was also observed that the growth of agricultural output in
general and for the selected crops showed turned around in the 1980s.
At the state level the growth of output decelerated to reach 2.12 percent
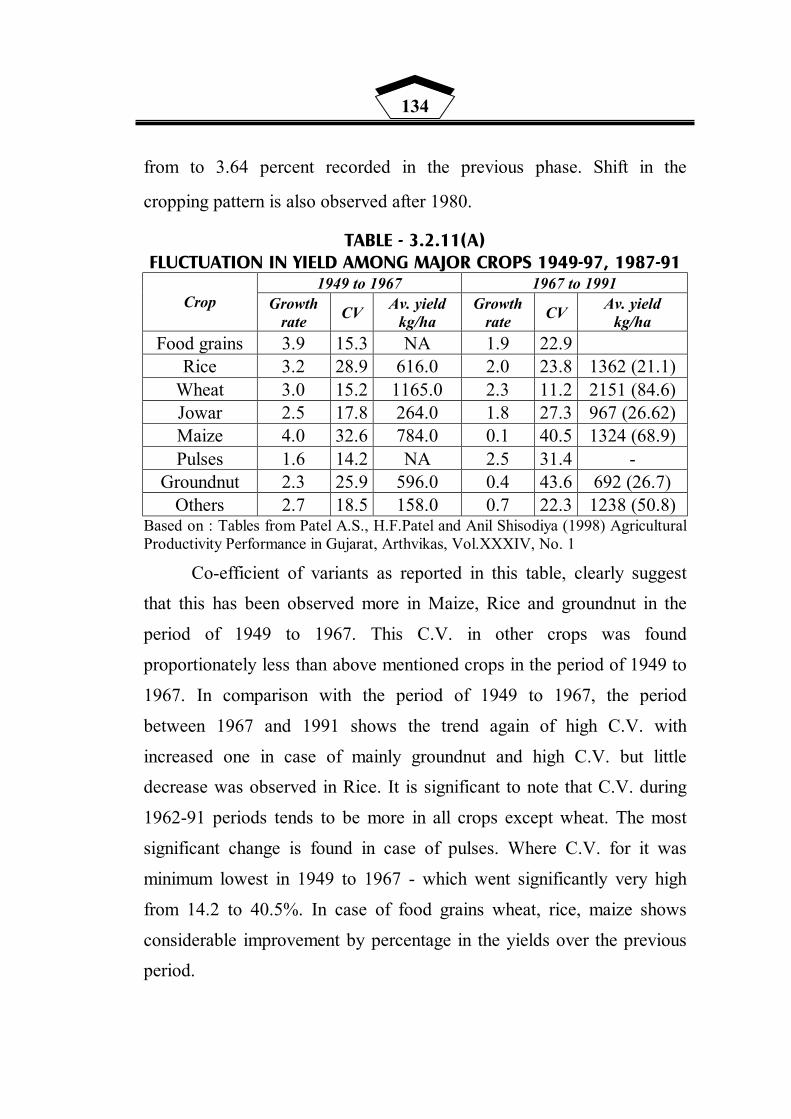
134
from to 3.64 percent recorded in the previous phase. Shift in the
cropping pattern is also observed after 1980.
TABLE - 3.2.11(A) FLUCTUATION IN YIELD AMONG MAJOR CROPS 1949-97, 1987-91
1949 to 1967 1967 to 1991 Crop Growth
rate CV Av. yield kg/ha
Growth rate CV Av. yield
kg/ha Food grains 3.9 15.3 NA 1.9 22.9
Rice 3.2 28.9 616.0 2.0 23.8 1362 (21.1) Wheat 3.0 15.2 1165.0 2.3 11.2 2151 (84.6) Jowar 2.5 17.8 264.0 1.8 27.3 967 (26.62) Maize 4.0 32.6 784.0 0.1 40.5 1324 (68.9) Pulses 1.6 14.2 NA 2.5 31.4 -
Groundnut 2.3 25.9 596.0 0.4 43.6 692 (26.7) Others 2.7 18.5 158.0 0.7 22.3 1238 (50.8)
Based on : Tables from Patel A.S., H.F.Patel and Anil Shisodiya (1998) Agricultural Productivity Performance in Gujarat, Arthvikas, Vol.XXXIV, No. 1 Co-efficient of variants as reported in this table, clearly suggest that this has been observed more in Maize, Rice and groundnut in the
period of 1949 to 1967. This C.V. in other crops was found
proportionately less than above mentioned crops in the period of 1949 to
1967. In comparison with the period of 1949 to 1967, the period
between 1967 and 1991 shows the trend again of high C.V. with
increased one in case of mainly groundnut and high C.V. but little decrease was observed in Rice. It is significant to note that C.V. during
1962-91 periods tends to be more in all crops except wheat. The most
significant change is found in case of pulses. Where C.V. for it was
minimum lowest in 1949 to 1967 - which went significantly very high
from 14.2 to 40.5%. In case of food grains wheat, rice, maize shows
considerable improvement by percentage in the yields over the previous period.

135
3.2.12 DISTRICT WISE LEVEL OF INPUT USED
TABLE - 3.2.12
DISTRICT WISE LEVEL OF INPUT USED
No. of tractors (per'000 ha)
No. of pumps (per'000 ha)
Consumption of fertilizer (kg/ha)
Percentage of GCA irrigated Cropping intense
District / State 1961-
63 1981-
83 1987 1961- 63
1981- 83 1987 1961-
63 1981-
83 1987 1961- 63
1981- 83 1987 1961-
63 1981-
83 1987
Amdavad / Gandhinagar 0.48 3.82 7.20 8.60 26.35 31.11 1.42 26.42 69.98 9.28 19.16 28.82 1.00 1.04 1.08
Amreli 0.55 3.56 4.66 17.40 93.79 112.45 4.35 56.67 51.86 6.32 13.89 10.84 1.01 1.13 1.05 Banaskantha 0.05 1.84 4.23 4.53 45.09 74.07 0.51 13.19 42.10 7.81 22.76 33.00 1.08 1.19 1.30
Bharuch 0.43 1.37 3.42 3.79 10.37 15.39 34.00 18.91 50.72 2.75 10.28 13.06 1.00 1.01 1.01 Bhavnagar 0.17 2.18 3.61 14.21 84.99 104.53 3.46 44.07 61.60 8.32 21.22 23.37 1.02 1.17 1.11 Jamnagar 0.17 1.64 1.97 23.69 100.93 113.23 1.86 36.20 30.91 5.40 23.97 22.91 1.03 1.22 1.10 Junagadh 0.24 2.49 4.12 38.55 145.62 185.26 6.18 63.03 71.39 14.28 20.45 17.91 1.06 1.17 1.12 Kuchchh 0.12 1.43 3.14 8.03 23.13 30.50 10.26 5.89 25.30 6.94 10.67 15.58 1.02 1.05 1.08 Kheda 1.07 7.60 12.23 10.94 28.11 43.73 10.15 66.62 131.74 9.41 46.25 52.77 1.06 1.18 1.21
Mahesana 0.36 5.09 6.95 18.89 35.38 19.38 1.34 33.50 59.89 19.29 40.38 49.97 1.07 1.32 1.29 Panchmahal 0.06 2.76 3.36 23.07 118.20 134.69 4.30 70.36 66.35 6.51 22.62 25.43 1.01 1.12 1.10
Rajkot 0.36 2.76 3.36 23.07 118.10 134.69 4.30 70.36 66.35 6.51 22.61 25.43 1.01 1.13 1.10 Sabarkantha 0.37 3.84 6.55 19.78 109.21 120.48 0.77 71.48 99.32 11.21 34.29 30.53 1.00 1.12 1.17
Surat 1.13 5.49 8.32 6.96 24.00 38.56 4.84 87.41 173.29 6.44 29.57 38.69 1.05 1.07 1.08 Surenranagar 0.21 2.08 3.11 6.26 44.59 39.59 0.16 22.42 33.02 4.04 13.06 16.91 1.01 1.02 1.00 The Dangs 1.00 0.07 0.04 0.37 0.81 2.06 0.00 0.81 0.34 0.10 0.22 0.18 1.00 1.00 1.00 Vadodara 0.47 2.17 3.36 5.61 17.91 24.87 7.88 49.42 82.20 3.86 23.21 27.52 1.03 1.04 1.04
Valsad 0.60 3.90 8.08 12.55 40.95 71.55 3.66 33.72 90.34 4.41 17.84 29.95 1.11 1.10 1.10 Gujarat 0.38 2.93 4.81 13.55 58.74 73.17 3.64 39.55 66.17 7.85 22.76 27.30 1.05 1.13 1.13
136
District wise details on application of several inputs like - tractors,
pump sets, chemical, fertilizer is presented in this table. The table in
general reveals that the yield and growth of crop output are positively
associated with the use of modern inputs. In 1991-93, the high
productivity districts of Valsad, Mahesana, Kheda, Surat, Sabarkantha
were characterized by high levels of area under irrigation. In most of the
districts the consumption of fertilizer was also found of the highest
order. It is also observed that the districts where the area under food
grains is of less importance, had slightly lower levels of fertilizer use -
for instance in Jamnagar - Surendranagar and Kachchh.
In aggregate at the state level, there is a strong relationship
between the use of modern inputs and the magnitude of crop output.
Between 1961-63 and 1981-83, the output nearly doubled. During this
period, the per hectare consumption of fertilizer, rose from 4 to 40
kg/ha. Substantial gains were also made in the use of pump sets from
13.5 to 59 per thousand hectares. Percentage of GCA under irrigation
increased from 7-8 percent during 1961-63 to 22.7 percent during 1981-
83. Consequently the growth of output between 1971-73 and 1981-83
accelerated at 3.6 percent.
This trend is found to have continued at large from 1981-83 to
1991-93. An increase in the consumption for fertilizer in several districts
like Bharuch, Surat and Kachchh led to high growth in output.
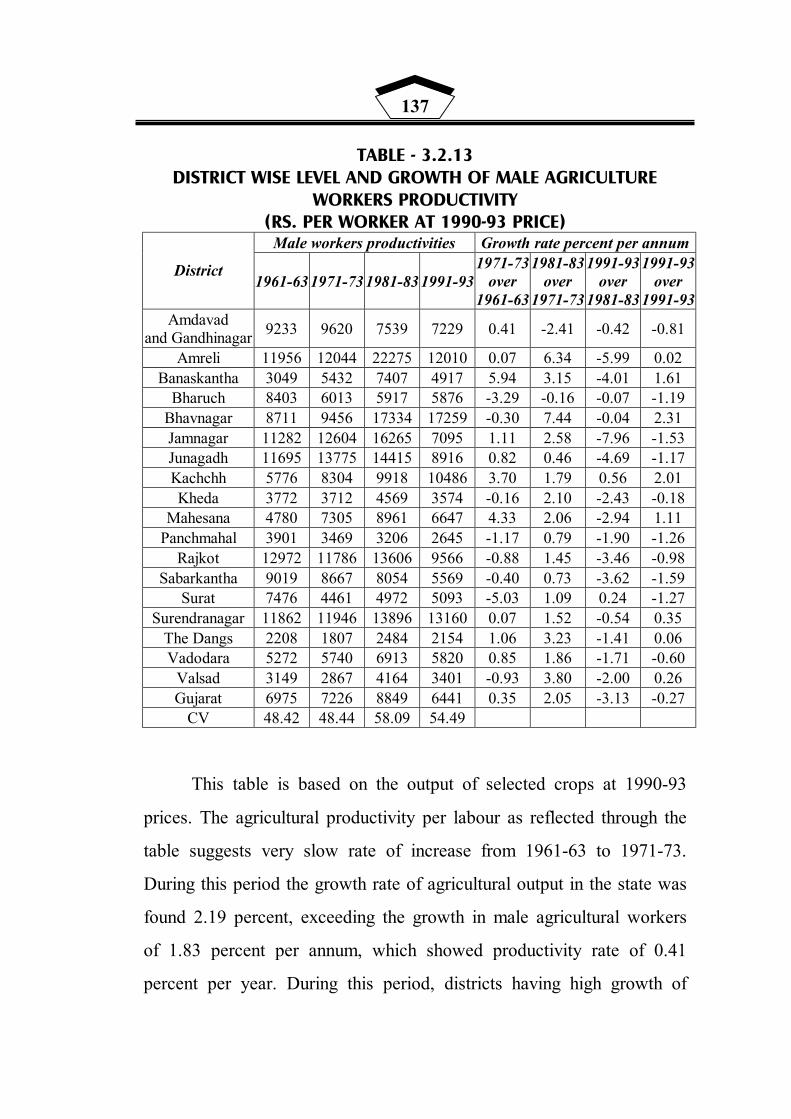
137
TABLE - 3.2.13 DISTRICT WISE LEVEL AND GROWTH OF MALE AGRICULTURE
WORKERS PRODUCTIVITY (RS. PER WORKER AT 1990-93 PRICE)
Male workers productivities Growth rate percent per annum
District 1961-63 1971-73 1981-83 1991-93
1971-73 over
1961-63
1981-83 over
1971-73
1991-93 over
1981-83
1991-93 over
1991-93 Amdavad
and Gandhinagar 9233 9620 7539 7229 0.41 -2.41 -0.42 -0.81
Amreli 11956 12044 22275 12010 0.07 6.34 -5.99 0.02 Banaskantha 3049 5432 7407 4917 5.94 3.15 -4.01 1.61
Bharuch 8403 6013 5917 5876 -3.29 -0.16 -0.07 -1.19 Bhavnagar 8711 9456 17334 17259 -0.30 7.44 -0.04 2.31 Jamnagar 11282 12604 16265 7095 1.11 2.58 -7.96 -1.53 Junagadh 11695 13775 14415 8916 0.82 0.46 -4.69 -1.17 Kachchh 5776 8304 9918 10486 3.70 1.79 0.56 2.01 Kheda 3772 3712 4569 3574 -0.16 2.10 -2.43 -0.18
Mahesana 4780 7305 8961 6647 4.33 2.06 -2.94 1.11 Panchmahal 3901 3469 3206 2645 -1.17 0.79 -1.90 -1.26
Rajkot 12972 11786 13606 9566 -0.88 1.45 -3.46 -0.98 Sabarkantha 9019 8667 8054 5569 -0.40 0.73 -3.62 -1.59
Surat 7476 4461 4972 5093 -5.03 1.09 0.24 -1.27 Surendranagar 11862 11946 13896 13160 0.07 1.52 -0.54 0.35
The Dangs 2208 1807 2484 2154 1.06 3.23 -1.41 0.06 Vadodara 5272 5740 6913 5820 0.85 1.86 -1.71 -0.60
Valsad 3149 2867 4164 3401 -0.93 3.80 -2.00 0.26 Gujarat 6975 7226 8849 6441 0.35 2.05 -3.13 -0.27
CV 48.42 48.44 58.09 54.49
This table is based on the output of selected crops at 1990-93
prices. The agricultural productivity per labour as reflected through the
table suggests very slow rate of increase from 1961-63 to 1971-73.
During this period the growth rate of agricultural output in the state was
found 2.19 percent, exceeding the growth in male agricultural workers
of 1.83 percent per annum, which showed productivity rate of 0.41
percent per year. During this period, districts having high growth of

138
output were associated with high growth of male agricultural workers
too. In the next decade of 1971-73 to 1981-83, growth rate of output
increased from 2.2 percent to 3.6 percent per annum. While the growth
rate of male agricultural workers, in that period showed deceleration
upto 1.56 percent. As a result MAW's productivity recorded higher
growth at 2.1 percent per annum. Among the districts, Amreli,
Jamnagar, Surendranagar and Rajkot recorded medium to high growth
and maintained their lead in workers productivity. Amreli, Bhavnagar,
Kheda, Dangs and Valsad recorded phenomenol growth ranging
between 3.2 to 7.4 percent annually in male workers productivity as
compared to very lower negative rates in the preceding period. This
could be largely attributed to the factor like large acceleration in output
growth in such districts between 1971-73 and 1981-83.
In the 1980s there is clear cut significant down fall in the
agricultural productivity along with declining trend in the growth of
male agricultural workers. The CV of male agricultural worker
productivity increased between 1971-73 to 1983. Consequently this CV
also showed declined from 58 to 54 percent, indicating that regional
disparities existing earlier are declining.
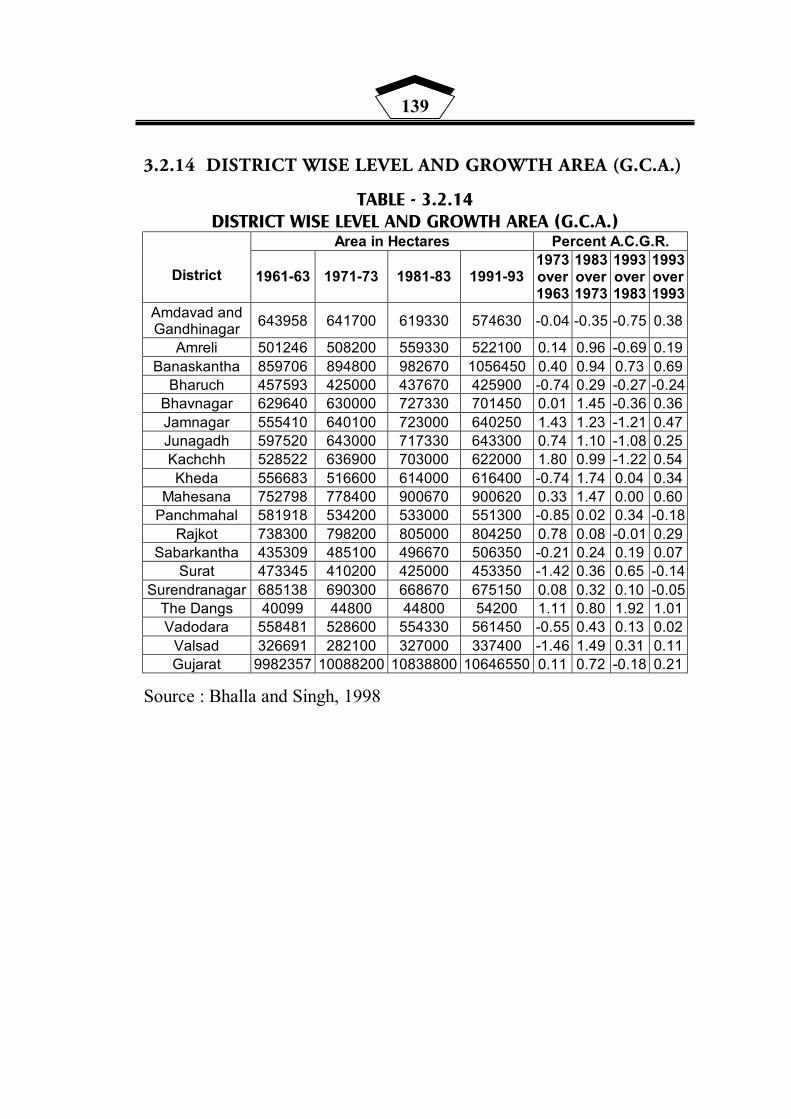
139
3.2.14 DISTRICT WISE LEVEL AND GROWTH AREA (G.C.A.)
TABLE - 3.2.14 DISTRICT WISE LEVEL AND GROWTH AREA (G.C.A.)
Area in Hectares Percent A.C.G.R.
District 1961-63 1971-73 1981-83 1991-93 1973 over 1963
1983 over 1973
1993 over 1983
1993 over 1993
Amdavad and Gandhinagar 643958 641700 619330 574630 -0.04 -0.35 -0.75 0.38
Amreli 501246 508200 559330 522100 0.14 0.96 -0.69 0.19 Banaskantha 859706 894800 982670 1056450 0.40 0.94 0.73 0.69
Bharuch 457593 425000 437670 425900 -0.74 0.29 -0.27 -0.24 Bhavnagar 629640 630000 727330 701450 0.01 1.45 -0.36 0.36 Jamnagar 555410 640100 723000 640250 1.43 1.23 -1.21 0.47 Junagadh 597520 643000 717330 643300 0.74 1.10 -1.08 0.25 Kachchh 528522 636900 703000 622000 1.80 0.99 -1.22 0.54 Kheda 556683 516600 614000 616400 -0.74 1.74 0.04 0.34
Mahesana 752798 778400 900670 900620 0.33 1.47 0.00 0.60 Panchmahal 581918 534200 533000 551300 -0.85 0.02 0.34 -0.18
Rajkot 738300 798200 805000 804250 0.78 0.08 -0.01 0.29 Sabarkantha 435309 485100 496670 506350 -0.21 0.24 0.19 0.07
Surat 473345 410200 425000 453350 -1.42 0.36 0.65 -0.14 Surendranagar 685138 690300 668670 675150 0.08 0.32 0.10 -0.05
The Dangs 40099 44800 44800 54200 1.11 0.80 1.92 1.01 Vadodara 558481 528600 554330 561450 -0.55 0.43 0.13 0.02
Valsad 326691 282100 327000 337400 -1.46 1.49 0.31 0.11 Gujarat 9982357 10088200 10838800 10646550 0.11 0.72 -0.18 0.21
Source : Bhalla and Singh, 1998
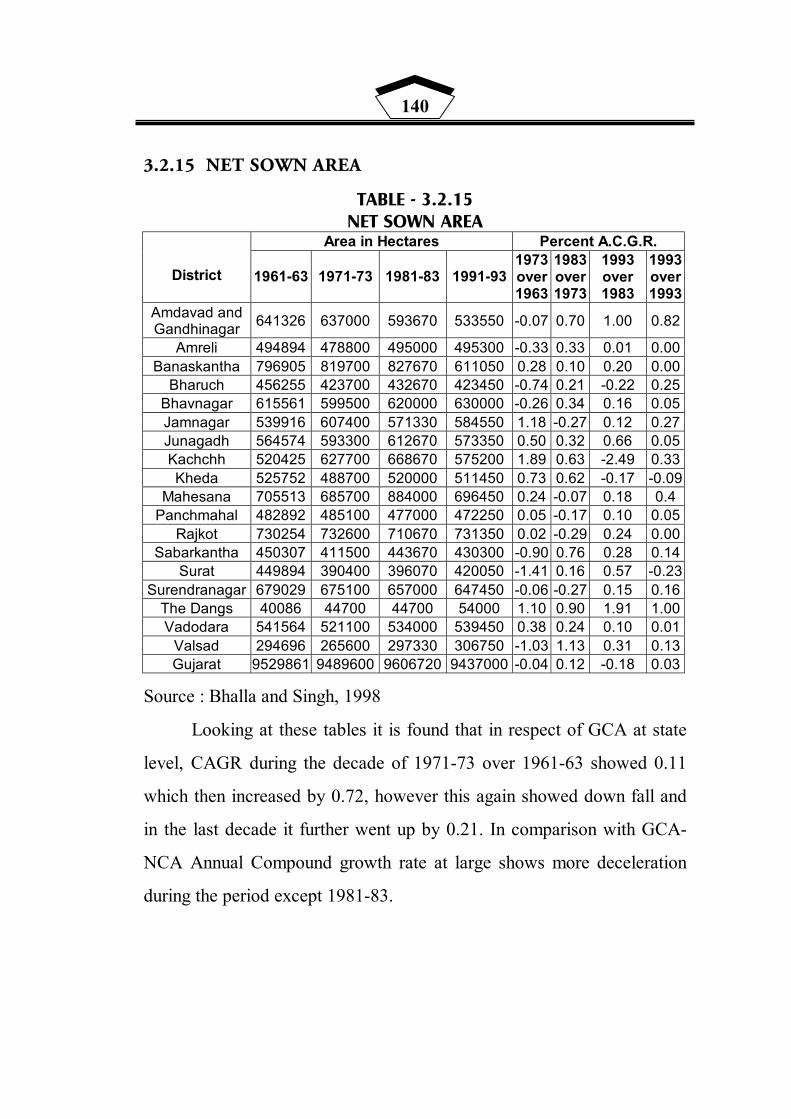
140
3.2.15 NET SOWN AREA
TABLE - 3.2.15 NET SOWN AREA
Area in Hectares Percent A.C.G.R.
District 1961-63 1971-73 1981-83 1991-93 1973 over 1963
1983 over 1973
1993 over 1983
1993 over 1993
Amdavad and Gandhinagar 641326 637000 593670 533550 -0.07 0.70 1.00 0.82
Amreli 494894 478800 495000 495300 -0.33 0.33 0.01 0.00 Banaskantha 796905 819700 827670 611050 0.28 0.10 0.20 0.00
Bharuch 456255 423700 432670 423450 -0.74 0.21 -0.22 0.25 Bhavnagar 615561 599500 620000 630000 -0.26 0.34 0.16 0.05 Jamnagar 539916 607400 571330 584550 1.18 -0.27 0.12 0.27 Junagadh 564574 593300 612670 573350 0.50 0.32 0.66 0.05 Kachchh 520425 627700 668670 575200 1.89 0.63 -2.49 0.33 Kheda 525752 488700 520000 511450 0.73 0.62 -0.17 -0.09
Mahesana 705513 685700 884000 696450 0.24 -0.07 0.18 0.4 Panchmahal 482892 485100 477000 472250 0.05 -0.17 0.10 0.05
Rajkot 730254 732600 710670 731350 0.02 -0.29 0.24 0.00 Sabarkantha 450307 411500 443670 430300 -0.90 0.76 0.28 0.14
Surat 449894 390400 396070 420050 -1.41 0.16 0.57 -0.23 Surendranagar 679029 675100 657000 647450 -0.06 -0.27 0.15 0.16
The Dangs 40086 44700 44700 54000 1.10 0.90 1.91 1.00 Vadodara 541564 521100 534000 539450 0.38 0.24 0.10 0.01
Valsad 294696 265600 297330 306750 -1.03 1.13 0.31 0.13 Gujarat 9529861 9489600 9606720 9437000 -0.04 0.12 -0.18 0.03
Source : Bhalla and Singh, 1998
Looking at these tables it is found that in respect of GCA at state
level, CAGR during the decade of 1971-73 over 1961-63 showed 0.11
which then increased by 0.72, however this again showed down fall and
in the last decade it further went up by 0.21. In comparison with GCA-
NCA Annual Compound growth rate at large shows more deceleration
during the period except 1981-83.
141
INDUSTRIAL ECONOMY OF GUJARAT :
Basically right from the inception the state economy is found
more prone to industry sector. In the year 1960 in the state total number
of working factories registered were 3649. Average number of workers
employed daily in working factories were 346462 with average number
of workers per factory 94-95. This number increased to 4534 showing
an increase of 885 - i.e. per year growth of 177 till 1965. In that five
year number of workers employed went up to 413782 which indicated
rise of 67320 per year increase of 13464 but average number of workers
per factory had declined to 91.26. In the year 1970 number of working
factories went upto 5544 - this expressed decadal change in the number
of factories of about 1895 i.e. decadal change in percentage 51.93.
Average number of workers employed daily were found in the number
of 437554. This showed change in the decade by 91092 - in percentage
this growth was of 26.29 percentages. If growth is examined per year it
tends to be of 9109. Average number of workers per factory was found
to the tune of 78.92 showing down fall of 16.03.
Industrial economy in the state has undergone different changes
more precisely in the 1980s. Compositional break up of industries in
Gujarat visualized during 1980s and in the beginning years of 1990s.
Detailed exposition on the industrial growth pattern is presented through
various tables highlighting pre reform scenario.

142
3.2.16 RELATIVE POSITION OF GUJARAT IN FACTORY
SECTOR IN INDIA - 1981 TO 1995 :
TABLE - 3.2.16
RELATIVE POSITION OF GUJARAT IN FACTORY SECTOR IN INDIA - 1981 TO 1995 :
Gujarat India Variable / year Value Percent Value Percent
Number of Factory : 1980-81 10206 10.6 96563 100 1985-86 10305 10.2 101016 100 1990-91 10943 9.9 110179 100 1994-95 12034 9.8(4) 123010 100
Invest - Capital : 1980-81 4398 9.4 46881 100 1985-86 8257 9.4 88112 100 1990-91 18696 9.6 194913 100 1994-95 38578 10 387535 100
Number of Employees : 1980-81 699427 9.1 1714679 100 1985-86 665746 8.0 7173515 100 1990-91 675448 8.3 8162504 100 1994-95 782908 8.0 (0) 9227097 100
Net value added : 1980-81 1139 9.5 11930 100 1985-86 2152 9.2 23266 100 1990-91 4468 8.67 51515 100 1994-95 12359 11.4(2) 108517 100
Source : Govt. of India, Annual Survey of Industries - Summary Result
for Factory Sector - Various Volumes, Govt. of India.
143
Table 3.2.16 indicates position of Gujarat in relation to India. This
has been presented through from major variables like number of
factories, invested capital, number of employees and net value added.
This table provides the data covering the period of 1980-81 to 1994-95.
As presented in the table number of units went on increasing through
every quarter of five years. However quantitative increase during 1980's
was not so significant like what is observed during the first phase of
1990s. It is also found that percentage share of number of factories to
the total of India shows decelerating trend over the period of time.
While capital invested in amount shows continuous positive trend
and decadal change in this respect is reported to be of 14298 crore
showing 325.10 percentage increase in the capital percentage share in
capital invested to the total of India shows little positive change through
the period.
Regarding number of employed - it tends to have decelerating
trend through out the decadal period during 1980-81 to 1990-91. There
was marked decrease of 23979 i.e. showing percentage change of 3.43.
However decadal change if examined in respect of 1985-86 to 1994-95 -
it showed an increase of 1,17,162 - suggesting an improvement 17.60
percentage over the decade. However in relation to India employment
share in percentage to total India shows declining one at every quarter of
1980s.
Net value added if taken into consideration suggests constant
positive and this tends to be at an increasing rate. From 1980-81 to
1990-91, the decade shows a change of 3,329 i.e. 292.27 percentage
increase. While this change is examined in respect of decade between

144
1985-86 to 1994-95 shows an increase of 10,207 i.e. 474.30 percentage.
Percentage share to the total India in this respect showed decelerating
one from 1980-81 to 1991, however in the 1995-96 this increased again.
As mentioned in parenthesis in the table the state enjoyed 4th rank in all
India in 1994-95 in respect of number of working factories, 4th position
in Net Value Added.
3.2.17 INTER SCALE GROWTH OF INDUSTRIAL SECTORS
IN GUJARAT (ANNUAL COMPOUND RATE OF
GROWTH IN PERCENTAGE)
TABLE - 3.2.17 INTER SCALE GROWTH OF INDUSTRIAL SECTORS IN GUJARAT (ANNUAL COMPOUND RATE OF GROWTH IN PERCENTAGE)
Sector 1985-86 to 1990-91
1990-91 to 1995-96
1985-86 to 1995-96
Number of Factories : Small Scale 9.48 8.26 8.87 Medium and Large 10.55 14.45 12.48 Factory Sector (1+2) 9.49 8.32 8.9
Investment : Small Scale 14.15 13.22 13.68 Medium and Large 14.58 23.38 18.90 Factory Sector (1+2) 14.52 22.08 18.24
Employment : Small Scale 7.79 7.22 7.55 Medium and Large 10.31 12.34 11.22 Factory Sector (1+2) 8.40 8.61 8.50
Source : Data collected. Compiled from DICS - Commissioner of Industries, Government of India.
145
Above table shows - prior to the implementation of new economic
policy the state in respect of growth in industrial economy was relatively
sound. Category wise if examined annual compound of growth is found
higher in medium and large scale - in comparison with small-scale units.
All the three variables show the similar trend. Temporal trends suggest
very clearly that in comparison with first half of 1990s, the second half
of 1980s had more state in small scale. Decadal growth rate if examined
also shows clearly dominance of medium and large scale in the
aggregate growth process. This includes not only growth in physical
numbers but also the growth in amount invested and worked employed.

146
3.2.18 INDUSTRIAL INVESTMENT IN GUJARAT IN
MEDIUM AND LARGE SCALE INDUSTRIES :
TABLE - 3.2.18 INDUSTRIAL INVESTMENT IN GUJARAT IN MEDIUM AND LARGE
SCALE INDUSTRIES STATUS 1-1-83 to
31-12-1990 1-1-91 to 30-4-1996
Percentage increase
(A) Projects Sanctioned : Number of Projects 886 4423 - Annual Average Number of Projects
110.75 829.83 649.25
Investment (Rs. crore) 21378 170169 Average annual investment 2072.25 31926.64 1094.25 Employment potential 141637 8436.73 Average annual employment 17704 158287.61 794.07 (B) Projects Commissioned : Number of Projects 328 1182 - Annual Average Number of Projects
41 221.76 440.87
Investment (Rs. crore) 4760 14923 Average annual investment 595 2799.6 470.55 Employment potential 47788 199353 Average annual employment 5973.5 37402.1 426.18 (C) Projects under implementation : Number of Projects 52 2852 - Annual Average Number of Projects
6.51 535.8 6130.2
Investment (Rs. crore) 5260 124903 Average annual investment 670 23433.9 3497.46 Employment potential 9044 418160 Average annual employment 1130.5 78454.1 694.28
Source : Report from Monitoring Division, Udyog Bhavan, Section 11,
Govt. of Gujarat, Gandhinagar.

147
Table 3.2.18 highlights growth trends observed exclusively of
medium and large scale industries. This refers to the period of 1-1-1983
to 31-12-1990 and 1-1-1991 to 30-4-1996. Mainly three variables -
progress is presented. It includes number in aggregate and annual
average number, investment and annual average investment and
employment in numbers and average annual employment. This table
presents the scenario in terms of physical progress i.e. it provides data
on projects sanctioned, projects commissioned and projects under
implementation. Percentage change in average of each variable is also
presented to understand the trend of change.
It is revealed from the table that medium and large-scale units
tend to perform better during the first half of 1990s in comparison with
the period of 1980s. Also it is observed that projects under
implementation are going to have much higher growth in all the
variables as against the projects commissioned. This also thereby
reflects the investment climate found more conducive to the medium
and large scale during the first half of 1990s in comparison with 1980s.

148
3.2.19 CONCENTRATION RATIO OF TOTAL INVESTMENT
FOR TOP 25 TALUKAS OF GUJARAT (PERCENTAGE
INVESTMENT)
TABLE 3.2.19 CONCENTRATION RATIO OF TOTAL INVESTMENT FOR TOP 25
TALUKAS OF GUJARAT (PERCENTAGE INVESTMENT) Sectoral Temporal Classi- fication
TOP 5 Talukas
TOP 10 Talukas
TOP 15 Talukas
TOP 20 Talukas
TOP 25 Talukas
Others Total
Small Scale :
1986 48.70 61.15 69.03 74.41 78.69 21.31 100
1991 45.59 57.03 65.39 70.83 74.84 25.16 100
1996 44.36 56.43 63.67 69.62 74.11 25.89 100
Medium and Large :
1986 69.98 82.70 91.25 96.01 97.67 2.33 100
1991 61.87 78.60 84.81 89.51 93.18 6.82 100
1996 61.11 73.45 80.73 85.47 89.02 10.98 100
Total (Factory Sector) :
1986 65.80 78.03 86.04 90.86 93.41 6.59 100
1991 57.72 73.87 80.28 85.22 89.09 10.91 100
1996 58.89 71.01 77.80 82.45 86.13 13.87 100 Source: Data collected. Compiled from DICS - Commissioner of Industries, Government of India.
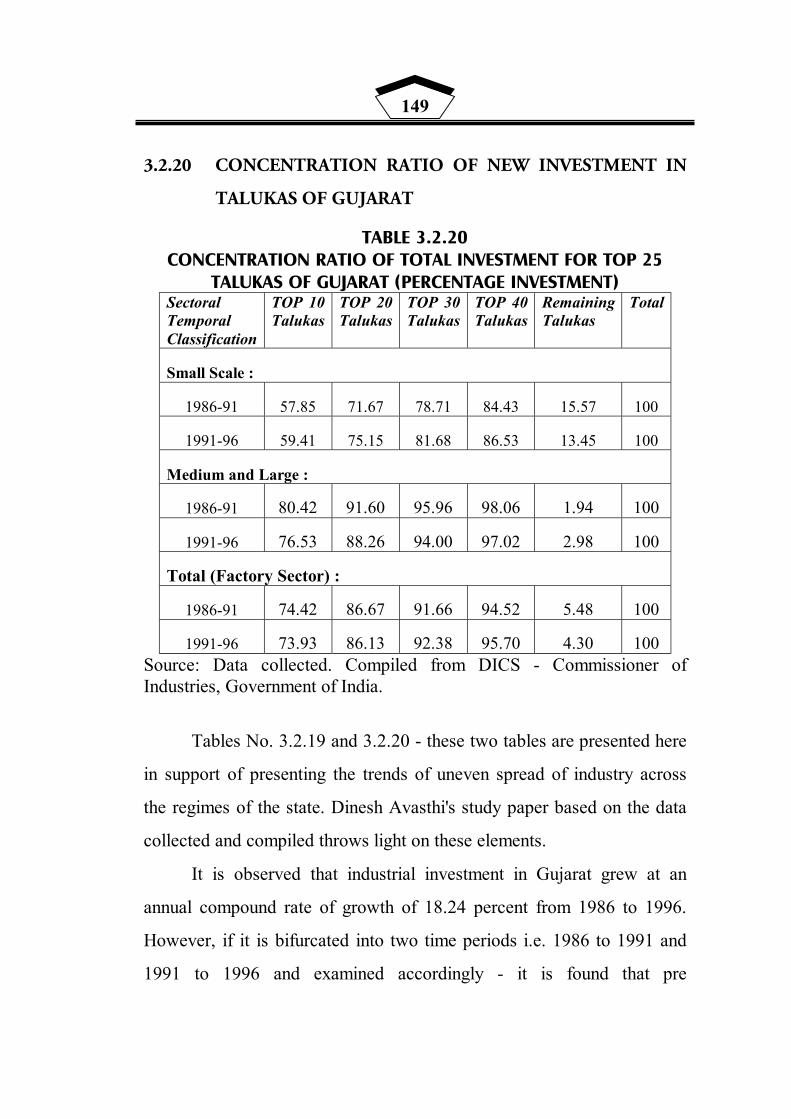
149
3.2.20 CONCENTRATION RATIO OF NEW INVESTMENT IN
TALUKAS OF GUJARAT
TABLE 3.2.20 CONCENTRATION RATIO OF TOTAL INVESTMENT FOR TOP 25
TALUKAS OF GUJARAT (PERCENTAGE INVESTMENT) Sectoral Temporal Classification
TOP 10 Talukas
TOP 20 Talukas
TOP 30 Talukas
TOP 40 Talukas
Remaining Talukas
Total
Small Scale :
1986-91 57.85 71.67 78.71 84.43 15.57 100
1991-96 59.41 75.15 81.68 86.53 13.45 100
Medium and Large :
1986-91 80.42 91.60 95.96 98.06 1.94 100
1991-96 76.53 88.26 94.00 97.02 2.98 100
Total (Factory Sector) :
1986-91 74.42 86.67 91.66 94.52 5.48 100
1991-96 73.93 86.13 92.38 95.70 4.30 100 Source: Data collected. Compiled from DICS - Commissioner of Industries, Government of India.
Tables No. 3.2.19 and 3.2.20 - these two tables are presented here
in support of presenting the trends of uneven spread of industry across
the regimes of the state. Dinesh Avasthi's study paper based on the data
collected and compiled throws light on these elements.
It is observed that industrial investment in Gujarat grew at an
annual compound rate of growth of 18.24 percent from 1986 to 1996.
However, if it is bifurcated into two time periods i.e. 1986 to 1991 and
1991 to 1996 and examined accordingly - it is found that pre

150
liberalization period showed the growth of 14.52 percent while post
liberalization period demonstrated the growth much higher - 22.08
percent. But most important point of concern is the spread of industries
across the regime. This suggests very clearly uneven spread in this
regard.
Table 3.2.19 provides concentration ratios for the share of TOP
25 talukas in investment. These talukas account for over three quarters
of the share of investment in small-scale sector, 89.02 percent of
medium and large scale sector and about 80 percent of aggregate
industrial investment in Gujarat. In 1986 the corresponding figures were
78.09 percent, 97.67 percent and 93.41 percent. The residual investment
was spread across all the 159 talukas. There was found modest decline
in concentration ratios between 1986 and 1996, even in 1996-97 the
TOP 5 talukas account for 44.36 percent of investment in small scale
sector, 61.11 percent in medium and large scale units and 58.59 percent
of aggregate factory sector.
The second table (Table No. 3.2.20) highlights the pattern almost
similar to that of concentration ratios showed in the previous table.
However intensity in that respect is found much higher in this table. It is
found that investments instead of getting dispersed over space - have got
further concentrated from 94.25 in 1986-91 and 1991-96.
Scale wise the ratios examined suggest that for small scale - the
TOP 10 talukas accounts for almost 58 percent of the investment during
the first incentive block of 1986 to 1991 and 59.41 percent between
1991 to 1996. The corresponding figures for medium and large scale
were 80.42 percent and 76.53 percent and for factory sector the figures
151
were 74.42 percent and 73.93 percent. It is true that investments have
flowed to 13 backward talukas but the magnitude of this shift is
negligible. The first 40 talukas of 1986-91 continued to gain over 86
percent of the new investments and the 13 new entrants could get only
9.87 percent of investments. This trend is found almost the same in case
of small scale units and temporal examination under the beginning of
reform also suggest the same trend. The TOP 40 talukas continued to
hold prime position in attracting new investments. During 1991 to 96
period it was of about 80.52 percent share against 84.43 percent during
1986-91.

152
3.2.21 POLARITY OF INVESTMENTS IN FACTORY SECTOR ACROSS TALUKAS SURROUNDING GROWTH POLES IN GUJARAT
TABLE - 3.2.21
POLARITY OF INVESTMENTS IN FACTORY SECTOR ACROSS TALUKAS SURROUNDING GROWTH POLES IN GUJARAT
1986 1991 1996 Pole Investment Share
in State
Investment Share in
State
Investment Share in
State
Amdavad 181997 24.43 247578 16.68 494021 12.42
Vadodara 24539 03.29 69128 4.71 609700 15.33
Bharuch 92090 12.36 119113 8.12 412074 10.36
Surat 220943 29.66 492639 33.58 1311106 32.96
Valsad 27057 3.63 53389 3.64 130528 3.28
Rajkot 16967 2.28 25064 1.71 37562 0.94
Jamnagar 1276 0.17 11962 0.82 19563 0.49
Bhavnagar 1141 0.15 2847 0.19 22069 0.55
Pole Total 565960 75.98 1021720 69.64 3036623 76.33 Gujarat Total 744834 100 1467117 100 3978275 100
Source : Industrial Extension Bureau (Monitoring Division) Government of Gujarat, Gandhinagar.
Looking at the investment flow by district - it is observed that
there is an element of polarity found in the investments pattern. This
suggests stronghold of specific polarity regime in Gujarat state in
industrial investments. Based on study of several districts across the
regime - the data is collected - compiled accordingly. A decade of 1986
to 1996 is segregated into 3 time period with specific year i.e. 1986,
1991 and 1996.
153
Looking at the table, it is clearly found that in all the three years
specified Surat holds the scenario with maximum percentage share in
the state to the total investments. Amdavad has continued its hold
though the percentage share over the time tends to decline. Vadodara
has improved the condition significantly during the reform period in
comparison with pre reform period. Bharuch shows fluctuations over the
period of time. No pole as such in Saurashtra has shown improvement in
this regard. Only during 1991 - Jamnagar showed an exception to the
declining trend that it could be attributed to the single are Reliance
Refinery. Bhavnagar in comparison with Rajkot and Jamnagar has
shown continuous better performance.
INFRASTRUCTURE IN THE STATE ECONOMY :
Infrastructure is the basic input of development for any economy.
Historically it is found that one of the major obstacles to the growth of
economy - in less developed regions is neglect of infrastructure. At
global level what is observed also holds true at regional level.
Infrastructure has assumed greater significance in planning and policy
formulations at state level very late. However Gujarat state in
comparison with most of the other states found to have well placed as
regards the development of infrastructure.
There have been several studies under taken earlier to examine
the level and nature of relationship between infrastructure and
productivity. Though none of the studies have concluded with strong
and assured positive relationship between the two, equally important is
the observation made in the studies reveals that there is no derying the

154
fact that infrastructure like roads, transport, power, telecommunications
- bottlenecks have had an adverse impact on Indian economy. It is in this
regard important to have a view on the development practices that are
visualized in respect of infra-structural facilities in a relatively highly
progressive state like Gujarat.
Post liberalization in particular and in general an attempt is to be
made in the following chapter to understand and examine the pattern of
infrastructure development in the state. But to have a view at the back of
mind for study purpose following elaborative analysis would be helpful.
In Gujarat the sectoral allocation of plan outlay shows a trend
similar to national allocation pattern. Transport and communication
received decreasing share over plan periods. In the second plan it was
18.13 percent which was brought down to 9.66 percent in the third and
further to 8.38 percent in the fourth plan. Though one percentage share
increased to 11.29 percent in the fifth plan, it has been declining
thereafter. It was 9.17 in sixth, 6.56 in seventh and 5.57 percent in
eighth plan.
It is also observed that there is a decline in the overall share of the
states. Gujarat share, from the central plan, to transport and
communication fell from 2.17 percent in sixth plan to 079 percent in
eighth plans.
Total road length in Gujarat state was reported of 13154 kms in
1151 from which percentage share of national highways was only 4.54,
in 1961 road length increased to 2262 i.e. showing an increase of 9475
kms however from this percentage share of national highways was only

155
4.44. In the year 1974 this percentage share further declined to 3.47 in
1985 to 2.46 and in the year 1995 to 2.22.
By category of roads in percentage share to total, it was found that
in 1951, other district roads, village roads and major district roads hold
the scenario with 35.58 percentage, 27.82 percentage and 20.60
percentage respectively. There was slight interchange in the hold in
1961 with other district roads, 30.97 percentage, major district roads
with 26.89 percentage and village roads with 19.91 percentage. In 1970
and 1980 village roads shared the largest with 26.79 and 29.85
percentage followed by other district roads with 26.13 and 23.43 percent
respectively.
In the year 1990 major district roads shared the largest with 33.45
percentage, followed by village roads 23.81 percentage and state
highways with 25.06 percentage. In the year 1951 in the state 50.32
percentage roads were surfaced one in 1961 this went upto 52.73, again
in 1974 it was 60.27 percent and in 1985 83.40 percentage surface roads
and in 1990 this percentage increased to 88.00 percentage.
Communication also plays key role in respect of development of
economy, considering various modes of communication the state is
found to be progressive. In the year 1950-51 number of post offices in
the state was 1199 which went upto 3494 showing an increase of 2295
offices in percentage the growth was of 191.41 percentage. In 1970-71
this number was 6715 reporting an increase of 3221 - percentage
increase by 92.18 percentage. In the year 1980-81 number of post
offices 25.31 percentage increase in 1990-91, there was an increase of
only 272 suggesting 3.47 percentage growth.
156
As against this decadal change in percentage in case of telephone
offices was found of +230.50% from 1951 to 1961, +325.31% between
1961 to 1971, +117.92% between 1971 to 1981 and +127.82 percentage
between 1981 to 1991. Growth rate from 1980-81 to 1995-96 is found to
the tune of 10.01.
As regards banking operations decadal change in 1970s was
found to the tune of 121.96% in bank offices, 402.55% in deposits and
393.38% in bank credit, this change in 1980s was observed in
percentage of 45% in bank offices, 331.64% change in deposits and
319.93 percentage increase in bank credit.
Power generation in the state increased by 1731 MW between
1961 to 1969 and by 5792 MW between 1969 to 1978 while between
1978 to 1990 this increased by 14,765 MW. During 1990s this again
went up by 26545 MW.

157
3.2.22 OCCUPATIONAL DISTRIBUTION BY BROAD
INDUSTRY GROWTH
TABLE - 3.2.22 OCCUPATIONAL DISTRIBUTION BY BROAD INDUSTRY GROWTH
Category Unit 1971 1981 1991 2001
Total cultivators Lakh 36.20 41.15 47.04 47.11
Percentage to total workers % 43.12 37.46 33.37 27.67
Total Agricultural labourer Lakh 18.88 24.88 32.31 30.48
Percentage to total workers % 22.49 22.65 22.92 17.91
Workers engaged in Household
industries
Lakh 2.36 2.69 1.97 3.06
Percentage to total workers % 2.81 2.45 1.40 1.80
Workers engaged in other
activities
Lakh 26.52 41.15 59.64 89.59
Percentage to total workers % 31.59 37.43 42.30 52.62
Total main work Lakh 83.96 109.87 140.95 170.25
Percentage to total population % 31.45 32.22 34.12 33.58 Source : Basic Statistics - Gujarat and India - 2003. Directorate of Economics & Statistics, Govt. of Gujarat, Gandhinagar and Socio-Economic Review, 2005.
This table provides data on occupational distribution by broad
industry groups. Main workers of the state as per census reports are
classified mainly into 4 categories. Number of workers in respective
category and percentage to main workers are highlighted in the table.
Important observations from the table are as under :
(A) Occupational structure in the state shows decadal variations -
indicating changing pattern of occupation. It is clearly found from

158
the table that under the reform period i.e. during 1990s clean shift
from agriculture to non-agriculture in broad respect has taken
place considering both number of cultivators and agricultural
labourers - the two in combined and separately has less number of
percentage to the total workers in 1990s.
(B) Having a look at category wise - year wise picture, it is reflected
in the table that number of cultivators in the state has increased
over the decade. However, this again shows sharp fluctuation in
increase over the decade between 1971 to 1981 there is an
increase of 4.95 lakh - this rate of increase further went to 5.89
lakh during 1981 to 1991 but in the last decade this shows very
little increase 0.07 thousand only. This indicates decadal change
in percentage of 13.67 (between 1971 to 1981), 14.31 percentage
(between 1981 to 1991) and 0.08 percentage (between 1991 to
2001). This reflects average growth by decade of 9.35 percentage.
Number of cultivators when examined in percentage to
total workers shows continuous declining trend over the decade. It
is observed that change in the decade of 1970s i.e. between 1971
to 1981 shows decrease of 6.6 percentage point, between 1981 to
1991 it showed fall by 4.09 percentage point and lastly between
1991 to 2001, this falling rate was considerably more indicating -
9.70 percentage point. Thus it is clearly found that decadal trends
show declining strength of cultivators in terms of occupation.
(C) Second category is of agricultural labourers. This shows an
increase in number of labourers beginning from 1971 to 1991.
This increase in number between 1971 to 1981 is reported of 6.00
159
lakh, between 1981 to 1991 it increased by 7.43 lakh and in the
last decade unlike earlier trends it registered fall of 1.83 lakh.
Change in the growth over the decade in respect of number of
cultivators in percentage reveal that between 1971 to 1981 there
was change of 33.33 between 1981 to 1991, 29.16 percentage
change and between 1991 to 2001 change in percentage was -
3.12. This tends to have an increase of 11.40 lakh in 30 years
showing annual average growth of 38,000.
Total agricultural labourers when examined in percentage
to total main workers the trend shows increase by +0.16 and
+0.27 during the first two decades but in the last decade unlike
earlier trends it demonstrated fall of -5.1 percentage point.
Comparative look at the first two category shows clearly
more shift in number and percentage in both the categories - from
which number4 of cultivators showing less rate of fluctuations as
against that is found in case of agricultural labourers.
(D) It is worthwhile to have a broaden look at the third and fourth
category household industry workers and other workers. In other
activities large chance falls in the precise category of service
sector, which refers to transport, storage, communication, trade,
social and financial services. Some fraction of other category can
be absorbed in household category - more precisely those engaged
in small manufacturing and or processing units.
It is clearly found that other activities in particular hold the
scenario as long as occupational trend of main workers is
concerned. In number the change over the decade in this sector

160
shows +14.63 lakh between 1971 to 1981, +18.49 lakh between
1981 to 1991 and +29.95 lakh between 1991 to 2001. Change in
percentage over the decade is showing +55.16, +31.00 and +50.22
percentage change over the decade respectively.
The most significant element is found in case of percentage
number of workers engaged in other activities to total workers. This
clearly shows increasing tendency towards tertiary sector for
occupational purpose. This trend is found in conformity to that which is
observed in most of the developing nations including India.
If the compositional break up in terms of occupation of workers
by residence is examined it also suggest more rapid changes and more in
numbers in urban set up in comparison with rural set up. From the year
2001 census report this can be understood and analysed more clearly.

161
TABLE - 3.2.23
WORKERS CLASSIFICATION BY RESIDENT
Total workers 17025074
Rural workers in percentage to total 65.28
Urban workers in percentage to total 34.72
Cultivators - Total 4711094
Rural in percentage to total 98.02
Urban in percentage to total 1.08
Agricultural labourer - Total 3048713
Rural in percentage to total 65.82
Urban in percentage to total 04.18
Workers in household industry - Total 306139
Rural in percentage to total 60.65
Urban in percentage to total 39.05
Other workers - Total 8959128
Rural in percentage to total 37.83
Urban in percentage to total 62.17
This table illustrates the fact that from amongst total number of
main workers 65.28 percentage of the main workers are in rural India
while 34.72 percentage of workers are found in urban India.
Interestingly even in 2001 that is after the implementation of
reforms - rural Indian has not seen significant change in the occupation
pattern. As presented in the table agrarian economy is still the largest
source of work for rural Indian. It is only in tertiary sector that urban
workers are found having dominance.
162
From total number of rural workers i.e. 111140415 - 7539298 are
found have activities in agricultural labourers i.e. 67.83 percentage of
rural workers still depend on agriculture. It is also observed that from
the total of 35,74,743 engaged in non-agriculture activities - 33,89,071
i.e. 94.80 percentage of rural non-agricultural workers and 30.49
percentage to total rural workers are found to have engaged in other
activities. This signifies that household industries and related work does
not hold much significance either in rural economy of urban economy.
CONCLUSION :
This entire chapter was devoted to historical, geographical ground
of Gujarat State - followed by changes in the demographic
characteristics, more importantly for the purpose of reference and to
have more precise analysis in details of the reform period. This chapter
also provided general trend of growth in respect of level and nature of
growth being observed during the period of 1960 to 1990. This chapter
prepared the ground to have analytical presentation in detail, covering
all aspects of economy.
163
REFERENCES :
(1) Statistical Atlas of Gujarat - Volume-1 - Director of Bureau of
Economics and Statistics, Govt. of Gujarat, Gandhinagar, 1982.
(2) Statistical Abstract of Gujarat State - 2002 - Director of Bureau of
Economics and Statistics, Govt. of Gujarat, Gandhinagar.
(3) Level and Pattern of Economic Growth in Gujarat - 109--1994 -
Sudarshan Iyengar - Gujarat Institute for Development and
Research, January 2000.
(4) Road - Transport and Communication in Gujarat - Arti Nanavati -
Occasional Paper, G.I.D.R. Amdabad, January 2000.
(5) Agriculture in Gujarat - Problems and Prospects - Niti Mathur, S.
P. Kashyap - Economic and Political Weekly, August -
September, 2000.
(6) Recent changes in Gujarat Industry - Dinesh Avasthi, Economic
and Political Weekly - August - Sept. 2000.
(7) Socio-Economic Review, Gujarat State, Reports of 1991 to 2005.
Directorate of Economics and Statistics, Govt. of Gujarat,
Gandhinagar.

164
CHAPTER - 4
ANALYTICAL STUDY OF ECONOMIC GROWTH IN
GUJARAT UNDER REFORM PERIOD
SECTION - I ACGR - GSDP PER-CAPITA GSDP SECTION - II ACGR - NSDP PER-CAPITA NSDP SECTION - III QUINQUENNIUM COMPOUND GROWTH RATE SECTION - IV GSDP - NSDP AT 1993-94 PRICE SECTION - V PER-CAPITA GSDP - NSDP SECTION - VI SECTORAL SHARE IN GSDP SECTION - VII AGRICULTURAL GROWTH IN GUJARAT SECTION - VIII INDUSTRIAL GROWTH IN GUJARAT SECTION - IX ECONOMIC INFRASTRUCTURE IN GUJARAT SECTION - X SOCIAL SECTOR DEVELOPMENT IN GUJARAT SECTION - XI BROAD ECONOMIC INDICATORS OF GUJARAT SECTION - XII GROWTH AND PUBLIC FINANCE - GUJARAT AT A GLANCE SECTION - XIII ECONOMIC GROWTH AND NATURAL CALAMITY

165
CHAPTER - 4
ANALYTICAL STUDY OF ECONOMIC GROWTH IN
GUJARAT UNDER REFORM PERIOD
This chapter provides detailed exposition on the level and pattern
of economic growth in Gujarat visualized under the reform period. The
chapter is divided into thirteen sections, which includes broad structural
composition of growth besides data analysis of each sub sector of the
economy. It follows as under :
SECTION - I
ACGR - GSDP PER-CAPITA GSDP
This section includes data on Annual Compound Growth Rate in
GSDP and per-capita GSDP during the period of 1980s and 1990s.
There are total 8 tables in this section (Table 4.1 to 4.8)
There are graphical presentation which shows comparative picture
of GSDP and per-capita GSDP.
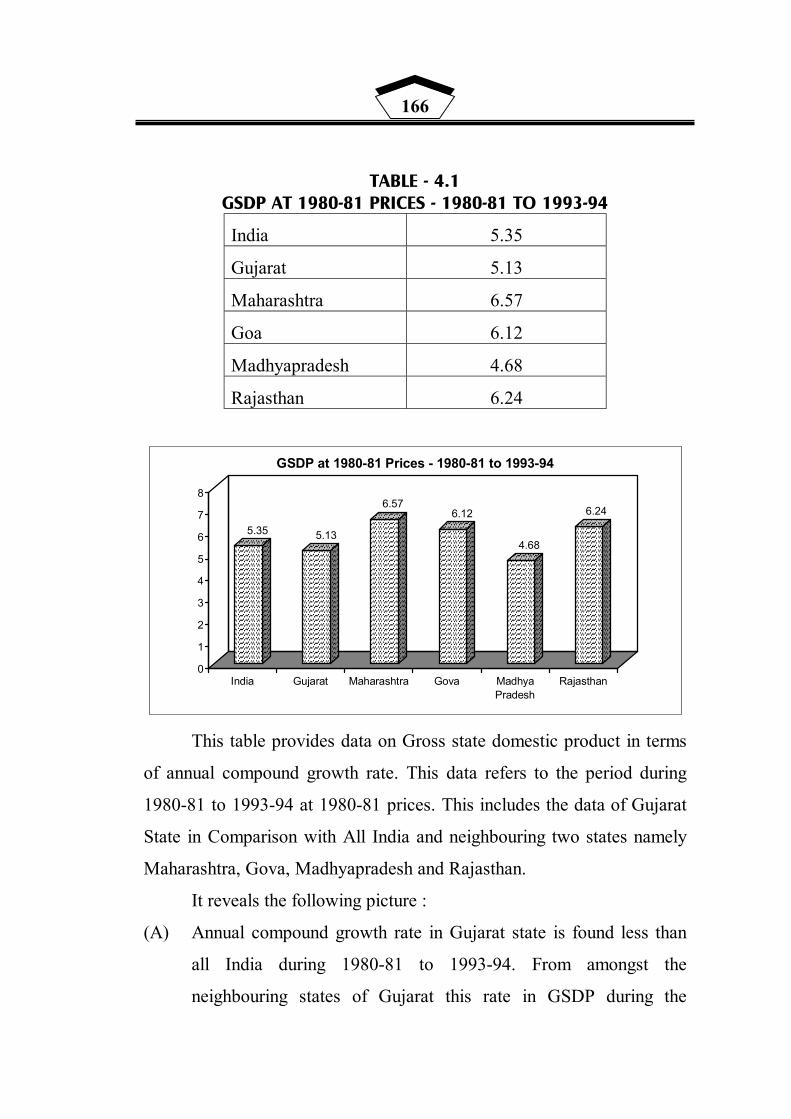
166
TABLE - 4.1 GSDP AT 1980-81 PRICES - 1980-81 TO 1993-94
India 5.35
Gujarat 5.13
Maharashtra 6.57
Goa 6.12
Madhyapradesh 4.68
Rajasthan 6.24
������������������������������������
������������������������������������������������������������������������������������������������������������
���������������5.35 ������������������������������������
������������������������������������������������������������������������������������������������������������
���������������5.13
��������������������������������������������
�������������������������������������������������������������������������������������������������������������������������
���������������6.57����������������������������������������
��������������������������������������������������������������������������������������������������������������
��������������6.12
��������������������������������
������������������������������������������������������������������������������������������������
���������������4.68
��������������������������������������������
��������������������������������������������������������������������������������������������������������������
������������������������������6.24
0
1
2
3
4
5
6
7
8
India Gujarat Maharashtra Gova MadhyaPradesh
Rajasthan
GSDP at 1980-81 Prices - 1980-81 to 1993-94
This table provides data on Gross state domestic product in terms
of annual compound growth rate. This data refers to the period during
1980-81 to 1993-94 at 1980-81 prices. This includes the data of Gujarat
State in Comparison with All India and neighbouring two states namely
Maharashtra, Gova, Madhyapradesh and Rajasthan.
It reveals the following picture :
(A) Annual compound growth rate in Gujarat state is found less than
all India during 1980-81 to 1993-94. From amongst the
neighbouring states of Gujarat this rate in GSDP during the
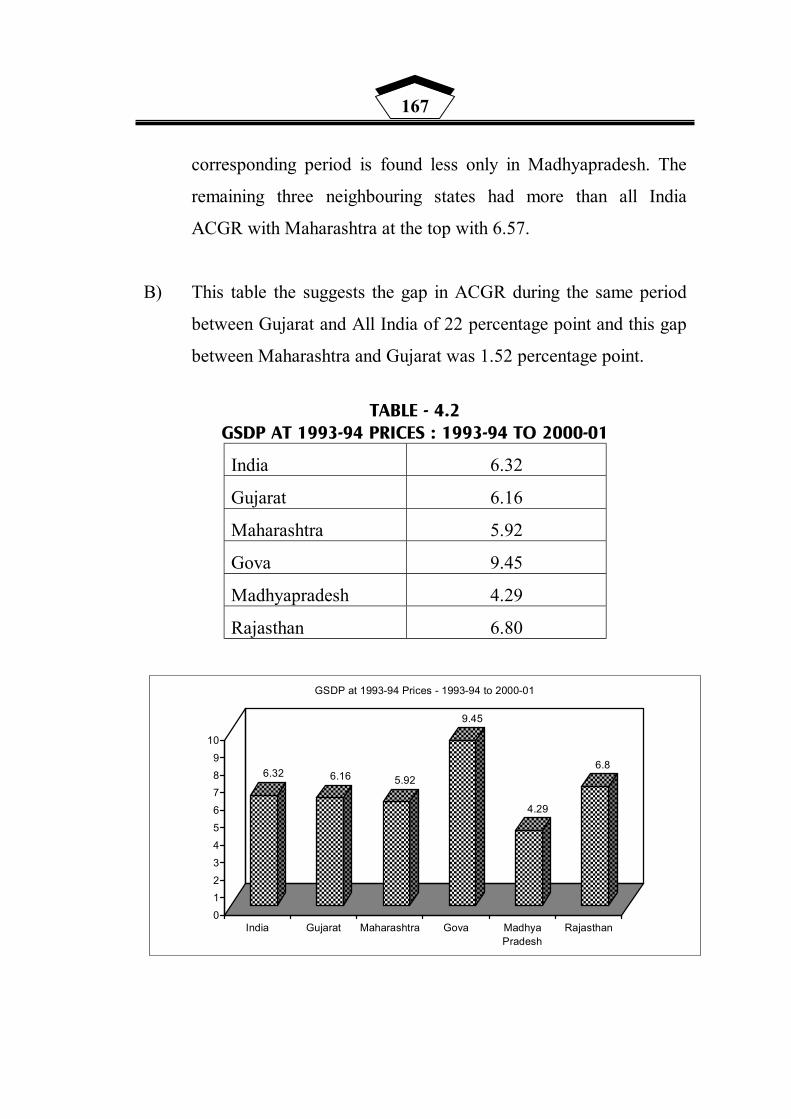
167
corresponding period is found less only in Madhyapradesh. The
remaining three neighbouring states had more than all India
ACGR with Maharashtra at the top with 6.57.
B) This table the suggests the gap in ACGR during the same period
between Gujarat and All India of 22 percentage point and this gap
between Maharashtra and Gujarat was 1.52 percentage point.
TABLE - 4.2
GSDP AT 1993-94 PRICES : 1993-94 TO 2000-01
India 6.32
Gujarat 6.16
Maharashtra 5.92
Gova 9.45
Madhyapradesh 4.29
Rajasthan 6.80
������������������������������������
���������������������������������������������������������������������������������������������������
��������������6.32 ������������������������������������
����������������������������������������������������������������������������������������
����������������������������
6.16 ������������������������������������
����������������������������������������������������������������������������������������
����������������������������
5.92
����������������������������������������������������
������������������������������������������������������������������������������������������������������������������������������������
����������������������������
9.45
����������������������������
������������������������������������������������������������������������
������������������������������
4.29
����������������������������������������
������������������������������������������������������������������������������������������������������������
������������������������������
6.8
0123456789
10
India Gujarat Maharashtra Gova MadhyaPradesh
Rajasthan
GSDP at 1993-94 Prices - 1993-94 to 2000-01

168
This table reflects ACGR in GSDP at 1993-94 prices of the period
1993-94 to 2000-01. This also provides data of Gujarat State in
comparison with all India and 4 neighbouring states like Maharashtra,
Gova, Madhyapradesh and Rajasthan.
It is found from he table that -
(A) ACGR of GSDP of Gujarat at 1993-94 prices was also lower than
that of All India from amongst the neighbouring states only Gova
and Rajasthan.
(B) Madhyapradesh from amongst these five states was again at the
bottom with 4.29
(C) The gap between Gujarat and All India was found of -16
percentage point, while in comparison with Maharashtra during
this period Gujarat reported the difference of +.24 percentage
point.
Looking at the table 4.1 and 4.2 it can be stated that time series
reveal the difference of +.97 percentage point at All India level and this
time series difference is found of +1.3 percentage point. However
Maharashtra registered less ACGR in respect of time by -.65 percentage
point, from amongst the selected starts Gova improved ACGR in time
perspective by +3.33 percentage point.

169
TABLE - 4.3 GSDP AT 1980-81 PRICES : 1980-81 TO 1993-94
India 3.17
Gujarat 3.17
Maharashtra 4.18
Gova 4.53
Madhyapradesh 2.25
Rajasthan 3.67
������������������������������������������������������������
������������������������������������������������������������������������������������������������������������������������������������������������
����������������3.17 ������������������������������������������������������������
������������������������������������������������������������������������������������������������������������������������������������������������������������
�����������������3.17
����������������������������������������������������������������
���������������������������������������������������������������������������������������������������������������������������������������������������������������������������������������������������
��������������������������������
4.18�������������������������������������������������������������������������������������
������������������������������������������������������������������������������������������������������������������������������������������������������������������������������������������������������������
����������������4.53
���������������������������������������������
������������������������������������������������������������������������������������������������������������
����������������2.25
����������������������������������������������������������������������
������������������������������������������������������������������������������������������������������������������������������������������������������������������������
����������������3.67
0
0.5
1
1.5
2
2.5
3
3.5
4
4.5
5
India Gujarat Maharashtra Gova MadhyaPradesh
Rajasthan
GSDP at 1980-81 Prices : 1980-81 to 1993-94
ACGR in per-capita GSDP is presented in the table at 1980s 81
prices covering the period of 1980-81 to 1993-94, following inferences
can be derived from the table (I) Gujarat reported ACGR in per-capita
GSDP equal to that of All India (3.17) (II) Except Madhyapradesh the
other neighbouring states had an edge over Gujarat and All India in this

170
regard with Gova at the top. (III) The gap between Gova and Gujarat
tends to be of -1.36 percentage point.
TABLE - 4.4
GSDP AT 1993-94 PRICES : 1993-94 TO 2000-01
India 4.32
Gujarat 4.48
Maharashtra 3.82
Gova 7.91
Madhyapradesh 2.25
Rajasthan 4.16
�����������������������������������
������������������������������������������������������������������������
��������������������������������4.32
�����������������������������������
������������������������������������������������������������������������
��������������������������������
4.48������������������������������
�������������������������������������������������������
������������������������������
3.82
�������������������������������������������������������
��������������������������������������������������������������������������������������������������������������
������������������������������
7.91
��������������������
��������������������������������������������
���������������2.25
������������������������������
������������������������������������������������������������������
���������������4.16
0
1
2
3
4
5
6
7
8
9
10
India Gujarat Maharashtra Gova MadhyaPradesh
Rajasthan
GSDP at 1993-94 Prices : 1993-94 to 2000-01
ACGR in per-capita GSDP at 1993-94 prices covering the period
of 1993-94 to 2000-01 is reflected in this table. ACGR presented in the
table indicates the fact that Gujarat has an edge over all India ACGR
4.16 point percentage. From amongst the neighbouring states of Gujarat.
Gova is the only state having more ACGR than Gujarat. The difference
between the two states tends to be of 73.43 point percentage is Gova is
171
having more than Gujarat. Madhyapradesh tends to show poor
performance in comparison with Gujarat, Maharashtra etc.
Having a comparative look at the table 4.3 and 4.4 it is further
revealed that in comparison with preceding period of 1980-81 to 1993-
94, during the period of 1993-94 to 2000-01 the rate at all India level in
improved by +1.15 percentage point, while Gujarat showed an
improvement in the same of +1.31 point percentage slightly more than
all India level of improvement. State like Gova battered the rate by +
3.38 point percentage. Maharashtra performed four in this regard by
registering ACGR less by 0.36 point percentage. Madhyapradesh
reported stationary performance with no change in ACGR between the
two corresponding period.

172
TABLE - 4.5 GSDP AT 1980-81 PRICES : 1980-81 TO 1990-91
India 5.55
Gujarat 5.08
Maharashtra 6.02
Gova 5.49
Madhyapradesh 4.56
Rajasthan 6.60
��������������������������������������������
������������������������������������������������������������������������������������������������������������������������
������������������������������5.55 ����
������������������������������������
���������������������������������������������������������������������������������������������������
������������������������������
5.08
�������������������������������������������������������
�������������������������������������������������������������������������������������������������������������������������
���������������6.02
��������������������������������������������������
������������������������������������������������������������������������������������������������������������������������
����������������5.49
������������������������������������
������������������������������������������������������������������������������������������������
������������������������������
4.56
������������������������������������������������
������������������������������������������������������������������������������������������������������������������������������������������������
���������������6.6
0
1
2
3
4
5
6
7
India Gujarat Maharashtra Gova MadhyaPradesh
Rajasthan
GSDP at 1980-81 to 1990-91 prices
This table provides data on ACGR in GSDP referring to the
decade of 1980-81 to 1990-91. According to the figures presented in the
table it is evidently found that Maharashtra and Rajasthan, the two
neighbouring states of Gujarat reported ACGR higher than that of All
India level. Rajasthan is being at the top followed by Maharashtra.
Gujarat with 5.08 ACGR was lagging behind to All India level by
- 0.47 point percentage. Gova was also lagging behind to All India level
but the gap as reflected in table tends to be of only -0.6 point percentage.
The gap found between Gujarat and Rajasthan the top amongst
neighbouring state as found of 1.52 point percentage.

173
TABLE - 4.6
GSDP AT 1990-91 PRICES : 1990-91 TO 2000-01
India 6.10
Gujarat 7.35
Maharashtra 6.83
Gova 8.38
Madhyapradesh 4.78
Rajasthan 6.07
����������������������������������������
������������������������������������������������������������������������������������������������������������������������
���������������6.1
������������������������������������������������
������������������������������������������������������������������������������������������������������������������������������������������������
���������������7.35��������������������������������������������
������������������������������������������������������������������������������������������������������������������������������������
���������������6.83
��������������������������������������������������������
������������������������������������������������������������������������������������������������������������������������������������������������������������
������������������������������8.38
��������������������������������
����������������������������������������������������������������������������������������
���������������4.78
��������������������������������������������������
��������������������������������������������������������������������������������������������������������������
���������������6.07
0
1
2
3
4
5
6
7
8
9
India Gujarat Maharashtra Gova MadhyaPradesh
Rajasthan
GSDP at 1990-91 to 2000-01 prices
This table provides ACGR in GSDP referring to the decade
period of 1990-91 to 2000-01. The table demonstrates the fact that
Gujarat showed an edge over all India ACGR by + 1.25 point
percentage. From amongst the neighbouring states Gova reported
highest ACGR i.e. 8.38 +1.3 percentage point than Gujarat and + 2.28
percentage point than all India level. Madhyapradesh continued to have
poor performance from amongst the states taken into consideration.
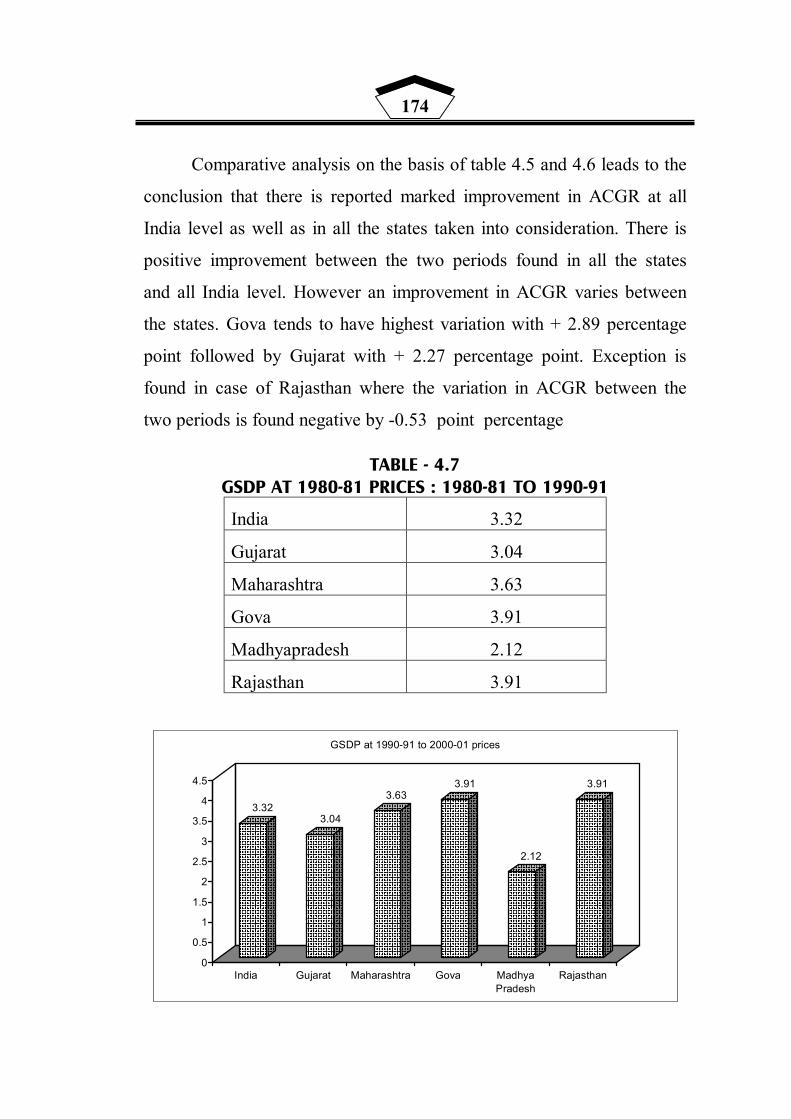
174
Comparative analysis on the basis of table 4.5 and 4.6 leads to the
conclusion that there is reported marked improvement in ACGR at all
India level as well as in all the states taken into consideration. There is
positive improvement between the two periods found in all the states
and all India level. However an improvement in ACGR varies between
the states. Gova tends to have highest variation with + 2.89 percentage
point followed by Gujarat with + 2.27 percentage point. Exception is
found in case of Rajasthan where the variation in ACGR between the
two periods is found negative by -0.53 point percentage
TABLE - 4.7 GSDP AT 1980-81 PRICES : 1980-81 TO 1990-91
India 3.32
Gujarat 3.04
Maharashtra 3.63
Gova 3.91
Madhyapradesh 2.12
Rajasthan 3.91
����������������������������������������
������������������������������������������������������������������������������������������������������������������������
���������������3.32 ��������������������������������������������������
���������������������������������������������������������������������������������������������������
������������������������������3.04
��������������������������������������������
�������������������������������������������������������������������������������������������������������������������������
���������������3.63������������������������������������������������
������������������������������������������������������������������������������������������������������������������������������������
������������������������������
3.91
�����������������������������������
�����������������������������������������������������������������������������
���������������2.12
������������������������������������������������
������������������������������������������������������������������������������������������������������������������������������������
������������������������������
3.91
0
0.5
1
1.5
2
2.5
3
3.5
4
4.5
India Gujarat Maharashtra Gova MadhyaPradesh
Rajasthan
GSDP at 1990-91 to 2000-01 prices
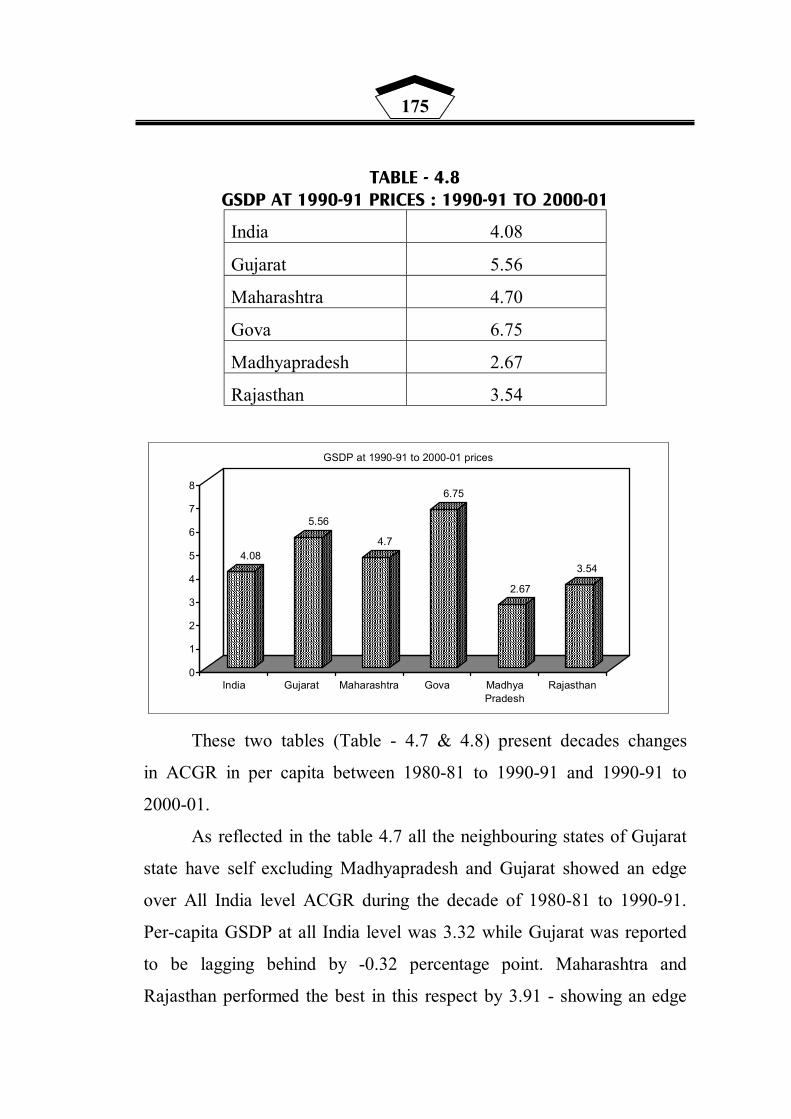
175
TABLE - 4.8
GSDP AT 1990-91 PRICES : 1990-91 TO 2000-01
India 4.08
Gujarat 5.56
Maharashtra 4.70
Gova 6.75
Madhyapradesh 2.67
Rajasthan 3.54
����������������������������������������
�����������������������������������������������������������������������������
������������������������������
4.08
����������������������������������������
������������������������������������������������������������������������������������������������������������
������������������������������
5.56���������������������������������������������
����������������������������������������������������������������������������������������
������������������������������4.7
������������������������������������������������
������������������������������������������������������������������������������������������������������������������������������������
������������������������������
6.75
������������������������������
�������������������������������������������������������
������������������������������2.67
����������������������������
������������������������������������������������������������������������
������������������������������
3.54
0
1
2
3
4
5
6
7
8
India Gujarat Maharashtra Gova MadhyaPradesh
Rajasthan
GSDP at 1990-91 to 2000-01 prices
These two tables (Table - 4.7 & 4.8) present decades changes
in ACGR in per capita between 1980-81 to 1990-91 and 1990-91 to
2000-01.
As reflected in the table 4.7 all the neighbouring states of Gujarat
state have self excluding Madhyapradesh and Gujarat showed an edge
over All India level ACGR during the decade of 1980-81 to 1990-91.
Per-capita GSDP at all India level was 3.32 while Gujarat was reported
to be lagging behind by -0.32 percentage point. Maharashtra and
Rajasthan performed the best in this respect by 3.91 - showing an edge

176
over All India level by +0.59 point percentage . Madhyapradesh was at
the bottom with 2.12 point percentage lagging far behind the
neighbouring states and all India level.
Table No. 4.8 reveals the fact that Madhyapradesh and Rajasthan
performed poor with ACGR less than all India level. Gova performed
the best with 6.75 ACGR i.e. +2.67 percentage point to all India level
ACGR. Gujarat followed Gova with 5.56. Maharashtra reported 4.70
ACGR 4.62 percentage point to all India level of 4.08.
Having a comparative look at the two table it is clearly found that
except Rajasthan the states selected for the purpose in table showed
positive improvement between the two periods improvement in ACGR
at All India level is found of +0.76 percentage point while this gap is
found of +2.52 percentage point in Gujarat, +1.7 percentage point in
Maharashtra, +2.84 percentage point in Gova and +0.55 percentage
point in Madhyapradesh. Rajasthan was an exception to this fact with
showing negative change by -0.37 percentage point.
SECTION - II
ACGR - NSDP PER-CAPITA NSDP
This section includes data on Annual Compound Growth Rate in
NSDP and per-capita NSDP during the period of 1980s AND 1990s.
There are total 8 tables in this section (Table 4.9 to 4.16)

177
TABLE - 4.9 NSDP AT 1980-81 PRICES : 1980-81 TO 1993-94
India 5.25
Gujarat 4.95
Maharashtra 6.59
Gova 6.78
Madhyapradesh 4.28
Rajasthan 6.15
������������������������������������
����������������������������������������������������������������������������������������
������������������������������
5.25��������������������������������
������������������������������������������������������������������������������������������������
���������������4.95
�������������������������������������������������������
��������������������������������������������������������������������������������������������������������������
������������������������������
6.59��������������������������������������������
�������������������������������������������������������������������������������������������������������������������������
���������������6.78
����������������������������
������������������������������������������������������������������������������������
���������������4.28
��������������������������������������������������
��������������������������������������������������������������������������������������������������������������
���������������6.15
0
1
2
3
4
5
6
7
8
India Gujarat Maharashtra Gova MadhyaPradesh
Rajasthan
NSDP at 1980-81 to 1993-94
Table 4.9 This table refers to the data for the period of 1980-81 to
1993-94 at the prices of 1980-81. NSDP on that price of All India.
Gujarat state and neighbouring states is reflected in this table.
It is found from this table that during the period of 1980-81 to
1993-94 NSDP at 1980-81 prices in Gujarat and Madhyapradesh was
less than All India levels Gova from amongst the neighbouring states
was at the top with 6.78 followed by Maharashtra 6.59 and Rajasthan
6.15. Gujarat was lagging behind All India level by -0.35 percentage
point while M.P. was for more behind by -0.97 percentage point.
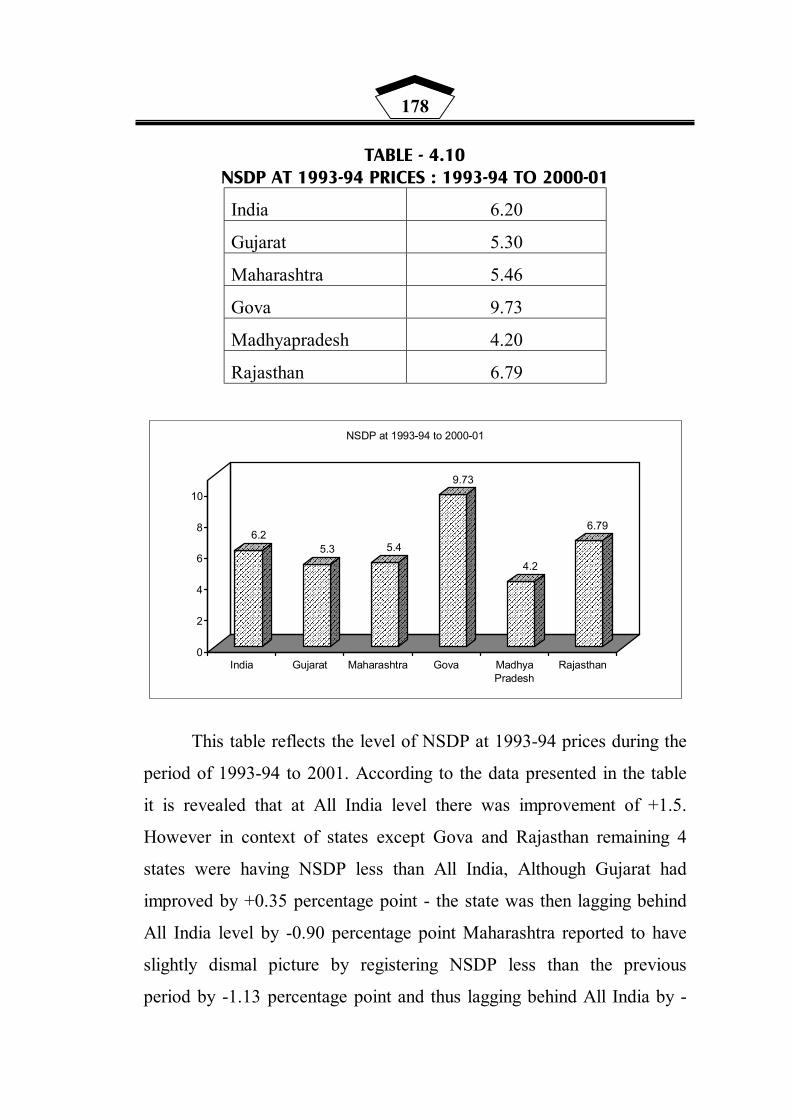
178
TABLE - 4.10 NSDP AT 1993-94 PRICES : 1993-94 TO 2000-01
India 6.20
Gujarat 5.30
Maharashtra 5.46
Gova 9.73
Madhyapradesh 4.20
Rajasthan 6.79
����������������������������������������
����������������������������������������������������������������������������������������
���������������6.2����������������������������
������������������������������������������������������������������������������������
���������������5.3 ����������������������������
������������������������������������������������������������������������������������
���������������5.4
������������������������������������������������������������
�������������������������������������������������������������������������������������������������������������������������
������������������������������9.73
������������������������������
������������������������������������������������������������������������
����������������4.2
������������������������������������
������������������������������������������������������������������������������������������������
������������������������������6.79
0
2
4
6
8
10
India Gujarat Maharashtra Gova MadhyaPradesh
Rajasthan
NSDP at 1993-94 to 2000-01
This table reflects the level of NSDP at 1993-94 prices during the
period of 1993-94 to 2001. According to the data presented in the table
it is revealed that at All India level there was improvement of +1.5.
However in context of states except Gova and Rajasthan remaining 4
states were having NSDP less than All India, Although Gujarat had
improved by +0.35 percentage point - the state was then lagging behind
All India level by -0.90 percentage point Maharashtra reported to have
slightly dismal picture by registering NSDP less than the previous
period by -1.13 percentage point and thus lagging behind All India by -
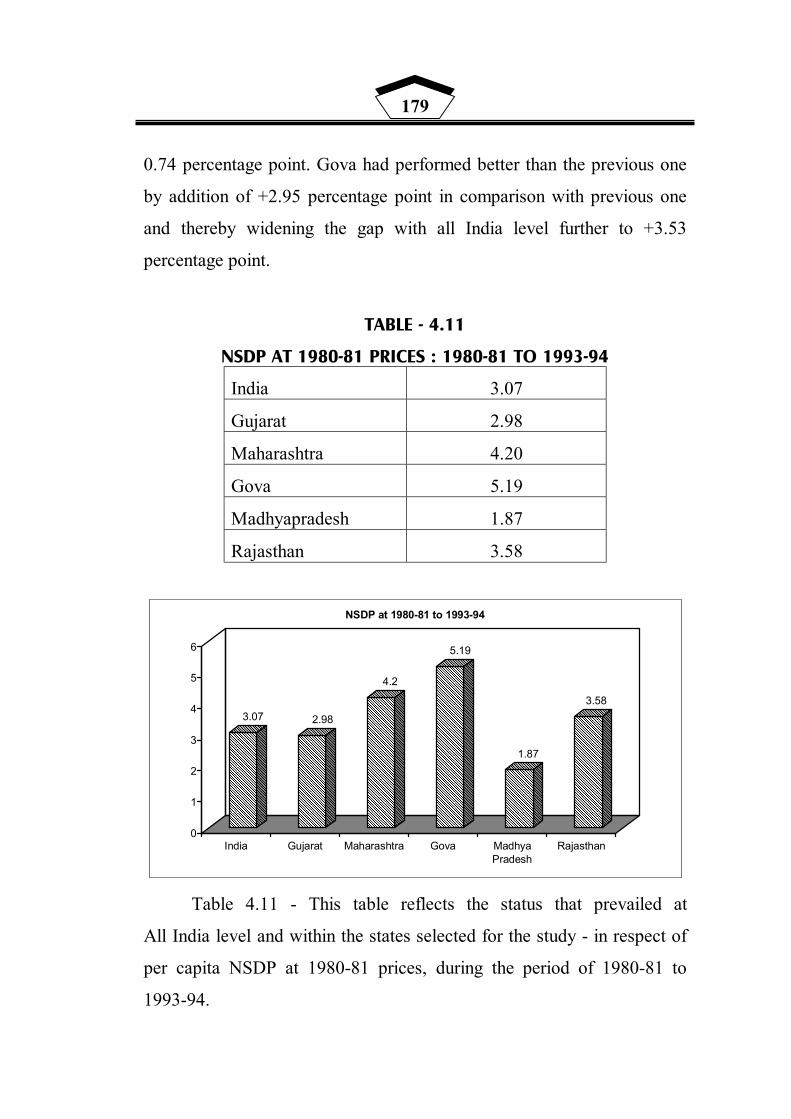
179
0.74 percentage point. Gova had performed better than the previous one
by addition of +2.95 percentage point in comparison with previous one
and thereby widening the gap with all India level further to +3.53
percentage point.
TABLE - 4.11
NSDP AT 1980-81 PRICES : 1980-81 TO 1993-94
India 3.07
Gujarat 2.98
Maharashtra 4.20
Gova 5.19
Madhyapradesh 1.87
Rajasthan 3.58
�����������������������������������
������������������������������������������������������������������������������������
����������������3.07 �����������������������������������
������������������������������������������������������������������������������������
����������������2.98
���������������������������������������������
������������������������������������������������������������������������������������������������������������
����������������4.2
������������������������������������������������������������
������������������������������������������������������������������������������������������������������������������������������������
��������������������������������5.19
�������������������������
������������������������������������������������
��������������������������������
1.87
����������������������������������������
������������������������������������������������������������������������������������������������
����������������3.58
0
1
2
3
4
5
6
India Gujarat Maharashtra Gova MadhyaPradesh
Rajasthan
NSDP at 1980-81 to 1993-94
Table 4.11 - This table reflects the status that prevailed at
All India level and within the states selected for the study - in respect of
per capita NSDP at 1980-81 prices, during the period of 1980-81 to
1993-94.

180
This table highlights the fact that per capita NSDP in Gujarat state
was 2.98 less than All India 3.07. Gujarat was also found lagging behind
in this aspect to the most neighbouring states except Madhyapradesh. As
usually Gova from amongst the neighbouring states was at the top with
5.19 the level for more than that of All India (+2.12) and Gujarat
(+2.21). Maharashtra with 4.20 and Rajasthan with 3.58 performed
better than Gujarat State in this regard.
TABLE - 4.12
NSDP AT 1993-94 PRICES : 1993-94 TO 2000-01
India 4.20
Gujarat 3.63
Maharashtra 3.37
Gova 8.20
Madhyapradesh 2.16
Rajasthan 4.15
����������������������������
������������������������������������������������������������������
����������������������������
4.2������������������������
������������������������������������������������������������������
��������������3.63 ������������������������������
�������������������������������������������������������
������������������������������3.37
������������������������������������������������������������
������������������������������������������������������������������������������������������������������������������������������������
���������������8.2
����������������
����������������������������������������
��������������2.16
����������������������������
������������������������������������������������������������������
����������������������������
4.15
0
1
2
3
4
5
6
7
8
9
India Gujarat Maharashtra Gova MadhyaPradesh
Rajasthan
NSDP at 1993-94 to 2000-01
This tables reflects per capita NSDP in All India and the
neighbouring states of Gujarat. This is at 1993-94 price covering the
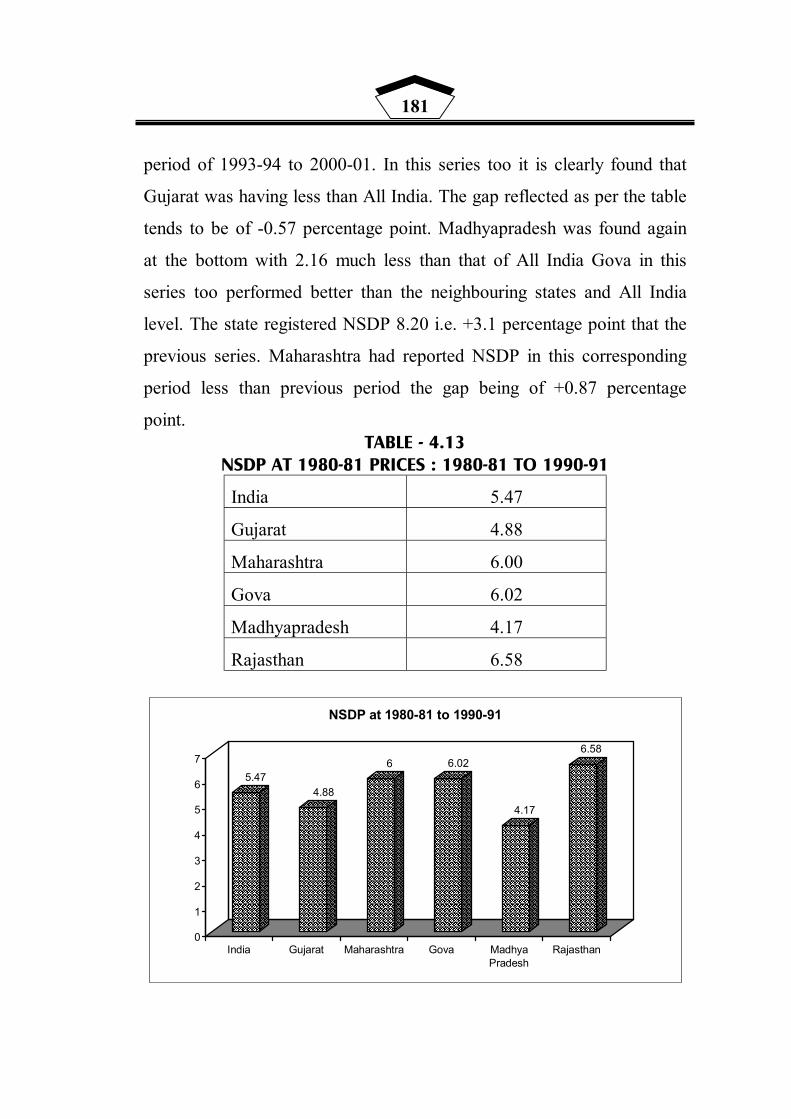
181
period of 1993-94 to 2000-01. In this series too it is clearly found that
Gujarat was having less than All India. The gap reflected as per the table
tends to be of -0.57 percentage point. Madhyapradesh was found again
at the bottom with 2.16 much less than that of All India Gova in this
series too performed better than the neighbouring states and All India
level. The state registered NSDP 8.20 i.e. +3.1 percentage point that the
previous series. Maharashtra had reported NSDP in this corresponding
period less than previous period the gap being of +0.87 percentage
point. TABLE - 4.13
NSDP AT 1980-81 PRICES : 1980-81 TO 1990-91
India 5.47
Gujarat 4.88
Maharashtra 6.00
Gova 6.02
Madhyapradesh 4.17
Rajasthan 6.58
��������������������������������������������������
��������������������������������������������������������������������������������������������������������������
���������������5.47������������������������������������
���������������������������������������������������������������������������������������������������
���������������4.88
��������������������������������������������
������������������������������������������������������������������������������������������������������������������������������������
���������������6 �������������������������������������������������������
�������������������������������������������������������������������������������������������������������������������������
���������������6.02
��������������������������������
������������������������������������������������������������������������������������������������
���������������4.17
������������������������������������������������������������
������������������������������������������������������������������������������������������������������������������������������������
���������������6.58
0
1
2
3
4
5
6
7
India Gujarat Maharashtra Gova MadhyaPradesh
Rajasthan
NSDP at 1980-81 to 1990-91

182
TABLE - 4.14 NSDP AT 1993-94 PRICES : 1990-91 TO 2000-01
India 5.95
Gujarat 6.86
Maharashtra 6.50
Gova 8.60
Madhyapradesh 4.64
Rajasthan 5.95
���������������������������������������������
������������������������������������������������������������������������������������������������������������
����������������5.95����������������������������������������
������������������������������������������������������������������������������������������������������������������������
���������������6.86 ��������������������������������������������������
���������������������������������������������������������������������������������������������������
������������������������������
6.5
������������������������������������������������
������������������������������������������������������������������������������������������������������������������������������������������������
���������������8.6
�����������������������������������
�����������������������������������������������������������������������������
���������������4.64
������������������������������������
������������������������������������������������������������������������������������������������������������
���������������5.95
0
1
2
3
4
5
6
7
8
9
India Gujarat Maharashtra Gova MadhyaPradesh
Rajasthan
NSDP at 1990-91 to 2000-01
These two tables (Table 4.13 and 4.14) provide decades variations
in NSDP of All India and Gujarat inclusive of few neighbouring states
of Gujarat. These variations are however at two different series i.e. of
1980-81n prices and 1993-94 prices.
Following is the picture reflected from these tables -
(A) At two different series decadal variation in NSDP found at India
level tends to be positive by +0.48 percentage point.
(B) This gap between the two periods at two level of prices was found
positive in all the states that of selected except Rajasthan Gujarat
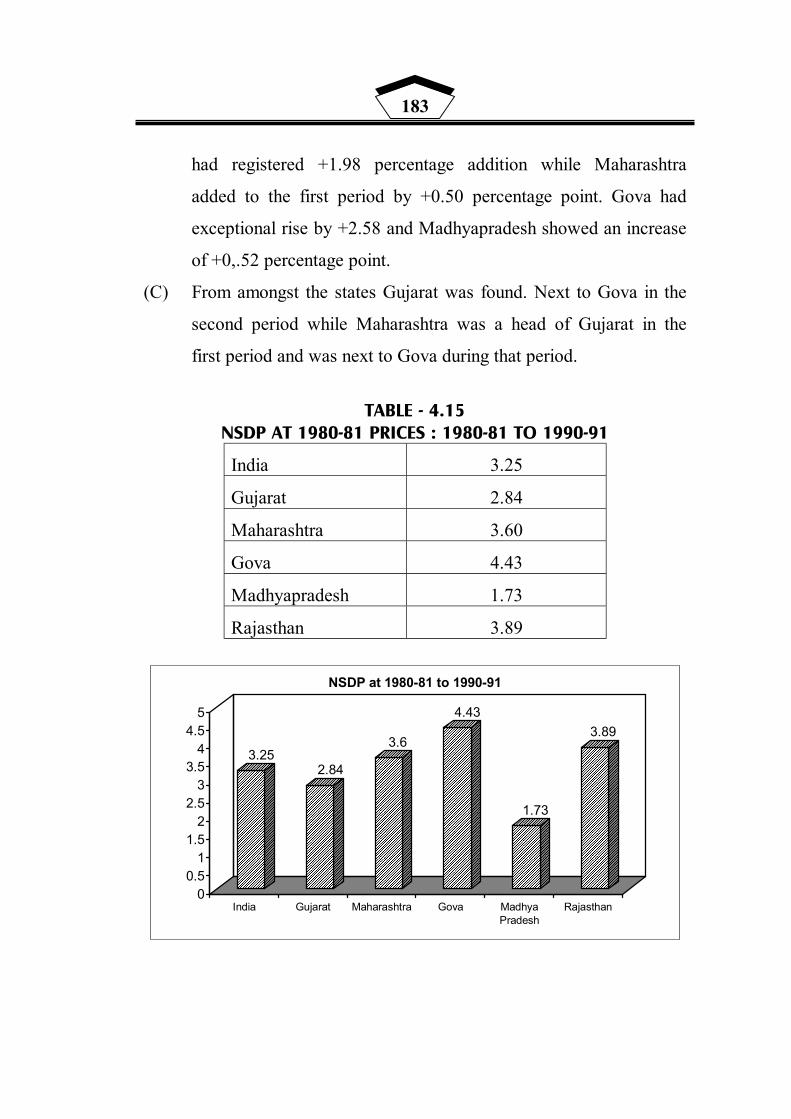
183
had registered +1.98 percentage addition while Maharashtra
added to the first period by +0.50 percentage point. Gova had
exceptional rise by +2.58 and Madhyapradesh showed an increase
of +0,.52 percentage point.
(C) From amongst the states Gujarat was found. Next to Gova in the
second period while Maharashtra was a head of Gujarat in the
first period and was next to Gova during that period.
TABLE - 4.15
NSDP AT 1980-81 PRICES : 1980-81 TO 1990-91
India 3.25
Gujarat 2.84
Maharashtra 3.60
Gova 4.43
Madhyapradesh 1.73
Rajasthan 3.89
���������������������������������������������
����������������������������������������������������������������������������������������
������������������������������3.25 �����
�����������������������������������
������������������������������������������������������������������������������������
��������������������������������
2.84
��������������������������������������������������
������������������������������������������������������������������������������������������������������������
��������������������������������3.6
�������������������������������������������������������
������������������������������������������������������������������������������������������������������������������������������������
����������������4.43
�������������������������
������������������������������������������������������������
����������������1.73
��������������������������������������������������
������������������������������������������������������������������������������������������������������������������������
����������������3.89
00.5
11.5
22.5
33.5
44.5
5
India Gujarat Maharashtra Gova MadhyaPradesh
Rajasthan
NSDP at 1980-81 to 1990-91

184
TABLE - 4.16 NSDP AT 1993-94 PRICES : 1990-91 TO 2000-01
India 3.67
Gujarat 5.07
Maharashtra 4.37
Gova 6.97
Madhyapradesh 2.52
Rajasthan 3.42
������������������������
������������������������������������������������������������
������������������������������
3.67
��������������������������������
������������������������������������������������������������������������������������
������������������������������5.07 ����
������������������������
������������������������������������������������������������������������
������������������������������4.37
����������������������������������������
������������������������������������������������������������������������������������������������������������
������������������������������6.97
��������������������
������������������������������������������������
������������������������������2.52
������������������������
������������������������������������������������������������
������������������������������3.42
0123456789
India Gujarat Maharashtra Gova MadhyaPradesh
Rajasthan
NSDP at 1990-91 to 2000-01
These two tables (Table 4.15 and 4.16) provide data on per capita
NSDP at 1980-81 prices and 1993-94 prices - reflecting decade figure.
As reflected in the table it is found that -
(a) Per capita NSDP between the two decades vary by +0.42
percentage point at All India level.
(b) During the first decade 3 states were a head of India in this
respect from amongst neighbouring states of Gujarat. Gova at the
top with 4.43 followed by Rajasthan 3.89 and Maharashtra 3.60
while M.P. was at the bottom with 1.73 much less than All India's
level of 3.25.
185
(c) Gujarat state reflected variation between the two decades of +2.23
percentage point i.e. 5.07 from 2.84 in the previous decade though
Gujarat lagged behind 3 states in the 81 to 91 decade. The state
improved better than the other states except Gova from amongst
neighbouring states. Rajasthan from amongst neighbouring states
performed poor in the second decade i.e. between 91 to 2001.
(d) During the decade of reference per capita NSDP in Gujarat is
found more than Maharashtra (+0.70 percentage point) and
Rajasthan (+1.65 percentage point) Madhyapradesh showed
dismal picture in this respect during the reform period.
SECTION - III
QUINQUENNIUM COMPOUND GROWTH RATE
Under this section Quinquennium Compound Growth Rate of
GSDP, per capita GSDP, NSDP, per capita NSDP at 1993-94 prices
1990-91 to 1995-96 and 1995-96 to 2000-01 is presented. Two tables
for each parameter for the different two periods are presented totaling
4.17 to 4.20.
These tables reveal the following picture.

186
TABLE - 4.17 GSDP
1990-91 TO 1995-96 : 1995-96 TO 2000-01
1990-91 TO 1995-96 1995-96 TO 2000-01
India 5.63 5.84
Gujarat 9.24 4.05
Maharashtra 8.21 5.30
Gova 6.05 9.72
Madhyapradesh 4.85 3.52
Rajasthan 4.65 5.10
��������������������������������������������������������������������������������
��������������������������������������������������������������������������������������������������������������
������������������������������������������������������������������������������������������
��������������������������������������������������������������������������������
����������������������������������������������������������������������
������������������������������������������������������������
��������������������������������������������������������������������������������
������������������������������������������������������������
����������������������������������������������������������������������
������������������������������������������������������������������������������������������������������������������������
��������������������������������������������������
����������������������������������������������������������������������
GSDP at 1993-94
5.63
9.248.21
6.05
4.85 4.65
5.84
4.05
5.3
9.72
3.52
5.1
0
2
4
6
8
10
12
India Gujarat Maharashtra Gova MadhyaPradesh
Rajasthan
Table 4.17 refer to GSDP at 1993-94 price (Quinquennium
growth rate) for the period of 1990-91 to 1995-96 and 1995-96 to 2000-
01. It is found from the table that (a) At All India level second half of
the decade showed an increase of +0.21 percentage point in comparison
with the first half. (b) In comparison with All India the states like
Gujarat Maharashtra and Madhyapradesh showed negative changes in
the second half in comparison with first decade. There appeared to have
considerable down fall in QGR of about 5.19 percentage point in
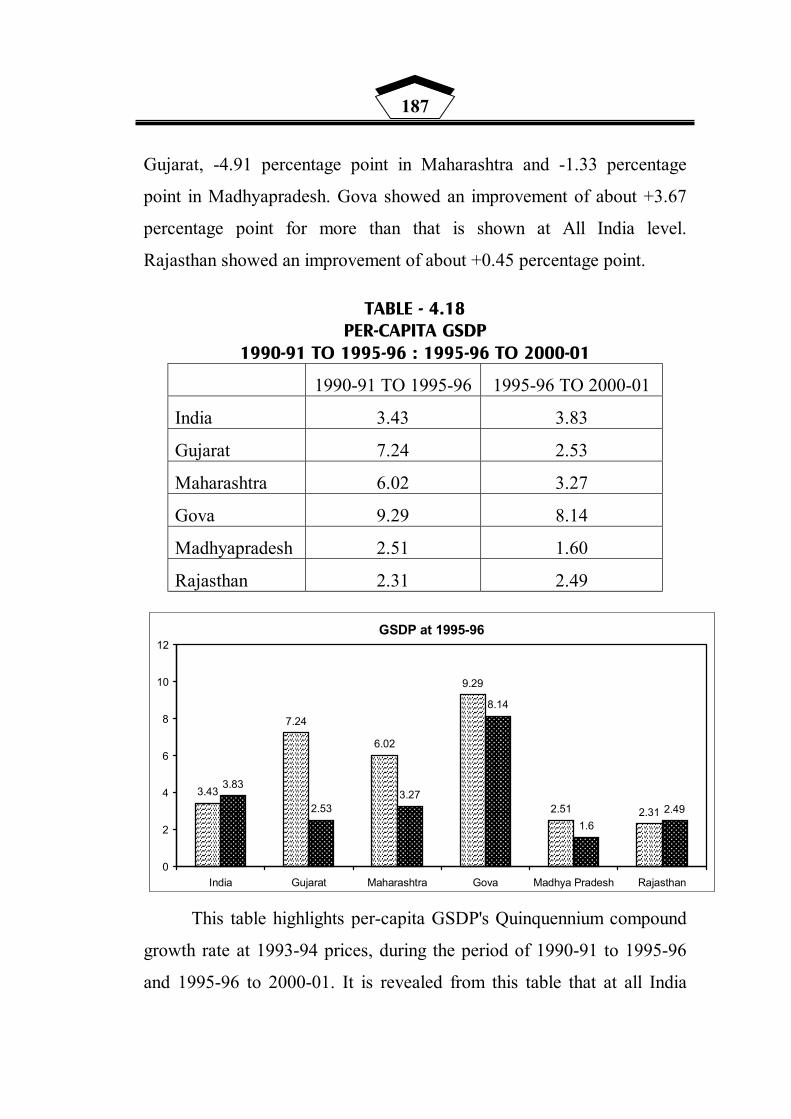
187
Gujarat, -4.91 percentage point in Maharashtra and -1.33 percentage
point in Madhyapradesh. Gova showed an improvement of about +3.67
percentage point for more than that is shown at All India level.
Rajasthan showed an improvement of about +0.45 percentage point.
TABLE - 4.18 PER-CAPITA GSDP
1990-91 TO 1995-96 : 1995-96 TO 2000-01
1990-91 TO 1995-96 1995-96 TO 2000-01
India 3.43 3.83
Gujarat 7.24 2.53
Maharashtra 6.02 3.27
Gova 9.29 8.14
Madhyapradesh 2.51 1.60
Rajasthan 2.31 2.49
�������������������������������������������������������
����������������������������������������������������������������������������������������������������
����������������������������������������������������������������������������������������
������������������������������������������������������������������������������������������������������������������������������������
��������������������������������������������
��������������������������������������������
������������������������������������������������������������������
��������������������������������������������
�������������������������������������������������������
��������������������������������������������������������������������������������������������������������������
���������������������������������
��������������������������������������������
GSDP at 1995-96
3.43
7.24
6.02
9.29
2.51 2.31
3.83
2.533.27
8.14
1.62.49
0
2
4
6
8
10
12
India Gujarat Maharashtra Gova Madhya Pradesh Rajasthan
This table highlights per-capita GSDP's Quinquennium compound
growth rate at 1993-94 prices, during the period of 1990-91 to 1995-96
and 1995-96 to 2000-01. It is revealed from this table that at all India
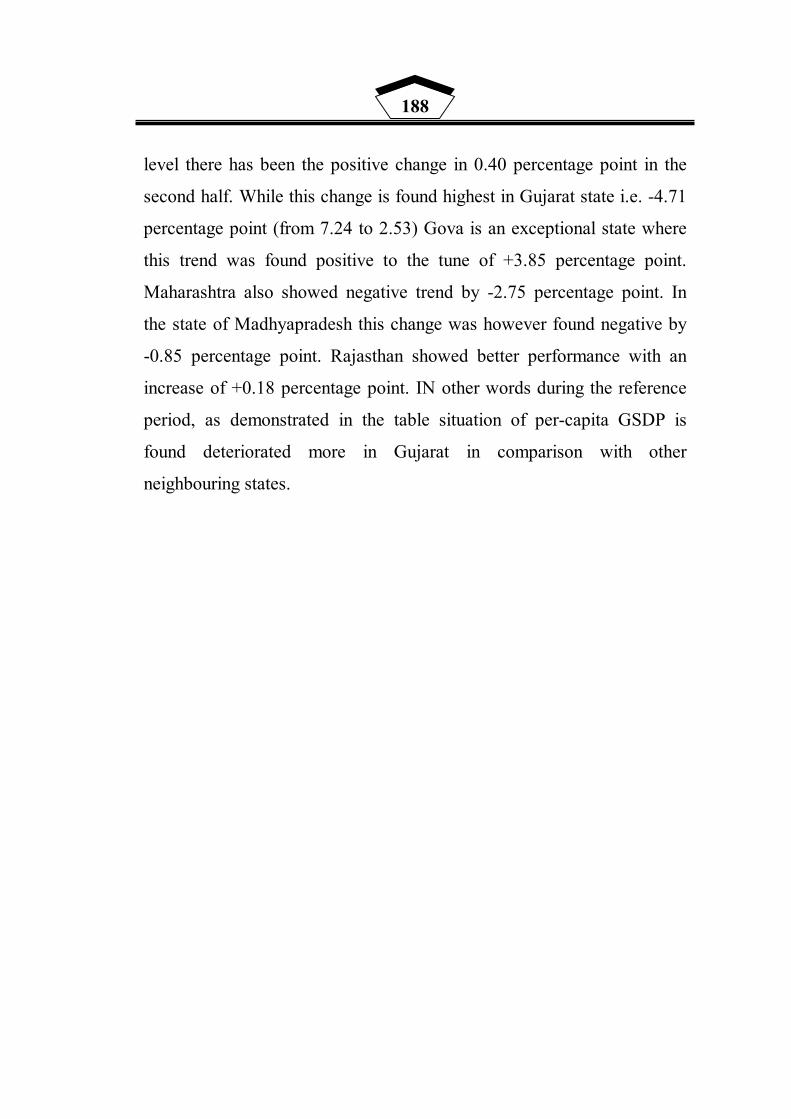
188
level there has been the positive change in 0.40 percentage point in the
second half. While this change is found highest in Gujarat state i.e. -4.71
percentage point (from 7.24 to 2.53) Gova is an exceptional state where
this trend was found positive to the tune of +3.85 percentage point.
Maharashtra also showed negative trend by -2.75 percentage point. In
the state of Madhyapradesh this change was however found negative by
-0.85 percentage point. Rajasthan showed better performance with an
increase of +0.18 percentage point. IN other words during the reference
period, as demonstrated in the table situation of per-capita GSDP is
found deteriorated more in Gujarat in comparison with other
neighbouring states.
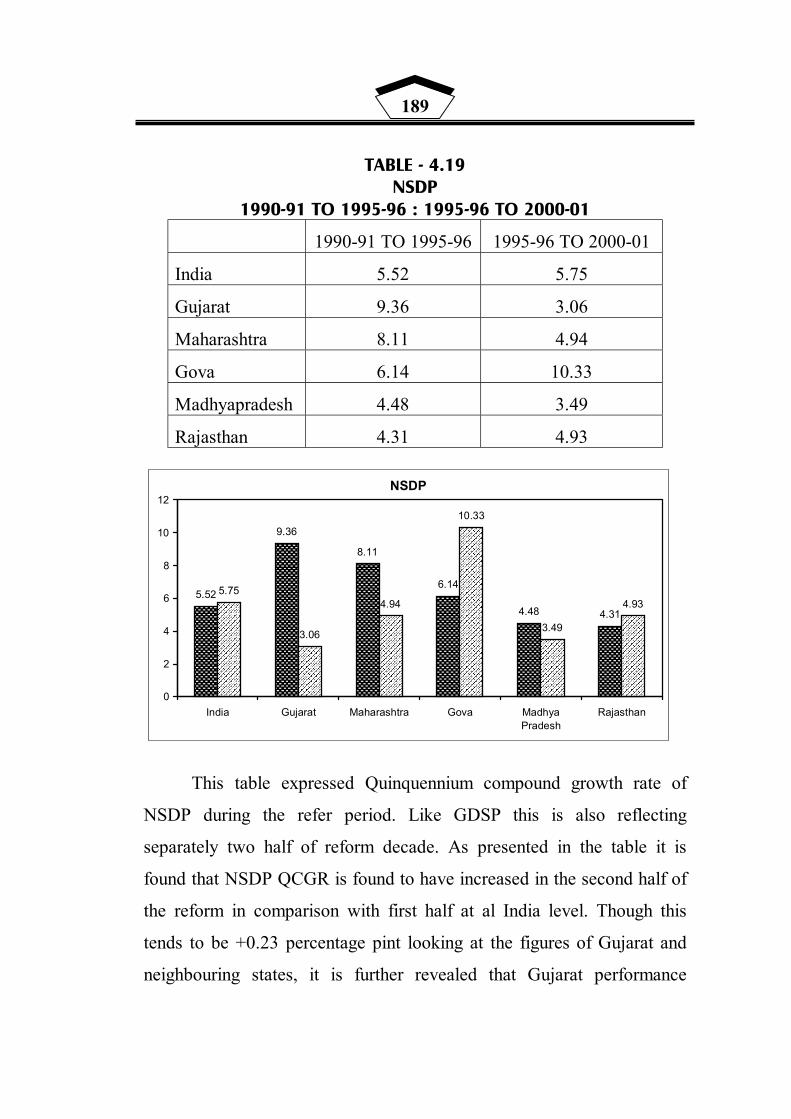
189
TABLE - 4.19 NSDP
1990-91 TO 1995-96 : 1995-96 TO 2000-01
1990-91 TO 1995-96 1995-96 TO 2000-01
India 5.52 5.75
Gujarat 9.36 3.06
Maharashtra 8.11 4.94
Gova 6.14 10.33
Madhyapradesh 4.48 3.49
Rajasthan 4.31 4.93
����������������������������������������������������������������������
��������������������������������������������������������������������������������������������������������������
����������������������������������������������������������������������������������������������������
��������������������������������������������������������������������������������
������������������������������������������������������������
������������������������������������������������������������
����������������������������������������������������������������������
����������������������������������������
������������������������������������������������������������
������������������������������������������������������������������������������������������������������������������������
��������������������������������������������������
������������������������������������������������������������
NSDP
5.52
9.36
8.11
6.14
4.48 4.31
5.75
3.06
4.94
10.33
3.49
4.93
0
2
4
6
8
10
12
India Gujarat Maharashtra Gova MadhyaPradesh
Rajasthan
This table expressed Quinquennium compound growth rate of
NSDP during the refer period. Like GDSP this is also reflecting
separately two half of reform decade. As presented in the table it is
found that NSDP QCGR is found to have increased in the second half of
the reform in comparison with first half at al India level. Though this
tends to be +0.23 percentage pint looking at the figures of Gujarat and
neighbouring states, it is further revealed that Gujarat performance

190
better in that respect in the first half of the reform than the second half
of reform. The second half reform indicated downfall of 6.30 percentage
point similar is the trend found in respect of Maharashtra too which
shows decline of 4.83 percentage point in second half of the reform
against the first half. Gova showed an upward trend in QCGR by 4.79
percentage point in the second half in comparison with first half of
reform. MP showed declining trend of about 0.99 percentage points. It is
evidently found from the table that Gujarat was in the bitter situation
then Maharashtra and Gova besides all India level in the first half of
reform decade but the state economy did not perform well in the second
half of the result and the economy was at the bottom from amongst all
neighboring states.

191
TABLE - 4.20 PER-CAPITA NSDP
1990-91 TO 1995-96 : 1995-96 TO 2000-01
1990-91 TO 1995-96 1995-96 TO 2000-01
India 3.46 3.75
Gujarat 7.37 1.55
Maharashtra 5.92 2.91
Gova 4.38 8.73
Madhyapradesh 2.24 1.57
Rajasthan 1.98 2.31
��������������������������������������������������
����������������������������������������������������������������������������������������������������
��������������������������������������������������������������������������������
������������������������������������������������������������
����������������������������������������
������������������������������
��������������������������������������������������
������������������������������
����������������������������������������
������������������������������������������������������������������������������������������������������������������������
������������������������������
����������������������������������������
NSDP
3.46
7.37
5.92
4.38
2.24 1.98
3.75
1.55
2.91
8.73
1.572.31
0
1
2
3
4
5
6
7
8
9
10
India Gujarat Maharashtra Gova MadhyaPradesh
Rajasthan
This table in two parts of a single decade of reform refers to the
QCGR in content of per-capita NSDP. Following are the major
conclusion derived from the table.
(A) There has been an increase in QCGR. Per-capta NSDP at all India
level. It showed an increase of 0.29 percentage point i.e. from
3.46 in first half to 3.75 in second half of the reform.

192
(B) From amongst the states Gujarat was at the top during first half of
reform with 7.37 which then went at the bottom in the second half
with 1.55. Thus there was a down fall of 5.82 percentage point.
(C) Comparison in QCGR in respect of time period clearly suggest
that besides Gujarat. Maharashtra also went down by 3.1
percentages point and Madhyapradesh by 0.57 percentage point.
Gova demonstrated an increase by 4.35 percentage point being at
the top in the second half of the reform. Rajasthan too showed a
little upward trend of 0.33 in the second half of reform.
(D) All the states except Gova legged behind to all India QCGR in the
second half of the reform.
SECTION - IV
GSDP - NSDP AT 1993-94 PRICE
This section includes 4 major tables indicating GSDP and NSDP
of Gujarat and total India at 1993-94 price. Data presented in this table
cover the period from 1993-94 to 2004-05. This reflects actual figure in
numbers, mean of the 12 years and figures in brackets in Gujarat State
expresses percentage to the total of India.

193
Table - 4.21
194
Table No. 4.21 expresses the figure of GSDP of Gujarat state and
all India at constant prices of 1993-94. This table leads to following
broads conclusion.
(1) Time series data beginning from the year 1993-94 to 2004-05
shows fluctuating trends during 12 years period in terms of
changes occurred in GSDP of Gujarat state and India. Shame of
Gujarat in percentage to total of India also demonstrates the same
fluctuating trends over the period of time.
(2) Considering the mean in GSDP of 12 years it is revealed from the
table that in Gujarat state GSDP it found more than the mean
amount. 5 times out 12 years. From the time period shows in the
table GSDP in state trends to be maximum in the year 2003-04
(P) while it is found minimum in the year 1993-94 the beginning
year i.e. 49194. It thus reveals that the gap between maximum
GSDP and minimum in the state tends to be of 54807 i.e. max
min ratio +11141% during the reference period. However, it is
also reflected from the table that in respect of percentage of
GSDO to the total 7 India it was found maximum in the year
1996-97 was found maximum in the year 1996-97 i.e. 7.21%
while it is reported minimum in 2004-05 4.25 as per the quick
estimates 7 that year.
(3) In context of all India GSDP at constant per 1993-94. It is
revealed from the table that it tends to have continuous increase in
numbers. However, rate of increase shows fluctuating trends over
the period of time. It is evidently found that GSDP was at its
minimum leveling the very beginning years of the reference

195
period i.e. 781345 in the year 1993-94 and maximum as per the
quick estimates of 2004-05 i.e. 2393671. This indicates the gap
between minimum and maximum tend to be of 1612326 in
percentage it comes to be 206.35 percentage more.
(4) Growth over the year during the reference period if examined
demonstrates the fact that out of 12 years period, there were 2
years i.e. 2000-01 and in 2004-05 - it showed negative change in
the growth i.e. in these two years the growth is found negative in
respect of total GSDP compared with the GSDP of previous
years. In the remaining period it showed positive trends in growth
with varying degree of changes.
In case of all India there appears to be positive trends in growth
over the years. However that rate of growth in number is found
maximum in the year 2003-04 over the previous year i.e. 907669 and
incidentally as per the quick estimates of 2004-05 it showed minimum
positive growth against the previous year of 2003-04.

196
Table - 4.22

197
Table No. 4.22 highlights the data on GSDP of Gujarat and India
at current prices of 1993-94 beginning from the year 1993-94 to 2004-
05. Some important observations can be made from the table as under.
(1) In numbers it is reflected from the table that GSDP in the state
shows constant positive change at varying level in respect of the
growth over the year. From the entire period of 12 years this
growth is found highest in the year 2003-04 i.e. 24642
(provisions) over the previous year 2002-03. And growth was
minimum to the tune of 2271 in the year 1999-2000 over the
previous year.
(2) Mean of GSDP for the reference period in the state is found
106461.75. Looking at the table it is found that during the first 6
years i.e. from 1993-94 to 1998-99 GSDP in number tends to be
less than the mean of 12 years. From amongst the entire period it
is found maximum in 2004-05 as per quick estimates and that it is
found minimum in the very beginning year 1993-94.
(3) Gap in GSDP at state level between maximum and minimum
number is found to the time of 130400 i.e. 265.34 percentage
share to the total of India it appears that it was highest in the year
2003-04 (7.30%) and that it was lowest in the year 2000-01
(4.35%)
(4) Considering the data of GSDP at current price at all India level it
is found that there has been constant positive change over the year
except in the year 2000-01 where it is found negative.
(5) From the entire reference period the mean comes about
1610621.16. As against this first six years i.e. from 1993-94 to
198
1999-2000 showed GSDP less than the mean number and the
remaining years shows more than that. From amongst 12 years of
period it is found that in the year 2004-05 quick estimates show
highest figure which this was found lowest (minimum) in the
beginning year 1993-94.
(6) Gap found between minimum and maximum appears to be of
1749878 i.e. 223.96 percentage more. Examining growth over the
year during the reference period it is further found that it was little
negative in the year 2001-02, but for that there was positive
growth with highest rate of growth during the year of 2004-05
over the previous year of 2003-04.

199
Table - 4.23

200
Table No. 4.23 refers to the status of Net State Domestic Product
(NSDP) at constant price of 1993-94. Examining the table following
major inferences can be derived.
(A) NSDP of Gujarat State shows fluctuating trends over the period of
time. From amongst 12 years of period the year 1997-98 and the
year 1999-2000 shows negative growth over the previous year
respectively. Whole the remaining years show positive change
over the year.
(B) NSDP of Gujarat State in percentage to the total of India show
changes over the years at varying degrees. Maximum share in
percentage is observed in the year 2003-04 (7.92) followed by
7.02% in the year 1996-97, while it is found lowest in the year
2004-05 (4.24%) as per the quick estimates.
(C) Out of 12 years period NSDP in the state is found less than the
mean in the first 8 years of period. Gap between maximum NSDP
and minimum tends to be of 48223 i.e. 113.30% rise during the
span of 12 years.
(D) All India picture in respect of NSDP at constant price reveals the
fact that in the beginning 5 years NSDP in number was less than
the mean of the aggregate period. It is further found that growth
over the years in general is found positive except in the year
2003-04 in which it is found negative less than the previous year
2002-03.
(E) Maximum amount NSDP tends to be 2141776 in the year 2004-
05 as per quick estimates is found 1443784 more than the

201
minimum in the year 1993-94 indicating 206.85% rise in that
regard.
(F) Gap between maximum and minimum NSDP at state level tends
to be 109956 i.e. 258.35% rise while this gap at the national level
is observed of 1833231 i.e. 262.64% rise. Thus growth rate in
NSDP suggests more progress at the all India level in comparison
with Gujarat State.

202
Table - 4.24
203
Table No. 4.24 provides data on NSDP of state and India at
current prices. Following major trends are available from the table.
(1) NSDP of Gujarat state reflects that fact that mean of 12 years
tends to be of 91686. It is found from the table that during the first
seven years i.e. 1993-94 to 1999-2000 years wise NSDP was less
than the average while in the remaining years of period it is found
more than the mean.
(2) NSDP growth over the year during the reference period
demonstrates fluctuating trends. In general there is positive trend
in the growth rate but the degree of growth varies over the years.
It observed that in the year 2003-04 NSDP growths is found
maximum over the previous year 2002-03.
(3) Percentage share in NSDP to the total of India is examined
highlights the fact that there have been fluctuating found in the
percentage share. From amongst 12 years of period this share is
however reported to be maximum, in 1996-97 while it is found
minimum in 1999-2000 and 2000-01 consecutively.
(4) NSDP trend in All India indicates that during first six years i.e.
from 1993-94 to 1998-99 - this number is found less than the
mean NSDP of all India of the selected period. While in the
remaining years it is found more than that. As per quick estimates
of 2004-05, NSDP in that year is found maximum while this in
the beginning year 1993-94 is reported to be minimum.
(5) The table in general indicates growth over the years in the
positive directions though rate of the growth tends to have
fluctuations over the period.

204
SECTION - V
PER-CAPITA GSDP - NSDP
This section refers to the data on per-capita GSDP and per-capita
NSDP both at constant and current price. It covers the period from
1993-94 to 2003-04 and 2004-05. Four separate tables are there in this
section.

205
Table - 4.25
206
Table No. 4.25 highlights the status of per-capita GSDP at
constant price both of Gujarat State and India. It is found from this table
that -
(A) Per-capita GSDP in Gujarat State shows fluctuating trends over
the period of time. It is found increasing from 1993-94 to 1998-
99. It showed little downward trend in 1999-2000 and there after
it shows continuous increase. Gap in per-capita GSDP between
the beginning year 1993-94 i.e. 11323 and the last year 2003-04
i.e. 19673 is found of 8350 which shows 73.74 percentage rise.
Growth over the year if examined reveals the fact that growth in
percentage is found varying with greater intensity of lower
growth. However, it is found highest in 2003-04 over the previous
year i.e. 13.34 next to only the year of 1994-95 which topped
during the reference period by registering 15.73% growth over
1993-94. As mentioned earlier growth rate was found negative in
the year 1999-2000 over the previous year. Mean of per-capita
GSDP is 15344, which indicates that from 1993-94 to 1998-99
GSDP per-capita was less than the mean of 11 years which in the
remaining 6 years it was more than that amount
(B) GSDP per-capita for India is shown from the period 1993-94 to
2000-2001. It is found increasing constantly over the years. The
amount as reflected in the table was 8312 in 1993-94 which went
upto 10817 in 2000-2001 i.e. gap between the two is of Rs. 2505
i.e. 30.13% rise. Growth in percentage over the year tends to be of
lower rate in comparison with the growth reflected in Gujarat
State.

207
Table - 4.26
208
Table No. 4.26 indicates per-capita GSDP at current price. It
reveals that in case of Gujarat State it is found increasing constantly. It
is found minimum 11323 in the year 1993-94 and maximum in 2003-04
i.e. 31672. Thus it shows the gap of 20649 i.e. 182.36 percentage rise
during the period referred for the study purpose. Mean of 11 year of per-
capita GSDP at current price is to the tune of 20863 - demonstrating the
fact that during 1993-94 to 1997-98. The amount was less than the
average and more than the average in the remaining 6 years. Figures in
the bracket in Gujarat State show yearly growth over in per-capita
GSDP in percentage. It is revealed from it that in general growth tends
to be positive over the year though fluctuating rate. Highest in
percentage is found in 1994-95 with 26.60 percentage and next best was
found in the year 2003-04 with 16.50%. It was however found minimum
in the year 1999-2000 with 0.60 percentage.
Like per-capita GSDP at constant price, the same trend with little
variation is found at national level. The maximum amount was found in
2000-01 i.e. 17111 while minimum was found the gap between this
tends to be of Rs. 8798 i.e. 105.83% change over the period.

209
Table - 4.27
210
Per-capita NSDP at constant price of Gujarat State and All India
is reflected in Table No. 4.27. In 1993-94, the beginning year of
reference period in Gujarat the amount was 9396 which went upto
16878 in 2004-05. This means during the entire period of study. There
was an increase of 7282 i.e. 77.50% rise in per-capita NSDP. Mean of
11 years NSDP tends to be 13,325 i.e. from 12 years of study period, 8
year show per-capita amount less than the average while in the four
years it was found more than that. Growth in per-capita NSDP over the
years in case of Gujarat shows that it was found negative in the year
1997-98 over the year 1996-97 again in 1999-2000 over 1998-99 and
lastly it felt short of little 0.36 percentage in 2000-01 over 1999-2000.
The remaining period suggests absolute positive trend in this respect.
Growth in percentage over the previous year was however found
maximum in 1994-95 over 1993-94 (22.76%) and in 2003-04 (14.85%)
over the year 2002-03. It is found from the table that at all India level
per-capita NSDP shows continuous positive growth but at a low rate
however exceptionally in the year 2003-04 growth over the previous
year is reported very high (68.13 percentage) in the last year of 2004-05
growth over the percentage is found of 5.87%. Per-capita NSDP in
average tends to be 10645 which shows that first eight years per-capita
NSDP was less than the average in India.

211
Table - 4.28

212
Per-capita NSDP of Gujarat and all India is presented in the Table
No. 4.28 at current price. This refers to the period beginning from 1993-
94 to 2004-05. It is observed from this tale that except in the year 1999-
2000, during all other years growth in per-capita NSDP is found positive
at varied degree. Growth over the year in percentage shows maximum in
the year 1994-95 over the previous year 1993-94 i.e. 34.52% followed
by 1996-97 over 1995-96 i.e. 18.20%. Mean amount worked out from
12 years aggregate turns out to be 18540 which shows that first five
years per-capita NSDP was less than the average while in the follow-up
seven years it was found more than the average. Gap between the first
year of the period 1993-94 and last year of the period 2004-05 in per-
capita NSDP tends to be of 18959 i.e. 201.77% more.
In context of India the table further reveals the fact that it has also
shown increasing trend constantly but in less degree. Average per-capita
NSDP of 12 years appear to be 14352. It means that during first seven
years per-capita NSDP at India level was less than the average of 12
years while in the last five years it was found more than the average.
The gap between minimum i.e. 7394 and maximum 23222 is of 15828
i.e. 214.06%.

213
SECTION - VI
SECTORAL SHARE IN GSDP
There are 2 broad exhaustive tables are presented in this section.
These two tables provide sectoral share in GDP with breakup of three
main sectors. These data refer to the period from 1993-94 to 2004-05.
Data of 2002-03 and 2003-04 are provisional are and data of 2004-05
are quick estimated worked out by the bureau of economics and
statistics, Government of Gujarat. Figures indicated into brackets show
percentage contribution to the total GSDP of the state.

214
Table - 4.29
215
This table refers to domestic product of the state by industry
groups at constant price. Following are the major facts observed from
the table.
(A) All the three sectors at large show fluctuating trends in respect of
each one's share to GSDP over the years specified in the table.
(B) Year wise picture as demonstrated in the table reflects the fact
that by and large primary sector's contribution to the total GSDP
is found declining. From amongst 12 years period this
contribution in percentage to the total is found minimum in the
year 2000-01 and 2002-03 i.e. 16.7% while it is found maximum
in the year 1994-95 i.e. 31.6%. Looking at the 12 years' total
percentage which shows 22.11%. It can be said that out of 12
years in the beginning 6 years i.e. from 1993-94 to 1998-99
primary sector's share is found more than aggregate's total
percentage share, while in the later 6 years part show that share in
percentage less than aggregate's percentage share.
It is also reflected further from the table that in terms of
physical amount share of agriculture to the GSDP was found
highest in the year 2003-04 - though percentage share to the total
at that amount was much less than what is was in 1994-95. This
therefore reveals the fact that even with an increase in physical
amount share of primary sector in comparison with other two
sectors has not increased.
One important indicator to be examined particularly for
primary sector is its growth over the previous year. In percentage
number as mentioned earlier it shows ups and downs over the

216
period of time. In respect of growth over the year it is found as
under.
In the year 1994-95 growth over the previous year in
percentage was 27.02%. In the year 1995-96 this growth rate was
found to be negative by 11.82 percentage. Primary sector in 1996-
97 grew by about 32.66 percentage - this trend however show
decelerating one again in the year 1997-98, this happened to be
1.95%. The year 1998-99 showed again rise of 5.36%. Year 1999-
2000 showed further fall in share by 24.15 percentage, this trend
of decline continued further in the year 2000-01, where in the fall
was of 12.96 percentage. Growth in percentage in the year 2001-
02 again went up by 27.93%. This however was not maintained in
the year 2002-03, which indicated decline in growth by 11.09%.
Year 2003-04 shows an increase in growth again by 50.28% and
lastly in the year 2004-05 growth in percentage was found
negatively 8.94%.
(C) Secondary (industry) sector as reflected in the table has played
important role in GSDP of Gujarat State. Looking at the sector's
contribution to GSDP in percentage it is found that from amongst
the study of last 12 years it was found minimum in 1994-95
(32.7%) and maximum in 2002-03 (40.2%). In physical amount
the gap between lowest amount - 167056 (in 1994-95) and 41837
(quick estimated 2004-05) tends to be of 25132 i.e. 150.44% rise.
The year 1994-95 which showed lowest percentage share in
comparison with other years, however showed maximum share in
the same year in comparison with primary and tertiary sector. And
217
the year 2002-03 which indicated highest percentage share in
comparison with other years however was less than tertiary
sector's share in the same year.
It is found from the last column of the table that percentage
share in aggregate of 12 years appeared to be 37.31 percent.
Considering this percentage share in aggregate - out of 12 years
study period during 8 years, this share was less than the aggregate
share. However, if growth over the years if examined it is
revealed that unlike primary sector secondary sector shows
positive trend in the respect through out the period of 12 years
except in the year 1994-95 and 2000-01 which demonstrated
negative growth. However growth in percentage was found
fluctuating over the period of time. Secondary sector share in
GSDP if examined year by year - thus reflected that in the year
1994-95 this growth in percentage was found negative by -5.05
percentage. The year 1995-96 showed an increase of 9.33 percent.
This trend continued in 1996-97 showing rise of about 11.96
percentage over the previous year. Year 1997-98 showed sizeable
jump in growth over the previous year demonstrating 26.96
percentage over the previous year. This growth went little down
by +8.30 percent in the year 1998-99. This trend of increase in
sectoral share continued in the year 1999-2000 by showing
growth of +9.83 percent change over the preceding year. The year
2000-01 however again demonstrated negative change in sectoral
share falling by -2.82 percentage. In the year 2001-02 this share
was increased by just 1.27 percentage. The year 2002-03 is found
218
most significant one by having addition in the growth about 16.90
percent. This trend with little less degree continued to have
change in the last 2 years i.e. 2003-04 (7.67% and in 2004-05
9.33 percent).
(D) Looking at the contribution of tertiary sector to GSDP it is clearly
found that this sector has continuously increased its significance
in respect of changing pattern of sectoral development. Of the
three broad sectors this sector continues to enjoy greater
significance in comparison with primary and secondary sector.
Examining the trend over the period it is found that in physical
amount the share was found declining only and exceptionally in
the year 1994-95. Out of 12 years study period the share of the
sector is found more than the aggregate of 12 years six times
while in the beginning six years this share was found less than the
share in aggregate of 12 years. In the beginning year of the study
period i.e. in 1993-94 share in amount was found minimum 17079
which is found highest in the year 2004-05 i.e. 45440, this
indicating the gap of 26366 in percentage it tends to be 138.23%
rise over the period. Growth in tertiary sector's share if examined
over the year suggests positive change though of varying degree.
The year 1995-96 showed an increase in the growth by 10.00
which continued to have positive change of 6.17%. The year
1997-98 showed an increase in its share over the previous year by
26.11 percentage. In the year 1998-99 this again went up by 7.32
percent. The year 1999-2000 showed an increase of 12.34
percentage in the growth of the sector over the previous years.

219
Little growth of 1.24 percent was observed in the year 2000-01. In
the year 2001-02 this growth in share in percentage was reported
to be of 7.18 and successively in the year 2002-03 the change in
the growth was of 7.80 percentage. As per the provisional figure
of 2003-04 tertiary sector's share further grew by 8.86 percent
over the previous year. The year 2004-05's quick estimates reflect
the growth in percentage over the previous year of about 8.63%.
(E) Sectoral share also needs to be examined in context of the
subcomponent's role respectively. Broad analysis of components
of each sector demonstrated following factors. (I) As long as
agriculture (primary) sector is concerned direct agriculture
including animal husbandry is the single most important
component contributing most to the primary sector. Percentage
share of direct agriculture to the primary sector if examined and
analysed clearly reveal the fact that from within the sector its
share to the sector is found 78.19 percent in the year 1993-94,
85.28 percent in 1994-95, 83.62 percent in 1996-97. The year
1997-98 registered 83.60 percent share. This further demonstrated
the share in percentage as under - during the year from 1998-99 to
2004-05 respectively - 85.03, 80.09, 78.20, 82.51, 78.66, 85.64
and 83.94%. Thus in aggregate that share was of 83.08
percentage. This shows very clearly the dominant role the direct
agriculture plays in promoting the economy through primary
sector. (II) More or less similar is the trend observed in case of
manufacturing sectors role in secondary industry sector. This also
is examined and analysed suggest the following trends
220
respectively in the years covered under study - 79.53, 82.04,
81.40, 83.21, 81.28, 81.22, 79.35, 80.69, 81.91, 80.26, 80.41 and
lastly 79.47 percentage. In aggregate of 12 years this is reflected
as 180.74%.
In context of tertiary sector - total product from tertiary
sector is found more from trade, hotel, communication followed
by banking and insurance while public administrations and other
services contribute the least to the tertiary sector. In the very
beginning year of study period i.e. in 1993-94 trade, hotel
contributed 44.71% to the tertiary sector while 33.75 percent to
the tertiary sector generated from banking and insurance while
public administrative services contributed 21.54% to the tertiary
sector. This share in percentage is found as under in the respective
years 45.04 percent, 32.54 percent and 22.42 percent in 1994-95.
This share followed by 46.15, 32.27 and 21.58 percent in the year
1995-96. This was found 49.27 percent, 29.1 percent and 21.72
percent in 1996-97. In the years to follow public administrative
services improved its share to tertiary sector in physical amount
and also in percentage. However in general trade services,
restaurant, hotel, storage and communication were the leading
services area which has contributed more to the tertiary sector. It
is also found in follow through that tertiary sector in general has
shown more positive trends in context of contributive shares in
comparison with primary and secondary sector. In view of
examining the relationship between the sector and with aggregate
GSDP Table 4.29(A) could be of much help.
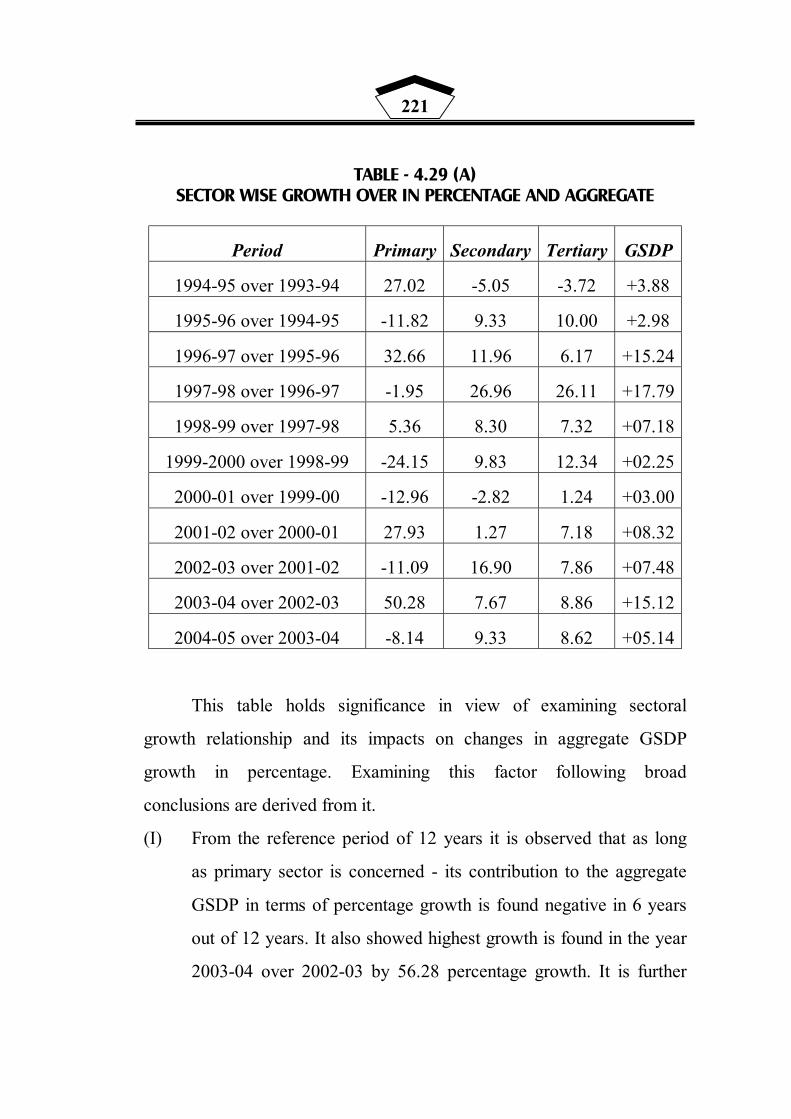
221
TABLE - 4.29 (A)
SECTOR WISE GROWTH OVER IN PERCENTAGE AND AGGREGATE
Period Primary Secondary Tertiary GSDP
1994-95 over 1993-94 27.02 -5.05 -3.72 +3.88
1995-96 over 1994-95 -11.82 9.33 10.00 +2.98
1996-97 over 1995-96 32.66 11.96 6.17 +15.24
1997-98 over 1996-97 -1.95 26.96 26.11 +17.79
1998-99 over 1997-98 5.36 8.30 7.32 +07.18
1999-2000 over 1998-99 -24.15 9.83 12.34 +02.25
2000-01 over 1999-00 -12.96 -2.82 1.24 +03.00
2001-02 over 2000-01 27.93 1.27 7.18 +08.32
2002-03 over 2001-02 -11.09 16.90 7.86 +07.48
2003-04 over 2002-03 50.28 7.67 8.86 +15.12
2004-05 over 2003-04 -8.14 9.33 8.62 +05.14
This table holds significance in view of examining sectoral
growth relationship and its impacts on changes in aggregate GSDP
growth in percentage. Examining this factor following broad
conclusions are derived from it.
(I) From the reference period of 12 years it is observed that as long
as primary sector is concerned - its contribution to the aggregate
GSDP in terms of percentage growth is found negative in 6 years
out of 12 years. It also showed highest growth is found in the year
2003-04 over 2002-03 by 56.28 percentage growth. It is further
222
observed that primary sector's growth over the years in percentage
shows significant change when there is positive growth. It was
only in the 1998-99 that the growth over the percentage over
1997-98 shows very little positive growth.
(II) In context of secondary sector it is observed that out of 12 years'
reference period it is only in the year 1994-95 and 2000-01 that
the growth in percentage over the previous year was negative.
Highest growth in percentage from amongst the reference period
was found in the year 1997-98 over 1996-97 i.e. 26.99%.
(II) Tertiary sector shows negative growth only once in the beginning
period i.e. in the year 1994-95 over 1993-94 by -3.88%. Except
that year growth over the previous year in percentage shows
continuous positive trade. However most significant change in
respect of growth over in percentage was found in the year 1997-
98 (26.11%) and 1999-2000 (12.34%).
(III) The three sectors change over the years if examined in respect of
its impacts over the change in aggregate GSDP it can be
concluded.
(IV) Highest growth in aggregate GSDP is shown in the year in which
the growth over in percentage of secondary sector and tertiary
sector was highest though growth in percentage of secondary
sector was little more than tertiary sector. It is also important to
note that growth over in percentage of aggregate GSDP is found
significantly very less (2.25 in 1999-2000 and 2.18 in 1995-96)
from amongst the 12 years - the years in which primary sector's
growth was found significantly negative high. Only 1997-98 is

223
the year in which exceptionally high is the growth over in
percentage despite the fact that growth of primary sector was
negative in that year.
No other sector showed growth as high as primary sector
showed from amongst the entire period of study i.e. from 1993-94
to 2004-05. It was found +50.28 percentage growth over the
previous year found in primary sector. Similarly highest and
exceptional high negative growth is also observed in case of
primary sector -26.15 percentage fall in the growth in 1999-2000
over the previous year 1998-99.

224
Table 4.30

225
This table provides data on sectoral contribution to GSDP in
Gujarat State. It covers the period beginning from 1993-94 to 2004-05.
Examining the data presented in the table following major conclusions
can be derived.
(A) Primary sector's contribution in percentage to GSDP shows
fluctuating trends over the period of time. From amongst the 12
years period this share in percentage is found highest (30.4%) in
the year 1994-95 while this is found lowest 17.6% in the year
2000-01. Gap in physical amount of primary sectors contribution
tends to be of 21675 (i.e. 173.05% rise). Looking at the sectoral
share to aggregate of 12 years GSDP, it is found 21.79
percentage. It thus reveals the fact that from 12 years of period
primary sectors share in percentage to GSDP is found less than
aggregate share in 6 years while in the remaining 6 years its share
is found more than what it is found in aggregate of 12 years.
(B) Components role in respect of primary sector if examined reveals
the fact that direct agricultural operations have contributed
significantly more to the total of primary sector. This if examined
in respect of percentage demonstrates the fact that it was found
78.11% in the year 1993-94, while in 1994-95 it was to the tune
of 84.95%, in the year 1995-96 it reflected 84.52%, again in the
year 1996-97 - 87.08%, further in 1997-98 it was 84.53%. The
year 1998-99 reflected direct share of agriculture 86.22% which
was reported to be 83.90% in 1999-2000. In the year 2000-01 it
showed 77.22 percentage followed by 79.34% in 2001-02. The
year 2002-03 registered contribution of 70.94 percentage, 78.39
226
percentage was the contribution of direct agriculture in the year
2003-04, while quick estimates of 2004-05 reflected 74.31
percentage share of direct agriculture to primary sector.
(C) At current price secondary sector's contribution to GSDP shows
positive trend in general with little variation in the percentage to
GSDP. However in physical amount secondary sector's share was
found less than the previous year's share in the year 1999-2000.
Secondary sector's contribution to GSDP in physical amount was
found minimum although the reference period 17595 in 1993-94
which was found maximum in 2004-05 - 68894. This expresses
the gap between the two of 51,299 i.e. 291.55% rise over the
period. Percentage share to GSDP also shows variations in degree
through out the period. Percentage share to aggregate GSDP of 12
years is 37.04%. It thus shows that out of 12 years period in 9
years secondary sector's share is found less than the percentage
share to aggregate amount. It is found more than that only in 3
years of the total period of 12 years. Sub-sectoral trend as
highlighted in the table expresses that manufacturing sector has
contributed in percentage to total secondary sector as under. In the
beginning year of 1993-94 this was 79.02 percentage which then
showed 82.10%. In the year 1995-96 manufacturing sector
contributed 80.50 percentage to the secondary sector. This
percentage share was reported to be of 81.50% in 1996-97.
Manufacturing performed positively in the years that followed by
1996-97. This positive share was found 98.91%, 79.19%, 78.27%,
227
79.81%, 78.78%, 77.86%, 78.40% respectively and lastly in
2004-05 - 77.50%.
(D) Tertiary sector in physical amount is found to have increased its
share to the total GSDP over the period of time. It contributed
19074 (38.87%) in the beginning year 1993-94, while in 2004-05
as per quick estimated its contribution was 76450. The gap
between the two suggests rise of 57,376 i.e. 300.80 percentage.
Looking at the aggregate GSDP of 12 years percentage share in
aggregate is found 41.16 percentage. While year wise share if
examined indicates the fact that out of 12 years period in 7 years
this share in percentage was less than the aggregate's share.
Tertiary sector's total is further divided into 3 of the sub-sectors.
Each sub-sector's share is also presented in the table. Of the three
sub-sectors share in physical amount it is clearly found that trade,
hotel, restaurants, storage and communication has remained at the
top every year although out the reference period. It is also
interesting to observe the changes that have taken place in respect
of sub-sectoral performance to GSDP over the years covered
under the study. Trade services, hotel's share in physical amount
appeared to be maximum in the year 2004-05 i.e. 36421 in
percentage it tends to be 47.64 percentage to the total of tertiary
sector. Similar is the performance found in cases of banking and
insurance registering maximum amount in the last year of study
i.e. 22493 (29.42%) of the total of tertiary sector. While public
administration share was found maximum in 2004-05 with 17536
i.e. 22.94 percentage. In the beginning year of the study trade and
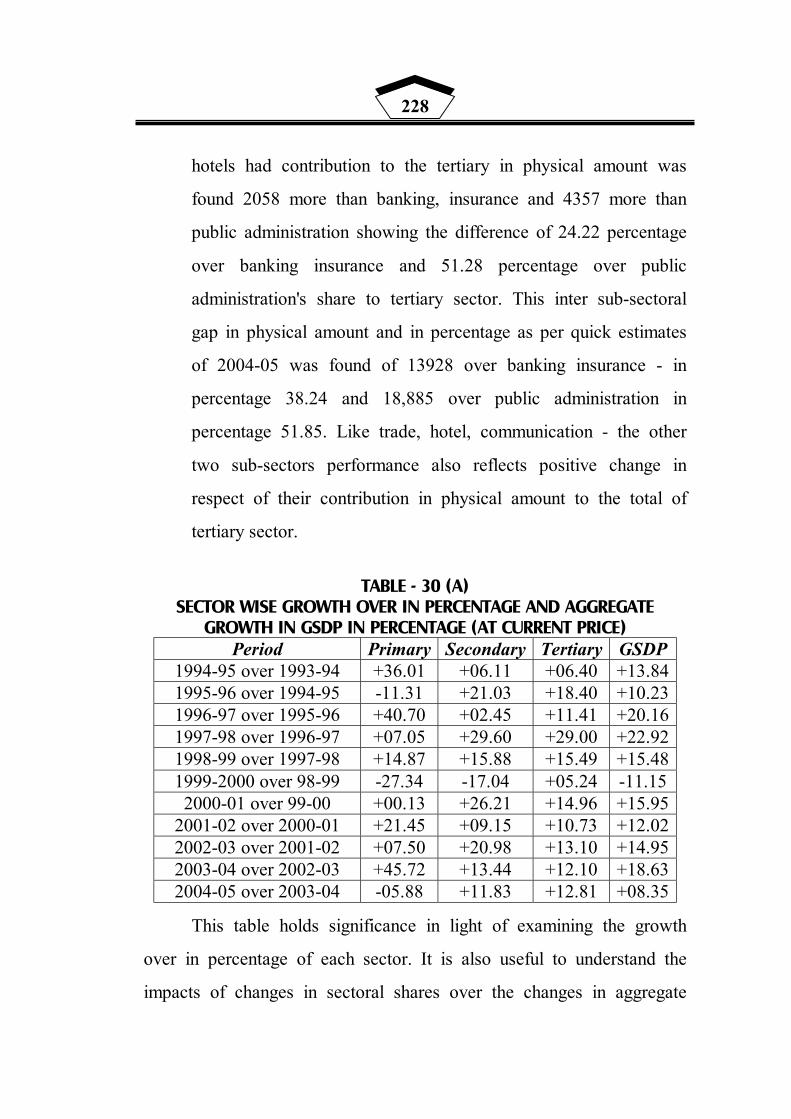
228
hotels had contribution to the tertiary in physical amount was
found 2058 more than banking, insurance and 4357 more than
public administration showing the difference of 24.22 percentage
over banking insurance and 51.28 percentage over public
administration's share to tertiary sector. This inter sub-sectoral
gap in physical amount and in percentage as per quick estimates
of 2004-05 was found of 13928 over banking insurance - in
percentage 38.24 and 18,885 over public administration in
percentage 51.85. Like trade, hotel, communication - the other
two sub-sectors performance also reflects positive change in
respect of their contribution in physical amount to the total of
tertiary sector.
TABLE - 30 (A)
SECTOR WISE GROWTH OVER IN PERCENTAGE AND AGGREGATE GROWTH IN GSDP IN PERCENTAGE (AT CURRENT PRICE)
Period Primary Secondary Tertiary GSDP 1994-95 over 1993-94 +36.01 +06.11 +06.40 +13.84 1995-96 over 1994-95 -11.31 +21.03 +18.40 +10.23 1996-97 over 1995-96 +40.70 +02.45 +11.41 +20.16 1997-98 over 1996-97 +07.05 +29.60 +29.00 +22.92 1998-99 over 1997-98 +14.87 +15.88 +15.49 +15.48 1999-2000 over 98-99 -27.34 -17.04 +05.24 -11.15
2000-01 over 99-00 +00.13 +26.21 +14.96 +15.95 2001-02 over 2000-01 +21.45 +09.15 +10.73 +12.02 2002-03 over 2001-02 +07.50 +20.98 +13.10 +14.95 2003-04 over 2002-03 +45.72 +13.44 +12.10 +18.63 2004-05 over 2003-04 -05.88 +11.83 +12.81 +08.35
This table holds significance in light of examining the growth
over in percentage of each sector. It is also useful to understand the
impacts of changes in sectoral shares over the changes in aggregate
229
GSDP in respective years. Broadly following are the major observations
found from this table.
(A) Growth over the year in percentage if examined of each sector it
is revealed that from amongst the three sectors - primary sector is
found to have negative change 3 times out of 12 years of study
period, while secondary sector tends to have performed negatively
only once from the entire period of study. Tertiary sector has
performed well and positive although the period. It is this trend in
aggregate that has affected aggregate GSDP growth accordingly
reflecting negative trend only once.
(B) Growth over in percentage in case of aggregate GSDP is found
negatively only when both primary and secondary sector
registered negative growth in the year 1999-2000 over the year of
1998-99. Growth over the year in percentage for aggregate GSDP
is found highest (22.92%) in the year 1997-98 over the year 1996-
97 incidentally the year in which both secondary and tertiary
sector registered highest growth in percentage from the entire
period of study. It is also important to note that negative growth
has a taken place 3 times during the years covered under the study
in primary sector. While if it examined deeply it suggests that
only once i.e. in the year 1999-2000 that negative growth in
agriculture is also followed by secondary and tertiary sector.
While in the year 1995-96 and 2004-05 though primary sector
showed negative growth this was not followed by secondary and
tertiary sector and on the contrary in these two years these two
factors registered sizeable positive change. It is also observed
230
from the table that the degree of percentage change is found
maximum and minimum +45.72 percentage in the year 2003-04
and minimum (-27.34%) in the year 1999-2000 in case of primary
sector. From amongst these three sectors the other two have
remained more positive but variation in growth over the
percentage is found less intensive in comparison with primary
sector.
SECTION - VII
AGRICULTURAL GROWTH IN GUJARAT
This section refers to the data presentation and analysis on the
nature and composition of growth in Agriculture that is reflected in the
state economy precisely during the 1993-94 to 2004-05. In general
agrarian growth under reform period in respect of several major
important parameters is examined and analysed under this part. Mainly
it refers to the status of agricultural growth in relation to Indian,
Behavioural changes at sub-regional level of different agricultural
provide, growth in respect of index numbers growth in irrigation, inputs,
produce of ancillary to agriculture etc. In all the entire agrarian growth
is reflected through tables from 4.31 to 4.40.

231
TABLE - 4.31
AGRICULTURAL GROWTH GUJARAT TO INDIA
Agricultural Growth
Units 1996-97 1997-98 1998-99 1999-2000 2000-01 2001-02 2002-03
Gross cropped area : Gujarat Min Hec 11.00 11.16 11.14 10.15 10.69 N.A. N.A. India Min Hec 189.54 190.57 192.62 189.74 187.01 N.A. N.A. No of area sown : Gujarat '000 hec 9600 9674 9667 9667 9643 N.A. N.A. India '000 hec 142819 142083 142598 141231 141101 N.A. N.A. Irrigated area as % of GCA : Gujarat Percent 33.11 33.87 34.46 35.72 33.92 N.A. N.A. India Percent 38.66 31.31 39.43 40.23 40.18 N.A. N.A. Area under food grain Gujarat '000 hec 3846 4077 3719 3235 2928 3465 3213 India Percent 3.11 3.29 2.97 2.63 2.42 2.84 2.88 Production of food grain : Gujarat '000 ton. 4913 5710 5137 3678 2266 4894 3621 India Percent 2.46 2.97 2.52 1.75 1.15 2.30 2.08 Yield (food grain) : Gujarat Kg per hec 1278 1400 1381 1137 774 1442 1127 India Kg per hec 1610 1550 1627 1704 1626 1746 1562 Source : C.M.I.E. Monthly Review of Gujarat Economy, October 2005.
This table throws light on the status of agriculture in the economy
of Gujarat through some main broad variables. These have also been
presented in context of Indian economy. This table refers to main 6 of
the parameters. The data highlights the status covering the period of
1996-97 to 2000-2001.
In respect of agriculture in Gujarat gross cropped area does not
show much variation over the period of time. This tends of least
variation is in conformity to what it is observed at national level. Gross
cropped area in percentage to that of India tends to be 5.80 percentage in
1996-97 followed by 5.77 in 97.98 5.71 in 1998-99, 5.27 in 1999-2000
and 5.35 in 2000-2001. This shows declining trend in percentage.

232
Net area sown as reflected in the table also behaves in the similar
like gross cropped area net area sown also does not highlight large
variations during the period of 1996-97 to 2000-01. In number of
hectares the change is found by +74, -07, 0 and -18 respectively during
the reference period. Unlike GCA however in net area sown changes
found at state level are not found in conformity to what it is observed at
national level. In other words at all India level changes in the net area
sown is found of greater degree and intensity. While in percentage net
area sown to that of total India is found of 6.72%, 6.80%, 6.78%, 6.84
and 6.84%.
Third important trend is presented for irrigation. This highlights
Irrigated area in percentage to gross cropped area at state level and
national level It is revealed from the table that year by year this area in
percentage is found to have an increase except in the year 2000-01. This
is also found in similarity with the trend available at India level. Most
important to note is the fact that irrigated area in percentage to gross
cropped area in Gujarat is found much less than India.
Fourth variable that is presented in the tabulation form is
regarding the area covered under food grain in Gujarat. It also shows
area in percentage to the total area covered at India level.
It is observed that area under food grain at state level is found to
have fluctuating trends during the years referred in the table. As
presented in the table, area in 1000 hect. under food grain in state tends
to have changed by +201, -358, -484, -307, +537 and lastly -252. Thus it
is revealed from the table that area under food grain from amongst the
233
sever years tends to have an increased only two years i.e. 1997-98 and
2001-02. While in percentage to total Indian positive growth is reflected
3 times out of 12 years. Growth over in percentage over previous year is
found as +5.22%, -8.78%, -13.01, -9.49%, +18.34% and lastly -7.27%
Production of food grain is highlighted as independent variable. It
shows in 1000 tonnes and in percentage to the total of India. As
reflected in the table it shows large fluctuations over the period of time
indicated in the table. From amongst 7 years data presented in table only
2 times there is found increasing trend while in the remaining period the
trend shows declining one. It reflect the changes are examined it further
reveals the fact that the degree of decrease in food grain production is
found more in amount i.e. -577, -1459, 1412, and -1273 while an
increase is found to the tune of +797 and +2218. In percentage the
variation is observed as +16.22, -10.10, -39.67%, -38.39%, +97.88 and
-26.01. Food grain production in the state to the percentage of India also
shows fluctuating trends. This percentage share to the total of India is
found highest 2.97% in the year 1997-98 while it is found lowest in the
year 2000-01. i.e. 1.15 percentage. In 1000 tonnes found grain
production from amongst the years indicated in the table is found
maximum in the year 1997-98 while it is reported minimum in the year
2000-01. The gap between maximum and minimum is found to the tune
of 3,444 1000 tonnes.
In this table last but not the least indicator highlighted is of
productions in agriculture. Here in this table it is shown as yield in Kg.
Per Hec. This also demonstrates the fact from amongst the data
234
covering the period yield Kg per hec. is found maximum in 2001-02 in
Gujarat 1992 followed by little less 1400 in 1997-98, while this is
reported minimum in 2002-03 1127 Kg per Hec. At India level highest
yield is reported in 2001-02 1746 Kg. per Hec. followed by 1704 Kg per
Hec. in the year 1999-2000, while minimum yield is found 1550 Kg per
Hec. in the year 1997-98. In terms of percentage change over the year it
is found of +9.54, -1.36, -17.67, -31.92, +86.30 and -21.84%. In
comparison with state the trend at all India level is found of -3.72,
_+5.09, +4.60, -4.57, +7.38 and -10.54 percentage respectively.
These 4 tables (Table No. 4.32 to 4.35) provide sub-regional
breakup of the data on area covered under production in '00 hectares,
production in Million Tonnes and productivity Per Ha. in Kg. It refers to
cereals, pulses and oilseeds. Table 4.35 deals with stability and
variations in the crop across the state having reviewed various reports of
agricultural statistics of Gujarat and socio economic review data is
collected complied and average is computed this has been bifurcated in
to the two time period i.e. from 1990-91 to 1994-95 and the second from
1995-96 to 1999-2000.

235
TABLE - 4.32
CEREAL'S PRODUCTION, CHANGES IN AREA PRODUCTION AND YIELD
19990-91 to 1994-95
1995-96 to 1999-2000
Region
A P Y A P Y North Gujarat
5904 3855 131 4838 390 181
Saurashtra / Kachchh
6662 5489 165 5081 5765 227
Central Gujarat
7578 8251 218 8001 10427 261
South Gujarat
3239 4925 304 3029 4993 330
Gujarat state
24166 22530 186 21978 25736 234
A=Area ('000 Hec.), P=Production (M.Tonnes), Y=Yield (Per/Hec./Kg.) Source : Economic Review, 1991 to 2005. Directorate of Economics, Statistics, Gandhinagar.
Table 4.32 refers to the changes in the area of production, volume
of production and production, and productivity of cereals. It provides
mainly following details.
(I) Considering the area in the first span central Gujarat studies first
with largest area covered under the production of cereals (7578),
followed by Saurashtra and Kachchh (6662). The third is north
Gujarat 5904 hec. and the lost is south Gujarat 3239 hec. While in
respect of yield per ha in Kg it is found that during this first span
of five years south Gujarat stands at the top with 304 Kg followed
by central Gujarat with 218 Kg. Saurashtra Kachchh ranked third
with 165 Kg. per ha and north Gujarat at the last with 131 Kg.
236
Regional breakup in the second span of 1995-96 to 1999-
2000 demonstrates the same rank status in respect of the area
covered under the production of cereals and also in respect of the
yield per hec. in Kg.
(II) However important thing to note is the quantitative change
observed in the second. span in comparison with first span. It is found
from the table that the change is found positive in respect of area
covered under production with an increase of 423 ha while this is found
negative i.e. less area in the south Gujarat, Saurashtra Kachchh and
North Gujarat this is found decreased by 210 Ha in South Gujarat 1581
ha in Saurashtra Kachchh and 1514 Ha in North Gujarat. As against this
the trend in respect of yield as presented in the table highlights the fact
that it has increased in all the sub-regions with highest increase found in
Saurashtra by +62 hec. per Kg followed by +50 Kg per Ha in North
Gujarat central Gujarat reported an increase of 43 Kg per Ha while
South Gujarat this had changed by 24 Ha. Mores.

237
TABLE - 4.33 CHANGING TRENDS IN PULSE PRODUCTION
19990-91 to 1994-95
1995-96 to 1999-2000
Region
A P Y A P Y North Gujarat
1888 1094 582 1680 1119 662
Saurashtra / Kachchh
1475 450 294 1547 595 373
Central Gujarat
2177 1867 897 2245 1834 815
South Gujarat
2095 1340 638 1734 1114 645
Gujarat state
7893 4746 605 7208 4662 646
A=Area ('000 Hec.), P=Production (M.Tonnes), Y=Yield (Per/Hec./Kg.) Source : Economic Review, 1991 to 2005. Directorate of Economics, Statistics, Gandhinagar.
This table refers to the changes observed in the area, production
and yield of pulses during the decreade period in two span examining
the table followed are the major conclusions can be derived.
(I) In the first span of five years (1990-91 to 1994-95) average area
covered under pulses is found maximum in central Gujarat (2177
Ha), followed by South Gujarat (2095 ha) third comes North
Gujarat with 1888 ha and the last is Saurashtra Kachchh with
1475 Ha.
While the data on yield reflects the fact that it is found highest in
central Gujarat 89.7 Kg. followed by south Gujarat 638 Kg third comes
north Gujarat with 582 Kg and lost is Saurashtra with 294 Kg per Ha.
Second span if examined demonstrates that central Gujarat topped
with 2245 Ha area followed by South Gujarat with 1734 Ha and North

238
Gujarat with 1680 and the last is the tara of Saurashtra and Kachchh
with 1547 Ha area About the yield in Kg Per Ha it is again found
maximum in central Gujarat 815 Kg next stood North Gujarat with 682
Kg. the third is the rank of south Gujarat with 645 Kg. and Saurashtra
had the least yield with 373 Kg. per ha.
Changes that are reflect in respect of area covered under paulses
and yield in Kg per Ha between the two span of decade highlights the
fact that, in Central Gujarat and Saurashtra Kachchh there is found an
increase in the area covered under the production of pulse. It has
increased by + 128 Ha in central Gujarat and by + 72 ha in Saurashtra
Kachchh while this shows declining trend in South Gujarat by -271 ha
and -208 ha in north Gujarat while examining the change in respect of
the while examining the change in respect of the yield in Kg per Ha it is
found decreased by -82 Kg in central Gujarat through by region Ha was
first in rank. while in the region ha was first in rank while in the
remaining three sub regions this showed an increase by +79 kg in
Saurashtra Kachchh +80 Kg in North Gujarat and +80 Kg in South
Gujarat respectively.

239
TABLE - 4.34 CHANGING TRENDS IN AREA / PRODUCTION
(YIELDS OF OIL SEEDS) 19990-91 to
1994-95 1995-96 to 1999-2000
Region
A P Y A P Y North Gujarat
5865 7704 1313 5913 8243 1394
Saurashtra / Kachchh
21038 14281 679 20449 17912 876
Central Gujarat
1628 7858 1141 1320 1599 1212
South Gujarat
606 456 753 363 455 1253
Gujarat state
28953 24291 839 28754 30788 1071
A=Area ('000 Hec.), P=Production (M.Tonnes), Y=Yield (Per/Hec./Kg.) Source : Economic Review, 1991 to 2005. Directorate of Economics, Statistics, Gandhinagar.
This table provides data in respect of oil seeds production and
production It is observed from the table that Saurashtra Kachchh has
demonstrated its strong dominance over other sub-regions in respect of
oil seeds Area in average covered under the production of oil seeds is
found highest in both the time period followed by North Gujarat central
Gujarat and south Gujarat in quantity the area covered under oil seeds in
Saurashtra is found declined by 689 ha in the second span in comparison
with the first span. There was found very little increase of +48 ha in
North Gujarat while declining trend was also observed of -308 Ha in
central Gujarat and -243 ha in South Gujarat.
While Total production is reported to have increased by +3711 m.
tones and yield per ha in Kg is also increased by 1797 Kg in Saurashtra
and Kachchh North Gujarat also registered an increase of +539 m tones

240
in production and +81 Kg per Ha in yield per Ha in Kg is reported to be
highest in north Gujarat followed by south Gujarat in second span.
Central Gujarat span third and Saurashtra in that respect was at the
bottom with 876 Kg. per Ha.
TABLE - 4.35
DECADE RATE OF STABILITY IN AGRICULTURAL PRODUCE (1990-91 TO 1999-2000)
Cereals Pulses Oil seeds Region A P Y A P Y A P Y
North Gujarat
14.08 24.27 26.76 9.33 11.55 16.52 3.72 12.07 10.84
Saurashtra / Kachchh
20.71 39.28 34.28 16.45 53.11 41.48 4.02 50.31 52.36
Central Gujarat
4.52 19.05 18.88 17.38 15.16 17.07 14.51 13.68 11.26
South Gujarat
7.50 9.9 6.77 10.98 16.96 12.63 57.15 16.88 27.56
Gujarat state
11.09 18.26 19.78 7.42 15.50 12.29 3.12 34.68 33.75
A=Area ('000 Hec.), P=Production (M.Tonnes), Y=Yield (Per/Hec./Kg.) Source : Economic Review, 1991 to 2005. Directorate of Economics, Statistics, Gandhinagar.
This table is consolidation our throwing light particularly on the
trend of stability and variations found in different regions of the state in
respect of area production and yield of cereals pulses and oil seeds.
Having examined the table following major conclusions can be
derived cereals. Coefficient of variance of presented in the table for the
area under cereals it is found lowest central Gujarat 4.52 suggesting
higher degree of stability in respect of area covered under production of
cereals. While this coefficient of variance is observed highest 20.77%
241
reflecting more in stability in the area covered under the production of
cereals. Coefficient of variance in aggregate Gujarat trends to be 11.59%
showing more instability in the area covered under cereals.
Coefficient of variance in respect of production of cereals is
observed highest 39.28% in Saurashtra while this is found lowest 9.19%
in central Gujarat showing more instability in Saurashtra and more
stability in central Gujarat. Coefficient of variance in respect of
production in aggregate Gujarat is found 18.26% showing greater
instability at the state level in this respect.
To talk about pulses co-efficiently variance presented in the table
highlights the fact that it was found minimum 9.33% in North Gujarat
and maximum 17.38% in central Gujarat. Showing greater stability in
north and instability in central Gujarat. While south Gujarat observed
little less co-efficient variance than Saurashtra Kachchh demonstrating
relatively more stability than Saurashtra and less than North Gujarat for
aggregate Gujarat it is of 7.42% which indicates greater stability in this
respect. Co efficient of variance for production of pulses as responded in
the table is found minimum in north Gujarat (11.56%) and maximum in
Saurashtra Kachchh 53.11%. It thus explains more stability in North
Gujarat and more instability in Saurashtra Kachchh. As indicated in the
table this index in co-efficient of variance for aggregate Gujarat is
reported 15.50%. Showing more instability in production in comparison
with the area covered under the production of pulses.
For oil seeds co-efficient of variation index tends to be lowest in
North Gujarat 3.72% and highest in South Gujarat 57.15% This shows
242
greater instability in respect of the area in South Gujarat while in
Saurashtra area in South Gujarat while in Saurashtra the index tends to
be 4.02% little more instability in comparison with north Gujarat but
better situation than central out south Gujarat. Index for aggregate
Gujarat is found minimum 3.12% showing in aggregate more stability in
respect of the production of oilseeds.
Oil seeds productions co-efficient of variance if examined shows
minimum index in North Gujarat 12.07% and maximum in Saurashtra
Kachchh 50.31%. This shows highest stability in the production of oil
seeds in North Gujarat while it is found more in stability in Saurashtra
Kachchh.
SUMMARY :
Having examined the tables separately and also examining the
consolidated table reflecting co-efficient of variance it is found that
Gujarat in general passing through the phase of more instability in
respect of area covered under different crops and also the production
availed of different crops. This indirectly leads to examine further the
availability of inputs in quantity and quality regained to strengthen and
stabilize the economy of Gujarat stability may work as stimulant to
growth in general.

243
TABLE - 4.36
AREA ('00 HECTARES) IRRIGATED BY SOME IMPORTANT CROPS Crop 1980-
81 1990-
91 1995-
96 1997-
98 1998-
99 1999-2000
2000-01
2001-02
Rice 2001 3108 4066 4392 4341 4249 3756 3710 Wheat 4741 4823 4685 5696 5326 4231 3295 3938 Jowar 335 347 205 159 124 118 1.5 0086 Bajra 1408 1730 2114 2159 2181 2059 1855 1861 All food crops
12656 16272 18791 20734 20714 19133 16914 18512
Cotton 4435 3250 5298 6302 6522 6307 6619 7146 Ground nut
1853 1498 1754 1659 1762 1435 1127 1301
Total oil seeds
NA 6923 7862 7547 7648 7267 6598 6685
Tobacco 798 955 1014 1031 1093 1164 879 896 All non-food crop
10688 12833 16203 17064 17692 17134 16507 17216
Gross irrigated area
23344 29105 34994 37798 38406 36267 33421 35728
Source : Socio-Economic Review, Gujarat - 2005-06, Published by Directorate of Economics and Statistics, Gujarat.
Table - 4.36 - Irrigation works as the most important stimulant to
agrarian growth in the economy. It is in this respect that an attempt is
made in this table to examine and analyze the status of irrigation
available to the agrarian economy of Gujarat. The table provides data on
Area irrigated by some important crops (in '00 hectares) in the economy
of Gujarat. It refers to the data of the year 1980-81, 1990-91 and here
after beginning from 1995-06 to 2001-02
This table demonstrates the following facts
244
(I) Irrigated area under main food crops is found propornately more
than what it is found under non food crops. This trend is found all
through out the period without exception.
(II) In percentage it tends to be 54.21% in the year 1980-81 and
55.91% in the year 199-91. This was found 53.70% in 1995-96,
54.85% in 1997-98, 53.83 in 1998-99, 53.75% in 1999-2000,
50.61% in 2001-02 and lastly in 2001-02 it was found 51.81
percentage. Thus food crops have gained more benefit of thus
food crops have gained more benefit of irrigation than non food
crops although out the period covered under study.
Growth over in percentage if examined. year by year than it is
found as under :
+28.57% in 1999-91 than the 1980-81
+15.48% in 1995-96 over 1990-91
+19.34% in 1997-98 over 1995-96
+00.09% in 1998-99 over 1997-98
-07.63% in 1999-2000 over 1998-99
-11.60% in 2000-2001 over 1999-2000
+09.44% in 2001-02 over 2000-01 respectively
Area under irrigation for oil seeds tends to have increased till
1998-99 but there after it shows declining trend. However in 2001-02 it
was again tend increased over the previous year.
Irrigated area under non food crops tends to show increasing trend
till 1998-99. But from it the year 1999-2000 and 2000-2001 this has
declined respectively but again showed increase in the year 20001-02.
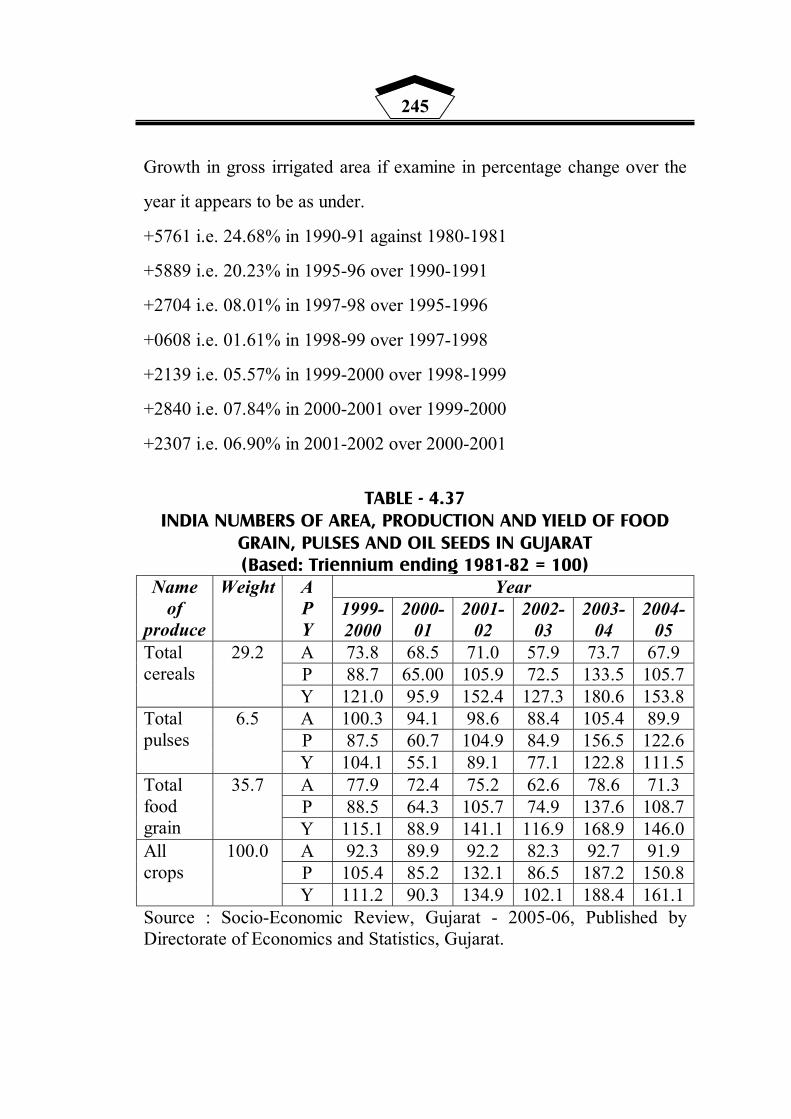
245
Growth in gross irrigated area if examine in percentage change over the
year it appears to be as under.
+5761 i.e. 24.68% in 1990-91 against 1980-1981
+5889 i.e. 20.23% in 1995-96 over 1990-1991
+2704 i.e. 08.01% in 1997-98 over 1995-1996
+0608 i.e. 01.61% in 1998-99 over 1997-1998
+2139 i.e. 05.57% in 1999-2000 over 1998-1999
+2840 i.e. 07.84% in 2000-2001 over 1999-2000
+2307 i.e. 06.90% in 2001-2002 over 2000-2001
TABLE - 4.37
INDIA NUMBERS OF AREA, PRODUCTION AND YIELD OF FOOD GRAIN, PULSES AND OIL SEEDS IN GUJARAT (Based: Triennium ending 1981-82 = 100)
Year Name of
produce
Weight A P Y
1999-2000
2000-01
2001-02
2002-03
2003-04
2004-05
A 73.8 68.5 71.0 57.9 73.7 67.9 P 88.7 65.00 105.9 72.5 133.5 105.7
Total cereals
29.2
Y 121.0 95.9 152.4 127.3 180.6 153.8 A 100.3 94.1 98.6 88.4 105.4 89.9 P 87.5 60.7 104.9 84.9 156.5 122.6
Total pulses
6.5
Y 104.1 55.1 89.1 77.1 122.8 111.5 A 77.9 72.4 75.2 62.6 78.6 71.3 P 88.5 64.3 105.7 74.9 137.6 108.7
Total food grain
35.7
Y 115.1 88.9 141.1 116.9 168.9 146.0 A 92.3 89.9 92.2 82.3 92.7 91.9 P 105.4 85.2 132.1 86.5 187.2 150.8
All crops
100.0
Y 111.2 90.3 134.9 102.1 188.4 161.1 Source : Socio-Economic Review, Gujarat - 2005-06, Published by Directorate of Economics and Statistics, Gujarat.
246
This table throws light on the changes occurred in the last five
years in respect of major agricultural produce. This is reflected in terms
of index numbers worked on the basis of Triennium ending 1981-1982 =
100. Following are the major changes observed over the period of time.
(A) To begin with all crops the productivity index works out to be
161.1 as against what it was 111.2 in the year 1999-2000. It
means an increase of approximately 50 numbers, but in
comparison with the previous year of 2003-04 it has fallow by
27.3 as it was 788.4 in the year 2003-04 similarly for all crops
index for production also increased in 2004-05 by +45.4 numbers
in comparison with 1990-2000 but it has declined by -36.4
numbers in comparison with the previous year comparison with
the previous year 2003-04. While index numbers of area for all
crops is found to have changed very little just by -0.3 in the year
2004-05 in comparison with the year 1999-2000 and it has
declined by -0.8 in comparison with previous year 2003-04
(B) Index numbers of productivity for oil seeds works out to be 153.8
in the year 2004-05 showing an increase of +32.8 index point
over the year 1999-2000 however it shows fall by of -26.8
numbers in comparison with the previous year 2003-04.
Similarly index numbers of production of cereals also show an
increase of +17.0 in the year 2004-05 over the year 1999-2000 but this
does show declining trend of about -27.8 index point in comparison with
the previous year 2003-04.

247
In context of area index numbers in 2004-05 shows fall of -5.9
numbers over the year 1999-2000 and also reported fall of -5.8 points in
comparison with the previous year.
Regarding the index numbers for pulses it demonstrates
fluctuating trends in index numbers for productivity of pulses. The last
year 2004-05 this index number works out to be +7.4 points than it was
in the year 1999-2000. However this index number works out to be
-11.3 points in comparison with the previous year 2003-04. The trend is
found similar for production of pulses and area covered for pulses.
Food grain in Gujarat in respect of Area, production and yield in
terms of index numbers has shown mixed trends over the period of time.
As long as index numbers for food grain in area is concerned it does not
express much variation. Index numbers show decline of -6.6 points in
2004-05 over the year 1999-2000. However in comparison with the year
2003-04 there was fall of -7.3 point. Production index number increased
by +20.2 points but reported fall by -28.9 numbers in 2004-05 over the
previous year. Productivity index numbers show an increase of +30.9
points in the year 2004-05 in comparison with the year 1999-2000.
However this does not behave in the similar fashion in comparison with
2003-04. It shows fall by -22.9 in 2004-05 over the previous year of
2003-04.
To compare the last year estimation of food grain with oil seeds, it
is observed that index number of production of oil seeds has out
numbered food grain index but in respect of productivity food grain
index number has out number productivity index of oil seeds.

248
TABLE - 4.38 CHEMICAL FERTILIZER CONSUMPTION
Year 1993-94 Year 2001-02 District / Sub region Total Consumption
per ha/kg Total Consumption per ha/kg
Banaskantha 43313 38.47 64254 50.00 Patan - 25779 - Mahesana 51475 56.75 35870 68.10 Sabarkantha 47452 88.41 58680 118.50 Gandhinagar 4057 57.63 8662 48.80 Amdavad 39246 66.53 52299 79.40 Kacchh 14964 22.6 30845 38.50 Surendranagar 22851 32.39 52562 36.10 Rajkot 45460 58.58 67652 86.60 Jamnagar 15899 24.69 38838 38.30 Porbandar - - 13835 - Junagadh 40232 60.2 43954 69.10 Amreli 25057 47.23 28257 64.10 Bhavnagar 39948 60 40533 62.80 Anand - - 44060 - Kheda 81819 125.05 46275 139.80 Panchmahal 26948 47.17 18273 60.30 Dahod - - 10185 - Vadodara 47051 82.68 58638 100.80 Narmada - - 5368 - Bharuch 20281 48.1 29627 60.50 Surat 73187 149.42 99122 139.00 The Dangs 23 0.41 38 - Navsari - - 20637 - Valsad 30218 87.49 2091 95.20 North Gujarat 37108.6 61.56 40924 73.06 Sau. - Kutchchh 29201.57 43.74 39559 56.42 Central Guj 51939.33 84.96 35486 103.69 Sough Gug 30927.25 71.35 29297 73.52 Gujarat state 669029 60.85 915234 74.00 Source : Development Indicators of Gujarat - 1999-2000. Socio-economic Analysis Division, Directorate of Economics and Statistics, Government of Gujarat, Gandhinagar.

249
Growth of each section depends on various inputs. Agricultural
growth is highly influenced by the use of certain inputs. Chemical
fertilizer is one such input its use affects to the quantity and quality of
agricultural produce. An attempt is made to have overview on the use of
chemical fertilizer at large in practice in different districts of the state.
Data also shows consumption of fertilizer in terms of per ha/kg. To have
a comparative look 2 different years data from within the period of
reform is presented here. Based on district wise data an attempt is made
to compare average use of fertilizer by sub regional area breakup. This
would also be of use to understand the gap that prevails between the
districts and between the sub regions. This leads to have broad
conclusions as under.
(A) An aggregate state the use of chemical fertilizers in year 2001-02
is reported to have increased by 246205 i.e. from 669029 in 1993-
94 to 915234 in the year 2001-02. This expresses the rise of 36.80
percentage.
This if further analyzed from sub regional context the difference
in average consumption in the year 1993-94 is found maximum in
central Gujarat 51939.33 followed by North Gujarat 37108.60 South
Gujarat reported consumption of 30927.25 and Saurashtra had the
minimum use of 29201.57. This trend when compared with the year
2001-02 showed an increase in the regions like North Gujarat and
Saurashtra Kachchh but in case of Central Gujarat and South Gujarat it
showed following in average use of fertilizers.

250
Data on per ha/kg use of chemical fertilizers tend to per form
positively at the aggregate State level. There was found an increase of
+13.15 Kg in 2001-02 in comparison with 1993-94, Sub regional trends
show clearly positive changes in all the sub regions though of varying
degree. In North Gujarat this showed an increase of 11.50 Kg per ha in
2001-02 in comparison with 1993-94, while this change as indicated in
the table was found to be tune of +12.68 Kg per ha Central Gujarat
demonstrated an increase of +18.73 Kg per ha while only +2.17 Kg per
ha was the change reflected in respect of South Gujarat.
However distribution data revealed the fact that in total use as
well as consumption per ha/kg. was found maximum in Surat in the year
1993-94 and in 2001-02 only per ha/kg consumption in Surat was found
next to Kheda district. The difference in per ha/kg consumption between
these two districts was however only of 0.08. It these two data when
compared with the time perspective it is observed that in 2001-02 Kheda
improved the situation with increase of +14.03 while Surat performed
much less in time perspective with having declining trend by -10.42.

251
TABLE - 4.39 STATISTICS ON MILK COLLECTION / PRODUCTION / SALES CHILLING
CENTERS AND THEIR CAPACITY Liquid milk plants Milk chilling centres
Year Collection of
milk in lakh kg Number Capacity '000
lit/per day Number Capacity '000 lit/per day
Milk and milk products produced
Milk and milk products
sold 1991-92 10342 19 4235 38 1137 53754 203210 1992-93 11363 19 4775 38 1436 59273 267712 1993-94 11914 19 4775 35 1436 59760 321223 1994-95 20412 19 4775 35 1482 77088 262837 1995-96 9480 19 4870 38 1913 102358 111884 1996-97 7983 19 4975 38 1915 120376 148547 1997-98 14448 18 5375 36 1875 124300 152484 1998-99 15114 18 4975 34 2563 137072 245356
1999-2000 16228 12 4870 31 2497 147058 274219 2000-01 16556 12 5510 32 2837 137711 302884 2001-02 17261 12 5510 33 2957 - -
Source : Statistical Abstract of Gujarat, 2000 - Directorate of Economy and Statistics, Government of Gujarat, Gandhinagar P. No. 190.217
Milk is important component in agricultural produce. It is also
important to note that milk production in Gujarat assumes greater
significance in context of India's cattle economy and from global
perspective too. This has considerable place to occupy. Therefore milk
economy of Gujarat needs to be examined in view of changing scenario
of agrarian economy of the state under reform period.
An attempt is made here to under steno examine the changes
observed broadly pertaining to the production and produce value of milk
in the economy of Gujarat. It expresses the changes based on the data
presented covering the period of 1991-92 to 2001-02. 11 years picture is
presented in this table. This table highlights the following changes.
(A) Looking at the collection of milk in lakh Kg it is found that there
are sharp fluctuations observed in respect of the time period. In
the beginning of it shows increasing trend till 1993-94 there after
252
for 3 years successively there is fall in the collection of milk i.e.
from 1994-95 to 1996-97. Again from the year 1997-98 till 2001-
02 there is an increase found over the years successively. Data of
1991-92 when compared with the year 2001-02 shows +919 i.e.
8.89 percentage increase during the period from amongst 11 years
period minimum collection of milk was reported 7983 in the year
1996-97
(B) Data on milk and milk products are presented separately in
column of this table. It is found from this section that in numbers
this shows increase over the years from 1991-92 to the year 1999-
2000 it is only in the year 2000-01 that it shows fall when
compared with the year 1999-2000 growth in percentage over the
year tends to be as under:
+10.26% change in 1992-93 over 1991-92
+00.82% change in 1993-94 over 1992-93
+28.99% change in 1994-95 over 1993-94
+32.78% change in 1995-96 over 1994-95
+17.60% change in 1996-97 over 1995-96
+03.26% change in 1997-98 over 1996-97
+10.27% change in 1998-99 over 1997-98
+07.28% change in 1999-2000 over 1998-99
+6.35% change in 2000-01 over 1999-2000

253
TABLE - 4.40 MARINE AND INLAND FISH PRODUCTION
Fish production (in tonnes) Year Marine Irland Total
Value (Rs. in crore)
1991-92 530017 39870 569887 518.02 1992-93 609103 51154 660257 689.01 1993-94 619836 65019 684855 821.42 1994-95 645261 70100 715361 1010.18 1995-96 598351 60158 658509 959.33 1996-97 660068 65278 725346 1111.31 1997-98 702355 70450 772805 1266.10 1998-99 551660 80068 631728 1195.24
1999-2000 670951 70330 741281 1452.93 2000-01 620474 40267 660741 1374.10 2001-02 650829 50774 701603 1683.33 2002-03 743638 34267 777905 1889.36 2003-04 60916 45436 106352 1688.15 2004-05 584951 50628 635579 1701.10
Source : Socio-Economic Review. Gujarat State 2005-06, P. S.24, Directorate of Economics and Statistics, Gandhinagar.
This table highlights production of Marine and Inland fish
reported in Gujarat during the period of last 14 years i.e. beginning from
1991-92 to 2004-05. It is revealed from the table that the production of
fish in the state shows fluctuating trends over the period of time. These
fluctuating trends are observed in both Marine as well as Inland fish
production. From amongst 14 years of period it is found maximum in
the year 2002-03 i.e. 777905 while it is found minimum in the year
1991-92 i.e. 569887. If this total production growth in percentage over
the year is taken into consideration the trend is found as under.
+1.58% in the year 1992-93 over 1991-92
+3.72% in the year 1993-94 over 1992-93
+4.45% in the year 1994-95 over 1993-94
-7.95% in the year 1995-96 over 1994-95
254
+10.15% in the year 1996-97 over 1995-96
+06.54% in the year 1997-98 over 1996-97
-18.25% in the year 1998-99 over 1997-98
+17.34% in the year 1999-2000 over 1998-99
-10.86% in the year 2000-2001 over 1999-2000
+06.18% in the year 2001-2002 over 2000-2001
+10.87% in the year 2002-2003 over 2001-2002
-15.85% in the year 2003-2004 over 2002-2003
-02.90% in the year 2004-2005 over 2003-2004
This shows that out of 14 years, in 8 years growth is found
positive while in 5 years growth is found negative.
Similarly looking at the value (Rs. Crore) also shows fluctuations
over the period of time. It is found from the table that growth over the
previous year if examined indicates positive trend in 9 years over the
respective previous years while in 4 years this growth is found negative
over the previous year from within the entire period value in Rs. Crore is
reported highest in the year 2002-03 i.e. 1889.36 while this is found
lowest (minimum) in the year 1991-92 i.e. 518.02. In respect of fish
production it is also observed through out the reference period in the
state there is found dominance of Marine fish over inland fish.

255
SECTION - VIII
INDUSTRIAL GROWTH IN GUJARAT
This section mainly refers to the nature and composition of the
growth that is visualized in the industrial economy of Gujarat State. An
attempt is made to examine the changes observed during the reference
period i.e. post reform period in the different segments of industrial
economy. In total 14 tables are presented indicating number of Units
investments, value added, employment etc. The data highlights district
wise. Sub region wise and aggregate scenario for certain segments and
also throws light on the compositional breakup progress over the period
of time. Table No. 4.41 to 4.52 - all these tables throw light on pattern of
industrial growth of Gujarat.
TABLE - 4.41 INDUSTRY SECTOR GROWTH AT A GLANCE GUJARAT
RELATION OF INDIA
Item 1996-
97 1997-
98 1998-
99 1999-2000
2000-01
2001-02
Factory Nos. 13405 13391 15455 14710 14090 13050 % to all India Percent 10.9 9.85 11.73 11.18 10.73 10.85
Value of output
Rs.Crore 81763 110867 113191 118551 127977 197550
% to all India Percent 11.01 13.26 14.44 13.20 13.81 15.33 Net value
added Rs.Crore 17554 19922 18896 19276 16856 16886
% to all India Percent 1.12 11.55 12.99 12.44 11.74 11.70 No. of workers '000 644 652 608 613 554 522 % to all India Percent 8.93 8.52 9.55 9.77 9.02 8.75
VOP per worker
Rs. Lakh 12.70 17.00 18.62 19.33 23.11 28.29
% to all India Percent 2.73 2.95 3.11 3.14 3.04 3.29
Source: Monthly Review of Gujarat Economy, CMIE October 20-05.

256
This table demonstrates progressive status of the Gujarat State in
comparison with India of certain selected indicators of Industrial Sector.
The table throws light leading to major important conclusions.
(A) In respect of number of factory existing in the state in different
years it is found fluctuating over the reference period. It shows
ups and downs in the number of factories and also this number in
percentage to the total of India is found fluctuating. As indicated
in the table from amongst the year 1996-97 to 2001-02 - this
number is found maximum in the year 1998-99 - indicating also
highest percentage to the total of India. However numerically it is
found minimum in 2001-02 (13050) but in percentage to the total
of India - however it is found minimum in the year 1997-98 i.e.
9.85 percentage.
(B) Having a look at the value of output in Rs. Crore it is reported
highest (maximum) in the year 2001-02 Rs. 1,47,550 and
minimum in the year 1996-97 i.e. 81763. This also shows
continuous positive growth in physical amount though the rate of
growth is found varied over the period of time. Growth over the
previous year in percentage suggest the changes by +35.59%,
+2.09%, +4.73, +7.95 and +15.29%. While this value of output in
percentage to total of India shows fluctuations with this being the
maximum in 2001-02 i.e. 15.33 percentage and minimum in the
year 1996-97 i.e. 11.01 percentage.
(C) According to the table net value added in Rs. Crore tends to have
fluctuating trends over the period of time. It shows ups and downs
257
in amount of net value added. It showed an increase of Rs. 2368
i.e. 13.49% rise thereafter fall in the amount of Rs. 1.26 in
percentage 5.15, again it increased by Rs. 380 (2.01%) which
decreased in the following year by Rs. 2420 (12.55%) and lastly
there was a little increase by +30 i.e. 0.18 percentage. In the year
1998-99 net value added in percentage to total of India was
highest 12.99 percentage and also maximum in amount in
comparison with other years referred to in the table.
(D) Fourth important parameter is about the number of workers
engaged in the industries in Gujarat State and that in percentage to
total of India. It is demonstrated through the table that total
number of workers engaged in industries are found varied over
the period of time. The year 1997-98 shows maximum number of
workers engaged in the industries i.e. 652'000 and in the year
2001-02 this number was minimum 522'000. If this trend
examined in context of percentage to total of India - it is found
maximum 9.77% in the year 1999-2000 while in the year 1997-98
this percentage was found minimum - 8.52% to the total of India.
It is also reflected from the table that net value added per worker
tends to show positive change constantly except in the year 2000-
01 which showed little less than the previous year.
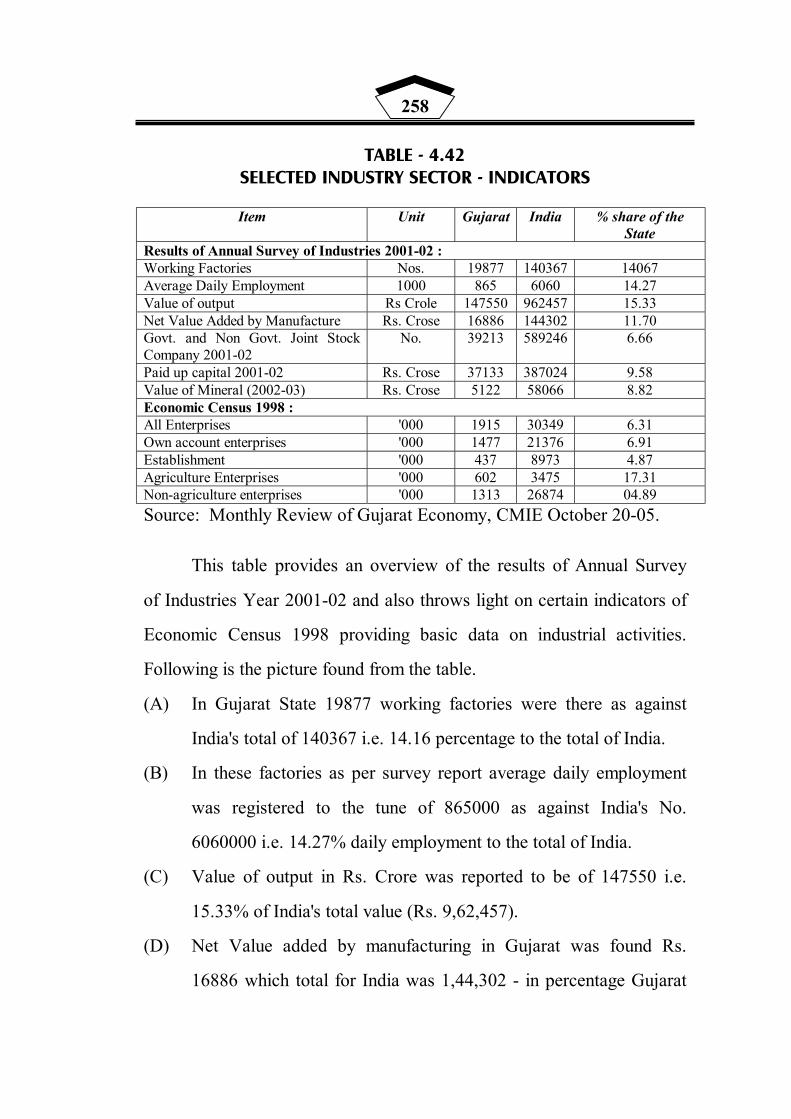
258
TABLE - 4.42 SELECTED INDUSTRY SECTOR - INDICATORS
Item Unit Gujarat India % share of the
State Results of Annual Survey of Industries 2001-02 : Working Factories Nos. 19877 140367 14067 Average Daily Employment 1000 865 6060 14.27 Value of output Rs Crole 147550 962457 15.33 Net Value Added by Manufacture Rs. Crose 16886 144302 11.70 Govt. and Non Govt. Joint Stock Company 2001-02
No. 39213 589246 6.66
Paid up capital 2001-02 Rs. Crose 37133 387024 9.58 Value of Mineral (2002-03) Rs. Crose 5122 58066 8.82 Economic Census 1998 : All Enterprises '000 1915 30349 6.31 Own account enterprises '000 1477 21376 6.91 Establishment '000 437 8973 4.87 Agriculture Enterprises '000 602 3475 17.31 Non-agriculture enterprises '000 1313 26874 04.89 Source: Monthly Review of Gujarat Economy, CMIE October 20-05.
This table provides an overview of the results of Annual Survey
of Industries Year 2001-02 and also throws light on certain indicators of
Economic Census 1998 providing basic data on industrial activities.
Following is the picture found from the table.
(A) In Gujarat State 19877 working factories were there as against
India's total of 140367 i.e. 14.16 percentage to the total of India.
(B) In these factories as per survey report average daily employment
was registered to the tune of 865000 as against India's No.
6060000 i.e. 14.27% daily employment to the total of India.
(C) Value of output in Rs. Crore was reported to be of 147550 i.e.
15.33% of India's total value (Rs. 9,62,457).
(D) Net Value added by manufacturing in Gujarat was found Rs.
16886 which total for India was 1,44,302 - in percentage Gujarat
259
to the total of India registered 11.70% of net value added by
manufacturing.
(E) As per the report of 2001-02 in Gujarat Government and Non-
Government joint stock companies registered were 39223 with
paid up capital of Rs. 37,133 Crores, this at national level was
5,89,246 companies with Rs. 3,87,024 Crore paid up capital - the
percentage number in Gujarat to the total of India tends to be 6.66
and 9.59 respectively.
(F) As per 2001-02 provisional data value of mineral reported in
Gujarat was to the tune of Rs. 5122 Crore as against India's total
value of Rs. 58066 Crore i.e. 8.82 percentage of India' value of
mineral was found in Gujarat.
(G) As per the report of Economic Census 1998, it is found that in
Gujarat state in total there were 1915000 enterprises out of which
602 (31.43%) were agricultural enterprises and 1313 (68.57%)
were non agricultural enterprises. This number in India for total
enterprises was 30349'000 of which 3475 (11.45%) were
agricultural enterprises and 26874'000 (88.55%) were non-
agricultural enterprises. In context of percentage it is found that
Gujarat registered 6.31% of the total enterprises of India from
which the percentage number of agricultural enterprises was
17.31% while for non-agricultural enterprises it was only 4.89
percentage. It means that in Gujarat though number of non
agricultural enterprises tend to be more than that of agricultural
enterprises but in respect of percentage to the total of India the
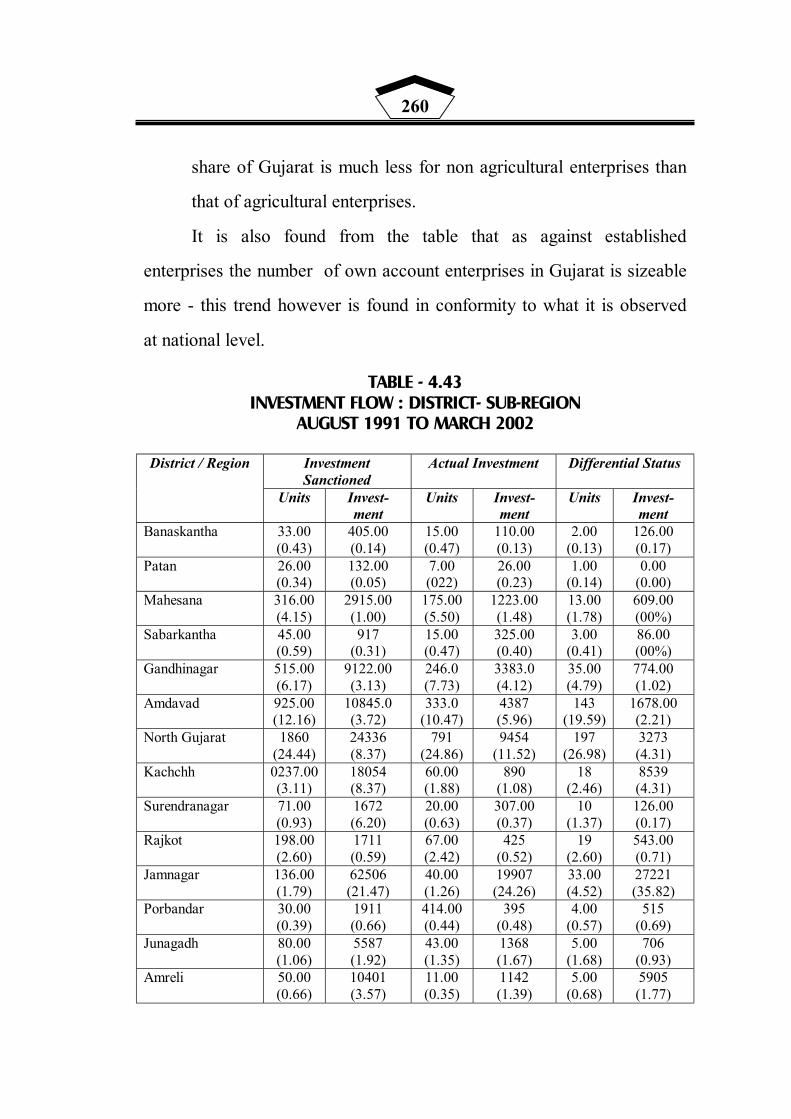
260
share of Gujarat is much less for non agricultural enterprises than
that of agricultural enterprises.
It is also found from the table that as against established
enterprises the number of own account enterprises in Gujarat is sizeable
more - this trend however is found in conformity to what it is observed
at national level.
TABLE - 4.43 INVESTMENT FLOW : DISTRICT- SUB-REGION
AUGUST 1991 TO MARCH 2002
Investment Sanctioned
Actual Investment Differential Status District / Region
Units Invest- ment
Units Invest- ment
Units Invest- ment
Banaskantha 33.00 (0.43)
405.00 (0.14)
15.00 (0.47)
110.00 (0.13)
2.00 (0.13)
126.00 (0.17)
Patan 26.00 (0.34)
132.00 (0.05)
7.00 (022)
26.00 (0.23)
1.00 (0.14)
0.00 (0.00)
Mahesana 316.00 (4.15)
2915.00 (1.00)
175.00 (5.50)
1223.00 (1.48)
13.00 (1.78)
609.00 (00%)
Sabarkantha 45.00 (0.59)
917 (0.31)
15.00 (0.47)
325.00 (0.40)
3.00 (0.41)
86.00 (00%)
Gandhinagar 515.00 (6.17)
9122.00 (3.13)
246.0 (7.73)
3383.0 (4.12)
35.00 (4.79)
774.00 (1.02)
Amdavad 925.00 (12.16)
10845.0 (3.72)
333.0 (10.47)
4387 (5.96)
143 (19.59)
1678.00 (2.21)
North Gujarat 1860 (24.44)
24336 (8.37)
791 (24.86)
9454 (11.52)
197 (26.98)
3273 (4.31)
Kachchh 0237.00 (3.11)
18054 (8.37)
60.00 (1.88)
890 (1.08)
18 (2.46)
8539 (4.31)
Surendranagar 71.00 (0.93)
1672 (6.20)
20.00 (0.63)
307.00 (0.37)
10 (1.37)
126.00 (0.17)
Rajkot 198.00 (2.60)
1711 (0.59)
67.00 (2.42)
425 (0.52)
19 (2.60)
543.00 (0.71)
Jamnagar 136.00 (1.79)
62506 (21.47)
40.00 (1.26)
19907 (24.26)
33.00 (4.52)
27221 (35.82)
Porbandar 30.00 (0.39)
1911 (0.66)
414.00 (0.44)
395 (0.48)
4.00 (0.57)
515 (0.69)
Junagadh 80.00 (1.06)
5587 (1.92)
43.00 (1.35)
1368 (1.67)
5.00 (1.68)
706 (0.93)
Amreli 50.00 (0.66)
10401 (3.57)
11.00 (0.35)
1142 (1.39)
5.00 (0.68)
5905 (1.77)
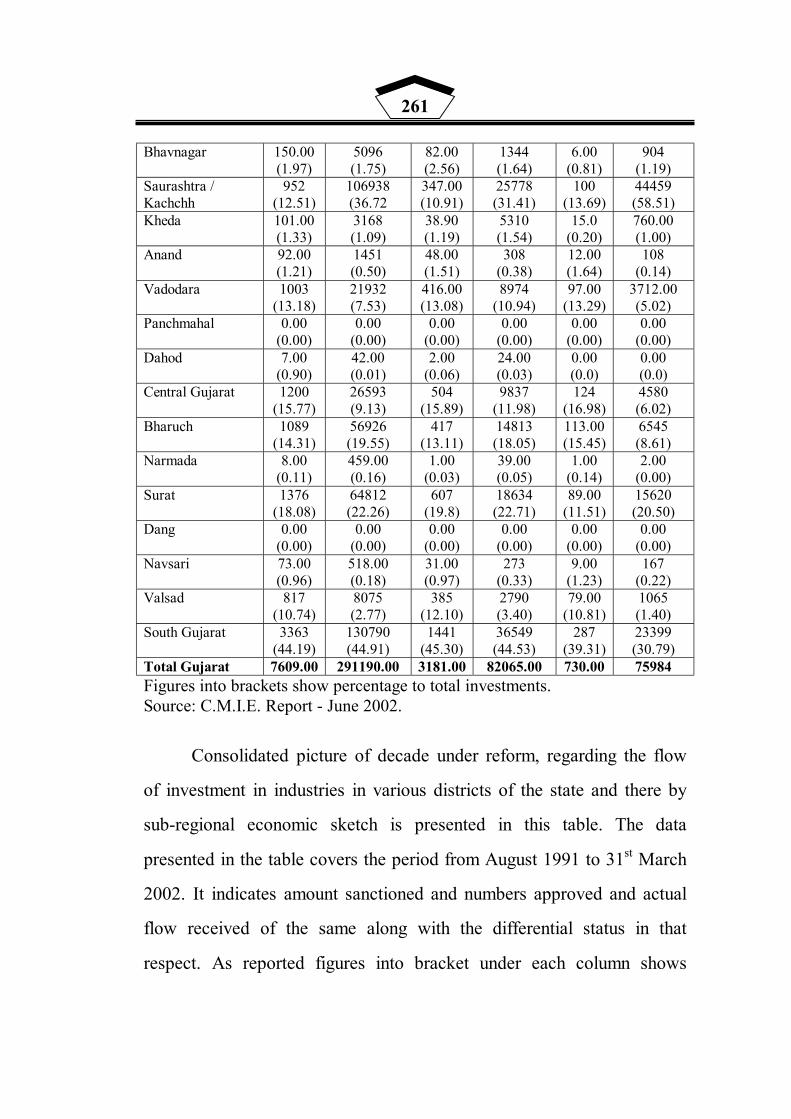
261
Bhavnagar 150.00 (1.97)
5096 (1.75)
82.00 (2.56)
1344 (1.64)
6.00 (0.81)
904 (1.19)
Saurashtra / Kachchh
952 (12.51)
106938 (36.72
347.00 (10.91)
25778 (31.41)
100 (13.69)
44459 (58.51)
Kheda 101.00 (1.33)
3168 (1.09)
38.90 (1.19)
5310 (1.54)
15.0 (0.20)
760.00 (1.00)
Anand 92.00 (1.21)
1451 (0.50)
48.00 (1.51)
308 (0.38)
12.00 (1.64)
108 (0.14)
Vadodara 1003 (13.18)
21932 (7.53)
416.00 (13.08)
8974 (10.94)
97.00 (13.29)
3712.00 (5.02)
Panchmahal 0.00 (0.00)
0.00 (0.00)
0.00 (0.00)
0.00 (0.00)
0.00 (0.00)
0.00 (0.00)
Dahod 7.00 (0.90)
42.00 (0.01)
2.00 (0.06)
24.00 (0.03)
0.00 (0.0)
0.00 (0.0)
Central Gujarat 1200 (15.77)
26593 (9.13)
504 (15.89)
9837 (11.98)
124 (16.98)
4580 (6.02)
Bharuch 1089 (14.31)
56926 (19.55)
417 (13.11)
14813 (18.05)
113.00 (15.45)
6545 (8.61)
Narmada 8.00 (0.11)
459.00 (0.16)
1.00 (0.03)
39.00 (0.05)
1.00 (0.14)
2.00 (0.00)
Surat 1376 (18.08)
64812 (22.26)
607 (19.8)
18634 (22.71)
89.00 (11.51)
15620 (20.50)
Dang 0.00 (0.00)
0.00 (0.00)
0.00 (0.00)
0.00 (0.00)
0.00 (0.00)
0.00 (0.00)
Navsari 73.00 (0.96)
518.00 (0.18)
31.00 (0.97)
273 (0.33)
9.00 (1.23)
167 (0.22)
Valsad 817 (10.74)
8075 (2.77)
385 (12.10)
2790 (3.40)
79.00 (10.81)
1065 (1.40)
South Gujarat 3363 (44.19)
130790 (44.91)
1441 (45.30)
36549 (44.53)
287 (39.31)
23399 (30.79)
Total Gujarat 7609.00 291190.00 3181.00 82065.00 730.00 75984 Figures into brackets show percentage to total investments. Source: C.M.I.E. Report - June 2002.
Consolidated picture of decade under reform, regarding the flow
of investment in industries in various districts of the state and there by
sub-regional economic sketch is presented in this table. The data
presented in the table covers the period from August 1991 to 31st March
2002. It indicates amount sanctioned and numbers approved and actual
flow received of the same along with the differential status in that
respect. As reported figures into bracket under each column shows
262
percentage to the total Gujarat State. Following are the major
conclusions derived from the table.
(A) It is observed from the table that in aggregate it shows the typical
trend - behavioural pattern of concentration of industries in much
prosperous regions only. In central Gujarat 31.65% of units in
operation to the total of sanctioned are found. This percentage
number in South Gujarat is reported to be 45.10%, North Gujarat
had 12.88 percentage of approved units while this number of
approved units for Saurashtra Kachchh was only 12.30%.
Looking at the data of investments approved - sub-regional
analysis leads to conclude that it was found highest in South Gujarat
44.92 percentage, followed by Saurashtra and Kachchh with 36.73%.
There was the rank of Central Gujarat 13.69% and lastly it was 4.36
percentage in North Gujarat. Now against the picture of approval, status
in respect of actual numbers and investment if examined indicates that
in South Gujarat it was 45.30% of approved units and 49.31% of
approved investments. In Central Gujarat actual numbers to the
approved in percentage was 15.84% and for investment in actual was
11.98 percentage is the sanctioned investment while Saurashtra Kachchh
region's actual status was 10.91 percentage of approved numbers and
31.47 percentage of actual investment. This trends in North Gujarat
suggests 24.81 percentage to the total of sanctioned units and 11.52
percentage of total sanctioned investments.
The data pertaining to the units and investments in different
stages are examined it is further found that number of such units in

263
percentage were 39.19 in South Gujarat, 38.62 percentage in Central
Gujarat, 13.69 percentage in Saurashtra - Kachchh and 7.39 percentage
in North Gujarat.
TABLE - 4.44 NUMBER OF REGISTERED SMALL SCALE INDUSTRIAL UNITS
At the end of the calendar year Sr.
No. State/
District 1985 1990 1995 2000 2001 2002 2003 2004 Upto
March 2005
GUJARAT 72459 115384 178627 251088 264668 274315 286185 296306 12789 1 Jamnagar 3843 5396 7698 10413 10920 11518 12222 12591 12789 2 Rajkot 8348 14417 20923 27874 29409 29639 30611 31371 31507 3 Surendranagar 2190 2949 4757 6792 7134 7585 7872 8188 8313 4 Bhavnagar 3616 5152 7947 10613 11106 11130 11335 11484 11584 5 Amreli 909 1426 2566 3929 4179 4339 4627 4711 4735 6 Junagadh* 1889 2632 4261 6545 6843 7294 7764 8217 8315 7 Kachchh 1182 1746 3127 4780 5100 5279 5470 5718 5794 8 Banaskantha 942 1755 3230 5003 5343 5733 6073 6401 6468 9 Sabarkantha 1347 2362 4307 6497 6829 7214 7721 8114 8140
10 Mehsana* 3598 5290 8877 13030 13814 14587 15259 16025 16200 11 Gandhinagar 357 843 1881 2958 3275 3648 4009 4371 4451 12 Ahmedabad 18929 29661 43320 58332 59747 60693 62137 63193 63987 13 Kheda* 3807 5669 8522 12064 12715 132698 14103 14765 14938 14 Panchmahal* 1285 2071 3785 5825 6233 6482 6282 7277 7306 15 Vadodara 4754 6648 10134 14209 15011 15653 16273 17219 17438 16 Bharuch 1974 38715 6963 11174 111920 12483 13312 14023 14263 17 Surat 9174 16764 25780 36069 39309 41053 43015 44420 45266 18 Valsad/Dangs* 4335 6788 10529 14981 15781 16716 17500 18186 18429
*The Data of new districts are included in concerned districts. Source: Commissioner of Industries, Gujarat State, Gandhinagar.
These two tables (Table No. 4.44 and 4.44-A) provide with the
number of registered Small Scale Industrial Units in the districts of
Gujarat State and regional breakup of the same is provided separately.
New districts after 1998 details have been included in these districts.
District wise data leads to the following conclusions.
(A) Although the period Amdavad district stands first in respect of the
number of registered small scale units from amongst all districts
of the state. Surat district occupies the next rank in this respect

264
although the period. While Rajkot district has maintained its third
rank although the period.
(B) It is however important to note that there prevails wide gap even
between these three districts during all the years referred to in the
study. In 1980 this gap between Amdavad and Surat was found to
be of 9,755 i.e. Amdavad was having more than 106.33
percentage of Units than Surat. This gap between Surat and
Rajkot was found to be of 826 i.e. 9.00% more than Rajkot.
Gandhinagar is small district having minimum number of units in
the year 1980. At the end of March 2005, gap between Amdavad
and Surat was reduced to 18,721 i.e. Amdavad districts in
percentage had 41.36% more units than Surat while this gap
between Surat and Rajkot has increased to 13,759 i.e. 43.67
percentage more than the Rajkot.
It thus reveals the fact that from the three leading districts of the
state Surat has registered exceptional higher growth in comparison with
Amdavad and Rajkot districts. The three districts together accounted for
60842 units. 52.73% of the total of Gujarat in 1990, this went upto
70,023 - 39.20% in 1995. In 2000 this happened to be 1,22,275 i.e.
48.70% while at the end of March 2005 it was 1,40,760 i.e. 46.93
percentage to the total of Gujarat State. It is also important to analyse
the growth over the year in percentage from December 2000 to March
2005 for the three districts it is reflected as under :
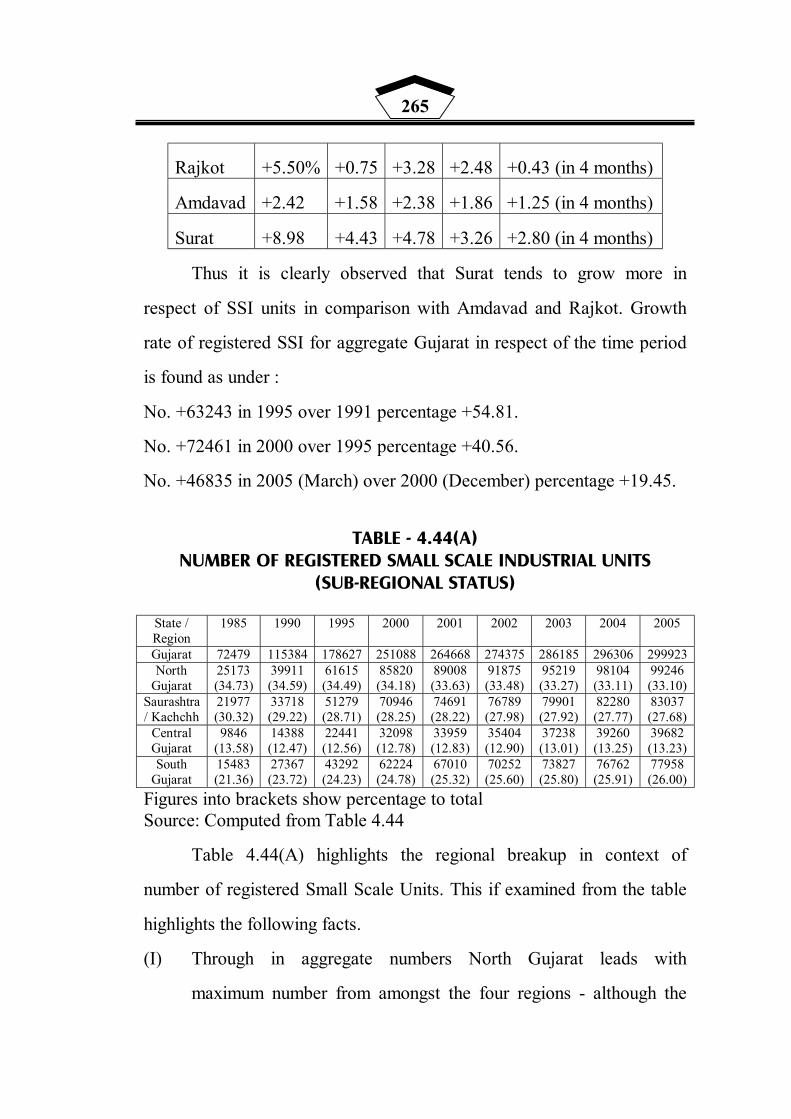
265
Rajkot +5.50% +0.75 +3.28 +2.48 +0.43 (in 4 months)
Amdavad +2.42 +1.58 +2.38 +1.86 +1.25 (in 4 months)
Surat +8.98 +4.43 +4.78 +3.26 +2.80 (in 4 months)
Thus it is clearly observed that Surat tends to grow more in
respect of SSI units in comparison with Amdavad and Rajkot. Growth
rate of registered SSI for aggregate Gujarat in respect of the time period
is found as under :
No. +63243 in 1995 over 1991 percentage +54.81.
No. +72461 in 2000 over 1995 percentage +40.56.
No. +46835 in 2005 (March) over 2000 (December) percentage +19.45.
TABLE - 4.44(A)
NUMBER OF REGISTERED SMALL SCALE INDUSTRIAL UNITS (SUB-REGIONAL STATUS)
State / Region
1985 1990 1995 2000 2001 2002 2003 2004 2005
Gujarat 72479 115384 178627 251088 264668 274375 286185 296306 299923 North
Gujarat 25173 (34.73)
39911 (34.59)
61615 (34.49)
85820 (34.18)
89008 (33.63)
91875 (33.48)
95219 (33.27)
98104 (33.11)
99246 (33.10)
Saurashtra / Kachchh
21977 (30.32)
33718 (29.22)
51279 (28.71)
70946 (28.25)
74691 (28.22)
76789 (27.98)
79901 (27.92)
82280 (27.77)
83037 (27.68)
Central Gujarat
9846 (13.58)
14388 (12.47)
22441 (12.56)
32098 (12.78)
33959 (12.83)
35404 (12.90)
37238 (13.01)
39260 (13.25)
39682 (13.23)
South Gujarat
15483 (21.36)
27367 (23.72)
43292 (24.23)
62224 (24.78)
67010 (25.32)
70252 (25.60)
73827 (25.80)
76762 (25.91)
77958 (26.00)
Figures into brackets show percentage to total Source: Computed from Table 4.44
Table 4.44(A) highlights the regional breakup in context of
number of registered Small Scale Units. This if examined from the table
highlights the following facts.
(I) Through in aggregate numbers North Gujarat leads with
maximum number from amongst the four regions - although the

266
reference period. Percentage share of this region to the total of
Gujarat also tends to be highest in all the years indicated in the
period. However one important point observed in respect of the
change over the years is that percentage share to the total shows
declining trend over the period of time. Similar is the trend
observed in case of Saurashtra and Kachchh. Wherein by numbers
the region stands next to North Gujarat and also in percentage to
the total of Gujarat. This also behaves in conformity to what it is
found in case of North Gujarat. Central Gujarat is at the bottom,
in view of the numbers registered over the years and its
percentage share to the total. But unlike North Gujarat and
Saurashtra percentage share to the total of Gujarat shows
increasing trend South Gujarat ranks third in number and
percentage but the change in percentage is found maximum.
TABLE - 4.45
INDUSTRY GROUP WISE SSI REGISTRATION DURING THE YEAR - RECENT TREND S.No. Item 1993-
94 1995-
96 1997-
98 1999-
00 2000-
01 2001-
02 2002-
03 2003-
04 2004-
05 1. Food Products 676 889 850 683 760 733 499 613 466 % 5.19 6.15 5.81 4.73 5.64 6.48 4.58 4.58 4.51
2. Beverages, Tobacco & Tobacco Products
103 978 70 59 45 48 51 4 2
% 0.79 0.69 0.48 0.41 0.33 0.42 0.47 0.03 0.02 3. Cotton
Textiles 546 790 150 171 689 306 124
% 4.19 5.68 1.02 1.18 5.12 2.70 1.14 4. Wool, Silk &
Synthetic Fibre Textiles
1410 575 178 170 607 2056 545 4140 849
% 10.81 4.13 1.22 1.18 4.50 18.17 4.99 33.60 8.21 5. Hosiery &
Garments 1855 2350 2976 3558 2603 1415 1998
% 14.23 18.05 28.84 27.30 19.33 12.50 18.32
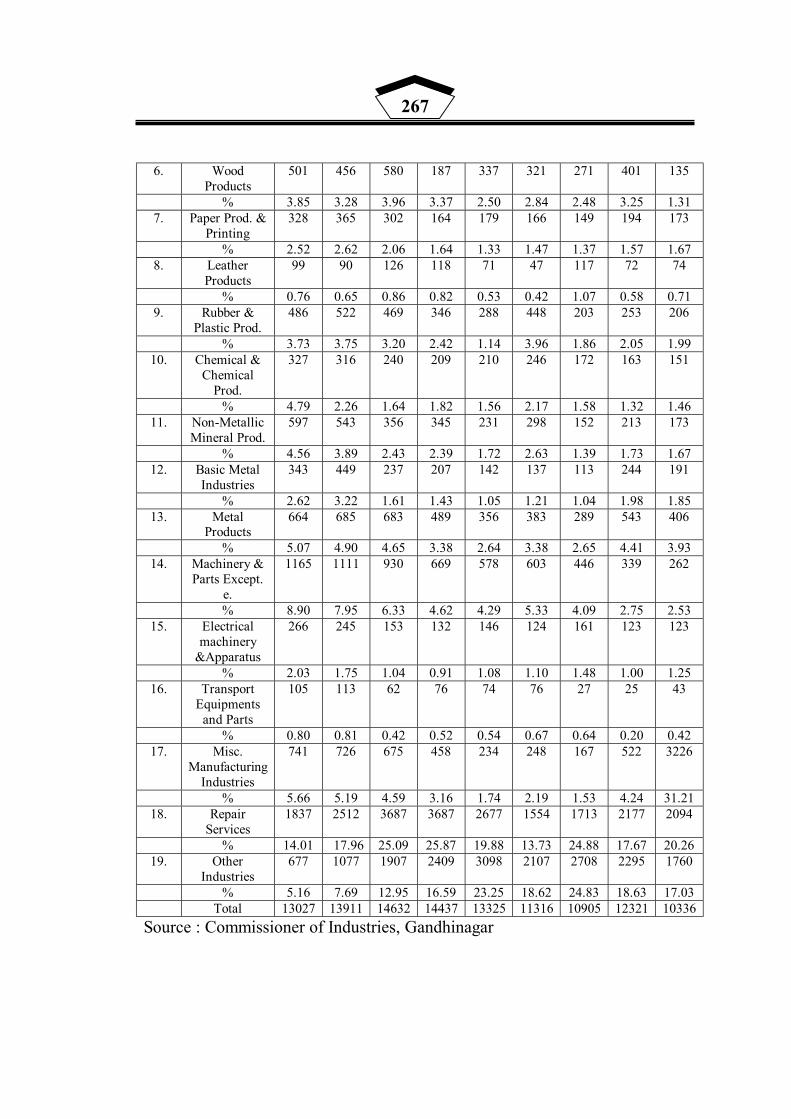
267
6. Wood
Products 501 456 580 187 337 321 271 401 135
% 3.85 3.28 3.96 3.37 2.50 2.84 2.48 3.25 1.31 7. Paper Prod. &
Printing 328 365 302 164 179 166 149 194 173
% 2.52 2.62 2.06 1.64 1.33 1.47 1.37 1.57 1.67 8. Leather
Products 99 90 126 118 71 47 117 72 74
% 0.76 0.65 0.86 0.82 0.53 0.42 1.07 0.58 0.71 9. Rubber &
Plastic Prod. 486 522 469 346 288 448 203 253 206
% 3.73 3.75 3.20 2.42 1.14 3.96 1.86 2.05 1.99 10. Chemical &
Chemical Prod.
327 316 240 209 210 246 172 163 151
% 4.79 2.26 1.64 1.82 1.56 2.17 1.58 1.32 1.46 11. Non-Metallic
Mineral Prod. 597 543 356 345 231 298 152 213 173
% 4.56 3.89 2.43 2.39 1.72 2.63 1.39 1.73 1.67 12. Basic Metal
Industries 343 449 237 207 142 137 113 244 191
% 2.62 3.22 1.61 1.43 1.05 1.21 1.04 1.98 1.85 13. Metal
Products 664 685 683 489 356 383 289 543 406
% 5.07 4.90 4.65 3.38 2.64 3.38 2.65 4.41 3.93 14. Machinery &
Parts Except. e.
1165 1111 930 669 578 603 446 339 262
% 8.90 7.95 6.33 4.62 4.29 5.33 4.09 2.75 2.53 15. Electrical
machinery &Apparatus
266 245 153 132 146 124 161 123 123
% 2.03 1.75 1.04 0.91 1.08 1.10 1.48 1.00 1.25 16. Transport
Equipments and Parts
105 113 62 76 74 76 27 25 43
% 0.80 0.81 0.42 0.52 0.54 0.67 0.64 0.20 0.42 17. Misc.
Manufacturing Industries
741 726 675 458 234 248 167 522 3226
% 5.66 5.19 4.59 3.16 1.74 2.19 1.53 4.24 31.21 18. Repair
Services 1837 2512 3687 3687 2677 1554 1713 2177 2094
% 14.01 17.96 25.09 25.87 19.88 13.73 24.88 17.67 20.26 19. Other
Industries 677 1077 1907 2409 3098 2107 2708 2295 1760
% 5.16 7.69 12.95 16.59 23.25 18.62 24.83 18.63 17.03 Total 13027 13911 14632 14437 13325 11316 10905 12321 10336
Source : Commissioner of Industries, Gandhinagar

268
In the previous we tried to examine and analyse physical progress
of registered SSIS during the different years by district and by region.
This table now highlights compositional breakup of registered SSIS in
Gujarat. This refers to the data of separate kind of industrial units
registered as SSIS in the different year.
As demonstrated in the Table No. 4.45 from amongst main listed
19 groups of industry - it is clearly observed that in all the years
Hosiery, Garments and Repair Services share maximum of working
units in numbers and in percentages. In 1993-94 of the total registered
units these two occupied 28.24 percentage in 1995-96 this was found to
the tune of 35.99% showing an increase of 7.75 percentage point. In
1997-98 this percentage number further went upto 53.13% i.e. 17.14
percentage point. In the year 1999-2000 this was found 52.73 percentage
showing little fall by -0.40 percentage point. In 2000-01 it was 39.21%,
in 2001-02 -26.23 percentage. In 2002-03 this showed again rise to
43.20 percentage. Thus it is reflected that even with falling share the two
segments as independent are still holds the industrial scenario from
amongst SSI units. In comparison with these two segments no other
segment shows significant weightage. All others tend to behave
moderately with little fluctuations reported over the period of time.
However in the last available data of 2004-05 miscellaneous
manufacturing services occupy share of 31.21 percentage to the total
registered units.

269
TABLE - 4.46
SMALL SCALE INDUSTRIES CENSUS, 1999-2000 DISTRICTWISE WORKIG UNITS, INVESTMENT, PRODUCTION AND EMPLOYEES
S. No.
District No. of working units
Fixed investment (Rs. in lakh)
Production (Rs. in lakh)
No. of employees
1 Ahmedabad 39241 136912 178614q 145684 2 Amreli 2767 3655 4447 5635 3 Banaskantha 3078 12970 11157 10892 4 Bharuch 4500 29948 47377 17551 5 Bhavnagar 5860 31182 28882 35101 6 Dangs 80 130 95 205 7 Gandhinagar 4138 29272 19890 21794 8 Jamnagar 9493 28805 35325 30427 9 Junagadh 3479 14059 20151 12511 10 Kheda 3663 10304 15499 10391 11 Kachchh 3235 10710 16110 12010 12 Mahesana 3333 18025 22164 16743 13 Panchmahals 3051 12633 16792 11015 14 Rajkot 18887 69676 103977 64282 15 Sabarkatha 4949 15213 12918 13489 16 Surat 28865 139097 234311 164045 17 Surendranagar 4649 22676 25821 22986 18 Vadodara 7239 61422 52032 37513 19 Valsad 5547 47656 106916 41818 20 Anand 4356 22106 35062 18998 21 Dahod 1157 4878 4829 3280 22 Narmada 779 1090 153 1498 23 Navsari 3590 12193 17727 13694 24 Patan 2465 5789 5380 9213 25 Porbandar 619 4231 6684 3557 Total 169020 744632 1022313 724332 Source: Commissioner of Industries, Gujarat State, Gandhinagar
These tables provide data in respect of census of S.S.I. 1999-
2000. It refers to the district wise working units, investment production
and employees as per 1991-2000. On the basis of district wise data
regional break up with percentage share is also presented in the table
4.46(A). As per the district wise report, Amdavad share 23.21% of total
working units of state with investment share of 18.38% and production
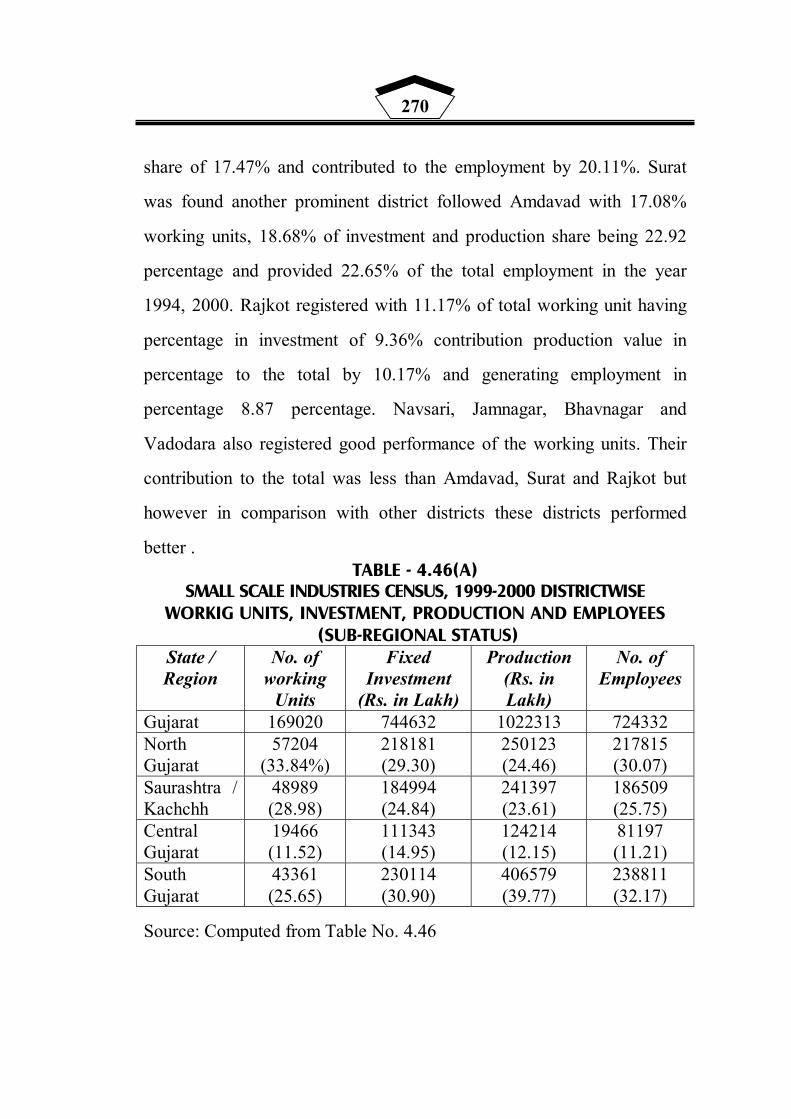
270
share of 17.47% and contributed to the employment by 20.11%. Surat
was found another prominent district followed Amdavad with 17.08%
working units, 18.68% of investment and production share being 22.92
percentage and provided 22.65% of the total employment in the year
1994, 2000. Rajkot registered with 11.17% of total working unit having
percentage in investment of 9.36% contribution production value in
percentage to the total by 10.17% and generating employment in
percentage 8.87 percentage. Navsari, Jamnagar, Bhavnagar and
Vadodara also registered good performance of the working units. Their
contribution to the total was less than Amdavad, Surat and Rajkot but
however in comparison with other districts these districts performed
better . TABLE - 4.46(A)
SMALL SCALE INDUSTRIES CENSUS, 1999-2000 DISTRICTWISE WORKIG UNITS, INVESTMENT, PRODUCTION AND EMPLOYEES
(SUB-REGIONAL STATUS) State / Region
No. of working
Units
Fixed Investment
(Rs. in Lakh)
Production (Rs. in Lakh)
No. of Employees
Gujarat 169020 744632 1022313 724332 North Gujarat
57204 (33.84%)
218181 (29.30)
250123 (24.46)
217815 (30.07)
Saurashtra / Kachchh
48989 (28.98)
184994 (24.84)
241397 (23.61)
186509 (25.75)
Central Gujarat
19466 (11.52)
111343 (14.95)
124214 (12.15)
81197 (11.21)
South Gujarat
43361 (25.65)
230114 (30.90)
406579 (39.77)
238811 (32.17)
Source: Computed from Table No. 4.46

271
Table 4.46(A) highlights the regional break up in respect of 1999-
2000 SSI Census reports in respect of number of working units in
percentage. North Gujarat remained at the top - followed by Saurashtra,
South Gujarat and Central Gujarat respectively. While in context of
fixed investment South Gujarat was at the top with North Gujarat
logging little behind. Saurashtra was in the third rank and central
Gujarat remained at the bottom. Production in Rupees if examined
South Gujarat again led the scenario followed by North Gujarat and then
Saurashtra and lastly Central Gujarat registered minimum production
value in comparison with other regions. With regard to the status of
employment generated by the working units it is South Gujarat
contributed the most with North keeping the second and Saurashtra was
again in the 3rd and Central Gujarat was at its lowest level in comparison
with other areas of Gujarat State.

272
TABLE - 4.47 SMALL SCALE INDUSTRIES CENSUS, 1999-2000 INDUSTRY GROUPWISE WORKIG UNITS, FIXED INVESTMENT, PRODUCTION AND EMPLOYEES
Products Name No. of working
Units
Fixed Investment
(Rs. in Lakh)
Production (Rs. in Lakh)
No. of Employees
Food Products / Agro Process 10011 40065 65078 41338 Cotton Textiles 20942 137404 244970 145283 Hosiery and Garments 23395 44321 38130 57438 Wood Products 7249 18846 23594 21350 Paper Products and Printing 4722 25217 31047 20748 Leather Products 1562 1701 1654 2719 Rubber and Plastic Products 5118 40315 52921 28271 Chemical and Chemical Products 4870 79805 132434 46413 Non-Metallic Mineral Products 6582 49673 54573 50699 Basic Metal Industries 5442 49934 83203 50229 Metal Products 9017 39614 51908 39408 Machinery and Parts except ele. 14962 70064 93084 64157 Electrical machinery and apparatus 2220 16926 25395 14321 Transport Equipments and Parts 1213 7463 10845 6917 Misc. Manufacturing Industries 7871 22608 28932 37025 Repair Services 29412 39911 27753 57304 Services not elsewhere classified 924 5865 7807 4517 Other Industries 11293 38224 34117 27506 Not Reported 2215 16677 14867 8689 Total 169020 744632 1022313 724332 Source : Commissioner of Industries, Gujarat State, Gandhinagar.
This table throws light on the results available by industry groups
of SSI Census 1999-2000, which expresses mainly industry wise
working units, fixed investment, production and number of employees
reported in the concerned industry group in the state economy.
It is clearly found that in the year 1999-2000 from amongst the
various industry groups registered as working SSI Units - Repair
Services remained at the top with 29412 units i.e. 17.40% of total
working units. Hosiery and Garments ranked 2nd with 23395 numbers
working having percentage share of 13.84% of the total. Cotton Textiles
also dominated the scenario with 20942 units in operations contributing

273
12.39% to the total working units. Machinery parts and equipments had
14962 units with 8.85 percentage. Other industries not mentioned
specifically were working in 11293 numbers having contributed 6.68
percentage. While examining the status in respect of investments of
industry groups - it is observed that cotton textiles stood first with
largest investment of Rs. 137404 lakh that is 18.45 percentage of the
total investment. This was followed by chemical and chemical products
with investment of Rs. 79805 lakh in percentage 10.71 to the total
investment. Machinery and equipments had an investment of Rs. 70064
- third largest segment having 9.41 percentage share to the total
investment.
As presented in the table the production (Rs. lakh) if taken into
consideration, Cotton textile remained at the top with production in
value of Rs. 244970 i.e. 23.96 percentage to the total. Chemical and
chemical products also registered production of Rs. 132434 (lakh) in
percentage it appears to be 12.95 percentage. Machinery and parts
except electricals produced Rs. 93084 lakh, 9.10 percentage to the total
production. Looking at the employment data for various industry groups
it is again cotton textiles with highest number of employment in
numbers 1,45,283 i.e. 20.06 percentage followed by Machinery sector
providing employment to 64,157 which in percentage turns out to be
8.86. In Hosiery and Garments employment was reported to be third
largest in number with 57,438 which appeared to be 7.93 percentage to
the total employments.
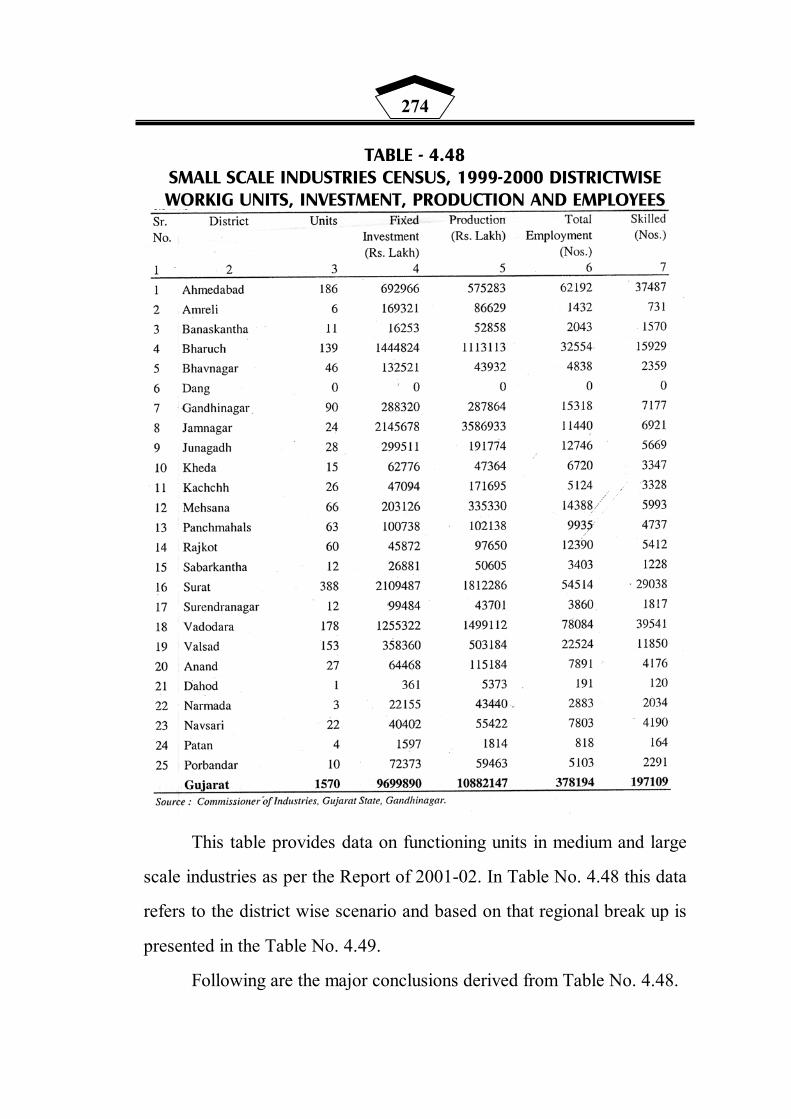
274
TABLE - 4.48 SMALL SCALE INDUSTRIES CENSUS, 1999-2000 DISTRICTWISE WORKIG UNITS, INVESTMENT, PRODUCTION AND EMPLOYEES
This table provides data on functioning units in medium and large
scale industries as per the Report of 2001-02. In Table No. 4.48 this data
refers to the district wise scenario and based on that regional break up is
presented in the Table No. 4.49.
Following are the major conclusions derived from Table No. 4.48.

275
(A) As presented in the table Surat district is having maximum
number of medium and large scale units in operation. There are
388 units i.e. 24.71 percentage to the total units ofGujarat are in
operation in single Surat district. Amdavad stands 2nd in this
regard with 186 units i.e. 11.85 percentage to the total working
units. Vadodara district is just logging behind with 80 units by
Amdavad i.e. the district is having 178 units in operation the
percentage comes to be 11.34. Valsad district reported to have
153 units in operation i.e. 9.74% and Bharuch had 139 units with
8.85 percentage. These five districts thus in total had 1044 units
among to be 66.49 percentage of the total units of State.
(B) In terms of investment Surat district had an investment of Rs.
2109487 lakh with 21.75 percentage of total investment.
However, Jamnagar district was at the top in investment of Rs.
2145678 (22.12%) - this was only due to single giant investment
of Reliance Petroleum Refinery near Khavadi. Bharuch shared
large chanla of investment to the total of Gujarat with 14.89
percentage share in physical amount of Rs. 1444824 lakh.
Vadodara district contribution 12.94 percentage with amount Rs.
1255322 lakh. These 4 districts total investment happened to be of
Rs. 69055311 lakh which means 71.70 percentage of the total
investment was made in these 4 districts.
(C) Employment generated by the medium and large scale units
turned out to be 378194 of which 197109 was skilled one - in
percentage 52.12. From this aggregate employment Vadodara
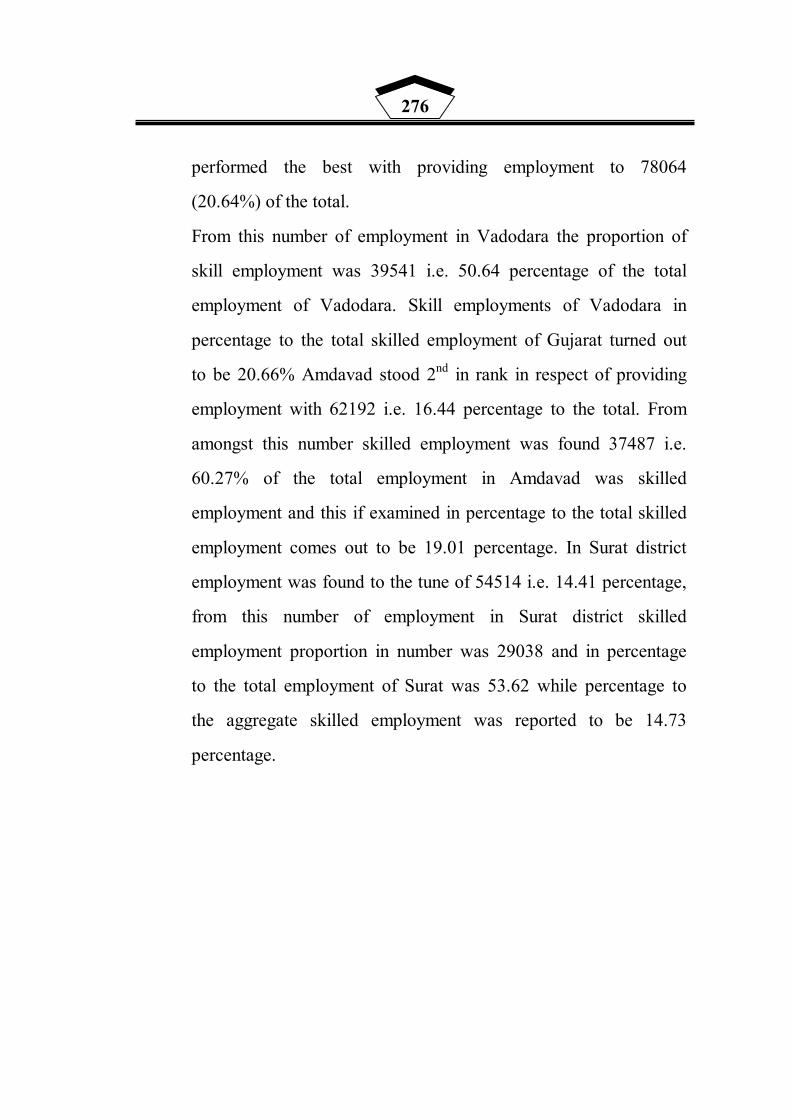
276
performed the best with providing employment to 78064
(20.64%) of the total.
From this number of employment in Vadodara the proportion of
skill employment was 39541 i.e. 50.64 percentage of the total
employment of Vadodara. Skill employments of Vadodara in
percentage to the total skilled employment of Gujarat turned out
to be 20.66% Amdavad stood 2nd in rank in respect of providing
employment with 62192 i.e. 16.44 percentage to the total. From
amongst this number skilled employment was found 37487 i.e.
60.27% of the total employment in Amdavad was skilled
employment and this if examined in percentage to the total skilled
employment comes out to be 19.01 percentage. In Surat district
employment was found to the tune of 54514 i.e. 14.41 percentage,
from this number of employment in Surat district skilled
employment proportion in number was 29038 and in percentage
to the total employment of Surat was 53.62 while percentage to
the aggregate skilled employment was reported to be 14.73
percentage.
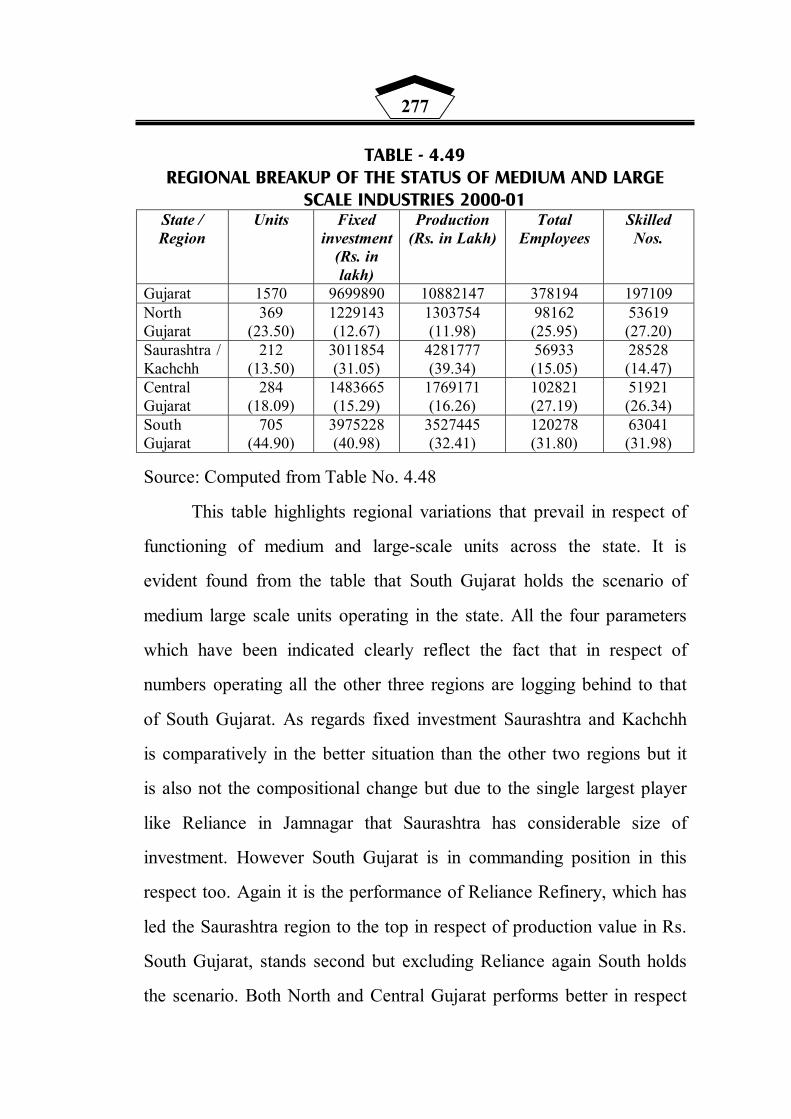
277
TABLE - 4.49 REGIONAL BREAKUP OF THE STATUS OF MEDIUM AND LARGE
SCALE INDUSTRIES 2000-01 State / Region
Units Fixed investment
(Rs. in lakh)
Production (Rs. in Lakh)
Total Employees
Skilled Nos.
Gujarat 1570 9699890 10882147 378194 197109 North Gujarat
369 (23.50)
1229143 (12.67)
1303754 (11.98)
98162 (25.95)
53619 (27.20)
Saurashtra / Kachchh
212 (13.50)
3011854 (31.05)
4281777 (39.34)
56933 (15.05)
28528 (14.47)
Central Gujarat
284 (18.09)
1483665 (15.29)
1769171 (16.26)
102821 (27.19)
51921 (26.34)
South Gujarat
705 (44.90)
3975228 (40.98)
3527445 (32.41)
120278 (31.80)
63041 (31.98)
Source: Computed from Table No. 4.48
This table highlights regional variations that prevail in respect of
functioning of medium and large-scale units across the state. It is
evident found from the table that South Gujarat holds the scenario of
medium large scale units operating in the state. All the four parameters
which have been indicated clearly reflect the fact that in respect of
numbers operating all the other three regions are logging behind to that
of South Gujarat. As regards fixed investment Saurashtra and Kachchh
is comparatively in the better situation than the other two regions but it
is also not the compositional change but due to the single largest player
like Reliance in Jamnagar that Saurashtra has considerable size of
investment. However South Gujarat is in commanding position in this
respect too. Again it is the performance of Reliance Refinery, which has
led the Saurashtra region to the top in respect of production value in Rs.
South Gujarat, stands second but excluding Reliance again South holds
the scenario. Both North and Central Gujarat performs better in respect

278
of employment generating however these regions have not surpassed the
percentage to the employment generated by South to the aggregate of
the State. North Gujarat region is found to have better situation in
respect of skilled employment to the total employment. This however is
also not that strong in comparison with South Gujarat region. It is
important to note that as explained in the previous table medium and
large scale units are found to have strong concentration mainly restricted
to Amdavad in North, Vadodara in Central and Surat and Bharuch in
South Gujarat region. Post reform period also does not indicate much
improvement as regards to the consolidation of large scale industries in
Gujarat is concerned. The growth in this respect still seems to be loop
sided one.
TABLE - 4.50 RESULTS OF ANNUIAL SURVEY OF INDUSTRIES - FACTORY
SECTOR - ALL INDUSTRIES- GUJARAT STATE Year No.of Factories
(%) Productive Capital
(Rs. Crore) (%) Persons
Employed (No.) (%)
Output (Rs. Crore) (%)
Net Value Added (Rs. Crore) (%)
1991-92 11094 17062 690053 30763 4092 1992-93 11210 +1.04 26013 +52.46 726151 5.23 41429 34.67 8038 96.43 1993-94 11821 +5.17 31743 +22.02 760432 4.72 46904 13.21 9425 17.25 1994-95 12094 +2.31 38871 22.45 770626 1.34 62039 24.39 13054 38.50 1995-96 13770 +13.86 73286 88.53 956644 24.14 84808 36.70 17621 34.98 1996-97 13363 -2.95 60467 77.49 816939 17.10 87229 2.85 19293 09.49 1997-98 13416 +0.40 82213 35.96 870122 6.51 110899 27.13 19232 00.30 1998-99 15455 +15.20 85050 3.45 815986 6.22 113191 2.06 18896 01.72 1999-00 14710 -04.82 81472 -4.21 822884 0.84 118551 4.73 19276 02.01 2000-01 14090 -04.21 87416 7.29 752013 -8.61 127977 7.95 16856 14.35 2001-02 13950 -01.00 103502 18.40 712804 -5.21 147550 15.29 16886 00.18 2002-03 13180 -05.52 99938 3.44 717055 0.59 182700 23.82 22889 35.55 2003-04 12831 -2.65 104470 4.53 728601 1.61 207316 13.42 43366 89.96 Source : Central Statistical Organisation, New Delhi.
This table shows light on the results of Annual Survey of
Industry, Factor Sector inclusive of all industries. Data are provided
regarding number of factories, growth over in percentage of this
279
numbers, productive capital (Rs. crore) and growth over in percentage
for that persons employed in units and growth over in percentage for
employment and lastly, net value added by units in Rs. and growth over
in net value added. Following are the broad conclusions derived from
this table.
(A) In the year 1991-92 number of factories reported were 11094 and
as per the provisional figures of 2003-04 number of factories were
12831. It means if the beginning year and the last year numbers
taken into consideration the gap in the numbers between the two
years is found of 1737 percentage change is 15.66. However if
different years number of units are considered then maximum
number of units were found in the year 1998-99 i.e. 15455 and the
minimum in the year 1991-92 11094 - this gap is found to the
tune of 4361 i.e. 39.31 percentage growth.
Data for each year from 1991-92 to 2003-04 if examined
suggests fluctuating trends of growth during the period looking at
the growth over in percentage year by year it is found that out of
total 13 years during 6 years growth rate is found positive while
for 6 years growth is found negative. Growth over the previous
year in percentage is found highest in the year 1998-99 by 15.20
over the previous year of 1997-98. While lowest growth i.e.
maximum negative growth is found in the year 2002-03 of 5.52
over the previous year 2001-02.
(B) Column - 4 provides data on productive capital in Rs. crore
invested in the number of units in the different years. Besides
280
these investments amount growth in the investment over the year
is also shown in percentage. It is revealed from this column that
productive capital invested in Rs. crore was minimum in the year
1991-92 Rs. 17062 while this was found maximum in the
provisional estimates of 2003-04 i.e. 104470 the gap being
observed of 87408 i.e. 512.30% change. Growth over the year in
investment if examined this change is found negative in 3 years
out of 12 years period. Maximum positive growth is reported
88.53 percentage in the year 1995-96 over the year 1994-95 while
in reverse to it negative change in maximum percentage was
observed in the year 1996-97 over the previous year 1995-96.
(C) Column 5 provides data on persons employed in the units in
different years. This is also supported by reflection of growth over
the years in percentage. As indicated in the table, minimum
number of employment was found in the year 1991-92 - 690053
while maximum number of employment was reported in the year
9,56,644 - this gap was of 2,66,591 percentage change 38.63. If
the change is examined year over year then it is observed that out
of 12 years 5 years show fall in number of employment over the
previous year respectively. This negative change in highest
percentage is reported in the year 1996-97 - 17.10% over the
previous year of 1995-96. While during 7 years positive growth is
reported in the number of employment highest growth in
percentage is reported in the year 1995-96 over the previous year
of 1994-95 by 24.14 percentage.

281
(D) Column 6 refers to the total output in Rs. Crore generated by total
number of working factories. This shows continuous positive
growth although the period. In physical amount it is found
maximum in the year 2003-04 provisional estimates indicating
Rs. 207316 which was found 30763 in 1991-92. Thus the gap
between the beginning and last year is found of 1,76,553 i.e.
573.91 percentage. However from the entire period maximum
growth in percentage is found in the year 1995-96 (36.70%) over
the previous year 1994-95.
(E) Last column 7 refers to the data on Net Value Added during the
reference period. It is found from the table that the behavioural
pattern of net value added during the reference period shows
fluctuating trends. Out of 12 years period 3 times it is found
negative while in the remaining years the growth is found
positive. It is revealed that maximum growth over the year is
found in the year 2003-04. As per the provisional estimates of the
year the growth is 89.46 percentage more than it was in the
previous year. While in the year 2000-01 there was negative trend
of -14.35 in the value addition over the year 1999-2000.
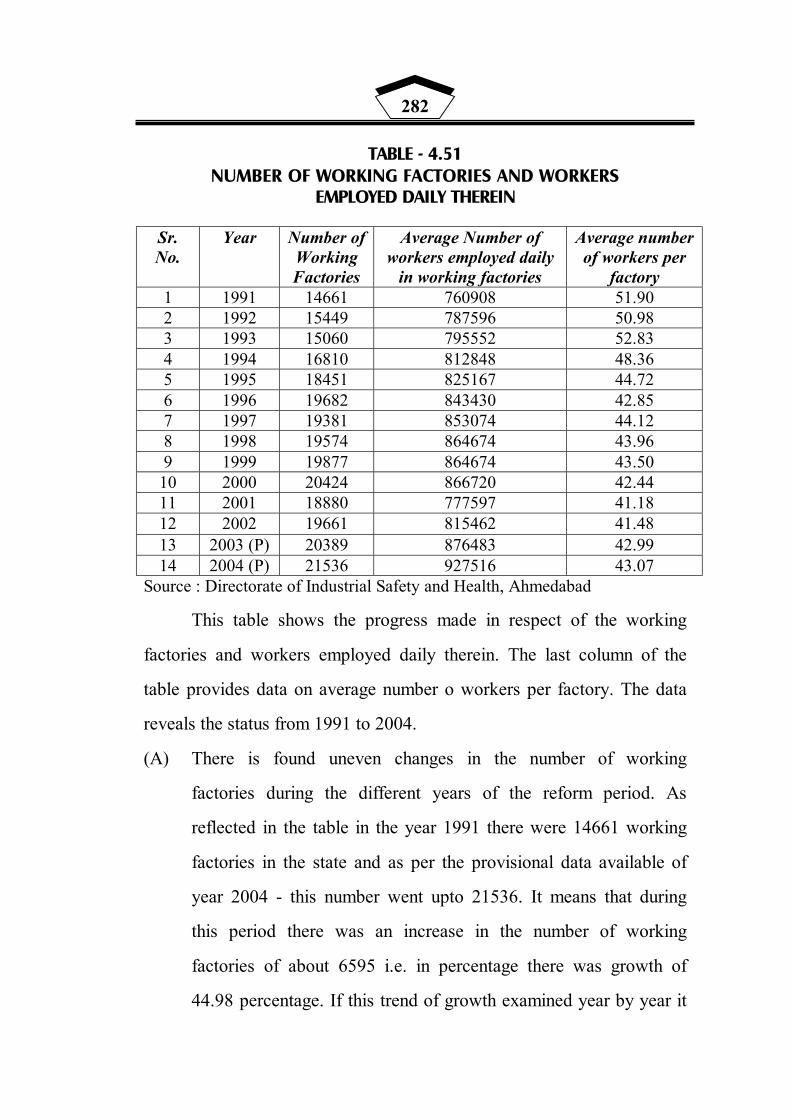
282
TABLE - 4.51 NUMBER OF WORKING FACTORIES AND WORKERS
EMPLOYED DAILY THEREIN
Sr. No.
Year Number of Working Factories
Average Number of workers employed daily
in working factories
Average number of workers per
factory 1 1991 14661 760908 51.90 2 1992 15449 787596 50.98 3 1993 15060 795552 52.83 4 1994 16810 812848 48.36 5 1995 18451 825167 44.72 6 1996 19682 843430 42.85 7 1997 19381 853074 44.12 8 1998 19574 864674 43.96 9 1999 19877 864674 43.50
10 2000 20424 866720 42.44 11 2001 18880 777597 41.18 12 2002 19661 815462 41.48 13 2003 (P) 20389 876483 42.99 14 2004 (P) 21536 927516 43.07
Source : Directorate of Industrial Safety and Health, Ahmedabad
This table shows the progress made in respect of the working
factories and workers employed daily therein. The last column of the
table provides data on average number o workers per factory. The data
reveals the status from 1991 to 2004.
(A) There is found uneven changes in the number of working
factories during the different years of the reform period. As
reflected in the table in the year 1991 there were 14661 working
factories in the state and as per the provisional data available of
year 2004 - this number went upto 21536. It means that during
this period there was an increase in the number of working
factories of about 6595 i.e. in percentage there was growth of
44.98 percentage. If this trend of growth examined year by year it
283
is observed that during the entire period number of working
factories has declined in 3years with highest fall in percentage
was found in the year 2001 over 2000 i.e. - 7.56. While the
remaining years show positive growth with highest positive
growth reported in the year1994 i.e. +11.62 over the year 1993.
(B) In respect of average number of workers employed daily there in
working factories the data as presented in the table reveals that
employment in numbers has declined in the year 2001 only once
through out the period. In that year it had declines by 89123 i.e.
10.28 percentage fall. While employment is found to have
increased in number in the year 2004 as per the provisional
estimates this has grown in number by 51033 i.e. 5.82 percentage
growth. Even in the preceding year 2003 employment had grown
with almost similar trend by 51.11%.
(C) In the last column data on average number of workers per factory
is presented. It is evidently found from the table that this has
changed very little during the period. Only in the beginning year
this has changed with considerable number but from 1995 to 2004
this deviation is insignificant in respect of the changes in number
of factories.
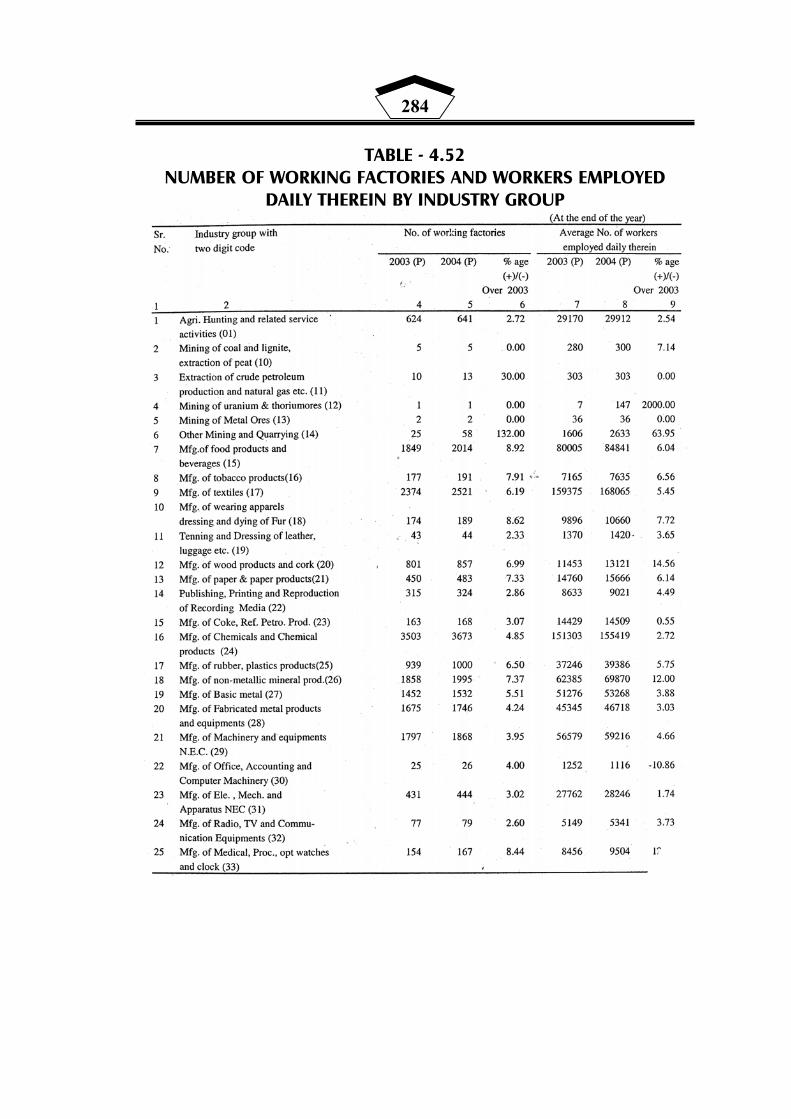
284
TABLE - 4.52 NUMBER OF WORKING FACTORIES AND WORKERS EMPLOYED
DAILY THEREIN BY INDUSTRY GROUP
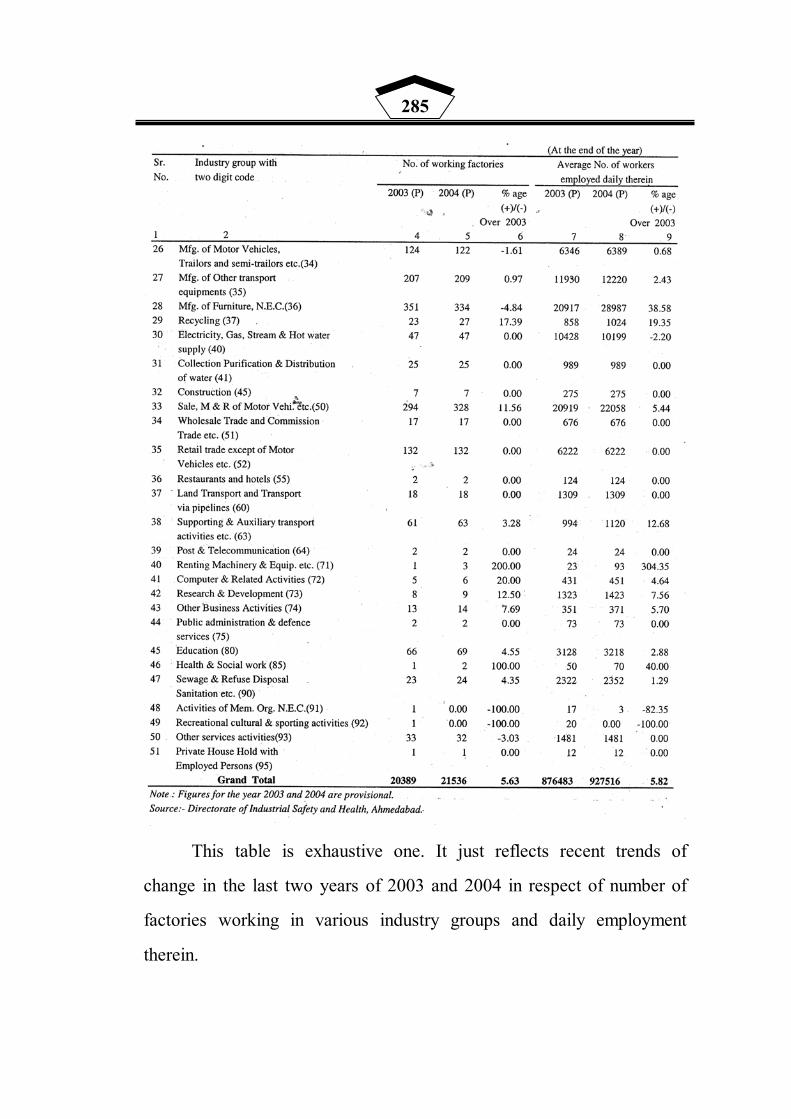
285
This table is exhaustive one. It just reflects recent trends of
change in the last two years of 2003 and 2004 in respect of number of
factories working in various industry groups and daily employment
therein.

286
As presented in the table it is evidently found that in total there
has been the change of 5.03 percent in the number of working factories
and 5.82 percentage change in the daily employment there in. This if
examined by industry groups, it reveals the fact that Renting Machinery
show 200 percent change, health and social work units show 100 percent
growth, Recycling 17.39 percentage growth. Mining and Quarrying
shows 132 percentage change and extraction of Petroleum production
show 32 percentage change.
SECTION - IX
ECONOMIC INFRASTRUCTURE IN GUJARAT
This section examines and analyses the data which reflects nature
and composition of growth of economic infrastructure in the State of
Gujarat. This mainly include - power, roads, transport, tele-
communication, banking. Table No. 4.53 to 4.62 - in all 10 broad tables
are presented in this section, which throws light on the progress that is
made during the different years mainly under reform period.
Mainly there are three tables (Table No. 4.53 and 4.54) which
highlight generation of power and changes in that, consumption of
power and the number of villages electrified to the total of Gujarat.

287
TABLE - 4.53 ELECTRICITY : INSTALLED CAPACITY AND GENERATION
Installed capacity (MW) Generation (MW) Years as on 31st March Central Share Total Central Share Total
1991 702 5094 4542 24430
1992 810 5593 5726 26973
1993 994 5957 4988 28995
1994 1100 6140 6425 31892
1995 1202 6241 6934 32908
1997 1323 6630 10539 38010
1998 1323 7582 10851 41494
1999 1323 8093 9790 45103
2000 1323 8343 11373 49379
2001 1562 8582 13534 50506
2002 1562 8651 15065 50069
2003 1532 8606 15140 55127
2004 1562 8712 15500 54727
2005 1602 8762 13891 58209
2006 1812 602 (MKWH) 4633 (MKWH) Source : Socio-Economic Review, Gujarat - 2005-06. C.M.I.E. - Monthly Economic Review, June 2006, p.39 (Gujarat).
Table No. 4.53 if examined and analysed reveals the fact that
installed capacity of power inclusive of central share to total tends to
increase continuously right from 1991 to 2005. Though proportion of
increase over the year tends to vary. This change is propornately found
maximum in the year 1998 over 1997 by 952 MW i.e. 14.36% change.
However exceptionally in the year 2003 the change was found negative
- 45 MW.
288
As against installation capacity generation of power in the state in
total, inclusive of central share also tend to vary over the period of time.
In comparison with the change in installed capacity, change in
generation of power is reported more. As against 1991 in 2005 installed
capacity had an increase of 3668 MW i.e. 72% rise was observed. While
power generation changed by 33779 MW i.e. 138.27%. Examining the
growth over the year it is observed that 400 MW reports negative
growth in the year in 2002 by 437 MW and in 2004. While this growth
is found positive during all other years, it is reported highest in the year
2003 - an increase of 5058 MW in percentage 10.10%, apart from this
year the year 2000 also registered significantly change in power
generation of 4276 MW in percentage an increase of 9.48.
As per the recent reports it is understood that as against the
demand for power in the state, as the present supply satisfy 83% of the
need while still recently 17 percentage deficit prevails in respect of
power in the State.
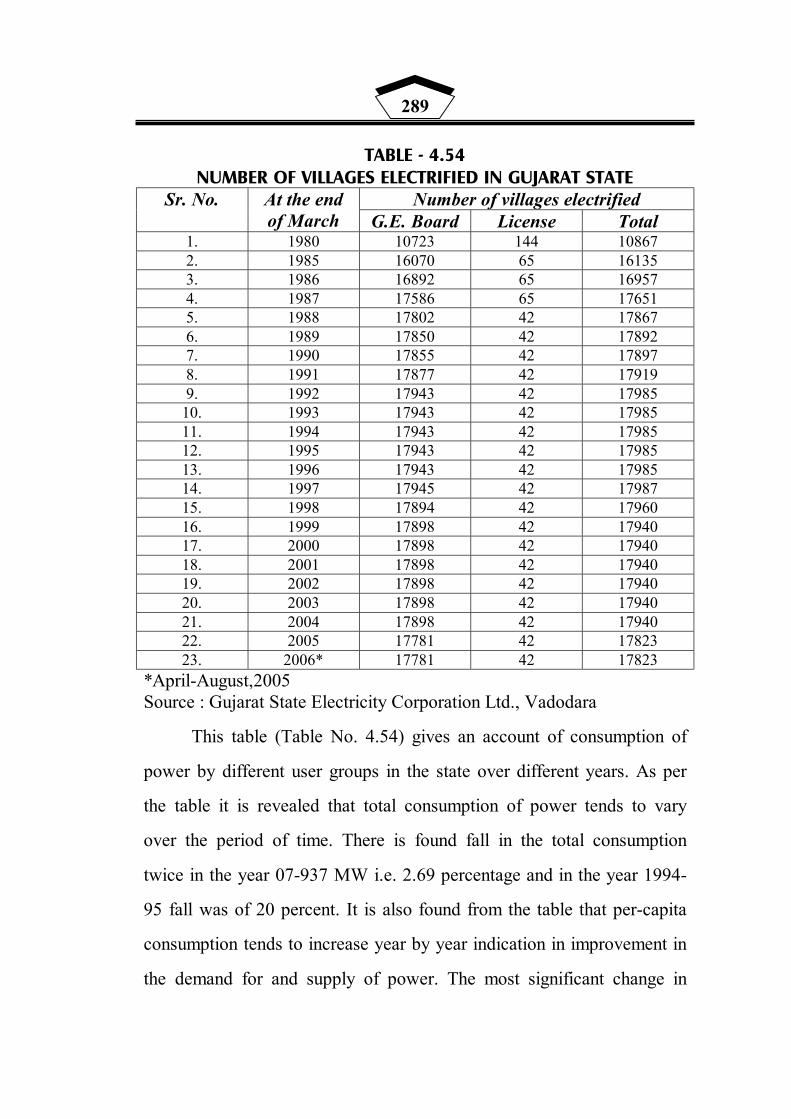
289
TABLE - 4.54 NUMBER OF VILLAGES ELECTRIFIED IN GUJARAT STATE
Number of villages electrified Sr. No. At the end of March G.E. Board License Total
1. 1980 10723 144 10867 2. 1985 16070 65 16135 3. 1986 16892 65 16957 4. 1987 17586 65 17651 5. 1988 17802 42 17867 6. 1989 17850 42 17892 7. 1990 17855 42 17897 8. 1991 17877 42 17919 9. 1992 17943 42 17985
10. 1993 17943 42 17985 11. 1994 17943 42 17985 12. 1995 17943 42 17985 13. 1996 17943 42 17985 14. 1997 17945 42 17987 15. 1998 17894 42 17960 16. 1999 17898 42 17940 17. 2000 17898 42 17940 18. 2001 17898 42 17940 19. 2002 17898 42 17940 20. 2003 17898 42 17940 21. 2004 17898 42 17940 22. 2005 17781 42 17823 23. 2006* 17781 42 17823
*April-August,2005 Source : Gujarat State Electricity Corporation Ltd., Vadodara
This table (Table No. 4.54) gives an account of consumption of
power by different user groups in the state over different years. As per
the table it is revealed that total consumption of power tends to vary
over the period of time. There is found fall in the total consumption
twice in the year 07-937 MW i.e. 2.69 percentage and in the year 1994-
95 fall was of 20 percent. It is also found from the table that per-capita
consumption tends to increase year by year indication in improvement in
the demand for and supply of power. The most significant change in

290
per-capita consumption is found in the year 2004-05 - which shows an
increase of 389 MW, ever found in the entire period of last 15 years.
The data if examined in respect of proportion of consumption by
user groups and change for the same in respective years following are
available.
(A) Consumption by industry group is found in percentage to total as
under :
38.98% in 1988-89
36.49% in 1989-90
35.56% in 1990-91
31.57% in 1991-92
29.76% in 1992-93
29.91% in 1993-94
40.12% in 1994-95
38.23% in 1995-96
39.34% in 1996-97
37.70% in 1997-98
35.21% in 1998-99
30.40% in 1999-2000
28.59% in 2000-01
28.21% in 2001-02
31.62% in 2002-03
33.00% in 2003-04
33.79% in 2004-05
291
This shows that from 1988-89 to 1993-94 there was declining
trend in consumption. Thereafter fluctuating trends are found showing
more fall and less rise till 2001-02. Again from 2002-03 this trends to
increase.
Power consumption by agriculture group tends to show increase
from 1988-89 to 1993-94. In the year 1994-95 is showed a little fall,
which went up by 1675 MW in the year 1995-96 next year in 1996-97 it
declined just by just 46 MW. However from 1997-98 onwards till 2001-
02 consumption by agriculture group continuously went on increasing.
Again from 2002-03 onwards till this year consumption of power by
agriculture has declined. It is evidently proved that agriculture tends to
be the second largest uses of power in percentage to the total
consumption. Domestic consumption however demonstrates constant
rise in consumption though in degree it varies over the period of time.
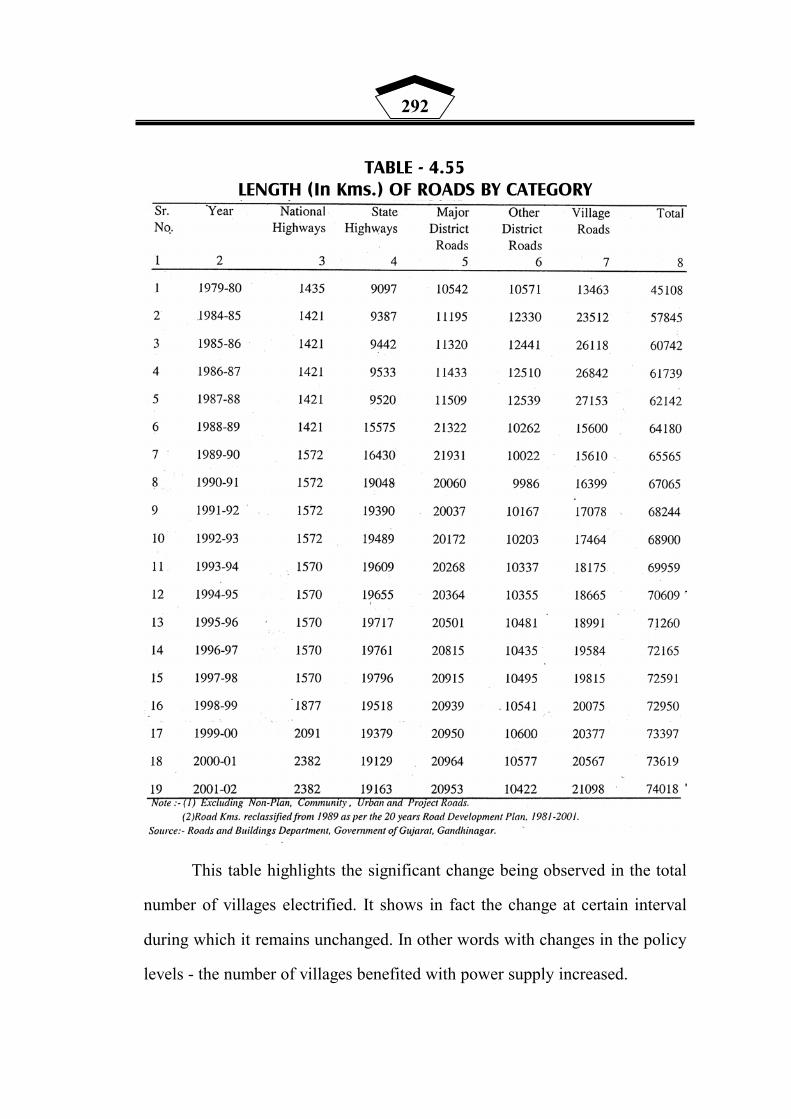
292
TABLE - 4.55 LENGTH (In Kms.) OF ROADS BY CATEGORY
This table highlights the significant change being observed in the total
number of villages electrified. It shows in fact the change at certain interval
during which it remains unchanged. In other words with changes in the policy
levels - the number of villages benefited with power supply increased.
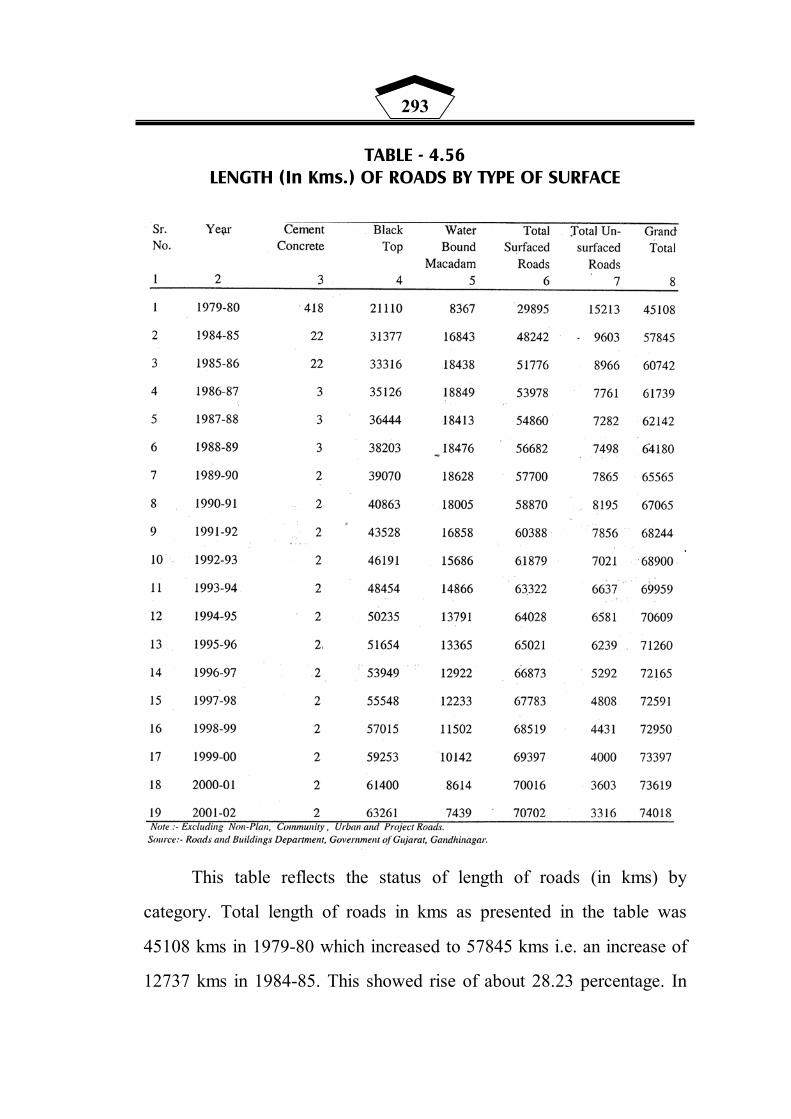
293
TABLE - 4.56 LENGTH (In Kms.) OF ROADS BY TYPE OF SURFACE
This table reflects the status of length of roads (in kms) by
category. Total length of roads in kms as presented in the table was
45108 kms in 1979-80 which increased to 57845 kms i.e. an increase of
12737 kms in 1984-85. This showed rise of about 28.23 percentage. In
294
1989-90 it again showed an increase of 7720 kms change of 13.34
percent. Examining this change in respect of year over year it
demonstrates very little change in this regard.
The other important element to be examined is the composition of
length of roads in kms. From 1989-90 to 1992-93 national highway in
length to the total road length was 2.30 percentage approximately as per
1991-93 in 1997-98 this proportion of national highway in percentage to
the total was of about 2.16 percentage. In the year 2001-02 length of
national highway to the percentage of total road length was found to the
tune of 3.22 percentage. In comparison with 1991 national in length
increased from 1572 to 2352 i.e. an increase of 810 km - 51.52
percentage. This change in the earlier decade was of 1137 km i.e.
79.23% increase.
State highways in length in Gujarat increased in the decade of 80s
by 9951 kms i.e. 109.38 percentage growth. As against that in the
decade of 90's it increased by 115 km i.e. 0.60 percentage change. It is
worth important to note that conversion of national highway integration
is not found adequate in respect of the overall growth.
Table No. 4.56 highlights in general length of roads by type of
surface. It is reflected from the table that in 1980 the proportion of
surfaced roads to the total roads i.e. length in kms was 66.27 percentage
- this situation in 1985 improved with 83.40 percentage of surfaced
roads in 1990 it increased in percentage to 88.00. In 1995 percentage of
surfaced roads to total was 90.68. In 2001-02 this percentage went upto

295
95.52 percentage. This shows significant improvement in average
quality of roads over the period of time.
TABLE - 4.57
NUMBER OF MOTOR VEHICLES REGISTERED At the end of March Sr.
No. Class of Vehicle 1980 1990 1995 2000 2003 2004 2005
As on 30th Sept 2005
1. Motor Cycle (two wheelers)
241165 1257826 2109897 3673658 4702529 5162167 5744353 6009068
2. Autorickshaws 31053 98917 137335 223908 258375 276908 296758 312033 3. Jeep 14328 33796 51750 89087 104263 110943 117809 120229 4. Motor Cars
(Three and Four
Wheelers)
52817 141584 222049 398028 522166 572414 632154 665857
5. Taxi Cabs 2896 9069 27581 31759 34579 36065 37422 38025 6. Passenger
Buses 10997 19768 26798 38496 41594 44500 47971 49801
7. School Buses 206 243 301 457 659 811 1048 1366 8. Private
Service Vehicles
751 2027 3026 3695 3838 3912 4035 4075
9. Goods Vehicles
(including tempos and
three wheeler vehicles)
44392 119461 198187 317151 362572 386640 418811 434602
10. Trailers 25461 67828 102428 172504 194501 199603 206498 210544 11. Tractors 32492 85386 134479 230050 267113 275543 290219 298590 12. Ambulances 575 1285 1670 2539 3166 3454 3606 3698 13. Others
(including police vans)
1371 3154 5665 9400 13015 14530 16588 17924
Total 458504 1840344 3021166 5190732 6508370 7087490 7817272 8165812
Source : Commissioner of Transport, Gujarat State, Gandhinagar.
This table is related with number of motor vehicles registered in
the state of Gujarat. It provides the changing trends in respect of number
of uses of vehicles along with compositional change of the vehicles.
Following are the major conclusions derived from this table.
(A) Total number of vehicles registered in different years show
positive change. It is found that in between 80 to 90 decadal
growth in percentage of vehicles registered showed 30.14
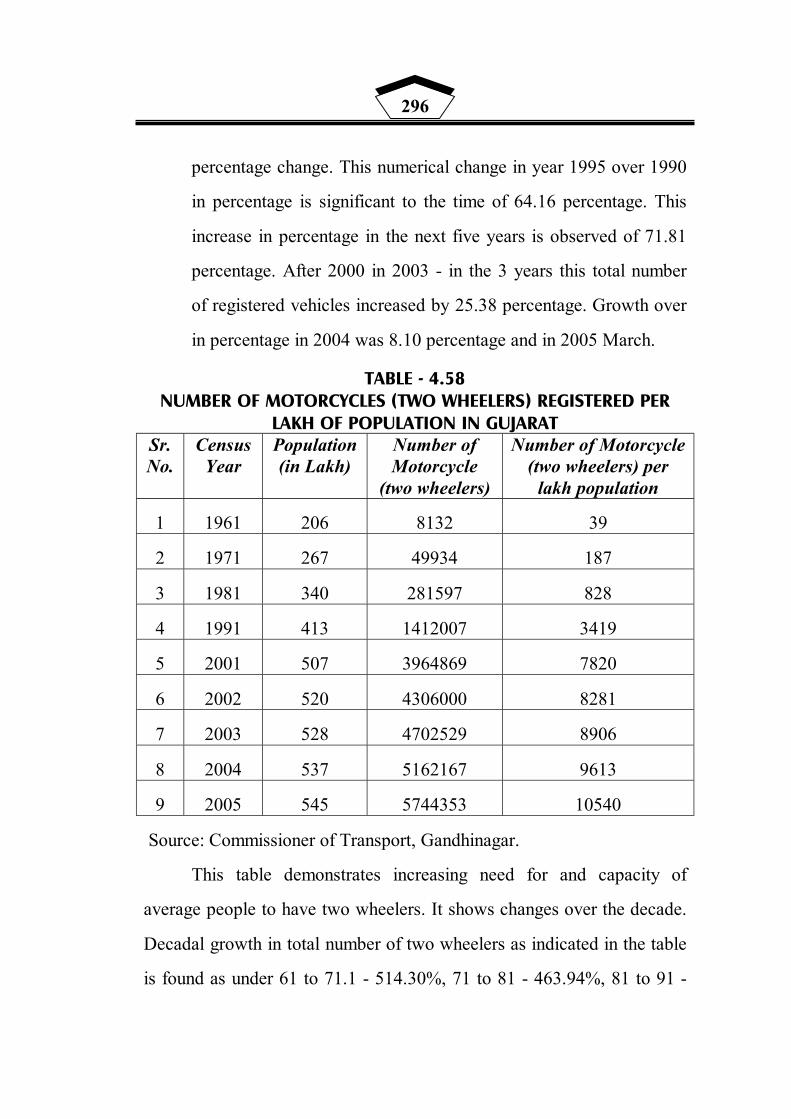
296
percentage change. This numerical change in year 1995 over 1990
in percentage is significant to the time of 64.16 percentage. This
increase in percentage in the next five years is observed of 71.81
percentage. After 2000 in 2003 - in the 3 years this total number
of registered vehicles increased by 25.38 percentage. Growth over
in percentage in 2004 was 8.10 percentage and in 2005 March.
TABLE - 4.58 NUMBER OF MOTORCYCLES (TWO WHEELERS) REGISTERED PER
LAKH OF POPULATION IN GUJARAT Sr. No.
Census Year
Population (in Lakh)
Number of Motorcycle
(two wheelers)
Number of Motorcycle (two wheelers) per
lakh population
1 1961 206 8132 39
2 1971 267 49934 187
3 1981 340 281597 828
4 1991 413 1412007 3419
5 2001 507 3964869 7820
6 2002 520 4306000 8281
7 2003 528 4702529 8906
8 2004 537 5162167 9613
9 2005 545 5744353 10540
Source: Commissioner of Transport, Gandhinagar.
This table demonstrates increasing need for and capacity of
average people to have two wheelers. It shows changes over the decade.
Decadal growth in total number of two wheelers as indicated in the table
is found as under 61 to 71.1 - 514.30%, 71 to 81 - 463.94%, 81 to 91 -

297
401.43%,91 to 2001 180.79% 2001 to 06 - 60.21%. It is also reflected
from the table that number of two wheelers per lakh population has
increased in numbers by 148, 641, 2591, 4401 (461, 625, 707 and 927)
in last year one year. In the last five years two wheelers per lakh
population show an increase of 2720.
TABLE - 4.59 CARGO HANDLED (LAKH TONNES) BY PORTS IN GUJARAT
Source: Kandla Port Trust, Kandla, Dist. Kachchh Gujarat Maritime Board, Gandhinagar

298
This table highlights working of parts in the state of Gujarat. The
data is presented in bifurcation i.e. exclusively of Kamdala major
national part and intermediate and minor parts. This table shows that in
the 80's Kandala part reported to have increase of cargo handed in lakh
tones by 108.69 lakh tones in number and in the decade of 1990's it
showed the total of 367.41 lakh tones - which reported an increase of
170.56 lakh tonnes. In 2004-05 Kandala part registered cargo handled in
415.51 lakh tones. It is however important to note that cargo handled in
lakh tones by Kandala major part was maximum in the year 1999-2000,
463.03 lakyh tones. This shows decadal change in percentage by
+122.51 in 80's, + 86.36 in 90's and +13.06 in the remaining 5 years. In
comparison with Kandala part cargo handled by all other was 27.80 lakh
tones in 1980-81 which went upto 75.54 lakh tones - showing an
increase of 47.74 lakh tones, in percentage 169.09% change. In 1990's it
reported 731.80 lakh tones indication the growth in number by 656.26
lakh tones and in percentage whooping growth of 868.42. In 2004-05
this further increased to 971.28 lakh tones showing 32.56 percentage
increase this had again increased by 10.29 percentage. The last available
data from April - 2005 to March 2006 indicated 10.30 percentage
change.
Regarding compositional breakup of registered vehicles it is
evidently proved that the number of two vehicles tend to show an
increase in numbers. It is also found from the table that of the total
vehicles registered in the state number of two wheelers registered in
percentage increased to 68.34 in 1990, in 1995 that percentage ratio
299
increased to 69.63. In the year 2000 two wheelers registered in the state
in percentage to the total was found to the tune of 72.25 percentage in
the year 2005 it went upto 73.48 and at the end of March 2006 it was
73.67 percentage.
Another important vehicle which represents ordinary group of
society is the use of Autoriskshaw. There is found significant increase in
the registered numbers of auto rikshaw in the 80's of 67,864 i.e. in
percentage 218.54 percentage. In the year 2000 this in number went
upto 223908 an increase of 1,24,991 in percentage 126.36. In the year
2005 this number is found 2,96,758 which shows an increase of 32.53
percentage in number 72,850 in the last five years.
The trends in respect of motor cars, goods vehicles an tractors
also show considerable improvement in their use over the period of
time. Cars in numbers improved by 168.06 percentage between 1980 top
1990, and it again increased in the decade of 1990's by 181.12
percentage and in the last five years there is found an increase of 58.82
percentage.
Numbers of goods vehicles show an improvement of 169.10 in
80's and 165.48 percentage growth in 90's. The last five years show the
change in percentage of about 32.05. Tractors show significant change
in 80's of 162.79 percentage in 1990's this was of 169.42 percentage
and in the last 5 years 26.15 percentage.
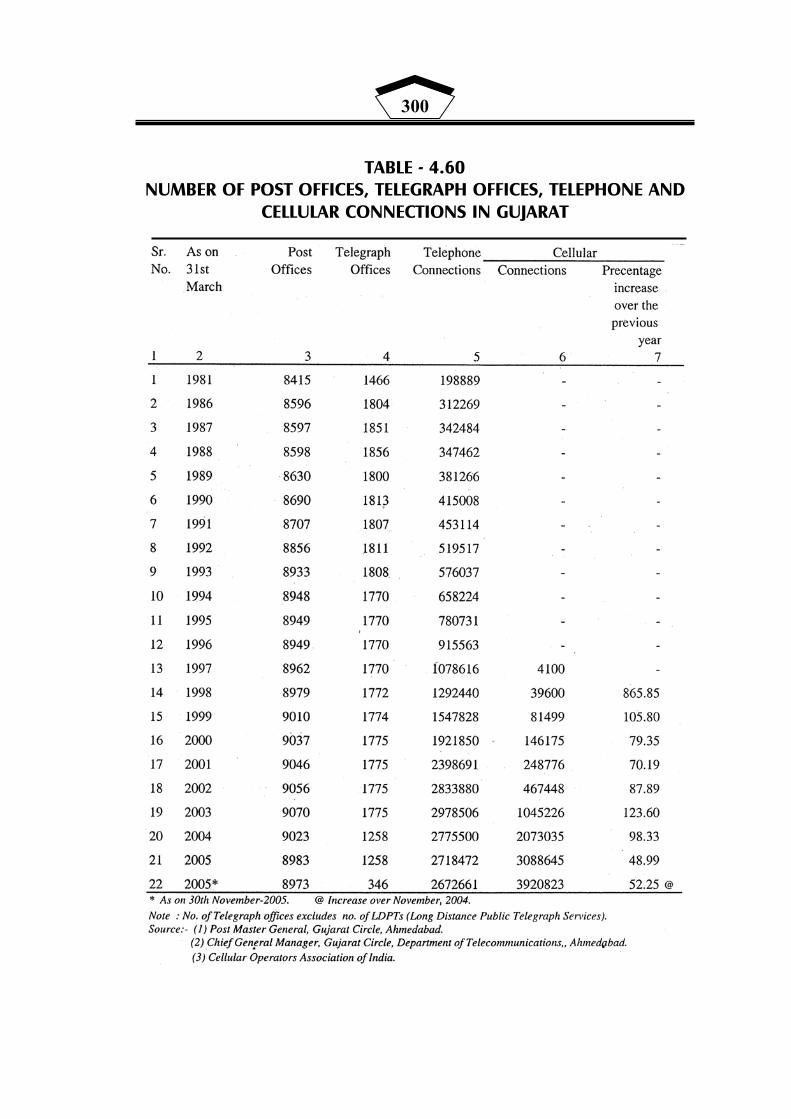
300
TABLE - 4.60 NUMBER OF POST OFFICES, TELEGRAPH OFFICES, TELEPHONE AND
CELLULAR CONNECTIONS IN GUJARAT

301
This table shows the change in numbers of different modes of
communications. Communication system has assumed key significance
in the growth of economy. It is in this respect that data pertaining to
different modes like post office, telegraph offices, telephone connections
and cellular connections. This data reveals the following facts.
(A) Decadal growth in number of post offices working in Gujarat
shows positive trend till 2004. During 80's this number had
increased by 3.47 percentage which showed an increase of 3.89
percentage in the 90's and in 2004 this number declined by 23
registering insignificant negative change.
(B) Telegraph offices functioning in the state increased 243 in 80's
showing 16.57 percentage change which showed fall in the
number by 32 showing insignificant full in percentage but in 2005
it showed sizeable decline of 517 i.e. 29.13 percentage fall.
(C) As against this telephone users phone increasing trends in the
state from 1981 to 2003. In 1980's number of telephone
connections increased by 254225 showing growth in percentage
by 127.82. From 1991 to 2001 - this connections further increased
by 1945577 indicating 429.38 percentage increase and this
continued to increase till 2003 - in the last two years there was
found change of 579815 - 29.17 percentage. However with
increasing tendency for cellular this connection in physical
numbers went down by 260034 - reflecting - 8.73 fall in
percentage.
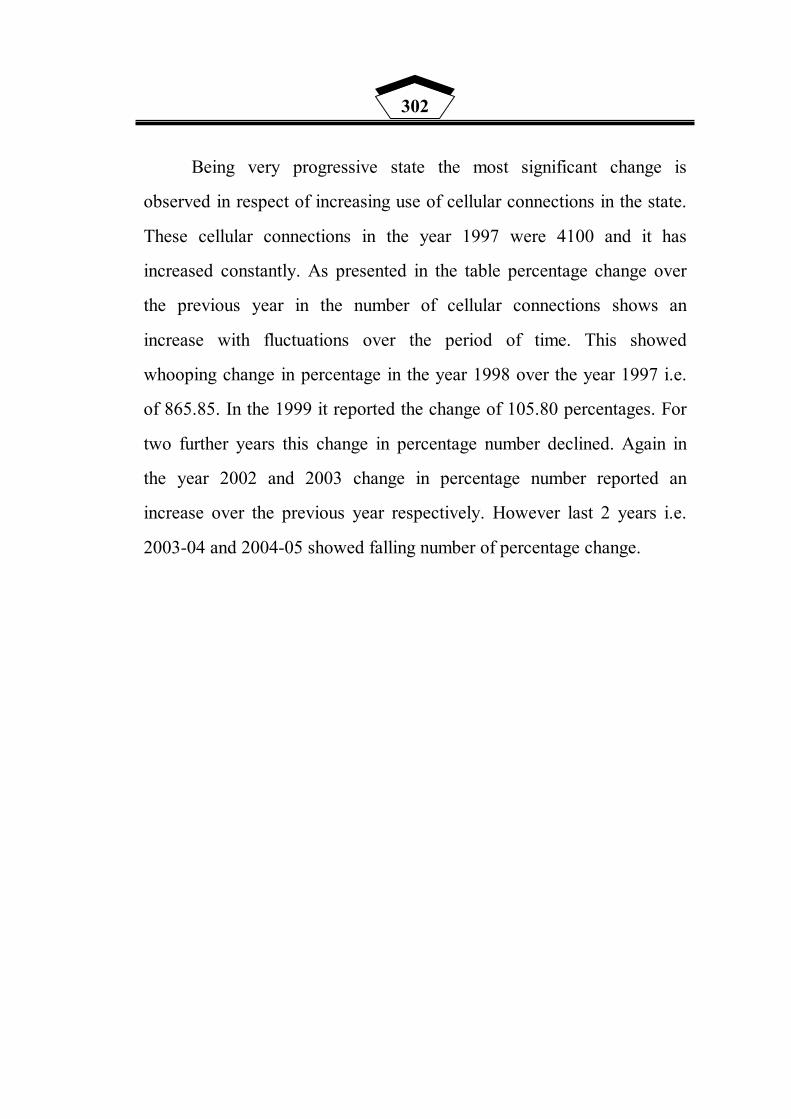
302
Being very progressive state the most significant change is
observed in respect of increasing use of cellular connections in the state.
These cellular connections in the year 1997 were 4100 and it has
increased constantly. As presented in the table percentage change over
the previous year in the number of cellular connections shows an
increase with fluctuations over the period of time. This showed
whooping change in percentage in the year 1998 over the year 1997 i.e.
of 865.85. In the 1999 it reported the change of 105.80 percentages. For
two further years this change in percentage number declined. Again in
the year 2002 and 2003 change in percentage number reported an
increase over the previous year respectively. However last 2 years i.e.
2003-04 and 2004-05 showed falling number of percentage change.
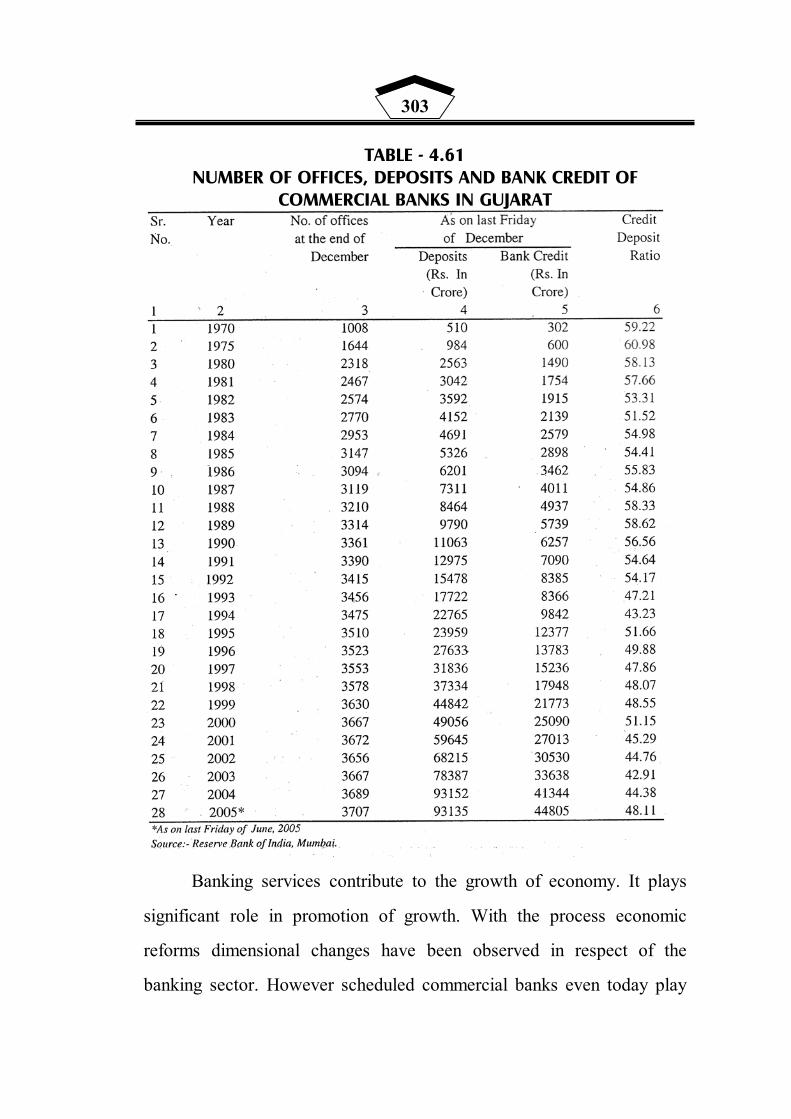
303
TABLE - 4.61 NUMBER OF OFFICES, DEPOSITS AND BANK CREDIT OF
COMMERCIAL BANKS IN GUJARAT
Banking services contribute to the growth of economy. It plays
significant role in promotion of growth. With the process economic
reforms dimensional changes have been observed in respect of the
banking sector. However scheduled commercial banks even today play
304
dominant role. Operational strategy before the reforms and after reforms
have changed considerably, simultaneously there has been wide spread
changes in the economic spectrum. It is in this context that the role of
traditional parameters needs to be examined and analysed accordingly.
Table No. 4.61 provides basic data on the typical performance of
SCB's. It reveals the status of banking operations in terms of number of
branch offices of SCB's, deposits and credit of SCB's and also credit
deposit (CD) ratio of SCB's. The time period exhibiting the performance
is from the year 1970 to 2004.
It is revealed from the table that growth in the number of offices
express decadal change by 129.96% in 1970's, 45.53% change in 1980s
and 009.10 percentage change in 1990s, while growth in deposits is
changed by 402.55 percent in 1970s, 331.61 percent change in 1980s
and 343.42 percentage change in 1990s. Credit disbursed by SCBs in
1970 increased by 393.38 percentage during 1980s it increased by
319.93 percentage and in 1990s the change was of 400 percent. CD ratio
of SCBs over the period of time, if examined suggests sharp
fluctuations. It is found changing over the period of time with uneven
pace in the very beginning period of reform, this ratio was observed
maximum while in the year 2003 this was found to be lowest.
305
SECTION - X
SOCIAL SECTOR DEVELOPMENT IN GUJARAT
This section deals with the behavioural pattern of different
parameters of education, health and water being observed in Gujarat
State. In all education status is reflected in terms of gross enrollment
ratio (different regions of the state), recent deep out rates, number of
educational institution, students, teachers (category wise), expenditure
on education, while in respect of health - it focuses on health status of
Gujarat in relation to India, Birth rate, Death rate, infant mortality rate,
percentage of malnutrition, health facilities and expenditure on health.
In respect of water - basic data on availability of water facility is
provided in a separate table.
Table No. 4.62 to 4.67 presents the status of education in terms of
different indicators. While Table No. 4.68 to 4.73 provide data on
various health indicators. Table No. 4.74 and 4.75 two tables
demonstrates the situation that prevails in respect of water and sanitation
as a result of growth process in the state. In general there are 15 tables
which highlight the status of social sector growth in the state economy.

306
Table 4.62 (File Name : Table 4.21 to.......) (2 pages) wide

307
Table 4.62 (2nd page)

308
This table provide detailed picture of educational institutions,
students and teachers that is found in the reform period. The data covers
the period beginning from 1995-96 to 2004-05. This entire table is
divided into 3 parts which highlights the strength (numbers) of various
category of education. Examining the category of primary education
column 1.1(a to c) reveals the following trends.
(A) Total number of primary education institutions show decadal
growth of 4552 i.e. it increased from 33119 to 37671 indicating
the change in percentage by 13.74%, primary education institutes
in numbers show positive trend although the period of various
degree.
(B) As long as the strength of primary students is concerned it is
clearly found that this has increased by 962'000 i.e. phenomenal
rise in percentage of about 13.17 percent within the decade. Like
number of institutions, number of students progress has been
constant positive through the entire period. While from amongst
total number of primary students - by sex girls were 3082'000 in
1995-96 i.e. 42.19 percentage. This number of girls students
increased by 510'000 i.e. 16.55 percentage rise. It means that
percentage increase amongst girls in primary education tends to
be more positive in comparison with change in aggregate primary
students. In 2004-05 girls primary students in percentage to the
total is found of 43.45. This shows that in primary education
growth in percentage of girls in the decade has increased by 1.26
percentage point.
309
(C) It is found that number of primary school teachers in the year
1995-96 was 175356 of which 80600 (45.96 percentage) were
female teachers. This number in the year 2004-05 increased to
213311 of which 104728 (49.10 percentage) were female
teachers. This shows decadal growth of 37955 in numbers
indicating 21.64 percentage change in the decade, while number
of female primary teachers show an increase of 24128 - reflecting
percentage change of 29.93. This proves that in the decade in
primary education set up female teachers have been more
absorbed in proportion to the male teachers.
(D) This section of table 4.62 gives an account of the change that is
observed in respect of number of secondary and higher secondary
institutions - along with number of students and teachers.
In total number of working institutes were 5713 in the year 1995-
96. This number as per the last data of 2004-05 was 9718. It shows an
increase in numbers of 2005 bringing about change of 35.10 percentage
within a decade. From this 5713 institutions in 1995-96 - 394 were
exclusively for girls i.e. 6.89 percentage to the total of institutes. This
went up to 524 in the year 2004-05 i.e. increase of 130 i.e. 32.99%
change and in 2004-05 girls secondary schools in percentage to the total
reported as 6.79 percent. It means that there was a little of 0.10 growth
in percentage of girls institutions in a decade. The trend in general for
secondary and higher secondary institutions showed continuous positive
change at a low rate, through the entire period of time.
310
From amongst these 5713 institutions 3893 (68.14 percentage)
were only secondary schools while remaining 1820 (31.86 percentage)
were upto 12th standard (higher secondary). This again if classified by
sex 186 out of 3893 (4.78 percentage) were only girls secondary schools
and from 1820 only 208 (11.43 percent) were girls higher secondary
school. It thus reveals the fact that girls higher secondary schools are
propornately more than the girls secondary schools.
This ratio of higher secondary schools to secondary in general and
for girls does show change in the year 2004-05. As against 3893
secondary schools in 2004-05 this number went upto 5260 i.e. an
increase of 1367 reflecting 35.11 percentage change in a decade. While
girls school in number in 2004-05 were 269 bringing about change of 83
in numbers and 44.62 in percentage. Number of higher secondary
schools in 2004-05 were 2458 i.e. 638 in numbers showing 35.05
percentage change in the decade girls higher secondary schools went up
from 208 to 255 i.e. an increase of 47 with 22.59 percentage increase in
the same. This reveals thus the fact that within a decade percentage
growth between secondary and higher secondary institutions do not vary
much but as long as girls institutions are concerned percentage change
in secondary girls institutions is found more than that is found for higher
secondary institutions.
(E) To talk about number of students in secondary and higher
secondary institutions, in the year 1995-96 total number of
students enrolled were 1925'000 of which 777'000 i.e. 40.36
percentage were girls. From this number only secondary students

311
were 1544'000 (80.21 percentage), while number of students
studying in 11th and 12th standard were 381 (19.79 percentage).
From amongst 777'000 girls students secondary girls students
were 612 i.e. 78.76 percentage and 165'000 (21.23 percentage)
were girls studying in standard 11th and 12th.
In comparison with 1995-96 number of secondary and higher
secondary students in 2004-05 were 2464'000. This shows an increase in
number of 539'000 in percentage the change appeared to be of 28.00
percent. Of this 2464'000 students - girls students are in the number of
992'000. Number of girls students in percentage to the total of secondary
/ higher secondary students is found to be 40.26. As against 1995-96 -
an 2004-05 girls students show an increase of 115'000 - they in
percentage happened to be change of 14.80. It thus reveals the fact that
in aggregate decadal growth of secondary students is found of 28
percentage - but in comparison with this the decadal growth in
percentage of girls students is found to the tune of 14.80 percent only.
From amongst total of 2464'000 students, 1987'000 students in
2004-05 are only secondary students. This shows that 80.64 students are
secondary while 477'000 students are higher secondary students (19.35
percentage). This shows thus just a little +0.43 percentage point change
in the number of secondary students within the decade.
From amongst 992'000 girls students in 2004-05, 794'000 i.e.
80.04 percentage were secondary school girls students while remaining
199'000 (19.96 percentage) were girls students studying in 1`1th and
12th standard.
312
(F) In the year 1995-96 total number of teacher for secondary and
higher secondary stream was 64243. From amongst this 23948
(37.28 percentage) teachers were only for secondary section,
while 46295 teachers (62.72 percentage) were teaching to
standard 8 to 12 students. From this 64243 recognized secondary
teachers, 15218 i.e. 23.69 percentage were female teachers.
As presented in the table number of secondary teachers in 2004-
05 is 71648. This shows decadal change of 7,405 teachers
bringing the change in percentage of 11.52. From this 71648
teachers, 31403 (43.83 percentage) are exclusively secondary
teachers while remaining 40245 (56.17 percentage) are teachers
of the schools of standard 8 to 12. This brings about 7455 i.e.
31.13 percentage increase within a decade in the number of
secondary teachers. Decadal change in the number of higher
secondary teachers tends to be of 40245 - thus showing negative
change of -50 within a decade. In 2004-05 from amongst 71648
secondary teachers 18774 were women teachers and suggesting
percentage of 26.20 to the total teachers strength. This bring
change in the number of female teachers of 3556 i.e. 23.36
percentage change.
In general this part of the table leads to conclude that in a decade
strength in number of secondary teachers has improved in comparison
with the strength in number of higher secondary teachers. It is also
noticed that in a decade change in percentage of female teachers has
313
improved but it has not changes as much as the change in number of
male teachers..
(G) It is found from the 3rd part of the table that in 1995-96 institutes
in the state providing higher education were 436 out of which 62
were only for girls (24.22%). This number went upto 747 in the
year 2004-05. This indicated an increase of 311 (71.33
percentage) in a decade. From this 747 institutes a 80 were
women institutes i.e. (10.71%). This shows an increase of 18
(29.03 percentage) in the decade.
Total number of students studying in higher education institutions
in 1995-96 was 410'000 of which 180'000 were female students i.e.
43.90 percentage. This number of students after a decade in the year
2004-05 were 494'000 showing an increase of 84'000 i.e. 20.49
percentage change. From amongst this 494'000 students 218'000 were
female students i.e. 44.13 percentage. This also demonstrates +38'000
change in a decade for female students showing growth of 21.11
percentage.
Total number of teachers in higher education institutions were
10643 in 1995-96, this number of teachers in 2004-05 went up to 11452.
This shows change of 809 i.e. 7.60 percentage within a decade. In the
year 2004-05 from amongst 11452 teachers, 3165 were women - this
appeared to be 27.64 percentage to the total teachers.

314
TABLE –4.63 ENROLMENT RATES (AGE 6-14 YEARS) BY NSS REGIONS, GUJARAT,
1999-00 AND 1993-94 Per cent 1999-00 Per cent 1993-94
NSS region Never Enrolled
Enrolled but left
In age 6-14 going to School
Net enrolment in elementary
School
In age 6-14 going to school
Net enrolment in elementary
school Male Male
Eastern region
15.78 6.89 77.33 75.87 76.21 70.46
Plains-Northern region
9.33 4.27 86.40 82.20 87.44 81.44
Plains-Southern region
6.32 7.89 85.79 81.48 84.37 76.86
Dry region 12.99 3.78 83.24 64.37 80.12 63.04 Saurashtra 5.45 4.12 90.44 75.72 81.38 79.55 Rural 10.32 6.00 83.68 75.45 79.91 73.52 Urban 7.26 3.53 89.21 80.47 88.88 80.87 Gujarat 9.38 5.25 85.37 76.98 82.57 75.70
Female Female Eastern region
20.76 7.74 71.49 68.20 66.91 60.10
Plains – Northern region
16.24 7.93 75.83 71.73 73.77 68.23
Plains – Southern region
10.50 7.60 81.90 76.03 72.73 63.56
Dry region 32.11 7.45 60.45 48.66 61.26 45.01 Saurashtra 10.97 9.89 79.14 66.69 69.18 68.23 Rural 19.88 8.76 71.36 63.95 63.49 57.35 Urban 8.64 7.02 84.34 77.48 82.90 74.89 Gujarat 16.68 8.26 75.05 67.80 69.55 62.62
Persons Persons Eastern region
18.17 7.30 74.53 72.19 71.98 65.75
Plains – Northern region
12.72 6.06 81.23 77.07 80.78 75.01
Plains Southern region
8.21 7.76 84.03 79.01 79.24 71.00
Dry region 21.39 5.39 73.22 57.46 70.99 54.31 Saurashtra 8.04 6.84 85.12 71.47 75.32 73.92 Rural 14.89 7.32 77.80 69.95 72.17 65.90 Urban 7.89 5.11 87.00 79.12 85.95 77.95 Gujarat 12.82 6.67 80.52 72.66 76.37 69.56
Source : Calculated using NSS Data

315
This table throws light on enrolment rates in the age group of 6 to
14 years computed on the basis of NSS Data. These data reflect region
wise status, status by residence and that of aggregate Gujarat. The data
is for the period of the year 1993-94 in percent and for the 1999-2000.
The state is here divided in five regions by NSS - as Eastern region,
plains, Northern region - plains South region Dry region and Saurashtra.
The data also is bifurcated by sex into male - female and aggregate
persons.
As revealed in the table - it is found in the 55th rural NSSO that in
the year 1999-2000, in aggregate Gujarat 12.82 percent of the children
in the age group of 6 to 19 were never enrolled in the school, from
which this ratio in rural area was of 14.89 percent. In other words at
least 1 out of 7 children from rural Gujarat never went to school. If this
proportion examined in context of regions it was found maximum 21.39
percent in dry region of the state which means from this dry region 1 out
of 5 children never went to school. Eastern region of the state which is
largely populated with tribal people has also high rate of percentage of
children never enrolled in the school.
This ratio when examined of female to male it is further revealed
that in rural Gujarat the gap between male and female child in respect of
percentage never enrolled to school and enrolled but left is wider than
that is observed in urban areas. Even in relatively better areas of the
state like plains - South region there prevails wide gap in respect of
percentage of female children not enrolled and male children not
enrolled.
316
If the trend is examined in respect the time period it is found that
in percent net enrolment in elementary school in the state was 69.56 in
1993-94 which was reported 72.68 percent in 1999-2000. It thus
suggested a change of +3.10 percent point between the years. This trend
when examined for rural and urban Gujarat it is further observed that
change in rural Gujarat tends to be of 4.05 percent point during the
period while in urban Gujarat the change is of only 1.17 percent point. It
is also found that net enrolment during the period in case of rural female
is found to have changed more than in comparison with rural male.
Percentage of children going to school has increased from 76.37 to
80.52 showing 4.15 percentage point change. This indicator also shows
much improvement in case of rural Gujarat with an increase of 5.63
percentage point in comparison with urban Gujarat. This trend shows
heartening change in case of rural female with an increase of 8.37
percent point in comparison with both rural male and urban female.
Different data consistently however show that female education
has been suffering in the state though it improved in the 1990s much
more than for males. Even then Gujarat is far behind other states in
female education. On the other hand the state has been well placed as far
as enrolment of boys is concerned but improvement there too stagnated
in the later half of the 1990s.

317
TABLE – 4.64 GROSS ENROLMENT RATES IN ELEMENTARY SCHOOL BY DISTRICT,
1996 AND 2000
1996 2000 District Boys Girls Total BOYS Girls Total
Ahmedabad 105 92 99 108 63 87 Amreli 91 75 83 92 80 86 Anand - - - 94 82 89 Banaskantha 89 54 72 99 72 86 Bharuch 102 73 88 159 156 158
Bhavnagaar 101 72 87 84 73 79 Dangs 118 120 119 123 129 126 Dahod - - - 124 93 732 Gandhinagar 61 61 61 138 124 109 Jamnagar 86 69 78 71 65 68
Junagaadh 85 74 80 76 72 74 Kachchh 91 66 79 91 77 85 Kheda 96 78 88 93 81 98 Mehsana 99 82 91 101 92 97 Narmada - - - 97 86 92
Navsari - - - 78 77 78 Panchmahals 91 62 77 99 88 93 Patan - - - 114 94 105 Porabandar - - - 73 69 71 Rajkot 107 62 85 77 73 75
Sabarkantha 88 77 83 89 79 84 Surat 87 86 87 85 76 81 Suredndranagar 81 94 73 87 74 81 Vadodra 90 72 81 89 66 78 Valsad 93 80 87 78 75 76 GUJARAT 93 74 84 94 78 86
Source: Calculated using data from the Directorate of Primary education.

318
This table highlights the status of education in Gujarat in respect
of gross enrolment rate in elementary schools by district covering the
period of 1996 and 2000. The table demonstrates the following facts:
(A) Gross enrolment rate in aggregate has improved during the period
specified by little 2 points. This however tends to have changed
by 4 points in case of girls and only 1 point in case of boys. In
year 1996 a districts out of 25 had average rate more than the state
rate while in remaining 18 districts this at rate was found less than
that of state average. In the year 2000 14 districts out of 25
showed enrolment rate more than the state rate. Highest gross
enrolment rate in elementary education by districts was found in
Dangs in 1996 (119) and lowest was found in Banaskantha (72).
Incidentally booth the districts are backward districts. In the year
2000 this rate was found maximum in Bharuch (158) while this
was found minimum in Porbandar (71).
(B) This rate is found falling 5 of major districts of Saurashtra region.
All the backward districts of the state however shows significant
positive change in respect of gross enrolment rate in elementary
school. In case of girls this enrolment rate is found have positive
change in 13 districts out of 25 districts.

319
TABLE – 4.65 RECENT DROP-OUT RATES OVER TIME, GUJARAT
Drop-out (%) I-V Drop-out (%) I-VII Year
Boys Girls Total Boys Girls Total 1990-91 44.63 53.41 49.02 63.86 66.60 64.48 1991-92 43.67 52.67 48.17 60.58 65.63 63.11 1992-93 41.74 50.19 45.97 58.17 64.29 61.23 1993-94 40.38 49.84 44.63 56.91 67.84 62.38 1994-95 34.94 41.10 37.71 51.17 55.52 53.11 1995-96 33.45 40.01 36.93 49.19 53.80 51.25 1996-97 32.72 39.74 35.40 48.19 51.17 49.49 1997-98 32.26 38.95 35.21 47.12 50.18 48.43 1998-99 29.28 27.56 28.96 46.91 49.74 48.18 1999-00 23.77 20.83 22.30 42.76 39.90 41.48 2000-01 21.05 19.12 20.81 40.53 36.90 38.92
Source: Calculated using data from the Directorate of Primary education.
This table holds crucial significance. As long as education is
concerned in respect of employment and growth problem of dropout
rates is considered a matter of serious concerns. It is believed that
because of poverty and lack of assurance for job in future - parents
prefer to have the children more in work than in schools. The other
institutional factors also hold much significance for drop out rates in
schools, precisely in a developing economy like India. An attempt is
made here to examine the recent trends of drop out rate over time for
Std. I to IV and for Std. I to VII.
Following is the trend revealed from the table :
(A) In total dropout rates there has been fall of 28.21 in a decade from
1990-91 to 2000-01 for Std. I to IV.
(B) Drop out rate for Std. I to IV is found more in case of girls than
boys though the gap in the drop out rates is found to have

320
narrowed over the period of time. In the year 1990-91 drop out
rate amongst boys was 44.03 and amongst girls this was 53.41 - a
gap of 8.78 percent point. This is found to have reduced over the
time and shows 21.05 in boys and in girls 19.12. It is therefore
found that from 1998-99 dropout rates in percentage amongst
boys is found more than the girls.
(C) For Std. I to VII drop out rates in total has reduced from 64.48 in
1990-91 to 38.92 in the year 2000-01 - a change of 25.56 percent
point. Amongst boys this has reduced from 62.86 to 40.53 i.e. fall
of 22.33 and amongst girls it has declined from 66.60 in 1990-91
to 36.90 percent in 2000-01 - suggesting a reduction of 29.70
percent point. This proves that drop out rate tends to have reduced
more amongst girls in comparison with boys over the time.
As presented in the table in the year 1990-91 for Std. I to VII drop
out rates in percentage was more in girls 66.60 than in boys 62.86. This
showed a gap of 3.74 percentage point between the two sex. This tend to
have fallen continuously and reverse is the trend found in 2000-01, the
year in which drop out rates of girls in percentage was 36.90 and for
boys 40.53 showing more drop out rate in boys than girls.

321
TABLE – 4.66 EXPENDITURE ON EDUCATION (CURRENT PRICES)
Total expenditure on education (Rs. Crore) S. No. Year
Revenue Capital Total 1 1991-92 1,068.06 10.35 1,145.45 2 1992-93 1,131.84 13.61 1,378.65 3 1993-94 1,369.20 9.45 1,571.74 4 1994-95 1,560.97 10.77 1,886.96 5 1995-96 1,871.17 15.79 2,061.03 6 1996-97 2,049.90 11.13 2,303.55 7 1997-98 2,289.64 13.91 3,141.15 8 1998-99 3,124.63 16.52 3,412.01 9 1999-00 3,392.95 19.06 3,684.77 10 2000-01 3,672.36 12.41 3,263.55 11 2001-02 3,258.15 5.40 0
Source : Based on Annual budgets from Directorate of Economics and Statistics
This table provides the trends for expenditure on education by
Gujarat State. The first part of the table clears with total expenditure of
the state on education. It reveals the following trends.
(A) In the year 1991-92 the total expenditure on education was Rs.
1,145.45 Crore. From this total expenditure revenue expenditure
on education in percentage was 93.24 while this increased in
numbers to Rs. 2,049.90 for revenue, which was 88.95 percentage
to the total of Rs. 2,303.55 in the year 1996-97. In 2001-02 total
expenditure was of Rs. 3,263.55 Crore while revenue expenditure
on education was Rs. 3,672.36. The table also reveals the fact that
year over the year change in capital expenditure on education is
not found increased in proportion to the increase in revenue
expenditure. It is on the contrary found declined in the year 2000-
2001 and 2001-2002.

322
TABLE – 4.66 (A) EXPENDITURE ON EDUCATION (CURRENT PRICES)
Total expenditure on education (Rs. Crore) S. No. Year Revenue Capital Total
1 1991-92 1,134.06 10.99 1,145.05 2 1992-93 1,164.00 14.00 1,178.00 3 1993-94 1,372.77 9.47 1,382.82 4 1994-95 1,535.93 10.59 1,546.52 5 1995-96 1,906.83 16.09 1,922.92 6 1996-97 2,088.33 11.33 2,099.66 7 1997-98 2,291.93 13.92 2,305.85 8 1998-99 3,228.92 17.07 2,246.00 9 1999-00 3,299.57 18.54 3,308.11 10 2000-01 3,519.61 11.89 3,531.50
Table 4.66(A) throws right on per student expenditure on
education. Examining this table it is observed that per student total
expenditure on education has increased from Rs. 1145.05 in the year
1991-92 to Rs. 3531.50 Crore, indicating an increase of Rs. 2386.45 in
percentage it has increased by 208.37 percentage. This per student
expenditure when examined in revenue and capital expenditure
perspective - it is further found that proportion of per student revenue
expenditure on education was Rs. 1,134.06 in the year 1991-92 which
was 99.03 percentage to total per student expenditure. This ratio in
percentage to total was found of 99.44 percentage in 1996-97 and in
2000-01 it was found to the tune of 99.65 percentage.
It is also revealed that per student capital expenditure on
education tends to have more fluctuations over the time. This was found
maximum in 1999-2000 of 28.54 followed by 17.07 in 1998-99. While
it was found minimum of 9.47 in the year 1993-94 and in the year 1994-
95 this was again very low at 10.69.
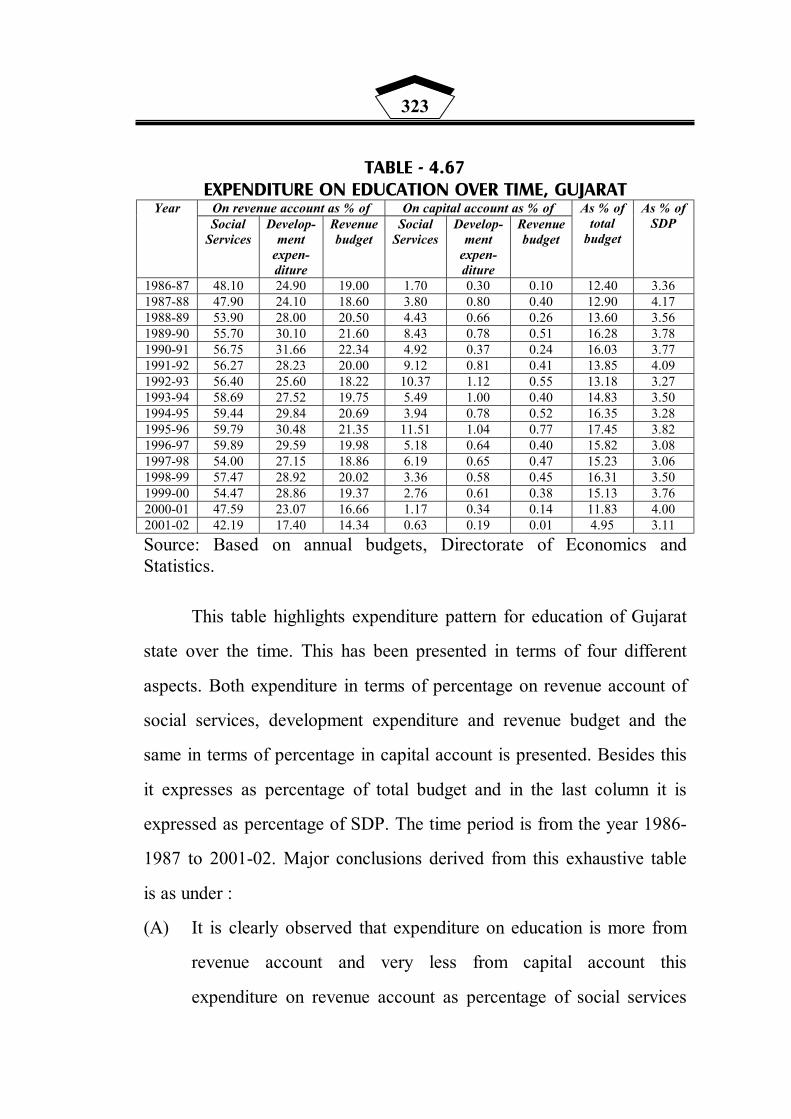
323
TABLE - 4.67 EXPENDITURE ON EDUCATION OVER TIME, GUJARAT
On revenue account as % of On capital account as % of Year Social
Services Develop-
ment expen-diture
Revenue budget
Social Services
Develop-ment
expen-diture
Revenue budget
As % of total
budget
As % of SDP
1986-87 48.10 24.90 19.00 1.70 0.30 0.10 12.40 3.36 1987-88 47.90 24.10 18.60 3.80 0.80 0.40 12.90 4.17 1988-89 53.90 28.00 20.50 4.43 0.66 0.26 13.60 3.56 1989-90 55.70 30.10 21.60 8.43 0.78 0.51 16.28 3.78 1990-91 56.75 31.66 22.34 4.92 0.37 0.24 16.03 3.77 1991-92 56.27 28.23 20.00 9.12 0.81 0.41 13.85 4.09 1992-93 56.40 25.60 18.22 10.37 1.12 0.55 13.18 3.27 1993-94 58.69 27.52 19.75 5.49 1.00 0.40 14.83 3.50 1994-95 59.44 29.84 20.69 3.94 0.78 0.52 16.35 3.28 1995-96 59.79 30.48 21.35 11.51 1.04 0.77 17.45 3.82 1996-97 59.89 29.59 19.98 5.18 0.64 0.40 15.82 3.08 1997-98 54.00 27.15 18.86 6.19 0.65 0.47 15.23 3.06 1998-99 57.47 28.92 20.02 3.36 0.58 0.45 16.31 3.50 1999-00 54.47 28.86 19.37 2.76 0.61 0.38 15.13 3.76 2000-01 47.59 23.07 16.66 1.17 0.34 0.14 11.83 4.00 2001-02 42.19 17.40 14.34 0.63 0.19 0.01 4.95 3.11 Source: Based on annual budgets, Directorate of Economics and Statistics.
This table highlights expenditure pattern for education of Gujarat
state over the time. This has been presented in terms of four different
aspects. Both expenditure in terms of percentage on revenue account of
social services, development expenditure and revenue budget and the
same in terms of percentage in capital account is presented. Besides this
it expresses as percentage of total budget and in the last column it is
expressed as percentage of SDP. The time period is from the year 1986-
1987 to 2001-02. Major conclusions derived from this exhaustive table
is as under :
(A) It is clearly observed that expenditure on education is more from
revenue account and very less from capital account this
expenditure on revenue account as percentage of social services
324
shows increase over the time from year 1986-87 to 1990-91.
There after for two successive years it has declined while from
1993-94 to 1996-97 it is found increased again and from 1998-99
this shows constant decline. From the decadal point of view
revenue expenditure on education as percentage of social service
was 48.10 percentage in 1986-87 which went up to 59.89
(increase of 11.79 percentage point) - considering decades reform
this was 56.27 in 1991-92 which declined to 42.19 in 2001-02
showing fall of 14.08 percentage point.
Similar is the trend observed in respect of revenue expenditure on
education as percentage of development expenditure. This shows ups
and downs over the period of time. Though the fluctuation in degree
varies over the time in comparison with social services. Considering
decadal growth from 1986-87 it seems to have an increase of 4.69
percentage point i.e. 24.90% in 1991-92 to 29.59% in 1996-97. But post
reform decade if examined shows again the fall of 10.83 percent point
from 1991-92 to 2001-02 considering this proportion as percentage of
revenue budget also leads to the same pattern of trend that is observed
during the period of time. The period between 1986-87 to 1996-97
suggests an increase of 0.89 percentage point but the decadal change
under reform period reflects - 5.66 percentage point change.
It is clearly found that as long as expenditure on education from
capital account is concerned it is insignificant to highlight the major.
This much less trend itself is a period of concern.
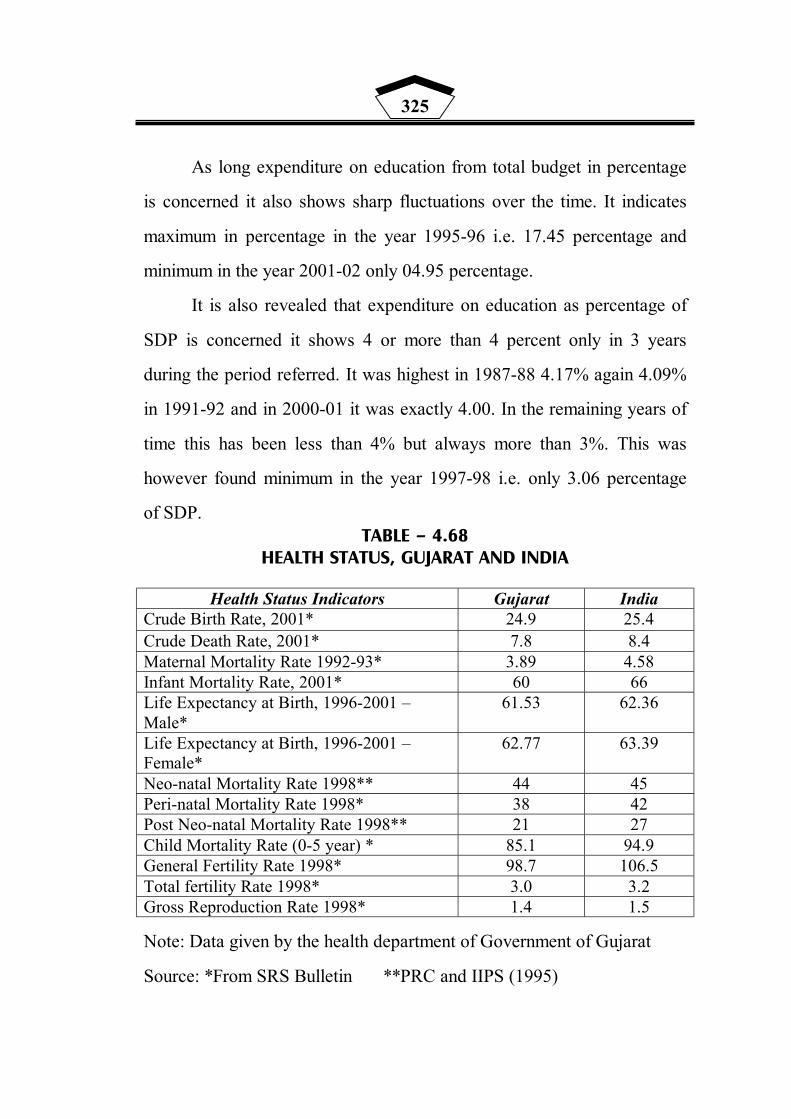
325
As long expenditure on education from total budget in percentage
is concerned it also shows sharp fluctuations over the time. It indicates
maximum in percentage in the year 1995-96 i.e. 17.45 percentage and
minimum in the year 2001-02 only 04.95 percentage.
It is also revealed that expenditure on education as percentage of
SDP is concerned it shows 4 or more than 4 percent only in 3 years
during the period referred. It was highest in 1987-88 4.17% again 4.09%
in 1991-92 and in 2000-01 it was exactly 4.00. In the remaining years of
time this has been less than 4% but always more than 3%. This was
however found minimum in the year 1997-98 i.e. only 3.06 percentage
of SDP. TABLE – 4.68
HEALTH STATUS, GUJARAT AND INDIA
Health Status Indicators Gujarat India Crude Birth Rate, 2001* 24.9 25.4 Crude Death Rate, 2001* 7.8 8.4 Maternal Mortality Rate 1992-93* 3.89 4.58 Infant Mortality Rate, 2001* 60 66 Life Expectancy at Birth, 1996-2001 – Male*
61.53 62.36
Life Expectancy at Birth, 1996-2001 – Female*
62.77 63.39
Neo-natal Mortality Rate 1998** 44 45 Peri-natal Mortality Rate 1998* 38 42 Post Neo-natal Mortality Rate 1998** 21 27 Child Mortality Rate (0-5 year) * 85.1 94.9 General Fertility Rate 1998* 98.7 106.5 Total fertility Rate 1998* 3.0 3.2 Gross Reproduction Rate 1998* 1.4 1.5
Note: Data given by the health department of Government of Gujarat
Source: *From SRS Bulletin **PRC and IIPS (1995)
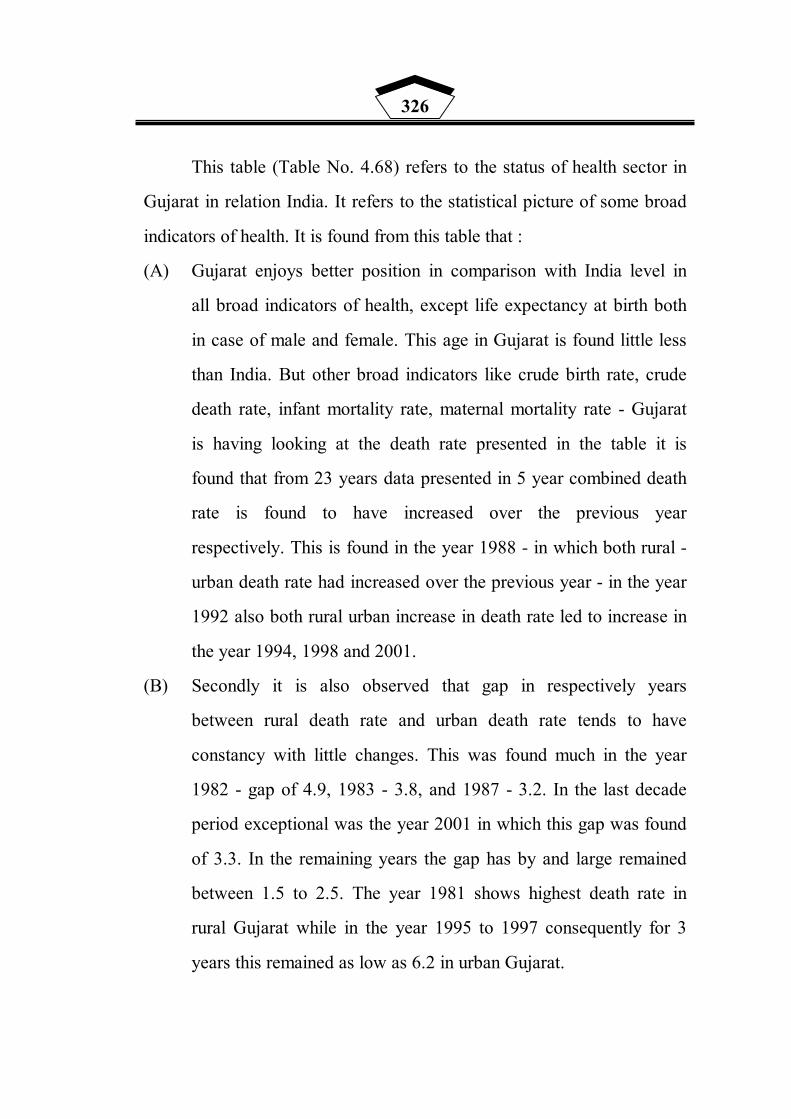
326
This table (Table No. 4.68) refers to the status of health sector in
Gujarat in relation India. It refers to the statistical picture of some broad
indicators of health. It is found from this table that :
(A) Gujarat enjoys better position in comparison with India level in
all broad indicators of health, except life expectancy at birth both
in case of male and female. This age in Gujarat is found little less
than India. But other broad indicators like crude birth rate, crude
death rate, infant mortality rate, maternal mortality rate - Gujarat
is having looking at the death rate presented in the table it is
found that from 23 years data presented in 5 year combined death
rate is found to have increased over the previous year
respectively. This is found in the year 1988 - in which both rural -
urban death rate had increased over the previous year - in the year
1992 also both rural urban increase in death rate led to increase in
the year 1994, 1998 and 2001.
(B) Secondly it is also observed that gap in respectively years
between rural death rate and urban death rate tends to have
constancy with little changes. This was found much in the year
1982 - gap of 4.9, 1983 - 3.8, and 1987 - 3.2. In the last decade
period exceptional was the year 2001 in which this gap was found
of 3.3. In the remaining years the gap has by and large remained
between 1.5 to 2.5. The year 1981 shows highest death rate in
rural Gujarat while in the year 1995 to 1997 consequently for 3
years this remained as low as 6.2 in urban Gujarat.
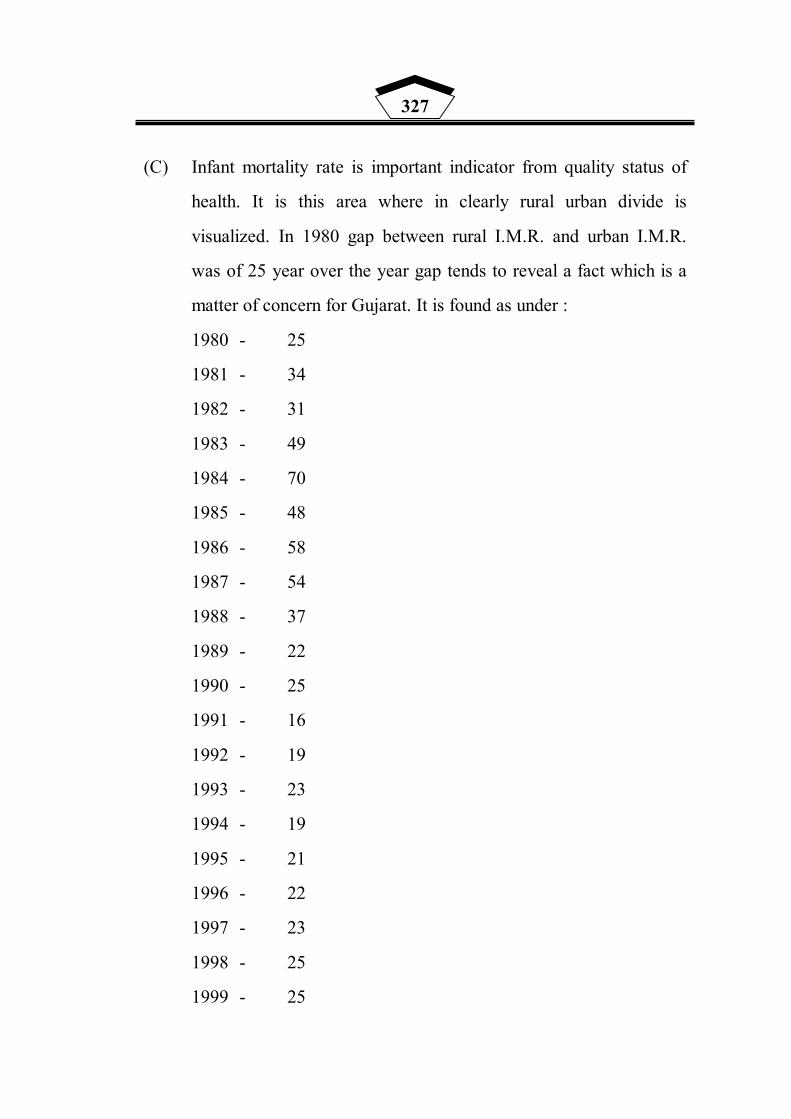
327
(C) Infant mortality rate is important indicator from quality status of
health. It is this area where in clearly rural urban divide is
visualized. In 1980 gap between rural I.M.R. and urban I.M.R.
was of 25 year over the year gap tends to reveal a fact which is a
matter of concern for Gujarat. It is found as under :
1980 - 25
1981 - 34
1982 - 31
1983 - 49
1984 - 70
1985 - 48
1986 - 58
1987 - 54
1988 - 37
1989 - 22
1990 - 25
1991 - 16
1992 - 19
1993 - 23
1994 - 19
1995 - 21
1996 - 22
1997 - 23
1998 - 25
1999 - 25

328
2000 - 24
2001 - 26
2002 - 31
2003 - 29
This shows clearly that in the 1980's this gap was found more in
comparison with the gap that is found in 1990's. In the 1980's the gap
tends to show wide fluctuations where as in the 1990's fluctuations are
also of less degree.
It is also reflected from the table that I.M.R. in rural and urban
Gujarat tends to show fluctuations more in respect of the time period.
From amongst 23 years of data increase in I.M.R. in rural Gujarat is
found in different 7 years, in 13 years it is found declined and 3 years
constant better position than all India.

329
TABLE - 4.69 BIRTH RATE, DEATH RATE AND INFANT MORTALITY RATE -
GUJARAT
330
Table No. 4.69 provides detailed picture of Birth Rate, Death Rate
and Infant Mortality Rate in Gujarat. It reveals the status of Gujarat by
residence i.e. both rural and urban Gujarat. It covers exhaustive data
respect of time period beginning from the year 1980 to 2003. The table
reveals the following picture.
(A) As long as birth rate is concerned it is observed that the gap
between rural and urban Gujarat has by and large remained
stagnant. Fluctuations are found but with little change. In 1980
this gap was of 5.5, which in the year 1990 was found of 2.3, in
the year 2000 there was the gap of 4.9 and the last data of 2003
shows the gap of 6.00. It is thus proved that under the 1990's this
gap is found more in comparison with what it was in 1980's.
Secondly rural Gujarat shows continuous fall but of lower rate in
the birth rate. However in the year 1990, 1992 and 1997 birth rate
in rural Gujarat tends to have slight increase over the previous
years respectively. While birth rate trend in urban Gujarat shows
more fluctuations in comparison with rural Gujarat. Out of 23
years data in 18 years birth rate shows falling trend but in 5 years
it shows increasing trend in comparison with the previous year.
Data on combined birth rate in Gujarat significantly suggests very
little increase only in 2 years out of 23 years and in the remaining
period of time though very little marginal this shows declining
trend.
In urban Gujarat I.M.R. over the previous year is found to have
increased in 5 years while declining trend is found 14 years while it has
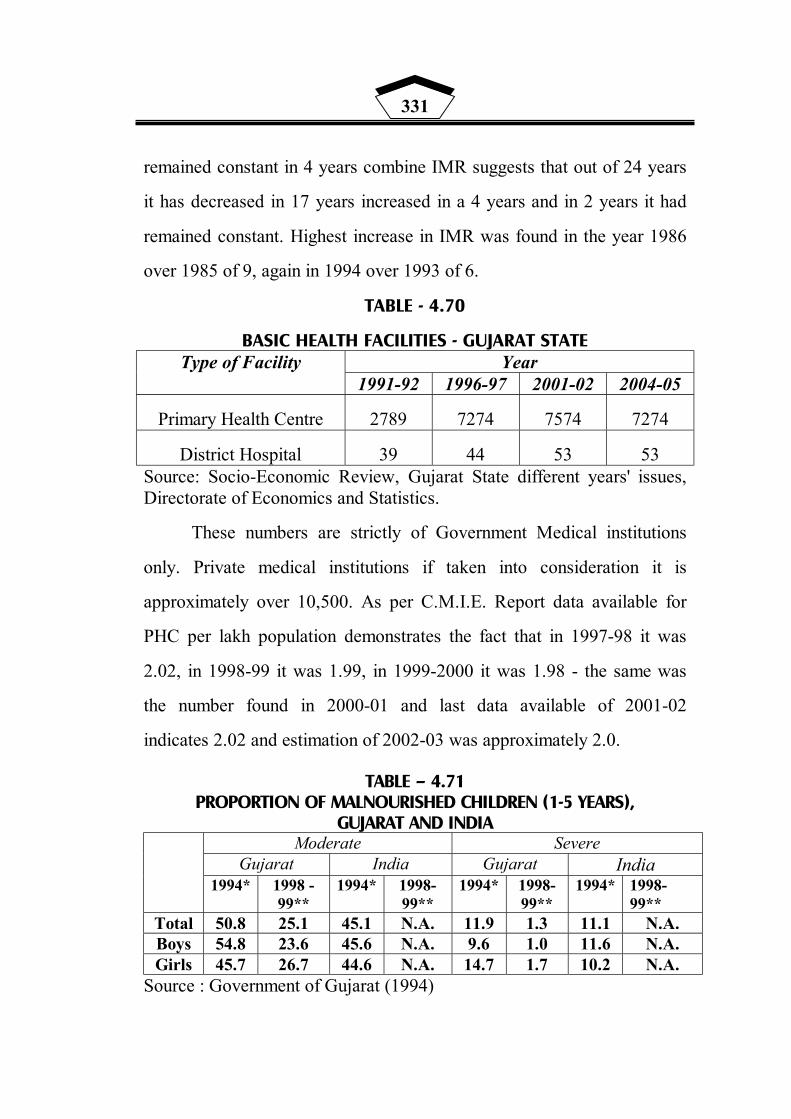
331
remained constant in 4 years combine IMR suggests that out of 24 years
it has decreased in 17 years increased in a 4 years and in 2 years it had
remained constant. Highest increase in IMR was found in the year 1986
over 1985 of 9, again in 1994 over 1993 of 6.
TABLE - 4.70
BASIC HEALTH FACILITIES - GUJARAT STATE Year Type of Facility
1991-92 1996-97 2001-02 2004-05
Primary Health Centre 2789 7274 7574 7274
District Hospital 39 44 53 53 Source: Socio-Economic Review, Gujarat State different years' issues, Directorate of Economics and Statistics.
These numbers are strictly of Government Medical institutions
only. Private medical institutions if taken into consideration it is
approximately over 10,500. As per C.M.I.E. Report data available for
PHC per lakh population demonstrates the fact that in 1997-98 it was
2.02, in 1998-99 it was 1.99, in 1999-2000 it was 1.98 - the same was
the number found in 2000-01 and last data available of 2001-02
indicates 2.02 and estimation of 2002-03 was approximately 2.0.
TABLE – 4.71 PROPORTION OF MALNOURISHED CHILDREN (1-5 YEARS),
GUJARAT AND INDIA Moderate Severe
Gujarat India Gujarat India
1994* 1998 -99**
1994* 1998-99**
1994* 1998-99**
1994* 1998-99**
Total 50.8 25.1 45.1 N.A. 11.9 1.3 11.1 N.A. Boys 54.8 23.6 45.6 N.A. 9.6 1.0 11.6 N.A. Girls 45.7 26.7 44.6 N.A. 14.7 1.7 10.2 N.A.
Source : Government of Gujarat (1994)
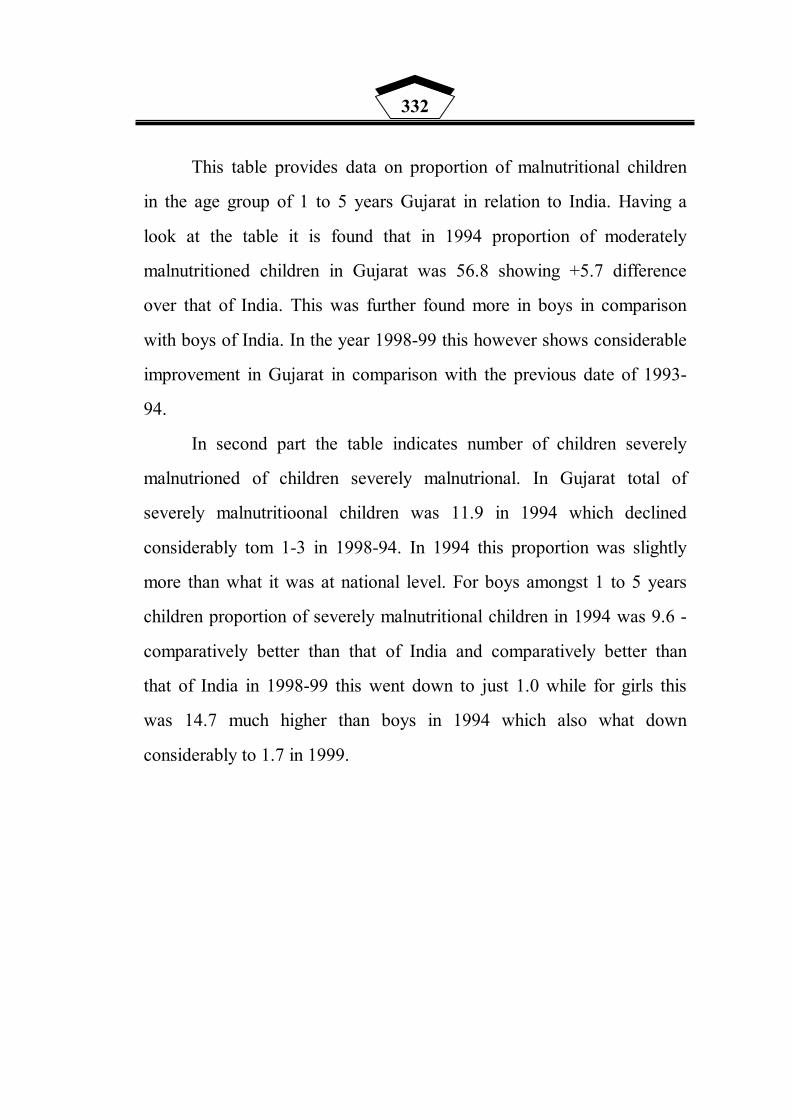
332
This table provides data on proportion of malnutritional children
in the age group of 1 to 5 years Gujarat in relation to India. Having a
look at the table it is found that in 1994 proportion of moderately
malnutritioned children in Gujarat was 56.8 showing +5.7 difference
over that of India. This was further found more in boys in comparison
with boys of India. In the year 1998-99 this however shows considerable
improvement in Gujarat in comparison with the previous date of 1993-
94.
In second part the table indicates number of children severely
malnutrioned of children severely malnutrional. In Gujarat total of
severely malnutritioonal children was 11.9 in 1994 which declined
considerably tom 1-3 in 1998-94. In 1994 this proportion was slightly
more than what it was at national level. For boys amongst 1 to 5 years
children proportion of severely malnutritional children in 1994 was 9.6 -
comparatively better than that of India and comparatively better than
that of India in 1998-99 this went down to just 1.0 while for girls this
was 14.7 much higher than boys in 1994 which also what down
considerably to 1.7 in 1999.
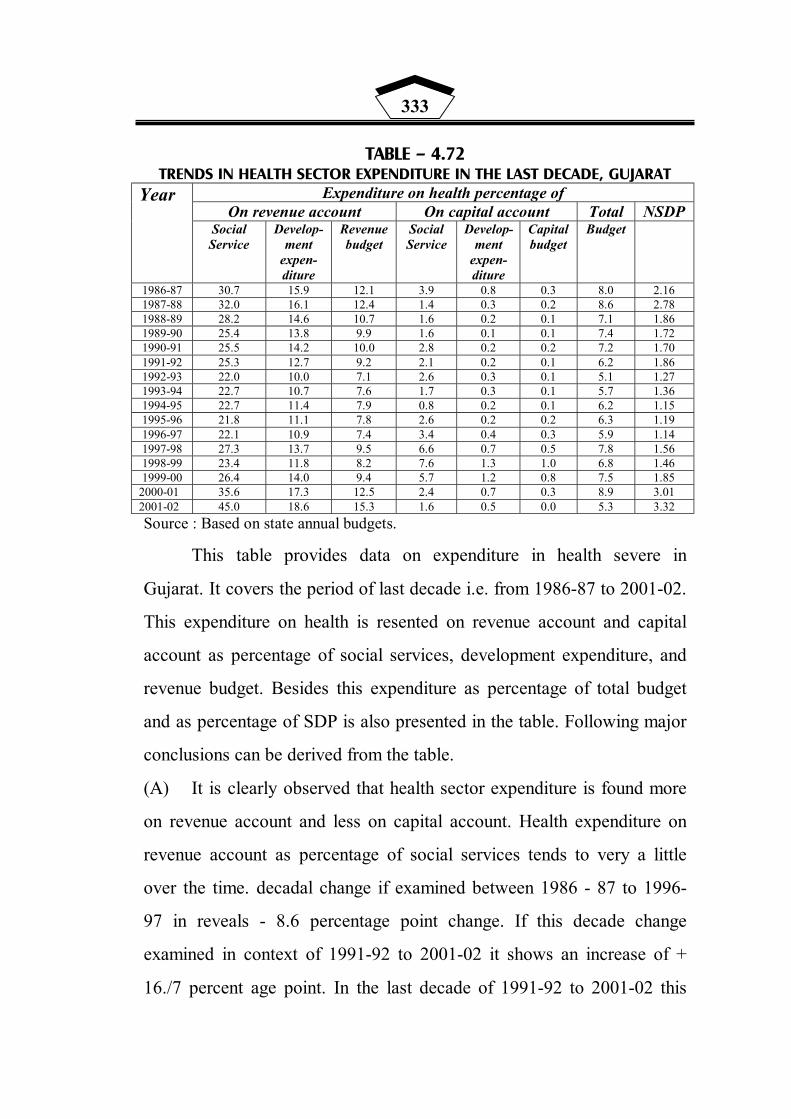
333
TABLE – 4.72 TRENDS IN HEALTH SECTOR EXPENDITURE IN THE LAST DECADE, GUJARAT
Expenditure on health percentage of On revenue account On capital account Total NSDP
Year
Social Service
Develop-ment
expen-diture
Revenue budget
Social Service
Develop-ment
expen-diture
Capital budget
Budget
1986-87 30.7 15.9 12.1 3.9 0.8 0.3 8.0 2.16 1987-88 32.0 16.1 12.4 1.4 0.3 0.2 8.6 2.78 1988-89 28.2 14.6 10.7 1.6 0.2 0.1 7.1 1.86 1989-90 25.4 13.8 9.9 1.6 0.1 0.1 7.4 1.72 1990-91 25.5 14.2 10.0 2.8 0.2 0.2 7.2 1.70 1991-92 25.3 12.7 9.2 2.1 0.2 0.1 6.2 1.86 1992-93 22.0 10.0 7.1 2.6 0.3 0.1 5.1 1.27 1993-94 22.7 10.7 7.6 1.7 0.3 0.1 5.7 1.36 1994-95 22.7 11.4 7.9 0.8 0.2 0.1 6.2 1.15 1995-96 21.8 11.1 7.8 2.6 0.2 0.2 6.3 1.19 1996-97 22.1 10.9 7.4 3.4 0.4 0.3 5.9 1.14 1997-98 27.3 13.7 9.5 6.6 0.7 0.5 7.8 1.56 1998-99 23.4 11.8 8.2 7.6 1.3 1.0 6.8 1.46 1999-00 26.4 14.0 9.4 5.7 1.2 0.8 7.5 1.85
2000-01 35.6 17.3 12.5 2.4 0.7 0.3 8.9 3.01 2001-02 45.0 18.6 15.3 1.6 0.5 0.0 5.3 3.32 Source : Based on state annual budgets.
This table provides data on expenditure in health severe in
Gujarat. It covers the period of last decade i.e. from 1986-87 to 2001-02.
This expenditure on health is resented on revenue account and capital
account as percentage of social services, development expenditure, and
revenue budget. Besides this expenditure as percentage of total budget
and as percentage of SDP is also presented in the table. Following major
conclusions can be derived from the table.
(A) It is clearly observed that health sector expenditure is found more
on revenue account and less on capital account. Health expenditure on
revenue account as percentage of social services tends to very a little
over the time. decadal change if examined between 1986 - 87 to 1996-
97 in reveals - 8.6 percentage point change. If this decade change
examined in context of 1991-92 to 2001-02 it shows an increase of +
16./7 percent age point. In the last decade of 1991-92 to 2001-02 this
334
tends to fluctuate unevenly over the period of time. From amongst 16
years data it is found minimum in percentage in the year 1995-96 21.8
and maximum in percentage in the year 2001-02m - 45.0 percentage.
Health expenditure on revenue account as percentage of
Development expenditure suggests sharp fluctuations over the period of
time out of 13 years in 7 years it shows decline in percentage over the
previous year. It is found maximum in the year 2001-02 - i.e. 18.6 while
this is found minimum in 1992-93 i.e. 10.0 percent. Decadal change in
context of 1991-92 this is found of +5.9 percentage change in 2001-02.
Expenditure on Revenue account as percentage of revenue budget
also express by and large similar trends observed in case of social
services and development expenditure.
(B) As mentioned earlier, health expenditure on capital account does
not have any significance in the total expenditure. Capital
expenditure for health as percentage of social services only has
little role to play.
(C) Expenditure on health as percentage of total budget shows
fluctuations over the period of time. This percentage is found
minimum in the year of 2001-02 in comparison with the data of
previous years of the decade. However this expenditure as
percentage of NSDP is found to have increased in the last 2 years.
In the decade of 19902 from 1991-92 to 1999-2000 it tends to be
in between 1.86 to 1.15. It is only in the year 2000-01 that it went
upto 3.01 and in 2001-02 it further went up by 3.32 as percentage
of NSDP.

335
TABLE - 4.73 EXPENDITURE ON HEALTH (CURRENT PRICES)
Total health n education (Rs. crore) S. No. Year
Revenue Capital Total 1 1991-92 461.36 2.39 483.75 2 1992-93 441.59 3.40 445.05 3 1993-94 530.28 2.99 533.27 4 1994-95 595.18 2.23 597.41 5 1995-96 682.83 3.59 686.42 6 1996-97 755.16 7.33 762.49 7 1997-98 1,158.48 14.93 1,173.41 8 1998-99 1,274.73 37.36 1,312.11 9 1999-00 1,643.57 39.26 1,682.83
10 2000-01 2,748.11 25.64 2,773.75 11 2001-02 3,472.99 13.78 3,486.77
This highlights expenditure on health at current prices covering
the period of 19091-92 to 2001-02. The table highlights the fact that
health sector like other sectors of economy and or like other state is not
an exception as long as pattern of expenditure is concerned. it is in
confirming to national trends and or with other developed states -
maximum expenditure tends place on revenue account and in the total
sectoral expenditure capital expenditure for health also holds
insignificant portion. In the year 1991-92 revenue expenditure to total
expenditure in percentage was 99.43 percentage, which was 99.02
percentage in 1996-97 and in 2001-02 percentage was 49.57.
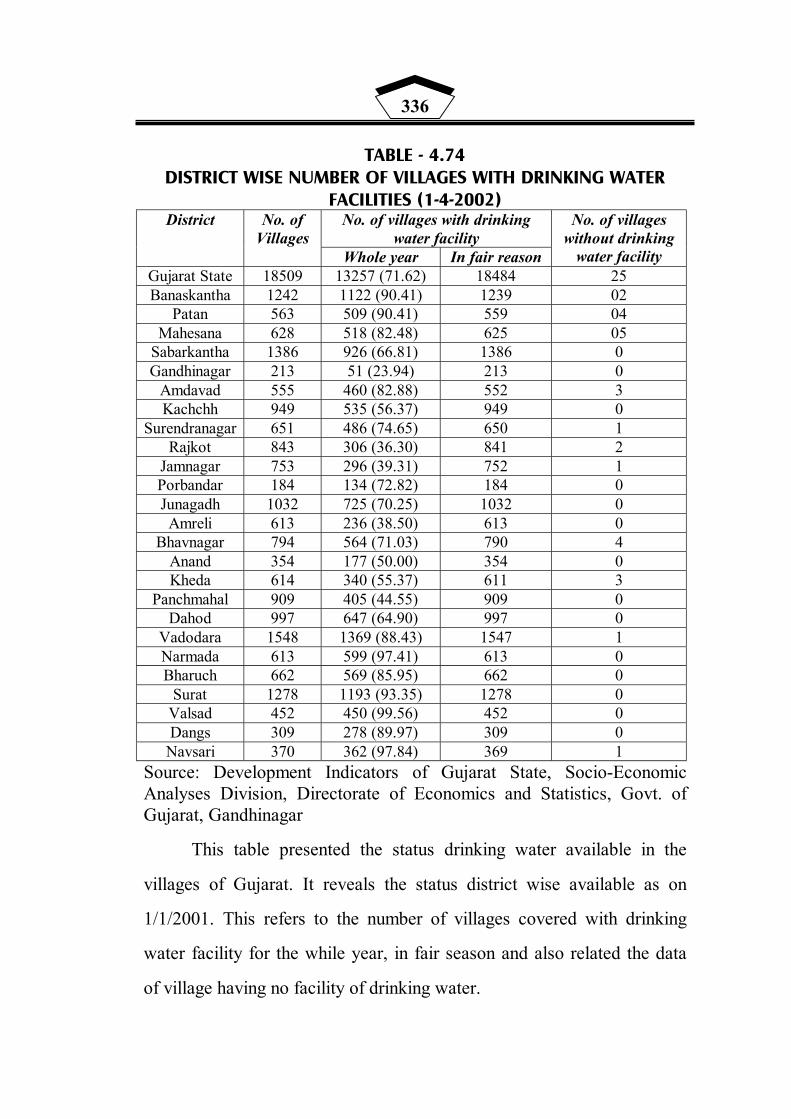
336
TABLE - 4.74 DISTRICT WISE NUMBER OF VILLAGES WITH DRINKING WATER
FACILITIES (1-4-2002) No. of villages with drinking
water facility District No. of
Villages Whole year In fair reason
No. of villages without drinking
water facility Gujarat State 18509 13257 (71.62) 18484 25 Banaskantha 1242 1122 (90.41) 1239 02
Patan 563 509 (90.41) 559 04 Mahesana 628 518 (82.48) 625 05
Sabarkantha 1386 926 (66.81) 1386 0 Gandhinagar 213 51 (23.94) 213 0
Amdavad 555 460 (82.88) 552 3 Kachchh 949 535 (56.37) 949 0
Surendranagar 651 486 (74.65) 650 1 Rajkot 843 306 (36.30) 841 2
Jamnagar 753 296 (39.31) 752 1 Porbandar 184 134 (72.82) 184 0 Junagadh 1032 725 (70.25) 1032 0 Amreli 613 236 (38.50) 613 0
Bhavnagar 794 564 (71.03) 790 4 Anand 354 177 (50.00) 354 0 Kheda 614 340 (55.37) 611 3
Panchmahal 909 405 (44.55) 909 0 Dahod 997 647 (64.90) 997 0
Vadodara 1548 1369 (88.43) 1547 1 Narmada 613 599 (97.41) 613 0 Bharuch 662 569 (85.95) 662 0
Surat 1278 1193 (93.35) 1278 0 Valsad 452 450 (99.56) 452 0 Dangs 309 278 (89.97) 309 0
Navsari 370 362 (97.84) 369 1 Source: Development Indicators of Gujarat State, Socio-Economic Analyses Division, Directorate of Economics and Statistics, Govt. of Gujarat, Gandhinagar
This table presented the status drinking water available in the
villages of Gujarat. It reveals the status district wise available as on
1/1/2001. This refers to the number of villages covered with drinking
water facility for the while year, in fair season and also related the data
of village having no facility of drinking water.

337
It is revealed from the table that by and large there is considerable
fair status of the villages of the status state in respect of drinking water
facilities. But it is important to note that all villages of each and every
district is not facilitated with water supply for the whole year.
Percentage in brackets show that districts in like Gandhinagar, Rajkot,
Jamnagar are deprived with whole year drinking water supply in more
than 60 percent of villages. Most of the villages in the districts of South
Gujarat and North Gujarat except Gandhinagar have drinking water
facility for the whole year. TABLE - 4.75
PERCENTAGE OF VILLAGES HAVING WATER FACILITY BY SOURCES District Tap Water Hand Pump Tube Well
Banaskantha 69.59 5.64 9.66 Patan 81.56 0.79 6.98 Mahesana 87.09 0.97 6.12 Sabarkantha 59.34 20.84 3.00 Gandhinagar 68.64 1.76 6.61 Amdavad 62.55 4.47 7.40 Kachchh 77.58 1.37 3.50 Surendranagar 52.81 10.23 5.38 Rajkot 61.99 16.70 4.71 Jamnagar 55.74 17.88 3.22 Porbandar 52.15 13.68 2.58 Junagadh 58.22 18.41 3.98 Amreli 46.60 27.10 6.89 Bhavnagar 50.29 18.12 5.03 Anand 73.35 8.68 4.92 Kheda 62.00 13.94 7.90 Panchmahal 22.38 39.35 1.78 Dahod 10.98 47.36 1.02 Vadodara 68.96 21.55 2.48 Narmada 27.82 59.85 1.76 Bharuch 50.29 18.12 5.03 Surat 65.13 19.08 6.09 Valsad 26.01 44.71 5.27 Dangs 13.39 46.81 0.69 Navsari 47.83 26.38 4.66 Gujarat 62.31 16.65 5.13

338
This table (Table No. 4.75) highlights the percentage number of
villages having different source of water. The data presented in the table
reveal the status being found in the year 1999-2000. It is found from the
table that the Dangs, Panchmahal, Valsad, Dahod Narmada are the
districts where in villages having the facility of Tap water are found in
very less number. From amongst all the districts this number of villages
in percentage is found minimum in the Dangs, (10.39) from bottom to
followed are Dahod (10.98) Panchamahal (22-38), Valsad (26.1) and
Narmada (27.82) Maheshana shows highest number of villages in
percentage having water tap facility (87.09) followed by Patan (81.50)
Kachchchh (77.58) and Anand (73.25) Hand pump is found to be in
maximum number of villages in percentage in the districts like 47.30
Narmada 59.85. Dahod 47.30, Dangs 46.81 and Valsad 44.71
percentage. This is found to be minimum in the districts like Patan 0.79,
Maheshana 0.97, Kachchh 1.37 and Banas Kantha 5.64. While
maximum number of villages in percentage having tubewells are found
in Banaskantha 9.66%, Kheda 7.90 percentage Amdavad 7.40
percentage. This facility is available in only 0.69 percentage of villages
in The Dangs, 1.02 percent in Dahod 1.76 percent in Narmada district.
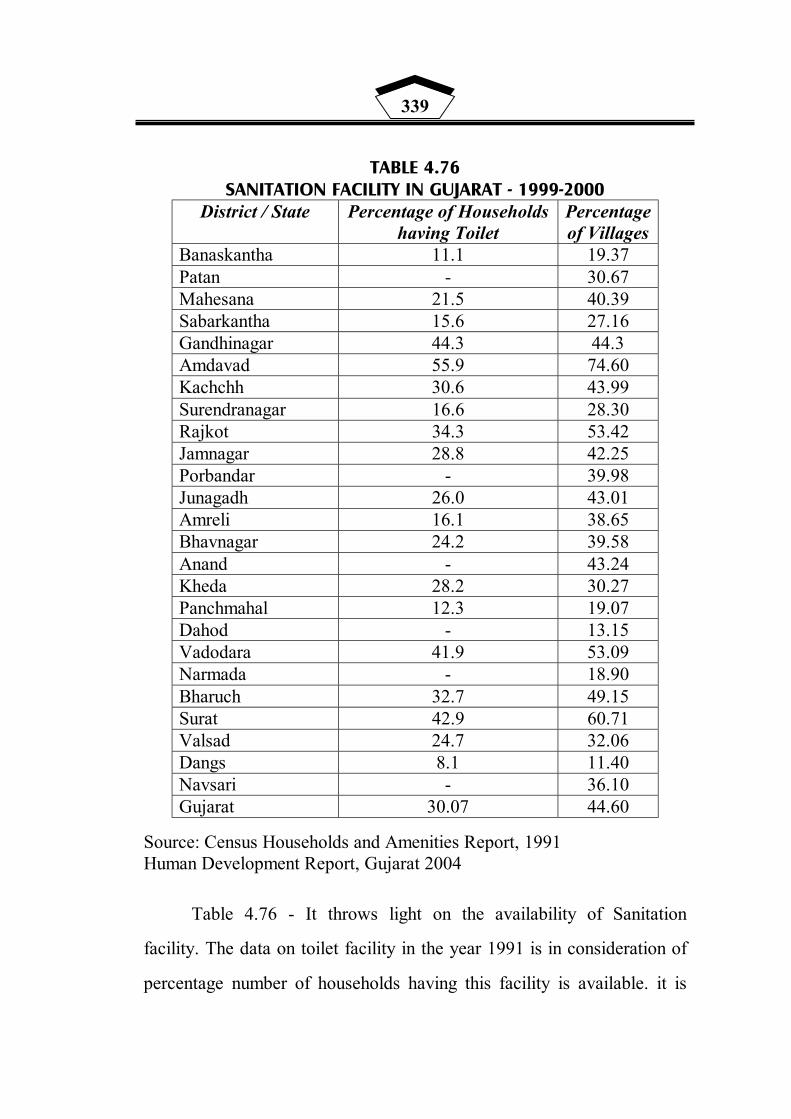
339
TABLE 4.76 SANITATION FACILITY IN GUJARAT - 1999-2000
District / State Percentage of Households having Toilet
Percentage of Villages
Banaskantha 11.1 19.37 Patan - 30.67 Mahesana 21.5 40.39 Sabarkantha 15.6 27.16 Gandhinagar 44.3 44.3 Amdavad 55.9 74.60 Kachchh 30.6 43.99 Surendranagar 16.6 28.30 Rajkot 34.3 53.42 Jamnagar 28.8 42.25 Porbandar - 39.98 Junagadh 26.0 43.01 Amreli 16.1 38.65 Bhavnagar 24.2 39.58 Anand - 43.24 Kheda 28.2 30.27 Panchmahal 12.3 19.07 Dahod - 13.15 Vadodara 41.9 53.09 Narmada - 18.90 Bharuch 32.7 49.15 Surat 42.9 60.71 Valsad 24.7 32.06 Dangs 8.1 11.40 Navsari - 36.10 Gujarat 30.07 44.60
Source: Census Households and Amenities Report, 1991 Human Development Report, Gujarat 2004
Table 4.76 - It throws light on the availability of Sanitation
facility. The data on toilet facility in the year 1991 is in consideration of
percentage number of households having this facility is available. it is
340
found from this table that. In Amdavad 55.9% of households had this
facility Gandhinagar district stood 2nd in this regard with 44.3 percent
and Surat was the third with 42.9 percent. The Dangs with 08.1
percentage of house holds remained at the bottom. The other districts
were having less number of households having this facility they were
Panchmal 12.3 Sabarkantha with 15.6 Amreli.
The data in the next column indicates percentage of villages
having this facility. This data is based on the reports of 1999-2000.
According to this column Poorest is the condition in the Dangs with
only 11.40 percentage of villages. The other districts lagging for behind
\in this respect are Dahiod 13.15 percentage, Narmada 18.90, Dah\id
19.7 and Banas Kantha 19.37%. It is important to note that all those
districts are dominated by scheduled Tribe population very sound s the
condition found in Amdavad with 74.60% of villages, Surat 60.71%,
Rajkot 53.42% and Vadodara 53.09% of villages. For the state in
aggregate 44.60% of villages are covered under toilet facility which
reveals paradoxical situation in which very high growth rate of
economy. Social sector provisioning seems to be lagging behind the
developed status. Out of 25 districts in the state 18 districts are found
such in which number of villages in percentage having toilets are found
less than percentage number of villages for aggregate economy. It is also
observed that in respect of toilet facilities rural urban divide is very high
in comparison with other variables.
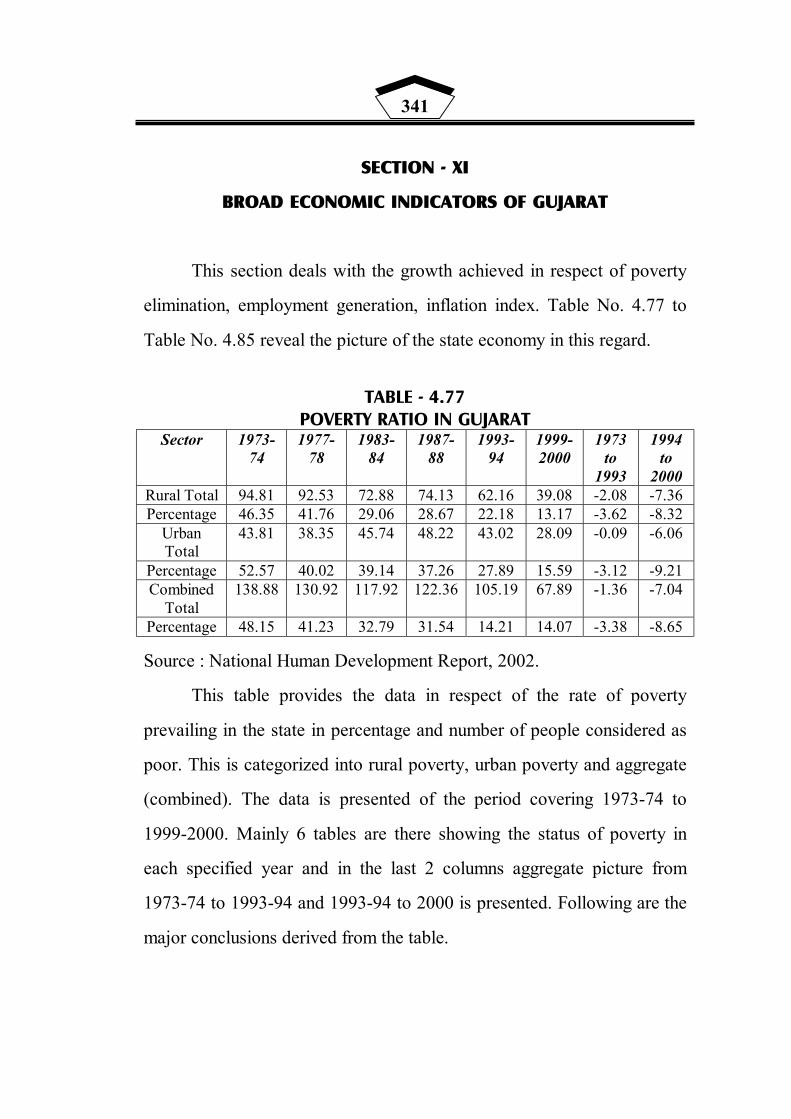
341
SECTION - XI
BROAD ECONOMIC INDICATORS OF GUJARAT
This section deals with the growth achieved in respect of poverty
elimination, employment generation, inflation index. Table No. 4.77 to
Table No. 4.85 reveal the picture of the state economy in this regard.
TABLE - 4.77
POVERTY RATIO IN GUJARAT Sector 1973-
74 1977-
78 1983-
84 1987-
88 1993-
94 1999-2000
1973 to
1993
1994 to
2000 Rural Total 94.81 92.53 72.88 74.13 62.16 39.08 -2.08 -7.36 Percentage 46.35 41.76 29.06 28.67 22.18 13.17 -3.62 -8.32
Urban Total
43.81 38.35 45.74 48.22 43.02 28.09 -0.09 -6.06
Percentage 52.57 40.02 39.14 37.26 27.89 15.59 -3.12 -9.21 Combined
Total 138.88 130.92 117.92 122.36 105.19 67.89 -1.36 -7.04
Percentage 48.15 41.23 32.79 31.54 14.21 14.07 -3.38 -8.65
Source : National Human Development Report, 2002.
This table provides the data in respect of the rate of poverty
prevailing in the state in percentage and number of people considered as
poor. This is categorized into rural poverty, urban poverty and aggregate
(combined). The data is presented of the period covering 1973-74 to
1999-2000. Mainly 6 tables are there showing the status of poverty in
each specified year and in the last 2 columns aggregate picture from
1973-74 to 1993-94 and 1993-94 to 2000 is presented. Following are the
major conclusions derived from the table.
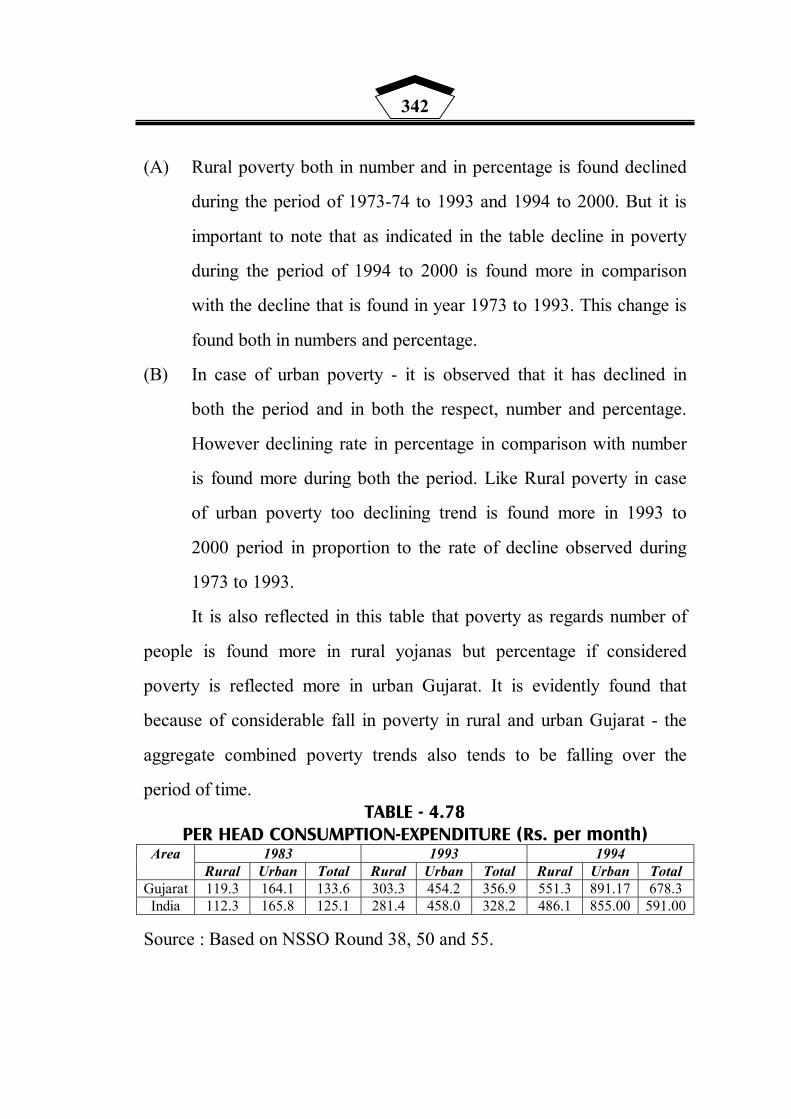
342
(A) Rural poverty both in number and in percentage is found declined
during the period of 1973-74 to 1993 and 1994 to 2000. But it is
important to note that as indicated in the table decline in poverty
during the period of 1994 to 2000 is found more in comparison
with the decline that is found in year 1973 to 1993. This change is
found both in numbers and percentage.
(B) In case of urban poverty - it is observed that it has declined in
both the period and in both the respect, number and percentage.
However declining rate in percentage in comparison with number
is found more during both the period. Like Rural poverty in case
of urban poverty too declining trend is found more in 1993 to
2000 period in proportion to the rate of decline observed during
1973 to 1993.
It is also reflected in this table that poverty as regards number of
people is found more in rural yojanas but percentage if considered
poverty is reflected more in urban Gujarat. It is evidently found that
because of considerable fall in poverty in rural and urban Gujarat - the
aggregate combined poverty trends also tends to be falling over the
period of time. TABLE - 4.78
PER HEAD CONSUMPTION-EXPENDITURE (Rs. per month) 1983 1993 1994 Area
Rural Urban Total Rural Urban Total Rural Urban Total Gujarat 119.3 164.1 133.6 303.3 454.2 356.9 551.3 891.17 678.3 India 112.3 165.8 125.1 281.4 458.0 328.2 486.1 855.00 591.00
Source : Based on NSSO Round 38, 50 and 55.
343
The real picture - better picture of poverty can be known more
precisely through the data on per-capita consumption in Rs. month. This
has been presented in this table based on NSS round results made
published of 38th round, 50th round and 55th round. This throws light on
the percentage number of population living with calories getting 90
percent less than the requirement in the regular diet. It is clearly
revealed from this table that in Rural Gujarat per-capita per month
consumption in Rs. in the year 1983 was Rs. 7 more than the rural
India's per capita consumption. In the same year this proportion in case
of Urban Gujarat was little less by Rs. 0.3 in comparison with urban
India. Again 1993-94 similar trend was observed in which per capita
consumption of Rural Gujarat was found little more than that was in
case of Rural India(+22.1). But in case of urban Gujarat it was again
found little less than RuralGujarat (+4). In 1999-2000 it is revealed from
the table that both in Rural Gujarat and Urban Gujarat per capita
consumption (in Rs. monthly) was found more than Urban Gujarat and
Urban India. In aggregate Rural Gujarat per capita consumption is found
to have an there are of Rs. 223.3 in 1993-94 over 1983 and of Rs. 321.4
in 1999-2000 in percentage it showed an increase of 166.91% and 89.94
percentage respectively.
This trend in respect of aggregate trend showed change of Rs.
203.1 (162.27%) and Rs. 162.8 (46.36%). If this consumption
expenditure in rural and urban Gujarat segregated into food and non
food expenditure it is further revealed that under the reform period
expenditure for food in Rural Gujarat exceeds over non food

344
expenditure but in case of urban Gujarat the trend reflects that under the
reform period per capita consumption for non food items is little more
than for food items.
TABLE - 4.79 EMPLOYMENT GROWTH IN GUJARAT (RURAL - URBAN COMBINED)
(ANNUAL PERCENTAGE) 1983 to 1993-94 1993-94 to 1999-2000 Area
Male Female Person Male Female Person
Gujarat :
Rural 2.0 1.2 1.7 1.8 2.4 2.0
Urban 3.2 3.6 3.3 2.6 0.7 2.3
Combined 2.4 1.6 2.1 2.01 2.1 2.1
India :
Rural 2.0 1.5 1.8 1.6 1.8 1.03
Urban 2.8 3.2 2.9 2.6 1.5 2.04
Combined 2.2 1.7 2.1 1.9 0.9 1.6
Source: National Human Development, 2002.
This table reveals the picture of employment generation by sex
and aggregate in Gujarat in comparison with India. It covers the data of
1983 to 1993 and 1994 to 2000. The table reveals the following trends
(I) Employment rate in state of examined suggests declining trend in
male employment under reform period in comparison with pre reform
period, both in rural and urban area. While in case of female
employment post reform period shows an increase over pre reform
period in rural area but in contrast to that in urban Gujarat the trend is
found reverse looking at the combined picture of employment it shows

345
an increase in the reform period. But employment in aggregate of
persons if observed the data reveals the fact that for combined it has
remained stagnant for urban Gujarat it has declined under reform and it
showed little increase for rural Gujarat.
TABLE - 4.80
EMPLOYMENT IN PUBLIC AND PRIVATE SECTOR (In '000) Number of persons employed as on 30th June Sr.
No. Category
1980 1990 1999 2000 2001 2002 2003 2004 As on 31st
Dec-04 (A) Public
Sector 737 940 932 934 872 844 845 818 824
1. Central Govt.
127 140 137 138 123 133 129 121 116
2. State Govt. 187 217 205 210 199 193 187 185 185 3. Quasi Govt. 189 293 299 298 283 266 264 243 247 4. Local
Bodies 234 290 291 288 267 252 265 269 276
(B) Private Sector
573 679 795 762 740 723 777 796 836
Total 1310 1619 1727 1696 1612 1567 1622 1614 1660 Source: Directorate of Employment and Training, Gujarat State, Gandhinagar.
This table highlights the status f employment in public and private
sector over the period f time. It covers the data of 1980-90 decadal and
therefore from the year 1999-2000 to 2004. According to the table the
trends available are found as under.
(A) During the decade of 1980s the growth in total employment in
number is found to be of 309000 (+23.58 percentage). In 1999 it
reported an increase of 108000 (+6.67 percentage). In decadal
contact the change in 900S LS found to the tune of +77000 (+4.75
percentage) growth over the year in percentage suggests -31'000
(-1.79 percentage) in 2000. This fall in employment in 2001 was
found of 84'000 (-4.95 percentage) This declining rend continued
in 2002 showing fall of 45'000 (-2.79%) In the year 2003 total

346
employment again increased by +55'000 (+3.51 percentage). In
the year 2004 this number again fall marginally by -8'000 (-0.49
percentage)
(B) The table further highlights number of employment in category of
public and private sector. In 1980 employment in public sector in
percentage to the total employment was of 56.26 percentage.
Decadal growth or change in public sector employment was
registered to the tune of 203'000 -i.e. 9401000. percentage to the
total was 56.06 showing percentage to the total was 58.076
showing an increase +1.80 percentage point in the decade. This
number of employment in public sector declined a little of
employment in public sector declined a little by -8 showing (-0.86
percentage) change over one year however year this number in
percentage to the total employment was 53.97%. This number of
employment in public sector showed meager increase of 2'000 i.e.
+2.21 percentage change. This trend continued to decline by -
62'000 showing -6.64 percentage change. This number of
employment was found to the true of 54.09 percentage. In the
year 2002. percentage ratio in public sector to the total
employment was found of 53.86 and change in percentage over
the previous year was of -3.21 percentage. The year 2003 reported
just an increase by +1000 i.e. +0.12 percentage over the previous
year this number of employment as percentage of total was found
52.09 percentage and as per the report of the year 2004. Change
over the previous year in percentage was found -3.19 percentage
and that in percentage to the total employment was 50.68. It is
thus proved from the table that there has been continuous

347
declining trend observed in numbers after 1990 including the
growth in percentage.
(C) Number of public sector employment over the years when
classified into Central State, quasi government and local bodies.
The trend particularly in respect of state government employment
strength also is found at large in conformity to what it is found for
aggregate public sector. In 80's this number showed an increase of
30'000 i.e. +16.04 percentage growth. In the 1990's it declined by
-7'000 i.e. -3.22 percentage fall and in 2004 this number
decreased by -251000 (in percentage -11.90).
TABLE - 4.80(a) EMPLOYMENT IN PUBLIC AND PRIVATE SECTOR
BY INDUSTRIAL CLASSIFICATION (In '000)
Second part of the table highlights growth in employment and
changes there in by different industry groups over the period of time.
Data present in the table refer to the years of 1980, 1990 and from 1999
348
on wards till 2004 June. This table demonstrates mainly the following
trends.
(A) Employment numbers when examined in context of sectoral share
to employment it is found that community, social and personal
services, Manufacturing and transport storage communication are
the three main large groups providing employment in larger
proportion. Year by year in larger proportion. Year by year if the
total of these three and individual examined it reveals the
following trends further.
(B) Combined share of the three main groups contribution in
percentage to the total employment is found varied over the
period this however shows fluctuations in a very little degree. The
highest from amongst different year is found in 1980 i.e. of 83.81
followed by 83.34 percent in the year 2002.
(C) When contribution of individual group to the employment is
concerned manufacturing sector is the single largest contributor to
the employment although the period. Manufacturing's share in the
total employment tends to show fluctuations little degree. Second
largest group is community social and personal service which also
show little variations over the period of time. It is important to
note that it 3 blood sectors of economy taken into consideration
then transport storage community, social services lead the
scenario in total employment. Financial services also tend to have
significant contribution to the total employment.

349
TABLE - 4.81 WOMEN EMPLOYMENT IN PUBLIC AND PRIVATE SECTOR (In '000) Sr. No. At the end of
June Persons / Women
Public Sector
Private Sector
Total
1. 1980 Persons 773 753 1310 Women 95 44 139 (12.89) (7.68) (10.61)
2. 1990 Persons 940 679 1619 Women 135 62 197 (14.36) (9.13) (12.17)
3. 1995 Persons 968 722 1690 Women 149 71 220 (15.39) (9.83) (13.02)
4. 1997 Persons 953 818 1771 Women 145 73 218 (15.21) (8.92) (12.30)
5. 1998 Persons 944 818 1762 Women 146 71 217 (15.46) (8.67) (12.31)
6. 1999 Persons 932 795 1727 Women 141 71 212 (15.15) (8.94) (12.29)
7. 2000 Persons 934 762 1696 Women 137 69 206 (14.67) (9.06) (12.15)
8. 2001 Persons 872 740 1612 Women 129 65 194 (14.79) (8.78) (12.03)
9. 2002 Persons 844 723 1567 Women 127 66 193 (15.05) (9.12) (12.31)
10. 2003 Persons 845 777 1622 133 78 211 (15.74) (10.04) (13.01)
11. 2004 Persons 818 796 1614 Women 137 79 216 (16.74) (9.92) (13.38)
12. 2004 (31st Dec 2004)
Persons 824 836 1660
Women 141 87 228 (17.11) (10.41) (13.73)
Source: Directorate of Employment and Training, Gujarat State, Gandhinagar.

350
This table is related with status of women employment in Gujarat
State. This highlights number of women employed over different years
in public sector and private sector. The figure in brackets indicates
percentage of women employment to total employment
Major trends available from the data can be explained as under.
(A) In the decade of 1980's women employment in percentage to total
employment shows an increaser of 1.56 percent point. In the
1990's i.e. in the year 2000 decadal change in women
employment in percentage to the total is found of -0.2 however in
between this period this had an increasing trend. In 2004 this
percentage number of women employed to total employment
showed an increase of +1.23 percentage point.
Women employment in the state when examined in respect of
public and private sector it is found that women employment is found to
have more absorption public sector in comparison with private sector.
This if examined in terms of percentage to total women employment it
reveals the trend as under. In 1980 public sector absorbed 68.34
percentage of total women employed in 1990 this share increased to
68.53 percentage in 1995 this share slightly decreased to 67.73
percentage. In the year 2000 66.50 percentage and in the year 2004
percentage number in public sector was 61.84 percentage. It thus
confirms with the trend that is observed in aggregate employment that
employment in public sector under the reform period has declined
considerably. In case of women employment too this has increased in
number under the reform period but percentage share of public sector in
comparison with private sector has declined.

351
TABLE - 4.82 WORKING OF EMPLOYMENT EXCHANGES (In '000)
Sr. No.
Year Registration during the
year
No. placed in employment during the
year
No. on Live Register at the end of the year
No. of Vacancies
notified during the year
1 1980-81 248 21 483 47
2 1985-86 147 12 771 33
3 1986-87 160 13 865 33
4 1987-88 206 16 779 35
5 1988-89 187 13 876 31
6 1989-90 182 17 954 38
7 1990-91 228 17 951 29
8 1991-92 188 16 991 30
9 1992-93 188 32 1026 41
10 1993-94 157 30 930 33
11 1994-95 171 36 899 36
12 1995-96 193 37 916 37
13 1996-97 237 54 924 48
14 1997-98 226 75 926 60
15 1998-99 234 67 634 67
16 1999-00 320 80 989 76
17 2000-01 339 80 1071 113
18 2001-02 252 75 1070 76
19 2002-03 238 72 1047 71
20 2003-04 277 73 964 73
21 2004-05 204 73 900 93
22 2005-06 101 41 876 56 Source : Directorate of Employment and Training Gujarat State, Gandhinagar.
352
This table provides data on functioning of employment
exchanges. Under the reform period employment opportunities in the
private sector has widened. This in a way declines the practical
significance of employment exchanges, Govt.'s role in the growth
grosses is also found more dynamic in respect of Govt.s intervention,
Despite this fact unemployed youth tends to has significant hope in the
functioning of employment exchanges. It is revealed from the table as
the number of registration in '000 with employment exchanges in
Gujarat showed increase between 1991-92 to 1999-2000. As presented
in the table between 80 to 90 number of registration got fluctuated with
virtual fall in 1940 in comparison with 1980. During the period of 1990s
also the trend remained by and large same but in 2000 virtually it
showed an increase of 92'000 i.e. from 228'000 to 320'000.
In the year 2004-05 this number of registration went down from
320 in 2000 to 204 in the year 2005. i.e. a fall of 116 i.e. 36.25
percentage fall. As against this trend for employment exchanges
employment provided by the exchanges reveal that between 80 to 90
there was found fall of 4000 i.e. 19.4 percentage fall between 90 to 2000
this showed an increase of 63'000 i.e. 370 percentage. However in 2005
this has again declined by 7'000 showing -8.75 percentage change.

353
TABLE - 4.83 NUMBER OF JOB SEEKERS BY LEVEL OF EDUCATION REGISTERED
WITH EMPLOYMENT EXCHANGES As on 31st December
Level of Education
1990 1995 2000 2001 2002 2003 2004
As on 30th Sept. 2005
S.S.C 435429 439642 435996 394563 364064 326042 305200 287556 Inter 81724 127454 230074 271455 290042 291244 258334 898 Diploma 8766 10787 19319 22458 23687 24801 23975 23915 Graduates 55007 76483 144952 172255 173238 174426 171112 17083 (a) Arts 16443 29366 59314 75554 76207 77052 74907 75067 (b) Science 8479 10974 23252 25573 25500 23949 21670 20948 (c)Commerce 20584 22603 44825 52414 52656 51625 49877 48741 (d) Others 9501 13540 17561 18714 18875 21800 24658 26117 Engineering Graduates
4085 3725 7579 8454 8681 8768 9191 9568
(a) Civil 2368 1431 1892 1964 1901 1368 1228 1202 (b) Mechanical 681 630 1689 1987 2049 2086 2160 2223 (c) Electrical 370 619 1589 1797 1910 2075 2276 2349 (d) Others 666 1045 2409 2706 2821 3239 3527 3794
Post Graduates 8129 12184 17595 19483 19304 21765 22704 24356 (a) Arts 2355 5452 8561 9522 9600 11148 11443 11965 (b) Science 2050 2369 3369 3626 3549 3566 3626 3938 (c) Commerce 1891 2475 3023 3310 3237 4078 4329 4677 (d) Others 1833 1888 2642 3025 2918 2973 3306 3776 Engineering Post Graduates
15 6 2 1 1 31 58 68
I Total Educated Unemployed
593155 670281 855517 888669 879057 847077 790574 757238
II Total Uneducated Unemployed
363826 241901 212234 204901 175368 152111 131194 118479
Grand Total (I+II)
956981 912182 1067751 1093570 1054425 999188 921768 875713
Source : Directorate of Employment and Training, Gujarat State, Gandhinagar.
This table reveals the number of unemployed seeking job by their
level education in the state of Gujarat the data presented in the table
reveal the status as on 31st December of 1990-1995, 2000-2004 and for
30th Sept. of 2005.
The most significant fact from this table found is the proportion of
educated unemployed to uneducated unemployed in respect of total
unemployed, and the changes observed over the period of time there in
the trend is found as under :
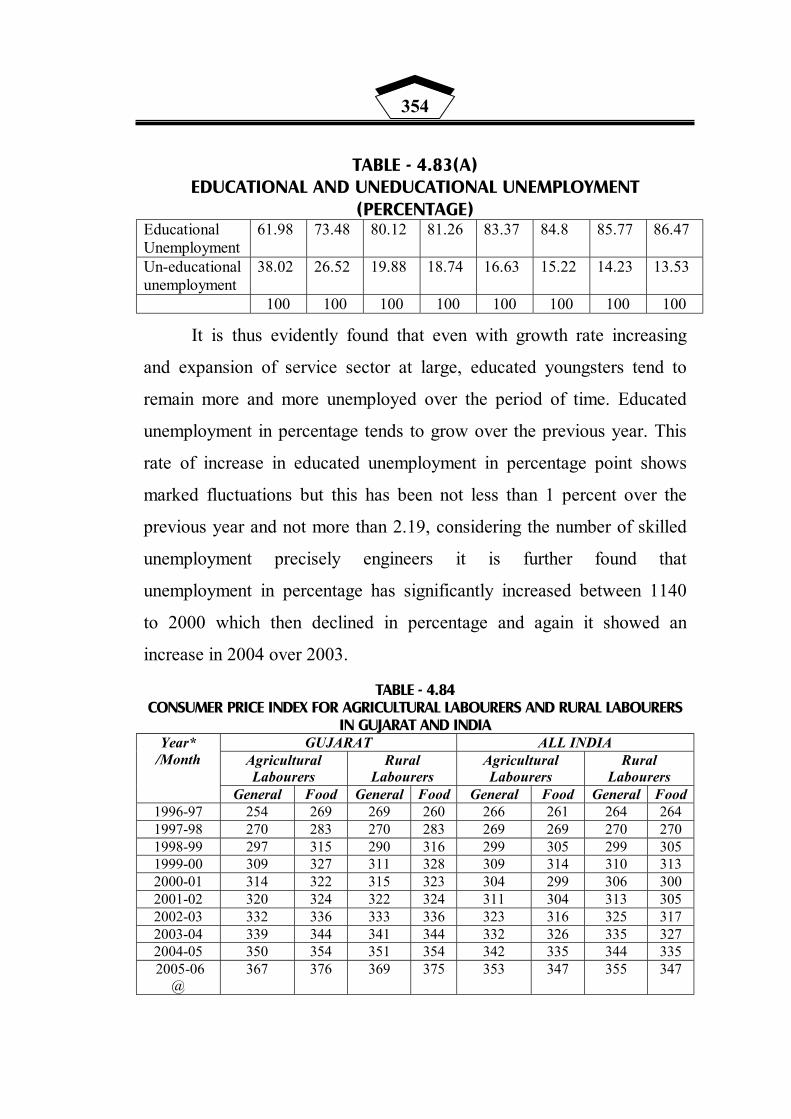
354
TABLE - 4.83(A) EDUCATIONAL AND UNEDUCATIONAL UNEMPLOYMENT
(PERCENTAGE) Educational Unemployment
61.98 73.48 80.12 81.26 83.37 84.8 85.77 86.47
Un-educational unemployment
38.02 26.52 19.88 18.74 16.63 15.22 14.23 13.53
100 100 100 100 100 100 100 100
It is thus evidently found that even with growth rate increasing
and expansion of service sector at large, educated youngsters tend to
remain more and more unemployed over the period of time. Educated
unemployment in percentage tends to grow over the previous year. This
rate of increase in educated unemployment in percentage point shows
marked fluctuations but this has been not less than 1 percent over the
previous year and not more than 2.19, considering the number of skilled
unemployment precisely engineers it is further found that
unemployment in percentage has significantly increased between 1140
to 2000 which then declined in percentage and again it showed an
increase in 2004 over 2003.
TABLE - 4.84 CONSUMER PRICE INDEX FOR AGRICULTURAL LABOURERS AND RURAL LABOURERS
IN GUJARAT AND INDIA GUJARAT ALL INDIA
Agricultural Labourers
Rural Labourers
Agricultural Labourers
Rural Labourers
Year* /Month
General Food General Food General Food General Food 1996-97 254 269 269 260 266 261 264 264 1997-98 270 283 270 283 269 269 270 270 1998-99 297 315 290 316 299 305 299 305 1999-00 309 327 311 328 309 314 310 313 2000-01 314 322 315 323 304 299 306 300 2001-02 320 324 322 324 311 304 313 305 2002-03 332 336 333 336 323 316 325 317 2003-04 339 344 341 344 332 326 335 327 2004-05 350 354 351 354 342 335 344 335 2005-06
@ 367 376 369 375 353 347 355 347
355
This table provides data on consumer price index in agricultural
labourer and rural labourers in Gujarat and India. Following is the trend
reflected from the table.
(I) C.P.I. general for agricultural labourers in Gujarat shows
continuous increase from 1996-97 to 2004-05. Though an
increase in index number over the year indicates fluctuations it
tends to have increased although the period. Year over year
change if examined in this respect it is found that it is trend
maximum in number in 2005-06 average of for months over the
year of 2004-05. Complete year if taken into consideration C.P.I.
in 1998-99 showed an increase of 27 over the year 1997-98. when
compared with all India agricultural labourers general C.P.I. the
trend does not show much variation as by as growth is concerned
except in the year 2000-01 at India this was found less than the
previous year's index. In 7 out of 10 years data as presented in the
table it is observed that agricultural labourers general C.P.I. in
Gujarat is reported to be little more than that of all India level.
(II) Consumer price index of rural labourers in general category
shows ups and downs over the period of time. Changing trend
when compared with agricultural labourers trend of C.P.I. of
Gujarat this is found almost similar though in degree the change is
found varied over the period o time. In numbers in both changing
index is found lowest in the year 1996-97 and highest in the year
2004-05 (if complete year is taken into consideration).

356
TABLE - 4.85 CONSUMER PRICE INDEX OF RURAL LABOURERS IN
MAIN CITIES OF GUJARAT Year Amdavad Vadodara Bhavnagar Rajkot Surat
1995 303 383 318 296 303
1996 333 332 350 332 333
1997 357 349 373 350 373
1998 399 385 425 393 417
1999 422 405 447 490 432
2000 447 430 466 430 446
2001 460 453 483 433 474
2002 476 467 492 447 489
2003 488 470 504 455 490
2004 507 485 516 465 490
2005 517 498 538 494 500
Source: Labour Bureau, Government of India, Simla.
Consumer price index rural labourers (general) in Gujarat when
compared with India it shows more in numbers for 7 years out 9 years
index presented in the table
It is found from the table that in the year 1995 C.P.I. in general
from amongst the five leading urban central of Gujarat was found
highest in Bhavnagar and lowest Rajkot. Gap between the two was
found of 22.
In 2005 too Bhavnagar reported highest C.P.I. (538) from
amongst leading cities of Gujarat while this was found lowest in Rajkot.
Gap between the two tend to have an increase of 44. In the year 2000,

357
similar trend was observed where in the different between highest and
lowest index was found of 36.
C.P.I. general as reflected in table indicates constantly increasing
trend and the rise in the index over the year. However this when
examined year-by-year tendency to have increase in the index is found
of different rates in all the centers. The trend compared with centers also
suggests change at various rates.
SECTION - XII
GROWTH AND PUBLIC FINANCE - GUJARAT AT A GLANCE
Govt.'s policy of direct and indirect intervention in the process of
growth plays important role in the nature and composition of growth. It
is through Govt. finance that it affects the determinants of growth.
Govt.'s strategy in respect of financing the growth process virtually
leads the state economy towards desired and determined direction of
growth. An attempt is made here to inquire into the status of growth in
context of finance. Some major indicators manifesting the impacts of
state finance on growth are examined here in this section. This mainly
refers to various types of expenditure ratios maintained in the state
particularly under the reform period. Besides data on expenditure pattern
of state planning DEBT / GDP ratio - revenue and fiscal deficit as
percentage of GSDP are presented through various tables. Tables from
4.86 to 4.91 highlights the state finance pattern under the reform period.

358
TABLE - 4.86 EXPENDITURE RATIOS IN GUJARAT - 1990-91 TO 2000-02
Year PER SAR SPR HER
1990-91 22.18 31.70 38.79 2.72 1991-92 29.80 25.84 40.74 3.13 1992-93 25.02 24.81 41.09 2.53 1993-94 23.70 26.94 41.71 2.68 1994-95 20.08 30.16 41.04 2.48 1995-96 21.86 30.21 41.95 2.77 1996-97 19.48 27.92 50.25 2.73 1997-98 20.08 29.52 46.95 2.78 1998-99 21.44 30.78 N.A. N.A. 1999-00 24.85 30.89 35.24 2.69 2000-01 33.81 28.19 36.81 3.49 2001-02 62.78 13.02 25.05 2.05
Source: Compiled on the basis various budget reports. Derived from Human Development - Gujarat - 2004.
This table highlights various expenditure ratios in the post reform
period examining the table following broad conclusions can be derived.
(A) PER (Public Expenditure Ratio) - which calls for percentage of
NSDP that goes for public expenditure, shows wide year-to-year
fluctuations. It also indicates long term increasing trend from
22.18 in 1990-91 to 62.78 in 2001-02. In two years 2000-2001
and 2002-2002, the ratio exceeded 25 percent. This could be the
out come of increase in public expenditure or decrease in NSDP.
In Gujarat it is the latter NSDP has decreased particularly in
2001-02. This however does not show any major point of
concerns.
(B) SAR (Social Allocation Ratio) - This demonstration percentage of
total expenditure earmarked for social services. This shows wide
359
fluctuations with a declining long-term trend. This ratio declined
from 31.70 in 1990-91 to 13.02 in 2001-02. The ratio remained at
around 30 percent till 1999-2000 and since then there is a very
rapid decline.
(C) SPR (Social Priority Ratio) - This refers to the percentage of
social expenditure devoted to human priority concerns, such as
elementary education, preventive health care (Water Supply and
Sanitation) and Nutrition. Looking at the table it shows an
increasing trend upto 1996-97. In fact, the ratio reached the norm
of 50.00 in 1996-97. Since then the ratio has declined sharply to
46.75 in 1997.98.
(D) HER (Human Expenditure Ratio) - It indicates percentage of
national income devoted to human priority services. It is basically
the derivation of the three previous ratios. As per the table it is
found that this has remained almost constant with figures going
slightly above as below 2.70 against the norm of 5.00 till 1999-
2000. In 2000-2001 the ratio moved to 3.39 and again went down
to 2.5 in 2001-02.
Direct agriculture has received minimal significance in terms of
rupees spent and percentage of total spending. It is true however that a
spending for irrigation has its cumulative significant impacts on
agriculture.
General and economic services under planning period have
gained momentum a little. An area of concern for the state in terms of
priority in spending it that of communication, science and technology

360
towards which state spending does not significant presence for want of
policy measures and co-ordination that of.
TABLE - 4.87 SECTOR WISE EXPENDITURE UNDER PLANNING (Rs. Lakh)
Subject
VIIIth plan
1992 to 1997 IXth plan
1997 to 2000 Xth plan
2002 to 2005 Agriculture 78,874 2,07,622 1,20,926 (6.71%) (7.67) (5.58) Rural Development 3,40,649 1,07,721 1 ,03,119 (28.97) (3.98) (4.79) Irrigation Flood 2,55,010 7,14,903 5,43,173 (21.69) (26.42) (25.08) Secondary Energy 64,361 3,97,196 2,72,576 (5.47) (14.67) (12.58) Industry 80,144 1,24,578 51,957 (6.82) (04.60) (12.40) Transport 570 2,04,889 2,08,992 (0.05) (07.57) (09.65) Communication - 0,00,047 3,430 - (0.00) (00.16) Science - Technology 819 17,504 18,813 (0.07) (0.64) (00.87) General Economic Services 28,510 81,818 73,711 (2.42) (3.02) (03.40) Social Services 2,70,647 8,37,965 7,68,224 (23.02) (30.95) (35.48) General Services 215 00,787 829 (0.02) (00.02) (00.03) Border Area Development - 2,901 - - (0.10) - Grand Total 11,75,610 27,07,231 21,657,50
This table demonstrates expenditure pattern of the state under
planning period. The data presented in the table cover mainly 8th, 9th
and 10th five year plan. Tenth five year plan's expenditure data however
is from April 1002-02 to March 2005. As highlighted in the table in the
361
8th plan period from the total expenditure rural development should the
largest in rupees and thereby in percentage to the total expenditure.
Social services received the second priority in respect of the amount
spent in number and in percentage. Irrigation and flood control was the
trend largest sector for which the amount in number and in percentage to
the total was spent. These three in combined shared 73.68 percentage of
the total expenditure during 8th five year plan.
In the 9th plan social services continued to have largest share of
the total expenditure in amount and percentage while rural development
sector want down in spending energy received more priority with being
the third largest sector for spending. Irrigation maintained shared
significance as long as spending is concerned.
First three years of 10th five year plan also showed by and large
the same pattern that is observed in the eight and ninth five year plan.
Social services being at the top in spending followed by irrigation flood
control and energy respectively.
Social services found to have very position with showing
continuous increase in spending in rupees and in percentage to the total
spending although out decadal period. Irrigation flood control also
remained significant one with slight fall in percentage ratio during 9th
plan.
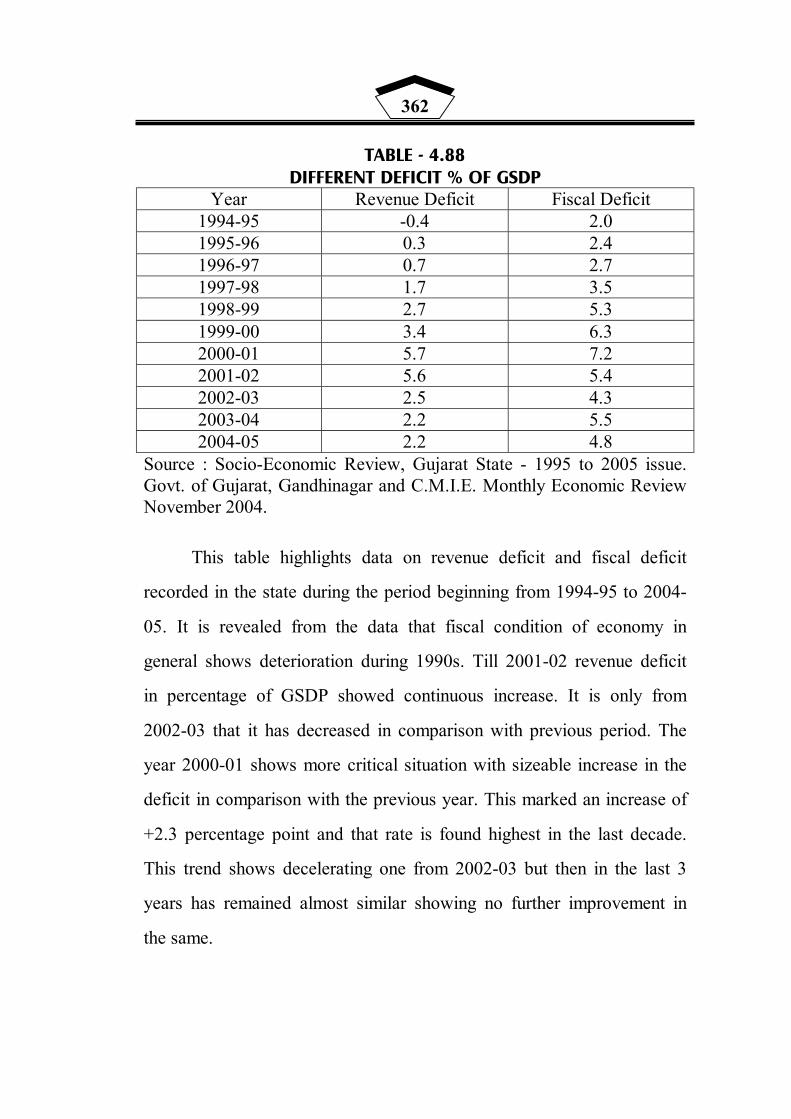
362
TABLE - 4.88 DIFFERENT DEFICIT % OF GSDP
Year Revenue Deficit Fiscal Deficit 1994-95 -0.4 2.0 1995-96 0.3 2.4 1996-97 0.7 2.7 1997-98 1.7 3.5 1998-99 2.7 5.3 1999-00 3.4 6.3 2000-01 5.7 7.2 2001-02 5.6 5.4 2002-03 2.5 4.3 2003-04 2.2 5.5 2004-05 2.2 4.8
Source : Socio-Economic Review, Gujarat State - 1995 to 2005 issue. Govt. of Gujarat, Gandhinagar and C.M.I.E. Monthly Economic Review November 2004.
This table highlights data on revenue deficit and fiscal deficit
recorded in the state during the period beginning from 1994-95 to 2004-
05. It is revealed from the data that fiscal condition of economy in
general shows deterioration during 1990s. Till 2001-02 revenue deficit
in percentage of GSDP showed continuous increase. It is only from
2002-03 that it has decreased in comparison with previous period. The
year 2000-01 shows more critical situation with sizeable increase in the
deficit in comparison with the previous year. This marked an increase of
+2.3 percentage point and that rate is found highest in the last decade.
This trend shows decelerating one from 2002-03 but then in the last 3
years has remained almost similar showing no further improvement in
the same.
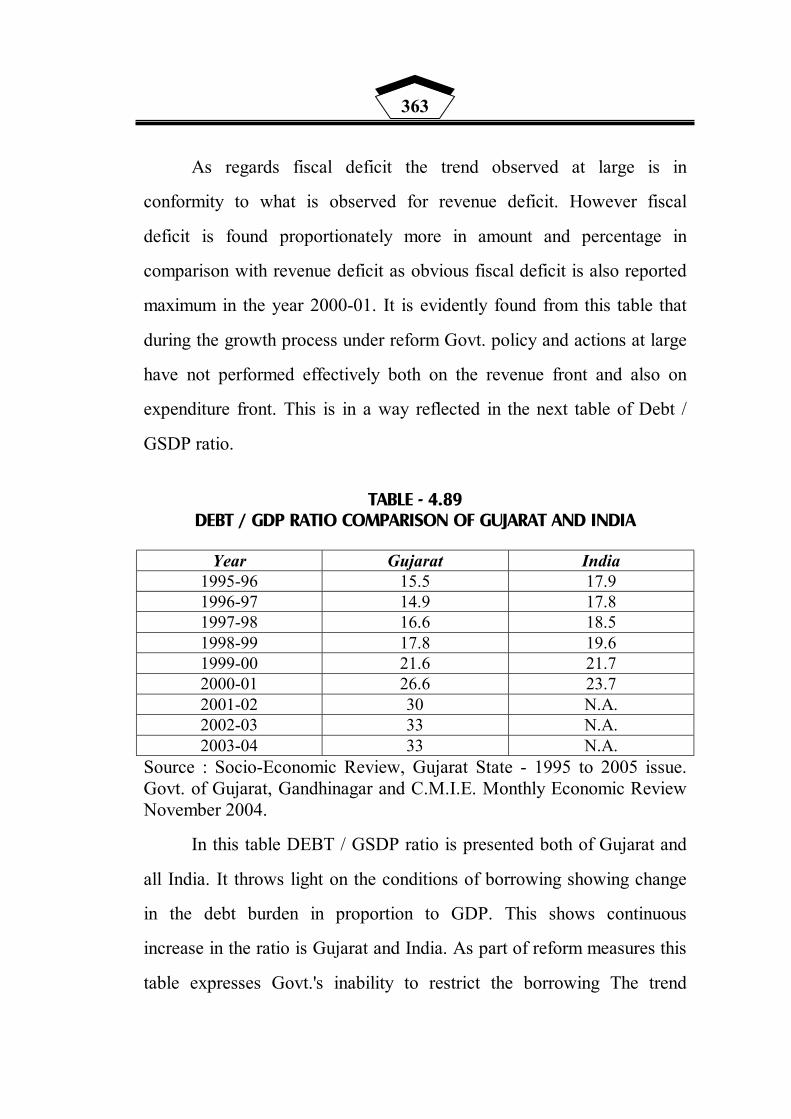
363
As regards fiscal deficit the trend observed at large is in
conformity to what is observed for revenue deficit. However fiscal
deficit is found proportionately more in amount and percentage in
comparison with revenue deficit as obvious fiscal deficit is also reported
maximum in the year 2000-01. It is evidently found from this table that
during the growth process under reform Govt. policy and actions at large
have not performed effectively both on the revenue front and also on
expenditure front. This is in a way reflected in the next table of Debt /
GSDP ratio.
TABLE - 4.89
DEBT / GDP RATIO COMPARISON OF GUJARAT AND INDIA
Year Gujarat India 1995-96 15.5 17.9 1996-97 14.9 17.8 1997-98 16.6 18.5 1998-99 17.8 19.6 1999-00 21.6 21.7 2000-01 26.6 23.7 2001-02 30 N.A. 2002-03 33 N.A. 2003-04 33 N.A.
Source : Socio-Economic Review, Gujarat State - 1995 to 2005 issue. Govt. of Gujarat, Gandhinagar and C.M.I.E. Monthly Economic Review November 2004.
In this table DEBT / GSDP ratio is presented both of Gujarat and
all India. It throws light on the conditions of borrowing showing change
in the debt burden in proportion to GDP. This shows continuous
increase in the ratio is Gujarat and India. As part of reform measures this
table expresses Govt.'s inability to restrict the borrowing The trend

364
indicates very clearly that Debt burden tends to increase in Gujarat and
more importantly change in the ratio leads to conclude that state
economy of Gujarat in comparison with India in this regard does not
show much improvement during the years as specified in the table.
TABLE - 4.90 GOVERNMENT SUBSIDIES IN GUJARAT - 1993-94 TO 1999-2000
Items 1993-
94 1994-
95 1996-
97 1997-
98 1998-99
(RE) 1999-2000
(BE) Total Subsidies (in Rs.
Crore) 6155 80.87 9161 10956 13201 13232
Per-capita subsidies (in Rs. Crore)
1422 1794 2013 2357 2784 2739
Cost Recovery Rate 2.21 2.18 1.63 2.11 2.10 2.91 Subsidy as % to NSDP 15.69 13.89 13.70 15.54 15.21 13.26
% of Social Sector subsidy to total subsidies
39.38 41.63 39.35 39.24 45.22 46.03
% of Economic sector subsidy to total subsidies
60.62 58.37 60.65 60.76 54.78 53.97
Source: Dholakiya Archana - "Fiscal Imbalances in Gujarat Economic and Political Weekly - August 26 - Sept. 2005
This table presents state economy in terms of subsidy in total with
its sectoral composition. The table also highlights cost recovery rate
important one in consideration of Govt.'s efficiency in services. The
trends demonstrated in the table can be analysed as under.
(A) In spite of constant concern for reforms subsidization tends to
continue. It is only in the budget estimates of 1999-2000 that it was
estimated with moderate increase. Except that in all the previous years
the total amount of subsidy show increase with relatively high rate. The
year 1994-95 showed an increase of 30.57 percentage over 1993-94
1996-97 showed an increase of 13.95 in comparison with 94-95. The
365
year 1997-98 witness rise in subsidy by 19.59 percentages. Revised
estimation for total subsidy reported an increase of 20.58 percentages
only budget estimation reported meager rise in subsidy by 0.23
percentages. Thus it is revealed from this part that total subsidization
with very limited exception tends to increase. This has obviously
resulted into an increase in per capita subsidy.
Most important point to note is the rate of cost recovery of
services made available in the state economy. No year from amongst the
table shows any significant change in the rate. This expresses the
limitations in governance and administration in general Cost recovery
rate for merit services and non-merit services also reports by and large
stagnancy at low rate.
Subsidy as percentage to NSDP also shows changes during the
year at moderate rate. In comparison with 1993-94 this showed decline
in 1994-95 and 1996-97. It then showed an increase in 1997-98 with
little fall in 1998-99. Budget estimations show comparatively lower as
percentage to NSDP.
Last two compositional items hold more significance in view of
understanding Govt.'s strategy towards enhancement of growth with
justice under the reform period.
It is evidently found that social sector in comparison with
economic sector is by and large less subsidized one. Though this
percentage gap between the two is found be narrowed in the pre years of
2000s. i.e. in 1998-99 and 1999-2000. Percentage of social sector
subsidy to total subsidy shows sharp fluctuations over the period of
366
time. There is marked ups and downs in the proportion of social sector
subsidy. This leads to conclude that even under the reforms Govt.'s in
general has accorded more priority to economic services than social
services as long as subsidy is concerned.
SECTION - XIII
ECONOMIC GROWTH AND NATURAL CALAMITY
Natural disasters destabilize the normal functioning of the
economy. Flood, Famine, Cyclone and Earthquake are the major forms
of nature disaster. Presence of any of the form's presence hurt the
process of development. It is generally found that due to any sort of
natural calamity. The state economic resources are diverted to meet the
emergency. This tends to cause negative externality damaging future
plan of the economy. An alarming situation is that the gap that prevails
between the targets and actual spending is rarely compensated or
readjusted in the years to come thereafter. State level planning is not an
exception to this phenomenon.
In the state economy of Gujarat this is found frequently. The state
has set designed pattern to meet with drought because it has become a
recurrent phenomenon. Specific financial provisioning in cash and kind
is arranged accordingly, flood control, however, has also become a part
of state and central planning, which is implied in Irrigation.

367
An overview on decadal trends of natural calamity is important to
understand the hurdles that affect the smooth functioning of growth in
Gujarat.
After 1987 severe scarcity, in the year 1990, the state witnessed
flood, which affected 69 Talukas of 9 District. 57 Talukas were under
more panic situation.
In the year 1991 Monsoon in width and spread was found again
uneven. This led to the declaration of scarcity in 67 Talukas of 11
Districts. The state Govt. chalked out emergency plan of Rs. 600 crore
of which Rs. 410 crores master plan was for relief work, Rs. 110 crores
for providing fodder at concessional rates to the cattle owners and Rs.
80 crore was arranged for drinking water. Against Rs. 600 crores plan
Rs. 288 crores were spent in actual during the same year for 12229
villages covering 6 lakh labourers.
In the year 1993, the state economy in general experienced heavy
rain in the beginning in the restricted areas while in certain parts of
Kachchh and Saurashtra Govt. had to declare scarcity.
Again in the year 1994 consequently for 3 times the state
witnessed heavy rainfall.
(A) During 15th June to 17th June
(B) 13th to 15th July and
(C) 7th to 9th September.
In total 307 human lives and 28,832 animals were met with
casualty. More than 30000 hats were completely destroyed, 1.40 Lakh

368
huts were partially damaged more than 48,000 pucca residential
buildings were arranged.
TABLE - 4.91
SUMMARY AND FINANCIAL BURDEN ON STATE ECONOMY
Year Famine Cyclone / flood Earthquake Total
1998-99 1.08 113.72 - 114.80
1999-2000 265.77 74.91 - 340.68
2000-2001 437.91 13.03 869.08 1320.12
2001-2002 476.60 23.15 2257.71 2757.46
2002-2003 170.79 3.82 832.01 1006.62
2003-2004 253.79 40.00 736.47 1029.66
Total 1605.34 268.63 4695.27 2569.24
Sources : Based on various socio economic review reports.
During 1996-97 67 Talukas of 6 districts were declared as acute
scarce area. Some 9552 labourers were provided cash assistance per day.
People of 1191 villages were served with water through 634 tankers
150880 cattle were maintained at several cattle centres. 239 cattle camps
were opened.
May 1999 was very critical month for the state economy. Coastal
area of the state was worst hit with cyclonic pressures in total 463
casualties were reported out of 450 were from Kachchh only. Heirs of
bereaved were provided with cash relief, this led to the payment of Rs.
384 lakhs, 74286 persons of some 15970 family were provided cash

369
assistance of Rs. 56.8 Lakhs. 14206 family were disturbed with Rs.
12.53 Lakh.
The year 1999 and 2000 were worst hit with famines. In the year
2000 80 Talukas experienced rainfall while in 976 Talukas rainfall was
reported 25 to 40 percent less than the normal rainfall. Employment
assistance as part of relief work worth Rs. 134.94 crores provision was
made Till 1st May 2001, 106253 old age people were aid Rs. 40705 and
9513 pregnant women were paid Rs. 190260.
The year 2001 was the most severe blow to the economy of the
state in general and Kachchh economy particular. Earthquake brought
for the severe damage to the economy. Rehabilitation entailing huge
amount is still under pipe line as per the official survey report of Govt.
the state experienced 32650 $ direct loss and rebuilding the economy
was estimated to 24580$.
In general from 1991 to 2004 within the span of 14 years as such
the state the experienced floods in 4 years, famine in 5 years, 2 cyclonic
pressures and 1 year of earthquake.
370
CHAPTER - 5
CONCLUSIONS - SUGGESTIONS
5.1 MAJOR CONCLUSIONS
5.2 POLICY PERSPECTIVE
5.3 BROAD SUGGESTIONS
5.4 FURTHER SCOPE

371
CHAPTER - 5
CONCLUSIONS - SUGGESTIONS
5.1 MAJOR CONCLUSIONS :
An attempt is made to inquire into the level and nature of growth
visualized in the state economy. Second part of 3rd chapter provided an
aggregate view on the changes observed in the economy of the state
from 1960 to 1990. This refers to the analytical presentation of broad
indicators of development. While the fourth chapter provides an
exhaustive economic map of the state through some 93 tables analysed
in 12 various sections. This begins with analysis of basic development
indicators like GSDP, NSDP.
The detailed tabulation analysis along with graphical presentation
of the same leads to conclude in respected of the hypothesis formulated
for the research purpose.
(I) Tabulation analysis presented for table 4.1 to 4.8 lead to conclude
that in general the state economy has experienced positive trends
in respect of growth in terms of GSDP / NSDP. Considering the
year 1991 as the beginning year of the reform it is proved that
NSDP and per capita NSDP tends to behave positively although
the reform period with some exceptions, as regards NSDP. The
year 2000 - 2001 showed down fall excluding that year there was
continuous positive trend but in respect of per capita. The year
2000-01 and 2001-02 these two years were of the downfall.
372
Graphical presentations also highlight positive trends with
variation in the degree of increase. An increase in SDP thus is
reported with fluctuations in the rate of an increase in NSDP and
per capita status.
To add to this observation it is also evidently found that as
per the annual averages of for 1990-91 to 1992-93 at constant
price in NSDP per capita - the state was 4th in the ranking order
from amongst the major states of India - this rank as per annual
averages was maintained for 1993-94 to 1995-96 and 1998-99 to
2000-2001. In respect of percentage share of GSDP also it is
observed that Gujarat was having the third rank contributing to
the GSDP for the year 1990-91 to 1992-93, 1993-94 to 1995-96
and for 1998-99 to 2000-2001. NSDP tends to behave positive not
only during 90's but also more positive in comparison with 70's
and 80's. Decadal growth in NSDP in percentage has also
demonstrated the fact that the hypothesis framed in the research
regarding positive behaviour of SDP through not the reform
period stands true in respect of tabulation analysis.
(II) While examining the trends of SDP its sectoral composition holds
greater significance. It provides a clue for the direction of
development. In general it is believed understood and experienced
that along with the pace of growth the sectoral composition
primarily tends to have shift from primary to secondary and
finally to testing sector. This trend of shift is clearly visualized
between the nations at global level i.e. Developed nations gain
373
more from tertiary sector with agriculture contribution the least.
The similar trend is observed at national level. From amongst less
developed countries of the world. India tends to be fast
developing nation and as mentioned earlier in the first chapter
only sectoral development suggests clean shift with more bias for
tertiary sector. This national level tendency in respect of sectoral
growth is also found at region level in Gujarat state.
It is time that right from the inception that is from 1960 to
1990 also there was found marked change in the trends of sectoral
composition and this has been visualized proportionately more in
intensity under the reform period. As analysed in the tale two
major conclusions can easily be derived regarding the sectoral
change. It is evidently proved that like national trends regional
trends of Gujarat is also in conformity to that showing
strengthening service sector and weakening primary sector as
regards to percentage share. Secondly it is also proved that
changing economic order has yielded more in favour of service
sector in comparison with the period of 1980s. Thus both in
magnitude and intensity the second hypothesis framed for the
research work holds positive strength based on the tabulation
analysis.
(III) Occupational composition - distribution has two-way
significance. One hand it throws light on changes in demographic
characteristic from occupation point of view - and secondly more
374
importantly it reveals explicitly the significance of sector in the
development process.
In Gujarat state as revealed in the table and the analysis
total number to workers as per the census reports shows an
increase in every census report. But the number of workers
engaged in economic activities as per the reports has interchanged
over the period of time. Number of workers reported to have
engaged in agriculture either as cultivations or agro labours is
declined considerably and percentage share of other workers to
total workers is increased. This trend is found common at national
as well as regional level. From occupational point of view
agriculture is loosing its significance and service sector has
gained more in this respect. This trend is in conformity to the
trends found in developed nations. However as shown in
annexure the occupational diversification is found proportionately
more in case of male by gender and in case of urban by residence.
This suggests that state economy is marching a head more in
magnitude with considerable pace to be global in this respect.
(IV) In the 1990s the concept for development has changed
considerably. With initiatives from UDNP, concern for human
development has attained greater significance. The traditional
concept referred to the performance of economy in respect of
physical indicators having more quantitative thrust - while human
development asks for the internalization of those indicators in
practice. All development efforts must lead to growth with equity
375
at large. It insists for the prevalence of certain norms like literacy
rate, life expectancy at birth and sizeable increase in GDP per
capita to materialize improvement in standard of living. It is
hypothesized in the research work that indicators of human
development are taken care of and accordingly the process of
development visualized under economic reform period.
This has been examined with tables pertaining to literacy
rate, life expectancy at birth, poverty index etc. Analytical
presentation of the table clearly proves that there is a concern for
human development in the state but the goals enriched are not
satisfactory. It is proved from the table that during last 10 years
from 1991 to 2001 are increase in literacy rate in Gujarat is less
than that is observed in the states like Madhyapradesh and
Rajasthan. Percentage point change reflected in the annexure also
leads to conclude poor performance below the national level
change IMA suggests decrease over the period of time but when
compared with other states, Gujarat seems to be lagging behind in
temporal reduction in IMR. Compound annual rate of growth in
population in the state in the last decade has increased over the
decade 1981 to 1991. Expenditure ratio table of the state in
independence also proves that the state has not met any of the
norms set by the UNDP with regard to social sector and public
expenditure ratios either before or after the reforms. The situation
is found to have worsened in the case of all ratios except which
met with the norm in one year 1996-97. Thus hypothesis

376
pertaining to positive trend of human development index along
with growth does not hold true.
(V) Economic reform measures are criticized largely on the ground of
enquiry and justice. It is understood that growth under the policy
of liberalization has not fielded positive impacts on the rural
economical weak population. Having examined the trends of
employment, poverty, consumption expenditure, literacy by
resident under the reform measures it is evidently proved that
large chance of rural population is lagging for behind urban
population in such respects.
There still prevails wider gap between rural and urban
literacy. By resident it is observed that total number of literates
has increased in rural Gujarat but in respect of literacy rate the
gap is not found much narrowed. This is further analysed that by
gender too there prevails a wide gap between rural female and
urban female in respected of literacy.
Employment data does reveal an increase in rural
employment over the period but data also reveals the fact that
unemployment in rural Gujarat has declined but not in proportion
to that is decreased in urban Gujarat. It is significant to note that
employment growth in the last decade is largely found in the form
of casual and or retail, which obviously are found more in urban
areas than rural areas. Scope for casual and on retail employment
in the existing pattern of growth is found very bleak in rural
Gujarat hence this gap is not narrowed to the extent.

377
Poverty index if examined in terms of numbers of poor
people and in percentage, Rural poverty in number has declined
considerably by 23.29 lakhs while decline in urban poverty was
found 16.97 lakhs but in percentage rural poverty declined less in
percentage point - 9.98 percentage point which in urban it
declined by 13.31 percentage point. Thus in poverty the gap
between rural and urban is found narrowed during the reform
period but in percentage the gap is not narrowed and the gap as
such is found more because of migration from rural to urban
economy.
Rural urban gap is also not narrowed as expected in the
social sector like, educational facilities and health facilities. Even
at the end of 20th century there prevails wide gap in respect of
sanitation facility. All these parameters in combined if taken into
consideration proves the framed hypothesis regarding rural urban
gap as null and void.
(VI) Growth process in the state economy is marked with the
increasing trend of inflationary pressures. In the early 1990s
Government had succeeded in general to restrict inflation. But
right from 1995, the decadal clearly show that there has been
continuous increase in price index. Though the rate of increase in
percentage gets varied over the time if tends to increase hence the
hypothesis in respect of steady performance of inflationary
pressure in the state economy does not hold true. This index even
examined separately for both agricultural labourers and urban
378
non-manual employees are found increasing in general during the
period of last 10 years.
5.2 POLICY PERSPECTIVES :
Government of Gujarat in the recent periods precisely after the
year 2000 has explicitly expressed the commitment for rapid diversified
human centric growth in the central economy. Attempts are being made
to gear up the administration prone to development with positive
attitude. In view of enrichment of specified goals policy measures on
different fronts have been pronounced to make the administration
committed towards the same and to generate an environment of
assurance regarding delivery of qualitative service and to attract the
people at large to be a part in the development programmes. An
overview of the major policy measures can be highlighted as under :
AGRICULTURAL POLICY - GUJARAT AGRO VISION, 2010 :
To increase the share of agricultural produce from Rs. 17952
Crores (in 1998-99) to Rs. 32029 Crores in 2010.
To achieve 6.8 percentage of CAGR which tends to be in between
1.77 to 3.95 in the last four decades.
To achieve growth rate more than 4% per annum as expected for
national level.
To increase per-capita income of the people engaged in
agriculture from Rs. 7155 at 5.97% CAGR and to rich upto Rs.
13534 at constant price.
379
Considering in general observations of the earlier studies attempt
to be made to increase income from non agriculture sector to Rs.
11479 Crores by achieving agricultural income growth to
Rs.18220 Crores.
Rs. 51500 Crores for agrarian investment from Rs. 17500 Crores
for water resources and the remaining Rs. 34,000 Crores for other
than water resources.
This huge investment of Rs. 51,500 Crores to be met with the
sources as under :
External aid / loans of NABARD Rs. 4170, provisional funds to
be received from Government of India Rs. 6532 Crores,
investment through co-operative / private sector Rs. 3855 Crores,
from State Government Resources Rs.21743 Crores, from
planning resources (10th and 11th Plan) Rs. 12,813 Crores, from
extra sources Rs. 8930 Crores.
Holistic approach towards agriculture includes. Technical
efficiency by having agricultural research, biotechnology
application and ecology.
Environmental capacity through land and water conservation,
biodiversity and organic farming.
Economic efficiency through concentration on sawing of
beneficial crops, qualitative production to meet with global
competitive standards, quality improvement, social stability
through special package for marginal, small and tribal farmers, 10
to 15% increase in agricultural price.

380
To lay more emphasize on vegetables by increase area four times,
production three times and per day per head production from 197
grams to 508 grams.
To generate an environment to attract investment for agricultural
infrastructure and agricultural process.
GUJARAT INDUSTRIAL POLICY - 2003 :
The state Government has announced Gujarat Industrial Policy
2003. The main objective is to achieve sustainable industrial
development to increase large-scale employment opportunities and
achieving global competitiveness by improving productivity among
industrial units.
The proposed strategic actions call for
(I) Enabling an entrepreneur easy access to authentic source of
information.
(II) Sensitizing government officials from grass root level to the apex
level to be able to emphasize with legitimate concerns of an
entrepreneur.
(III) Developing better than best infra structural.
(IV) Empowering industrial estates.
(V) Producing quality human resources in accordance with
contemporary requirements of industries.
(a) Ensuing development and environment go hand in hand.
(b) Deriving maximum benefits from Narmada water
supplemented by extensive use of advanced technology and

381
good management practices, to usher in a new era of
prosperity through green wealth.
(c) Developing more and more industrial clusters by
encouraging them to create and sustain common facility
centers.
(d) Equipping small and medium enterprises with advanced
technologies sensitizing and assisting them on issues
pertaining to quality technology up-gradation, patents and
other relevant aspects.
(e) Strengthening manufacturing base of Gujarat on the
platform of high quality research and development
processes.
(f) Adopting focused marketing and promotion activities for
creating and sustaining a global brand image of products
manufactured in Gujarat.
(g) Rejuvenating the industries in Gujarat with cheap and clean
sources of energy gas.
(h) Commitment to reforms agenda in the regime of taxation.
(i) Convergence of self-actualization needs of NRIS / NRGS
with developmental imperatives of Gujarat.
(j) Harnessing the potential of parts to be the future gateways
of state's prosperity.
382
POPULATION POLICY :
The Health and Family Welfare Development of the Government
of Gujarat has declared a population policy in 2000 May. The Prime
objective of this policy is to achieve replacement level of fertility i.e.
TFR of 2.1 by 2010, most important features of the policy are -
(i) To have paradigm shift from population control to reproductive
and child health approach.
(ii) To improve quality of family health services and make services
more clients focused.
(iii) To promote gender equality, women's empowerment and male
participation.
(iv) Decentralization in implementation through structural changes
and financial reforms.
(v) To promote inter sectoral coordination and partnership between
Government, NGOs, Corporate Sector, co-operatives and private
sector.
(vi) To enforce accountability in public and private health care sectors
and social service sector.
(vii) To have resource Mobilization, alternative financing and better
financial utilization.
(viii) Social mobilization and information, education and
communication.
However, the policy document does not specify the ways of
achieving population stabilization by 2010.

383
INFRASTRUCTURE AGENDA VISION - 2010
Gujarat Government has setup "The Gujarat Infrastructure
Development Board" to facilitate and monitor the development of
Infrastructure in Gujarat. This GIDB has initiated the process of
formulating an infrastructure Master plan for the state" Gujarat
Infrastructure Agenda - Vision - 2010" is a special attempt in this
direction. The Agenda seeks to identify development imperatives in
each infrastructure sector and inter sectoral linkages needed to ensure
coordinated development. The Agenda covers power, parts, transport,
industrial parks, urban infrastructure, water supply and miscellaneous
sectors like Air parts, gas grid and in formation infrastructure.
The Master plan assesses the emerging demand supply gap in
infrastructure capacity over the next 10 years. Identifies the projects that
have been envisaged in various sectors for covering the gap. Generates a
shelf of priority projects for development / marketing focus by the state
analyses the financial and investment implications for implementing
these projects and the extent of private sector involvement necessary to
satisfy the same.
HUMAN DEVELOPMENT - VISION 2010
The most debatable issue at the fore all over the world and in
India is the "concern for the Development of the Deprived - in context
of New Economic Order. It has been loudly acclaimed by the
developments of liberalization for free and just society with opponents
of liberalization challenge the validity on the same ground.
384
As long as the state economy is concerned as discussed earlier the
state has some drawbacks in achieving the goal of Development of
Deprived : In view of this fact and aiming at becoming a model state on
all fronts of human development. Social infrastructure Development
Board of Govt. of Gujarat has published a Documentary Report on
different aspects of Human Development. This does not directly address
the issues involved in Human Development but it works as
complimentary to other initiatives that Gujarat has launched. The report
calls for areas of attention in planners and policymaker's along with
submitting resource requirements to enhance the development. Besides
providing a status map resource requirements it also refers to the action
plan as strategic measures to achieve the goals.
This covers education, health, social welfare, women
empowerment, housing, water supply and sanitation, environment,
employment and training.
5.3 BROAD SUGGESTIONS :
Detailed analysis of state economy and the conclusions derived
from the analysis throw light on the prevailing aggregate status of
economic growth in Gujarat. Broad Indicators very clearly demonstrate
the fact that the state has continued the progress in the proportion - that
was maintained earlier. Quantitative dimension at large show that the
economy of Gujarat is strengthening. The state is having 4th rank in all
India in respect of per-capita income. Per-capita consumption
expenditure also tends to be much higher than that of all India level. The

385
state is found more dynamic in view of attracting investment circles
from abroad and from within. Decadal growth rate is found of 6% while,
secondary and tertiary sector show compound annual growth rate
(CAGR) of 7.25% and 7.39%. The state is holding third rank in respect
of Industrial progress.
With all these achievements to the credit, level and pattern of
growth in Gujarat is not found exceptional positive. There are certain
areas, the pit fall, in which call for immediate attention of the planners
and policymakers. Progressive state like Gujarat needs to inject the
growth in agriculture. This sector is found in general neglected one.
In spite of diversified growth strategy adopted at large agriculture
holds the scenario. Therefore there is a strong need to strengthen
agricultural productivity and thereby total productivity.
Agrarian economy needs to be taken care of by way of following
measures :
♦ Maximum incentives are provided for Research and Development
in Agriculture. Technological change is mandatory one to
strengthen rainfall areas - along with strong complementarily of
extension services.
♦ Innovated - better approach for effective land utilization and water
management through watershed programme.
♦ There is a need for application of TRIO tools, which includes
technological, institutional and legal instruments to improve
efficiency in water resource.

386
♦ Knowledge based simplified training programmes for small and
marginal farmers to have access to the new opportunities under
WTO programmes.
♦ Currently there is a weak link between agriculture and animal
husbandry. Let there be innovated programmes like operation.
Flood projects to strengthen this link and to promote milk economy
of Gujarat. There are wide opportunities in this respect under WTO.
♦ Agricultural finance is a weak link, weakening of co-operative
financial structure in the state is a matter of severe concern. All
efforts are made to re-establish and thereby re-strengthen co-
operative financial structure. Through NABARD package to have
easy access to agriculture credit. Private sector would be too costly
for poor small marginal farmers.
♦ Need to bring awareness amongst farmers for agribusiness and
updated knowledge of changing agrarian trends and make them
capable to seek the benefits of changing market pattern.
INDUSTRY SECTOR THE GROWTH DRIVER :
As long as numerical significance is concerned industrial
economy of Gujarat is more strengthen one than most of the other states'
industrial economy. What is important to be implemented at macro and
micro level is the systematic approach encompassing multifold actions
to integrate the regional industrial economy with local capabilities and
global culture.
387
There is strong need to have "Trickle Down" benefits of industrial
setup. On one hand all our efforts to increase productivity do not match
with the global standards for want of certain skills required in marketing
technology, on the other hand many localities are deprived of
opportunities. This required training centers at local level to train for
certain requirements.
Strong and specific but dynamic strategic actions are required to
serve the available manpower with reasonable wage and social security.
Equally important is to have strong "Monitoring" on emerging industrial
awareness through protecting the interests of small farmers while going
for sell agreements with industrialists. There is a need to allow factor
markets to function efficiently through appropriate policies so as to
enable the hinterlands to access benefits of industrial growth. Let people
feel "Full Transparency" on the part of Government while subsidising
industries.
Pollution control initiatives required to be implemented more
systematically and significantly. Clean technology - recycling, reuse of
industrial discharge are but the examples of this.
EMPLOYMENT ORIENTATION :
It is in general found that Gujarat is well placed among the states
of Union of India in respect of employment scenario. This however does
not fulfill the targets for better living through prevailing employment
status. About 20% of the existing workers in the state are marginal
workers. Most of them are engaged in low productivity, low-income
388
jobs. There is a need to either shift them to higher productivity jobs or
improve their productivity in existing employment.
As part of growth process the state has to penetrate into certain
areas having still potential to generate employment. These areas are
informed sector, micro, medium industries, cottage industries,
traditional trading. However these sectors may not be more fruitful in
respect of educated unemployment.
In order to generate employment for educated youngsters, whose
number is increasing as analysed in the table. There are long-term
strategic actions are required.
On one hand there should detailed documentation for the areas of
requirement. This should be based on survey indicating demand supply
gap.
On the other hand accordingly there should be direct industry
institution linkages where during the learning period practical training
may be provided and on completion of the programmes, enabling these
youngster to be self employed and or serve as skilled managers. (Fig.1)
Instead of exclusive highly technological skill oriented
programmes there should be used based short run programmes, which
would be less costly in time and capital. (Fig. 2)
To restore efficiency in terms of updated information with
employment exchanges, employment exchanges should not be passive
dormant units only for the purpose of registration. They need to be more
dynamic - vibrant - kind of professional placement centers.

389
In order to address the issues of unskilled workers more
strengthened, transparent, social security mechanism needs to be
implemented. There should be minimum bindings for employers and
minimum assurance to employees without any kind of legal hurdles.
Fig. 1
Fig. 2
390
GROWTH WITH ENVIRONMENT :
Environmental friendly is not the term restricted to the purpose of
marketing it has now become the core part of Government strategic
actions.
Growth and development Scenario of the last two decades reveal
the fact that the state is worst hit by way of severe depletion and
degradation of natural resources. Government efforts are piece meal in
nature. They are not directly environment centered, not fully integrated,
so as to settle the issues. Therefore there is a need to have clear, specific,
integrated, environment policy binding public as well as the private
sector to adhere to the norms strictly. This may appear costly initially
but ultimate it is to provide multifold advantages. All small, scattered
programmes designed for water management, forest management or
wasteland management be integrated into one exhaustive model which
seeks to address the issues besides generating employment opportunities
at micro level. This in turn will have impacts on quantitative and
qualitative growth.
STRENGTHENING SOCIAL SECTOR :
Social sector is to play crucial rare in reshaping the economy for
future and thereby enabling the state to have strong foundation for
sustainable development.
As long as the state of Gujarat is concerned what is more
important is not only increase in the rate of education, but also the
impacts, "the yields" of education.

391
Three-pronged strategy is required in respect of education and
health.
(i) To inject growth in these sectors through investment in related
infrastructure to protect - sustain the minimum standard.
(ii) To ensure with qualitative delivery, let there be induction of
innovative, professional programmes enhancing the capabilities of
the persons engaged in education, teachers and in the health,
nurse - doctors.
(iii) To have strict monitoring and supervision let there be public
private partnership with NGOS or other related groups.
In order to reshape the future or rebuild the society through
education and health at micro level (grass root) level parental awareness
is required as it saves time and cost. Let there be professional NGOs
intervention be sought.
OTHER AREAS OF CONCERN :
To promote human centric economic growth there are other areas
of concern, which should be taken into consideration while formulating
growth strategy.
Infrastructure is key area where there is plenty of and series of
strategic actions are required. Power is major important sector. There are
three important points to be taken into consideration.
(A) To have stream lined actions through company form
administration, to minimize transmission and distribution (T & D)
loss.

392
(B) If this loss is curtailed it would have its impacts on fuel cost.
Economic charges need to be introduced to motivate the
consumers of different groups to pay the charges regularly.
(C) To have policy of gradual de-subsidization in delivering power
services.
Information technology is also segment of communication.
Gujarat as a state is lagging behind Banglore, Hyderabad, Pune. Let
there be streamlined actions and follow up strategy to be implemented.
Information technology needs to be applied to strengthen development
programmes. There are plenty of potentials to establish transparency and
expedite the process resulting into higher and quicker growth.
Urban infrastructure needs to be paid special attention. As per the
latest statistics, Gujarat has crossed 50% of population as urban
population. Hence qualitative, economic housing facilities, approach
roads, maintenance of vehicular traffic are the major areas where special
attention and special funding is required.
Mainstreaming the gender in development process is a huge task.
In this respect Gujarat is not an exception. Female participation in
promotion of literacy and in major economic activities is required in
achieving overall goals of development. This is precisely required in
case of rural female. Rural female though not indifferent to the
development approaches, are not much responsive. It is because of
illiteracy, poverty and institutional rigidities that they are not found that
much responsive. This has to be addressed soon or later to empower
gender for development.

393
Last but not the least is inter sectoral, inter regional imbalances
need to be addressed as early as possible. Long term, co-ordinated and
integrated actions are required for Tribal belt, Saurashtra and Katchchh
needs special attention in respect of urban poverty and poor
infrastructure. Central Gujarat though considerably prosperous one is
going to be obstacle from intense urbanization point of view.
These are but the major thrust areas and actions required
according to state financing, precisely mobilization of own taxes as
revenue resource and improvement in cost recovery rate is also crucial
one to be considered.
5.4 FUTURE SCOPE :
Gujarat is to enter into Golden Jubilee Year in 2009-10. This
study is summarized one, more general in having a critical look. All
sectors of development need to be studied in isolation and its
interdependence and accordingly master research volume can be
prepared.

394
BIBLIOGRAPHY
395
BIBLIOGRAPHY
A. L. Marty Prof. Jargenson Model of a Duel Economy in Indian
Economic Journal - June, 1965, Page 439
AGB Fisher - Economic Progress and Social Security (1964)
Agriculture in Gujarat - Problems and Prospects - Niti Mathur, S.
P. Kashyap - Economic and Political Weekly, August -
September, 2000.
Ahluwalia and Chenery, "A conceptual Frame work for Economic
Analysis. Redistribution with growth" An approach to Policy (Ed)
H. B. Chenery, J. Duloy and R. Jolly, World Bank Washington
D.C.
Alagh Y. K. Gujarat Economy, Globalization any Fast Trucks,
Pub. in Vishvanidam Gujarati Vol. 16, No. 56-59, 2003 Page 16
to 24.
Amitabh Kundu : Globalizing Gujarat urbanization, Employment
and Poverty" Economic and Political weekly Aug. 26 - Sep. 2,
2000 Page No. 3172 to 3182
Amiya Bagchi, P. Das and S. KI. Chattopadhyay, Growth and
structural change in economy of Gujarat, 1970-2000, Economic
and Political Weekly, Vol. XI No. 28, P. 3029 to 3047.
Archana Dholakiya - "Fiscal Imbalance in Gujarat (28), Non tax
revenues and Subsides in Economic and Political weekly Aug. 26
- Sept. 2, 2000, Page No. 3217-3227.
396
Balkrishna : Regional Planning in India, P. 72-73 Quoted from P.
K. Dhar-7 Indian Economy It's growing dimensions, Kalyani
Publication, Delhi.
Ballerby - Economic Reconstruction, P. 287
Barro Robert J. (1991) : Economic growth in a cross section of
countries, Journal of Economics P. 106-2, May Pg. No. 407-443.
Bhattacharya B. B. and Mitra Arup (1993) "Employment and
Structural Adjustment, A look at 1991 census Data". Economic
and Political Weekly Vol. No. 28, 38.
Cainncross, A.K. : "Factors in Economic Development" p. 229.
Chaudhari K. and M. B. Chaudhary - 1995, Sectoral Linkages and
Economic growth in Asia. Evidence from Granger Casualty Test,
The Indian Economic Journal Vo. 42, Page No. 59 to 75.
Collin Clerk : The conditions of economic progress, 1957.
D. K. Rangnkar Minute of Disscut in Direct tax inquiry
committee final report December 1971, P. 248
Dholakiya Ravindra H-7 "Liberalization" of Gujarat Review of
Recent Experience in Economic and Political Weekly (Aug. 26 -
Sept. 2 2000) Page NO. 3121 to 3124.
Dinesh Awasthi : Recent, Changes in Gujarat Industry Issues and
Evidence "Economic and Political Weekly Aug. 26, Sept. 2, 2000,
Page No. 3183 to 3192
Domestic Product of States of India, 1960-61 to 2000-2001 EPW
Research Foundation, Bombay (2003), Page No. 21 to 33.
Dr. Joshi V. H. : Changing Pattern of Sectoral Behaviour in a
Regional Economy" B. R. Publishing Corporation, New Delhi.

397
Gunnoar Myrdal - Economic Theory and Under developed
Regions, Duckworth London Pg. No. 12 and 34.
Gustav Ranis and John C.H. Fei - "Development of the labour
surplus Economy (Home Wood - III< Richard Irwin - 1964).
H. B. Chenery and Syrquin : "Pattern of Development" 1950-
1970 (London Oxford University Press, 1975).
Hayamy and Ruttan : Agricultural Development in International
Perspective : John Hopkins Ress Page, 132, 1979.
Hirway Indira - Human Development Report and Darshini
Mahadevi, Gujarat 2004. Mahatma Gandhi Labour Institute
A'vad.
Kindleberger : Economic Development : Mcgraw Hill Publication
(1965) pg. No. 18.39.
Level and Pattern of Economic Growth in Gujarat - 109--1994 -
Sudarshan Iyengar - Gujarat Institute for Development and
Research, January 2000.
Lewis Co. : Economic Development with unlimited supplies of
labour : The Manchester School May-1954 - Sinh (Ed.) Economic
of Underdevelopment.
M. L. Jinghan : Economics of Development and Planning -
Konark Publication Pg. No. 1.37.
Malcom Gillis and Others "Economic Development" w.w.Norton
company London (1983) g. No. 3.37.
Mathur Niti and S. P. Kashyap - "Agriculture in Gujarat Problem
and Prospects", Economic and Political Weekly Aug. 26 Sep. 2
2000, Page No. 3137 to 3146.
398
Meier and Baldwin - Economic Development History and Policy
P. 112
Michael P. Todaro : Economic Development in the Third World.
Orient Longman Limited - 4th Edition, Page 114 to 125.
Ninth Five Year Plan Document Draft, Vol. 1, Pg. No. 3.
P. K. Dhar : "Indian Economy" Its Growing Dimensions -
Kalyani Publishers - Delhi, Thirtieth Enlarged Edition, 2005.
Patel Gunvant A. "Gujarat's Agriculture" Oversea Book Traders -
1977.
Paul Strectin First Things First Meeting Basic human needs in
Developing Countries (Washington, 1981)
Recent changes in Gujarat Industry - Dinesh Avasthi, Economic
and Political Weekly - August - Sept. 2000.
Road - Transport and Communication in Gujarat - Arti Nanavati -
Occasional Paper, G.I.D.R. Amdabad, January 2000.
Schultr, T. W. : The State of the Social Sciences (1956) P. 372
Schultz T. W. : Transforming Traditional Agriculture, New
Heaven, Yale University Press 1964
Shah Amita (1986) : "Rural Industrialization in Gujarat" Indian
Journal of Rural Science Vol. 18, No. 1
Shah K. R., "Economic growth and Human Development in
Gujarat Lessons for long term sustainable growth occasional
paper G.I. D. R., January 2000
Simmonkuznets : "Modern Economic Growth Findings and
Reflections - Nobel lecture delivered in Stockholm, Sweden -

399
December 1971 and published in the "American Economic
Review - 63, No.3 (1973).
Simonkuznets - Johnston and Kilby - "Agriculture and Structural
Transformation (1975), Page 111, 203.
Socio-Economic Review, Gujarat State, Reports of 1991 to 2005.
Directorate of Economics and Statistics, Govt. of Gujarat,
Gandhinagar.
Statistical Abstract of Gujarat State - 2002 - Director of Bureau of
Economics and Statistics, Govt. of Gujarat, Gandhinagar.
Statistical Atlas of Gujarat - Volume-1 - Director of Bureau of
Economics and Statistics, Govt. of Gujarat, Gandhinagar, 1982.
Sudarshan Iyengar : Level and Pattern of Economy growth in
Gujarat - 1980-1994, Occasional Paper Series, Gujarat Institute of
Development Research, January-2000.
Suresh D. Tendulkar - "Economic Inequalities and Poverty in
India" in : P. R. Brahmanand and V. R. Panchmukhi (Ed.) P. 128
Tharat S. K. : "Theories of Agriculture Development Trends and
Perspective" Published in "Growth, Industrialization and New
Economic Reform in India". (Ed.) B, Satyanarayan, Page 116,
Concept Publishing.
Trivedi A. B. Kathiawar Economics, Khalsa College, Bombay
1943
V. G. Mankar : "Economic Policy and Planning" New Age
International Publishers (1994).
400
Vakil C.N., D. T. Lakdawala, M.B. Desai = "Economics Survey
of Saurashtra" School of Economics and Sociology University of
Bombay, 1953.
W. Arthur Lewis : "The Theory of Economic Growth"
(Homewood - III, Richard Irwin - 1955).
Zakariah and E. E. Ahmad, 1990, Sources of Industries growth
during the factor decomposition approach" Malaysia 1978-87.
"The Developing Economies", Page 162 to 196
Zweing - "Planning of Free Societies", P. 104