k.s. raot - iitg.ac.in annual lectures/1999 igs annual...5 4 c q) 3 0 q) a_ c ·u; 0 c::
TRANSCRIPT

Indian Geotechnical Journal, 30 (1), 2000
Swell-Shrink Behaviour of Expansive Soils - Geotechnical Challenges
K.S. Subba Raot
Expansive Soils
Expansive soils are found in the arid and semi-arid regions of the world and are in abundance where the annual evaporation exceeds the precipitation. Hot climate and poor drainage conditions are usually
associated with the formation of these soils. The colour of these soils varies from deep black to grey and sometimes even reddish or yellowish.
In India, these soils are generally called as Black cotton soils (or Regur) and cover about 20% of the total land area. They are formed in the states of Maharastra, Madhya Pradesh, Gujarat, Andhra Pradesh, Karnataka and Tamilnadu. Apart from India, Africa, Australia, Israel, USA, Jordan, Ethiopia etc., also possess vast tracts of such soils.
Expansive soils are residually derived from the gneiss, basalt, basic volcanic ash, calcarious aluminum and sedimentary rocks containing calcarious shales, lime stones, slates and sand stones (Humad, 1987). The underlying bedrock of black cotton soil to a large extent is basaltic or traps. Black cotton soil forms due to the subaerial weathering of the basalts in-situ and subsequent admixture of the weathered products with iron and organic matter (Wadia, 1975).
The thickness of these soils varies from 30 em to 15 m, while the composition of the soil shows considerable variation with different depth horizons, especially in its clay content and lime segregation. Wadia (1975) has reported that the clay fraction of black cotton soil is very rich in silica
t .Professor and Chainnan, Department of Civil Engineering, Indian Institute of Science, Ban galore- 560 012, India.
_j

2 INDIAN GEOTECHNICAL JOURNAL
(60%) and iron (15%) with only 25% of alumina. Differential thermal analysis and X-ray diffraction pattern analysis (Roy and Char, 1969; Sridharan and Venkatappa Rao, 1973; Lunkad, 1977; Katti, 1979) have shown that montomorollinite is the predominant clay mineral in black cotton soil. Other clay minerals Illite and Kaolinite are present in smaller quantities. The specific gravity of black cotton soil ranges from 2.7 to 2.9 (Katti, 1975; Sridharan and Venkatappa Rao, 1973; Subba Rao and Satyadas, 1980; Sridharan and Rao, 1982).
Field Movements
Soils of expansive nature are problematic to the civil engineering structures because of their large volume changes due to the variations of water content. During rainy season, the soil within the active zone heaves and during summer season, it shrinks. Soil heaves even if the moisture ingress were to take place due to other environmental changes like leaks in plumbing work, drainage, lawn irrigation etc., or if any stress release were to take place. Similarly, soil shrinks if moisture content were to reduce due to climatic effects, withdrawal of water by tree roots, local heating due to central heating systems, such as boilers, furnaces etc.
The field observations made by several researchers under uncovered areas (Aitchison and Holmes, 1953; Holland and Lawrence, 1980) and under covered areas (Dinesh Mohan, 1958; Johnson, 1980; Justo et a!., 1985; Trevisan, 1987; Retmal et a!., 1987; Xinfang et al., 1987; Sorochan, 1991) have established the cyclic upward and downward movements of expansive soils due to alternate wetting and drying cycles.
Some typical field movements are shown m Figs.!, 2 and 3. The
180
140
'E E 100 ., > "' ~ 60
7.2 m diameter sand blanket~
7.2m diameter rBare:,::~.=.--:-...:::.-:..::: __.....-. .;r" :·- .._.. . ~
I',..--'-.._ f / 10.8 m diameter GAP cover
i/ {\ .................. . ........ ·;' ·1 / \"\ ~Open field(natural grass)
.. --< .>,>·-· '/ / .... · ( ~~ '--'; \ l' rx: !/ \ , ----~.~---...., \
1964
/ {'- } "J \ 1965 1966 1967
Time (years) 1968 1969 1970
FIGURE 1 Movements of the Ground Surface under Various Conditions of Surface Cover (Williams and Pidgeons, 1967)

SWELL-SHRINK BEHAVIOUR OF EXPANSIVE SOILS 3
20~------------------------------------.
c:~
"' E ~ E >-0
:a -1 0
No. 7
8 12 4 8 12 4 8 12 4 8
~ 74--1--- 75 ----+-- 76 ---1---77 ----+--
Time (month, year)
FIGURE 2 Foundation Movements with Time (Haung Xiling, 1987)
6 .§.
10
-10
c -20
~ o-o-o-o-o l\.1d I ( 17 kNhWI
8 C-Q.Q.Q.Q Pild 2 (17 kN1m 2)
] -30 ~&A -6.-11 P.o.d 3134 kN/rnl)
~ )f-,Mo--M-1(~ Pild-I(GllN/m~)
--10
-50
1988 l':H!9 1990
FIGURE 3 : Seasonal Movement of lm Square X 2m Deep Loaded Pad Foundations (Freeman et a!.)
observations indicate the ground movements and also the foundation movements recorded over some years. The ground movement cycles generally correlate with variations in rainfall and evaporation. Depending upon the depth from the surface, time lag occurs for swelling with precipitation and shrinkage with evaporation. The behaviour of foundation soil is observed to be similar to that of soils under covered areas. The ground movements decrease with increasing depth and are confined within the active zone depth, which usually varies from 4 to 6m.
When an expansive soil is used as a construction material or as a foundation base, it could be subjected to either swelling or shrinkage first, depending on the period of construction activity. If construction

4 INDIAN GEOTECHNICAL JOURNAL
80
SAMPLE NO. 80.141
·s ... 0 60 :E 01 ·a; ~
~ 0 0 ~ 0
t 40 01 c .,
JC;
0 c ~
c ~. 0
0 ~I e ::1 i I -;; 20
~ 0 ~
a
0 0 2 3 4
No. of Drying and Rewettlng Cycles
FIGURE 4 : Effect On Drying and Re-Wetting on the Ultimate Moisture Content of Ottawa Clay (Warkentin and Bozozuk, 1961)
activity were to start after the rainy season, the initially moist soil would be first subjected to shrinkage during the dry season. Subsequent to drying, the shrunken soil will experience wetting during the rainy season, so that the sequence is drying- wetting process. On the other hand, if construction activity were to start in the dry period, the resulting sequence would be wetting-drying process. The overall movements depend on how the sequence gets started.
The extent of vertical movement varies depending upon the location of the point from the surface, type of soil, whether covered or not, surcharge imposed on it, etc. These movements would be occurring over a range, which remain steady and would be in equilibrium under a particular environment. When this steady state is altered. through climatic changes or through other

5
4
c Q) 3 0 Q)
a_
c 0 ·u; c:: <tl c. X w 2
0 0
SWELL-SHRINK BEHAVIOUR OF EXPANSIVE SOILS
Clay stone soil sample Sample saturated to allow full expansion, then desiccated lo initial moislure content (11.5%), lhen allow full expansion again
2 3 4 5
Number of cycles of wetting and drying
FIGURE 5 : Fatigue of Swelling (Chen, 1965)
5
6 7
means like, when a structure is built over the soil, involving activities like excavation, loading, etc, the soil foundation system will again have to reach a level of equilibrium. This normally takes place over a few seasons.
Earlier Laboratory Investigations
Controlled laboratory tests on soil specimens have great advantage in throwing light on the swell-shrink behaviour of expansive soils, since they afford parametric studies. Earlier studies made by Warkentin and Bozuzuk (1961), Chen (1965) and Ring (1966), showed that the soils when subjected to cyclic wetting and drying showed signs of "'fatigue" after each cycle. The net decrease in the swollen volume of the specimen becomes smaller and smaller with each cycle and after a few cycles the swollen volume reaches a steady state.

22 r-------------------------------------~
21 1-
20 1-
o-c, Moulded at optimum moisture 6-6 Moulded air dry (compacted) o-o Moulded air dry (loose)
19,,~
- t '-...... a--...._ o-~18 "'-a-a---~ ----" --8 17 "' Q_ >J)
-~ 16 0
I 15 v\ ~ ----6~6----6~. 14 6 r:.
13 ~o~o/o~c_...--o----.___o_...--o----.___,,, 12 1-
11 0 _l_ I
0.5 2 1.5 2.5 3 3.5 4
Number of cycles
24
23
22
21
20
E" .s 19 c:
"' E G 18 "' 0.
"' ·g 17
0
.g, 15 ;;; I
t5
14
13
12
11 0 0.5 1.5
o-o Moulded at optimum moisture 6-6 Moulded air dry (compacted) o-n Moulded air dry (loose)
2 2.5 3 3.5
Number ol cycles
4
FIGllRE 6 : Height Changes under Alternate Wetting and Drying under 0.25 psi Surcharge Specimens of Cecil and Iredell Clay (Ring, 1966)
0\
z 0
~ 0 m 0 -' toi G ::r: z ;:=;
f:: 0 c ;;<) z ~

SWELL-SHRINK BEHAVIOUR OF EXPANSIVE SOILS 7
Warkentin and Bozozuk dried the specimen to particular water content, swelled it fully and did the cyclic tests maintaining the shnmken water content constant. Fig.4 shows the results. Chen allowed full expansion and desiccation to initial moisture content in each of the cycle (Fig.5). In the experiments conducted by Ring (Fig.6), the specimens were allowed to fully swell and fully shrink in each of the cycles from initial air-dry conditions.
Following the above initial studies. a number of researchers have conducted alternate wetting and drying experiments. Laboratory investigations fall into two groups depending on degree of shrinkage experienced by the expansive soil specimens during drying. One group of researchers (Chu and Mou, 1973; Chen and Ma, 1987: Subba Rao and Satyadas, 1987; Al-Homoud et al., 1995) performed partial drying experiments by restricting the expansive soil specimens to shrink to pre-determined levels of moisture content or specimen thickness. The other group of investigators (Popescu, 1980; Osipov et al., 1987: Dif and Bluemel, 1991: Day, 1994) fully shrunk their expansive soil specimens. These laboratory investigations suggested that by repeatedly subjecting the expansive soil specimens to full swelling-partial shrinkage cycles. their vertical swell potentials reduce to less than half of their ascompacted values. Comparatively. exposure of expansive soils to full swellingfull shrinkage cycles can almost double their swell potentials. In both the cases, the vertical swell potentials reached an equilibrium state after about three to five cycles. However, certain initial conditions prolong the number of cycles needed for equilibrium stage. For a black cotton soil (BC) specimen of initial water content 15% and void ratio 1.127. the movements did not stabilise even after 10 cycles (Satyadas. 1982) as seen in Fig. 7. Full swelling and partial shrinkage experiments conducted by Mahesh Kumar ( 1998). showed that black cotton soil having initial conditions of Yd = 1.28 Mg/m3
• w = 23.4% and S,=57%, (point on the dry side of standard proctor compaction curve) required 15 cycles to equilibrate (Fig. 8).
Scope
The codal stipulations (IS:2720 Part 41-1977, ASTM Designs D 4546-90) mention that the laboratory experiments need to simulate the soil specimens to cyclic wetting and drying process, prior to evaluating the swell potentials under the anticipated foundation pressures.
In order to better understand the behaviour of expansive soils, it becomes necessary to examine how the soil undergoes the swell-shrink movements, the details of movements like the highest swollen level and the lowest shrunken level and the equilibration bandwidth. which is the movement between the swollen and shnmken states at equilibrium. It is also necessary to know how the initial placement conditions. the swell-shrink patterns and the surcharge levels affect the swell-shrink behaviour.

8
23
22
E' ~ 21 a. E
"' U)
0
0
0 0
0
~ 20 <IL-l-1--+'-4+'iD :c
19 1-
0
18 - 0
17 0 2
INDIAN GEOTECHNICAL JOURNAL
0
0
4
Surcharge=5 kN/m 2 (nominal)
Initial w= 15%
Initial e-1.127
Shrunk at 50°c and cooled for 24 hrs. before adding water
0 0
0 0
I
6 8
0
Original level -1+---t+ -il+-+f---
0
I
0 ~ 1<4---~
0 0 0 ()
10 12 14 16 18 20 22 24
Number of cycles
FIGURE 7 : Swell-Shrink Behaviour of BC Soil Showing Large Number of Cycles to Reach Equilibrium under Full Swelling-Full Shrinkage Pattern
(Satyadas, 1982)
7 -------·
rv A6 (Initial yd= 1.28 Mg/m3
• w=23.4%, S,=57%) 6
'V
5 'V ~
:r:-'V :r: 4
<l.. 'V c Q)
3 E Q) (.)
"' D.. 2 "' '6 (ij .g a; >
0 2 3 4 5 8
Number of cycles --FIGllRE 8 : Swell-Shrink Behaviour of BC Soil Showing Large Number of Cycles to Reach Equilibrium under Full Swelling-tOO% Shrinkage Patter·n
(Mahesh Kumar, 1998)

SWELL-SHRINK BEHAVIOUR OF EXPANSIVE SOILS 9
In the laboratory experimentation, one has to choose appropriately the swell-shrink patterns in the test. based on the knowledge of the field suction or moisture content variation with depth. Soil can be expected to experience full swelling in the field atleast in the top layers. However the shrinkage of soil in the field rarely goes unhindered to its full value except during a prolonged drought period. With depth, the most likely patterns will be partial swelling and partial shrinkage in each cycle. However for convenience and also to obtain the conservative estimate of swell potential, the patterns that are adopted are (i) full swelling-full shrinkage and (ii) full swelling-partial shrinkage.
It is known that soil will primarily heave in vertical direction in the field, as lateral swell is restricted by the adjacent soil mass (Jennings and Kerich, 1962). However the above may not be true for (i) expansive soils that undergo severe fissuring on drying, (ii) soils in slopes and (iii) retaining wall structures subjected to lateral pressures (Grarnko, 1974). Accordingly, to make the laboratory swell measurements relevant to all field situations, laboratory swell data are analysed both in terms of vertical and volumetric strains.
It will be of interest to know how in each cycle at the swollen or shrunken level, the moisture content and dry density values vary, also how the shear strength varies with cycles. These studies together with time rate of development of swelling or shrinkage will help in answering the reversibility or otherwise of swelling and shrinkage process. From the results of extensive investigations on the laboratory compacted specimens, started at IISc, some 20 years ago, the basic issues in the swell-shrink behaviour of expansive soils will be addressed in the following sections. Besides, the widely used method of cushioning the expansive soil with a cohesive non-swelling soil (CNS) layer will also be critically examined.
Generalised Movement Modes
The nature and extent of vertical movement depend on several factors like the type of soil, whether covered or not, surcharge imposed o.n it, depth of the point from the surface, climatic condition etc. Xiling (1987), in a broad sense classified these movements into three categories:
i) Uprising
ii) Descending
iii) Uprising -- descending
However, for in-depth understanding of the cyclic behaviour of expansive soils, five modes have been suggested here based on extensive

10 INDIAN GEOTECHNICAL JOURNAL
laboratory investigations and on careful study of field movements. The suggested five classifications are shown in Figs.9 to 13, herein called types A, B, C, D and E. Out of these five modes two modes refer to the uprising and another two refer to the descending modes.
The nomenclatures used in these figures are as follows.
l. Highest Swollen Level: lt is the highest level to which the specimen swells in any of the swell-shrink cycles.
2. Equilibrium Swollen Level: It is the swollen level recorded at equilibrium state, which usually occurs after a few swell-shrink cycles.
3. Equilibrium Shrunken Level: It is the shrunken level of the specimen at equilibrium state, which usually occurs after a few swell-shrink cycles.
4. Operating Middle Level: It is the middle level between equilibrium swollen level and equilibrium shrunken level.
5. Equilibrium Bandwidth: It is the bandwidth of vertical displacement at equilibrium state between equilibrium swollen level and equilibrium shrunken level.
6. Initial Reference Level: It is the initial level of the specimen with respect to which all measurements are made.
7. Lowest Shrunken Level: It is the lowest level to which the specimen shrinks in any of the swell-shrink cycle.
8. Operating Di.,placement: It is the level difference between operating middle level and initial reference level.
9. Extreme Di.1placement: It is the extreme vertical displacement recorded by the specimen.
In type A mode (Fig. 9), the initial reference level is below all other levels. In type B mode (Fig. I 0), the lowest displacement level is below the initial reference level, but all other levels are above the initial reference level. In type C mode (Fig. II) the initial reference level falls within the equilibrium bandwidth. In type D mode (Fig.l2) the highest displacement level is above the initial reference leveL but the equilibrium swollen level will be below the initial reference level. In type E mode (Fig. 13 ), The initial reference level is above all the other levels.

SWELL-SHRINK BEHAVIOUR OF EXPANSIVE SOILS
20 ,-------------------------------------------------------,
18
16
t 14
§ <! 12 c -~ " 10 ~ a. ~ 8 n; " ~ 6 >
4
2
Highest swollen level
__J'
•
Initial reference level
2 3 4 5 Number of cycles
EQuilibrium swollen level
6
Equilibrium shrunken level
(Lowes! shrunken level)
Operating
displacement (+ve)
7 8 9
l E
~ g ii
" E
~ w
10
FIGURE 9 Swell-Shrink Movement (Type A), with All Movements above the Initial Reference Level
~
~ c ., E ., 0
"' a. en '0 n; " 1: ., >
.40 ,--------------------------------------------------------,
Highest swollen level
_ _.I
30
20
• 10
r Operating displacement (+ve)
0
-------- -- Lowest shrunken level
0 2 3 4 5
Number of cycles
Equilibrium swollen level
EqulUbrlum shruken level
Initial reference level
6 7 8 9
c . E . ~ g ;; . i w
10
11
FIGURE 10 Swell-Shrink Movement (Type B), with Equilibrium Bandwidth above the Initial Reference Level

12
t ~
INDIAN GEOTECHNICAL JOURNAL
20.------------------------------------------------,
10 Highest swollen level
Equilibnum swollen level
• ' .
• Lowest shrunken level and equilibrium shrunken level
Number of cycles
l' . E
~ Operattng , ~ 'i displacement (-ve) 1 l
--4--- Y-- --~ • .0 T E
~ w
I .L_
FIGllRE ll Swell-Shrink Movement (Type C), with Equilibrium Bandwidth Spread over the Initial Reference Level
10.--------------------------------------------------,
-10
__ Highest swollen level
-·~-
Initial reference level
I L
Equilibrium swollen level
ing middle tovel
. ------· .,·
~
'5 j
" c ~ E 2 g 5 " w
'~ Operating
displacement
Lowest shrun6(en level and eqUilibrium shrunken level
Number of cycles
_i
FIGllRE 12 Swell-Shrink Movement (Type D), with Equilibrium Bandwidth Entirely below the Initial Reference Level

SWELL-SHRINK BEHAVIOUR OF EXPANSIVE SOILS
0 ......... ,
-5
~
f-10 ~ QJ
E
~ li ~ -15
"(; ·e " >
-20
Highest swollen level initial relcrence level
•
l.At~r~= •----· -.---•--'--
1
Lowosl shrunken and equilibrium shrunken level
Number of cycles
• r E . E ~ • ~ '5
" 0
·~
li 0
13
FIGURE 13 Swell-Shrink Movement (Type E), with All Movements below the Initial Reference Level
The swell-shrink behaviour of any soil can span across all types of modes A to E, depending on several factors like the initial conditions, surcharge levels, swell-shrink patterns etc. A dense system with low initial water content usually show Type A mode. If the surcharge level is so high as to suppress the swell potential, Type E mode will result. For the same density, if the initial water contents were to increase, mode can change from A to C. Similarly, a change from mode C to E can be ~chieved J?y changing the surcharge pressure.
In design and performance of foundations in expansive soils or earth structures on expansive soils, a clear understanding of different modes and all levels of movements become necessary for any rational design. As of now this is a domain of considerable uncertainty.
Equilibrium Bandwidth
The results of cyclic experiments are plotted in terms of vertical displacement (%), defined as ~H/Hi , where ~H is the change in thickness of specimen from the as-compacted state to the swollen or shrunken state during the first cycle of wetting or drying. During the subsequent wetting and drying cycle ~H refers to the change in the height from the swollen state to the shrunken state or from the shrunken state to the swollen state of the specimen. The denominator Hi is the initial (as-compacted) placement thickness of the specimen.

14 INDIAN GEOTECHNICAL JOURNAL
Some of the results are also analysed in terms of volume change (%), defined as /:!e / (I+ e J , where, Ae refers to the change in void ratio during each swelling or shrinkage cycle and e
1 is the initial or as-compacted void
ratio of the specimen.
To illustrate the concept of bandwidth, Fig.l4 plots the variation of the vertical displacements with time during each swelling and shrinkage cycle of an expansive soil specimen subjected to alternate cycles of wetting and drying in the laboratory. It can be seen from this figure that the vertical movements of the specimen vary initially during the first two cycles of wetting and drying. After four cycles of wetting and drying. the movements operate between near constant limits. This movement during '·equilibrium" state is termed as the 'band width'. The results of swell-shrink experiments can also be plotted as shown in Fig.l5. Fig.l5 plots the maximum vertical displacements at the end of each swelling and shrinkage cycle. Examination of Fig.6 also clearly brings out the equilibrium movement state and the existence of bandwidth. However, the earlier focus was only on phenomenon of fatigue.
Subba Rao and Satyadas (1987), Al-Homoed et al. (1995), based on their experimental investigations confirmed the existence of bandwidth of an expansive soil subjected to alternate cycles of full swelling and partial shrinkage. Subba Rao and Satyadas ( 1987) allowed the laboratory compacted soil specimens to swell fully but controlled during each cycles of drying the shrinkage magnitudes to different percentages of the first swollen height, viz., 25, 50 and 75%. The magnitude of bandwidth was observed to reduce with decrease in the amount of drying.
·--------------
Number of days
e• -r
•
FIGURE 14 Typical Plot of Vet·tical Displacement with Time Dudng Each Wetting and Dt)'ing Cycle

SWELL-SHRINK BEHAVIOUR OF EXPANSIVE SOILS
lOr-------------------------------------------,
~
SW- SWELLING, Sll- SHRINKAGE
• ::c <l 5
L! (ij
-~ Q)
>
-5 l sw 0
• • 3
Number of cycles
• •
FIGURE 15 Typical Plot of Vertical Displacement during Wetting-Drying Cycles
5
15
To examine the influence of variations in the initial dry density and compaction water content on equilibrium band width, Subba Rao et a!. (1998) selected three soils, with liquid limit of 64%, 75% and 103% respectively. Compacted specimens were prepared with a wide range of initial dry densities and molding water contents. At each compaction water content, the initial dry densities of the specimens were varied. From water contents so chosen for each soil, the specimens were statically compacted into standard consolidation rings to a thickness of 13 .5mm. The ~pecimens were allowed to swell under a surcharge of 6.25 kN/m2
. The modified oedometer assembly had provision to maintain an elevated temperature of 40°C during each drying cycle. Each cycle comprising of full swelling and full shrinkage took 5 days (2 days for wetting and 3 days for drying). During each wetting part of the cycle, the shrunken specimen regained its original diameter (76mm) with closure of shrinkage cracks. The vertical displacements of the soil specimens became nearly constant after 3 or 4 cycles of wetting and drying. The cyclic experiments were hence terminated after four and half cycles.
Figure 16 plots the equilibrium bandwidth for a wide range of compaction water contents and dry densities. Figure shows clearly that the bandwidth is unaffected by the initial compaction conditions of the specimens. However higher the liquid limit of the soil, higher is the equilibrium bandwidth. Tests were also conducted with higher surcharge pressures. As expected the equilibrium bandwidths were reduced with increase of surcharge pressure. Fig.17 shows the relationship.

16 INDIAN GEOTECHNICAL JOURNAL
SOIL TYPE COMPACTION
Surcharge pressure = 6.25 kPa WATER CONTENT %
30
0 W L = 75% 10 to 38 Full swelling-Full shrinkage • w l =103% 13 to 38 6 W L = 64% 19 to 32
f.- • ,t. • • •• • • 0 o~o en rj:.Doo © 0 0
Of-6 .6 66 6 6
0 t t I I I I I I
1.0 1.1 1.2 1.3 1.4 1.5 1.6 1.7 1.8 1.9 2.0
As- compacted dry density, Mg/m3
FIGURE 16 Comparison of Equilibrium Bandwidths for Soils with Different Liquid Limits
,--,--...,....------,----------------Surcborce pressure
kP•
50
6.25
50 100
200
Liquid limit (w L). %
100 110
FIGURE 17 Effect of Liquid Limit and Surcharge Pressure on Equilibrium Bandwidths of Expansive Soils
The equilibrium bandwidth gets established even under full-swelling and partial shrinkage cycles. However, the magnitude of bandwidth is affected by the amount of drying allowed during each shrinkage cycle. Results of Gangadhara (1997) are shown in Fig.l8. A bandwidth of 16% under full shrinkage conditions reduces to 4% for partial shrinkage, with water contents at shrunken levels maintained at 20%.

SWELL-SHRINK BEHAVIOUR OF EXPANSIVE SOILS 17
40 .. --.. wa"icrcon!Cn"i-aft-;;;- ------------each shrinka e % w, ....::75~/0
As-compactoa y,=I 33 Mglm 1, w-~26% 0
·-'-"-"-''-'-.::..= L Ill sw I Ill SH I IV sw I IV SH I v sw I 0 2 3 4 5
Number of cycles
FIGURE 18 Full Swl'lling-Partial Shrinkage Cyclic Experiments with Three Levl'ls of Shrinkage
To study the effect of sequence of wetting and drying process (i.e., either swell-shrink pattern or shrink-swell pattern) on the equilibrium band width values, experiments were performed by Gangadhara (1997) on two soils (wL = 75% and 103%) under two surcharge pressures of 6.25 kN/m2 and 100 kN/m2
. He chose two compaction water contents and two dry densities for each soiL Full swelling and full shrinkage was adopted in each cycle. His results showed that even when the testing was changed to shrink-swell pattern, the equilibrium bandwidth gets established in just about the same number of cycles and the bandwidth is unaffected by the initial placement conditions. Fig.l9
w~.=75%
As.compacted y,f'"l.33 MglmJ, w-=-26%
\~(;«X<X f 1 0 0 0 ----
1
·10
-200[--j__-+--...L---_!-----'--+----''----____jc----__J __ ___L _ __J
Number of cydes
FIGURE 19 Comparison of Swell-Shrink and Shrink-Swell Bandwidths

18
40
~
.,-+
:,:::: " :2. "' Ol c
"' .s::: u u ·;:: Q)
-10 E ::J
0 > -20
-30
INDIAN GEOTECHNICAL JOURNAL
As-Compacted Band
f--+---y'-'-,,-~"-~~-~T i~~ -- :~~~,'/, 1.33 . I' 32.4 48.43 1.52
I SWELL
0 3 Number of cycles
wL= 75% S11rtharge p~ssure = 6.25 k.Pa
0
FIGURE 20 Variation of Volumetric Change with Cycles for Soil of W1=75%
l!! :::;. .. +
.... ~
~ -"' u
40
I SWELL I SHlUN Ji. n SWEll.
0 I
w, = \03% SIUcbarge pressure= 6.2S ~~
FIGURE 21 Variation of Volumetric Change with Cycles for Soil of W1=103%
shows a typical result. The equilibrium bandwidth remains at about 15% under 6.25 kN/m2 for both wetting-drying and drying-wetting patterns. Under I 00 kN/m2
, the bandwidth value is about 9%.

SWELL-SHRINK BEHAVIOUR OF EXPANSIVE SOILS 19
• compaction w=33% 25 • Compaction w=26%
... Compaction w=21%
• Compaction w=10%
20
~ ~
c 15 Q)
E Q) ()
"' 0.. U)
0 10 Ol c
~ Q) 0.. 0
5
-5
1.2 1.4 1.6 1.8 2.
As-compacted dry density (Mg/m 3)
FIGURE 22 Effect of Initial Conditions on the Operating Displacement for Soil of W1 = 75%
Gangadhara ( 1997) also analysed the results in terms of volumetric change, ~e/(l+e;), where ~e is the change in void ratio during each swelling or shrinkage cycle and e, is the initial or as-compacted void ratio of the specimen. Even in this case, a bandwidth exists as can be seen in Figs.20 and 21. However, the uniqueness associated with vertical displacement is not found here, in that the volume change is influenced by both the placement density and water content. The reason can be attributed to the reduction in cross sectional area, which the sample undergoes in each drying cycle. Tests conducted by Gangadhara ( 1997) have shown that larger the reduction in cross sectional area, larger would be the volumetric swell potential upon wetting. In contrast, the cross

20 lNDIAN GEOTECHNlCAL JOURNAL
30
• Compaction W=13.0%
• Compaction W=20.6%
• Compaction w=27.6%
20 •
~ ~
c a.> • E a.> u <ll n. If) 10 6 Ol .!: 1§ a.> c. 0
0
1.1 1.2 1.3 1.4 1.5 1.6 1.7
As-compacted dry density (Mg/m3)
FIGURE 23 Effect of Initial Conditions on the Operating Displacement for Soil of W1 = 103%
sectional areas of the specimen do not influence the vertical swell potentials.
Operating Displacement
When soil specimen is subjected to wetting and drying, the differences in the magnitudes of vertical displacements in the initial cycles will cause the specimen a permanent change in the operating middle level. The operating displacement could be either positive or negative depending upon the mode of swell-shrink behaviour. Further there is no uniqueness as found for equilibrium bandwidth. The relationship between operating displacement and

~
~ e._ c Q)
E Q) 0 co a. (/)
'0 Cl c: ·~ ~ a. 0
SWELL-SHRINK BEHAVIOUR OF EXPANSIVE SOILS
15 r-----------------------------------------,
10
5
0
1.3
• Compaction W=28.5%
Compaction W=22.5% 6 Compaction W= 19.5%
0
c
1.4 1.5 1.6
As compacted dry density (Mg/m3)
1.7
21
FIGURE 24 Effect of Initial Conditions on the Operating Displacement for Soil of W1 = 64%
the initial compaction conditions of the soil are shown in Figs.22, 23 and 24 for the three soils (Gangadhara, 1997). The plots clearly demonstrate a linear relationship between operating displacement and as-compacted dry density. For any particular compaction water content, the operating displacement increases with increase in the as-compacted dry density. The figures also suggest that for high as-compacted dry densities and low water contents, type AlB mode of swell-shrink behaviour would result, for which operating displacement is positive. Similarly, for low as-compacted dry densities and high water content, type DIE mode of swell-shrink behaviour will result for which the operating displacement is negative.

22 INDIAN GEOTECHNICAL JOURNAL
Invariant Swell Potential
What has been observed in the earlier results is that the swelling potentials vary from cycle to cycle till they reach equilibrium level. Most generally, the swelling potential during the second cycle (swelling after first shrinkage) is usually the highest if the specimen is on the dry side of optimum, thereafter the potentials gradually decrease and become steady. The difference in the potential from the first cycle to the last cycle was not insignificant.
t I
1.9r---------------------------------------------~
20
\ I
''A11 • ,, \
\
25
Modified Proctor
~Zero Air Voids Line
83% Saturation Line
A7
30 35 40 45 50
Water content (%) ----+
FIGURE 25 : Placement Conditions of the Specimens Selected for the Study of Invariant Swell Potential with Cycles (Along 83% s. Line)

SWELL-SHRINK BEfiA VI OUR OF EXPANSIVE SOILS 23
It would be interesting to find if a compaction state exists for which the swell potential remains unaltered with cycles. For this purpose, a search was made (Mahesh Kumar, I 99S) at the maximum dry density level of 1.44 Mg/m3 by changing the water content level. Apart from specimen A3, two more specimens (A2 and AS) were chosen as shown in Fig.25. The tests were conducted with chosen patterns of full swelling and I 00% shrinkage in each cycle. In other words, the specimens were shrunk back to the initial height in every cycle. For specimen A2 it was not possible to conduct full swelling-! 00% shrinkage tests, since from the second shrinkage cycle itself, the full shrinkage band was more than the specimen height. Specimen AS is seen to give the desired result (Fig.26) of the same swelling potential in each of the cycles. The initial degree of saturation corresponding to the specimen AS is S3%. As a continuation of this search it was felt desirable to check whether the specimens having the degree of saturation of S3% would behave in a similar fashion. So two more specimens were selected, specimens A9 and A I 0. Specimen A9 is on the standard compaction curve itself. A I 0 has still lower dry density and higher water content. Very interestingly, both the specimens A9 and A I 0 showed the consistency of swelling potentials with cycles as seen in Figs.27 and 2S. As expected, the magnitude of swelling was the least for specimen A I 0 on account of its least dry density and highest water content. It is to be observed that all the three specimens AS, A9 and A I 0 are on the S3% saturation line but have the dry density equal to or less than standard Proctor maximum dry density. To check whether or not this behaviour is observed even for specimen
1 AS (Initial yd= 144 Mglm.l, w=27.1%, Sr-=83%)
4
Number of cycles -
FIGURE 26 Specimen AS Showing the Same Swell-Shrink Movements In Each Cycles (Full Swelling- 100% Shrinkage)

24 INDIAN GEOTECHNICAL .JOURNAL
8~--------------------------------------------~
l
c OJ E OJ u ro (i V)
u (ij u 't OJ > 1
A9 (Initial YJ~ 1.41 l\1g/m ', w=28.5%, S,~8J%)
0 2 3
Number of cycles --+ 4
FIGURE 27 Specimen A9 Showing the Same Swell-Shrink Movements in Each Cycles (Full Swelling- 100% Shrinkage),
AIO (Initial: yd= 1.36 Mg/m3, w=30.5%, S,=83%)
•
0 2 3 4
Number of cycles --+
FIGURE 28 Specimen AlO Showing the Same Swell-Shrink Movements in Each Cycles (Full Swelling- 100% Shrinkage)

SWELL-SHRINK 81-ili\VIOUR Or EXPANSIVE SOILS 25
[------------------ --· ---------
16F All (Initial: yd= 1.54 Mg/m3, w=23.4%, S,=83%)
l X
t!fw I ::r: <l
c "-' E "-' u Ctl o_ U)
'6 Cli u ·-e X "-' >
2 3 4
Number of cycles ____.
FIGURE 29 Swell-Shrink Movement of Specimen All under Full Swelling- Full Shrinkage Conditions
having dry density higher than the Proctor maximum dry density, one more specimen A 11 was chosen corresponding to dry density equal to 1.54 Mg/m3 and water content 23.4%. Fig.29 shows that this specimen could not be subjected to I 00 % shrinkage at all. It therefore appears that for any given soil there will be a set of compaction states for which the cyclic swell potential remains unaltered with cycles of full swelling and I 00% shrinkage. For the chosen soil with wL = 72%, this state correspond to dry density of 1.44 Mg/m 3 or a little lower and degree of saturation of 83%.
Shear Strength Variation
Mahesh Kumar ( 1998) selected different compacted specimens to study basically how the density and water content vary with each cycle. The time readings associated with specimens A I, A3 and A6 are shown in Figs.30, J I and 32. It is clear from these figures that the time development curves differ widely until equilibrium state is reached, which in this case happens beyond fifth cycle for A I, sixth cycle for A3 and beyond fifteenth cycle for A6. Once the equilibrium is reached the swellshrink time curve will repeat itself.
Figures 33 and 34 show the variation of water content at swollen and shrunken states for specimens A3 and A6 respectively. Similarly, Figs.35 and 36 show the variation of dry density at swollen and shrunken levels

26
,...._
~ 2f :r:: <l
c Q}
E Q} 0 co 0.. <J)
'6 ro 0 ·-e Q}
>
30
28
26
24
22
16
14
12
10
8
6
INDIAN GEOTECHNICAL JOURNAL
AI (Initial: YcF 1.62 Mg/m3, w=23.4%, S,=94%)
o-o 1 ' 1 cycle •-• 2"d cycle 6-6 3rd cycle A-A 4" cycle o-o s" cycle
Time (minutes) ------+
FIGURE 30 : Swell-Shrink-Time Curves for Specimen AI
for A3 and A6. At swollen states in each of the cycles, the degree of saturation was found to be I 00%. rt is interesting to observe that alternate wetting and drying would induce (for the specimens on the dry side of optimum) an increase in trend of dry density at swollen states till equilibrium is reached. The water content shows the reverse trend. On the contrary, the shrunken states with cycles show a decrease in trend of water content after the first desiccation. Such variations will have practically important bearing on the shear strength of expansive soils with cycles. As it was difficult to conduct shear tests directly on the oedometric samples

,-...
~ t2 ::r:: <l
c Cl> E Cl> u ttl
Q._ (/)
:0 (ii u '2
Cl> >
SWELL-SHRINK BEHAVIOUR OF EXPANSIVE SOILS
6.-------------------------------------, A3 (Initial: yd= 1.44 Mglrn3
, w-=29.5%, S,=90%)
o-o 1 51 cycle •-• 2"d cycle
5 ll-ll 3rd cycle 4-4 4., cycle o-o st\ cycle
•-• 6., cycle
4
3
2
Time (minutes) -~
FIGURE 31 Swell-Shrink-Time Curves for Specimen A3
27
undergoing swelling and shrinkage, Mahesh Kumar ( 1998) conducted the same tests on reconstituted soil specimens.
Vane shear tests were conducted by him at the swollen states and triaxial UU tests at shrunken states. Tables I and 2 give the dry density and moisture content values at swollen and shrunken states for A3 and A6 samples. The specimens reconstituted to the values of dry density and water content corresponding to swollen states shown in Tables I and 2 resulted in vane shear strengths as shown in Figs.37 and 38. It must be mentioned here that the

28
t ~
~ ~
::r:f --::r: <l
c Cl.> E Cl.> '-' C1l a. (/)
'6 co '-' ·-e Cl.> >
INDIAN (iFOTECHNICAI JOURNAL
Sr-----------------------------------------.
7 -
6
5
4
3
2
A6 (Initial yd= 1.28 Mg!m3, w=23.4%, S,=57%)
o-o 1 '' cycle CJ-CJ 11" cycle
•-• 2nd cycle +-+ 12"' cycle
6-6 3ru cycle Jo:-A 13'' cycle
..1.-..1. 4 h cycle x-x 14" cycle
o-o Sh cycle •-• 15h cycle
Time (minutes) ....
FIGURE 32 Swell-Shrink-Time Curves for Specimen A6
swollen level water contents are far less than liquid limit water contents, roughly close to 50% value. So, even though the degree of saturation is I 00% at swollen level, specimens will still have significant shear strength. Figs.39 and 40 show typical deviator stress-strain responses for the reconstituted shrunken specimens. It can be observed very clearly from the figures that the shear strength varies considerably over the cycles till an equilibrium state is reached. The shear strength parameters c" and 'Pu obtained for all the specimens in each of the cycles of shrinkage are shown in Tables 3 and 4. As expected, the shrunken states will have very high shear strength levels.

SWELL-SHRINK BEHAVIOUR OF EXPANSIVE SOILS 29
45
•-• A3 (Initial yd= 1.44 MglmJ, w=29.5%)
40
I 35
;e ~
c Q) 30 c 0 (.)
Qj iii
25 ~
• 20
0 2 3 4 5 6 7
Number of cycles ---..
FIGURE 33 Water Content Variation with Number of Cycles for Specimen A3 (Full Swelling- 100% Shrinkage)
50r----------------------------------------------------.
45
35
c: <1> 30 c: 8 E ~ 25
20 r--
'V-'V A6 (Initial: 'YJ = 1.28Mg/n~ w = 23.4'7r.)
v
10 11 12 13 14 15 16 17
Number of cycles ____..
FIGURE 34 Water Content Variation with Number of Cycles for Specimen A6 (Full Swelling- 100% Shrinkage)

30 INDIAN GEOTECHNICAL JOURNAL
1.7r---------------------------------------------. •-• AJ (Initial: yd= 1.44 Mglm\ w=29.5%)
•
/\/\/-• • •
1.3 r_~ _ _j___~ _ _L_..___L_..J___j_ _ _,__~L___t__:---~---:7 0 2 3
Number of cycles --..
FIGURE 35 Dry Density Variations with Number of Cycles for Specimen A3 (Full Swelling- 100% Shrinkage)
1.5c---------------------------,
i 1.4
e ~ :::; >-;&i
" "' u >-0
9 " 9 9 9
9 9
1.2 9
10 11 12 13 14 15 16 17
Number of cycles -
FIGURE 36 Dry Density Variations with Number of Cycles for Specimen A6 (Full Swelling- 100% Shrinkage)

SWELL-SHRINK BEHAVIOUR OF EXPANSIVE SOILS 31
Table 1 Swollen and Shrunken State Placement Conditions of Specimen A3
Cyde No. Dry Density Water content Dry Density Water content (Mg!m3
) (%) (Mg/m3) (%)
(Swollen state) (Shrunken state) (Swollen state) (Shrunken state)
Initial 1.440 29.50 1.440 29.50
I 1.381 37.53 1.638 21.50
2 1.365 38.31 1.569 24.16
3 1.366 37.77 1.542 25.60
4 1.368 37.02 1.51 I 26.84
5 1.369 36.81 1.509 26.83
6 1.370 36.74 1.507 26.87.
Table 2 Swollen and Shrunken State Placement Conditions of Specimen A6
Cycle No. Dry Density Water content Dry Density Water content (Mg/m3
) (%) (Mg/m3) (%)
(Swollen state) (Shrunken state) (Swollen state) (Shnmken state)
Initial 1.284 23.40 1.284 23.40
1 1.204 46.30 1.474 16.99
2 1.213 45.53 1.456 18.50
3 1.222 45.06 1.444 19.32
4 1.230 44.42 1.432 20.04
5 1.237 44.08 1.429 20.72
6 1.242 43.71 1.420 21.24
7 1.246 43.49 1.413 21.65
8 1.249 43.29 1.410 22.05
9 1.253 43.01 1.406 22.23
10 1.253 42.99 1.403 22.45
11 1.256 42.82 1.402 22.60
12 1.258 42.73 1.397 23.05
13 1.260 42.58 1.395 23.04
14 1.261 42.52 1.394 23.15
15 1.261 42.50 1.394 23.17

32
I ME
3 0 0
>< ..c en <:
~ .... "' .,
..c VJ
1.6
0
INDIAN GEOTECHNICAL .JOURNAL
------------------, ln1tial
Y<J(Mg/m 1) ,~--(%)
Number of cycles --
FIGURE 37 Variation of Vane Shear Strength at Swollen Levels for Specimens A2, A3 and A4 ·
'V-V A6 (Initial Yd~ I 28 Mg!m', w~2J 4%)
L..J__l_.___L.__._LJ.__L_;•L-J.I_L, _;IL..J.•--=--1 ..J''----::-1_.__, -:1_,_,~1 _,,__LJ_L"_L"---LJ 5 6 7 8 9 10 11 12 13 14 15
Number of cycles
I'IGURE 38 Variation of Vane Shear Strength at Swollen Levels for Specimen A6

i N
E z ·"' 0 0
SWELL-SHRINK BEHAVIOUR OF EXPANSIVE SOILS
Specimen A3
( cr1= 200 kN/m2)
0 f/0-..LJ.-'-LL.L.L.J_J--L..I
0 2 4 6
Symbol Cycle No. Yd(Mglm3 w....:__(_~_)_l ·-·
8 10 12
Initial
1
2
3
4
5
14
Strain (%) ---..
1.440
1.638
1.569
1.542
1.511
1.509
16 18
29.50
21.50
24.16
25.60
26.84
26.83
20
FIGURE 39 Stress-Strain Curves for Specimen A3 at Shrunken Levels ( 100% Shrinkage)
Reversibility of Swelling and Shrinkage
33
The tests have clearly demonstrated that the swelling and shrinkage are not reversible processes during the initial cycles. However, once the equilibrium state is reached and an equilibrium bandwidth of movement is established, the swelling and shrinkage become reversible process. Not only the magnitudes of swelling and shrinkage are equal, but also swell-shrink time paths gets repeated. As mentioned earlier the equilibrium state at which

34 INDIAN GEOTECHNICAL JOURNAL
30.------------------------------------------,
28
26
24
22
20
6
4
2
Specimen A6
( cr3= 200 kN/rn2)
Symbol Cycle No.
•-• Initial ·-· ·-· 2
·-· 3 0-0 4
6-6 5
0-0 6
\1-\1
0-0
)1(-)1(
()-()
7
9
11
12
15
Strain(%) -
1.284 23.40
1.474 17.00
1.456 18.50
1.444 19.32
1.432 20.04
1.429 20 72
1.420 21.24
1.414
1.406
1.402
1.398
1.394
21.65
22.23
22.60
23.05
23.17
FIGURE 40 Stress-Strain Curves for Specimen A6 at Shrunken Levels (100% Shrinkage)
this reversibility is achieved usually gets established in about 5 cycles excepting some extreme cases of very low densities.
Re-establishment of Equilibrium State
Soils above the water table continuously undergo wetting and drying due to seasonal fluctuations of environment. Under a fixed pattern of environment, movements associated with wetting and drying would have reached a steady state. When this steady state is altered, like for example

SWELL-SHRINK REI I/\ VIU\JR OF EXPANSIVE SOILS 35
Table 3 Shear Strength of Specimen A3 at 100% Shrinkage Levels
Cycle No Cohe,HH1 intcrccpL c ikN/m 2) FrictiOn angle, if!o
<)6() 15.7
2 610 14.0
3 445 14.4
4 435 10.8
5 435 11.5
6 -135 11.2
Initial as-compacted 168 14.7
Table 4 Shear Strength of Specimen A6 at 100% Shrinkage Levels
Cycle No Cohesion intercept, c (kNinl'l Friction angle. rpo
~.ji) 25 5
2 J'l'i 25.0
3 350 22.5
4 29U 26.5
5 260 26.0
6 240 28.'i
7 215 27 0
9 195 270
11 ICJO 25.5
12 187 25.0
15 185 25.5
Initial as-compacted 145 15.5
when a structure is built over the soil involving activities, such as excavation, loading etc., the soil-foundation system will again have to reach a level of equilibrium. This usually takes place over a few seasons. When one pattern of environment gives rise to another p:lttern of environment then also the old equilibrium will have to give rise to new equilibrium. To examine how this will happen and how they affect the equilibrium bandwidth, Suhb<1 Rao and Tripathy ( !999) conducted experiments by changing the swell-shrink patterns.

36 INDIA.!'\! GEOTECHNICAL JOURNAL
15;------
10
t:If5 ::r: <l
C' " E " " "' c. "' '6
~ -5 OJ >
·10
Surcharge pressL:re .._50 l-.l\'/m 1
TranSition I Transition II lransition HI ~----i ~~
14.34%
.&.---.~o---- ... ·--
Shrunken level partial shnnkage
Full swelling- lull shnnkage
~ .&.~~· -A
('J: ~ t\{f Tl /Vr' I fl /""'" ""'"'"" : i
t. ... _ ... ___ .._ __ ...
FuH swct:mg ·partial shrinkage
___ j
r SWELLING SHA!NKAOE. Full swelling ·lull shnnkage
14.21%
-15 I I __LJ t I t I I I .i_l I I I I I I ! I I I ! LL..L~.L..L..L..L..L..L.L.LL.LL.LL..LLJ 0 I 2 3 4 5 6 7 8 9 10 11 12 13 14 15 16 17 18 19 20 21 22 23 24 25
1\urnber of cycles
FIGURE 41 Swell-Shrink Rhythms of Full Shrinkage and Partial Shrinkage
Figure 41 shows the vertical displacement percentages when full swelling-full shrinkage pattern and full swelling-partial shrinkage pattern occur alternately. It is interesting to observe that there is a particular bandwidth associated with particular swell-shrink pattern and it remains unaltered. In other words, the moment the pattern is restored, the same bandwidth gets established. The soil thus displays memory in terms of band width (refer to 14.34%, 4.41%, 14.21% and 4.45% as marked in Fig.41).
Figure 42 shows the vertical displacement response when one partial shrinkage pattern (50% of the first swollen height) and another partial shrinkage pattern (100% of the swollen height) occur alternately. Here, there is an interesting phenomenon.
As long as the shrinkage level at any equilibrium state does not exceed the past maximum shrinkage level, the phenomenon of restoration of bandwidth occurs (refer to the bandwidth 4.52%, 2.27%, 4.48%, and 2.23% in Fig.42). A new bandwidth gets established if equilibrium shrinkage level exceeds the maximum past shrinkage level (refer to bandwidth percentage marked as 3.26%, 4.52'% in Fig.42). Another interesting observation, which could be made in both Figs.41 and 42, is about the presence or absence of fatigue phenomenon. No fatigue phenomenon is observed when the patterns have shrunken levels that were less than or equal to the maximum past shrunken level of an earlier pattem. Only when shrunken level exceeds the

SWELL-SHRINK BEHAVIOUR OF EXPANSIVE SOILS 37
10,--------------------Surcharge pressure =50 kNim 2
Shrunken level
_______ __J
Number of cycles
FIGURE 42 Swell-Shrink Rhythms Involving Putial Shdnkages
maximum past shrunken level, the fatigue phenomenon sets in and it takes a few cycles before equilibrium state is reached. When freshly compacted soil undergoes cyclic movements, fatigue phenomenon obviously is observed (refer up to B in both FigsAl and 42 and D to E in Fig.42). It follows therefore that the shrunken level (present and past) is the controlling factor in defining qualitatively the particle rearrangement.
Shrinkage Crack Patterns
Photographs of the shrunken specimens were taken by Satyadas (1982) at the end of the tests from the top and from the sides to view clearly an idea of generation and distribution of cracks in the specimens. It is generally known that, when the soil is suj:)jected to repeated cycles of wetting and drying, randomness of particle will increase with increase of cycles. Also, as cycles increase, the particle aggregations and consequently the stiffness will increase (Allam, 1977). It is also known that, the effect of temperature on the sample is to increase randomness of the particles and hence the increase of particle aggregation. It thus follows that one can expect more number of cracks and greater particle aggregation both with the increase of cycles and with the increase of shrinkage temperatures.
Plates I, 2, 3, and 4 refer to crack patterns seen on specimens. with varying surcharges 50 kN/m2 to 600 kN/m2 and also with different kinds of shrinkage, number of cycles being the same. It is seen that at lower surcharge

38 INDIAN GEOTECHNICAL JOURNAL
\:\k \
Plate l 4th Cycle, Shrunken Specimen, Shrunk at SO"C with Surcharge of 50 kN/M 2
Plate 2 4th Cycle, Shrunken Specimen, Shrunk at sooc with Surcharge of 400 kN/M 2
Plate 3 4th Cycle, Shrunken Specimen, Shrunk at sooc with Surcharge of 600 kN/M2

SWELL-SHRINK BEHAVIOUR OF EXPANSIVE SOILS
\1dl" \II.:'\\
Plate 4 4th Cycle, Shrunken Specimen, Shrunk at Room Temperature (Average 26°C} with Surcharge of 600 kN/M 2
Plate 5 4th Cycle, Shrunken Specimen, Shrunk at Room Temperature (Average 26°C) with Surcharge of 200 kN/M2
Plate 6 4th Cycle, Shrunken Specimen, Shrunk at Room Temperature (Average 26°C) with Surcharge of 400 kN/M 2
39

40 INDIAN GEOTECHNICAL JOURNAL
pressures, number of cracks are more and narrower than at higher surcharge pressures. Also at higher surcharge pressures, cracks seem to originate at the center, extending towards the sides. At lower surcharge pressures, origination of crack is from the sides extending towards the center. This can be clearly seen from the side views of the samples. Plates 5 and 6 show the photographs when the specimens under different surcharges were shrunk at room temperature. Comparing Plates 2 and 6 with Plates 3 and 4, the specimens have the same surcharges and have undergone same number of swell-shrink cycles, but the methods of shrinking are different. Plates 2 and 3 refer to specimen shrunk at elevated temperature of 50°C, thus inducing greater rate of shrinkage (total shrinkage taking place in about 8 days).
Plates 4 and 6 refer to specimens shrunk at room temperature (average of 25°C) at a slower rate (total shrinkage taking place in about 45 days). Specimens, which are shrunk at room temperature at a slower rate, show a fewer number of cracks, the distribution being random, cracks are however quite wide. This is probably due to the ease with which already existing cracks would get widened rather than to develop new cracks, since the available temperature gradients are smaller. The specimen shrunk at faster rate using higher temperature of 50°C (Plates 2 and 3) show that the number of cracks are more, but smaller in width. The cracks are distributed uniformly throughout the specimen.
Scanning Electron Micrographic Studies
Tripathy ( 1999) has done Scanning Electron Micrographic studies and some SEM 's are shown in Plates 7 to 13. Initial state of the specimens at start of full swelling-full shrinkage cycles under 50 kN/m2 surcharge corresponds to Proctor optimum conditions (Plate 7). All the plates show the side views. Plates 8, 10 and 12 show SEM's at the swollen levels of first, second and third cycles. All the swollen level photographs show the particle assemblage in interweaving bunch formation (Collins and McGown, 1974) with intra-assemblage and inter-assemblage pores. All the three show qualitatively similar pictures. Plates 9, II and 13 show SEM's at the shrunken levels of first, second and fifteenth cycles. The development of particle aggregations can be clearly seen at the shrunken states. More oriented particle arrangements existing at first shrunken level have given rise to dense matrix formations in the subsequent shrinkage levels.
Behaviour of Shrunken Specimens at Equilibrium State
Earlier results reported herein deal with the behaviour of compacted soil upto the equilibrium state. How the specimen in shrunken state, which has a history of atleast four cycles of wetting and drying behaved when wetted, will now be discussed.

SWELL-SHRINK BEHAVIOUR OF EXPANSIVE SOILS 41
Plate 7 Compacted at Standard Proctor Optimum Conditions
Plate 8 Swollen Specimen, First Cycle
Plate 9 Shrunken Specimen, First Cycle

42 INDIAN GEOTECHNICAL JOURNAL
Plate 10 Swollen Specimen, Second Cycle
Plate 11 Shrunken Specimen, Second Cycle
Plate 12 Swollen Specimen, Third Cycle

SWELL-SHRINK BEHAVIOUR OF EXPANSIVE SOILS 43
Plate t3 Shr-unken Specimen, Fifteenth Cycle
Studies were conducted by Subba Rao et al. (2000) on expansive soils of liquid limit 75%, statically compacted to different initial water content and densities. To facilitate presentation, the shrunken specimens at the end of four cycles herein are called desiccated specimens. The desiccated specimens were allowed to swell with measurements of both ve1tical and volumetric swell potentials. The dried specimens expanded both in the lateral and vertical directions on wetting. As-compacted specimen expanded only in the vertical direction in the first wetting. Consequently the vertical swell potential, same as vertical displacement (%) of an as-compacted specimen equalled its volumetric swell potential. The vertical swell potential of a desiccated specimen was calculated as LlH/Hshrunkcn , where L'lH is the increase in thickness of a desiccated specimen on wetting and Hshrunken is the thickness of the desiccated specimen prior to wetting. Vertical swell potential is the same as vertical displacement percentage mentioned earlier in this paper in which H; equal to the thickness of desiccated specimen prior to wetting.
Volumetric swell potential of desiccated specimen was calculated as llej( I+ eshrunkcn), where L'le is the increase in void ratio of desiccated specimen on wetting and eshrunken is the void ratio of the same specimen prior to wetting. Fig.43 shows a typical plot of swell potential versus pre-inundation dry density. In the same plot are also shown the swell potentials of as collipacted specimens. In this figure, point A represents the vertical or volumetric swell potential of as-compacted specimen and points A' and A" represent vertical and volumetric swell potentials of same specimens in the desiccated states. The explanation holds good for points B B'B", CC'C", D D'D". It is interesting to note the dry densities of all desiccated specimens vary with in a narrow range. The water contents of all the desiccated specimens were also nearly constant and ranged between two and three percent. As seen in Fig.43, the volumetric swell potentials of the as-compacted

44 INDIAN GEOTECHNICAL JOURNAL
70 I Swell potential f i Symbol Specimen state measured I
60 I • As-compacted Volumetric I I (:: V crtical) I
I o A1
t_;"k""d Vertical I I I 50
Desiccated Volumetric I r--. Compaction water content = 2 I% I !§'< J B! "@ 40 ~
c! • I t:: ~ 0
D'e 1/D 0.. 30 Q) ·1"-~ /ox {/)
20
~ B• 8:,Bq1 A!!
10 A (D'!)
0 1.0 1.2 1.4 1.6 1.8 2.0
Pre-inundation dry density (Mg/m3
)
FIGURE 43 Pre-Inundation Dry Density-Swell Potential Relations for as-Compacted and Desiccated Specimens
specimen expectedly increase with dry density. The desiccated specimens however show marked variations in their volumetric swell potentials despite possessing near similar dry densities and moisture contents prior to inundation, owing to the differences in their lateral swell magnitudes.
Figure 44 plots swell potential versus percent reduction in cross sectional area for desiccated specimens belonging to various compaction water content series. The percent reduction in cross sectional area of a desiccated specimen is defined as the ratio (A
0- Act)/ A0 X J 00, where
A0
is the cross sectional area of the as-compacted specimen and Act is the cross sectional area of the same specimen in desiccated condition. The plots of Fig.44 illustrate that irrespective of its compaction water content, a desiccated specimen that has experienced a greater reduction in cross sectional area exhibits a larger volumetric swell potential. The desiccated specimens of all the four-compaction water content series however exhibit near identical vertical swell potentials. The trend of

SWELL-SHRINK BEHAVIOUR OF EXPAl"\!SIVE SOILS 45
100 Compaction Volumetric Vertical
water content % swell swell
10 • 0
21 • 11
26 a 0
38 ~ <>
~ • •• 0 • • • c (l) ~
0 0..
• • Qj ,;. 3: lll •
• .. /10 11 ol1o Q) 00 <x} [p
0 0 35
% reduction in cross-sectional area
FIGURE 44 Correlation Between Percent Reduction in Cross-Sectional Area and Swell Potential of Desiccated Specimens
results in Fig.44 implies that the swelling in the lateral direction IS
preferred to swelling in the vertical direction.
Figure 45 plots the relationship between swell potentials of the desiccated specimens and their L\eshrmkage values to different water content series. The L'leshrinkage values in Fig.45 represent the difference between void ratio of an as-compacted specimen and its desiccated counterpart. A positive L\eshrinkage value indicates that an as-compacted specimen experiences an increase in void ratio from cyclic wetting-drying effects. The plot in Fig.45 reveals that the L\eshrinkage value becomes less positive in magnitude with reduction in initial void ratio. It emerges from this figure that, irrespective of the compaction water content, specimens that experience a larger reduction in void ratio from 4 cycles of wetting and drying also exhibit a larger volumetric swell potential in the desiccated condition.
The fairly linear relationship in Fig.46 suggests that the volumetric swell potentials of the desiccated specimens are independent of their compaction

46 INDIAN GEOTFCHNIC;\L JO!.'Ri':AL
100r-~----------~------~-----r---------, Compaction water Volumetric Vertical
0
c cu ~
0 0..
50
<I> 40 3
lJ)
20
content % swell swell ~------------r--
1 ?~ • 0
~~~-•_: __ ~ __ o_~--~ • • ii
I
• •
0
( b.e )shrinkage
FIGURE 45 Plot of ~Eshrink•g• vs. Swell Potential of Desiccated Specimens
water content, but are strongly influenced by their initial void ratio. The vertical swell potentials of the desiccated specimens are independent of their compaction water content as well as their initial void ratio. This conclusion has already been drawn in connection with equilibrium bandwidth.
Behaviour of Cushioned Expansive Soils
Of the several alternatives for absorbing the swelling potential of expansive soils, providing a cushion is one popular method adopted in India. Different cushion materials have been used in practice. They are (i) sand, (ii) sand and boulder, (iii) cohesive non-swelling soil (CNS), (iv) lime-stabilised soil, (v) cement-stabilised soil, etc. Thicker the cushion, better will be its efficiency in protecting the overlying foundation from the expansive nature of the soil. Studies on sand cushion made by Satyanarayana ( 1973) and Moussa et a!. (I 985) bring out the influence of sand gradation and placement condition on its efficiency. However, the use of sand cushion met with limited success only when the expansive soil shows low to moderate swelling

....-c: Q) ~
0 0...
SWELL-SHRINK BEHAVIOUR OF EXPANSIVE SOILS
100 .. ------------r-----~------r-------~ Compaction water Volumetric Vertical
content .% swell swell 10 • 0 21 A A
26 • 0 38 • 0
• •
•
• 20
o A LPo oro 0 0 ~ 6
0 o~.-4-L--~~.--~~--~--~-,~.z--~~---L~1·6
Initial void ratio
47
FIGURE 46 Correlation Between Initial Void Ratio and Swell Potentials of Desiccated Specimens
characteristectics. The reason for this has been thought of as due to the noncohesiveness of the cushion. This view further got strengthened with the research of Katti and co workers (1967, 1979) which resulted in the development of cohesive non-swelling (CNS) soil as a suitable cushion material. Their findings were all based on first swelling observations. Their results show the cohesion of the CNS layer and its thickness are the governing criteria in counteracting the swelling and swelling pressure. The placement condition of the cushion corresponds to proctor optimum conditions. The specifications as to what constitutes the CNS material, placement conditions and the thickness to be provided have been developed by Katti et al. (1979) for the CNS material.
It was necessary to examine how rigorous is the specifications for CNS soil as suggested by Katti et al. and also approved by Bureau of Indian Standards, because in practice, the locally available reddish brown soil, called murrum is usually taken to be the CNS soil. Therefore Subba Rao et al. (1994) studied the expansive soil with different red earth compositions, one

48 INDIAN GEOTECHNICAl JOURNAL
Table 5 Physical Properties of Soils
Properties BC soil CNS CNS (NSI) CNS (NS2)
Grain SIZC analysis
Clavi%) 20.0 19 0 38 I! I I 0
Sand (%) 67.0 36.0 270 19.0
Cir~vcl (%) 13.0 370 330 55.0
Silt (%) 8.0 20 15.0
Consistency limits:
w, (%) 88.0 37 () 49.0 28.0
w,(%J 42.0 210 24.0 ! r, 0
PI I" o l .1(,.0 I C. 0 25 () 12 0
\' {tl oi l; t. l ~~ ( l 1 ~ () ~\: :t "---~~-·· ""- "-· -~~~~ -·----- --·. ~----~-~----- "·- ·-----·-~------~·~---······· ---
.\p Gra\'11) 2 b7
Proctor l ompaction Charactcristtcs:
OMC (%)
MOO (kN/m)
){, 00
12.70
' "
I 5. 70
17.13
2 (t'-1
2200
16 09
Shear strength of samples compacted to Standard Proctor
UCC (kN/m')
c .. (kN/m')
¢ ... (deg.)
217.78
74.56
8.00
201 II
59.84
9.00
2 -·,
12.00
19.52
124.59
.104
15.00
conforming to the specifications and other two not conforming to the specifications. They were accordingly designated as CNS, CNS (NS 1) and CNS (NS2). Table 5 gives the salient details of these materials together with that of black cotton soil (BC). Results of tests conducted show the behaviour in the first swelling. BC soil and any CNS soil used in BC + CNS system were compacted to the respective proctor dry densities, while BC soil was at hygroscopic water contents, CNS, CNS (NS I), CNS (NS2) were compacted at their respective optimum moisture contents. The results clearly demonstrated that the specifications for CNS soil are not so rigorous. In fact, soil with higher clay content CNS (NS I) behaved better than CNS itself. The soil with higher sand content, CNS (NS2) was Jess effective.
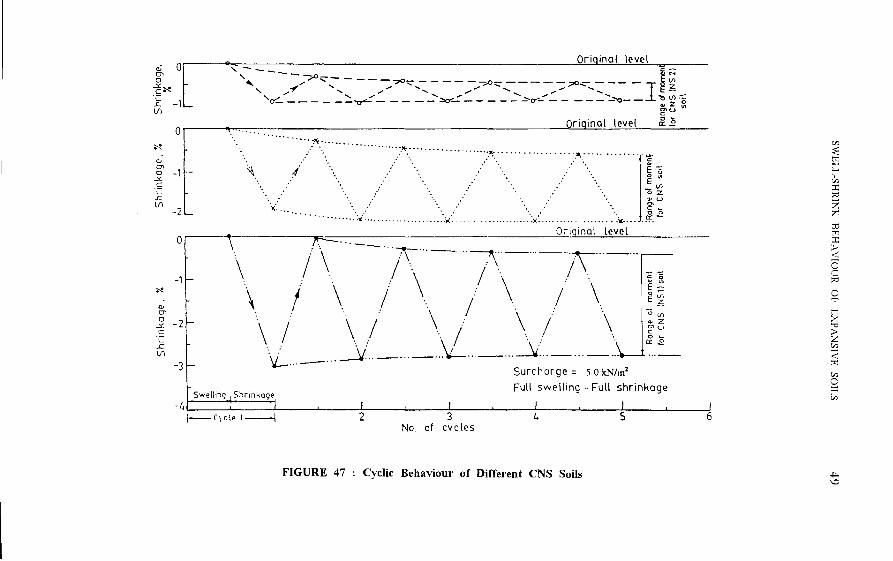
The swell shrink behaviour of different CNS soils under a nominal surcharge during full swelling-full shrinkage is shown in Fig.47. The equilibrium movement is reached just after two cycles for all the soils. The
,; en 0
~X ·c .c lf)
~~
"' en 0 -"' .s L. ..c lf)
~
"' en 0
..;,:. c L.
L lf)
0
-1
Oriqinal level ',------::><>--- a;N
"- ...- ', - - - -;;oo, - - - - - --;;~>- --- - - ;:.o- _ _ _ _ E V> ', ,.., .......... ,.,..,.,.. ........... ...... ..,,....,.. ............. ....... .., ..,.,.. ...................... I g 6-if-- - - - - -'a'"- - - - - - "'a'- - - - - - _:,.,.-_ - - - - - -'o- - , Vl ·-.. zo
O>U"'
Oriaina\ level & ~
~-
••• .?·· , ............ , ........ ,h .· ·. : 0 z
. ·. .. u • • •• . . ...... : •... H" x· . .....•..
:-..: .... . .... :.,/ .. . ..... )(' .... Oriainal Level
\ /\ ···-···f\···- ·A:·-···-···-r:;-···-··· \ I \ /\ /\ /\ rn \ / \ / \ / \ / \Ji~
·v_ ... -···_j/···-···-··v_··--···J ... _,,_____ ···-Surcharge= so kN/m2
Full swelling -Full shrinkage Swelling I Shrmkage
-4~~-7~--~----~--~~---4----~----~--~----~----~----~--~ \-C)cle 1---j 2 3 4 5 6
No. of cvcles
FIGURE 47 Cyclic Behaviour of Different CNS Soils
[/)
::::: fl ~ [F)
:r: "' z ~
ttl
"' :r:: ~ § ;,:; 0 ..,., M ~
~ [/)
< tn [/)
0 F [/)
-1'\D

~
0> c
<lJ
3: V)
~
<lJ BC Soil
8 C Soil alone BC-CNS(NSI)soil BC-CNS Soil BC-CNS (NS2.)soil
/:r.\ .. .. ~~ v:-. V .\· .. ~\! /..... \~ /? .'rf.. . .\ 1.; ··o/ ·\· .. \i'.l.:.
··r~ ';g/,.
Initi ol values Oriainol level
'fd.gm/cclw. r. 1·295 110·5 Surcharge= so kN/ml
0> o - 1 ~ CNS (NS2) soil 1·990 12·0
..X Full swelling- Partial shrinkage
.~ CNS Soil 1·746 15·7 L
0
~ CNS (NS 1) soil 1·640 22-0 1 1 -2 I I I
I Swellmg I Shrinking11 2 3 4 5 6 ~Cycle 1---J No. of cycles
FIGURE 48 : Cyclic Swell-Shrink Behaviour of BC Soil and BC-CNS Soils
Vt 0
z t:i
~ CJ t"l 0 >-l M (')
~ z n F: '-0 c:: ::0 z F:

SWELL-SHRINK BEHAVIOUR OF EXPANSIVE SOILS 51
equilibrium band widths for CNS (NS I), CNS and CNS (NS2) are 2.35%, 1.65% and 0.4% respectively. It is interesting to observe that the CNS materials though do not swell in the first cycle, but do shrink in the first shrink cycle and then show both swelling and shrinkage behaviour in subsequent cycles. If one were to consider only swelling potential in first cycle, then it is zero for all the three soils. But in long run, they do show shrink-swell behaviour. Since CNS (NS I) has maximum clay content, expectedly its equilibrium bandwidth is maximum.
Subba Rao et al. (I 995) studied the swell-shrink behaviour of BC + CNS systems. In one series, cyclic tests with full swelling-full shrinkage were conducted. In another series, cyclic tests with full swelling-partial shrinkage were conducted. In the latter, shrinkage level was kept at 75% of first swollen level. The experiments were conducted on samples prepared in consolidation rings of 76mm diameter and 50mm height. BC soil and CNS soil used in the BC+CNS system were compacted to their respective Proctor dry densities. While BC soil was compacted to a dry density of I2.95 KN/m3 at hygroscopic water content of I 0. 5%, the cushions were compacted at their respective optimum water contents. The thickness ratio of BC soil: cushion was 2 : 1. The typical cyclic behaviour of BC + CNS systems under a surcharge of 50 kN/m2 is as shown in Fig.48. In this figure, the swelling and shrinkage percentages of cushioned systems have been calculated based on the thickness of BC soil in each system.
The results of the experiments are shown in Table 6 for the case of full swelling-full shrinkage. The table reports the swollen and shrunken levels in each of the cycles for both BC and BC + CNS systems. In order to examine whether or not the CNS has been active, the figures for BC +Dummy (to account for replacement effect) system have been added. These refer to a system having BC and dummy cushion material which neither swells nor shrinks in any of the cycle, the thickness being unaltered. Since thickness of BC in BC + CNS system, is 213'd of thickness of system having BC alone, the figures for BC +dummy system will simply be 2/3rd of those of BC alone.
Now consider values corresponding to surcharge level of 5 kN/m2. In
the first cycle, swelling of BC+CNS is 8.67% as against IJ% for the BC +dummy system, clearly showing an improvement of 4.33%. But at the end of 3rd cycle BC + CNS system is showing higher displacements in both swelling and shrinkage than the BC +dummy system. In fact in the second cycle itself, the shrinkage displacement of BC + CNS system is more than BC +dummy system. If the values were to be the same between the two, it means CNS is just inactive. If the displacement (~H) values of BC + CNS system are less, then CNS is advantageously active. If the values are more as have been seen in the third cycle and onwards, then BC + CNS behaviour is worse than that of BC alone.

Table 6 : Cyclic Behaviour of BC and BC+CNS Systems under Full Swelling-Full Shrinkage
First cycle Second cycle Third cycle
Surcharge Description Displacement ~H Displacement ~H Displacement ~H
kN/m 2 Level (%) (%) Level (%) (%) Level (%) (%)
sw SH sw SH sw SH sw SH sw SH sw Level Level Level Level Level Level Level Level Level Level Level (%) (%) (%) (%) (%) (%) (%) (%) (%) (%) (%)
5.0 BC 19.50 1.00 19.50 18.50 20.00 8.00 19.00 12.00 19.00 8.50 11.00
BC+DM 13.00 0.67 13 00 12.33 13.33 5.33 12.66 8.00 12.67 5.67 7.34
BC+CNS 8 67 -1.33 8.67 lO 00 8.67 0.00 10.00 8.67 9.34 133 9 34
50.0 BC 4.50 -11.50 4.50 16.00 0.50 -11.20 12.00 11.70 -1.50 -11.20 9.70
BC+DM 3.00 -7.67 3.00 10.66 0.33 -7.47 8.00 7.80 -1.00 -7.47 6.47
BC+CNS 2.00 98.67 2.00 10.67 -133 -9.47 7.34 8.14 -2.67 -9.47 6 80
1000 BC 0.50 -13.50 0.50 14.00 -4.00 -15.00 9.50 11.00 -5.00 -15.50 10.00
BC+DM 0.33 -9.00 0.33 9.33 -2.67 -10.00 6.33 7.33 -3.33 -I 0.33 6.67
BC+CNS 0.15 -10.33 0.15 10.48 -4.00 -11.33 6.33 7.33 -4.67 -12.00 6.67
200.0 BC -1.00 -16.00 1.00 15.00 -9.00 -19.00 7.00 10 00 -11.00 -21.00 8.00
BC+DM -0.67 -10.67 0.67 10.00 -6.00 -12.67 4.67 6.67 -7.33 -14.00 5.34
BC+CNS -0.67 -11.00 0.67 10.33 -6.67 -14.00 4.33 7.33 -8.00 -14.67 6.00 L_ ---
SW - Swollen SH - Shrunken OM - Dummy
SH Level (%)
11.50
7.00
8.00
9.50
6.47
6.80
10.50
7.00
7.33
10.00
6.67
6.67 ·---
V> N
z 0
~ 0 r.-1 0 -' rri n ::r: z ~ ::: 0 c S2 F:

Table 6 : Continued
Fourth cycle Fifth cycle
Surcharge Description Displacement L'lH Displacement kNim2 Level (%) (%) Level (%)
sw SH sw SH sw SH SW Level Level Level Level Level Level Level (%) (%) (%) (%) (%) (%) (%)
5.0 BC 19.00 8.80 10.50 10.20 19.00 8.80 10.20
BC+DM 12.67 5.86 7.00 6.81 12.67 5.87 6.81
BC+CNS 9.87 2.33 8.54 7.54 9.87 2.33 7.54
50.0 BC -1.80 -11.20 9.40 9.40 -1.80 -11.00 9.40
BC+DM -1.20 -7.47 6.27 6.27 -1.20 -7.47 6.27
BC~CNS -2.93 -9.47 6.54 6.54 -2.93 -9.47 6.54
100.0 BC -6.90 -15.70 8.60 8.80 -6.90 -15.70 8.80
BC+DM -4.60 -10.47 5.73 5.87 -4.60 -10.47 5.87
BC+CNS -5.73 -12.13 6.27 6.40 -5.73 -12.13 6.40
200.0 BC -13.00 -22.30 8.00 9.30 -14.33 -22.30 7.97
BC+DM -8.67 -14.87 5.33 6.20 -9.55 -14.87 5.31
BC+CNS -9.33 -15.33 5.34 6.33 -10.20 -15.67 5.13
SW - Swollen SH - Shrunken DM - Dummy
Sixth cycle
L'lH Displacemeni (%) Level (%)
SH sw SH sw Level Level Level Level (%) (%) (%) (%)
10.20 19.00 8.80 10.20
6.80 12.67 5.87 6.81
7.54 9.87 2.33 7.54
9.40 -l.XO -11.00 9.40
6.27 -1.20 -7.47 6.27
6.54 -2.93 -9.47 6.54
8.80 -6.90 -15.70 8.80
5.87 -4.60 -10.47 5.87
6.40 -5.73 -12.13 6.40
7.97 -14.33 -22.30 7.97
5.31 -9.55 -14.87 5.30
5.47 -10.20 -15.67 5.44
L'lH (%)
SH Level (%)
10.20
6.81
7.54
9.40
6.27
6.54
8.80
5.87
6.40
7.97
5.30
5.44
"" ~ tTl
~ "" ::r: ~ z ;.:: IJ:) tTl ::r: ;» < 0 ~ ~ M ><
~ "" < tTl
"" 0 F ""
Vt w

54 INDIAN GEOTECHNICAL JOURNAL
Consider the values corresponding to surcharge of 50 kN/m 2 The figures in the Table 6 clearly show that by 3'" cycle onwards, CNS is inactive. Similar comparisons at higher surcharges demonstrate that CNS is either inactive or helps in worsening the cyclic behaviour except in the first swelling. The value at all the salient levels with the type of movement is tabulated in Table 7. For the tests conducted, four types of swell-shrink movements viz., Type A. 8, D & E have been observed. In all these cases highest displacement level occurred during the first swelling.
Comparing extreme displacement values (given in column 5), it clearly shows that under higher surcharges BC + CNS system will show more values than those for BC alone, accounting for replacement effect. Equilibrium bandwidth values shown in column 8 also unmistakably show that there is no reduction in equilibrium bandwidth in BC + CNS system after accounting for replacement effect.
The swollen and shrunken levels recorded for the cyclic tests conducted under the pattern of full swelling-partial shrinkage are shown in Table 8. The results for three cushion materials, CNS, CNS (NS I). and CNS (NS2) are shown in this table. Making comparisons described earlier, it is clear that even here, by 2"d cycle onwards the CNS has a tendency to become inactive. The alternatives to CNS, viz., CNS (NS I) and CNS (NS2) also do not show any marked improvement over the CNS behaviour. The value at all salient levels are recorded in Table 9. Advantage got in first swelling level seems to be essentially holding in all the cycles.
Heave and Shrinkage Profiles
The field heave and shrinkage of the ground at the surface and at different depths are usually known by actual measurements or the movements made over a period of time with different techniques such as Heave plugs or heave plates (Johnson, 1980), Multirod gauges with bearing plates placed in auger holes (Zeit len and Komornik. 1961 ). Loaded pads (Freeman et al., 1992), Level pegs (De Bruijn, 1973), etc. Heave and shrinkage profiles can also be obtained by insitu soil suction measurements or approximately by empirical information by knowing the field capacity and assumed soil suction during dry seasons (Hamberg, 1985; Wray, 1987; Terazaghi el al., 1996). In addition the results of laboratory oedometer swell-shrink tests can also be used in generating heave and shrinkage profiles with depth based on the method suggested by Kassif and Zeit len ( 1961 ).
The basic assumptions involved in this method arc the following:
i) Swelling and shrinkage 1s uniform in each layer.

Table 7 : Swell-Shrink Movements of BC and BC + CNS Systems under Full Swelling-Full Shrinkage
Surcharge Description Highest Lowest Ex1reme Equilibrium Equilibrium Equilibrium Operating Type of kN/m2 Swollen Shrunken Dis pl. Swollen Shrunken Bandwidth Displ. Movement
Level Level Level Level (%) (%) (%) (%) (%) (%) (%)
5.0 BC 20.00 1.00 20.00 19.00 8.80 10.20 13.90 A
BC+DM 13.33 0.67 13.33 12.67 5.87 6.80 9.27 A
BC+CNS 8.67 -1.33 10.00 9.87 2.33 7.54 6.13 B
50.0 BC 4.50 -11.50 16.00 -1.80 -11.20 9.40 -6.50 D
BC+DM 3.00 -7.67 10.67 -1.20 -7.47 6.27 -4.33 D
BC+CNS 2.00 -9.33 l 1.33 -2.93 -9.47 6.53 -6.20 D
100.0 BC 0.50 -15.70 16.20 -6.90 -15.70 S.80 -11.30 D
BC+DM 0.33 -10.47 10.80 -4.60 -10.47 5.87 -7.53 D
BC+CNS 0.15 -12.33 12.48 -5.73 -12.13 6.40 -8.93 D
200 BC -1.00 -22.30 22.30 -14.30 -22.30 8.00 -18.30 E
BC+DM -0.67 -14.87 14.87 -9.53 -14.57 5.33 -12.20 E
BC+CNS -0.67 -15.67 15.67 -10.20 -15.67 5.47 -12.93 E ·--
Disp. - Displacement
"' ::E tTl l" t;"
"' :I: c: z ~
t:c tTl :I: ~ < § ?;l
0 "'1
tTl ~ .., ~ "' < tTl
"' 0 F "'
Ul Ul

Table 8 : Cyclic Behaviour of BC and BC + Cushion System under Full Swelling-Partial Shrinkage
First cycle Second cycle lbird cyd~
Surcharg~ Description Displacement 1'\H Displacement 1'\H Displacement kN/m2 Level (%) (%) Level (%) (%) Level (~o)
sw SH sw SH sw SH SW SH sw SH sw Level Level Level Level Level Level Level Level Level Level Level (%) (o'o) (%) (%) <o oJ (oo) (%) (oo) (%) (%) (o o)
5.00 BC 19.00 7.00 19.00 12.00 12.60 7.60 5.60 5.00 12.60 7.60 5.00
BC+DM 12.67 4.67 12.67 x.oo X.40 5.07 3.73 3.33 8.40 5.07 3.33
BC+CNS 8.33 2.67 8.33 5.67 6.27 3.07 3.60 3.20 6.27 3.07 3.20
CNS (l'\S I) 10 .. 67 4.00 10.67 6.67 7.20 4.27 3.20 2.93 7.20 4.27 2.93
CNS (NS2) 7.33 2.00 7.33 5.33 5.67 2.53 3.67 3.14 5.67 2.53 3.14
50.0 BC 4.50 1.25 4.50 3.25 3.25 1.50 2.00 175 3.25 1. 75 I. 75
BC+DM 3.00 0.83 3.00 2.17 2.17 1.00 1.34 1.17 2.17 1.17 1.17
BC+CNS 2.17 0.67 2.17 1.50 2.17 0.67 1.50 1.50 2.17 0.67 1.50
CNS (NSl) 2.50 0 83 2.50 1.67 1.60 0.73 0.83 0.87 !.60 0.73 o.~n
CNS (NS2) 1.67 0.53 1.67 1.14 1.53 0.53 1.00 1.00 1.53 0.53 1.00 -~~- ~-- -
,_ --
SW - Swollen SH - Shrunken DM - Dummy
MI (%)
SH Level (%)
5.00
3.33
3.20
2.93
3.14
I. 75
1.17
1.50
0 87
1.00 --·-
Vo ~
z tJ ;; L'. c; ~ ;:::l tTi (")
:r:: z r; ?:: ..... 0 r
~ ?::

Table 8 Continued
First cycle Second cycle
Surcharge Description Displacement tiH Displacement L'iH kl\im2 Level (%) (%) Level (%) (%)
sw SH sw SH sw SH sw Level Level Level Level Level Level Level (01o) (%) (%) (%) (%) (%) coo)
5.00 BC 12.60 7.60 5.00 5.00 12.60 7.60 5.00
BC+DM K40 5.07 3.33 3.33 8.40 5.07 3.33
BC+CNS 6.27 3.07 3.20 3.20 6.27 3.(J7 3.20
CNS (NSl) 7.20 4.27 2.93 2.93 7.20 4.27 2.93
CNS C'JS2) 5.67 2.53 3.14 3.14 5.67 2.53 3.14
50.00 BC 3.25 1.75 1.75 1.75 3.25 1.75 1.75
BC+DM 2.17 1.17 1.17 1.17 2.17 1.17 1.17
BC+CNS 2.17 0.67 1.50 1.50 2.17 0.67 1.50
CNS (NSI) 1.60 0.73 0.87 0.87 1.60 0.73 0.87
CNS (NS2) 1.53 0.53 1.00 1.00 1.53 0.53 1.00 - --·-- ------- L_ __ -
SW - Swollen SH - Shrunken DM - Dummy
SH Level (%)
5.00
3.33
3.20
2.93
3.14
1.75
1.17
1.50
0.87
1.00 -- ·--
Third cycle
Displacement L'iH Levd (%) (%)
SW Sl! sw SH Level Level Level Level (%) (%) (%) (%)
12.60 7.60 5.00 5.00
8.40 5.07 3.33 3.33
6.27 3.(J7 3.20 3.20
7.20 4.27 2.93 2.93
5.67 2.53 3.14 3.14
3.25 1.75 1.75 1.75
2.17 1.17 1.17 1.17
2.17 0.67 1.50 1.50
1.60 0.73 0.87 0.87
1.53 0.53 1.00 1.00 --- __ L_- -- --- ----
"' < !:"1
~ ~ :r: ::0 z 7: OJ
~ :>< § ~ 0 -,;
~ ~ "0
~ "' < !:"1
"' c ~
V> -.J

Table 9 : Swell-Shrink Movements of BC and BC + Cushion Systems under Full Swelling-Partial Shrinkage
Surcharge Description Highest Lowest Extreme Equilibrium Equilibrium Equilibrium Operating Type of kN/m2 Swollen Shrunken Dis pl. Swollen Shrunken Bandwidth Dis pl. Movement
Level Level Level Level (%) (%) (%) (%) (%) (%) (%)
5.00 BC 19.0 7.0 19.0 12.6 7.6 5.0 10.1 A
BC+DM 12.67 4.67 12.67 8.40 5.07 3.33 6.73 A
BC+CNS 8.33 2.67 8.33 6.27 3.07 3.20 4.67 A
CNS (NS!) 10.61 4.27 10.61 7.20 4.27 2.93 4.67 A
CNS (NS2) 7.33 2.53 7.33 5.67 2.53 3.14 4.07 A
50.0 BC 4.5 1.25 4.50 3.3 1.5 1.8 2.4 A
BC+DM 3.00 0.83 3.00 2.20 1.00 1.20 1.60 A
BC+CNS 2.17 0.67 2.17 1.67 0.67 1.00 1.17 A
CNS (NSI) 2.50 0.73 2.50 1.60 0.73 0.87 1.20 A
CNS (NS2) 1.67 0.53 1.67 I. 53 0.53 1.00 1.03 A --
Disp. - Displacement
VI 00
z tl
~ 0 tTl 0 -l tTl
~ 0 f: .__ 0
~ f:

SWELL-SHRINK BHI,\ VIOUR OF EXPANSIVE SOILS 59
ii) Active depth within which moisture content fluctuation takes place which in turn induces heave or shrinkage considered invariant with cycles.
iii) The wet density of soil remains constant for both dry and wet seasons. iv) Any soil replacing the expansive soil will also have the wet density
same as the expansive soil.
Two cases are considered to illustrate the method.
CASE I: A footing in an expansive soil at a depth of 2m below ground
Fig.49 shows the ground profile for the problem in question for a footing 1.5 X 1.5m size under a pressure of !50 kN/m2
, assuming 3m thick active zone (divided into 3 layers of each lm thick) below the footing level. Full swelling-full shrinkage pattern is assumed in all the layers.
From the laboratory swell-shrink tests corresponding to the above patterns, vertical swell percentage versus surcharge for each cycle under consideration can be plotted. Fig.50 shows the plot of vertical displacement versus pressure for the first, second and the equilibrium cycles. ~H for each layer is read from the Fig.50 and taking Hi equal to layer thickness, heave or shrinkage is calculated as shown in Table 10. For this particular problems for the pressure ranges of interest all vertical displacements are negative. As all values are negative, the negative signs are dropped from Table 10. These results are plotted in Fig.52.
Pressure (kPa)
2.0m
Layer 2
2
------
.s 3
.c c.
----------T Layer 1 1.0m
- - - - - - - - - -
1.0m
Active zone
Q)
0 4 104 kPa
3.0 meters
5
FIGURE 49 Square Footing at 2.0m Depth

60
30
20
~ 10 !!... 'E 4)
E 4) 0 Cll c. (/)
'6 0 (ij 0
~ >
-10
-20
0
INDIAN GEOTECHNICAL JOURNAL
50
•-• First Swelling
c~-,~ First Shrinkage
•-• Second Swelling
-,· Second Shrinkage
A-A Equilibrium Swelling
::J-o Equilibrium Shrinkage
-------
100
Pressure (kN/m2)
150 200
FIGURE 50 Pressure Displacement Plots with Cycles for BC Soils (Full Swelling- Full Shrinkage)
CASE II: A footing at a depth of 2m below ground with a CNS cushion of J.Om thickness
Fig.51 shows the laboratory test data for the first, second and for the equilibrium cycles for BC + CNS system. The calculations for BC + CNS system are shown in Table II. Heave and shrinkage values in the first, second and at equilibrium cycles have been calculated and profiles marked in Fig. 52.
For the system having 3m of only BC, cumulative heave or shrinkage at equilibrium state is seen to be 253mm. The same gets changed to 184mm

All
va
lues
in
mm
00
Cum
. —
Cum
SWELL-SHRINK BEHAVIOUR OF EXPANSIVE SOILS 61
N J0 00
0 0
00 N
oc; N 00
o 00 00 N
00
O
Cc
CD O O 00 00
O
00 O N (-)
E
Ux
.
"0
0
07
00
C.) b
4)
v
U
C. O
C.)
CO
PA
CO
CO
CO
COro
1■••1
CO
00
00
tr,
Cfl N
O 01 C
O N N
O N 06 00
C 00 ,
C
N O
O 00 00
C O
00 00
C 00
U
x
00
U
O
▪ t
O
N
O
o
Cn
C
O CJ \
O
N
C
N
00 o
N
O
C N
N
O
C.
O
7.)
C O
00
4)
All va
lues in m
m
Cfl
00
00
Hea
ve a
nd
Shri
nkag
e C
alcu
lati
ons
for
BC
+ C
NS
Soil
Sy
stem
C O N
C CV 00
N
CO
C N Cs
N
O
6 Z C
N T. N

62
10
~
:::.\! ~ 0 .. c 4> E 4> (.,) CIS [i en Ci (ij 0 t 4> -10 >
-20
0
INDIAN OEOTFCHN!CAL JOURNAl,
50
•-• First swelling
,_ First shrinkage
•-• Second swelling
: -· Second shrinkage
"-" Equilibrium swelling
o-c Equilibrium shrinkage
100 Pressure (kN/m2
)
150 200
FIGURE 51 Pressure Displacement Plots with Cycles For BC+CNS Soils (Full SHelling- Full Shrinkage)
if lm of black cotton soil vvere to be replaced by a CNS layer, Had an inactive layer of the same thickness replaced it, the corresponding value would have been 2/3rd of 253mm, which is equal to 169mm. Therefore clearly replacement by CNS has worsened the situation.
Conclusions
The real challenge about the expansive soils is their ability to undergo very large movements, the uncertainties of which render any rational design most difficult Reasonable assessment of swell-shrink pattern coupled with laboratory cyclic tests will help a great deal in understanding possible heaves

Movement (mm)
·400 ·200 0 ·600 0 r-r-.-.-,-,-,-~~-r-r~~--
2
g = 3 0..
<V 0
4 ~
5
6
·-· •-• Second heave o-o Second shrinkage
•-• Equilibrium heave o-o Equilibrium shrinkage
253 mm
(a) BC soil
·600 Or-
2
E = 3 0.. v
0
4
5
6
Movement (mm)
·400 -200
•-• First heave
o-o First shrinkage
•-• Second heave o-o Second shrinkage
•-• Equilibrium heave o-:J Equilibrium shrinkage
1,184 mm •I
(b) BC + CNS
FIGURE 52 : Heave and Shrinkage Profiles for Square Footing
0
"' ::E t'Il r \ ~ ~ ~
&l :I:
~
~ 0 '"'1
t'Il >< ..., ;z "' < t'Il
"' 0 r "'
0\ w

64 INDIAN GEOTECHNICAL JOURNAL
and settlements. The possible movements have been classified into five types, types A to E. The experimental results have clearly demonstrated that the swell-shrink behaviour of expansive soils is different in different cycles. After a few cycles however, the soil will come under steady movements. The studies .have brought out that the equilibrium bandwidth associated with steady movements can be assessed fairly reliably since it possesses certain uniqueness. It is seen not only unaffected by the placement conditions but also by the swell-shrink sequence.
Studies reported in this paper have highlighted that the expansive soils exhibit memory. When a soil that is in equilibrium under a particular swellshrink pattern is disturbed and comes under the influence of a new pattern, a new equilibrium will follow after a few cycles. If the old pattern is once again restored, the old bandwidth will again get re-established. This reestablishment of bandwidth takes place as long as the immediate shrunken level does not exceed the maximum past shrunken level. The shrunken levels, present and the past, are the controlling factors in defining the cyclic behaviour and also for the presence or absence of the fatigue phenomenon. If the past shrunken level is not exceeded in the changing patterns, there will be no fatigue.
Most of the earlier research on the cyclic behaviour has indicated that the swell potential in the second cycle (swelling following the first shrinkage) is usually the maximum. The reason has been attributed to the particle arrangement. The results presented in this paper have shown that a set of placement conditions (points on 83% S, line and the dry densities Jess than or equal to Proctor maximurri) bring about the invariance of the swell potentials with cycles. Measurements of shear strength of swollen specimen show that the swollen soils still possess significant shear strengths. Even though the soil is fully saturated at the swollen level the saturation water content will be just about 50% of the liquid limit water content.
The swelling and shrinkage are two different magnitudes and processes at the beginning. After four or five cycles, when the equilibrium state is reached, the two magnitudes become the same and the swelling and shrinkage become reversible.
The compacted specimens and the desiccated specimens expectedly show significant differences in their behaviour. The vertical swell potentials of desiccated soils are unaffected by compaction water contents or dry densities, the same as observed in the name of Bandwidth. But the volumetric swell potential increases with increase in the initial void ratio of the soil. More the initial void ratio, more would be the reduction in the cross-sectional area of the desiccated specimen and more would be the volumetric swell potential.

SWELL-SHRINK BEHAV!OCR OF EXPANSI\'1: SOILS 65
Swell-shrink behaviour of CNS-cushioned e:-;pansive soil clearly demonstrates that the CNS becomes less and less active and effective with ·vcles. CNS soil definitely helps in absorbing some swelling potential in the t1rst cycle. Afterwards. the performance of BC + CNS system becomes less impressive and may even become worse than that of BC alone.
Acknowledgements
The contents of this paper arc chiefly dra\\n from the theses of the authors· students. Dr. Gi!Terd Satvadas. Dr. JV Clununurthy. Dr. S. G<mgadhara. M. C.P. Mahesh Kumar and Mr. Snehasis Tripathy. Their painstaking efforts
in careful e:-;perirnentation arc gratefully acknowledged. The author wishes to place on record the excellent help rendered by his present students, Mr. Sitaram Nayak, Mr. C.R. Parthasarathy and Mr. Decpankar Choudhury. vvithout whose help this paper would not have been completed on time.
References
AITCHISON. G.D and HUIMIS. J.M. (!':!531 "Aspects nl S\vdling in the Sui! Protilc ·. Australian Jounwl of' .lpplied Science. No.4. pp 244
AITCHISON, G.D. and IIOLMFS. J.W. (ILJ53) "Seasonal Changes of Soil Moisture in a Red-Bruwn Earth and a Black Earth in Southern Australia''. Australian Journal of .-Jpplied Scimce ( 4 ). pp 260-273
ALLAM. M.M. (I <J77) ·'Shc<tr Strength and Volume Change Ilehaviuur of Desiccated Soils .. , Ph/J. lhesis. liSe. Bang:1lorc. India.
AL-IIOMOUD. A.S.. BASMA. AA. lll!SFIN. MALKAVI and 1\LIlASII/\JlSHI\H, M.A ( llJlJ5) --c,clic S\\elling llehaYiour of Clavs". Journal of 1/mtec:/mical Engineenng. ASCE. Vol.l21. Nu.7. pp.5X2-5(>5.
ASTM. 1)4546-90: ·'Standard Test Methuds for One Dimensional Swell or Settlement Potential of Cohesive Soils'', pp.(i\l(>-702.
llASMA, A.A., AL-HOMOIJD. AS .. MALKAVL 1\I.ll. and AL-HASHABSHAII, MA (I 996) '·Swelling-Shrinkage 13ehaviuur of Natural Expansive Clays·', Applied Clay Science, No.I!. pp.211-227.
BILSEL, H. and TUNCER, E.R. ( 19':!8) : "Cyclic Swell-Shrink Behaviour of Cyprus Clav", Proc. Intemational Conference on Problematic Soils. pp.337-340.
CII EN. F.H. (I 965) "The !Jsc uf Piers to Prevent the Uplitting of Lightly Loaded Structures Fuunded un Expansive Soils". Proc. t.'ngineering Effects of Moisture Changes in Soils. International Research and Engineering C"n!Crence on Expansi\·c Clay Soils. Texas A&M Press. College Station. TX.
CHEN, LIN, and DF(JUO, WANG ( I<J87) : '·Engineering Characteristics of Mengtze Expansive Soil", Proc. 6th Jntenwtional Conference 011 J~xpansive Soils. New Delhi, India. Vul.l. pp.403-407.
CJIEN. F. I-I. and MA, G.S. (I 987) "Swelling and Shrinkage Behaviuur of Expansive Soils", Proceedings, 6th Intemational Conference on Expansive Soils, New Delhi, India, VoL!, pp !27-!29.

66 INDIA .. "J UEOTECHJ\IC.\L .10! :Rl\AL
CI!EN. T Y and MOlL C.ll. (I 'J73) '"Volume Change Characteristics of Expansive Soils Determined bv Cuntrolkd Suction Tests··. !'ron:edings. Jrd lni<:mational C'onjereno: 011 Lrpansiw "\'oi/.1. IsraeL Vol.!. pp.l77-l R5.
CIIEN. X.Q .. J !J. /.W and HE. X.F (I'JR5) "'Moisture Movement and Det(mnation nf Expansive Sllils ... Proceedings I Jth lllfemational ('m!fierence on Soil .ilechanics and f<!JIIndatirm t'ngineering. S:1n Francisco. VolA. pp.23R'l-2392.
COLI.INS, K. and MC< j()WN. A ( 1974) "'The Furm and Function uf Miwlfabric Features in a Varietv of Natural Soils'·. c;euteclmique. 24. No.2. pp223-254.
DAY. R.W. ( l'l94) "'Swell-Shrink Behmiuur of Expansive Cnmpactcd Clav .. _
.lounwl of Geotechnical J:'ngineering. Vol L:'U. No.3. pp.6!8-623
DE BRUIJN. C. M.A. (I 'J73 1 ""Moisture Redistribution and Soil Mllv·cments at Vereeniging (Transvaal!" /'roc. Jrd !lltt'nwtirmal Conference 011 L\'f'<lllsil·e Soils. Haifa. Vol.!, pp.27<J-2XR.
DIF. A.F. and BLUEMEL. W .F. (I 991) "'Expansive Soils with Cyclic Drying and Wetting", Geotechnical testing Journal. C!TJODJ. Vol.l4, No. I. pp.<J6-I 02.
DrNESH MOHAN and JAIN. () S. ( 1955) "'lJndcr-reamcd Pik Foundatinns em Black Cotton Soil"'. Indian C'onstmctirm \'nrs. Vol.l4. No.l2.
FREEMAN. T.L BliRHlRD. l l. and CRillY MS. (1992 J "Seasunal hnmdatlllll Movements in London ClaY .. _ flroc. ./th lntemutirmul C'rmj-,rence oil (]rrmlld Jiovenu:llts and Stmctures. London. pp 4R5-'i0 I
GANGADHARA. S ( 19'J7) "Cyclic Swell-Shrink Behaviour of I .aburatorv Compacted Expans1vc Soils''. f'h.D Thesis. Indian Institute of Science. llangalorc.
GRAMKO. G.J (I 'J74) "'Rev·iew of Fxpan.siv·c Soils". lou mal r!f' Geotechnical Engineering Division. ASCL Vol.l 00. No(>. rr 66 7-687.
GURUMURTHY. J. V. ( llJ93 J "'Behav·iour nf Expansive Soils Cushioned with
Stabilized with Rice !Jusk Ash and a Cnt1cal Appraisal of CNS Soil a.s a Cushion" /'h./)_ Thesis. Indian Institute of Science. llungalorc.
HOLLAND, J.E. and LAWRENCE. C. E. ( l<J80 J "Seasonal II eave of Australian Clav Soils", Proceedings . ./th !ntematirmal ('rmference on Expansive Soils. Denver.
Colorado, VoL!, pp.302-32l.
HUMAD, S. (1987) ''Critical Evaluation of Foundation Practices in Black Cotton Soils towards Economy in Design''. Ph.D. 7/lesis. Devi Ahalya Vishwavidyalaya. Indore.
IS 2720 (Part 41)-1977 (Reatlirmed 1987) "'Indian Standard Methods of Test for Soil - Part 41, Measurement of Swelling l'rcssure of Soils, Section I· Consolidometer method, Section 2: Constant volume method''. pp. 126-132.
JENNrNGS, JE and KERRIC!-1 . .IE. ( 1962) "'The Heaving of lluilding and the Associated Economic Consequences. v.ith Particular Reference to the Orange Free State Fields". Civil t."ngint>er in South .~ji-ica. Vol4. No. II.
JOHNSON, LD. (I 980) . "Field Test Section on Expansive Soils'', 4th international Cof!ference on Expansive Soils. ASCE, New York. NY. Vol.!. pp.262-283.
JUSTO, J.L, SAURA, L JARAMILLO, A, DELGADO, A and GENTIL, P (1985) : "Prediction and Performance j[)r Seasonal Swelling - Shrinkage of Buildings on Expansive Clays", Proceedings, 11th lntemational Conference on Soil Mechanics and Foundation Engineering, San Francisco, Vul.4, pp.2199-2204.

SWELL-SHRINK BEH.-\V!Ol1R OF EXPANSIVE SOILS 67
KATTL R.K. and KATE, J.M. ( 1lJ75) "Role of Micro Particles in Interaction between CNS Laver and Underlving Expansive Soil Media". Proc. 5th Asian Hegional ( 'miference on SAIFE. Han galore. lndi:1. Vol. I. pp.15-18.
KATTI. R.K. (1979) "First IGC Annual Lecture-Search t(Jr Solution to Problems in Black Cotton Soil" Indian (ieolechnical Jrmrna/, VoL'J. No.I, pp.l-80.
LlJNKAD. S.K. ( 1977) · "The Etlcct o! Soil Genesis and Expanding Lavcrcd Lattice Mineral on the Engineering Index l'ropcrtres of Residual Trappcan Soil of Malwa Plateau". Proceedings lsi Vatirmal Svmposium o1z Expansive Soils, Kanpur, India.
MAHESH KIJMAR, CP ( 1998) "Shear Strength and Volume Change Behaviour of Cumpa<.:ted Expansive Soils under C\Ciic Wetting and Drying", M.Sc (Eng.) llzesis, Indian Institute of Science. 1\angalore. India.
OSIPOV. V .. BIK. N.N. and RlJMJANTSEVA. N.A (lYR7J "Cyclic Swelling of Clavs". Applied Clay Scir>nce. Amsterdam. the Netherlands. 2(7). pp.363-.,74
POPESCU. M. (19SO) ·'Behaviour ot' Expansive Soils with Crumb Structures··. /'roceedings .Jth lntenzatirma/ Conji·rnzcu mz Lrpmzsive Soils. Denver. CO. VoL I. pp.!58-l71
RET MAL, E .. ORTl<iOSA P. and ACEVEDO. P ( l'J87) "Swelling Prediction Compared with In-situ Measurements in Santiago. Chile". Proceedings 6th /ntematirmal Cmzference 011 E\pwzsin' Soils. New Delhi. India, Vol.!, pp.ll 5-120.
RING. W. E. ( 19fio) "Shrink-Swell Potentials of Soils". lliglnrrry Research Record i\'o.l/9. National Ac:tdcrnv of Sciences - N:ttional Research Council Publication. No.l360. W:tshington. pp.l7-21
ROY. S and CHAR. AN .R ( Jl)(,l)) "Fnginccnng Characteristics of 131ack Cotton Soils as Related to their Mineralogtcal Composition", Proceedings Symposium on Black Col/on Soils, College nf MilitarY Engineering, Pun e. pp.l7.
SATY ADAS. C.CJ. ( !982) "Some Studies on Swelling and Shrinkage of Black Cotton Soils, with Particular Relcrencc to the Etfcets of Temperature and Humidity''. Plz.D. Ihesis. Ll.Sc, Bangalore, India.
SOROCHAN, E.A. ( Jl)'J I) ; Constmctiun of Buildings on Expansive Soils, Oxford and !Bll Publishing Co. Pvt. Ltd .. New Delhi.
SRIDHARAN, A and VENKATAPA RAO, G. (1973) "Mechanism Controlling Volume Change of Saturated Clays and the Role of Effective Stress Concept", Geotechnique. 23(3 ), pp.35Y-382.
SRIDI-IARAN, A and ALLAM. M.M. (!982) "Volume Change Behaviour of Desiccated Soils". Journal of Geotechnical Engineering Division, Proceedings of the American Society of Civil Engineers, ASCE, Vol.l08, No.GT8, pp.l057-!07l.
SRIDHARAN, A and RAO, A.S. ( 1982) "Mechanisms Controlling the Secondary Compression of Clavs". Geotechnique (London), Vo1.32, No.3, pp.249-260.
SUBBA RAO. K.S. and SATYADAS. G.C. (1980) "Pre-wetted and Over Loaded Expansive Soil'', Proceedings Geotech. 80, Bombay, pp.29-32.
SUBBA RAO, K.S., SARGUNAN, A. and AGARWAL, K.B. (1985) : "Regionat Deposits - Black Cotton Soils''. Proceedings Indian Contribution to Geotechnical Engineering, Commemorative volume, Sarita Prakashan, Meerut, India.

68 1:\DL\0: (;I OTECH:\IC\1 JOl R'\.\1
SUBBA RAO. K.S and S/\TY J\DAS. (J C (I 'J87) ··swelling Potcnti~ls with Cvcles of Swelling and Parti,d ShnnL!gc" l'roceedings 6th International
Conference on lc~\pw1siw Soils. ~elY DeihL India. Vol. I pp. 1:'7-I.J 7.
SUBBA RAO. K.S. SIVAI'lll.LIAJ-L I)V. and (ilJRc,f\H: 'rJIY. J.V. (ll)<J.J) "An Appraisal of CNS Mntcrial as a Cushion I<' Reduce S clling l'<lkntial". Indian I i<Cotcclmical Con/cTI!tlce. pp j7-i,IJ
SlJBf3,\ RJ\0. K.S. SIV/d'lii.IIAIL I'\ '"'d Cil!R\!IVWRIIIY . .IV il'~'l'J
"Cnlic Swell-Shrink lkh:tllllllr <1f C:NS-Cusltu•ncd l'.xi"""i,·c s,,ils" l'roceedi11gs lOth Asian Rf!gir!/lal ('on/L'I'<'ili<' on S .. \1. ,r I 1:. (I). pplt,)-l(,i\
S\JBBA R/\0. K.S .. Slillii/\KJ\1<. M k/\1\ 1111d lil\Nii,\IJI!/\RA S 1 I'J'I~J
"lland11idth ,,f Vntical M"1 cmcnl ol I \pan"' c .<;1\Jk. Indian ( :eo/,•cllllic,i/ ( 'onji·r<:nce. Ne11 DeihL V"l I. pp 71-7-1
S\IHBA FJ\11. K.S. and TRII';\liiY. S ( I'J'l'l) "Hcl""'"ur ,,f l~\pansi1c Suth under Changing I( hi thnh 111 Shrinkai!c .. lnditlll Ceo/,•c!JIIil a! ( 'on/l'renu:. l'akullcl
SIIBBA Ri\IJ. KS. Sl'IJII:\K;\]( '.: IZ\11 and Ci:\NifADitAI<.:\. S (~11.1 1 11
"Swelling Hcha1·i,,ur u ,, I lcsJccated Cl:i\ .. ( ieul<'clmical I <'S/1/Ig Journal. ;\mcncan
~:ocietv of Testing and fVLtter"''·'· (Tll appc'" I
TI·:IU.i\(1111. K. ITCK. 1<1, and MI,<;I<.J c; (l'l'lllJ lc'ngincering !'me/ice . .iuhn \Nile\ and Sr >n>. Inc
Sui! \fechunics in
llZEVJSAN. S.J tllJ87) ··""il Cwcking and Vt:rl!cal Jv1"1'ellr<:nt I hdric Pcgimc Rclati<>ll\hip. l\\>1 Case llistllncs 111 Ar.:cnttnu" l'ruc,·,·dings ri1!1 lnlerna/l!Jit<t! ('unji:rc'lli'<' ott fi.l'fl<IIISil"t• Soils. Ncn lklln. lndi11. Vt~l I. pp . .l-13-347
Tl<ll'All I Y. S. 1! ') 1J'J)
Shnnk C1 clc<. l'h.!J
WJ\Ill!\. llN (I<J75J -ltli cditil'IL •Jth tcprmt
"lkhill'lllllr ,,j l ''lllJ'ilC!cd lxp:!!hllc Snils undt:t Sl\cll!ltt'l/.1. Indian lrJsltlllk "' ScJcl!cc llallt'dlurc. lnd"'
WARKENTIN. IlP and llll/IJ/\JK. 'vl tl%11 ·Shrinkage and S\\elllllg l'mpc11ic.s ul· I I\ I\ Ctnad;an Cla1s .. !'rr,,·,·t'llutg.' 5th /n!er/l<lliunal C'lm/i'l"eil<'<' on
S\1. & Fl .. IJun<ld. 1':111s. l~:lllcc. ppX51-X''·
WRA Y. K. (I ')R7) "h•aluation of St11lic l:qutlibrium Soli Suction Fm·clupcs I(Jt l'rcdicting Clim!llc-induced Soil Suction Ch111i~cs llccurriu~ beneath l\l\'ered Surlaccs" Proceedings 61!1 ln!t'I'J/<iliunul ( ·uii/L'I'<'IICL' lilt F.Yf!<l/1.\il'e Suils. Nc11 I Jclhi. Vol.!. pp.2.1'-2·1'J.
XI UNCi. llli/\N(1 (I 'JX7) ·The Idcntilicati"n and Cbssilication of Fxp11nsivc Soils m Cllllw". /'rocecdings {Jf/i lnkrlla/111/1111 ( 'ollj(erelu e nit l'xpmlsil·e Soils.
Nc11 Delhi. India. Vt•l.l
XINFANG. JL, UN. C and IJECiUO. W. ti'JX71 "The L!l(;ct of Foundation Cmer on Expansive Soils", Proceedings 6/h luiernulirillal CoJI/<'I"OICI! oil Expansive Soils.
New Delhi, India. Vol!. pp.275-279.
/.FITLEN. Hi. anJ KOMIJRNIK. /\. (I 'JiJ I) "!Jcformati,lll and Moisture Movements in Fxp,msi\'e Cla\S". Procef!dings 5ih lntentalional Cm!fi'rence on Soil
.\fechanics and Fm~~tdalimz Fngi11eering. v,,l.l. pp.873-X79.