k+s aktiengesellschaft berenberg food ingredients and ... · k+s aktiengesellschaft. berenberg food...
TRANSCRIPT

K+S Aktiengesellschaft
Berenberg Food Ingredients and Chemicals Conference 201615 September 2016
Martin Heistermann, Senior Investor Relations Manager

K+S Group 2
K+S Group
Investment CaseTwo-pillar strategy
Global Presence
Positioned for growthEarnings-based dividend policy
Attractive mid-term outlookBalanced regional portfolio
Sustainable margin growth through specialisationCost discipline

K+S Group 3
Our ProductsK+S Group
De-icing
Fertilizer
Food processing
Chemicals
Pharma
Oil & Gas
Agriculture(Feed)
~ 10m tons
~ 6m tons
~ 11m tons

K+S Group
Inevitable for life…and for K+SSalt
4
Main Applications: Food processing
industry Baking industry Condiment and
preservative agent
Main Applications: Chemical industry Chlor-Alkali
processes (→ PVC) Polycarbonates ,
MDI (Isocyanat)(→ plastics, synthetic resin)
Synthetic Soda Ash (→ glass)
Main Applications: Winter road
maintenance services
Commercial users Private
households
Main Applications: Water treatment Drilling fluids Animal feed Infusion, dialysis
solutions Pharmaceuticals Preserving of fish Dyeing works Leather treatment
De-Icing Food processing Industrial ChemicalConsumer
Main Applications: Table salt Dishwasher care Water softening Pool chlorination Body care

K+S Group 5
Unrivalled Global Production NetworkSalt
More than 30 assets on 3 continents Ensuring close proximity to customers Best in class supply chain assets and competence Industry best cost production in Chile
Project in Australia launched

K+S Group 6
Balanced FertilizationPotash and Magnesium Products
Plants need sunlight, water and minerals
Only few soils with sufficient availability of plant nutrients
Potash is an indispensablesupplement to natural nutrient content of soils
Potash not substitutable

K+S Group 7
¼ of a Soccer Field Remains to Feed One Person 2050Potash and Magnesium Products

K+S Group 8
Utilizing Entire Range of Minerals in Complex DepositsPotash and Magnesium Products
KCL (MOP)3.1
Industrial products
0.7
Specialties3.0
6.8
SOP
Korn-Kali
Kieserite
Industrial potash
Health Care & Nutrition

K+S Group 9
Q12012
Q12013
Q12014
Q12015
Q12016
Bas
is: Q
120
12
Q12014
Q22014
Q32014
Q42014
Q12015
Q22015
Q32015
Q42015
Q12016
Q22016
Basi
s: Q
120
14
K+S average selling price versus selected peers
MOP gran. Europe vs. Brazil (Source: FMB)
200
300
400
500
600
200
300
400
500
600
Europe (€, Granular, cfr)
Brazil(US$/t, Granular, cfr)
US$/t €/t
2011 2012 2013 2014 2015 2016
K+S K+S
Potash and Magnesium ProductsOur Unique Portfolio Makes Us More Robust

K+S Group 10
Strengthening our Global Presence Legacy Project
ChinaIndiaSouth East Asia
North America
South America

K+S Group 11
ValuationLegacy Project
~90
2017 2018 2019 2020 2021 2022 2023
Cost
sper
ton
(CAD
)
Volume ramp-up (m metric tons) /costs per ton (CAD)
Production costs Logistics costs Mining taxes/ royalties
<1 ~2 ~2.1 ~2.3 ~2.4 ~2.6 ~2.9Sales volumes (m metric tons)
Implied Value Per Share (€)
Terminal growth rate
0% 2%
WAC
C
7% ~ 21
8% ~ 11
Volume ramp-up (m metric tons)/ costs per ton (CAD)
Main assumptions:
Unaffected potash production Potash price level of summer 2015
(time of release of guidance)

K+S Group 12
K+S Group
Q2/16 ResultsLower potash prices
Dry weather
Fit for the FutureMild winter weather
Full-year guidanceMissing deep-well injection
High extraordinary impactsCost discipline

K+S Group 13
Weak Second Quarter in Both Business UnitsK+S Group
179
15
Q2/15 Volume/ Price Missing deep-well injection
Fit for the Future Q2/16
EBIT I in € million
• Potash price andproduct mix
• Mild winter in salt
• Werra productionstandstills
K+S Group 14
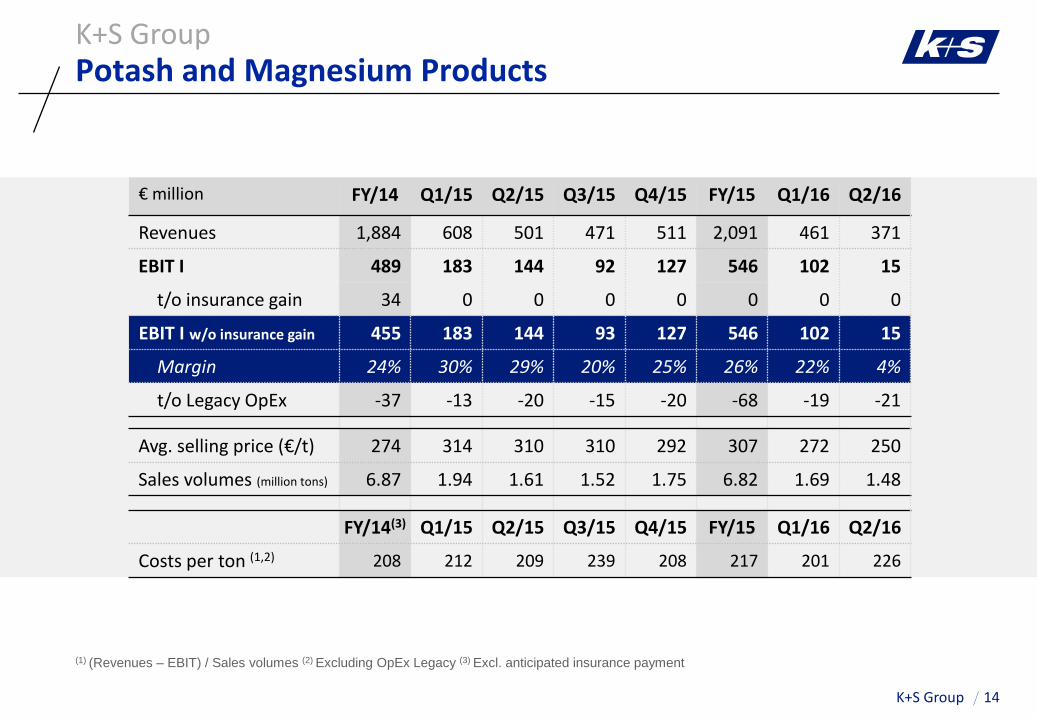
Potash and Magnesium ProductsK+S Group
(1) (Revenues – EBIT) / Sales volumes (2) Excluding OpEx Legacy (3) Excl. anticipated insurance payment
€ million FY/14 Q1/15 Q2/15 Q3/15 Q4/15 FY/15 Q1/16 Q2/16
Revenues 1,884 608 501 471 511 2,091 461 371
EBIT I 489 183 144 92 127 546 102 15
t/o insurance gain 34 0 0 0 0 0 0 0
EBIT I w/o insurance gain 455 183 144 93 127 546 102 15
Margin 24% 30% 29% 20% 25% 26% 22% 4%
t/o Legacy OpEx -37 -13 -20 -15 -20 -68 -19 -21
Avg. selling price (€/t) 274 314 310 310 292 307 272 250
Sales volumes (million tons) 6.87 1.94 1.61 1.52 1.75 6.82 1.69 1.48
FY/14(3) Q1/15 Q2/15 Q3/15 Q4/15 FY/15 Q1/16 Q2/16
Costs per ton (1,2) 208 212 209 239 208 217 201 226

K+S Group 15
SaltK+S Group
€ million FY/14 Q1/15 Q2/15 Q3/15 Q4/15 FY/15 Q1/16 Q2/16
Revenues 1,779 727 374 382 442 1,925 595 319
EBIT I 173 142 43 43 39 266 123 5
Margin 10% 20% 11% 11% 9% 14% 21% 2%
Sales volumes (million tons) 23.6 9.1 3.6 3.8 4.7 21.1 7.1 2.9
De-icing 14.4 6.9 1.2 1.5 2.3 11.9 4.9 0.6
Non de-icing 9.2 2.2 2.4 2.3 2.4 9.2 2.2 2.3
Average selling prices (€)
De-icing 53 65 65 62 67 65 64 53
Non de-icing 104 119 120 124 118 120 122 123

K+S Group
Update on deep-well injection
16
Review of the application is ongoing
Originally expected to be completed in summer 2016
Currently, saline wastewater can only be disposed to a limited extent
Production largely based on water flow rate of the Werra river
Potash and Magnesium Products
Mai Jun Jul Aug
Wat
erflo
wW
erra
May Jun Jul Aug

K+S Group
K+S GroupGuidance 2016: EBIT I also Influenced by Extraordinaries
17
Actual2015
Volume-/price
Missing deep-well injection
permit
Othereffects(net)
Fit for theFuture
2016e
782
€ million
200
300
2016e EBIT I range
Main effects:- OpEx Legacy- Higher D&A
200

K+S Group 18
K+S Group
Management AgendaCommissioning Legacy
Lower CapEx
Fit for the FutureManage environmental challenges
Enhancing portfolio of higher yielding productsSalt 2020
Potash fundamentals to improveCost discipline

K+S Group
From Capex to CashK+S Group
19
Today 2020
Leverage1.0-1.5x
CapexMaintenance
FCFPositive
EBITDA1
~ € 1.6 billion
Leverage (LTM)3.6x
Capex2
€ 1.3 billion
FCFNegative
EBITDA3
€ 0.5-0.6 billion
Keeping cost discipline above
and beyond “Fit for the
Future”
Successful implementation of “Salt 2020“
Strategy
Enhancing portfolio of
higher yielding products
Managing environmental
challenges particularly in
Germany
Commissioning of Legacy
Fundamentals of the potash business expected to improve
1 Main assumptions: Unaffected potash production in Germany and Canada; Potash price level of summer 2015; USD/EUR 1.10; Normalized winter2 2015 3 Guidance 2016

K+S Group 20
Commissioning Continues Despite Incident in July Commissioning of Legacy
No injuries 1 of 5 crystallizers dropped Impact on ramp-up:
− Commissioning continues− Production of first ton
delayed into Q2/17 − Production volume 2017
below previously planned (up to 1 million tons)
Capacity of 2 million tons p.a. expected to be reached by the end of 2017

K+S Group 21
Deep-well injection: Measures for the short-termManaging Environmental Challenges in Germany
1997 2006 2012 2015 2016 2017 Beyond
Werra + Deep-well injection Measures Gap
20
10
14
7 7 7 5.5
Identification and implementation of measures
to bridge 2016/2017
KCF plant
Million m³

K+S Group 22
Two Bolt-On Acquisitions in Both Business UnitsEnhancing Portfolio of Higher Yielding Products
One of the largest producers of synthetic magnesium sulphate
Oil palms, soybeans and sugar cane and industrial applications
Improved access to growth markets of South-East Asia and China
Scalable low cost production assets
Huludao
Expected capacity of 3.5 million tons of salt for chemical industry in Asia
CapEx of around € 225 million
Possible production start in 2022
K+S Group
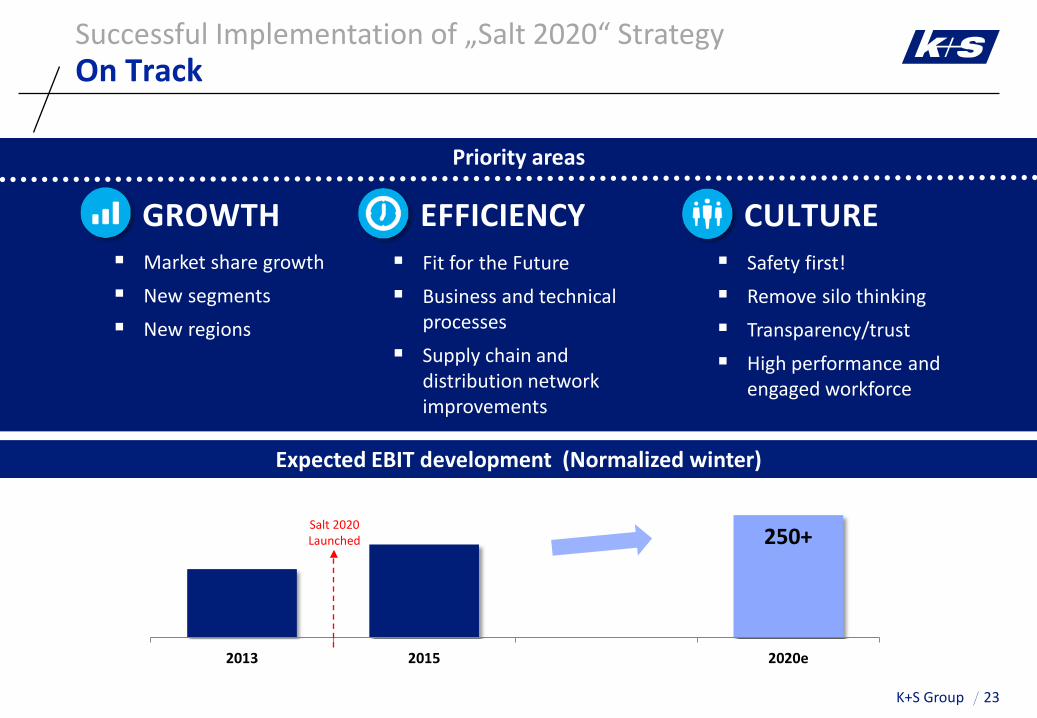
250+
2013 2015 2020e
23
On TrackSuccessful Implementation of „Salt 2020“ Strategy
Expected EBIT development (Normalized winter)
Safety first! Remove silo thinking Transparency/trust High performance and
engaged workforce
Fit for the Future Business and technical
processes Supply chain and
distribution network improvements
Market share growth New segments New regions
Salt 2020 Launched
Priority areas
GROWTH CULTUREEFFICIENCY

K+S Group
2013 2014 2015 2016
>150
30
>180
24
Cost Discipline Will Remain HighKeeping Cost Discipline Above and Beyond ‚Fit for the Future‘
on track
€ million
“Fit for the Future” on track More than 2/3 of total
aspirations achieved Measures implemented will
continue beyond 2016 with full effects until 2018
Further top-down measures beyond “Fit for the Future” initiated Effects coming through in
2017 and 2018

K+S Group 25
Debt ProfileK+S Group
Bond I € 500 million(expn. June 2022; coupon: 3.000%)
Bond II € 500 million(expn. Dec 2021; coupon: 4.125%)
Bond III € 500 million(expn. Dec 2018; coupon: 3.125%)
RCF € 1 billion
Debt Instruments
2016 2017 2018 2019 2020 2021 2022
Schuldschein € 700 million(3-yrs: € 295 million; 5-yrs: € 365 million; 7-yrs: € 40 million)
K+S Group
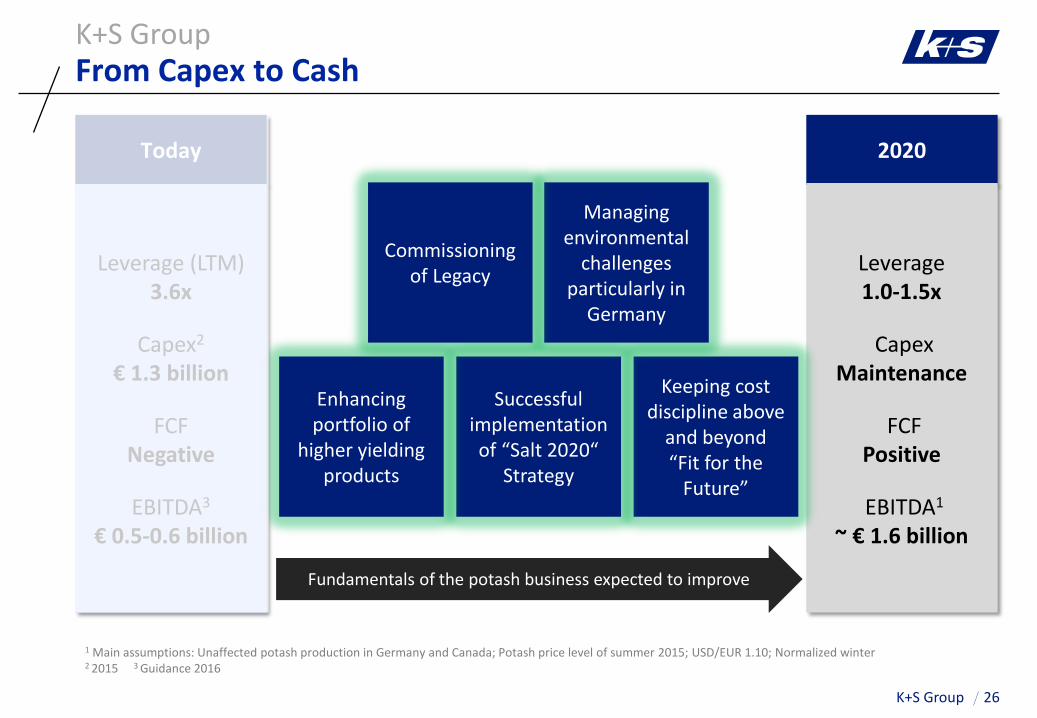
From Capex to CashK+S Group
26
Today 2020
Leverage1.0-1.5x
CapexMaintenance
FCFPositive
EBITDA1
~ € 1.6 billion
Leverage (LTM)3.6x
Capex2
€ 1.3 billion
FCFNegative
EBITDA3
€ 0.5-0.6 billion
Keeping cost discipline above
and beyond “Fit for the
Future”
Successful implementation of “Salt 2020“
Strategy
Enhancing portfolio of
higher yielding products
Managing environmental
challenges particularly in
Germany
Commissioning of Legacy
Fundamentals of the potash business expected to improve
1 Main assumptions: Unaffected potash production in Germany and Canada; Potash price level of summer 2015; USD/EUR 1.10; Normalized winter2 2015 3 Guidance 2016

K+S Group 27
IR Contact DetailsK+S Group
E-Mail: [email protected]: www.k-plus-s.comIR-website: www.k-plus-s.com/en/ir
K+S AktiengesellschaftBertha-von-Suttner-Str. 734131 Kassel (Germany)
Laura SchumberaJunior Investor Relations ManagerPhone.: +49 561 / 9301-1607Fax: +49 561 / [email protected]
Thorsten BoeckersHead of Investor RelationsPhone: +49 561 / 9301-1460Fax: +49 561 / [email protected]
Andrea RachInvestor Relations AssistantPhone: +49 561 / 9301-1100Fax: +49 561 / [email protected]
Martin HeistermannSenior Investor Relations ManagerPhone.: +49 561 / 9301-1403Fax: +49 561 / [email protected]
Patrick KoflerSenior Investor Relations ManagerPhone.: +49 561 / 9301-1885Fax: +49 561 / [email protected]

K+S Group 28
Forward-Looking StatementsK+S Group
This presentation contains facts and forecasts that relate to the future development of the K+S
Group and its companies. The forecasts are estimates that we have made on the basis of all the
information available to us at this moment in time. Should the assumptions underlying
these forecasts prove not to be correct or should certain risks – such as those referred to in
the Risk Report of the Annual Report – materialize, actual developments and events may deviate
from current expectations. The Company assumes no obligation to update the statements, save
for the making of such disclosures as are required by the provisions of statute.

K+S Group

K+S Group 30
K+S Group
K+S Aktiengesellschaft · Bertha-von-Suttner-Straße 7 · 34131 Kassel | Germany · Internet: www.k-plus-s.comInvestor Relations · phone: +49 (0)561 / 9301-1100 · fax: +49 (0)561 / 9301-2425 · email: [email protected]
Financial Calendar 2016/17: 10 Nov: Q3/16 – 16 Mar: FY/16
K+S Share• WKN: KSAG88• ISIN: DE000KSAG888 • Ticker-Symbols:
Bloomberg SDF / Reuters SDFG
K+S ADR• CUSIP: 48265W108 • ADR Ticker-Symbol:
Bloomberg: KPLUY / Reuters: KPLUY.PK
K+S Bond 06/2022• WKN: A1P GZ8• ISIN: DE000A1PGZ82
K+S Bond 12/2018• WKN: A1Y CR4 • ISIN: XS0997941199
K+S Bond 12/2021• WKN: A1Y CR5• ISIN: XS0997941355