krista m. stimson and paula m. vertino* department of ...aaa cc-3™, d: 5™-ttt tat tgt atg tgg...
TRANSCRIPT
Methylation-mediated silencing of TMS1/ASC is accompanied by
histone hypoacetylation and CpG island-localized changes in chromatin architecture1
Krista M. Stimson and Paula M. Vertino*
Department of Radiation Oncology and the Winship Cancer Institute
Emory University School of Medicine, Atlanta GA, 30322
Running Title: Methylation and Chromatin Structure in TMS1 Silencing
*Correspondence to:
Paula M. Vertino, Ph.D.Winship Cancer InstituteEmory University School of Medicine1365-B Clifton Road, NE, Rm B5119Atlanta GA 30322Phone: 404-778-3119Fax: 404-778-3965email: [email protected]
Copyright 2001 by The American Society for Biochemistry and Molecular Biology, Inc.
JBC Papers in Press. Published on December 3, 2001 as Manuscript M109809200 by guest on M
arch 18, 2020http://w
ww
.jbc.org/D
ownloaded from

2
Summary
Aberrant methylation of CpG dense islands in the promoter regions of genes is an
acquired epigenetic alteration associated with the silencing of tumor suppressor genes in human
cancers. In a screen for endogenous targets of methylation-mediated gene silencing, we
identified a novel CpG island-associated gene, TMS1, that is aberrantly methylated and silenced
in response to the ectopic expression of DNA methyltransferase-1. In this study, we
characterized the methylation pattern and chromatin architecture of the TMS1 locus in normal
fibroblasts and determined the changes associated with its progressive methylation. In normal
fibroblasts expressing TMS1, the CpG island is defined by an unmethylated domain that is
separated from densely methylated flanking DNA by distinct 5' and 3' boundaries. Analysis of
the nucleoprotein architecture of the locus in intact nuclei revealed three DNAse I hypersensitive
sites that map to within the CpG island. Strikingly, two of these sites coincided with the 5' and 3'
methylation boundaries. Methylation of the TMS1 CpG island was accompanied by loss of
hypersensitive site formation, hypoacetylation of histones H3 and H4, and gene silencing. This
altered chromatin structure was confined to the CpG island, and occurred without significant
changes in methylation, histone acetylation or hypersensitive site formation at a fourth DNAse I
hypersensitive site 2 kb downstream of the TMS1 CpG island. The data indicate that there are
sites of protein binding and/or structural transitions that define the boundaries of the
unmethylated CpG island in normal cells, and that aberrant methylation overcomes these
boundaries to direct a local change in chromatin structure, resulting in gene silencing.
by guest on March 18, 2020
http://ww
w.jbc.org/
Dow
nloaded from

3
Introduction
Cytosine methylation is a post-replicative modification of DNA that plays an important
role in epigenetic inheritance. In vertebrates, methylation occurs primarily at cytosines within the
dinucleotide CpG. Both the distribution of CpG sites and their methylation status is non-random
in the human genome, generating a pattern of DNA methylation that varies with respect to
density across the chromosome. CpG sites occur relatively infrequently throughout much of the
human genome, except in discreet regions of CpG-dense DNA known as CpG 'islands'. These
islands are ~200-1000 bp in length and often coincide with the 5' ends of genes. Accordingly, the
identification of such regions in the human genome sequencing projects has been useful in gene
prediction (1). Current estimates suggest that there are ~29,000 CpG islands in the human
genome (2). Whereas non-CpG island DNA is generally methylated, most CpG islands remain
methylation-free in both expressing and non-expressing tissues (3,4). Specialized physiologic
cases in which CpG islands are methylated include genes subject to parental imprinting and
genes on the inactive X chromosome (5,6). Here methylation functions as part of an epigenetic
mechanism ensuring the stable propagation of allele-specific gene repression.
In human cancers, CpG island methylation occurs aberrantly, and is associated with the
inappropriate silencing of tumor suppressor genes and other genes that function in the
suppression of the malignant phenotype. Methylation-mediated silencing contributes to
malignant progression at several levels, and has been implicated in the inactivation of genes
involved in tumor suppression (e.g. Rb, VHL and CDKN2A), the regulation of DNA repair and
genome integrity (e.g. MLH1, MGMT, BRCA1), and the suppression of metastases (e.g. CDH1
and TIMP3) (reviewed in (7-9)). Recent evidence suggests that aberrant methylation also
contributes to human carcinogenesis by conferring resistance to cell death signals through the
silencing of genes that promote apoptosis (10-13). In each of these cases, aberrant methylation of
by guest on March 18, 2020
http://ww
w.jbc.org/
Dow
nloaded from
4
promoter region CpG islands is associated with loss of gene expression in tumor-derived cell
lines and primary tumors relative to normal somatic cells. That methylation plays a primary role
in the silencing of these genes is supported by the fact that treatment with a demethylating agent
such as 5-aza-2'-deoxycytidine is sufficient to restore expression and, in many cases, gene
function.
At present, it is not known how or why particular CpG islands succumb to aberrant
methylation in cancer cells, and the precise mechanism in which an unmethylated, actively
transcribed gene progresses to a methylated and inactive state is unclear. One established
consequence of CpG island methylation is transcriptional repression. Methylation of cytosine can
affect gene expression directly, by interfering with the binding of transcription factors like E2F
and AP-2 (14,15), or indirectly, through the recruitment of proteins that bind preferentially to
methyl CpG through a methyl CpG binding domain (MBD)1 (reviewed in (16,17)). The MBD
proteins are found within complexes containing histone deacetylases (HDAC) and chromatin
remodeling factors (18-21). The accidental methylation of a CpG island during carcinogenesis
could serve to re-direct the MBDs and chromatin remodeling machinery to newly methylated
DNA, resulting in aberrant gene silencing. The recent observation that the DNA
methyltransferases (DNMTs), DNMT1, DNMT3a and DNMT3b possess intrinsic transcriptional
repressor activity and interact directly with HDACs (22-26) also raises the intriguing possibility
that methylation-dependent gene silencing may be directed by the DNA methyltransferases
themselves through the recruitment HDACs to their methylation targets.
To study the factors involved in aberrant methylation targeting and its consequences in
somatic cells, we have utilized a human fibroblast model system in which de novo methylation is
induced by the ectopic expression of DNA methyltransferase-1 (DNMT1). In previous studies,
we showed that the overexpression of DNMT1 results in the progressive de novo methylation of
by guest on March 18, 2020
http://ww
w.jbc.org/
Dow
nloaded from

5
endogenous CpG island sequences (27,28). Using this model, we recently identified a novel CpG
island-associated gene, TMS1 (Target of Methylation-induced Silencing), that is aberrantly
methylated and silenced in response to DNMT1-driven methylation (13). Further studies
indicated that TMS1 is silenced in association with aberrant methylation in human breast cancer
cell lines and primary tumors, implicating TMS1 as a putative tumor-suppressor in breast cancer
(13). TMS1 encodes a caspase recruitment domain protein and functions as a positive mediator
of apoptosis (29). TMS1 was independently identified (and named ASC) by Masumoto et al. (30)
who showed that decreased expression of TMS1 results in reduced sensitivity to anticancer
agents. Methylation-mediated silencing of TMS1 thus may contribute to breast carcinogenesis by
allowing cells to bypass apoptosis, and may confer resistance to cancer chemotherapeutic agents
or other genotoxic stress.
In this study, we used bisulfite genomic sequencing, DNAse I hypersensitive site
mapping and chromatin immunoprecipitation to characterize the methylation pattern and the
chromatin architecture of the TMS1 locus in normal human fibroblasts, and to determine the
changes associated with its progressive methylation in immortalized and DNMT1
overexpressing derivatives. We find that in normal fibroblasts, the TMS1 CpG island is
comprised of an unmethylated domain with distinct 5' and 3' methylation boundaries. Three
DNAse I hypersensitive (HS) sites mapped to within the CpG island, with two coinciding almost
precisely with the positions of the methylation boundaries. De novo methylation of the CpG
island in DNMT1 overexpressing cells was accompanied by loss of CpG island-specific HS
formation, localized hypoacetylation of histones H3 and H4, and gene silencing. We propose that
there are protein binding sites that demarcate the boundaries of TMS1 CpG island in normal
cells, and that aberrant methylation overcomes these boundaries to direct a localized change in
chromatin architecture, resulting in gene silencing.
by guest on March 18, 2020
http://ww
w.jbc.org/
Dow
nloaded from

6
Experimental Procedures
Cell Culture and Drug Treatments
Normal diploid human fibroblasts (IMR90) and SV40 immortalized IMR90 cells
(referred to as �90SV�) were obtained from the National Institute on Aging Cell Repository
(AG02804C) and were maintained in EMEM with 2mM glutamine and 10% FCS. The
generation of a 90SV derivative cell line stably overexpressing the human cytosine 5-DNA
methyltransferase-1 (HMT.1E1) has been reported (27). HMT.1E1 cells were maintained in
EMEM plus 2mM glutamine, 10% FCS and 400µg/ml G418. HMT.1E1 cells were seeded in
75cm2 flasks overnight and treated the next day with 100ng/ml Trichostatin A (TSA) (Sigma) or
500nM 5-aza-2�-deoxy-cytidine. For the combined treatments cells were treated with 500nM 5-
aza-2�-deoxycytidine for 72 hours and 100ng/ml TSA was added for the last 24 hours.
Bisulfite Sequencing and Methylation Specific PCR
Genomic DNA was treated with sodium bisulfite as previously described (31). For
methylation-specific PCR, approximately 50ng of bisulfite-modified DNA was amplified by
PCR under the following reaction conditions: 67mM Tris-HCl (pH 8.8), 16.6 mM NH4SO4, 6.7
µM EDTA, 10mM β-mercaptoethanol, 6.7 mM MgCl2 and 1µM each primer in a 25µl reaction.
A hot start was preformed (5min 950C) followed by the addition of 0.5u Taq polymerase (Life
Technologies) and 35 cycles of PCR (950C, 30s; 580C, 30s; 720C, 30s) with a final extension of 4
min at 720C. Primers were designed from the interpolated sequence after bisulfite conversion
assuming DNA was either methylated or unmethylated at three CpG sites. Primers used for
methylated reactions were 5�-TTG TAG CGG GGT GAG CGG C-3� and 5�-AAC GTC CAT
AAA CAA CAA CGC G-3�. Primers used for the unmethylated reactions were 5�-GGT TGT
AGT GGG GTG AGT GGT �3� and 5�-CAA AAC ATC CAT AAA CAA CAC A-3�. Reaction
by guest on March 18, 2020
http://ww
w.jbc.org/
Dow
nloaded from
7
products were separated by electrophoresis on a 6% polyacrylamide/Tris-borate-EDTA gel,
stained with ethidium bromide and photographed.
For genomic sequencing, 50 ng bisulfite-modified DNA was amplified by PCR using the
same reaction conditions described above except that annealing temperature was 550C and the
final extension was increased to 10 minutes. Primers were designed to avoid potential
methylation sites (e.g. CpG) such that both methylated and unmethylated DNA would be
amplified equally. The resulting amplification pools were cloned into the pCR2 vector using the
TOPO TA Cloning kit (Invitrogen). Eight to twelve individual subclones per PCR reaction were
isolated and sequenced. Primer pairs used for bisulfite genomic sequencing were: A: 5�-GAA
ATT GAA GTT TAG AGA GAT TTG-3� and 5�-CCC TTA ATC CCC TCC CAC C-3�, B: 5�-
TTG GTG TAA GTT TAG AGA TAA GT-3� and 5�-ACC ATC TCC TAC AAA CCC ATA-3�,
C: 5�-AAG TTG GTT AGT TTT TAT TTG GAG-3� and 5�-CTT CAA AAA TTC CTC TAC
AAA CC-3�, D: 5�-TTT TAT TGT ATG TGG GGT TTT GG-3� and 5�-CTC TAC ACA TAC
CAA CAA ACT AAA-3�, E: 5�-GGT ATG TGT AGA GTT TAG TTA TG-3� and 5�-CAC TAC
ACT CCA ATC TAA ATA AC-3�.
DNase I Hypersensitivity
Cells (1x10⁷ ) were resuspended in Nuclei Isolation Buffer (RBS)(10 mM Tris, pH 7.4, 5
mM MgCl2, 0.5 mM DTT, 0.3 mM sucrose, 0.4 mM PMSF and 0.1% NP-40) and swollen on ice
for 10 min. This was followed by dounce homogenization and nuclei were collected by
centrifugation at 1,500g. Nuclei were resuspended in RBS without NP-40 and immediately
added to prepared aliquots of DNase I (GibcoBRL) and 0.1mM CaCl2 for 10min at room
temperature. As controls, nuclei were incubated in the presence of CaCl2 without DNAse I
(endogenous nuclease control) or in the absence of DNAse I (nuclease free reference). Reactions
were stopped by the addition of an equal volume of 20mM EDTA, 1% SDS, 10µg/ml RNAse A
by guest on March 18, 2020
http://ww
w.jbc.org/
Dow
nloaded from

8
and incubated at 370C for 30min. DNA was then isolated by Proteinase K digestion,
phenol:chloroform extraction and ethanol precipitation. Ten µg of DNA was digested with Hind
III and electrophoresed on a 25 cm, 1.0 % agarose gel. The gel was transferred to a nylon
membrane and hybridized to a random-prime labelled 423bp HindIII-XbaI fragment anchored to
the 3� HindIII site of the TMS1 locus. Blots were washed to a final stringency of 0.1XSSC, 0.1%
SDS at 650C and exposed to X-ray film (Biomax-MS, Kodak).
Chromatin Immunoprecipitation (ChIP)
Chromatin immunoperciptation was performed using antibodies specific for the
acetylated isoforms of histone H4 and H3 in accordance with the protocol provided by the
supplier (Anti-acetyl Histone H4, Chip Grade and Anti-acetylated Histone H3, Upstate
Biotechnology, Lake Placid, NY). DNA fragments immunoprecipitated with anti-acetylated H3
or anti-acetylated H4 were analyzed by multiplex PCR using primers spanning HS1, HS2, HS3
or HS4 of the TMS1 locus in combination with primers specific for the β-actin promoter region.
Multiplex PCR was carried out under the following reaction conditions: 67mM Tris-HCl (pH
8.8), 16.6 mM NH4SO4, 6.7 µM EDTA, 10mM β-mercaptoethanol, 6.7 mM MgCl2 and 1µM
each primer in a 25µl reaction. A hot start was performed (5min, 950C) followed by the addition
of 0.5u Taq polymerase (Life Technologies) and 35 cycles of PCR (950C, 30s; 550C, 30s; 720C,
30s) with a final extension of 720C for 4min. PCR products were electrophoresed on a 2%
agarose gel, stained with ethidum bromide and photographed. The ratio of intensities of the
TMS1 product to β-actin product in each reaction was determined from digital images using
Scion Image software (Scion Corporation). The PCR conditions used were within the linear
range of amplification for input DNA. Primer pairs derived from the TMS1 genomic sequences
surrounding the DNase I hypersensitive sites (HS1: 5�-CCA GCT GGA GGG CGC GA-3� and
5�-GCC GCC GAC CAG GAG GA-3�, HS2: 5�-ACC TGG AGA CCT ACG GCG and 5�-GGC
by guest on March 18, 2020
http://ww
w.jbc.org/
Dow
nloaded from

9
CAA GCG TGG GGA GC-3�, HS3: 5�-ACC CTC ATC CAA CTG CAT G-3� and 5�-ATC CAG
CAG CCA CTC AAC G-3�, HS4: 5�-GGT CAT AGG TTG CAC TTT GC-3� and 5�-AGC TTG
AAC CTG GGA GGT G-3�) were each paired with primers from the promoter region of the
human β-actin gene (5�-CCT CAA TCT CGC TCT CGC T-3� and 5�-CGC GCC TGC GAA
CTG GC-3�).
Reverse Transcriptase-PCR
Total RNA was isolated from log-phase cells by the Chomsynski and Sacchi method
(32). Six µg of total RNA was pretreated with amplification grade DNAse I (Life Technologies)
and reverse transcribed using random hexamer primers and MMLV-reverse transcriptase (Life
Technologies). One-thirtieth of the reverse transcriptase reaction (200ng of starting RNA) was
used in a PCR reaction. The PCR conditions were: 67mM Tris-HCl (pH 8.8), 16.6mM NH4SO4,
6.7µM EDTA, 10mM β-mercaptoethanol, 4.7mM MgCl2, 10% DMSO, and 400nM each primer
in a 25µl reaction. A hot start was performed (5 min, 950C), followed by 35 cycles of 95 0C, 30
s; 55 0C, 30 s; 720C, 30s. TMS1 primers were 5�- TGG GCC TGC AGG AGA TG-3� and 5�-
ATT TGG TGG GAT TGC CAG-3.� β-actin primers were 5�-CCT TCC TGG GCA TGG AGT
CCT G-3� and 5�-GGA GCA ATG ATC TTG ATC TTC-3�. For multi-cycle experiments,
samples were withdrawn from a 100µl PCR reaction after 20, 30 and 40 cycles for TMS1 or after
15, 25, 35 cycles for β-actin. Samples were run on a 2% agarose gel, transferred to a nylon
membrane and hybridized to random prime labeled TMS1 or β-actin cDNA probe. Blots were
washed to a final stringency of 0.1XSSC, 0.1% SDS at 650C and exposed to X-ray film
(Biomax-MS, Kodak).
by guest on March 18, 2020
http://ww
w.jbc.org/
Dow
nloaded from

10
Results
We identified TMS1 in a PCR-based subtractive cDNA screen to isolate transcripts that
were downregulated in human fibroblasts stably overexpressing DNMT1 (13). We have shown
previously that TMS1 is expressed in normal human diploid fibroblasts (IMR90) and their SV40-
immortalized counterparts (90SV cells), but is silent in the 90SV derivative cell line expressing
50-fold increased levels of DNMT1 (HMT.1E1 cells) (13). These cell lines represent a useful
model for studying the genesis and consequences of aberrant CpG island methylation in that they
are derived from a common parent (IMR90) yet differ in their expression and methylation status
at the TMS1 locus.
To examine the role of DNA methylation in TMS1 silencing, we first characterized the
TMS1 locus with regards to structure and methylation status in normal diploid fibroblasts
(IMR90). The coding sequence of TMS1 covers approximately 1.5 kb on chromosome 16p11.2.
The promoter region of TMS1 lacks a defined TATA box but contains a 600 bp CpG island
predicted on the basis of C+G content (69%) and CpG frequency (CpG observed/expected =
0.82) which extends from approximately 200 bp upstream to 400 bp downstream of a single
transcription start site (position 1177, Figure 1A and data not shown). Genomic sequencing of
bisulfite modified DNA was used to construct a map of the methylation status of 110 CpGs
across 2.5 kb of the TMS1 locus. Five overlapping regions covering the TMS1 locus were
amplified from bisulfite treated DNA. PCR products were then subcloned and individual clones
sequenced. This allows for the assessment of the methylation status of independent alleles
derived from the cell population. Figure 1B shows the percent of alleles methylated at each CpG
site as determined from the analysis of eight to sixteen individual alleles for each primer set. The
TMS1 locus was characterized by an unmethylated domain that extended from ~100 bp upstream
to ~1 kb downstream of the transcription start site, and encompassed the entire predicted CpG
by guest on March 18, 2020
http://ww
w.jbc.org/
Dow
nloaded from
11
island plus ~500 bp of additional downstream sequence (Figure 1B). CpGs within this region
were methylated in no more than 1 allele per 8-16 analyzed with exception of one CpG site in
which 3/8 alleles analyzed were methylated. In contrast, sequences upstream of nt 1100 and
downstream of 2100 were densely methylated, with distinct 5� and 3� boundaries separating the
unmethylated CpG island region from heavily methylated flanking DNA (Figure 1B). Primary
mammary epithelial cells are also completely devoid of methylation on 8-10 individually
sequenced alleles in the region from 1100 to 2000 (data not shown). Thus, the pattern shown
here appears representative of normal tissues.
To determine the relationship between methylation of TMS1 and gene silencing, we next
analyzed the methylation pattern of 500 bp surrounding the transcription start site (primer set B,
see Figure 1) in the IMR90 fibroblasts, their SV40 immortalized derivatives, the 90SV cells, and
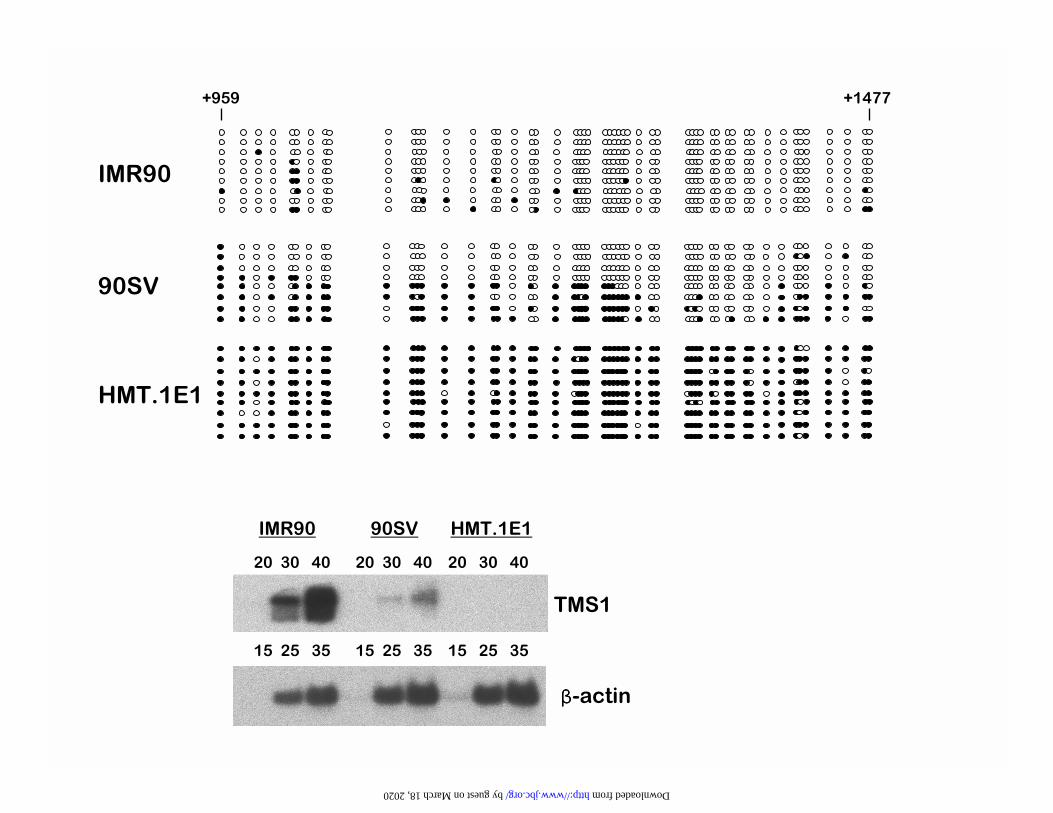
the DNMT1 overexpressing derivative HMT.1E1 cells. As discussed above, TMS1 was almost
completely unmethylated on individual alleles downstream of nt 1100 in IMR90 cells (Figure
2A). Of the few sites that showed methylation, they appeared to be random in that no single CpG
site was methylated in more than one allele analyzed (Figure 2A). Relative to IMR90, 90SV
cells showed a partially methylated pattern. There did not appear to be any methylation hot-spots
in these cells, although there was somewhat more methylation in general in the 5' end than the 3'
end of the region analyzed. Rather, the analysis of individual subclones was suggestive of two
populations of alleles; those that were predominantly methylated and those that were
predominantly unmethylated (Figure 2A). This pattern is consistent with a mixed cell population
in which some cells are methylated for TMS1 and others are not, or with allelic heterogeneity
within each cell. The partially methylated pattern of the 90SV cells correlated with a decreased
expression of TMS1 relative to IMR90 cells (Figure 2B). In stark contrast, HMT.1E1 cells
showed no detectable TMS1 expression and were methylated at nearly every CpG site on all
by guest on March 18, 2020
http://ww
w.jbc.org/
Dow
nloaded from
12
alleles analyzed (Figure 2A and 2B).
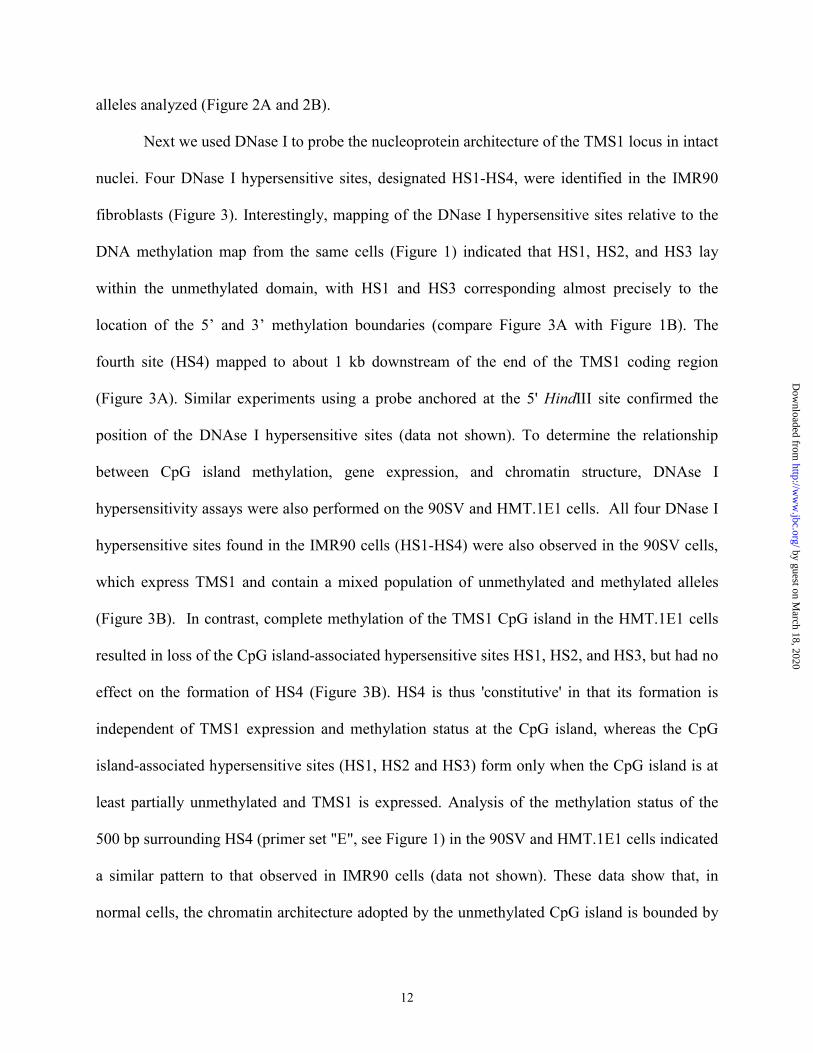
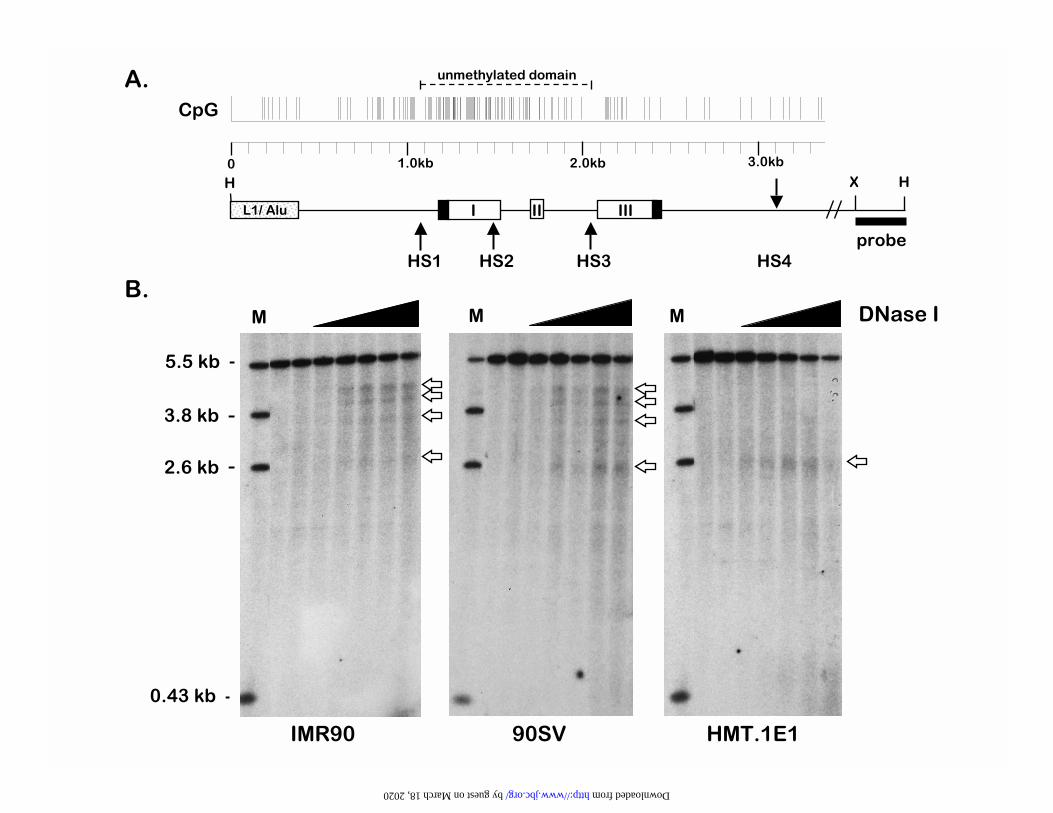
Next we used DNase I to probe the nucleoprotein architecture of the TMS1 locus in intact
nuclei. Four DNase I hypersensitive sites, designated HS1-HS4, were identified in the IMR90
fibroblasts (Figure 3). Interestingly, mapping of the DNase I hypersensitive sites relative to the
DNA methylation map from the same cells (Figure 1) indicated that HS1, HS2, and HS3 lay
within the unmethylated domain, with HS1 and HS3 corresponding almost precisely to the
location of the 5� and 3� methylation boundaries (compare Figure 3A with Figure 1B). The
fourth site (HS4) mapped to about 1 kb downstream of the end of the TMS1 coding region
(Figure 3A). Similar experiments using a probe anchored at the 5' HindIII site confirmed the
position of the DNAse I hypersensitive sites (data not shown). To determine the relationship
between CpG island methylation, gene expression, and chromatin structure, DNAse I
hypersensitivity assays were also performed on the 90SV and HMT.1E1 cells. All four DNase I
hypersensitive sites found in the IMR90 cells (HS1-HS4) were also observed in the 90SV cells,
which express TMS1 and contain a mixed population of unmethylated and methylated alleles
(Figure 3B). In contrast, complete methylation of the TMS1 CpG island in the HMT.1E1 cells
resulted in loss of the CpG island-associated hypersensitive sites HS1, HS2, and HS3, but had no
effect on the formation of HS4 (Figure 3B). HS4 is thus 'constitutive' in that its formation is
independent of TMS1 expression and methylation status at the CpG island, whereas the CpG
island-associated hypersensitive sites (HS1, HS2 and HS3) form only when the CpG island is at
least partially unmethylated and TMS1 is expressed. Analysis of the methylation status of the
500 bp surrounding HS4 (primer set "E", see Figure 1) in the 90SV and HMT.1E1 cells indicated
a similar pattern to that observed in IMR90 cells (data not shown). These data show that, in
normal cells, the chromatin architecture adopted by the unmethylated CpG island is bounded by
by guest on March 18, 2020
http://ww
w.jbc.org/
Dow
nloaded from

13
DNAse I HS, and that methylation-mediated silencing of TMS1 is accompanied by localized
changes in the conformation of this domain.
Recent evidence suggests that methylation-associated gene repression involves the
recruitment of histone deacetylases (HDACs) and other chromatin modifying factors (22-26). To
determine whether methylation-mediated silencing of TMS1 is accompanied by changes in
histone acetylation, we analyzed the relative levels of acetylated histone H3 and H4 at the
regions corresponding to HS1, HS2, HS3 and HS4 in IMR90, 90SV and HMT.1E1 cells.
Formaldehyde-crosslinked chromatin was immunoprecipitated with antibodies against the
acetylated isoforms of histone H3 or histone H4. Immunoprecipitated DNA was analyzed by
multiplex PCR using a primer pair specific to each of the hypersensitive site regions (HS1-4) in
conjunction with primers to the β-actin promoter under conditions of linear amplification of
input DNA. β-actin was used as a positive control as it is expressed at similar levels in all three
cell lines (Figure 2B). The ratio of intensities of the TMS1 product and β-actin product was
determined and normalized to that of the IMR90 cells to allow for comparison between the three
cell lines.
Relative to the IMR90 cells, both 90SV and HMT.1E1 cells showed decreased levels of
acteylated histones H3 and H4 at all four regions of the TMS1 locus analyzed (Figure 4). At the
CpG island-localized DNAse I hypersensitive sites (HS1, HS2, and HS3), where the density of
CpG is highest, the relative degree of histone hypoacetylation in the three cell lines correlated
well with the degree of methylation. As the level of methylation in the CpG island increased
from <10% in the IMR90 cells to ~ 50% in the 90SV to nearly 100% in HMT.1E1, the relative
levels of histone H4 acetylation decreased by ~50-60% in the 90SV cells and >80% in the
HMT.1E1 cells. The relative levels of acetylated histone H3 at HS1, HS2 and HS3 were also
decreased in the 90SV and HMT.1E1 cells, although to a somewhat lesser extent than acetylated
by guest on March 18, 2020
http://ww
w.jbc.org/
Dow
nloaded from

14
histone H4 (Figure 4B). In contrast, there was little correlation between methylation and histone
acetylation outside of the CpG island, in the region of HS4. Although the levels of acetylated
histones associated with HS4 in the 90SV and HMT.1E1 cells was decreased relative to IMR90
cells, there was little difference between the TMS1 expressing 90SV cells and the TMS1 silent
HMT.1E1 cells (Figure 4). Together with the finding that the formation of HS4 is independent of
the CpG island methylation and gene expression, these data suggest that the effect of aberrant
methylation at the TMS1 CpG island on chromatin structure is confined to the immediate
vicinity of the CpG island.
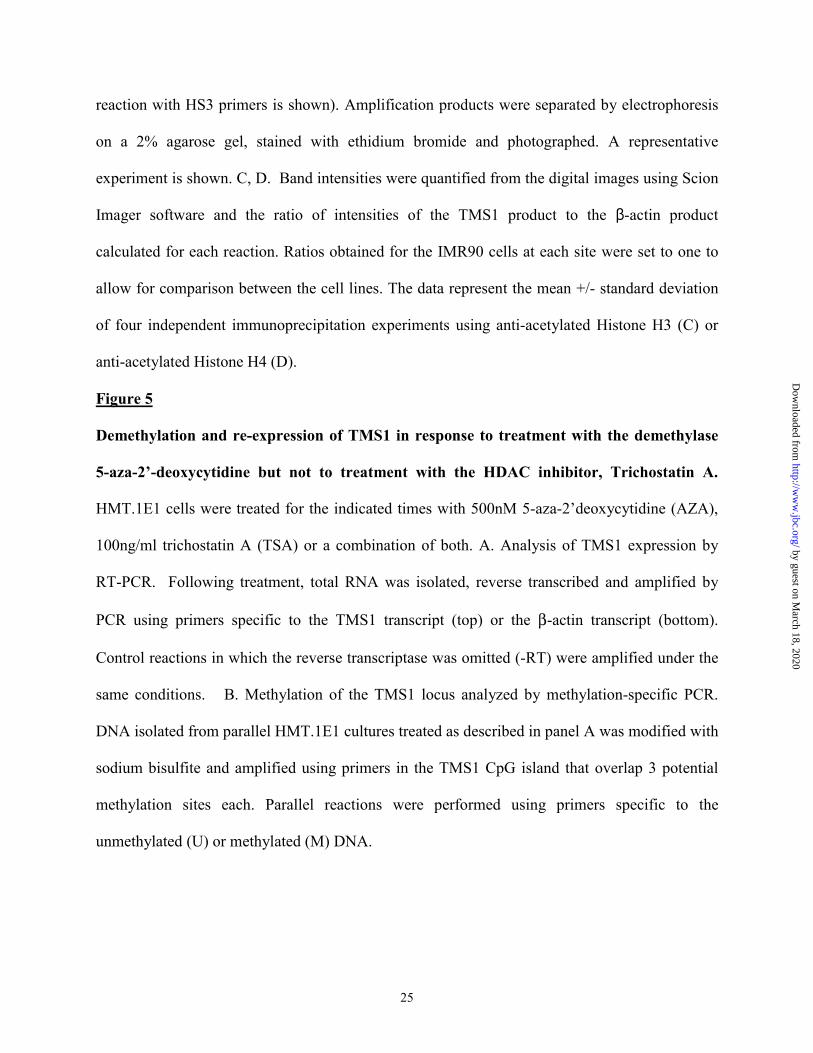
To further examine the relative contributions of methylation and histone deacetylation in
TMS1 silencing, we determined the effect of treatment with the demethylating agent 5�-aza-
2�deoxycytidine (5azadC) or the histone deacetylase inhibitor Trichostatin A (TSA) on the
expression and methylation of TMS1 in the HMT.1E1 cells. Treatment of HMT.1E1 cells with
5azadC resulted in a time-dependent re-activation of TMS1 (Figure 5A). This reactivation was
accompanied by partial demethylation of the TMS1 CpG island (Figure 5B). In contrast,
treatment of HMT.1E1 cells with TSA had no effect on TMS1 expression or methylation of the
CpG island, and did not significantly alter the degree of re-expression when combined with
5azadC. The data indicate that the inhibition of histone deacetylation alone is insufficient to re-
activate TMS1. As has been found for other CpG island associated genes silenced in human
cancers (33,34) these data suggest that methylation plays a primary role in TMS1 silencing.
by guest on March 18, 2020
http://ww
w.jbc.org/
Dow
nloaded from

15
Discussion
TMS1/ASC is an apoptotic signaling protein whose expression is frequently lost in
human breast cancers via aberrant methylation. TMS1 is associated with a 5' CpG island that is
unmethylated in normal fibroblasts and mammary epithelial cells, but becomes aberrantly
methylated in response to overexpression of DNMT1 and in human breast cancer cell lines and
primary tumors. In this study, we showed that the CpG island of the TMS1 gene is unmethylated
in normal somatic cells and is separated from densely methylated flanking DNA by distinct
boundaries at both the 5' and 3' ends. The methylation boundaries coincided with DNase I HS
sites that form only when the CpG island is unmethylated. The de novo methylation of the TMS1
CpG island was accompanied by local changes in CpG island conformation and activity,
including the hypoacetylation of histones H3 and H4, remodeling of CpG island-specific DNAse
I HS sites, and gene silencing. An understanding of the consequences of aberrant methylation of
TMS1 on chromatin structure and gene expression is important not only because of its role in
breast cancer but because TMS1 may be representative of other CpG island-associated tumor
suppressor genes that are silenced in cancer.
Recently, 5' methylation boundaries have been mapped for the CpG islands of the GSTP1
and the BRCA1 genes (35,36). This demarcation was absent in cancer cells in which the CpG
island is aberrantly methylated and silenced. In the case of GSTP1, the methylation boundary
overlapped a small A+T-rich region with a repeated sequence of ATAAA (35). Although the 5�
methylation boundary of TMS1 contains one copy of an ATAAA sequence, neither the 5' nor 3'
methylation boundary is particularly A+T-rich. We note here that one thing the TMS1
boundaries have in common with those identified at the GSTP1 and BRCA1 genes is small gaps
of 50-100 bp that lack CpGs altogether (note the gaps in CpG density in Figure 1A). The 5' and
3' boundaries of the TMS1 CpG island contain a stretch of 60 and 134 base pairs, respectively,
by guest on March 18, 2020
http://ww
w.jbc.org/
Dow
nloaded from

16
that although C+G rich, are devoid of CpGs. These regions of non-CpG DNA abutting the CpG
island DNA may act as a buffer zone ensuring that methylation does not spread into the CpG
island.
It is currently unknown what, if anything, constitutes a methylation boundary in normal
cells. We found that the unmethylated domain of the TMS1 CpG island is flanked by DNAse I
hypersensitive sites that form at the boundaries between the unmethylated CpG island and the
surrounding methylated DNA. This finding is significant in that it shows that the CpG island
boundary is more than just a transition in methylation pattern; it suggests the existence of a
physical boundary occurring at the level of chromatin. These sites were lost when the CpG island
was methylated. One model that stems from these findings is that the maintenance of a chromatin
boundary at HS1 and HS3, which could be mediated by the binding of a specific protein or
complex, may play an important role in preventing the methylation of the CpG island in normal
cells. Loss of this boundary function could contribute to aberrant methylation. The idea that there
are cis-acting elements that protect CpG islands or other regions from methylation or that
specific proteins might block de novo methylation is not without precedent. The binding of
transcription factors and other DNA binding proteins blocks de novo methylation by bacterial
and mammalian DNA methyltransferases in vivo (37-39). A region of the chicken β-globin locus
defined by a constitutive DNAse I HS site was shown to block the progressive de novo
methylation and silencing of an integrated transgene (40). Subsequent studies have shown that
this site is bound by the methylation-sensitive transcription factor CTCF (41). CTCF binding to
the imprint control region of the H19/IGF2 locus is important in the maintenance of normal
imprinted expression of H19 and IGF2 (42,43) Interestingly, acquired methylation of these sites
in human colon cancers and Wilms tumors leads to loss of imprinting and bi-allelic expression of
IGF2 (44,45).
by guest on March 18, 2020
http://ww
w.jbc.org/
Dow
nloaded from

17
Previous studies have suggested that a cis-element in the 5' end of the mouse or hamster
APRT gene containing Sp1-like sites is important in protecting the CpG island from de novo
methylation (46-49). Mutation or deletion of the Sp1 binding sites leads to de novo methylation
of the CpG island when propagated in transgenic mice or transfected into embryonic cells.
Whether it is Sp1 binding that mediates the protective effect is not entirely clear, however, since
neither the Sp1 consensus sites alone nor those from a heterologous locus protected the APRT
gene from de novo methylation in transgenic embryos (50). Moreover, targeted disruption of Sp1
does not lead to widespread methylation of CpG islands (51). Nevertheless, it is noteworthy that
all three CpG island-associated HS sites (not HS4) are in the vicinity of a canonical Sp1 binding
site.
If the boundary were occupied by a methylation-sensitive DNA binding protein, the
competition between de novo methylation of the boundary element and its occupancy by the
DNA binding protein during DNA replication might be the first step towards the methylation of
the CpG island. In the model system utilized here, that balance might be tipped in favor of
aberrant methylation by overexpression of DNMT1. We have shown previously that the
hypermethylation of affected CpG island loci was observed only in clones expressing >9-fold
increased levels of DNMT1 (27), consistent with a competition model or the existence of a
saturable control mechanism. Alternatively, loss of a trans factor that mediates the boundary
function in the HMT.1E1 cells or other cell types might allow for aberrant methylation. Indeed,
we find that in samples exhibiting incomplete methylation of TMS1, such as the 90SV cells
studied here or breast cancer cell lines and primary tumors (J. Levine and P. Vertino, manuscript
in preparation), there are no "hot-spots" of methylation, rather individual alleles are either
predominantly methylated or predominantly unmethylated, suggesting that loss of a boundary
function may be a limiting factor.
by guest on March 18, 2020
http://ww
w.jbc.org/
Dow
nloaded from
18
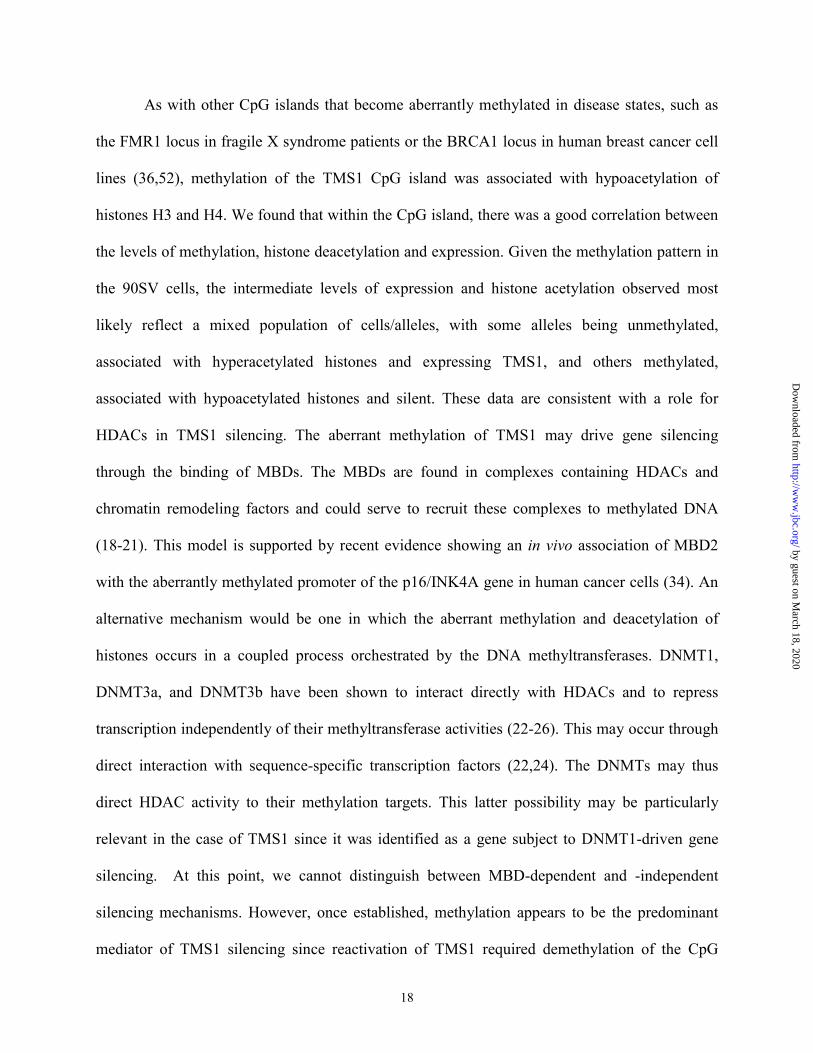
As with other CpG islands that become aberrantly methylated in disease states, such as
the FMR1 locus in fragile X syndrome patients or the BRCA1 locus in human breast cancer cell
lines (36,52), methylation of the TMS1 CpG island was associated with hypoacetylation of
histones H3 and H4. We found that within the CpG island, there was a good correlation between
the levels of methylation, histone deacetylation and expression. Given the methylation pattern in
the 90SV cells, the intermediate levels of expression and histone acetylation observed most
likely reflect a mixed population of cells/alleles, with some alleles being unmethylated,
associated with hyperacetylated histones and expressing TMS1, and others methylated,
associated with hypoacetylated histones and silent. These data are consistent with a role for
HDACs in TMS1 silencing. The aberrant methylation of TMS1 may drive gene silencing
through the binding of MBDs. The MBDs are found in complexes containing HDACs and
chromatin remodeling factors and could serve to recruit these complexes to methylated DNA
(18-21). This model is supported by recent evidence showing an in vivo association of MBD2
with the aberrantly methylated promoter of the p16/INK4A gene in human cancer cells (34). An
alternative mechanism would be one in which the aberrant methylation and deacetylation of
histones occurs in a coupled process orchestrated by the DNA methyltransferases. DNMT1,
DNMT3a, and DNMT3b have been shown to interact directly with HDACs and to repress
transcription independently of their methyltransferase activities (22-26). This may occur through
direct interaction with sequence-specific transcription factors (22,24). The DNMTs may thus
direct HDAC activity to their methylation targets. This latter possibility may be particularly
relevant in the case of TMS1 since it was identified as a gene subject to DNMT1-driven gene
silencing. At this point, we cannot distinguish between MBD-dependent and -independent
silencing mechanisms. However, once established, methylation appears to be the predominant
mediator of TMS1 silencing since reactivation of TMS1 required demethylation of the CpG
by guest on March 18, 2020
http://ww
w.jbc.org/
Dow
nloaded from
19
island induced by 5-aza-2'-deoxycytidine and was not affected by the histone deacetylase
inhibitor TSA. This is consistent with other CpG island-associated genes silenced in cancer
where methylation plays the dominant role in the maintenance of the repressed state (33).
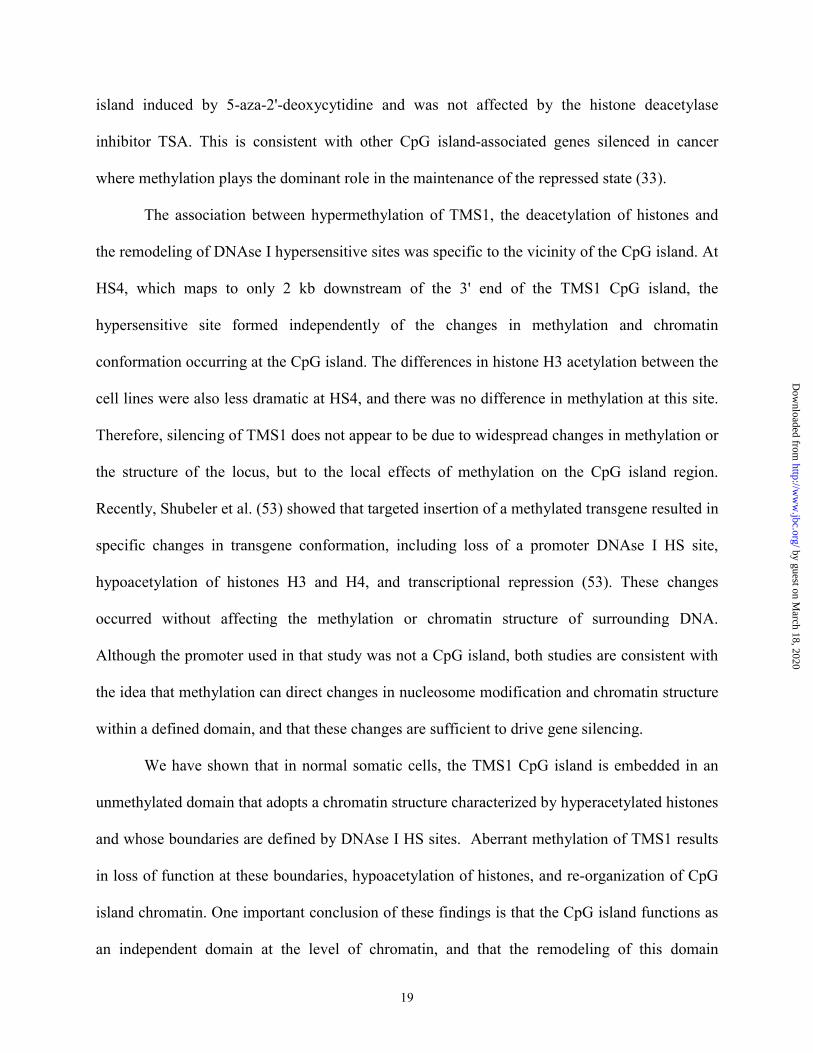
The association between hypermethylation of TMS1, the deacetylation of histones and
the remodeling of DNAse I hypersensitive sites was specific to the vicinity of the CpG island. At
HS4, which maps to only 2 kb downstream of the 3' end of the TMS1 CpG island, the
hypersensitive site formed independently of the changes in methylation and chromatin
conformation occurring at the CpG island. The differences in histone H3 acetylation between the
cell lines were also less dramatic at HS4, and there was no difference in methylation at this site.
Therefore, silencing of TMS1 does not appear to be due to widespread changes in methylation or
the structure of the locus, but to the local effects of methylation on the CpG island region.
Recently, Shubeler et al. (53) showed that targeted insertion of a methylated transgene resulted in
specific changes in transgene conformation, including loss of a promoter DNAse I HS site,
hypoacetylation of histones H3 and H4, and transcriptional repression (53). These changes
occurred without affecting the methylation or chromatin structure of surrounding DNA.
Although the promoter used in that study was not a CpG island, both studies are consistent with
the idea that methylation can direct changes in nucleosome modification and chromatin structure
within a defined domain, and that these changes are sufficient to drive gene silencing.
We have shown that in normal somatic cells, the TMS1 CpG island is embedded in an
unmethylated domain that adopts a chromatin structure characterized by hyperacetylated histones
and whose boundaries are defined by DNAse I HS sites. Aberrant methylation of TMS1 results
in loss of function at these boundaries, hypoacetylation of histones, and re-organization of CpG
island chromatin. One important conclusion of these findings is that the CpG island functions as
an independent domain at the level of chromatin, and that the remodeling of this domain
by guest on March 18, 2020
http://ww
w.jbc.org/
Dow
nloaded from

20
represents a critical step in the silencing associated with aberrant methylation. A similar scenario
may be operative at other CpG island-associated tumor suppressor genes silenced by methylation
in cancer.
by guest on March 18, 2020
http://ww
w.jbc.org/
Dow
nloaded from

21
Acknowledgments
The authors wish to thank Dr. Paul Wade for helpful discussions and for his critical
review of the manuscript, and Ms. Kimberly Fowler for assistance with bisulfite sequencing.
by guest on March 18, 2020
http://ww
w.jbc.org/
Dow
nloaded from

22
Footnotes
1 This work is supported by Public Health Service grant CA77137 from the National Cancer
Institute. PMV is an Avon Scholar in Breast Cancer research.
2 The abbreviations used are: DNMT, DNA cytosine-5-methyltransferase; HDAC, histone
deacetylase; HS, hypersensitive site; MBD, methyl CpG binding domain; PCR, polymerase
chain reaction; TSA, Trichostatin A.
by guest on March 18, 2020
http://ww
w.jbc.org/
Dow
nloaded from

23
Figure Legends
Figure 1
Pattern of Methylation at the TMS1 Locus in Normal Fibroblasts A. Genomic map of the
TMS1 locus. The position of 110 CpG dinucleotides (vertical lines) analyzed in this study are
indicated above the map. Open boxes, TMS1 exons; numbers indicate nucleotide position
relative to an upstream HindIII site (H). Connected arrows represent the locations of the five sets
of overlapping primers (A-E) used in bisulfite sequencing. B. Methylation pattern of the TMS1
locus in normal fibroblasts. DNA from IMR90 cells was modified with sodium bisulfite which
deaminates cytosines to uracil but leaves methyl cytosines unaltered. Bisulfite-modified DNA
was amplified by PCR using primer pairs A-E which were designed to avoid potential
methylation sites such that methylated and unmethylated DNA is amplified equally. The
resulting PCR products were subcloned, and at least eight individual subclones were sequenced
for each amplification reaction. Percent methylation was determined from the number of alleles
containing a methylated CpG at each position relative to the total number of alleles analyzed.
Figure 2
TMS1 Silencing is Associated with Complete Methylation of the CpG Island. A. Bisulfite
sequencing analysis of the methylation status of 53 CpG sites in the TMS1 CpG island. DNA
from IMR90, 90SV and HMT.1E1 cells was modified with sodium bisulfite and amplified by
PCR using primer set B indicated in Figure 1. The amplification product was subcloned and
sequenced. Each row represents the methylation pattern of an individual allele; ❍, unmethylated
CpG, �, methylated CpG. CpG positions are indicated, and are relative to the 5' HindIII site as in
Figure 1. B. TMS1 expression. Expression of TMS1 was determined by semi-quantitative RT-
PCR analysis. RNA from IMR90, 90SV and HMT.1E1 cells was reverse transcribed and
amplified with primers specific to TMS1 (top) or �-actin (bottom) for the indicated number of
by guest on March 18, 2020
http://ww
w.jbc.org/
Dow
nloaded from

24
cycles. TMS1 silencing in HMT.1E1 cells is correlated with the near-complete methylation of
all 53 CpG sites in the CpG island.
Figure 3
Mapping of DNase I Hypersensitive Sites in the TMS1 locus. A. Map of the 5.5 kb Hind III
(H) genomic fragment containing the TMS1 gene. The unmethylated domain identified in
IMR90 cells (Figure 1) is indicated. Open boxes, TMS1 exons; numbers indicate nucleotide
position relative to the 5' HindIII site. The HindIII-XbaI (X) probe used in indirect end-labeling
experiments is indicated. Arrows represent the positions of the DNAse I hypersensitive sites,
which were mapped to the approximate base pair positions 1094 (HS1), 1515 (HS2), 2054
(HS3), and 3090 (HS4) relative to the 5' HindIII site. B. DNAse I hypersensitive site mapping.
Nuclei isolated from the indicated cell line were incubated in the absence (lanes 2 and 3 of each
gel) or presence of increasing concentrations of DNAse I (open triangles). Genomic DNA was
then isolated, digested with HindIII and subjected to Southern blot analysis using a random-
prime labeled probe indicated in panel A which was anchored to the 3� HindIII site. Genomic
DNA digested with HindIII plus XbaI, XhoI or BamHI was included as a marker (M, Lane 1).
Figure 4
Histone acetylation at the TMS1 locus. The indicated cell lines were treated with formaldehyde
to crosslink protein to DNA and acetylated histones were immunoprecipitated using antibodies
specific to the acetylated isoforms of histone H3 (A) or histone H4 (B). Immunoprecipitated
DNA was analyzed by multiplex PCR using primers specific to the regions surrounding HS1,
HS2, HS3, or HS4 of the TMS1 locus coupled with a common primer set specific to the β-actin
promoter. Immunoprecipitation reactions lacking antibody (No Ab) or of 1/40 of chromatin input
(Input) were used as a negative and positive controls for each of the four primer pairs (only the
by guest on March 18, 2020
http://ww
w.jbc.org/
Dow
nloaded from
25
reaction with HS3 primers is shown). Amplification products were separated by electrophoresis
on a 2% agarose gel, stained with ethidium bromide and photographed. A representative
experiment is shown. C, D. Band intensities were quantified from the digital images using Scion
Imager software and the ratio of intensities of the TMS1 product to the �-actin product
calculated for each reaction. Ratios obtained for the IMR90 cells at each site were set to one to
allow for comparison between the cell lines. The data represent the mean +/- standard deviation
of four independent immunoprecipitation experiments using anti-acetylated Histone H3 (C) or
anti-acetylated Histone H4 (D).
Figure 5
Demethylation and re-expression of TMS1 in response to treatment with the demethylase
5-aza-2�-deoxycytidine but not to treatment with the HDAC inhibitor, Trichostatin A.
HMT.1E1 cells were treated for the indicated times with 500nM 5-aza-2�deoxycytidine (AZA),
100ng/ml trichostatin A (TSA) or a combination of both. A. Analysis of TMS1 expression by
RT-PCR. Following treatment, total RNA was isolated, reverse transcribed and amplified by
PCR using primers specific to the TMS1 transcript (top) or the β-actin transcript (bottom).
Control reactions in which the reverse transcriptase was omitted (-RT) were amplified under the
same conditions. B. Methylation of the TMS1 locus analyzed by methylation-specific PCR.
DNA isolated from parallel HMT.1E1 cultures treated as described in panel A was modified with
sodium bisulfite and amplified using primers in the TMS1 CpG island that overlap 3 potential
methylation sites each. Parallel reactions were performed using primers specific to the
unmethylated (U) or methylated (M) DNA.
by guest on March 18, 2020
http://ww
w.jbc.org/
Dow
nloaded from

26
References
1.Ioshikhes, I. P., and Zhang, M. Q. (2000) Nat Genet 26(1), 61-3.
2.Lander, E. S., Linton, L. M., Birren, B., Nusbaum, C., Zody, M. C., Baldwin, J., Devon, K.,
Dewar, K., Doyle, M., FitzHugh, W., Funke, R., Gage, D., Harris, K., Heaford, A., Howland, J.,
Kann, L., Lehoczky, J., LeVine, R., McEwan, P., McKernan, K., Meldrim, J., Mesirov, J. P.,
Miranda, C., Morris, W., Naylor, J., Raymond, C., Rosetti, M., Santos, R., Sheridan, A.,
Sougnez, C., Stange-Thomann, N., Stojanovic, N., Subramanian, A., Wyman, D., Rogers, J.,
Sulston, J., Ainscough, R., Beck, S., Bentley, D., Burton, J., Clee, C., Carter, N., Coulson, A.,
Deadman, R., Deloukas, P., Dunham, A., Dunham, I., Durbin, R., French, L., Grafham, D.,
Gregory, S., Hubbard, T., Humphray, S., Hunt, A., Jones, M., Lloyd, C., McMurray, A.,
Matthews, L., Mercer, S., Milne, S., Mullikin, J. C., Mungall, A., Plumb, R., Ross, M.,
Shownkeen, R., Sims, S., Waterston, R. H., Wilson, R. K., Hillier, L. W., McPherson, J. D.,
Marra, M. A., Mardis, E. R., Fulton, L. A., Chinwalla, A. T., Pepin, K. H., Gish, W. R., Chissoe,
S. L., Wendl, M. C., Delehaunty, K. D., Miner, T. L., Delehaunty, A., Kramer, J. B., Cook, L. L.,
Fulton, R. S., Johnson, D. L., Minx, P. J., Clifton, S. W., Hawkins, T., Branscomb, E., Predki, P.,
Richardson, P., Wenning, S., Slezak, T., Doggett, N., Cheng, J. F., Olsen, A., Lucas, S., Elkin,
C., Uberbacher, E., Frazier, M., et al. (2001) Nature 409(6822), 860-921.
3.Bird, A. (1992) Cell 70(1), 5-8.
4.Bird, A. P. (1986) Nature 321(6067), 209-13.
5.Mann, J. R., Szabo, P. E., Reed, M. R., and Singer-Sam, J. (2000) Crit Rev Eukaryot Gene
Expr 10(3-4), 241-57.
6.Jaenisch, R., Beard, C., Lee, J., Marahrens, Y., and Panning, B. (1998) Novartis Found Symp
214, 200-9; discussion 209-13, 228-32.
by guest on March 18, 2020
http://ww
w.jbc.org/
Dow
nloaded from
27
7.Baylin, S. B., Herman, J. G., Graff, J. R., Vertino, P. M., and Issa, J. P. (1998) Adv Cancer Res
72(51), 141-96.
8.Jones, P. A., and Laird, P. W. (1999) Nat Genet 21(2), 163-7.
9.Esteller, M., Corn, P. G., Baylin, S. B., and Herman, J. G. (2001) Cancer Res 61(8), 3225-9.
10.Katzenellenbogen, R. A., Baylin, S. B., and Herman, J. G. (1999) Blood 93(12), 4347-53.
11.Kissil, J. L., Feinstein, E., Cohen, O., Jones, P. A., Tsai, Y. C., Knowles, M. A., Eydmann, M.
E., and Kimchi, A. (1997) Oncogene 15(4), 403-7.
12.Teitz, T., Wei, T., Valentine, M. B., Vanin, E. F., Grenet, J., Valentine, V. A., Behm, F. G.,
Look, A. T., Lahti, J. M., and Kidd, V. J. (2000) Nat Med 6(5), 529-35.
13.Conway, K. E., McConnell, B. B., Bowring, C. E., Donald, C. D., Warren, S. T., and Vertino,
P. M. (2000) Cancer Res 60(22), 6236-42.
14.Campanero, M. R., Armstrong, M. I., and Flemington, E. K. (2000) Proc Natl Acad Sci U S A
97(12), 6481-6.
15.Eden, S., and Cedar, H. (1994) Curr Opin Genet Dev 4(2), 255-9.
16.Hendrich, B., and Bird, A. (2000) Curr Top Microbiol Immunol 249, 55-74.
17.Ballestar, E., and Wolffe, A. P. (2001) Eur J Biochem 268(1), 1-6.
18.Jones, P. L., Veenstra, G. J., Wade, P. A., Vermaak, D., Kass, S. U., Landsberger, N.,
Strouboulis, J., and Wolffe, A. P. (1998) Nat Genet 19(2), 187-91.
19.Nan, X., Ng, H. H., Johnson, C. A., Laherty, C. D., Turner, B. M., Eisenman, R. N., and Bird,
A. (1998) Nature 393(6683), 386-9.
20.Ng, H. H., Jeppesen, P., and Bird, A. (2000) Mol Cell Biol 20(4), 1394-406.
21.Wade, P. A., Gegonne, A., Jones, P. L., Ballestar, E., Aubry, F., and Wolffe, A. P. (1999) Nat
Genet 23(1), 62-6.
by guest on March 18, 2020
http://ww
w.jbc.org/
Dow
nloaded from

28
22.Robertson, K. D., Ait-Si-Ali, S., Yokochi, T., Wade, P. A., Jones, P. L., and Wolffe, A. P.
(2000) Nat Genet 25(3), 338-42.
23.Rountree, M. R., Bachman, K. E., and Baylin, S. B. (2000) Nat Genet 25(3), 269-77.
24.Fuks, F., Burgers, W. A., Godin, N., Kasai, M., and Kouzarides, T. (2001) Embo J 20(10),
2536-44.
25.Fuks, F., Burgers, W. A., Brehm, A., Hughes-Davies, L., and Kouzarides, T. (2000) Nat
Genet 24(1), 88-91.
26.Bachman, K. E., Rountree, M. R., and Baylin, S. B. (2001) J Biol Chem 26, 26
27.Vertino, P. M., Yen, R. W., Gao, J., and Baylin, S. B. (1996) Mol Cell Biol 16(8), 4555-65.
28.Graff, J. R., Herman, J. G., Myohanen, S., Baylin, S. B., and Vertino, P. M. (1997) J Biol
Chem 272(35), 22322-9.
29.McConnell, B. B., and Vertino, P. M. (2000) Cancer Res 60(22), 6243-7.
30.Masumoto, J., Taniguchi, S., Ayukawa, K., Sarvotham, H., Kishino, T., Niikawa, N., Hidaka,
E., Katsuyama, T., Higuchi, T., and Sagara, J. (1999) J Biol Chem 274(48), 33835-8.
31.Herman, J. G., Graff, J. R., Myohanen, S., Nelkin, B. D., and Baylin, S. B. (1996) Proc Natl
Acad Sci U S A 93(18), 9821-6.
32.Chomczynski, P., and Sacchi, N. (1987) Anal Biochem 162(1), 156-9.
33.Cameron, E. E., Bachman, K. E., Myohanen, S., Herman, J. G., and Baylin, S. B. (1999) Nat
Genet 21(1), 103-7.
34.Magdinier, F., and Wolffe, A. P. (2001) Proc Natl Acad Sci U S A 98(9), 4990-5.
35.Millar, D. S., Paul, C. L., Molloy, P. L., and Clark, S. J. (2000) J Biol Chem 275(32), 24893-
9.
36.Rice, J. C., and Futscher, B. W. (2000) Nucleic Acids Res 28(17), 3233-9.
37.Han, L., Lin, I. G., and Hsieh, C. L. (2001) Mol Cell Biol 21(10), 3416-24.
by guest on March 18, 2020
http://ww
w.jbc.org/
Dow
nloaded from

29
38.Kladde, M. P., Xu, M., and Simpson, R. T. (1996) Embo J 15(22), 6290-300.
39.Kladde, M. P., and Simpson, R. T. (1994) Proc Natl Acad Sci U S A 91(4), 1361-5.
40.Pikaart, M. J., Recillas-Targa, F., and Felsenfeld, G. (1998) Genes Dev 12(18), 2852-62.
41.Bell, A. C., West, A. G., and Felsenfeld, G. (1999) Cell 98(3), 387-96.
42.Bell, A. C., and Felsenfeld, G. (2000) Nature 405(6785), 482-5.
43.Hark, A. T., Schoenherr, C. J., Katz, D. J., Ingram, R. S., Levorse, J. M., and Tilghman, S. M.
(2000) Nature 405(6785), 486-9.
44.Cui, H., Niemitz, E. L., Ravenel, J. D., Onyango, P., Brandenburg, S. A., Lobanenkov, V. V.,
and Feinberg, A. P. (2001) Cancer Res 61(13), 4947-50.
45.Nakagawa, H., Chadwick, R. B., Peltomaki, P., Plass, C., Nakamura, Y., and de La Chapelle,
A. (2001) Proc Natl Acad Sci U S A 98(2), 591-6.
46.Mummaneni, P., Bishop, P. L., and Turker, M. S. (1993) J Biol Chem 268(1), 552-8.
47.Brandeis, M., Frank, D., Keshet, I., Siegfried, Z., Mendelsohn, M., Nemes, A., Temper, V.,
Razin, A., and Cedar, H. (1994) Nature 371(6496), 435-8.
48.Mummaneni, P., Yates, P., Simpson, J., Rose, J., and Turker, M. S. (1998) Nucleic Acids Res
26(22), 5163-9.
49.Macleod, D., Charlton, J., Mullins, J., and Bird, A. P. (1994) Genes Dev 8(19), 2282-92.
50.Siegfried, Z., Eden, S., Mendelsohn, M., Feng, X., Tsuberi, B. Z., and Cedar, H. (1999) Nat
Genet 22(2), 203-6.
51.Marin, M., Karis, A., Visser, P., Grosveld, F., and Philipsen, S. (1997) Cell 89(4), 619-28.
52.Coffee, B., Zhang, F., Warren, S. T., and Reines, D. (1999) Nat Genet 22(1), 98-101.
53.Schubeler, D., Lorincz, M. C., Cimbora, D. M., Telling, A., Feng, Y. Q., Bouhassira, E. E.,
and Groudine, M. (2000) Mol Cell Biol 20(24), 9103-12.
by guest on March 18, 2020
http://ww
w.jbc.org/
Dow
nloaded from

B.
A.
Position
AB
CD
E
1000 1500 2000 2500 3000
0
20
40
60
80
100
Pe
rce
nt
Me
thyl
ati
on
CpG
H
I II III
CpG Island
HL1/ Alu
0 1.0kb 2.0kb 3.0kb
by guest on March 18, 2020 http://www.jbc.org/ Downloaded from
90SV
HMT.1E1
IMR90
TMS1
����-actin
20 30 40 20 30 40 20 30 40
HMT.1E1IMR90 90SV
15 25 35 15 25 35 15 25 35
+959 +1477
by guest on March 18, 2020 http://www.jbc.org/ Downloaded from
M MM DNase I
5.5 kb
3.8 kb
2.6 kb
0.43 kb
IMR90 90SV HMT.1E1
B.
A.CpG
X
II
H
L1/ Alu
0 1.0kb 2.0kb 3.0kb
I III
H
probeHS1 HS2 HS3 HS4
unmethylated domain
by guest on March 18, 2020 http://www.jbc.org/ Downloaded from

HS4 HS1
IMR90 90SV HMT.1E1
HS2
IMR90 90SV HMT.1E1
HS3
IMR90 90SV HMT.1E1 IMR90 90SV HMT.1E1
D.
C. HS1
IMR90 90SV HMT.1E1
HS2
IMR90 90SV HMT.1E1
HS3
IMR90 90SV HMT.1E1
HS4
IMR90 90SV HMT.1E1
ββββ-actin
TMS1
M IMR
9090
SV
HM
T.1E
1IM
R90
90S
VH
MT.
1E1
IMR
9090
SV
HM
T.1E
1IM
R90
90S
VH
MT.
1E1
IMR
9090
SV
HM
T.1E
1IM
R90
90S
VH
MT.
1E1
No AbHS2 HS3HS1 HS4 Input
B. Anti-acetylated Histone H4
IMR
9090
SV
HM
T.1E
1IM
R90
90S
VH
MT.
1E1
IMR
9090
SV
HM
T.1E
1IM
R90
90S
VH
MT.
1E1
IMR
9090
SV
HM
T.1E
1IM
R90
90S
VH
MT.
1E1
No AbHS2 HS3HS1 HS4 Input
TMS1
ββββ-actin
M
A. Anti-acetylated Histone H3
00.2
0.40.6
0.81.0
1.2
00.2
0.40.6
0.81.0
1.2
00.2
0.40.6
0.81.0
1.2
00.2
0.40.6
0.81.0
1.2
00.2
0.40.6
0.81.0
1.2
00.20.40.60.81.01.2
00.2
0.40.6
0.81.0
1.2
00.2
0.40.6
0.81.0
1.2
by guest on March 18, 2020
http://ww
w.jbc.org/
Dow
nloaded from

RT
TMS1
ββββ-actin
Untreated
+ -
24hr AZA
+ -
48hr AZA
+ -
72hr AZA
+ -
24hr TSA
+ -
48hr TSA
+ -
72hr AZA+24hr TSA
+ -
A.
Untreated
M U
24hr AZA
M U
48hr AZA
M U
72hr AZA
M U
24hr TSA
M U
48hr TSA
M U
72hr AZA+24hr TSA
M U
B.
by guest on March 18, 2020
http://ww
w.jbc.org/
Dow
nloaded from
Krista M. Stimson and Paula M. Vertinohypoacetylation and CpG island-localized changes in chromatin architecture
Methylation-mediated silencing of TMS1/ASC is accompanied by histone
published online December 3, 2001J. Biol. Chem.
10.1074/jbc.M109809200Access the most updated version of this article at doi:
Alerts:
When a correction for this article is posted•
When this article is cited•
to choose from all of JBC's e-mail alertsClick here
by guest on March 18, 2020
http://ww
w.jbc.org/
Dow
nloaded from