kpmg and savca - african private equity and venture ... · 2 the 2015 kpmg and savca venture...
TRANSCRIPT

KPMG and SAVCA
Venture Capital and Private Equity Industry Performance Survey of
South Africa covering the 2014 calendar year
June 2015
kpmg.co.za

b
KPMG and SAVCA Private Equity Survey
1
ContentsForeword 2
Highlights 4
Introduction to Private Equity 12
Funds under Management 16
Fund Raising Activity 26
Investment Activity 32
Analysis of BEE Investments 40
Exits 44
Performance 50
Private Equity Investment Professionals 54
Black Economic Empowerment 56
Data Tables 58
Participants 60
Sources of Information 64
Glossary 67
KPMG and SAVCA Private Equity Survey

2
The 2015 KPMG and SAVCA Venture Capital and Private Equity Industry Performance Survey is the fifteenth consecutive collaboration between KPMG and SAVCA. Recognised as one of the most detailed of its type globally, it gives private equity stakeholders a greater understanding of this unique industry and its trends.
This latest survey, which covers the 2014 calendar year, reflects an expanded industry with R171.1 billion in funds under management as at 31 December, a slight increase from the start of that year. The growth in funds under management in the South African market reflects the growing interest in investing in private equity locally. Since this survey was first published, the compound annual growth rate of funds under management over a fifteen year period has been 11.3% (excluding undrawn commitments).
The realisation market in the South African private equity industry returned the highest amount of capital since 2011. Funds returned to investors increased by 44.7% from R9.8 billion during 2013, to R14.2 billion in 2014. The realisation in 2014 had implied times money multiplies of 2.4 times, significantly higher than the 1.6 times reported in 2013 and the 1.2 times in 2012.
A significant portion of private equity funds are sourced from outside of South Africa, with these third-party funds coming from geographies such as Europe, the United States and the United Kingdom. Their long-term commitments, usually of around ten years, contribute towards much-needed foreign direct investment into South Africa and the rest of Africa.
With South Africa’s ongoing focus on Black Economic Empowerment, the survey highlights the notable role of private equity in this regard.

KPMG and SAVCA Private Equity Survey
3
Private equity models help to facilitate BEE shareholdings and most transactions today have a BEE component to their structuring. The survey analyses private equity BEE investments in 2014, and notes a slight decrease in overall value, number of deals, and average deal size. Additionally, many private equity firms have their own BEE shareholders.
Employment equity is also a priority for private equity fund managers, and the survey reports that black staff members have increased by 21% from the previous year.
Adding to the growing insights into the private equity industry in South Africa, we have recently seen the publication of the 2013 SAVCA-DBSA Economic Impact Study, which supports our findings on the contributions of private equity to the economy. This study confirmed the innovation and flexibility introduced by private equity investors, and showcased the various ways in which they stimulate growth in their investee companies. This in turn creates much-needed employment. The 2013 Economic Impact Study showed samples of portfolio companies increasing their own employment by 40% over the two-year period surveyed, with revenues growing by 49%, BEE credentials improving and corporate governance structures being enhanced. Private equity is undoubtedly proving to be a powerful economic driver.
Investments channeled into infrastructure, energy and related continues to show the ongoing developmental opportunities available in energy, transport, telecommunications and social infrastructure and an increase in investments into banks, financial services and insurance.
The KPMG/SAVCA survey is conducted through questionnaires, supplemented by information sources such as interviews and international reports. We consider the survey to represent in excess of 90% of the South African Private Equity industry by funds under management. Questionnaires were emailed to 80 potential survey participants; there was response from 42 participants representing 74 funds. Alternative sources were used to obtain information on a further 17 private equity firms representing 17 funds. We are grateful to the Public Investment Corporation for its significant inclusion of all the Government Employees Pension Fund’s allocated funds to private equity.
KPMG and SAVCA would also like to extend their thanks to all the participants in the survey. We are also grateful to the survey committee and to KPMG’s Private Equity Clients and Sectors team for all their efforts in producing this survey.
Warren WatkinsDirector – KPMG Services (Pty) Ltd Head of Private Equity Markets – Africa Region
Erika van der Merwe CEO: Southern African Venture Capital and Private Equity Association
Foreword

4
1Highlights

KPMG and SAVCA Private Equity Survey
5
HighlightsSouth Africa’s private equity industry, including both government and private funds, has R171.1 billion in funds under management at 31 December 2014,a small increase from R169.3 billion at 31 December 2013. This represents a compound annual growth rate of 11.3% (excluding undrawn commitments) since 1999, when the survey first began. › Funds returned to investors increased by R4.4 billion (44.7%) from R9.8 billion during 2013 to
R14.2 billion in 2014
› R54.9 billion of the funds under management are in undrawn commitments at the end of 2014. R41.6 billion is available for future investments in South Africa and R13.3 billion for Pan Africa (South Africa and the rest of Africa). This represents a decrease of 11.7% from the R62.1 billion of the total undrawn commitments at the end of 2013.
› Of the R54.9 billion in undrawn commitments, 54.0% is with Independents (R29.6 billion), 8.6% Captive-Financial Services (R4.7 billion) and 34.5% is with Captives-Government (R18.9 billion).
› Captives-Government and fund managers that are themselves black-owned, empowered or influenced (that is, have at least 5.0% black ownership) have R144.2 billion of funds under management at 31 December 2014, an increase of 1.9% (2013: R141.5 billion). Of the total funds under management, 84.3% are thus at least black-influenced or classified as Captives-Government (2013: 83.6%).
› R6.8 billion was raised in 2014, which is a decrease from the record high R30.9 billion raised during 2013. The funds raised in 2014 are all for late-stage investment.
› 56.7% of all funds raised during 2014 were from South African sources (2013: 70.3%). South Africa has been the source of 42.0% of cumulative funds raised to date and not yet returned to investors (2013: 52.0%)
› Investment activity for independents only, as a percentage of GDP, was 0.21% (2013: 0.17%). This compares with the United Kingdom of 0.81% and the United States of 1.23%. Israel remains the highest percentage at 1.64%.
› Investment activity was R17.4 billion during 2014, compared to R17.6 billion in 2013. Of the R17.4 billion invested, R6.0 billion was for follow-on investments, and R11.3 billion was for new investments.
6
Highlights

7
Composition of total funds under management
Captives - Government* Independents Captives - Financial Services Captives - Other
10,2 11,9 13,9 18,4 24,7 31,2 39,7 24,0 21,7 27,6 30,3
5,2 5,8 7,0 10,1
12,3
14,0 12,1 21,1 24,0 42,4
63,3
39.3 39.7 42.5 59.2
86.3
109.4 105.4 114.2 114.5
138.8
169.3
2003 2004 2005 2006 2007 2008 2009 2010 2011 2012 2013
15,2 14,3 13,9 24,5
42,9 53,7 48,3
54,8 57,5 58,7 64,4
66,3
29,2
66,0
8,7 7,8 7,7 6,2 6,4 10,5
5,3 14,3 11,3 10,0 11,4 9,6
171.1
2014
Total funds under management at year end, split by undrawn commitments and investments (Rbn)**
Undrawn commitments Invested 25,5 25,9 26,5 33,9 54,7 68,8 70,4 78,3 83,9 97,9 107,2
13,8 13,8 16,0 25,3
31,6
40,6 35,0 35,9
30,6
40,9 62,1
39.3 39.7 42.5
59.2
86.3
109.4 105.4 114.2 114.5
138.8
169.3
116,2
54,9
171.1
2003 2004 2005 2006 2007 2008 2009 2010 2011 2012 2013 2014
* The Public Investment Corporation, classified under Captives – Government, had R45.4 billion funds under management during 2014 and R44.3 billion during 2013.
** A portion of the undrawn commitments is inclusive of a provision for future management fees.
Highlights
8
Highlights
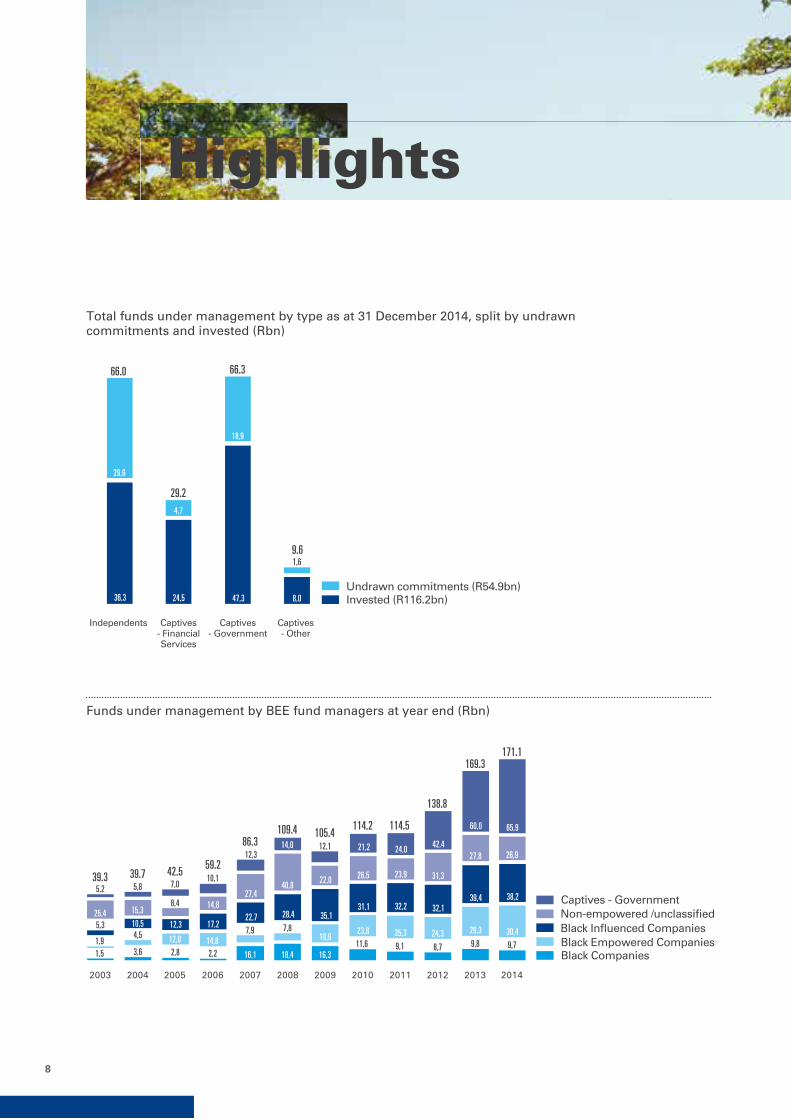
Total funds under management by type as at 31 December 2014, split by undrawn commitments and invested (Rbn)
Undrawn commitments (R54.9bn) Invested (R116.2bn) 36,3 24,5 47,3 8,0
29,6
4,7
18,9
1,6
66.0
29.2
66.3
9.6
Independents Captives- FinancialServices
Captives- Government
Captives- Other
Funds under management by BEE fund managers at year end (Rbn)
5,3 10,5 12,3 17,2 22,7 28,4 35,1
31,1 32,2 32,1 39,4
1,5
4,5 12,0 14,8 7,9 7,8
19,9 23,8 25,3 24,3 29,3
1,9 3,6 2,8 2,2 16,1 18,4 16,3
11,6 9,1 8,7 9,8
39.3 39.7 42.5 59.2
86.3 109.4 105.4
114.2 114.5
138.8
169.3
2003 2004 2005 2006 2007 2008 2009 2010 2011 2012 2013
25,4 15,3 8,4 14,8
27,4 40,8
22,0 26,5 23,9 31,3
27,8
5,2 5,8 7,0 10,1
12,3 14,0 12,1 21,2 24,0 42,4
60,0
26,9
65,9
38,2
30,4
9,7
171.1
2014
Non-empowered /unclassi�ed Black In�uenced Companies Black Empowered CompaniesBlack Companies
Captives - Government

9
Third party funds raised during the year, analysed by fund stage (Rbn)*
Late stageEarly stage
0,7 0,1 2,1 0,3 0,2 0,8 1,4 8,2
4,2
2,2 2,2 14,5
15,3 8,5 3,3 11,2 9,9 17,4
22,7
4.9
2.3 2.2
14.5
15.4
10.6
3.6
11.4 10.7
18.8
30.9
2003 2004 2005 2006 2007 2008 2009 2010 2011 2012 2013
6,8
6.8
2014
Geographical sources of third party funds raised
Rest of Africa UK Rest of EuropeUnited States Other or unspeci�ed
South Africa
Funds raisedduring 2013
Funds raisedduring 2014
Funds raised to31 Dec 2013 not yet
returned to investors
Funds raised to31 Dec 2014 not yet
returned to investors
1,2%
5,8%
2,2% 2,3%
1,0%
1,0%
70,3%
7,5%
13,1%
56,7%
16,4%
24,6%
52,0%
17,0%
7,7%
13,9%
8,4%
42,0%
20,2%
9,5%
16,6%
10,7%
* The 2013 figures are funds that were raised and only reported during 2013

10
HighlightsPrivate Equity annual investment by independents as a percentage of GDP (%)
During 2014 During 2013
1,47
1,18
0,99
0,17 0,20 0,25 0,08 0,04
0,14 0,11 0,09 0,05 0,01 0,01 0,01
1,64
1,23
0,81
0,21 0,19 0,18 0,15 0,12 0,12 0,12 0,05 0,02 0,004
Israel UnitedStates
UnitedKingdom
SouthAfrica
SouthKorea
China Sub-Saharan
Africa
India Brazil PolandJapan Turkey Russia MENA
Funds returned to investors during the year (Rbn)
2003 2004 2005 2006 2007 2008 2009 2010 2011 2012 2013
Venfin disposal (R8.8bn)Pepkor & Premier disposal (R5.2bn)
Vodacom disposal (16.0bn)Funds returned to investors 2,4 4,5 4,0 4,4 10,5 6,2 2,0 9,3 20,5
5,2
7,0 9,8
16,0
8,8
2.4
4.5 4.0
20.4
10.5
6.2
2.0
18.1
25.7
7.0
9.8
2014
14,2
14.2
Cost of investments made during the year, analysed by new and follow-on investments (Rbn)
Follow-on Investments(Independents, Captives - Financial services, Captives - Other) New Investments(Independents, Captives - Financial services, Captives - Other)
Follow-on Investments(Captives - Government)
New Investments(Captives - Government)
3,5 4,6 3,3 5,4 24,7 10,7 4,3 6,2 7,7 5,4 6,9
0,7 1,8 1,3
1,5
1,4
8,2
2,9
5,6 8,8
4,5
0,6
0,5
5,7
4.3 6.5
4.5
6.9
26.1
18.9
7.2
11.8
16.5
11.1
17.6
2003 2004 2005 2006 2007 2008 2009 2010 2011 2012 2013
7,9
4,3
17.4
2014
3,2
1,7
3,4
1,7

11

12
2Private EquityIntroduction to

KPMG and SAVCA Private Equity Survey
13
Introduction to Private EquityThe term ‘private equity’ refers to shareholder capital invested in private companies, as distinguished from publicly listed companies. Private equity funds are generally investment vehicles that invest primarily in enterprises which are not listed on a public stock exchange.An enterprise may seek private equity financing for a variety of applications, from increasing its working capital base in times of business expansion, developing new technologies and products to grow and remain competitive, making acquisitions of other businesses, to buying out certain shareholders and to restructure the ownership and management of the business. Another vital application of private equity in South Africa is facilitating the introduction of BEE investment.
The role of private equityInvestments by private equity funds into companies hold great benefits besides the mere cash effect to develop businesses. Private equity investments have considerable impact in terms of productivity, skills development and job creation, as it includes the transfer and exchange of know-how and not only the flow of capital. Private equity fund managers play an active role in managing their investments in companies as they derive a return from the increased value of their investments (not just debt repayment and an associated interest rate) and hence focus on business development for the companies they invest in.
In South Africa the private equity industry represents a significant sector within the overall financial services industry, and is an attractive asset class within the broader capital markets. As seen across a range of indicators, the profile of the local private equity industry is that of a productive contributor to the development of the South African economy. These contributions are detailed in The Economic Impact of Venture Capital and Private Equity in South Africa 2013 study, which is available from SAVCA. In addition private equity facilitates BEE, addresses economic imbalances of the past, promotes entrepreneurial initiatives and positions South Africa to compete successfully on the global stage.
Through the use of leverage in certain transactions, private equity sponsors can assist in improving the capital efficiency of their investee companies.
As can be seen in this survey, private equity is an important source of Foreign Direct Investment (FDI), both indirectly via the raising of offshore money by local fund managers and also by direct co-investment by foreign investors.

14
Introduction to Private Equity
Investment stagesFor the purposes of this survey we have broadly classified private equity into three sub-classes, namely:
› venture capital
› development capital
› buy-out funding
These definitions are found in the glossary.
The history of private equity in South AfricaBeyond being defined as a range of investment categories applicable to non-listed companies, private equity is also a distinct asset class within the broader capital market, and is supported by a well-defined industry made up of various players and stakeholders.
The current profile of the private equity industry in South Africa is the result of various historical developments in the country and in global capital markets. In South Africa, the industry was boosted by the large number of leveraged buy-outs and management buy-outs (LBOs and MBOs), resulting from the widespread disinvestment of multinationals from South Africa in the 1980s. These transactions were structured, financed and managed by the major commercial, merchant and investment banks of the time.
As these local banks developed the in-house expertise to manage private equity investments on an internally funded basis, there was a global trend, especially in the US and Europe (more specifically the UK) towards the formation and management of private equity funds whose capital was sourced from third party investors such as pension funds, large corporations and other institutional entities.
In South Africa the private equity industry benefited from the global trend towards recognising the asset class as an attractive investment vehicle for investors, combined with its growing reputation as an effective means of economic development for Governments and development agencies. It may be argued that South Africa has one of the most sophisticated private equity industries among emerging and developed markets, with different funds at all stages of business development, from start-up venture capital funds through to late-stage and buy-out funds.
Types of private equity firmsA distinction needs to be made between captive and independent fund managers. Fund managers include Independents who manage funds on behalf of third parties as well as Captives who manage on-balance sheet investments that were funded by a parent or group often from an indeterminate pool of money. Captive funds are for the purpose of this survey further classified into the captive funds of Government, financial services (including banks and insurance companies) and other captive funds (including corporates).
Independent fund managers raise cash commitments from third party investors. Generally, in terms of the agreement between the third party investors and the private equity fund manager, the private equity firm draws down on the commitments as and when investments are to be made. Independents are the dominant type of firm in the UK, the rest of Europe and in the US, where these funds are structured as limited partnerships. Private equity firms typically act as the general partner of the limited partnership, whilst institutions and other investors become limited partners.
Unlike captive funds, independent funds are usually closed ended. This means that once a fund has been raised, it is closed out, following which no further commitments are accepted from third parties. Typically, third parties’ commitments expire, often according to a time schedule based on a ‘use it or lose it’ principle, once a maximum drawdown time period expires. Professional private equity managers usually earn income from a combination of a management fee based on total commitments plus a carried interest, which is based on the performance of the fund relative to a benchmark. Captive fund managers usually do not charge any management fee.

KPMG and SAVCA Private Equity Survey
15

16
3ManagementFunds under
KPMG and SAVCA Private Equity Survey
17
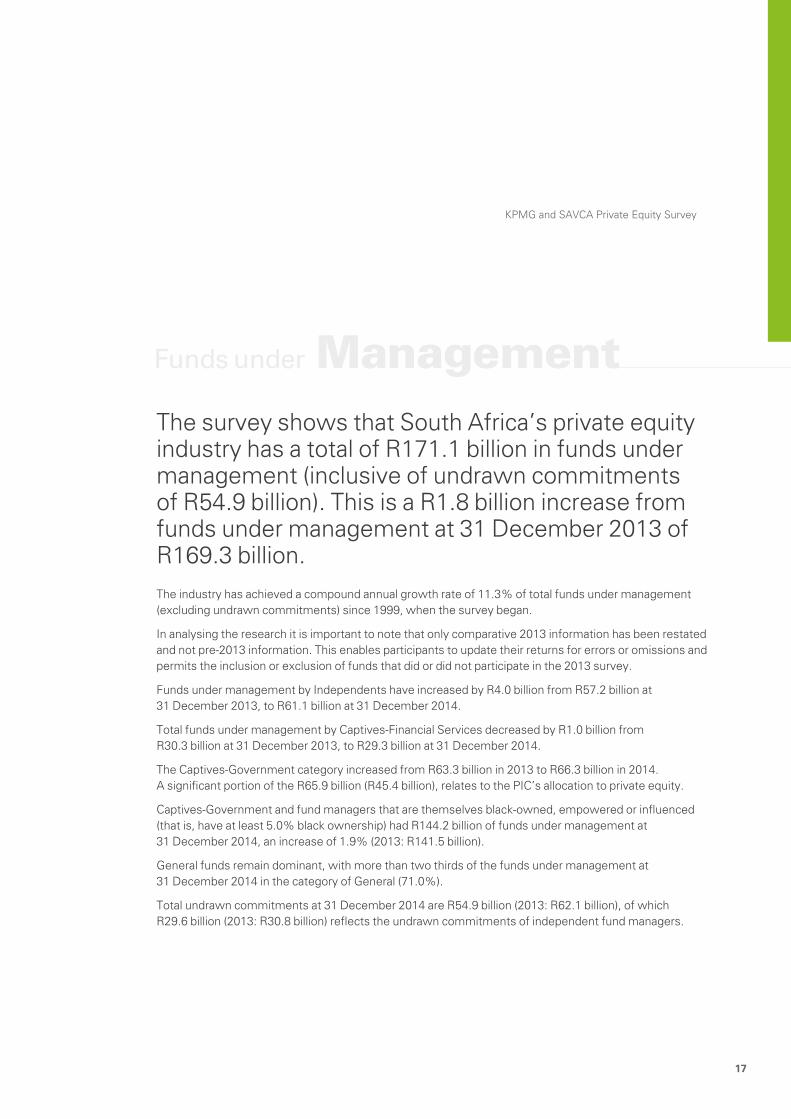
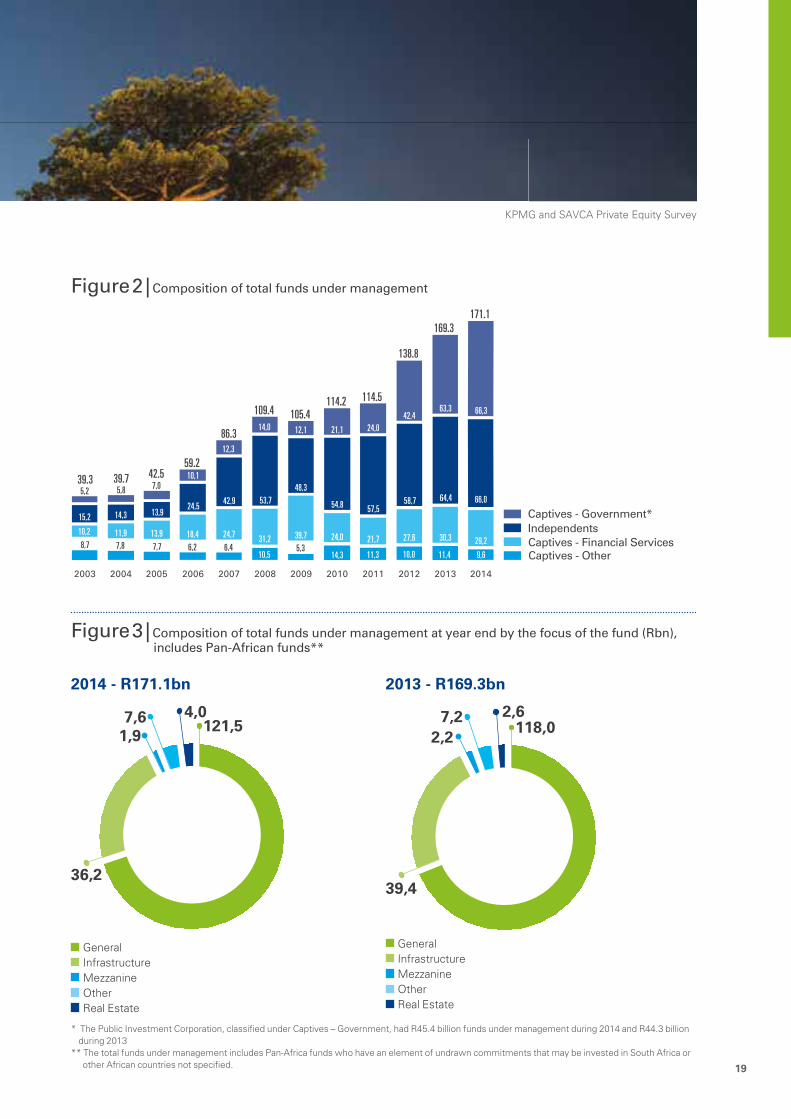
Funds under ManagementThe survey shows that South Africa’s private equity industry has a total of R171.1 billion in funds under management (inclusive of undrawn commitments of R54.9 billion). This is a R1.8 billion increase from funds under management at 31 December 2013 of R169.3 billion.The industry has achieved a compound annual growth rate of 11.3% of total funds under management (excluding undrawn commitments) since 1999, when the survey began.
In analysing the research it is important to note that only comparative 2013 information has been restated and not pre-2013 information. This enables participants to update their returns for errors or omissions and permits the inclusion or exclusion of funds that did or did not participate in the 2013 survey.
Funds under management by Independents have increased by R4.0 billion from R57.2 billion at 31 December 2013, to R61.1 billion at 31 December 2014.
Total funds under management by Captives-Financial Services decreased by R1.0 billion from R30.3 billion at 31 December 2013, to R29.3 billion at 31 December 2014.
The Captives-Government category increased from R63.3 billion in 2013 to R66.3 billion in 2014. A significant portion of the R65.9 billion (R45.4 billion), relates to the PIC’s allocation to private equity.
Captives-Government and fund managers that are themselves black-owned, empowered or influenced (that is, have at least 5.0% black ownership) had R144.2 billion of funds under management at 31 December 2014, an increase of 1.9% (2013: R141.5 billion).
General funds remain dominant, with more than two thirds of the funds under management at 31 December 2014 in the category of General (71.0%).
Total undrawn commitments at 31 December 2014 are R54.9 billion (2013: R62.1 billion), of which R29.6 billion (2013: R30.8 billion) reflects the undrawn commitments of independent fund managers.

18
Funds under Management
Figure 1 | Total Funds Under Management
2014 - R171.1bn
38,6%
17,1%
38,7%
5,6%
Captives - Government | R66.3bn (4 firms) Independents | R66.0bn (39 firms) Captives - Financial Services | R29.2bn (11 firms) Captives - Other | R9.6bn (5 firms)
2013 - R169.3bn
38,0%
17,9%37,4%
6,7%
Captives - Government | R63.3bn (4 firms) Independents | R64.4bn (39 firms) Captives - Financial Services | R30.3bn (11 firms) Captives - Other | R11.4bn (5 firms)
2012 - R138.3bn
42,3%
19,9%30,6%
7,2%
Captives - Government | R42.4bn (6 firms) Independents | R58.7bn (44 firms) Captives - Financial Services | R27.6bn (11 firms) Captives - Other | R10.0bn (8 firms)
2011 - R114.5bn
50,3%
18,9%
21,0%
9,8%
Captives - Government | R24.0bn (6 firms) Independents | R57.5bn (42 firms) Captives - Financial Services | R21.7bn (11 firms) Captives - Other | R10.3bn (18 firms)
KPMG and SAVCA Private Equity Survey
19
Figure 2 | Composition of total funds under management
Captives - Government* Independents Captives - Financial Services Captives - Other
10,2 11,9 13,9 18,4 24,7 31,2 39,7 24,0 21,7 27,6 30,3
5,2 5,8 7,0 10,1
12,3
14,0 12,1 21,1 24,0 42,4
63,3
39.3 39.7 42.5 59.2
86.3
109.4 105.4 114.2 114.5
138.8
169.3
2003 2004 2005 2006 2007 2008 2009 2010 2011 2012 2013
15,2 14,3 13,9 24,5
42,9 53,7 48,3
54,8 57,5 58,7 64,4
66,3
29,2
66,0
8,7 7,8 7,7 6,2 6,4 10,5
5,3 14,3 11,3 10,0 11,4 9,6
171.1
2014
Figure 3 | Composition of total funds under management at year end by the focus of the fund (Rbn), includes Pan-African funds**
2014 - R171.1bn
121,5
36,2
4,07,61,9
General Infrastructure Mezzanine Other Real Estate
2013 - R169.3bn
118,0
39,4
2,67,22,2
General Infrastructure Mezzanine Other Real Estate
* The Public Investment Corporation, classified under Captives – Government, had R45.4 billion funds under management during 2014 and R44.3 billion during 2013
** The total funds under management includes Pan-Africa funds who have an element of undrawn commitments that may be invested in South Africa or other African countries not specified.

20
Funds under Management
Figure 4 | Total funds under management at year end, split by undrawn commitments and investments (Rbn)*
Undrawn commitments Invested 25,5 25,9 26,5 33,9 54,7 68,8 70,4 78,3 83,9 97,9 107,2
13,8 13,8 16,0 25,3
31,6
40,6 35,0 35,9
30,6
40,9 62,1
39.3 39.7 42.5
59.2
86.3
109.4 105.4 114.2 114.5
138.8
169.3
116,2
54,9
171.1
2003 2004 2005 2006 2007 2008 2009 2010 2011 2012 2013 2014
Figure 5 | Total funds under management by type as at 31 December 2014, split by undrawn commitments and invested (Rbn)
Undrawn commitments (R54.9bn) Invested (R116.2bn) 36,3 24,5 47,3 8,0
29,6
4,7
18,9
1,6
66.0
29.2
66.3
9.6
Independents Captives- FinancialServices
Captives- Government
Captives- Other
* A portion of the undrawn commitments is inclusive of a provision for future management fees.

KPMG and SAVCA Private Equity Survey
21
22
Funds under Management
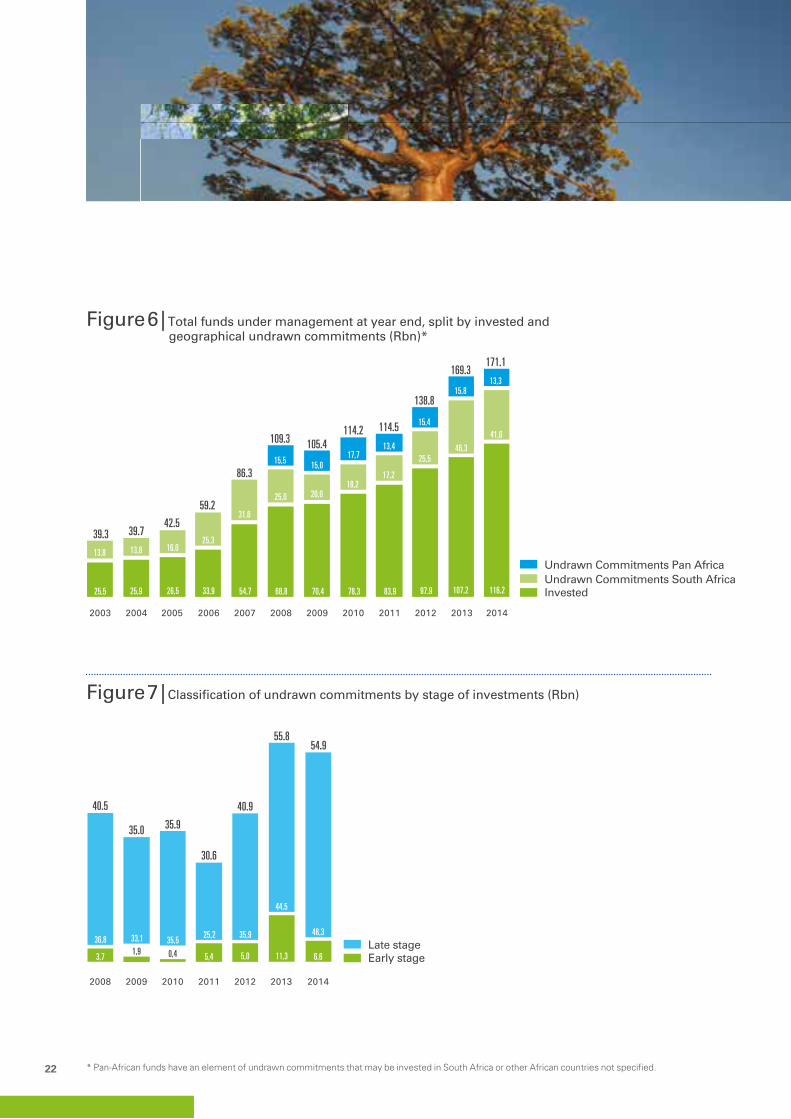
Figure 6 | Total funds under management at year end, split by invested and geographical undrawn commitments (Rbn)*
Undrawn Commitments South Africa Undrawn Commitments Pan Africa
Invested 25,5 25,9 26,5 33,9 54,7 68,8 70,4 78,3 83,9 97,9 107,2
13,8 13,8 16,0 25,3
31,6
25,0 20,0 18,2
17,2
25,5 46,3
15,5 15,0 17,7
13,4
15,4
39.3 39.7 42.5
59.2
86.3
109.3 105.4 114.2 114.5
138.8
169.3
2003 2004 2005 2006 2007 2008 2009 2010 2011 2012 2013
116,2
41,6
13,3
171.1
2014
15,8
Figure 7 | Classification of undrawn commitments by stage of investments (Rbn)
Late stage Early stage
36,8 33,1 35,5 25,2 35,9
44,5
3,7 1,9 0,4 5,4 5,0 11,3
40.5
35.0 35.9
30.6
40.9
55.8
2008 2009 2010 2011 2012 2013
48,3
6,6
54.9
2014
* Pan-African funds have an element of undrawn commitments that may be invested in South Africa or other African countries not specified.

KPMG and SAVCA Private Equity Survey
23
Figure 8 | Classification of undrawn commitments by type of fund manager (Rbn)
Captives - Government Independents Captives - Financial Services Captives - Other
28,0 23,2 23,5
23,0 26,0 30,8
2,1
11,2 9,6 5,5 5,3 6,6
2,4
0,1 7,6
22,8
8,0 0,6 2,2 1,7 1,8 1,8
0,1
40.5
35.0 35.4
30.4
40.7
62.1
29,6
4,7
18,9
1,6
54.9
2008 2009 2010 2011 2012 2013 2014
Figure 9 | Composition of later stage, independent undrawn commitments by focus of the fund (Rbn)*
Mezzanine Other Infrastructure General
Mining and Resources
12,7 12,4 15,9 12,8 15,0 22,0
10,7
2,1
1,3
1,3
0,3 0,3
0,1
6,8
0,7
0,6
12,3 8,5
0,4
0,4
4,5 6,0
2,5
25.2
21.1
33.8
20.1 21.0
27.1
2008 2009 2010 2011 2012 2013
23,0
1,1
4,0
28.8
2014
* A portion of the undrawn commitments is inclusive of a provision for future management fees.

24
Funds under Management
Figure 10 | Funds under management by BEE fund managers at year end (Rbn)
5,3 10,5 12,3 17,2 22,7 28,4 35,1
31,1 32,2 32,1 39,4
1,5
4,5 12,0 14,8 7,9 7,8
19,9 23,8 25,3 24,3 29,3
1,9 3,6 2,8 2,2 16,1 18,4 16,3
11,6 9,1 8,7 9,8
39.3 39.7 42.5 59.2
86.3 109.4 105.4
114.2 114.5
138.8
169.3
2003 2004 2005 2006 2007 2008 2009 2010 2011 2012 2013
25,4 15,3 8,4 14,8
27,4 40,8
22,0 26,5 23,9 31,3
27,8
5,2 5,8 7,0 10,1
12,3 14,0 12,1 21,2 24,0 42,4
60,0
26,9
65,9
38,2
30,4
9,7
171.1
2014
Non-empowered /unclassi�ed Black In�uenced Companies Black Empowered CompaniesBlack Companies
Captives - Government

KPMG and SAVCA Private Equity Survey
25
KPMG and SAVCA Private Equity Survey 25
Comparison to the global marketAlthough the South African private equity industry as a whole is relatively small in comparison to those of the US and UK, it is well established and locally significant.
Using the available EMPEA information, but recalculating the South African percentages using the South African survey data, South Africa has investment activity as a percentage of GDP for 2014 of 0.21 % (2013: 0.17%). The calculation relates to annual investment by Independents only, in order to compare directly with the EMPEA information. South Africa’s private equity investment as a percentage of GDP is higher than India (0.19%), China (0.15%), Brazil (0.12%) and Russia (0.01%). It is still some way off that of the United Kingdom (0.81%), the United States (1.23%) and Israel (1.64%).
Figure 11 | Private Equity annual investment by independents as a percentage of GDP (%)
During 2014 During 2013
1,47
1,18
0,99
0,17 0,20 0,25 0,08 0,04
0,14 0,11 0,09 0,05 0,01 0,01 0,01
1,64
1,23
0,81
0,21 0,19 0,18 0,15 0,12 0,12 0,12 0,05 0,02 0,004
Israel UnitedStates
UnitedKingdom
SouthAfrica
SouthKorea
China Sub-Saharan
Africa
India Brazil PolandJapan Turkey Russia MENA

26
4ActivityFund Raising

KPMG and SAVCA Private Equity Survey
27
Fund Raising ActivityThe total of third party funds raised in 2014 decreased from R30.9 billion reported during 2013, to R6.8 billion during 2014. The majority of reported fund raising activity during 2014 was by Independents (70.5%). In 2013 the majority of the funds was by Captives – Government (63.6%).
The major fund raisers for 2014 were International Housing Solutions, Development Partners International and the Public Investment Corporation.
In 2013 the major fund raisers included Actis, Capitalworks and the Public Investment Corporation.
Of the total raised in 2013, R4.3 billion (62.5%) was from South African sources. 31.9% of all third party funds raised during 2014 were from insurance companies/institutions (2013: 9.3%). Government, aid agencies and DFI’s accounted for 16.9% in 2014 (2013: 14.5%) and private equity fund of funds, 16.1% in 2014 (2013: 6.5%)
Cumulatively, of the funds raised but not yet returned to investors, South Africa is the main source of fund raising (42.0%), ahead of the UK (20.2%) and the United States (9.5%).

28
Fund Raising Activity
Figure 12 | Third party funds raised during the year, analysed by fund stage (Rbn)*
Late stageEarly stage
0,7 0,1 2,1 0,3 0,2 0,8 1,4 8,2
4,2
2,2 2,2 14,5
15,3 8,5 3,3 11,2 9,9 17,4
22,7
4.9
2.3 2.2
14.5
15.4
10.6
3.6
11.4 10.7
18.8
30.9
2003 2004 2005 2006 2007 2008 2009 2010 2011 2012 2013
6,8
6.8
2014
Figure 13 | Source of third party funds raised during 2014 (Rbn)
Foreign source (R2.6 billion) Local source (R4.3 billion)
1.0
2.2
0.4
1.9
1.0 1.1
Pension &endowment
Insurancecompanies/institutions
BanksGovernment,aid agencies
and DFIs(Development
FundingInstitutions)
Privateindividuals
Privateequityfund offunds
0,5
0,6 1,9
0,3
0,4
0,8
0,4
0,6
0,4
0,5
0,6
* The 2013 figures are funds that were raised and only reported during 2013

KPMG and SAVCA Private Equity Survey
29
Figure 14 | Source of third party funds raised during 2013 (Rbn)
Foreign source (R10.8 billion)
Local source (R20.1 billion)
0,8 18.9
2.9 0.4
4.5 0.6 1.7 2.0
Pension andendowment
funds
Insurancecompanies/institutions
Banks Government,aid agencies
and DFIs(Development
Funding Institutions)
Privateindividuals
Corporates Privateequityfund offunds
1,90,1
0,2 1,0
0,5
0,1 0,2 0,4 4,5
1,5 1,6
18,1
Figure 15 | Geographical sources of third party funds raised
Rest of Africa UK Rest of EuropeUnited States Other or unspeci�ed
South Africa
Funds raisedduring 2013
Funds raisedduring 2014
Funds raised to31 Dec 2013 not yet
returned to investors
Funds raised to31 Dec 2014 not yet
returned to investors
1,2%
5,8%
2,2% 2,3%
1,0%
1,0%
70,3%
7,5%
13,1%
56,7%
16,4%
24,6%
52,0%
17,0%
7,7%
13,9%
8,4%
42,0%
20,2%
9,5%
16,6%
10,7%

30
Fund Raising Activity
The figure below uses EMPEA data for Russia/CIS, India, China and Brazil, with South African data collated from the survey. This calculation relates to the Independents only in order to compare directly with the EMPEA information.
Figure 16 | Emerging markets private equity fundraising totals by select markets (US$bn)
India China Brazil
RussiaSouth Africa
2,9 0,5 2,5 7,2 2,8 1,6
14,6 6,9 8,6
21,6
11,4 10,3
7,3
2,3
3,2
2,6
2,6 1,2
0,6
1,1
1,1
0,2
0,1
0,3
0,6
0,7
0,6
0,5
0,4
1,5
26.4
10.3 15.9
32.4
18.5
14.2
2008 2009 2010 2011 2012 2013
4,1
9,7
2,1
0,3
0,2 16.5
2014

KPMG and SAVCA Private Equity Survey
31
32
5ActivityInvestment
KPMG and SAVCA Private Equity Survey
33
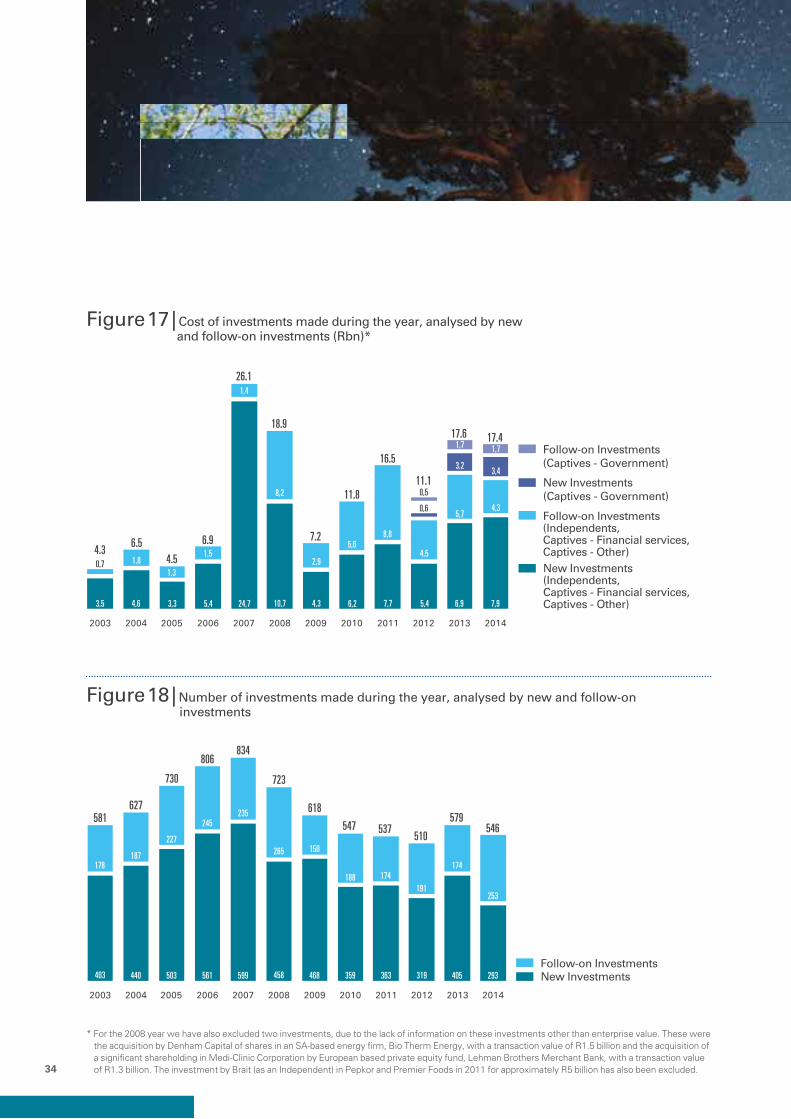
Investment ActivityThe reported value of private equity investments during 2014 is R17.4 billion (2013: R17.6 billion). The total number of investments decreased by 33, from 579 to 546 during 2014.New Investments during 2014 amounted to R11.3 billion (2013: R10.2 billion) and follow-on investments during 2014 amounted to R6.0 billion (2013: R7.4 billion)
The overall average investment deal size increased from R30.3 million for the 2013 year to R31.8 million during 2014. The average deal size for new investments increased from R25.1 million during 2013 to R38.6 million during 2014, while average deal size for follow-on investments decreased from R42.5 million during 2013 to R23.8 million during 2014.
In terms of the number of reported investments, Business Partners, classified as Captives-Other, was again by far the most active investor in the South African private equity market, contributing 332 (60.8%) of the total number of reported investments made during 2014 (2013: 349, 60.3%). By value, Business Partners represents 3.6% in terms of the cost of total investments made during 2014 (2013: 4.0%). Business Partners’ average deal size was R3.6 million in 2014 compared to R4.0 million in 2013.
If Business Partners’ investments are excluded, the total average deal size during 2014 increases to R194.1 million (2013: R155.2 million), new investments’ average deal size during 2014 increases to R153.1 million from R63.8 million during 2013 and follow-on investments average deal size during 2014 decreases to R41.0 million from R91.4 million during 2013.
By number, Captives-Other has the largest number of deals, as this category includes investments made by Business Partners.
Of the investments made during 2014 classified into sectors, 25.5% were in the Infrastructure sector, 24.7% in the other/unspecified sector category and 18.2% in the Banks, financial services and insurance sector.
Manufacturing comprises 24.8% of all unrealised investments at 31 December 2014, with infrastructure making up 18.4% and mining and natural resources making up 12.9%.
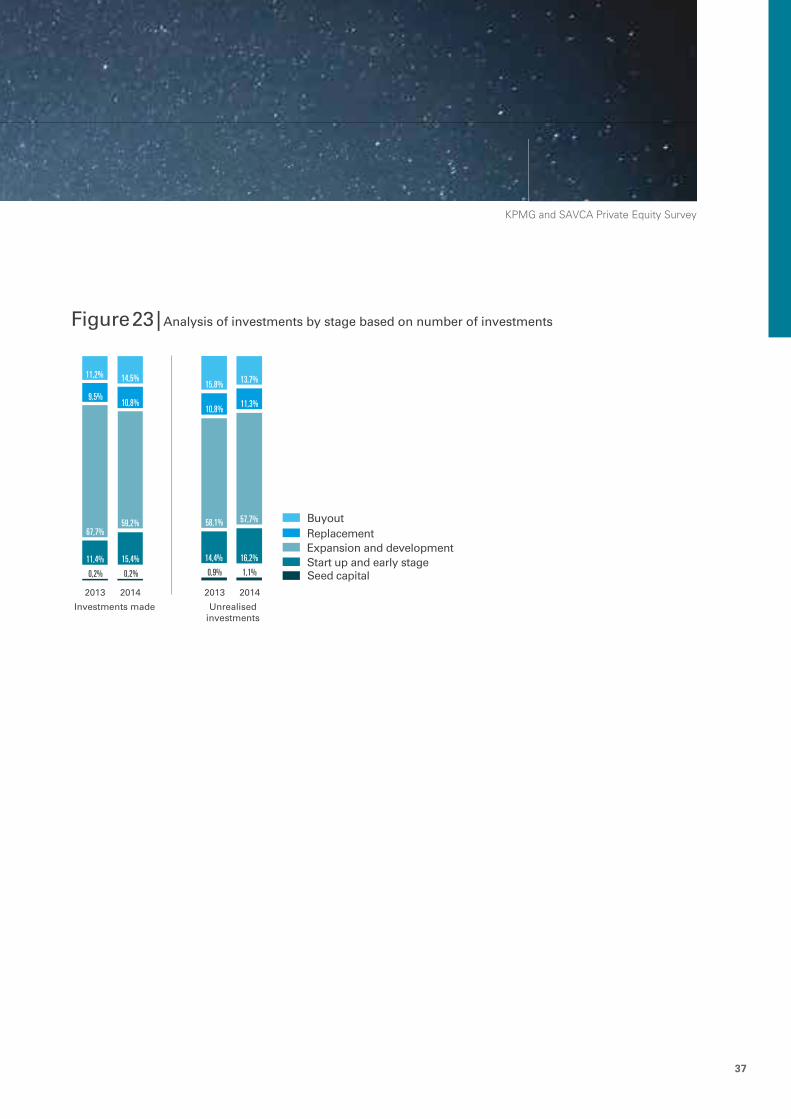
The cost of investments into seed and start-up/early stage entities contributed 16.3% of cumulative unrealised investments at 31 December 2014 (2013: 11.4%). This represented 17.3% of the number of investments at 31 December 2014 (2013: 15.3%), which is indicative of the proportionally smaller transaction values for the early-stage types of deals.
Expansion and development as a proportion of investments made by cost, decreased from 43.1% in 2013 to 27.2% in 2014 and Replacement capital increased from 12.8% during 2013 to 27.6% in 2014.
34
Investment Activity
Figure 17 | Cost of investments made during the year, analysed by new and follow-on investments (Rbn)*
Follow-on Investments(Independents, Captives - Financial services, Captives - Other) New Investments(Independents, Captives - Financial services, Captives - Other)
Follow-on Investments(Captives - Government)
New Investments(Captives - Government)
3,5 4,6 3,3 5,4 24,7 10,7 4,3 6,2 7,7 5,4 6,9
0,7 1,8 1,3
1,5
1,4
8,2
2,9
5,6 8,8
4,5
0,6
0,5
5,7
4.3 6.5
4.5
6.9
26.1
18.9
7.2
11.8
16.5
11.1
17.6
2003 2004 2005 2006 2007 2008 2009 2010 2011 2012 2013
7,9
4,3
17.4
2014
3,2
1,7
3,4
1,7
Figure 18 | Number of investments made during the year, analysed by new and follow-on investments
Follow-on Investments New Investments 403 440 503 561 599 458 468 359 363 319 405
178 187
227
245 235
265 150
188 174 191
174
581 627
730
806 834
723
618
547 537 510
579
2003 2004 2005 2006 2007 2008 2009 2010 2011 2012 2013
293
253
546
2014
* For the 2008 year we have also excluded two investments, due to the lack of information on these investments other than enterprise value. These were the acquisition by Denham Capital of shares in an SA-based energy firm, Bio Therm Energy, with a transaction value of R1.5 billion and the acquisition of a significant shareholding in Medi-Clinic Corporation by European based private equity fund, Lehman Brothers Merchant Bank, with a transaction value of R1.3 billion. The investment by Brait (as an Independent) in Pepkor and Premier Foods in 2011 for approximately R5 billion has also been excluded.

KPMG and SAVCA Private Equity Survey
35
Figure 19 | Cost (Rbn) and number of investments made during the year, analysed by type of fund manager
5,2 4,4 46
84
Cost ofInvestments
(Rbn)
Number ofInvestments
2013 2014
4,9
1,7
16.9
5,0
5,1
0,8
16.7
6,4
50
26
108
230
2013 2014
45
20
65
214
Captives - Government Independents Captives - Financial Services Captives - Other
.
Figure 20 | Investments made during the year, analysed by sector
2014 2013
Infrastructure, energy and
related
Other/Unspeci�ed
ManufacturingBanks,financialservices
andinsurance
Miningand
naturalresources
Retail Media Services Telecoms HealthcareInformationtechnology
25,5%
41,4%
24,7%
18,2%
9,5%
4,2% 4,1% 3,5% 3,3% 3,3% 2,6% 2,6% 1,1%
15,2%
8,8%
2,2%
11,5%
1,0%
9,8%
1%
4,0% 1,7% 1,6%

36
Investment Activity
Figure 21 | Unrealised investments portfolio at year end, analysed by sector*
2014 2013
Infrastructure,energy and
related
Manufacturing Media Banks,financialservices
andinsurance
Miningand
naturalresources
Services Retail Healthcare Telecoms Entertainment,leisure andtourism
24,8%
18,4%
4,6%
29,6%
19,7%
12,9% 12,5% 12,2% 11,4% 11,1%
8,9%
4,6% 4,6% 5,0%
2,7% 2,7% 1,4% 1,6%
2,9%
0,9%
Figure 22 | Analysis of investments by stage based on cost of investments
Start up and early stageExpansion and developmentReplacementBuyout
Seed capital11,6%
43,1%
12,8%
32,8%
2013
22,0%
27,2%
27,6%
32,2%
2014
Investments made
2013 2014
Unrealisedinvestments
1,2% 1,2%10,2%
37,9%
11,1%
39,6%
?%
34,1%
12,7%
37,0%
* 12.9% (R13.2 billion) of investments made during 2014 were classified in the other sector category or not classified at all by survey participants (2013: 6.8% / R6.7 billion). These have been excluded from the above analysis.
KPMG and SAVCA Private Equity Survey
37
Figure 23 | Analysis of investments by stage based on number of investments
Start up and early stageExpansion and developmentReplacementBuyout
Seed capital2013
Investments made
2013
Unrealisedinvestments
11,4%
67,7%
9,5%
11,2%
10,8%
14,5%
2014
0,9%
14,4%
58,1%
10,8%
15,8%
2014
1,1%0,2% 0,2%
16,2%
57,7%
11,3%
13,7%
59,2%
15,4%

38
Investment Activity
Figure 24 | The figure below provides an analysis of the Top 10 largest reported private equity transactions in 2014
Name of investment
Equity provider/sDebt provider/s
Total funding raised (Rm)
Type of investment
PE Fund’s equity interest
BEE ownership (post deal)
RTT Ethos, PIC & DPI RMB > R2 500.0 LBO 42.7% Black influenced company
Tiger Automotive
Old Mutual Private Equity
ABSA R 1 776.0 LBO 38.5% Not disclosed
Autozone Ethos ABSA > R1 000.0 LBO 79.6% Black empowered company
Tekkie Town Actis Africa Ltd -
R 605.7 Replacement capital
42.5% Not empowered
Homechoice DPI through African Development Partners II L.P.
-
> R 500.00 Replacement capital
16.5% Not disclosed
Compuscan Actis Africa Ltd -
R 402.8 Later stage expansion capital
60.0% Not empowered
Dynamic Bedding
Vantage & management
Investec (senior) & Vanatage (mezz)
R 144.4 Management Buyout
60.0% Not disclosed
10X Old Mutual Private Equity
n/a R 30.0 Later stage expansion capital
16.7% Not disclosed
Boxmore Plastics (Pty) Ltd
Investec Principal Investments
-
R 8.7 Later stage expansion capital
0.0% Black empowered company
Autocast (Pty) Ltd
Investec Principal Investments
-
R 6.4 LBO 0.0% Black influenced company

KPMG and SAVCA Private Equity Survey
39
Figure 25 | The figure below provides an analysis of the Top 10 largest reported private equity transactions in 2013
Name of investment
Equity provider/sDebt provider/s
Total funding raised (Rm)
Type of investment
PE Fund’s equity interest
BEE ownership (post deal)
Bokpoort GEPF 25%, ACWA Power 40%, Lereko Solafrica Investments (Pty) Ltd 13%, Lereko Metier Solafrica Fund I Trust 9%, Lereko Metier Sustainable Capital Fund I Trust 3%, Kurisani Solafrica Investments (Pty) Ltd 5%, Solafrica Community Investment Company 5%
Investec/Absa/DBSA
R 4 713.0 Development Capital (Renewable Energy)
25.0% Black influenced company
Kansai-Plascon (KP)
Kansai Paint, GEPF, KP Employee Trust, Other.
Kansai-Plascon to Employee Trust
R 3 500.0 MBO (BEE equity participation)
9.9% Black influenced company
SunEdison Boshoff
GEPF 19%, SEGP Renewable Energy SA (Pty) Ltd 51%, Nehawu Investment Holdings (Pty) Ltd 20%, Kurisani Boshoff Trust (Pty) Ltd 10%
OPIC R 2 502.0 Development Capital (Renewable Energy)
19.0% Black empowered company
Independent News Media South Africa
PIC, Sekunjalo Independent Media Proprietary Ltd, Interacom Investment Holdings Ltd
PIC and Interacom
R 2 000.0 Buy-Out 25.0% Black company
Paycorp Group (Pty) Ltd
Actis Africa Ltd Investec, RMB R 937.0 MBO 77.7% Black influenced company
Southern Farms (SF)
GEPF (20%), SF Employee Trust (20%), SF Investment (60%).
GEPF/ Southern Cross Holdings.
R 600 m Development Capital
20.0% Black influenced company
Cedar Park Properties
Regiments Capital Vantage R 590.0 Exansion capital
Undisclosed Black empowered company
Van Schaik Bookstore (Pty) Ltd
Medu Capital RMB R 325.0 LBO 51.0% Black empowered company
Assupol Holdings Ltd
Investec -
R 308.8 LBO 30.0% Black empowered company
Auto Industrial Group (Pty) Limited
Trinitas Private Equity Partnership
FNB / Investec R 300.0 Replacement capital
70.0% Black influenced company

40
6BEE InvestmentAnalysis of
KPMG and SAVCA Private Equity Survey
41
Analysis of BEE InvestmentBEE investments are an important element of the South African economy and remain a significant portion of the M&A activity in South Africa. The cost of investment into entities that are at least black-influenced companies in 2014 was R12.4 billion, a decrease of 4.5% from the 2013 levels. The number of BEE investments increased from 236 during 2013 to 267 during 2014. It should be noted that 343 investments during 2013 were categorised as Non-empowered/unspecified and 279 during 2014.The average black economic empowerment deal size in 2014 was R46.6 million compared to R55.2 million during 2013. These are investments into black owned, empowered, influenced or Captives-Government companies.

42
Analysis of BEE Investment
Figure 26 | Cost of BEE investments made during the year (Rbn)
2003 2004 2005 2006 2007 2008 2009 2010 2011 2012 2013
Captives - GovernmentBlack Influenced Companies Black Empowered CompaniesBlack Companies0,3 0,6
1,1 2,9 3,4 5,5 1,7 2,7 5,2 0,7
2,0
0,6 1,3 1,9
1,7 6,1
5,0
2,8
2,5
2,4
4,4 4,3
0,5 1,8 0,1
2,4
2,7
1,1 3,3
0,4
1,9 1,9
0,7 0,7 0,5 4,9
1.43.6
3.14.7
11.8
13.2
5.6
9.2 8.77.6
13.0
2014
2,4
1,8
3,1
5,1
12.4
Figure 27 | Number of BEE investments made during the year
2004 2005 2006 2007 2008 2009 2010 2011 2012 2013
Captives - GovernmentBlack Influenced Companies Black Empowered CompaniesBlack Companies51 227 251 284 233 173 39 120
23 138
203
52 79
74
70
49
150
53
50
44
14 8
11 32
16
18
20 10
29
14
5 2
6
40
268287
341
390
319
240214 185
108
236
2014
133
44
45
45
267
2003
26
144
15 185

KPMG and SAVCA Private Equity Survey
43
KPMG and SAVCA Private Equity Survey 43

44
7Exits
KPMG and SAVCA Private Equity Survey
45
ExitsThe realisation market in the South African private equity industry returned the highest amount of capital since 2011. Funds returned to investors increased by R4.4 billion (44.7%) from R9.8 billion during 2013, to R14.2 billion during 2014. The realisation in 2014 had implied times money multiplies of 2.4 times, significantly higher than the 1.6 times reported in 2013 and the 1.2 times in 2012.
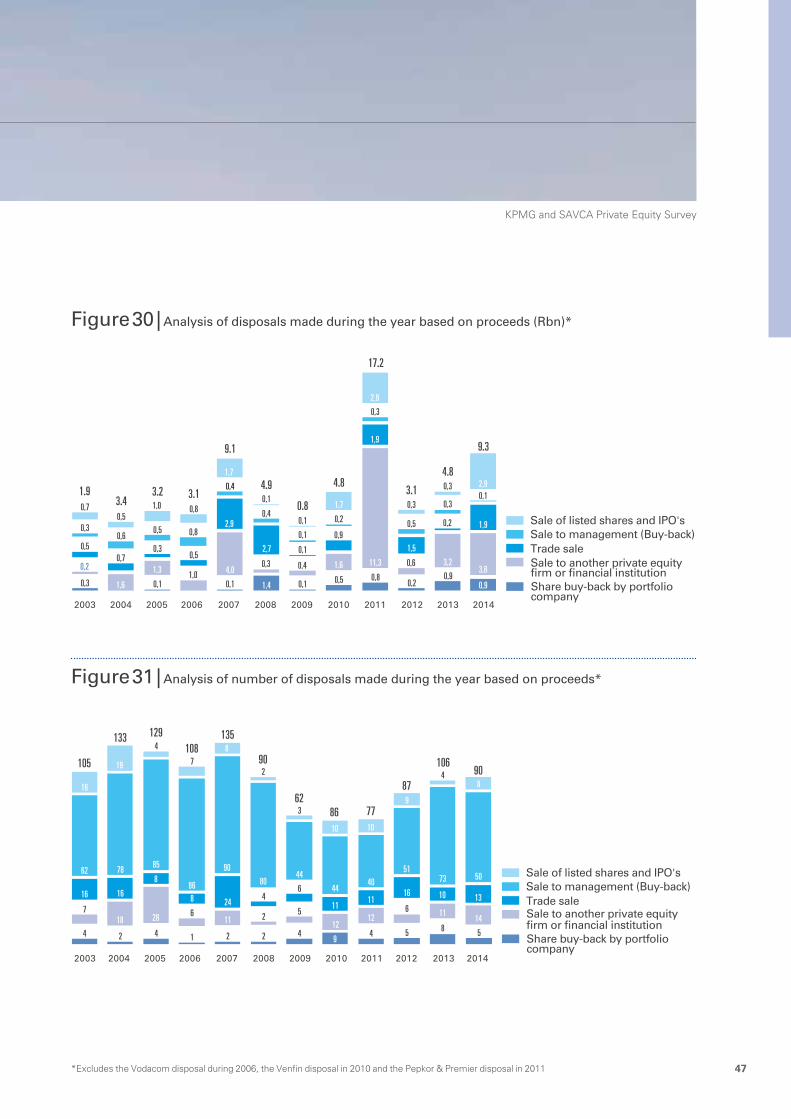
The value of disposals increased from R4.8 billion in 2013 to R9.3 billion during 2014. Disposals through sale of listed shares was the most popular in value terms.
The average proceeds per disposal increased from R45.6 million in 2013 to R103.6 million in 2014.

46
Exits
Figure 28 | Funds returned to investors during the year (Rbn)
2003 2004 2005 2006 2007 2008 2009 2010 2011 2012 2013
Venfin disposal (R8.8bn)Pepkor & Premier disposal (R5.2bn)
Vodacom disposal (16.0bn)Funds returned to investors 2,4 4,5 4,0 4,4 10,5 6,2 2,0 9,3 20,5
5,2
7,0 9,8
16,0
8,8
2.4
4.5 4.0
20.4
10.5
6.2
2.0
18.1
25.7
7.0
9.8
2014
14,2
14.2
Figure 29 | Proceeds of funds returned to investors during the year (Rbn)
During 2014 (R14.2 billion) During 2013 (R9.8 billion)
Sale to anotherprivate equity�rm or �nancial
institution
Repayment of
preferenceshares /
loans
Sale tomanagement
with no equity
involvement of another �nancial
institution
Share buy-back
byportfoliocompany
Other /unspeci�ed
Write-offs -includingsales for a nominalamount
Sale of listedshares
Listingor IPO
Tradesale
0,20,3
0,0 0,0
0,3
3,2
3,6 3,5
3,8
0,9 0,9
0,6
0,9 0,9
0,2
1,9
2,8
0,1
KPMG and SAVCA Private Equity Survey
47
Figure 30 | Analysis of disposals made during the year based on proceeds (Rbn)*
2003 2004 2005 2006 2007 2008 2009 2010 2011 2012 2013
Sale to management (Buy-back) Sale of listed shares and IPO's
Trade sale Sale to another private equity �rm or �nancial institution Share buy-back by portfolio company
0,3 0,1 0,1 1,4 0,1 0,5 0,8 0,2
0,9 0,2
1,6
1,3 1,0 4,0 0,3 0,4 1,6 11,3 0,6 3,2
0,5 0,7
0,3 0,5
2,9
2,7
0,1 0,9
1,9
1,5
0,2 0,3 0,6
0,5 0,8
0,4
0,4 0,1 0,2
0,3
0,5
0,30,7 0,5
1,0 0,8
1,7
0,1
0,1
1,7
2,9
0,3
0,3 1.9 3.4
3.2 3.1
9.1
4.9
0.8
4.8
17.2
3.1
4.8
2014
3,6
1,9
2,9
9.3
0,9
0,1
Figure 31 | Analysis of number of disposals made during the year based on proceeds*
2003 2004 2005 2006 2007 2008 2009 2010 2011 2012 2013
Sale to management (Buy-back) Sale of listed shares and IPO's
Trade sale Sale to another private equity �rm or �nancial institution Share buy-back by portfolio company
4 2 4 1 2 2 4 9
4 5 5 8
7 18 28 6
11 2 5 12
12 6 11
16 16
8
8 24 4
6
11 11
16 10
62 78 85
86
90
80 44
44 40
51 73
16
19
4
7 8
2
3
10 10
9
4 105
133 129 108
135
90
62 86 77
87
106 90
2014
13
14
50
8
*Excludes the Vodacom disposal during 2006, the Venfin disposal in 2010 and the Pepkor & Premier disposal in 2011

48
ExitsFigure 32 | Proceeds and cost of investments made during 2014 (Rbn)
Cost (R4.1 billion) Proceeds (R9.3 billion)
Sale oflistedshares
and IPO's
Total Tradesale
Sale toanotherprivateequity�rm or
�nancialinstitution
Sharebuy-back
by portfoliocompany
Sale tomanagement
(Buy-back)
9,3
2,9
3,6
1,9
0,9
0,1
4,1
1,8
1,3 0,8
0,1 0,0
Figure 33 | Proceeds and cost of investments made during 2013 (Rbn)
Cost (R4.5 billion) Proceeds (R4.8 billion)
Sale to another
private equity�rm or �nancial
institution
Total Sale tomanagement
(Buy-back)
Share buy-back
by portfoliocompany
Sale of listedshares
and IPO
Tradesale
4,8
3,2
0,9
0,3 0,3 0,2
4,5
3,3
0,5 0,3
0,2 0,2
Write-offsThirty-one investments were written off during 2014, inclusive of sales for nominal amounts (2013: 48 investments). The net loss on these investments (cost less proceeds) was R558.0 million in 2014 (R93.0 million in 2013).
Cancelled/expired fundsNo committed funds were cancelled and/or expired during 2014 (2013: R83.5 million).

KPMG and SAVCA Private Equity Survey
49

50
8Performance

KPMG and SAVCA Private Equity Survey
51
PerformanceBackground
Measuring the performance of private equity funds on a consistent basis can be difficult as private equity investment valuations are, by their very nature, highly subjective. The overriding principle of the International Private Equity and Venture Capital Valuation Guidelines is to show a fair valuation of investments to the investor. These guidelines were released during 2005 and adopted by the majority of global private equity associations, including SAVCA and EVCA.Riscura Fundamentals, in conjunction with SAVCA, produce a quarterly South African Private Equity performance report. The reported private equity returns over different time periods as compared to listed entities are as follows:
52
Performance
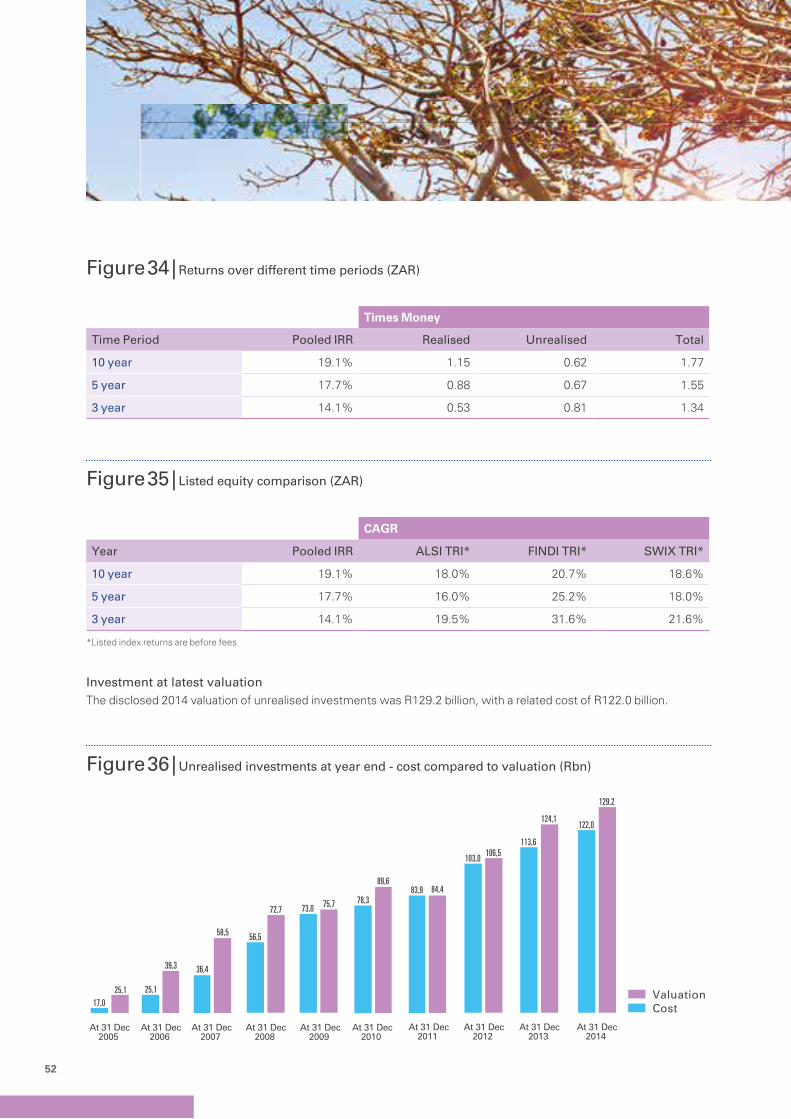
Figure 34 | Returns over different time periods (ZAR)
Number of professionals 2014 Times Money
Time Period Pooled IRR Realised Unrealised Total
10 year 19.1% 1.15 0.62 1.77
5 year 17.7% 0.88 0.67 1.55
3 year 14.1% 0.53 0.81 1.34
Figure 35 | Listed equity comparison (ZAR)
Number of professionals 2014 CAGR
Year Pooled IRR ALSI TRI* FINDI TRI* SWIX TRI*
10 year 19.1% 18.0% 20.7% 18.6%
5 year 17.7% 16.0% 25.2% 18.0%
3 year 14.1% 19.5% 31.6% 21.6%
*Listed index returns are before fees
Investment at latest valuationThe disclosed 2014 valuation of unrealised investments was R129.2 billion, with a related cost of R122.0 billion.
Figure 36 | Unrealised investments at year end - cost compared to valuation (Rbn)
Valuation Cost
17,0
25,1
36,4
56,5
73,0 78,3
83,9
103,0
113,6
25,1
39,3
58,5
72,7 75,7
89,6 84,4
106,5
124,1 122,0
129,2
At 31 Dec2005
At 31 Dec2006
At 31 Dec2007
At 31 Dec2008
At 31 Dec2009
At 31 Dec2010
At 31 Dec2011
At 31 Dec2012
At 31 Dec2013
At 31 Dec2014

KPMG and SAVCA Private Equity Survey
53

54
9ProfessionalsPrivate Equity Investment

KPMG and SAVCA Private Equity Survey
55
Private Equity Investment ProfessionalsThe total number of investment professionals employed in the Private Equity industry increased from 546 in 2013 to 557 in 2014. The figure below illustrates that the number of black staff members has increased from 123 of the private equity workforce in 2013 to 149 in 2014.
Indian, coloured and black professionals employed by the private equity industry increased by 21 during 2013 to 226. By comparison, white professionals decreased by 16 during 2014 to 257.
At 31 December 2014 23.4% of all professionals were females (2013: 21.4%).
Number of professionals 2014
White Indian Coloured Black Undisclosed
Male 217 41 14 91 63
Female 40 15 7 58 11
Total 257 56 21 149 74
Number of professionals 2013
White Indian Coloured Black Undisclosed
Male 233 48 14 78 56
Female 40 3 17 45 12
Total 273 51 31 123 68
56
10EmpowermentBlack Economic

KPMG and SAVCA Private Equity Survey
57
Black Economic EmpowermentOne of the notable features of South Africa’s private equity industry is the very significant role it plays in the development of BEE. The industry’s impact on BEE is far reaching, as detailed in the various sections of this survey. It is specifically important to note that:
› The Codes of Good Practice for Broad-Based BEE (BEE Codes), issued by the Department of Trade and Industry (DTI), stipulate the conditions under which a company may treat its ownership arising from a private equity fund as if that ownership were held by black people. These requirements were finalised in June 2007 and provide the industry clarity on how to further increase its already significant contribution on this vital socio-economic process. The requirements can be summarised as follows:
− More than 50% of any exercisable voting rights associated with the equity instruments through which the private equity fund manager holds rights of ownership must be held by black people.
− More than 50% of the profits made by the private equity fund manager after realising any investment made by it, must by written agreement, accrue to black people.
− The private equity fund manager must be a black-owned company, as defined in the BEE Codes.
− Over a 10-year period, the private equity fund must have more than 50% of the value of funds invested, invested in black-owned enterprises that have at least 25% direct black ownership.
› Private equity transactions enable higher gearing, whereby a combination of private equity investment and bank loans allow the implementation of an appropriately geared financial structure, allowing management of the investee company to acquire a significant stake in the company. This leveraged model also creates opportunities for the involvement of black management and other BEE parties in the ownership and management of the investee company.
› The vast majority of transactions concluded by the industry have a significant BEE component and the majority of South African private equity fund managers have a BEE element to their own shareholding structure.Empowerment

58
11TablesData

KPMG and SAVCA Private Equity Survey
59
Data Tables Total funds under
management at year end
Undrawn commitments
at year end
Fund raising activity during
the year
Investment activity during
the year
Proceeds from disposals during
the year
R billions R billions R billions R billions R billions
Year ended 31 December 2014
Early stage funds
› Independents 4.049 0.845 0.011 0.221 0.142
› Captives (Financial Services) 0.330 0.000 0.000 0.015 0.000
› Captives (Government) 7.930 5.717 0.000 1.576 0.000
› Captives (Other) 0.150 0.039 0.000 0.020 0.000
12.459 6.601 0.011 1.832 0.142
Later stage funds
› Independents 61.921 28.801 4.811 6.182 8.536
› Captives (Financial Services) 28.918 4.726 0.323 4.384 4.032
› Captives (Government) 58.321 13.221 1.644 3.571 0.182
› Captives (Other) 9.493 1.554 0.050 1.385 1.306
158.652 48.302 6.828 15.522 14.056
171.111 54.904 6.839 17.353 14.198
Year ended 31 December 2013
Early stage funds
› Independents 6.872 3.742 0.169 0.793 0.004
› Captives (Financial Services) 0.305 0.000 0.000 0.010 0.000
› Captives (Government) 8.157 7.520 8.000 0.435 0.000
› Captives (Other) 0.150 0.059 0.000 0.037 0.000
15.483 11.321 8.169 1.275 0.004
Later stage funds
› Independents 57.543 27.096 10.398 4.185 3.112
› Captives (Financial Services) 29.965 6.648 0.535 5.211 1.999
› Captives (Government) 55.100 15.326 11.655 4.508 0.000
› Captives (Other) 11.240 1.758 0.148 2.381 4.695
153.849 50.828 22.736 16.284 9.806
169.332 62.149 30.905 17.560 9.810
60
Participants12

KPMG and SAVCA Private Equity Survey
61
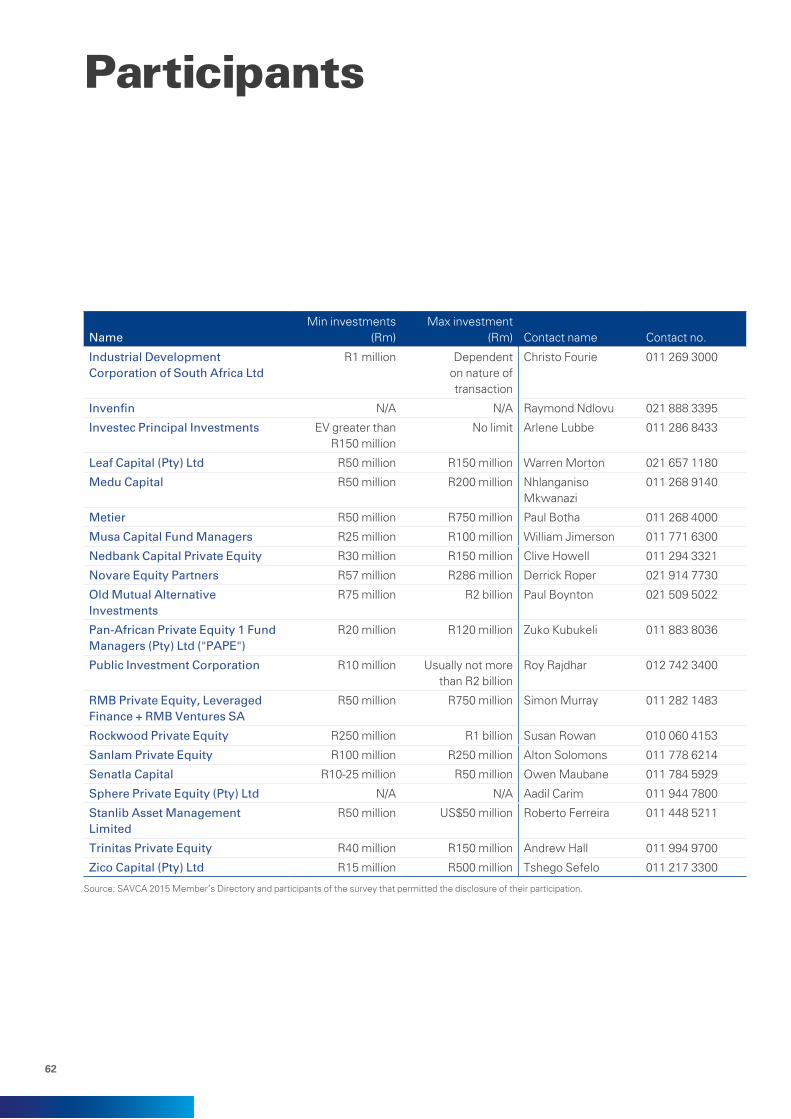
ParticipantsKPMG and SAVCA would like to thank all of the participants for their input. Without their time and effort, this survey would not be possible.
NameMin investments
(Rm)Max investment
(Rm) Contact name Contact no.
4D Innovative Capital (Pty) Ltd R 100 000 R 5 million Lungile Makhanya 021 659 2042
Abraaj Group US$10 million US$100 million Ron den Besten 011 884 2066
Acorn Equity R50 million R500 million Pierre Malan 021 852 2887
Actis US$50 million US$200 million/ US$250 million
Chantal Clark 011 778 5900
African Infrastructure Investment Managers (South Africa) (Pty) Ltd
R200 million R900 million Jurie Swart 021 670 1234
Business Partners Limited R 150 000 R30 million Nazeem Martin 011 713 6600
Capitalworks Investment Partners (Pty) Ltd
R100 million R500 million Chad Smart 011 301 3000
Collins Private Equity Holdings (Pty) Ltd
Nil R40 million Bruce Chelius 031 536 8004
Development Partners International LLP
R110 million R850 million Runa Alam 44(0)2073495030
Enablis Financial Corporation SA R 25 000 R5 million Ebenise Bester 021 462 4486
Ethos Private Equity Fund VI: R750 million
Fund VI: R3 billion and greater in
consortium
Chelsea Wilkinson 011 328 7400
62
NameMin investments
(Rm)Max investment
(Rm) Contact name Contact no.
Industrial Development Corporation of South Africa Ltd
R1 million Dependent on nature of transaction
Christo Fourie 011 269 3000
Invenfin N/A N/A Raymond Ndlovu 021 888 3395
Investec Principal Investments EV greater than R150 million
No limit Arlene Lubbe 011 286 8433
Leaf Capital (Pty) Ltd R50 million R150 million Warren Morton 021 657 1180
Medu Capital R50 million R200 million Nhlanganiso Mkwanazi
011 268 9140
Metier R50 million R750 million Paul Botha 011 268 4000
Musa Capital Fund Managers R25 million R100 million William Jimerson 011 771 6300
Nedbank Capital Private Equity R30 million R150 million Clive Howell 011 294 3321
Novare Equity Partners R57 million R286 million Derrick Roper 021 914 7730
Old Mutual Alternative Investments
R75 million R2 billion Paul Boynton 021 509 5022
Pan-African Private Equity 1 Fund Managers (Pty) Ltd ("PAPE")
R20 million R120 million Zuko Kubukeli 011 883 8036
Public Investment Corporation R10 million Usually not more than R2 billion
Roy Rajdhar 012 742 3400
RMB Private Equity, Leveraged Finance + RMB Ventures SA
R50 million R750 million Simon Murray 011 282 1483
Rockwood Private Equity R250 million R1 billion Susan Rowan 010 060 4153
Sanlam Private Equity R100 million R250 million Alton Solomons 011 778 6214
Senatla Capital R10-25 million R50 million Owen Maubane 011 784 5929
Sphere Private Equity (Pty) Ltd N/A N/A Aadil Carim 011 944 7800
Stanlib Asset Management Limited
R50 million US$50 million Roberto Ferreira 011 448 5211
Trinitas Private Equity R40 million R150 million Andrew Hall 011 994 9700
Zico Capital (Pty) Ltd R15 million R500 million Tshego Sefelo 011 217 3300
Source: SAVCA 2015 Member’s Directory and participants of the survey that permitted the disclosure of their participation.
Participants

KPMG and SAVCA Private Equity Survey
63
64
InformationSources of13
KPMG and SAVCA Private Equity Survey
65
Sources of InformationThe principal source of information for this survey was the survey questionnaire. In addition we have used the SAVCA Members’ Directory, held discussions with certain private equity industry participants, as well as sourced public information on private equity funds, including international surveys.The survey questionnaire was developed jointly by KPMG in South African and a specially constituted SAVCA sub-committee.
For clarity, the guidelines for participation in this survey are as follows:
Participants must:
› Include investments if they are made in South Africa, regardless of where they are managed from;
› Have as their principal business the management of funds (third party and / or proprietary capital) for the provision of capital (equity or quasi equity) primarily to unlisted companies;
› Employ professionals - dedicated to the management of the capital and the investments made using the capital (and capital from other providers); and
› Aim to generate returns mainly through medium to long-term returns on the sale of investments and / or social development returns.

66
Sources of Information
We note that determining the level of private equity industry activity is not an easy task. Whilst certain parties lobby for a more inclusive approach to measurement, others believe that overstating the level of local activity is a disservice to the industry as this could possibly reduce the appetite of Development Financing Institutions (DFIs) and foreign investors to commit funds to South Africa in favour of other under-funded emerging markets. The ‘purists’ also argue that this survey should only measure the activity of the independent funds, as these form the core of the professionally managed private equity industry both locally and globally. This, however, would negate the significant role played by the captive funds (Corporates, Banks and Government) in the South African private equity industry. For the purposes of presentation, and elimination if deemed necessary by specific users, we have presented data, wherever possible, split between the various types of fund managers.
Questionnaires were e-mailed to 80 (2013:101) entities that indicated that they would consider participating in the survey. 42 (2013: 59), representing 74 funds (2013: 76), completed the questionnaire. In addition, alternative sources were used to obtain information on a further 17 private equity firms, representing 17 funds, that did not complete the questionnaire. Although these alternative sources did not provide us with as much information as our questionnaire, we believe that the information is complete and understated, if anything.
In analysing the data, it is worth noting that comparative data for 2013 can be restated by participants for errors or omissions. In addition, 2013 data is also restated for the inclusion/exclusion of funds that did/did not participate in the 2014 survey.
Other empirical data has been sourced from various sources, including:
› EMPEA Industry Statistics Q4 2014 – Emerging Markets Private Equity - Fundraising & Investment Analysis; EM PE Fundraising by Region & Country – Data as of 31 December 2014
› RisCura-SAVCA South African Private Equity Performance Report – Quarter ended: 31 December 2014
› Statistics South Africa
› Other sources specifically included in the footnotes.
In compiling the information for this survey, KPMG has worked closely with a SAVCA sub-committee, to try to ensure meaningful interpretation and comment has been included in this report. The sub-committee reviews the document prior to its public release, but does not have access to any of the individually completed questionnaires submitted to KPMG or any other information not presented in this publication. Although care has been taken in the compilation of the survey results, KPMG and SAVCA do not guarantee the reliability of its sources or of the results presented. Any liability is disclaimed, including incidental or consequential damage arising from errors or omissions in this report.

KPMG and SAVCA Private Equity Survey
67
BEE Black Economic Empowerment BEE, as defined in the Financial Sector Charter, means the economic empowerment of all black people, including women, workers, youth, people with disabilities and people living in rural areas, through diverse but integrated socio-economic strategies.
The definitions used in this survey for BEE companies are stated below:
‘Black companies’ refers to companies that are more than 50% owned and are controlled by black people. Control centres on the authority and power to manage assets, the determination of policies and the direction of business operations. ‘Black people’ refers to all Africans, Coloureds and Indians who are South African citizens and includes black companies.
‘Black empowered companies’ refers to companies that are more than 25% owned by black people (but not more than 50%) and where substantial participation in control is vested in black people.
‘Black influenced companies’ refers to companies that are between 5% and 25% owned by black people and with participation in control by black people.
‘Not empowered companies’ refers to companies that are less than 5% owned by black people.
Buy-out Leveraged buy-out or buy-inReplacement capital
Captive fund Those funds making investments mainly on behalf of a parent or group, typically an insurance company, bank or institutional asset manager, often from an indeterminate pool of money.
Carried interest This represents a fee enhancement for a private equity fund manager for achieving a benchmark return or hurdle rate. The fee is often set at 20% of the value of returns achieved in excess of the benchmark return.
DBSA Development Bank of Southern Africa
Development capital
Funding for growth and expansion of a company which is breaking even or trading profitably.
DFIs Developmental Finance Institutions
Edcon Edgars Consolidated Stores Limited
EMPEA Emerging Markets Private Equity Association
EVCA European Private Equity and Venture Capital Association
Follow on investments
Investments into companies where at least one round of funding has already been made.
GDP Gross Domestic Product
GEPF Government Employment Pension Fund
Independent fund Those private equity companies, managers or funds raising and disbursing capital which has been sourced mainly from third party investors.
Glossary

68
IPO / Listing When a company’s equity is sold to investors via a listing on an exchange.
IRR Internal Rate of Return
KPMG KPMG Services (Proprietary) Limited
LBO Leveraged buy-out
Leveraged buy-out or buy-in
Funding to enable a management team or empowerment partner, either existing or new, and their backers to acquire a business from the existing owners, whether a family, conglomerate or other. Unlike venture and development capital, the proceeds of a buy-out generally go to the previous owners of the entity. Buy-outs are often leveraged.
M&A Mergers and acquisitions
MBO Management buy-out
Mezzanine debt Debt which ranks behind senior secured debt but ahead of trade credit and shareholders’ funds in terms of security. Mezzanine debt is often used in higher leveraged transactions to maximise funding availability from a company’s own balance sheet. It may provide for equity-like features such as attached share purchase warrants or participation in cash-flow.
PIC Public Investment Corporation
Replacement capital
Funding for the purchase of existing shares in a company from other shareholders, whether individuals, other venture-backers or the public through the stock market. Unlike venture and development capital, the proceeds of replacement capital transactions are generally paid to the previous owners of the entity.
SAVCA The Southern African Venture Capital and Private Equity Association
Seed capital Funding for research, evaluation and development of a concept or business before the business starts trading.
Start-up and early stage
Funding for new companies being set up or for the development of those which have been in business for a short time (one to three years).
Total funding Total funds raised by all providers of capital during a transaction. This could include the purchase consideration, funds to pay advisors fees, funds required for immediate working capital requirements, etc. This could be in the form of equity, shareholder loans, senior, mezzanine and junior debt and working capital facilities.
Trade sale Sale of business to a third party, and frequently to an acquirer within the industry of the business being sold.
UK United Kingdom
US United States of America
Venture capital Seed capital or Start-up and early stage
Glossary

69

© 2015 KPMG Services Proprietary Limited, a South African company and a member firm of the KPMG network of independent member firms affiliated with KPMG International Cooperative (“KPMG International”), a Swiss entity. All rights reserved. Printed in South Africa. KPMG and the KPMG logo are registered trademarks of KPMG International Cooperative (“KPMG International”), a Swiss entity. MC13204