kos plateau tuff (kpt) on kalymnos island, aegean volcanic arc: a geochemical approach
TRANSCRIPT

ISSN 0742�0463, Journal of Volcanology and Seismology, 2013, Vol. 7, No. 5, pp. 293–312. © Pleiades Publishing, Ltd., 2013.
293
1 1. INTRODUCTION
It has been suggested by Allen [2001] that the KosPlateau Tuff (KPT) has been erupted 161 Ka ago[Smith et al., 1996] from a superstructure now out�lined by the remains of a ~16 km caldera which ismostly submarine. Our studies using satellite imagery,subaqueous distribution of hydrothermal vents and tec�tonic data of ring and radial faults supports the evidenceof such a caldera superstructure [St. Seymour et al.,2006; Zouzias, St. Seymour, 2006] very similar to thatproposed by Allen [2001]. Kalymnos lies roughly20 km from Kos and represents the northernmost bor�der of deposition of the KPT according to physicalvolcanology arguments presented by Allen [2001]. Sheargued that pyroclastic density currents from a majoreruption, which occurred south of Kos 161 Ka ago[Smith et al., 1996], deposited tuffs on Kalymnos, Ti�los, on the coasts of Asia Minor and other islands inthe area. The apron of this ash has travelled, due to thepredominant trade winds in the Aegean Sea, 300 km tothe south and is thought to be equivalent with the W�3submarine tephra layer [Federman, Carey, 1980; Vin�ci, 1985]. Pyroclastic density currents from the 161 kaKos eruption traveled either on land [Pe�Piper et al.,2005] or crossed open sea [Allen, 2001; Allen, Cas,
1 The article is published in the original.
2001; Bohla, Keller, 1987; Stadlbauer et al., 1986].This paper presents the geochemical arguments for theconsanguineous relationship of the KPT and Kalym�nos pumices based on major, trace and Rare Earth ele�ment and mineral chemistry new data obtained fromthese tuffs. The geochemical arguments presentedhere entirely support conclusions derived from physi�cal volcanology observations by Allen [2001, 1998],Allen and Cas [2001, 1998] and Allen et al. [1999].
2. ANALYTICAL METHODS
Mineral chemistry was analyzed at McGill Univer�sity, Montreal, using a JXA JOEL 8900L instrumentequipped with wavelength�dispersive spectrometers(WDS). Electron microprobe work on petrographicpolished thin sections was performed at an acceleratorvoltage of 15 kV, a beam current of 20 nA and a beamdiameter of 5 microns. On line ZAF corrections wereperformed utilizing CAMECA software. For glassanalyses a highly defocused beam (20 μm) and a beamcurrent of 15 nA was used to prevent devolatilization ofalkalies from the glass [St. Seymour et al., 2004]. Nat�ural and synthetic feldspar, diopside, rutile, chromite,hematite, spessartine, fluorite, vanadinite, obsidianand basaltic glass were used as standards. For the feld�spars, the detection limits are: 0.03 wt % for Si, 0.05 wt %
Kos Plateau Tuff (KPT) on Kalymnos Island, Aegean Volcanic Arc: A Geochemical Approach1
Dimitrios Zouziasa and Karen St. Seymoura, b
a Laboratory of Ore Deposits and Volcanology, Department of Geology, University of Patras, Rion 26500 Hellas (GR)b Department of Geography, Urban Planning�and Environment, Concordia University, Montreal Canada HSG1M8
e�mail: [email protected]; [email protected]; [email protected] July 06, 2010
Abstract—Thirteen pumice samples from the D and E ignimbrite units of Kalymnos Tuff have been analyzedfor their biotite and feldspar phenocryst mineral chemistry and for bulk major and 20 trace, including 14 RareEarth elements, to define and compare their petrochemistry with the Kos Plateau Tuff (KPT). For the samepurpose major element analyses were obtained from Kalymnos Tuff and KPT glasses. Both KPT and Kalym�nos pumice lapilli are rhyolites characterized by a well�developed ‘silky’ texture and roundish quartz. Phe�nocrysts of biotite and feldspars (sanidine, oligoclase) from both tuffs display compositional overlap. Crystalsare charac�terized by undulatory extinction (quartz), fractures (sanidine, oligoclase) and bent cleavages(biotite) due to the explosive origin of their host. Both tuffs show well�defined petrogenetic trends and exten�sive compositional overlaps on major and trace element variation diagrams suggesting that they are consan�guineous. However, D ignimbrite samples are more evolved than those obtained from E ignimbrite as indi�cated from major elements, alkali earths (Ba, Rb, Sr), immobile (Zr, Y), compatible (V) and hygromagmato�phile trace element (Th) distributions. This evidence indicates a stratified magma chamber under a ~16 Kmcaldera superstructure which is mostly submarine.
DOI: 10.1134/S0742046313050047

294
JOURNAL OF VOLCANOLOGY AND SEISMOLOGY Vol. 7 No. 5 2013
ZOUZIAS, SEYMOUR
for Ti, 0.02 wt % for Al, 0.04 wt % for Fe, 0.02 wt % forMg, 0.03 wt % for Ca, 0.07 wt % for Ba, 0.03 wt % forK and for Na 0.03 wt %. For ferromagnesian mineralsthe detection limits are: 0.03 wt % for Si, 0.06 wt % forTi, 0.03 wt % for Al, 0.05 wt % for Fe, 0.05 wt % forMn, 0.02 wt % for Mg, 0.04 wt % for Ca, 0.03 wt % forNa, 0.02 wt % for K, 0.17 wt % for F and 0.02 wt % forCl. For the glasses, spessartine, vanadinite, apatite,obsidian and basaltic glass were used as standards andthe detection limits are: 0.04 wt % for Si, 0.06 wt % forTi, 0.03 wt % for Al, 0.06 wt % for Fe, 0.05 wt % forMn, 0.03 wt % for Mg, 0.04 wt % for Ca, 0.05 wt % forNa, 0.03 wt % for K and 0.01 wt % for Cl.
Thirteen bulk samples from the D and E ignimbriteunits as defined by Allen [2001], from Kalymnos(samples KL�1 to KL�17) have been analyzed for ma�jor, trace and Rare Earth elements in the Actlabs labo�ratory of Ontario Canada and the analytical results arepresented in Table 1. Major elements have been ana�lyzed by ICP methods under analytical code WRA +trace 4Litho. Accuracy is at the 0.001 wt % level forTiO2 and MnO and 0.01 % for the rest of the major ele�ments. Trace elements and REE have been analyzedby ICP/MS methods. Detection limits are 0.05 ppmfor Pr, Eu, Tm and 0.04 ppm for Lu and 0.1 ppm forthe rest of the REE. Detection limits for Sc, Be, Co,Ga, Ge, Nb, Sb, Cs, Hf, Ta, Tl, Bi, Th, U and W are1 ppm or better. For Sr, Y and Rb are 2 ppm, for Ba andZr are 3 ppm and 4 ppm respectively, for V and Pb are5 ppm and for Zn are 30 ppm. Probe mineral analysesare presented in Tables 2 and 3 and glass analyses inTable 4.
3. SAMPLING
3.1. Geological Setting and Location of Samples
The studied samples represent part of a record ofvolcanic activity in a key area that comprises Miocenehigh�K volcanic products deposited in easterly trend�ing grabens [Ulusoy et al., 2004] which continue intothe Aegean Sea [Kurt et al., 1999; Doutsos, Kokkalas,2001; Bozkurt, 2003] and subduction�related calc�al�kaline volcanic rocks of the presently active Quaterna�ry Hellenic Volcanic Arc. Subduction�related centersin the area (Fig. 1, inset) have been particularly explo�sive and because the depositional setting has beenmostly marine the primary pyroclastic subaerial prod�ucts from the eruptions are often limited [Allen et al.,1999]. Caldera structures are at the best interpretedfrom volcanological data [Allen et al., 1999; Dala�bakis, Vougioukalakis, 1993], from remotely sensed (sat�ellite) images and structural data [St. Seymour et al.,2006; Zouzias, St. Seymour, 2006]. Of these, the161000 yrs B.P. Kos Plateau Tuff eruption gave the mostvoluminous pyroclastic products with a minimum esti�
mated volume ~60 km3 D.R.E of which ~9 km3 waserupted during the emplacement of earlier KPT unitsA, B and C [Allen, Cas, 1998; Allen et al., 1999]. Dis�tal submarine fall layers (W�3 ash) were deposited at adistance up to 300 km south of Kos [Federman, Carey,1980; Vinci, 1985]. The intensity of this explosion isdepicted by the occurrence of quite unusual platy�shaped pumice clasts in pyroclastic fall and densitycurrent deposits due to a shear mechanism in the mag�ma conduit [Palladino et al., 2008].
In Kalymnos the pumice is the youngest alloctho�nous unit. Pumice samples were collected from twonorthwesterly trending fault–related valleys, these ofHorion and Vathy grabens (Fig. 1, Table 5). Pumiceexposure in the Horion graben is limited due to humansettlement. The Horion valley is underlain by aNeopaleozoic basement which consists of limestoneand schist�sandstone with lenses of mafic metavolca�nic rock. Triassic to Upper Jurassic limestone, dolo�mitic limestone and dolomite lie transgressively onUpper Paleozoic formations. These are overlain bymassive to thick�bedded crystalline Lower Cretaceouslimestone (Fig. 1).
On western Kos, the KPT overlies the Kefalos tuffring deposits (3.4–2.7 Ma) and Tnassic Lower Creta�ceous limestone [Dalabakis, Vougioukalakis, 1993].Allen [1998] and Allen et al. [1999] subdivided theKPT into six mappable, texturally distinct, strati�graphic units from oldest to youngest A, B, C, D, Eand F. Units A and the upper part of F are mainly fall�out deposits and the rest have resulted from pyroclasticdensity current deposition such as the D and E hori�zons which comprise mappable ignimbrite subunits[Stadlbauer et al., 1986; Allen et al., 1999; Allen,1998]. Our samples represent the most pristine possi�ble pumice lapilli� and bomb�size samples obtainedfrom units D and E both on Kos and Kalymnos.
4. RESULTS
4.1. Petrography
A phenocryst assemblage of plagioclase–biotite–quartz and less abudant K�feldspar embedded inhighly vesiculated clear glass characterizes the Kalym�nos and KPT tuffs. Accessory minerals include mona�zite, zircon, apatite, ilmenite and magnetite. Rare cli�nopyroxene and amphibole crystals showing signs ofresorption are locally present in these tuffs and have aprobable xenocrystic origin from the deeper levels ofthe volcanic reservoir. All phenocrysts display texturesof fracturing to various degrees, attributed to theexplosive origin of their host.
Biotite crystals, euhedral to subhedral, are on theaverage approximately at 400 μm × 250 μm long anddisplay fracturing, bent cleavages and undulatory ex�tinction. Often biotites come apart or are being re�placed either by chlorite along cleavage planes or by

JOURNAL OF VOLCANOLOGY AND SEISMOLOGY Vol. 7 No. 5 2013
KOS PLATEAU TUFF (KPT) ON KALYMNOS ISLAND 295
Table 1. Geochemistry of Kalymnos pumice: Major element contents in wt % and trace element and REE’s in ppm
KL1 KL2 KL3 KL4 KL6 KL7 KL8 KL9 KL10 KL14 KL15 KL16 KL17
SiO2 % 71.91 73.3 73.06 72.55 70.86 72.41 73.58 73.26 72.25 70.97 69.75 70.94 71.04
TiO2 % 0.18 0.191 0.172 0.184 0.188 0.201 0.184 0.187 0.18 0.18 0.18 0.18 0.17
Al2O3 % 13.08 12.6 13.13 13.5 12.82 13.1 12.62 13.28 12.96 13.23 14.19 12.52 13.34
Fe2O3(T)% 1.36 1.44 1.45 1.47 1.51 1.5 1.86 1.91 1.39 1.6 2.31 1.34 1.47
MnO % 0.057 0.063 0.053 0.06 0.063 0.059 0.062 0.062 0.06 0.06 0.06 0.06 0.06
MgO % 0.37 0.35 0.34 0.33 0.43 0.4 0.36 0.36 0.35 0.4 0.36 0.35 0.3
CaO % 1.28 1.14 1.33 1.4 1.43 1.31 1.31 1.19 1.55 1.2 1.53 2.09 1.56
Na2O % 3.72 3.17 3.67 3.56 3.58 3.6 3.41 3.63 3.67 3.52 4.3 3.44 3.65
K2O % 4.34 4.74 4.42 4.64 4.54 4.39 4.21 4.48 4.07 4.86 4.23 3.95 4.29
P2O5 % 0.06 0.05 0.04 0.05 0.05 0.05 0.06 0.06 0.05 0.05 0.05 0.05 0.05
LOI % 2.3 1.87 1.42 1.81 3.12 2.14 1.45 1.4 2.88 2.7 1.97 3.75 2.67
Total % 98.65 98.92 99.09 99.56 98.6 99.15 99.09 99.81 99.41 98.77 98.94 98.68 98.61
Sc ppm 3 2 3 2 2 3 2 3 2 3 3 3 2
Be ppm 2 2 1 2 2 1 2 2 2 1 1 2 2
V ppm 12 10 10 13 14 14 13 15 13 13 12 10 15
Ba ppm 557 574 914 542 598 609 628 1370 623 1181 996 496 684
Sr ppm 139 117 151 149 140 140 141 146 151 140 179 116 152
Y ppm 14 11 12 11 11 13 12 11 12 11 12 11 11
Zr ppm 78 85 87 92 83 97 91 95 90 84 85 85 85
Co ppm 1 1 1 1 2 1 2 2 1 1 1 n.d. 1
Ga ppm 13 13 13 14 14 13 13 12 12 13 14 12 12
Ge ppm 1 1 1 1 1 1 1 1 1 1 1 1 1
Rb ppm 110 112 104 108 113 108 106 111 100 112 102 119 108
Nb ppm 15 15 15 15 15 15 15 15 14 15 15 39 15
Cs ppm 4 4.1 4 3.9 4.2 3.8 3.8 4 3.7 4 3.5 4.2 3.9
Hf ppm 2.3 2.5 2.4 2.7 2.6 2.9 2.7 2.6 2.6 2.6 2.5 2.4 2.6
Ta ppm 1.7 1.8 1.6 1.8 1.8 1.8 1.7 1.7 1.6 1.8 1.6 11.5 1.8
W ppm 1 n.d. 3 n.d. n.d. 2 n.d. 4 1 3 3 2 2
Tl ppm 1.2 0.4 0.5 0.5 0.8 0.7 0.8 0.8 0.4 0.4 0.8 0.5 0.4
Pb ppm n.d. 10 13 9 11 10 11 10 9 10 9 9 10
Th ppm 13.7 16.1 13.1 15.9 16.8 14 15.3 14 13.8 14.5 13.7 15.9 15.3
U ppm 4.2 4.6 3.8 4.5 4.4 4.1 4.4 4.2 3.9 4.1 3.9 4.4 4.1
La ppm 30.3 30.4 31.3 31.1 34.8 31.6 30 29.6 29.7 34.3 33.7 33.1 33.5
Ce ppm 47.4 47.6 48 49.3 54.2 49 47.3 46.8 46.5 53.2 51.8 51.5 52.4
Pr ppm 4.22 4.26 4.25 4.35 4.81 4.32 4.25 4.11 4.05 4.62 4.54 4.52 4.5
Nd ppm 13 13.1 13.1 13.4 14.9 13.4 13.2 12.7 12.7 13.9 13.9 13.8 13.8
Sm ppm 2 2 2 2.1 2.3 2.1 2 2 2 2.1 2.1 2.2 2.1
Eu ppm 0.38 0.34 0.37 0.42 0.38 0.4 0.41 0.44 0.41 0.4 0.48 0.36 0.44
Gd ppm 1.6 1.7 1.5 1.7 1.7 1.7 1.8 1.7 1.7 1.6 1.7 1.8 1.7
Tb ppm 0.3 0.3 0.3 0.3 0.3 0.3 0.3 0.3 0.3 0.3 0.3 0.3 0.3
Dy ppm 2 2 1.8 1.9 2 2 2.1 1.9 1.8 1.9 2 2 1.9
Ho ppm 0.4 0.4 0.4 0.4 0.4 0.4 0.4 0.4 0.4 0.4 0.4 0.4 0.4
Er ppm 1.3 1.4 1.2 1.3 1.3 1.4 1.4 1.3 1.3 1.3 1.3 1.3 1.3
Tm ppm 0.22 0.23 0.2 0.22 0.22 0.23 0.23 0.21 0.21 0.21 0.21 0.22 0.21
Yb ppm 1.5 1.5 1.4 1.6 1.5 1.7 1.6 1.5 1.4 1.5 1.5 1.6 1.4
Lu ppm 0.26 0.24 0.22 0.24 0.25 0.27 0.25 0.26 0.23 0.24 0.24 0.25 0.24

296
JOURNAL OF VOLCANOLOGY AND SEISMOLOGY Vol. 7 No. 5 2013
ZOUZIAS, SEYMOUR
Table 2. Representative electron microprobe microanalyses of ferromagnesian crystals from Kalymnos and KPT pumices(major elements in wt %)
Sample
KL1�C1�1
KL1�C1�3
KL1�C1�5
KL1�C4�1
KL1�C4�2
KL1�CX�1
KL1�CX�2
KL1�CX�3
KPT1�C3�1
KPT1�C3�3
KPT1�C3�4
KPT1�C7�1
KPT1�C7�2
core mantle rim core rim core mantle rim core mantle rim core rim
SiO2 36.5 36.7 36.78 38.39 39.09 36.01 36.33 36.7 36.34 36.6 36.81 39.09 39.07TiO2 4.29 4.3 4.29 4.03 3.95 4.4 4.17 4.11 3.96 4.19 4.36 3.79 3.99Al2O3 13.82 13.93 13.77 13.45 13.23 13.82 13.82 13.95 13.61 14.02 13.91 13.2 13.16FeO 17.22 17.2 17.33 15.88 15.6 17.74 16.96 17.48 17.21 17.39 17.61 16.28 16.26MnO 0.49 0.49 0.5 0.41 0.39 0.51 0.46 0.52 0.46 0.52 0.53 0.45 0.38MgO 13.14 13.04 12.96 12.24 12.15 12.78 12.91 12.72 12.55 12.97 12.95 11.8 11.97CaO 0 0.02 0.04 0.07 0.1 0 0.1 0 0.26 0.04 0.02 0.25 0.25BaO 0.49 0.64 0.67 0.07 0.05 0.66 0.26 0.33 0.28 0.33 0.76 0.07 0.06Na2O 0.44 0.42 0.43 0.1 0.1 0.41 0.36 0.43 0.33 0.41 0.4 0.19 0.25K2O 9.06 9.32 9.15 9.17 9.16 9.41 9.33 9.59 8.94 9.13 9.05 9.05 9.34F 0.28 0.24 0.28 0.19 0.18 0.32 0.27 0.27 0.2 0.22 0.37 0.29 0.16Cl 0.13 0.13 0.12 0.12 0.13 0.13 0.11 0.1 0.13 0.11 0.11 0.12 0.1
Total 95.86 96.43 96.32 94.12 94.13 96.19 95.08 96.2 94.27 95.93 96.88 94.58 94.99
Number of ions on the basis of 22 atoms of oxygens
Si 5.55 5.55 5.57 5.84 5.93 5.50 5.56 5.57 5.61 5.55 5.55 5.93 5.90AlIV 2.45 2.45 2.43 2.16 2.08 2.49 2.44 2.43 2.39 2.45 2.45 2.07 2.10
8.00 8.00 8.00 8.00 8.01 7.99 8.00 8.00 8.00 8.00 8.00 8.00 8.00
AlVI 0.03 0.04 0.03 0.25 0.29 0 0.05 0.07 0.08 0.06 0.03 0.29 0.24Ti 0.49 0.49 0.49 0.46 0.45 0.5 0.48 0.47 0.46 0.48 0.5 0.43 0.45Fe2 2.20 2.18 2.20 2.02 1.98 2.27 2.17 2.22 2.22 2.21 2.22 2.07 2.05Mn 0.06 0.06 0.07 0.05 0.05 0.07 0.06 0.07 0.06 0.07 0.07 0.06 0.05Mg 2.98 2.94 2.93 2.78 2.75 2.91 2.95 2.88 2.89 2.93 2.92 2.67 2.70
5.76 5.71 5.72 5.56 5.52 5.75 5.71 5.71 5.71 5.75 5.74 5.52 5.49
Ba 0.03 0.04 0 0 0 0.04 0.02 0.02 0.02 0.02 0.05 0 0Ca 0 0 0.01 0.01 0.02 0 0.02 0 0.04 0.01 0 0.04 0.04Na 0.13 0.12 0.13 0.03 0.03 0.12 0.11 0.13 0.1 0.12 0.12 0.06 0.07K 1.76 1.80 1.77 1.78 1.77 1.83 1.82 1.86 1.76 1.77 1.74 1.75 1.80
1.92 1.96 1.91 1.82 1.82 1.99 1.97 2.01 1.92 1.92 1.91 1.85 1.91
a) Microanalyses of biotite crystals.
Sample
KPT1�C5�1
KPT1�C5�3
KPT1�C5�4
KPT1�C5�c2�1
KPT1�C5�c2�3
KPT1�C5�c2�4
KPT1�C7�3
KPT1�C7�c2�1
KPT1�C7�c2�2
core mantle rim core mantle rim core core rim
SiO2 36.52 36.92 36.82 36.04 37.03 36.45 36.19 39.11 39.17TiO2 4.11 4.21 4.2 4.21 4.19 4.27 4.28 3.94 4.02Al2O3 13.69 13.93 13.86 13.64 13.26 13.66 13.49 13.29 12.94FeO 17.01 17.4 17.1 17.56 17.45 17.21 17.54 16.78 16.36MnO 0.5 0.47 0.5 0.49 0.41 0.44 0.48 0.38 0.4MgO 12.65 12.6 12.66 12.59 12.05 12.74 12.29 11.58 11.75CaO 0.08 0.08 0.08 0.06 0.19 0.12 0.04 0.23 0.24BaO 0.21 0.27 0.3 0.69 0.29 0.64 0.47 0.02 0.09Na2O 0.37 0.41 0.37 0.4 0.39 0.38 0.36 0.13 0.18K2O 8.97 8.95 9.06 8.7 8.76 8.76 9.02 9.19 9.08F 0.13 0.23 0.18 0.23 0.12 0.35 0.21 0.1 0.24Cl 0.11 0.12 0.12 0.11 0.11 0.12 0.1 0.1 0.1Total 94.35 95.59 95.25 94.72 94.25 95.14 94.47 94.85 94.57

JOURNAL OF VOLCANOLOGY AND SEISMOLOGY Vol. 7 No. 5 2013
KOS PLATEAU TUFF (KPT) ON KALYMNOS ISLAND 297
Table 2. (Contd.)
Sample
KPT1�C5�1
KPT1�C5�3
KPT1�C5�4
KPT1�C5�c2�1
KPT1�C5�c2�3
KPT1�C5�c2�4
KPT1�C7�3
KPT1�C7�c2�1
KPT1�C7�c2�2
core mantle rim core mantle rim core core rim
Number of ions on the basis of 22 atoms of oxygens
Si 5.61 5.61 5.61 5.56 5.70 5.59 5.59 5.91 5.94AlIV 2.39 2.39 2.39 2.44 2.30 2.41 2.41 2.09 2.06
8.00 8.00 8.00 8.00 8.00 8.00 8.00 8.00 8.00
AlVI 0.09 0.1 0.1 0.03 0.1 0.05 0.05 0.28 0.25Ti 0.48 0.48 0.48 0.49 0.49 0.49 0.5 0.45 0.46Fe2 2.19 2.21 2.18 2.26 2.25 2.21 2.27 2.12 2.08Mn 0.07 0.06 0.06 0.06 0.05 0.06 0.06 0.05 0.05Mg 2.90 2.85 2.88 2.90 2.76 2.91 2.83 2.61 2.66
5.73 5.70 5.70 5.74 5.65 5.72 5.71 5.51 5.50
Ba 0.01 0.02 0.02 0.04 0.02 0.03 0.03 0 0.01Ca 0.01 0.01 0.01 0.01 0.03 0.02 0.01 0.04 0.04Na 0.11 0.12 0.11 0.12 0.12 0.11 0.11 0.04 0.05K 1.76 1.73 1.76 1.71 1.72 1.71 1.78 1.77 1.76
1.89 1.88 1.90 1.88 1.89 1.87 1.93 1.85 1.86
b) Microanalyses of biotite crystals.
SampleKPT2�C10�1
KPT2�C10�2
KPT2�C11�1
KPT2�C2�1
KPT2�C4�1
KPT2�C4�2
KPT2�C4�3
KPT2�C4�4b
KPT2�C5�1
KPT2�C5�1b
KPT2�C5�2
core rim core core core mantle rim core core core rim
SiO2 36.76 36.86 36.4 37.11 36.18 36.1 36.49 36.13 36.04 36.5 36.04TiO2 4.29 4.2 4.17 4.33 4.31 4.28 4.14 4.16 4.29 4.33 4.4Al2O3 13.87 13.61 13.87 13.95 13.85 13.85 13.65 13.93 13.58 13.76 13.53FeO 17.71 17.28 17.71 17.49 18.05 17.89 17 17.55 17.81 17.83 17.75MnO 0.49 0.5 0.53 0.48 0.5 0.48 0.45 0.5 0.48 0.54 0.47MgO 13.33 13.43 13.09 12.62 12.92 12.84 12.93 12.55 12.63 13.07 12.64CaO 0.01 0.03 0.1 0.13 0.04 0.03 0.12 0.12 0.12 0.08 0.18BaO 0.66 0.49 0.29 0.72 0.72 0.42 0.28 0.55 0.64 0.4 0.71Na2O 0.41 0.42 0.41 0.35 0.43 0.39 0.35 0.38 0.37 0.39 0.36K2O 9.21 9.27 9.14 8.29 9.14 9.25 8.76 8.7 8.51 9.41 8.06F 0.29 0.35 0.33 0.33 0.19 0.3 0.27 0.33 0.27 0.32 0.24Cl 0.13 0.1 0.11 0.13 0.11 0.11 0.11 0.11 0.11 0.11 0.09
Total 97.16 96.54 96.15 95.93 96.44 95.94 94.55 95.01 94.85 96.74 94.47
Number of ions on the basis of 22 atoms of oxygens
Si 5.53 5.57 5.53 5.62 5.50 5.51 5.60 5.55 5.55 5.53 5.56AlIV 2.46 2.42 2.47 2.38 2.48 2.49 2.40 2.45 2.45 2.47 2.44
7.99 7.99 8.00 8.00 7.98 8.00 8.00 8.00 8.00 8.00 8.00
AlVI 0 0 0.01 0.11 0 0 0.07 0.07 0.01 0 0.01Ti 0.48 0.48 0.48 0.49 0.49 0.49 0.48 0.48 0.5 0.49 0.51Fe2 2.23 2.18 2.25 2.22 2.30 2.28 2.18 2.26 2.30 2.26 2.29Mn 0.06 0.06 0.07 0.06 0.07 0.06 0.06 0.07 0.06 0.07 0.06Mg 2.99 3.03 2.96 2.85 2.93 2.92 2.96 2.87 2.90 2.95 2.91
5.76 5.75 5.77 5.73 5.79 5.75 5.75 5.75 5.77 5.77 5.78
Ba 0.04 0.03 0.02 0.04 0.04 0.03 0.02 0.03 0.04 0.03 0.04Ca 0 0.01 0.02 0.02 0.01 0.01 0.02 0.02 0.02 0.01 0Na 0.12 0.12 0.12 0.1 0.13 0.12 0.1 0.11 0.11 0.12 0.11K 1.77 1.79 1.77 1.60 1.77 1.80 1.72 1.71 17 1.82 1.59
1.93 1.95 1.93 1.76 1.95 1.96 1.86 1.87 1.84 1.98 1.74c) Microanalyses of biotite crystals.

298
JOURNAL OF VOLCANOLOGY AND SEISMOLOGY Vol. 7 No. 5 2013
ZOUZIAS, SEYMOUR
green pristine biotite insinuating fO2 increase. Inclusionsof Fe�Ti oxides and monazite are common (Fig. 2a, 2b).
Plagioclases are subhedral up to 1.5 mm large oftenfractured and glomeroporphyritic phenocrysts withresorbed cores and complex zoning, signs of magmamixing and/or decompression [Stamatelopoulou�Seymour et al., 1990]. Monazite and apatite inclusionsare common in the plagioclase phenocrysts (Fig. 2c).
K�feldspars are less common, subhedral to round�ed phenocrysts, i.e. displaying signs of resorption.They are occasionally fractured and display undulato�ry extinction due to the explosive character of thetuffs (Fig. 2d).
Quartz forms also rounded phenocrysts up to 1.5 mmin size.
Rare pyroxene (KPT) and pyroxene – amphibolecrystals (KPT) display signs of incipient resorption.
4.2 Mineral chemistry
Biotite represents the predominant ferromagnesianmineral with prismatic crystals 400 μm × 250 μm insize. Green pleochroic biotite replaces brown biotiteinsinuating fO2 increase. The biotite laths are oftenbent and display undulatory extinction due to theeruptive origin of the tuffs. Recalculation of the atomswas based on 22 atoms of oxygen (Ο), due to lack ofH2Ο measurements. Representative analyses of the bi�
Table 2. (Contd.)
KPT1�C8�1 KPT1�C8�1b KPT2�C9�1 KPT1�C8�1
core rim core
SiO2 51.97 51.62 51.4 SiO2 43.42TiO2 0.45 0.6 0.31 TiO2 1.09Al2O3 2.57 2.39 2.61 Al2O3 12.53FeO 5.77 7.55 4.93 FeO 5.61MnO 0.14 0.25 0.09 MnO 0.12MgO 17.76 17.04 16.72 MgO 10.96CaO 20.41 19.69 22.37 CaO 24.86Na2O 0.21 0.22 0.33 BaO 0.042K2O 0.02 0.042 0.013 Na2O 0.1Total 99.3 99.4 98.8 K2O 0.02
Number of ions on the basis of 6 oxygens F 0.06
Si 1.91 1.91 1.90 Cl 0.01
Al 0.09 0.1 0.1 Total 98.82.00 2.01 2.00 Number of ions on the basis of 23 oxygens
Al 0.02 0.01 0.01 Si 6.57Ti 0.01 0.02 0.01 Al 1.43Fe3 0.07 0.07 0.1 8.00Mg 1 0.94 0.92 Al 0.81Fe2 0.11 0.16 0.05 Fe3 0.33Mn 0 0.01 0 Ti 0.12Ca 0.8 0.78 0.88 Mg 2.47Na 0.02 0.02 0.02 Fe2 0.38K 0 0 0 Mn 0.02
2.03 2.01 1.99 Ca 0.87
WO 41.04 39.79 45.14 5.00EN 49.69 47.91 46.95 Ca 1.16FS 9.28 12.30 7.91 Na 0.03
K 0
1.19
d) Microanalyses of pyroxene xenocrysts.e) Microanalyse of amphibole xenocryst.

JOURNAL OF VOLCANOLOGY AND SEISMOLOGY Vol. 7 No. 5 2013
KOS PLATEAU TUFF (KPT) ON KALYMNOS ISLAND 299
Table 3. Representative electron microprobe microanalyses of feldspars from Kalymnos and KPT (major elements in wt%)
Sample
KL1�C11�1
KL1�C11�3
KL1�C11�5
KL1�C12�1
KL1�C12�2
KL1�C12�3
KL1�C13�1
KL1�C13�3
KL1�C13�5
KL1�C4�1
KL1�C5�1
core mantle rim core mantle rim core mantle rim core core
SiO2 64.12 64.36 64.37 65.78 64.55 64.44 64.21 65.73 63.99 64.23 64.03
Al2O3 19.01 18.91 18.99 18.58 18.89 18.91 19.03 18.5 19.2 19.05 18.97
FeO 0.05 0.07 0.08 0.07 0.08 0.07 0.1 0.08 0.07 0.1 0.06
BaO 1.69 1.55 1.51 0.11 1.57 1.61 1.79 0.06 2.26 1.82 1.99
CaO 0.17 0.137 0.11 0.18 0.16 0.14 0.16 0.16 0.14 0.15 0.15
Na2O 3.16 3.2 3.16 3.34 3.23 3.2 3.22 3.25 3.18 3.22 3.36
K2O 11.39 11.42 11.48 11.83 11.36 11.42 11.31 11.97 11.1 11.32 11.08
Total 99.59 99.647 99.7 99.89 99.84 99.79 99.82 99.75 99.94 99.89 99.64
Number of ions on the basis of 32 atoms of oxygens
Si 11.86 11.88 11.87 12.00 11.89 11.88 11.85 12.00 11.82 11.85 11.85
Al 4.14 4.11 4.13 3.99 4.10 4.11 4.14 3.98 4.18 4.14 4.13
Fe2 0.01 0.01 0.01 0.01 0.01 0.01 0.02 0.01 0.01 0.02 0.01
Ba 0.12 0.11 0.11 0.01 0.11 0.12 0.13 0 0.16 0.13 0.14
Ca 0.03 0.03 0.02 0.03 0.03 0.03 0.03 0.03 0.03 0.03 0.03
Na 1.13 1.15 1.13 1.18 1.15 1.14 1.15 1.15 1.14 1.15 1.21
K 2.69 2.69 2.70 2.75 2.67 2.69 2.66 2.79 2.62 2.66 2.62
Ab 29.4 29.7 29.3 29.8 29.9 29.7 30 29 30.1 30 31.3
An 0.9 0.7 0.5 0.9 0.8 0.7 0.8 0.8 0.7 0.8 0.8
Or 69.7 69.6 70.1 69.4 69.3 69.6 69.2 70.2 69.2 69.3 67.9
a) Microanalyses of alkali feldspars.
Sample
KL1�C3A�1
KL1�C3A�6
KL1�C3A�3
KL1�C3A�8
KL1�C3A�5
KL1�C3A�10
KPT1�C3A�1
KPT1�C3A�10
KPT1�C3A�3
KPT1�C3A�5
KPT1�C3A�9
core core mantle mantle rim rim rim rim mantle core mantle
SiO2 65.56 65.35 64.36 64.61 64.42 64.43 64.48 64.54 64.17 64.5 64.34
Al2O3 18.55 18.68 19.06 18.99 18.81 19.02 18.82 19.07 18.99 18.92 18.9
FeO 0.08 0.07 0.09 0.08 0.07 0.12 0.05 0.09 0.09 0.07 0.09
BaO 0.3 0.16 1.66 1.52 1.62 1.49 1.48 1.38 1.8 1.68 1.76
CaO 0.12 0.12 0.17 0.16 0.12 0.16 0.12 0.14 0.14 0.12 0.14
Na2O 3.32 3.32 3.09 3.25 3.2 3.36 3.18 3.23 3.15 3.14 3.21
K2O 11.81 11.88 11.46 11.5 11.41 11.52 11.49 11.5 11.45 11.58 11.36
Total 99.74 99.58 99.89 100.11 99.65 100.1 99.62 99.95 99.79 100.01 99.8
Number of ions on the basis of 32 atoms of oxygens
Si 11.99 11.97 11.86 11.87 11.90 11.85 11.90 11.87 11.86 11.88 11.88
Al 4.00 4.03 4.14 4.11 4.09 4.12 4.09 4.13 4.13 4.10 4.11
Fe2 0.01 0.01 0.01 0.01 0.01 0.02 0.01 0.01 0.01 0.01 0.01
Ba 0.02 0.01 0.1 0.11 0.12 0.11 0.11 0.1 0.13 0.12 0.13
Ca 0.02 0.02 0.03 0.03 0.03 0.03 0.03 0.03 0.03 0.02 0.03
Na 1.18 1.18 1.10 1.16 1.15 2.00 1.14 1.15 1.13 1.12 1.15
K 2.76 2.76 2.69 2.70 2.69 2.70 2.70 2.70 2.70 2.72 2.68
Ab 29.8 29.6 28.8 29.8 29.7 30.5 29.4 29.7 29.3 29 29.8
An 0.6 0.6 0.9 0.8 0.6 0.8 0.6 0.7 0.7 0.6 0.7
Or 69.6 69.8 70.3 69.4 69.7 68.7 69.9 69.6 70 70.4 69.5
b) Microanalyses of alkali feldspars.

300
JOURNAL OF VOLCANOLOGY AND SEISMOLOGY Vol. 7 No. 5 2013
ZOUZIAS, SEYMOUR
Table 3. (Contd.)
Sam�ple
KPT2�C8�a
KPT2�C9�1
KPT2�C9�2
KPT2�C9�3
KL1�C11�1
KL1�C11�2
KL1�C3�1
KL1�C3�3
KL1�C3�4
KL1�C3�a1
KL1�C3�a6
KL1�C3�a3
KL1�C3�a8
KL1�C3�a5
KL1�C3�a10
core core mantle rim core rim core mantle rim core core mantle mantle rim rim
SiO2 64.15 63.92 64.67 64.42 62.74 62.76 63.24 63.3 63.27 61.94 62.55 62.64 62.68 61.93 62.87
Al2O3 19.09 18.67 18.75 18.78 22.98 22.88 22.84 22.78 22.66 23.51 23.05 22.99 23.08 23.5 22.84
FeO 0.1 0.06 0.03 0.04 0.14 0.15 0.14 0.15 0.11 0.21 0.14 0.15 0.17 0.15 0.14
BaO 1.68 0.95 0.91 0.85 0.09 0.1 0.09 0.05 0.08 0.09 0.09 0.02 0.06 0.11 0.04
CaO 0.16 0.05 0.05 0.04 4.34 4.26 4.52 4.57 4.21 5.06 4.54 4.45 4.62 4.93 4.4
Na2O 3.3 1.16 1.56 1.08 8.48 8.57 8.47 8.42 8.67 8.23 8.44 8.39 8.38 8.28 8.48
K2O 11.21 14.69 14.27 14.88 0.86 0.86 1.16 1.17 1.21 0.72 0.85 0.89 0.82 0.77 0.89
Total 99.69 99.5 100.24 100.09 99.63 99.58 100.46 100.44 100.21 99.76 99.66 99.53 99.81 99.67 99.66
Number of ions on the basis of 32 atoms of oxygens
Si 11.85 11.90 11.94 11.92 11.17 11.19 11.19 11.20 11.22 11.04 11.15 11.17 11.15 11.05 11.19
Al 4.15 4.10 4.07 4.10 4.82 4.80 4.76 4.75 4.73 4.94 4.84 4.83 4.83 4.94 4.79
Fe2 0.2 0.01 0 0.01 0.02 0.02 0.02 0.02 0.02 0.03 0.02 0.02 0.03 0.02 0.02
Ba 0.12 0.07 0.07 0.06 0.01 0.01 0.01 0 0.01 0.01 0.01 0 0 0.01 0.01
Ca 0.03 0.01 0.01 0.01 0.83 0.81 1 0.87 0.8 0.97 0.87 0.85 0.88 0.94 0.84
Na 1.18 0.42 0.56 0.39 2.93 2.96 2.91 2.89 2.98 2.84 2.92 2.90 2.89 2.86 2.93
K 2.64 3.49 3.36 3.51 0.2 0.2 0.26 0.26 0.27 0.16 0.19 0.2 0.19 0.18 0.2
Ab 30.7 10.7 14.2 9.9 74.1 74.6 72.2 71.9 73.5 71.6 73.3 73.4 73.1 71.9 73.8
An 0.8 0.3 0.3 0.2 21 20.5 21.3 21.5 19.7 24.3 21.8 21.5 22.2 23.7 21.1
Or 68.5 89.1 85.5 89.9 4.9 4.9 6.5 6.6 6.8 4.1 4.9 5.1 4.7 4.4 5.1
c) Microanalyses of alkali feldspars.d) Microanalyses of plagioclases.
Sam�ple
KL1�C4�1
KL1�C4�3
KL1�C4�5
KL1�C5�1
KL1�C5�3
KL1�C5�5
KL1�C9�1
KL1�C9�3
KL1�C9�5
KPT1�C3�1c
KPT1�C3�3
KPT1�C3�5
core mantle rim core mantle rim core mantle rim core mantle rim
SiO2 62.98 63.36 62.9 62.48 63.31 62.91 63.29 63.01 62.93 62.24 62.73 62.83Al2O3 22.85 22.36 22.81 23.02 22.5 22.7 22.71 22.72 22.78 23.7 23.1 22.58FeO 0.11 0.17 0.16 0.16 0.13 0.13 0.1 0.13 0.12 0.16 0.15 0.39BaO 0.06 0.06 0.06 0.07 0.07 0.09 0.07 0.07 0.06 0.07 0.13 0.09CaO 4.13 3.8 4.37 4.43 3.97 4.25 3.95 4.04 4.38 5.42 4.91 4.15Na2O 8.49 8.77 8.47 8.47 8.62 8.58 8.57 8.6 8.62 8.04 8.27 8.51K2O 0.93 1.02 0.9 0.88 0.99 0.92 1.02 0.98 0.88 0.866 1.02 1.23
Total 99.55 99.54 99.67 99.51 99.59 99.58 99.71 99.55 99.77 100.496 100.31 99.78
Number of ions on the basis of 32 atoms of oxygens
Si 11.21 11.29 11.20 11.15 11.27 11.21 11.25 11.23 11.20 11.02 11.13 11.21Al 4.79 4.69 4.78 4.84 4.72 4.76 4.75 4.77 4.77 4.94 4.83 4.74
Fe2 0.02 0.03 0.02 0.02 0.02 0.02 0.01 0.02 0.02 0.02 0.02 0.06Ba 0 0 0 0.01 0.01 0.01 0.01 0.01 0 0.01 0.01 0.01Ca 1 0.73 0.83 0.85 0.76 1 0.75 0.77 1 1.03 1 0.79Na 2.93 3.03 2.92 2.93 2.98 2.97 2.95 2.97 2.97 2.76 2.84 2.94K 0.21 0.23 0.2 0.2 0.23 0.21 0.23 0.22 0.2 0.2 0.23 0.28
Ab 74.6 76 73.8 73.7 75.2 74.4 75 74.9 74.2 69.3 71 73.3An 20.1 18.2 21 21.3 19.1 20.4 19.1 19.4 20.8 25.8 23.3 19.7Or 5.3 5.8 5.2 5 5.7 5.2 5.9 5.7 5 4.9 5.7 7
e) Microanalyses of plagioclases.

JOURNAL OF VOLCANOLOGY AND SEISMOLOGY Vol. 7 No. 5 2013
KOS PLATEAU TUFF (KPT) ON KALYMNOS ISLAND 301
Table 3. (Contd.)
Sample
KPT1�C4�1c
KPT1�C4�3
KPT1�C4�4
KPT1�C5�1
KPT1�C5�1c
KPT1�C5�3
KPT1�C5�4
KPT1�C56�2
KPT1�C56�4
KPT1�C56�7
KPT1�C7�1c
core mantle rim core core mantle rim core mantle rim core
SiO2 64.07 63.31 62.23 63.11 62.91 63.22 61.83 63.89 63.84 64.03 63.66Al2O3 22.1 22.84 23.6 22.96 23.14 22.78 24.05 22.32 22.41 22.14 22.64FeO 0.2 0.14 0.18 0.17 0.14 0.17 0.14 0.11 0.17 0.13 0.12BaO 0.11 0.12 0.05 0.06 0.06 0.06 0.06 0.08 0.05 0 0.06CaO 3.69 4.4 5.26 4.49 4.83 4.43 5.52 3.99 4.15 3.72 4.3Na2O 8.76 8.58 8.18 8.67 8.24 8.46 8.07 8.72 8.53 8.72 8.6K2O 1.3 1.24 0.95 0.94 1.01 1.15 0.97 1.24 1.19 1.31 1.15
Total 100.23 100.63 100.45 100.4 100.33 100.27 100.64 100.35 100.34 100.05 100.53
Number of ions on the basis of 32 atoms of oxygens
Si 11.35 11.19 11.03 11.17 11.14 11.21 10.95 11.30 11.29 11.35 11.25Al 4.61 4.76 4.93 4.79 4.83 4.76 5.02 4.65 4.67 4.62 4.71
Fe2 0.02 0.02 0.03 0.03 0.02 0.03 0.02 0.02 0.03 0.02 0.02Ba 0.01 0.01 0 0 0 0 0 0.01 0 0 0Ca 0.7 0.83 1 0.85 0.92 0.84 1.05 0.76 0.79 0.71 0.81Na 3.01 2.94 2.81 2.98 2.83 2.91 2.77 2.99 2.93 3.00 2.95K 0.29 0.28 0.22 0.21 0.23 0.26 0.22 0.28 0.27 0.3 0.26
Ab 75.2 72.5 69.8 73.7 71.2 72.5 68.6 74.3 73.5 74.9 73.3An 17.5 20.6 24.9 21.1 23.1 21 25.9 18.7 19.8 17.7 20.3Or 7.3 6.9 5.3 5.2 5.7 6.5 5.5 7 6.7 7.4 6.4
f) Microanalyses of plagioclases.
Sample
KPT1�C7�3
KPT1�C7�5
KPT1�C9�1c
KPT1�C9�2
KPT1�C9�3
KPT2�C1�1
KPT2�C1�3
KPT2�C1�5
KPT2�C3�a1
KPT2�C3�a3
KPT2�C3�a5
KPT2�C3�b1
mantle rim core mantle rim core mantle rim core mantle rim core
SiO2 63.09 63.76 60.84 62.7 63.48 63.38 61.58 63.48 63.41 63.41 62.97 62.73
Al2O3 23.05 22.82 24.54 23.04 22.67 22.78 23.66 22.43 22.75 22.74 22.82 22.92
FeO 0.136 0.177 0.181 0.123 0.121 0.172 0.171 0.141 0.137 0.108 0.164 0.14
BaO 0.07 0.04 0.05 0.04 0.06 0.04 0.08 0.06 0.13 0.04 0.02 0.05
CaO 4.53 4.4 6.25 4.71 4.17 4.23 5.2 4.25 4.01 4.06 4.43 4.37
Na2O 8.55 8.47 7.58 8.23 8.47 8.71 8.14 8.6 8.64 8.61 8.47 8.46
K2O 1.08 1.14 0.692 1.08 1.25 0.89 0.7 0.91 1 0.94 0.83 0.89
Total 100.51 100.81 100.13 99.92 100.22 100.20 99.53 99.87 100.08 99.91 99.70 99.56
Number of ions on the basis of 32 atoms of oxygens
Si 11.16 11.23 10.83 11.15 11.25 11.22 11.00 11.30 11.24 11.25 11.20 11.18
Al 4.80 4.73 5.15 4.82 4.73 4.75 4.98 4.69 4.75 4.75 4.78 4.81
Fe2 0.02 0.03 0.03 0.02 0.02 0.03 0.03 0.02 0.02 0.02 0.02 0.02
Ba 0.01 0 0 0 0 0 0.01 0 0.01 0 0 0
Ca 0.86 0.83 1.19 0.9 0.79 0.8 1 0.81 0.76 0.77 0.84 0.83
Na 2.93 2.89 2.62 2.84 2.91 2.99 2.82 2.96 2.97 2.96 2.92 2.92
K 0.24 0.26 0.16 0.25 0.28 0.2 0.2 0.21 0.23 0.21 0.19 0.2
Ab 72.7 72.7 66 71.3 73.1 74.9 70.9 74.5 75 75.1 73.9 73.8
An 21.3 20.9 30 22.5 19.9 20.1 25.1 20.3 19.3 19.5 21.4 21.1
Or 6 6.4 4 6.2 7 5 4 5.2 5.7 5.4 4.7 5.1
g) Microanalyses of plagioclases.

302
JOURNAL OF VOLCANOLOGY AND SEISMOLOGY Vol. 7 No. 5 2013
ZOUZIAS, SEYMOUR
Table 3. (Contd.)
Sample
KPT2�C3�b3
KPT2�C3�b5
KPT2�C3�c1
KPT2�C3�c3
KPT2�C3�c5
KPT2�C5�a1
KPT2�C5�a3
KPT2�C5�a5
KPT2�C5�b1
KPT2�C5�b3
KPT2�C5�b6
mantle rim core mantle rim core mantle rim core mantle rim
SiO2 63.87 62.87 56.52 60.82 63.2 63.18 62.7 62.35 59.65 57.34 62.72
Al2O3 22.58 23.02 27.44 24.38 22.57 22.61 22.99 23.22 25.42 26.86 23.22
FeO 0.12 0.15 0.18 0.17 0.15 0.14 0.12 0.15 0.19 0.18 0.18
BaO 0.02 0.12 0.16 0.15 0.1 0.06 0.06 0.02 0.07 0.02 0.07
CaO 3.85 4.32 9.26 5.65 3.93 4 4.54 4.63 6.91 8.61 4.52
Na2O 8.75 8.47 5.88 7.75 8.63 8.62 8.37 8.31 7.27 6.36 8.41
K2O 1 0.87 0.31 0.66 1 0.99 0.88 0.83 0.5 0.35 0.87
Total 100.19 99.82 99.75 99.58 99.58 99.6 99.66 99.51 100.01 99.72 99.99
Number of ions on the basis of 32 atoms of oxygens
Si 11.29 11.18 10.18 10.88 11.26 11.25 11.16 11.12 10.65 10.31 11.14
Al 4.70 4.82 5.82 5.14 4.73 4.74 4.81 4.88 5.35 5.69 4.86
Fe2 0.02 0.02 0.03 0.03 0.02 0.02 0.02 0.02 0.03 0.03 0.03
Ba 0 0.01 0.01 0.01 0.01 0 0 0 0.01 0 0.01
Ca 0.73 0.82 1.79 1.08 0.75 0.76 0.87 0.89 1.32 1.66 0.86
Na 3.00 2.92 2.05 2.69 2.98 2.98 2.89 2.87 2.52 2.22 2.90
K 0.23 0.2 0.07 0.15 0.23 0.23 0.2 0.19 0.11 0.08 0.2
Ab 75.8 74.1 52.5 68.5 75.3 75.1 73.1 72.8 63.7 56.1 73.3
An 18.4 20.9 45.7 27.6 19 19.3 21.8 22.4 33.4 41.9 21.7
Or 5.8 5 1.8 3.9 5.7 5.6 5.1 4.8 2.9 2 5
h) Microanalyses of plagioclases.
Sample
KPT2�C6�1
KPT2�C6�3
KPT2�C6�5
KPT2�C7�1
KPT2�C7�5
KPT2�C7�8
KPT2�C8�a1
KPT2�C8�a3
KPT2�C8�a5
KPT2�C8�b1
KPT2�C8�b3
KPT2�C8�b5
core mantle rim core mantle rim core mantle rim core mantle rim
SiO2 56.93 56.58 62.99 62.1 59 62.92 62.84 60.97 62.51 62.28 62.31 61.96Al2O3 27.11 27.17 22.95 23.63 25.64 22.95 22.83 24.29 23.31 23.19 23.37 23.6FeO 0.15 0.18 0.15 0.16 0.13 0.14 0.13 0.18 0.12 0.14 0.14 0.14BaO 0.05 0.03 0.05 0.05 0.06 0.05 0.05 0.08 0.1 0.07 0.16 0.01CaO 9 9.13 4.49 5.01 7.23 4.26 4.32 5.82 4.75 4.79 4.71 4.88Na2O 6.11 6.08 8.44 8.17 7.07 8.43 8.54 7.78 8.3 8.3 8.21 8.27K2O 0.34 0.31 0.88 0.77 0.46 0.93 0.89 0.65 0.81 0.8 0.84 0.77
Total 99.69 99.48 99.95 99.89 99.59 99.68 99.6 99.77 99.9 99.57 99.74 99.63
Number of ions on the basis of 32 atoms of oxygens
Si 10.25 10.22 11.18 11.05 10.59 11.19 11.19 10.88 11.11 11.11 11.10 11.05Al 5.75 5.78 4.80 4.95 5.42 4.81 4.79 5.11 4.88 4.87 4.90 4.96
Fe2 0.02 0.03 0.02 0.02 0.02 0.02 0.02 0.03 0.02 0.02 0.02 0.02Ba 0 0 0 0 0 0 0 0.01 0.01 0.01 0.01 0Ca 1.74 1.77 0.85 0.96 1.39 0.81 0.82 1.11 0.91 0.92 0.9 0.93Na 2.13 2.13 2.91 2.82 2.46 2.91 2.96 2.69 2.86 2.87 2.84 2.86K 0.08 0.07 0.2 0.18 0.11 0.21 0.2 0.15 0.18 0.18 0.19 0.18
Ab 54 53.7 73.4 71.4 62.2 74 74.2 68.1 72.4 72.4 72.2 72.1An 44 44.5 21.6 24.2 35.2 20.7 20.7 28.1 22.9 23.1 22.9 23.5Or 2 1.8 5 4.4 2.6 5.3 5.1 3.8 4.7 4.5 4.9 4.4
i) Microanalyses of plagioclases.

JOURNAL OF VOLCANOLOGY AND SEISMOLOGY Vol. 7 No. 5 2013
KOS PLATEAU TUFF (KPT) ON KALYMNOS ISLAND 303
otites from Kalymnos and Kos tuffs are presented inTable 2. The biotite data from Kalymnos and KPTtuffs are plotted in the “ideal biotite’ diagram byGuidotti [1984] and display compositions which ex�tensively overlap (Fig. 3a) except for two sampleswhich display overlapping but they have less Al2O3 incomparison to the rest of the samples.
Pyroxenes display compositions of augite and aug�ite to diopside and amphibole crystals are magnesio�hornblende respectively [Morimoto et al., 1988;Leake, 1978], (Table 2; Fig. 3c and 3b). In order to es�timate the depth and the temperature of the subvolca�nic magma chamber of the KPT, we used the amphib�ole geobarometer that is based on the pressure�depen�dent Al content [Schmidt, 1992] and the equation ofAnderson and Smith [1995]. The calculated pressureranges between 3.19–4.39 kbar (3.79 ± 0.6 kbar) indicat�ing amphibole crystallization at a depth ranging be�tween 10.5–14.5 km and a temperature approximatelyof 714°C.
K–feldspars are sanidines with compositions O71,Ab28 An1 for cores, O72, Ab27 An1 for mantles and O72,Ab27 An1 for rims (Table 3; Fig. 4a to 4c). Composi�tions of cores, mantles and rims plots within the sani�dine field except for one sample from KPT which plotmore closely to K apex. (Table 3; Fig. 4c).
Plagioclases have oligoclase composition with O5,Ab71 An24 for cores, O5, Ab71 An24 for mantles and O6,
Ab73 An21 for rims, except for two KPT samples, onefrom Kos, which have andesine core (O4, Ab66 An30)and another from Tilos, which core (O2, Ab54 An44) andmantle (O2, Ab53 An45) is andesine (Fig. 5, Table 3).
Table 4. Representative electron microprobe microanalyses of residual volcanic glass from Kalymnos and KPT pumices(major elements in wt %)
KL KL KL KL KL KL KL KL KL KL KPT1 KPT1 KPT1 KPT1 KPT1 KPT1 KPT2 KPT2
C1�1 C1�4 C1�5 C3�2 C3�3 C3�4 C4�1 C4�2 C4�3 CX�3 C4�g4 C4�g5 C2�g4 C7�g1 C7�g3 C8�g1 g2 g9
SiO2 % 73.67 73.65 74.24 74.17 74.31 74.17 74.73 74.39 74.4 73.95 74.24 73.84 73.94 73.6 72.76 73.91 74.39 74.48
TiO2 % 0.07 0.07 0.09 0.1 0.08 0.06 0.09 0.1 0.06 0.1 0.09 0.08 0.12 0.07 0.08 0.07 0.07 0.09
Al2O3 % 11.9 11.76 12 12.1 11.97 11.88 11.95 11.82 12.13 12 12.05 11.98 11.92 11.77 11.85 12.02 12 11.88
Fe2O3(T)%
0.49 0.5 0.53 0.51 0.49 0.51 0.51 0.5 0.48 0.51 0.5 0.5 0.62 0.5 0.55 0.56 0.54 0.53
MnO % 0.06 0.05 0.06 0.05 0.05 0.07 0.05 0 0.07 0.05 0.06 0.06 0 0.05 0.05 0 0.07 0.06
MgO % 0.06 0.08 0.09 0.05 0.05 0.05 0.05 0.05 0.06 0.06 0.06 0.06 0.05 0.06 0.07 0.04 0.06 0.06
CaO % 0.58 0.59 0.54 0.55 0.54 0.57 0.61 0.57 0.58 0.61 0.57 0.55 0.57 0.56 0.65 0.69 0.54 0.57
Na2O % 3.6 3.27 3.53 3.59 3.6 3.69 3.51 3.65 3.53 3.49 3.36 3.51 3.6 3.16 3.51 3.61 3.69 3.56
K2O % 4.33 4.54 4.43 4.54 4.57 4.24 4.38 4.39 4.51 4.55 4.43 4.34 4.4 4.28 3.76 3.69 4.59 4.53
Cl % 0.1 0.11 0.09 0.1 0.09 0.01 0.1 0.1 0.1 0.09 0.09 0.09 0.09 0.09 0.09 0.08 0.08 0.09
LOI % 5.03 5.33 4.36 4.21 4.25 4.67 3.97 4.43 4.04 4.59 4.51 5 4.69 5.86 6.54 5.33 3.91 4.12
Total % 94.97 94.67 95.64 95.79 95.75 95.33 96.03 95.57 95.96 95.41 95.49 95 95.31 94.14 93.46 94.67 96.09 95.88
Table 5. GPS locations of Kos and Kalymnos pumice sam�ples obtained from D and E ignimbrite units
Sample Location Easting Northing
KL�1 (E) Kalymnos Island 36 58.323 27 00.124
KL�2 (D) Kalymnos Island 36 58.390 27 00.164
KL�3 (E) Kalymnos Island 36 58.984 27 00.181
KL�4 (E) Kalymnos Island 36 58.356 26 59.456
KL�6 (E) Kalymnos Island 36 58.419 26 59.497
KL�7 (E) Kalymnos Island 36 58.414 26 59.552
KL�8 (D) Kalymnos Island 36 58.361 27 00.010
KL�9 (E) Kalymnos Island 36 58.350 27 00.063
KL�10 (E) Kalymnos Island 36 58.200 27 00.310
KL�14 (E) Kalymnos Island 36 56.550 27 00.299
KL�15 (E) Kalymnos Island 36 56.560 26 59.534
KL�16 (E) Kalymnos Island 36 56.573 26 59.341
KL�17 (E) Kalymnos Island 36 56.454 26 59.337

304
JOURNAL OF VOLCANOLOGY AND SEISMOLOGY Vol. 7 No. 5 2013
ZOUZIAS, SEYMOUR
Plagioclase and K�Feldspar compositions fromKalymnos and KPT tuffs display extensive composi�tional overlaps (Figs. 4, 5).
4.3. Petrochemistry
Samples from Kalymnos and KPT tuffs are rhyo�lites (Table 1) displaying “volcanic arc” affinities in theY + Nb�Rb diagram [Pearce et al., 1984] (Fig. 8a),quite in agreement with the petrotectonic environ�ment of their emplacement. Despite the efforts to ob�tain the most pristine samples loss on ignition for thesetuffs is rather high with a mean ~2.3 w.t.% (Table 1).This is not unusual for this type of volcanic materialthat is characterized by high porosity with the tenden�cy to deposit alteration (hydrous) minerals in the mul�tiple vacuoles. However, major elements show lowvariance (Table 1) and SiO2, TiO2, Al2O3, Fe2O3, MnO
display limited ranges and averages (in wt %) that arevery close for the two groups (SiO2: 71.99 vs. 71.8,TiO2: 0.18 vs. 0.17, Al2O3: 13.11 vs. 13.21, Fe2O3: 1.59 vs.1.39, MnO: 0.06 vs. 0.06). MgO displays wider com�positional range but mean values (in wt %) that arevery close for the two tuffs (0.36 vs. 0.34). The alkali ele�ment oxides and CaO display wider ranges for the in�dividual groups, however, mean values that are onlyslightly different between the two tuffs (CaO: 1.4 vs.1.3, K2O: 4.4 vs. 4.19, Na2O: 3.61 vs. 3.7). For the Ka�lymnos and KPT glasses LOI contents present a meanof 4.77 w.t.% i.e. higher than the LOI of the bulk com�positions probably as a result of unavoidable devolati�lization by the electron beam (Table 4). On Harkervariation diagrams the bulk analyses for major ele�ments of Kalymnos and KPT pumices overlap (Fig. 6).Kalymnos pumices display tight trends with the D�unit
37''00'
27''00'
N
W
S
E
0 2 4 km
Vathy
Horion
Kalymnos
Kos Plateau Tuff
Limestone, conglomerate,sandstone, alluvian depositsLimestone
Limestone and psammitic schists
Probable fault
Fault
GREECE
TU
RK
EY
Aegean Sea
Pelopones Recent
ArcHelienic
Trench
Fig. 1. Simplified geological map of the island of Kalymnos (modified after [Dounas et al., 1971]). Kos Plateau Tuff (KPT) ishosted in the valleys of Vathy and Horion (white�dotted black pattern). Inset: Recent Aegean Arc and Hellenic trench. Study areais indicated by an arrow.

JOURNAL OF VOLCANOLOGY AND SEISMOLOGY Vol. 7 No. 5 2013
KOS PLATEAU TUFF (KPT) ON KALYMNOS ISLAND 305
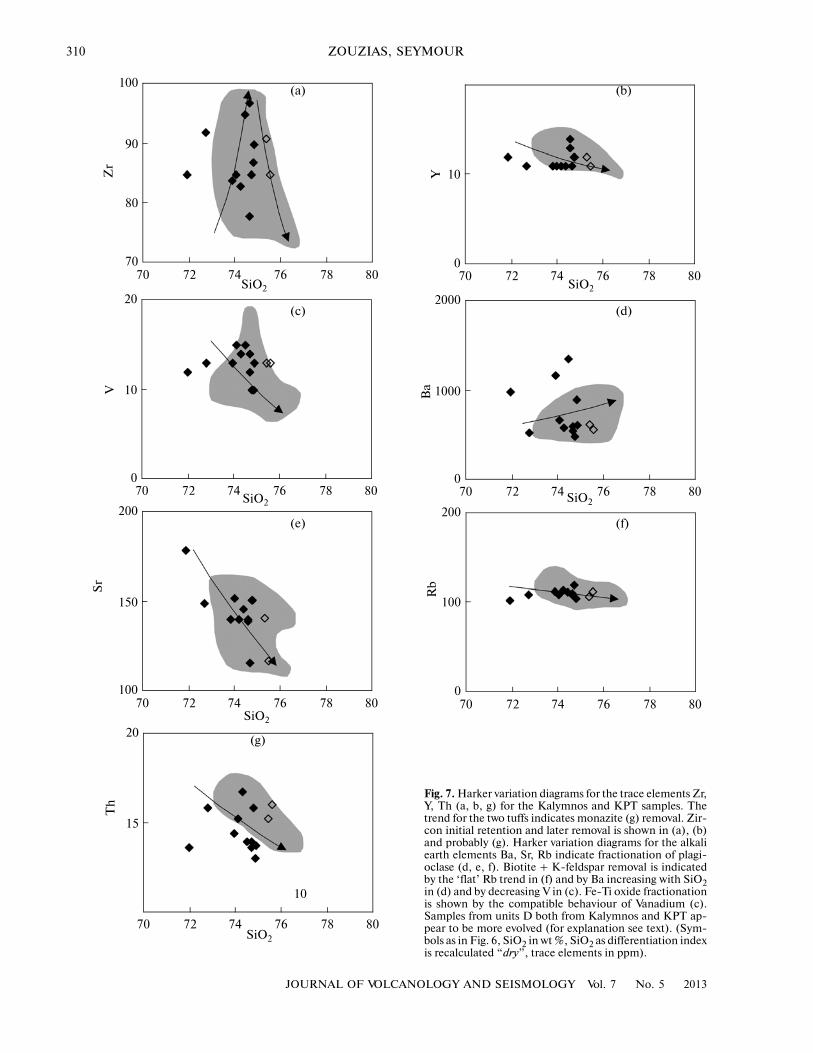
samples being slightly more differentiated (Fig. 6). Traceelements such as the “immobile” trace elements Zr and Y,the alkali earth elements Ba, Rb and Sr, the compa�tible trace element V and the hygromagmatophile traceelement Th, have also been plotted on Harker varia�tion diagrams where these tuff groups display overlap�ping variation trends (Fig. 7). Rare Earth profiles nor�malized to primitive mantle [Sun, McDonough, 1989]are parallel and display negative Eu anomalies(Fig. 8b). The Kalymnos and KPT glasses have rangesof major elements SiO2: 74.22 vs. 73.82, TiO2:0.05 vs. 0.07, Al2O3: 11.94 vs. 11.94, Fe2O3: 0.5 vs.0.53, MnO: 0.05 vs. 0.05, MgO 0.06 vs. 0.06, CaO:0.57 vs. 0.59, K2O: 4.46 vs. 4.37 and Na2O: 3.54 vs.3.56. Glasses from both sites show depletion in MgO,TiO2, Fe2O3 (Total) and a slight depletion for CaO andenrichment in the alkali elements K and Na (Table 4,Fig. 6).
5. DISCUSSION
Physical volcanology arguments presented by Allen[1998] have suggested that the D and E ignimbriteunits of the Kos Plateau Tuff have been deposited onthe islands of Tilos to the south and on Kalymnos,north of Kos. Zouzias and St. Seymour [2008] provi�ded the geochemical arguments supporting this thesisfor the KPT and Tilos tuffs. In the present work, theconsanguinity of Kalymnos tuff and KPT pumicesfrom Kos and Tilos has been investigated on the basis oftheir petrochemistry and mineral chemistry. On Harkervariation diagrams for major elements (Figs. 6a, 6g) Ka�lymnos and KPT whole rock analyses define coherentliquid�lines�of descent. Residual glass compositions forboth KPT and Kalymnos coincide; however, theyshow depletions in the ferromagnesian mineral com�ponents and retention in the alkali feldspar compo�nents (Fig. 6). The evolution of liquid has been ac�complished by removal of biotite (TiO2, Fe2O3, MgO,Rb vs. SiO2) trends, (Figs. 6a, 6c, 6f, 7f), Fe�Ti oxide(TiO2, Fe2O3, V) vs SiO2 (Figs. 6a, 6c, 7c) and feldspar(Al2O3, CaO, Na2O, K2O, Ba, Sr, Rb vs. SiO2) trends,(Figs. 6b, 6d, 6e, 6g, 7d, 7e, 7f). Zircon and monazite re�moval is reflected in the Zr, Y, Th trends (Fig. 7a, 7b, 7g).Plagioclase removal is indicated also by the negativeEu anomalies in the REE profiles of both Kalymnosand KPT pumice samples (Fig. 8b). These observa�tions agree with the phenocrystic assemblage of bio ±feldspar ± quartz ± Fe�Ti oxide and the monazite andzircon crystals present in both Kalymnos and KPTsamples (Fig. 2). The petrography and textural fea�tures of the Kalymnos and KPT assemblages are simi�lar (Fig. 2) and the mineral chemistry of their phenoc�rystic assemblage display extensive compositionaloverlaps for biotite (ideal biotite), K�feldspar (sani�
dine) and plagioclase (oligoclase) (Figs. 3a, 4, 5). RareEarth profiles of the KPT and Kalymnos tuffs are par�allel revealing a consanguineous relationship and are“concave upwards”, a characteristic of arc�relatedmagmas (Fig. 8b). St. Seymour [1996] has suggestedthat the volcanic centers active at different times in theKos�Nisyros area are genetically related to a larger,deeper magma reservoir underlying the Kos�Nisyrosarea. St. Seymour et al. [2006] have identified by re�mote sensing techniques and field geology criteria anumber of caldera depressions and have related the ge�ometry of these subsidiary chambers expressed by theircalderas to the deeper superstructure of the main reser�voir and the volcano�tectonic regime in the immediatearea [Zouzias, St. Seymour, 2006]. The geochemistry ofvolcanic products of the Quaternary centers in the areahas been presented for Kos [Keller, 1969; Stadlbauer,1988; Dalabakis, 1988; Pe�Piper, Moulton, 2008].St. Seymour [1996] has suggested on the grounds ofthe studied geochemical relationship between the rhy�
(b)
(c)
(а) 100 µm 100 µm
100 µm 100 µm(d)
Fig. 2. SEM images of biotite, plagioclase and K�feldsparcrystals representative of all phenocrysts from Kalymnosand KPT pumice samples. (a) Fractured and slightly bentbiotite crystals with inclusions of monazite (100 µm insize, bright white color) from KPT pumice (scale bar:100 µm), embedded in the volcanic glass and apatite (10–20 µm in size, white crystals). Fracturing and bent cleavageplanes of biotite phenocrysts are attributed to the explosiveorigin of host. (b) Very fractured and slightly bent biotitecrystals due to explosive origin of its host (KPT pumice)(scale bar: 100 µm), embedded in highly vesicular volcanicglass with inclusions of monazite (20–60 µm in size, brightwhite color). Biotite crystals in both (a) and (b) tend to al�ter to chlorite along cleavage planes showing darker huethan fresh biotite. (c) Fractured plagioclase crystals inKPT pumice with apatite inclusions (approximately100 µm in size, white crystals). Oligoclase phenocrysts dis�play zonation and relict cores (upper left) interpreted asevidence of magma mixing and decompression. (d) Frac�tured K�feldspar phenocryst from Kalymnos pumice in asheath of glass surrounded by highly vesicular glass and dis�playing typical rounded habit interpreted as sign of resorp�tion (scale bar: 100 µm).

306
JOURNAL OF VOLCANOLOGY AND SEISMOLOGY Vol. 7 No. 5 2013
ZOUZIAS, SEYMOUR
odacites of Nisyros and the Yali rhyolites that the mag�matic chambers of the aforesaid centers might havebeen satellite chambers of a larger, active subvolcanicreservoir. The geophysical evidence of the presence ofa much smaller, remnant, active magma chamber be�tween Kos and Nisyros has been presented by Lagioset al. [2005]. The minimum depth of the KPT magmachamber has been estimated at approximately at 5–6 km from melt inclusion evidence [Bourguin, 2006]and at 8.1 ± 1 km from the normative composition ofthe melt [Keller, 1969]. The magma is estimated tohave resided in the KPT chamber for approximately200000 years as concluded from zircon crystallizationand recycling [Bachmann et al., 2007]. Based on co�existing Fe–Ti oxide compositions, oxygen fugacitiesranged around NNO +1 to +1.5 at 760°–780°C. Forco�existing granitic inclusions temperatures rangedfrom 710°–740°C [Bacon, Hirschmann, 1988]. Ourdata from Al content in hornblende in the tuff samplesyielded a depth of 10.5–14.5 km for the KPT magmachamber applying the geobarometer of Schmidt[1992] and temperatures approximately 714°C usingthe general expression of Anderson and Smith [1995].Magma mixing processes suggested by plagioclase mi�crotextures, by resorption of quartz and K�feldspar
and by the presence of pyroxene and amphibole xe�nocrysts characterize these chambers [St. Seymour,Vlassopoulos, 1991; Pe�Piper, Moulton, 2008]. RareEarth profiles of Kalymnos and KPT pumices areoverall parallel indicative of magma consanguinity(Fig. 8b). Zr�SiO2 and Nb/Zr–La/Yb systematics(Fig. 8c, 8d) show that all these subsidiary chambersdisplay similar but quite distinct geochemical insignias,reflecting different magma chamber dynamics evolv�ing as a function of geological time which would dis�tinguish for example Nisyros and Yali (paroxysmic ex�plosion ~46000 yrs; [Margari et al., 2007] from Kos(paroxysmic explosion ~161000 yrs ago, [Smith et al.,1996]).
6. CONCLUSIONS
It is concluded from major, trace and REE distri�butions that the Kalymnos and Kos Plateau tuffs havecompositions that coincide on petrogenetic evolutionlines. Mineralogy, textural relationships and mineralchemistry of Kos Plateau and Kalymnos tuffs are iden�tical. The above conclusions, as well as, those arrivedat by Zouzias and St. Seymour [2008] totally agreewith the physical volcanology evidence presented by
3
102
Eastonite Siderophyllite
Phlogopite Annite
Ph
logo
pit
e
Bio
tite
Fe/(Fe + Mg)
AII
V
8.00
1.0
7.5 7.0 6.5 6.0 5.5
Mg/
(Mg
+ F
e 2)
TSi
Tremolite TrHb
Actinolite
Ferro–Fe–
Act
Hbl
Magnesio–Hbl
Ferro–Hbl
Tsch
Hbl
Fe–
Tsch
Hbl
Tschermakite
Ferro–
TschermakiteActinolite
Act
Hbl
Di Hd
Augite
Pigeonite
En Fs
(a) (b)
(c)
Fig. 3. (A) In the “Ideal Biotite Diagram” of [Guidotti, 1984] biotite analyses from Kalymnos (filled diamond) and KPT (shadedarea) plot in the field of biotite composition. Classification of rare (xenocrystic) pyroxene and amphibole from KPT pumices (Kosisland–filled circles; Tilos island–filled reversed triangle): (B) The amphibole from KPT in the [Leake, 1978] classificationscheme plots in the field of magnesio�hornblende. (C) Pyroxene quadrilateral [Morimoto et al., 1988]: the clinopyroxene com�positions fall in the augite field (KPT–Kos) and towards the diopside corner (KPT–Tilos).

JOURNAL OF VOLCANOLOGY AND SEISMOLOGY Vol. 7 No. 5 2013
KOS PLATEAU TUFF (KPT) ON KALYMNOS ISLAND 307
Or
San
Ab
An
Anorth
Alb Oligo And Labr Byt
An
Or
San
Ab
Anorth
Alb Oligo And Labr
Or
San
Ab
Anorth
Alb Oligo And Labr
Or
San
Ab
An
Anorth
Alb Oligo And Labr Byt
An
Or
San
Ab
Anorth
Alb Oligo And La
Or
San
Ab
Anorth
Alb Oligo And La
Or
San
Ab
An
Anorth
Alb Oligo And Labr Byt
An
Or
San
Ab
Anorth
Alb Oligo And La
Or
San
Ab
Anorth
Alb Oligo And La
(a)
(b)
(c)
Fig. 4. Alkali feldspar analyses from (a) Kalymnos, (b) KPT (Kos) and (c) KPT (Tilos) plot in the sanidine field. KPT (Tilos)alkali feldspar plot near the Or apex. Symbolism: core = open circle, mantle = open diamond and rim = open square.

308
JOURNAL OF VOLCANOLOGY AND SEISMOLOGY Vol. 7 No. 5 2013
ZOUZIAS, SEYMOUR
Or
San
Ab An
Anorth
Alb Oligo And Labr Byt An
Or
San
Ab
Anorth
Alb Oligo And
San
Anorth
Alb Oligo And
Ab
Or
Or
San
Ab An
Anorth
Alb Oligo And Labr Byt An
Or
San
Ab
Anorth
Alb Oligo And
San
Anorth
Alb Oligo And
Ab
Or
Or
San
Ab An
Anorth
Alb Oligo And Labr Byt An
Or
San
Ab
Anorth
Alb Oligo And
San
Anorth
Alb Oligo And
Ab
Or
(a)
(b)
(c)
Fig. 5. Plagioclase analyses from (a) Kalymnos, (b) KPT (Kos) and (c) KPT (Tilos) plot in the oligoclase field displaying exten�sively overlap except for two KPT samples, one from Kos, which have andesine core and another from Tilos, which have andesinecore and mantle. Symbolism: core = open circle, mantle = open diamond and rim = open square.

JOURNAL OF VOLCANOLOGY AND SEISMOLOGY Vol. 7 No. 5 2013
KOS PLATEAU TUFF (KPT) ON KALYMNOS ISLAND 309
0.24
0.18
0.12
0.06
7876747270 00
0.30
15
7876747270 8010
3.2
2.4
1.6
0.8
7876747270 800
4.0
2.4
1.8
1.2
0.6
7876747270 800
3.0
5.4
4.8
4.2
3.6
7876747270 803.0
6.0
0.56
0.42
0.28
0.14
7876747270 800
0.70
5.4
4.8
4.2
3.6
7876747270 803.0
6.0
TiO
2
Al 2
O3
SiO2
Fe 2
O3T
CaO
Na 2
O
MgO
K2O
(а) (b)
(c) (d)
(e) (f)
(g)
SiO2
SiO2SiO2
SiO2 SiO2
SiO2
Fig. 6. Harker variation diagrams for major ele�ment oxides (in w.t. %) of the Kalymnos andKPT pumice samples. Kalymnos D pumices arepresented as open diamonds and E pumices asfilled diamonds. KPT pumices are represented aslight grey shaded area. Glasses from Kalymnosand KPT are represented as grey shaded area.The two groups of samples mostly overlap, whichfor ‘immobile’ elements such as Ti and Al (a, b)show tight trends. However, the D unit samplesappear to be more evolved than E unit samples(for explanations see text). Feldspar fractionationis apparent from (b, d, e, g). Biotite removal is ap�parent from (a, c, f, g). Titaniferous�magnetite�ilmenite fractionation is shown from diagrams (a,c). All samples are recalculated “dry”.
20
310
JOURNAL OF VOLCANOLOGY AND SEISMOLOGY Vol. 7 No. 5 2013
ZOUZIAS, SEYMOUR
90
80
707876747270 80
100
10
07876747270 80
1000
07876747270 80
2000
10
07876747270 80
20
150
1007876747270 80
200
100
07876747270 80
200
15
10
7876747270 80
20
Sr
Rb
Th
Zr
Y
V Ba
(а) (b)
(c) (d)
(e) (f)
(g)
SiO2 SiO2
SiO2 SiO2
SiO2
SiO2
Fig. 7. Harker variation diagrams for the trace elements Zr,Y, Th (a, b, g) for the Kalymnos and KPT samples. Thetrend for the two tuffs indicates monazite (g) removal. Zir�con initial retention and later removal is shown in (a), (b)and probably (g). Harker variation diagrams for the alkaliearth elements Ba, Sr, Rb indicate fractionation of plagi�oclase (d, e, f). Biotite + K�feldspar removal is indicatedby the ‘flat’ Rb trend in (f) and by Ba increasing with SiO2in (d) and by decreasing V in (c). Fe�Ti oxide fractionationis shown by the compatible behaviour of Vanadium (c).Samples from units D both from Kalymnos and KPT ap�pear to be more evolved (for explanation see text). (Sym�bols as in Fig. 6, SiO2 in wt %, SiO2 as differentiation indexis recalculated “dry”, trace elements in ppm).

JOURNAL OF VOLCANOLOGY AND SEISMOLOGY Vol. 7 No. 5 2013
KOS PLATEAU TUFF (KPT) ON KALYMNOS ISLAND 311
Allen et al. [1999], Allen and Cas [2001] and Allen[2001] that argues for the deposition of the KPT alsoon Kalymnos.
ACKNOWLEDGMENTS
The authors would like to thank Dr. Lang Shi forthe co�operation on the Microprobe analyses and Mr.George Papaioannou for participating and helping inthe fieldwork. Professor Karen St. Seymour thanks theDepartment of Geography, Urban Planning and Envi�ronment, of Concordia University for extending anAdjunct Professor status with Concordia University.
REFERENCES
Allen, S.R., Reconstruction of a major caldera�formingeruption from pyroclastic deposit characteristics: Kos Pla�
teau Tuff, eastern Aegean Sea, J. Volcanol. Geotherm. Res.,2001, vol. 105, pp. 141–162.Allen, S.R. and Cas, R.A.F., Transport of pyroclastic flowsacross the sea during the explosive, rhyolitic eruption of theKos Plateau Tuff, Greece, Bull. Volcanol., 2001, vol. 62,pp. 441–456.Allen, S.R., Stadlbauer, E., and Keller, J., Stratigraphy ofthe Kos Plateau Tuff: product of a major Quaternary explo�sive rhyolitic eruption in the eastern Aegean Sea, Greece,Intern. J. Earth Sci., 1999, vol. 88, pp. 132–156.Allen, S.R., Volcanology of the Kos Plateau Tuff, Greece: TheProduct of an Explosive Eruption in an Archipelago, Ph. D.Thesis, Monash University, Australia, 1998.Allen, S.R. and Cas, R.A.F., Rhyolitic fallout and pyroclas�tic density current deposits from a phreatoplinian eruptionin the Eastern Aegean Sea, Greece, J. Volcanol. Geotherm.Res., 1998, vol. 86, pp. 219–251.Anderson, J.L. and Smith, D.R., The effects of temperatureand fO2 on the Al�in hornblende barometer, Amer. Miner.,1995, vol. 80, pp. 549–559.
1000
1001
600
400
200
8070605040
0.20
0.15
0.10
0.05
40302010
0.25
0
10
60
1La
CePr
Nd SmEu
GdTb
DyHo
ErTm
YbLu
Sam
ple
/Pri
mit
ive
Man
tle
1
100
10
100010 2000
2000
Syn–COLG WPG
VAG ORG
Campanianlgnimbrite & PhT3
Dodecanese
Thera, PhT1, PhT2
Aegean ArcMilosNisyrosYali
Aeolian & AnatolianCentrs KPT
Kos, Kalymnos, Tilos
Campanianlgnimbrite & PhT3
Dodecanese
Thera,
Aegean ArcMilosNisyrosYali
Aeolian
Centrs
KPTKos, Kalymnos, Tilos
Province
Anatolian
Centrs
PhT1, PhT2
Province
Y + Nb
SiO2 (wt %) La/Yb
Zr
(pp
m)
Rb
Nb/
Zr
(a) (b)
(c) (d)
Fig. 8. (a) In the Y + Nb vs Rb petrotectonic diagram of [Pearce et al., 1984] Kalymnos and KPT samples plot in the ‘VolcanicArc’ (VAG) field in agreement with the tectonic environment of their emplacement at 161 Ka B.P. (b) Envelopes of REE profilesfor the Kalymnos and KPT pumice samples normalized to Primitive Mantle [Sun, Mcdonough, 1989]. KPT Rare Earth profilesenvelope is represented as a grey shaded area. Kalymnos profiles envelope is represented as vertical lines. The ‘concave upwards’profiles characterize arc�related magmas. (c) Zr�SiO2 and (d) Nb/Zr–La/Yb systematics for Eastern Mediterranean volcaniccenters. The Kalymnos�KPT tuffs display distinct geochemical insignia compared to the Nisyros�Yali pumices reflecting differentmagma chamber dynamics evolving as a function of geological time (Adapted from [St. Seymour et al., 2004]).

312
JOURNAL OF VOLCANOLOGY AND SEISMOLOGY Vol. 7 No. 5 2013
ZOUZIAS, SEYMOUR
Bachmann, O., Charlier, B.L.A., and Lowenstern, J.B.,Zircon crystallization and recycling in the magma chamberof the rhyolitic Kos Plateau Tuff (Aegean arc), Geology,2007, vol. 35 (1), pp. 73–76.Bacon, C.R. and Hirschmann, M.M., Mg/Mn partitioningas a test for equilibrium between coexisting Fe�Ti oxides,Amer. Miner., 1988, vol. 73, pp. 57–61.Bohla, M. and Keller, J., Petrology and Plinian eruptions ofNisyros volcano, Hellenic arc, Terra Cognita, 1987, vol. 7,pp. 171.Bourquin, J., Etude des inclusions vitreuses du Kos PlateauTuff, Grece, Master in Geology, Geneva: University ofGeneva, 2006.Bozkurt, E., Origin of NE�trending basins in western Tur�key, Geodin. Acta, 2003, vol. 16, pp. 61–81.Dalabakis, P. and Vougioukalakis, G., The Kefalos TuffRing (W. Kos): Depositional mechanisms, vent positionand model of the evolution of the eruptive activity, Bull.Geol. Soc. Greece, 1993, vol. XXVIII/2, pp. 259–273. Dalabakis, P., Le volcanisme récent de l'île de Kos, (Greece),Thèse de l’université Paris Sud, Orsay, 1988.Dounas, A., Kakavas, N., and Tassios, N., Geological map,Kalymnos Sheet, scale 1 : 50 000, Institute of Geology andMineral Exploration (I.G.M.E.), 1971.Doutsos, T. and Kokkalas, S., Stress and deformation pat�terns in the Aegean region, J. Struct. Geol., 2001, vol. 23,pp. 455–472.Federman, A.N. and Carey, S.N., Electron microprobecorrelation of tephra layers from eastern Mediterraneanabyssal sediments and the island of Santorini, Quat. Res.,1980, vol. 13, pp. 160–171.Guidotti, C.V., Micas in Metamorphic Rocks, Bailey S.W.,Ed., Micas. Mineral. Soc. Amer., Reviews in Mineralogy,1984, vol. 13, pp. 357–467.Keller, J., Origin of rhyolites by anatectic melting of graniteand crustal rocks. The example of rhyolitic pumice from theisland of Kos (Aegean Sea), Bull. Volcanol., 1969, vol. 33,pp. 942–959.Kurt, H., Demirbag, E. and Kuscu, I., Investigation of thesubmarine active tectonism in the Gulf of Gökova, south�west Anatolia–southeast Aegean Sea, by multi�channelseismic reflection data, Tectonophysics, 1999, vol. 305,pp. 477–496.Lagios, E., Sakkas, V., Parcharidis, Is., and Dietrich, V.,Ground deformation of Nisyros volcano (Greece) for theperiod 1995–2002: Results from DInSAR and DGPS ob�servations, Bull. Volcanol., 2005, vol. 68, pp. 201–214.Leake, B.E., Nomenclature of amphiboles, Amer. Miner.,1978, vol. 63, pp. 11–12.Margari, V., Pyle, D.M., Bryant, C., and Gibbard, P.L.,Mediterranean tephra stratigraphy revisited: results from along terrestrial sequence on Lesvos Island, Greece, J. Vol�canol. Geotherm. Res., 2007, vol. 163, pp. 34–54.Morimoto, N., Fabries, J., Ferguson, A.K.M., et al., No�menclature of pyroxenes, Amer. Miner., 1988, vol. 73,pp. 1123–1133.Palladino, D.M., Simei, S., and Kyriakopoulos, K., Onmagma fragmentation by conduit shear stress: Evidencefrom the Kos Plateau Tuff, Aegean Volcanic Arc, J. Volca�nol. Geotherm. Res., 2008, vol. 178, pp. 807–817.Pearce, J.A., Harris, N.B.W., and Tindle, A. G., Trace ele�ment discrimination diagrams for the tectonic interpreta�tion of granitic rocks, J. Petrol., 1984, vol. 25, pp. 956–983.
Pe�Piper, G. and Moulton, B., Magma evolution in thePliocene–Pleistocene succession of Kos, South Aegean Arc(Greece), Lithos, 2008, vol. 106, pp. 110–124.
Pe�Piper, G., Piper, D.J.W., and Perissoratis, C., Neotec�tonics and the Kos Plateau Tuff eruption of 161 ka, SouthAegean Arc, J. Volcanol. Geotherm. Res., 2005, vol. 139,pp. 315–338.
Schmidt, M.W., Amphibole composition in tonalite as afunction of pressure: an experimental calibration of the Al�in�hornblende barometer, Contrib. Miner. Petrol., 1992,vol. 110, pp. 304–310.
Smith, P.E., York, D., and Evensen, N.M., Single crystal40Ar�39Ar dating of a Late Quaternary paroxysm on Kos,Greece: Concordance of terrestrial and marine ages, Geo�phys. Res. Lett., 1996, vol. 23(21), pp. 3047–3050.
St. Seymour, K., Kouli, M., Zouzias, D., et al., Identifyingcalderas in Aegean Sea, Hellas, using remote sensing tech�niques, European Congress on Regional Geoscientific Cartog�raphy and Information Systems Earth and Water, June 13,2006, Barcelona, Spain, 2006.
St. Seymour, K., Christanis, K., and Bouzinos, A., Teph�rostratigraphy and tephrochronology in the Philippi peatbasin, Macedonia, Northern Hellas (Greece), Quat. In�tern., 2004, vol. 121, pp. 53–65.
St. Seymour, K., Geochemistry of the Yali volcano rhyolitesand their relationship to the volcanic products of Nisyros,Aegean volcanic arc, Neues Jahrbuch fur MineralogieMonatshefte, 1996, H. 2, pp. 57–72.
St. Seymour, K. and Vlassopoulos, D., Magma mixing atNisyros volcano, as inferred from incompatible trace�ele�ment systematic, J. Volcanol. Geotherm. Res., 1991, vol. 50,pp. 273–299.
Stamatelopoulou�Seymour, K., Vlassopoulos, D., Pea�rce, T.H., and Rice, C., The record of magma chamberprocesses in plagioclase phenocrysts at Thera Volcano, Ae�gean Volcanic Arc, Greece, Contrib. Miner. Petrol., 1990,vol. 104, pp. 73–84.
Stadlbauer, E., Volkanologisch�geochemische Analyse einesjungen ignimbrites: Der Kos�Plateau�Tuff (Sudst� Agais),Ph.D. Thesis, Freiburg, 1988.
Stadlbauer, E., Bohla, M., and Keller, J., The Kos�Plateau�Tuff (Greece): A major ignimbrite eruption that crossedopen sea, International Symposium of Volcanology, N.Zealand. 1986.
Sun, S.S. and McDonough, W.F., On Magmatism in theOcean Basins, Special Publications Geol. Soc. London, 1989,vol. 42, pp. 313–345.
Ulusoy, I., Cubukcu, E., Aydar, E., et al., Volcanic and de�formation history of the Bodrum resurgent caldera system(Southeastern Turkey), J. Volcanol. Geotherm. Res., 2004,vol. 136, pp. 71–96.
Vinci, A., Distribution and chemical composition of tephralayers from eastern Mediterranean abyssal sediments, Ma�rine Geology, 1985, vol. 64, pp. 143–155.
Zouzias, D. and St. Seymour, K., Consanguineousgeochemistry of the Kos Plateau and Tilos D and E Pumic�es, Aegean Volcanic Arc, Hellas, Neues Jahrbuch fur Miner�alogie Abhandlungen, 2008, vol. 184/3, pp. 231–241.
Zouzias, D. and St. Seymour, K., Magma intrusion in 'pro�to�caldera caldera' systems: example from the Nisyros vol�cano, Bull. Geol. Soc. Greece, vol. XXXVII, 11th Interna�tional Congress, Athens, May, 2007.