korean ethnic identity and assimilation levels of high
TRANSCRIPT
KOREAN ETHNIC IDENTITY AND ASSIMILATION LEVELS
Korean Ethnic Identity and Assimilation Levels of High School
Students in an Ethnically Diverse Californian High School
Word Count: 4925

KOREAN ETHNIC IDENTITY AND ASSIMILATION LEVELS 1
Introduction
Koreans began their waves of immigration into the United States around the early years
of the 20th century, with most of the modern Korean Americans appearing after the enactment of
the Immigration Act of 1965 (Chan). According to the U.S Bureau of the Census, in 1990, there
are currently over one million Koreans residing in the United States of America, making U.S the
home of the largest South Korean population globally.
Across the U.S, Koreans are going through a mixture of cultures, American, Korean, and
the many others in the country. But, because of the large population centers of Koreans in the
United States, many are able to “retain their ethnic customs, values, and practices while
concurrently adapting to and living within mainstream society” (Lee), creating a distinct identity
from the cultures in many Korean Americans. The specific identity a person identifies with is
known as ethnic identity, which is often viewed “as one dimension of a person’s cultural
orientation….individuals therefore may adopt a bicultural, assimilated, traditional, or marginal
cultural orientation toward their own ethnic culture and the dominant culture” (Berry & Sam;
Lee; Laframboise, Coleman & Gerton).
Moreover, with the increasing amount of Korean immigrants and their later generations
in the United States, it becomes difficult to ignore Korea’s growing influence, such as through
food and music. This begs the question: has the United States influenced Koreans as much as
Koreans have influenced the U.S? Do these Korean immigrants still feel more ethnically Korean,
or do they now refer to themselves as Korean American? There have been studies that focus on
the the ethnic identity of Koreans by using surveys, for example, the Multigroup Ethnic Identity
Measure (MEIM). My research, the SHS study, was conducted to find Korean ethnic identity
and assimilation levels of high school students in an ethnically diverse Californian high
school.
Academic Literature Review
The SHS study was divided into three Findings Groups:
● Findings 1: Generational Status and Gender
● Findings 2: Language Fluency
KOREAN ETHNIC IDENTITY AND ASSIMILATION LEVELS 2
● Findings 3: Assimilation and Ethnic Identity
Throughout the paper, I will be referring to specific studies by the last name of the main
researcher (ex. Lee’s Study).
The survey used in my research was the Multi-Ethnic Identity Measure, which is widely
used by other researchers to measure ethnic identity. Created by Jean Phinney, the survey has
had multiple revisions throughout the years, but I will be using the 1992 version, which was
aligns with the survey used by Richard M. Lee, the author of whom my research is based off of.
The survey best measures two items: (1) ethnic identity and (2) affirmation, belonging, and
commitment.
The majority of my research style will be based of the work of Richard M. Lee, who
wrote: The Korean Diaspora Experience: Measuring Ethnic Identity in the United States and
China (2001). Currently, he is the professor of psychology in the University of Minnesota and
was the founding member of the Asian Caucus of the Society for Research on Child
Development. This research was conducted during his time at the University of Texas, Austin as
the professor of psychology. His paper on ethnic identity introduces the idea of varying ethnic
identities based on a country’s responses to immigrants, for example: the United States
welcomes migrants and encourages assimilation leading to a bicultural group of Korean
Americans, while China advocates for a multinational country, allowing Koreans to retain their
heritage. His piece concluded that in the United States, Koreans were more likely to be
bicultural, implying Korean Americans’ ability to “retain their cultural heritage and identity
while incorporating aspects of the dominant host culture into their identity and lifestyle” (Lee
207). For his method, he used the method of Sample and Procedure, more specifically the
Multigroup Ethnic Identity Measure (MEIM) 1992. The differential item function analysis used
revealed no cultural item bias among the retained MEIM items, which allows the conclusion to
be as objective and unbiased as possible. In Lee’s work, Korean Americans were more likely to
be classified as bicultural than the Korean Chinese. The latter were classified as assimilated,
traditional, or marginalized in their cultural orientation.
In Lee’s work, a over half of the participants identified their Korean speaking skills as
‘excellent’ (12%), ‘good’ (29%) and ‘fair’ (36%), and as previously mentioned, were found to be
KOREAN ETHNIC IDENTITY AND ASSIMILATION LEVELS 3
bicultural, showing interest in both their native and new culture. But, in Clara Lee Brown’s
Heritage Language and Ethnic Identity: A Case Study of Korean-American College Students , she
raises the idea of dual identity, ethnic identity of two different cultures (ex. Korean-American vs.
simply Korean), is not necessarily a personal choice.. Moreover, although Lee’s study showed
that fluency in Korean may be connected with the respondents identifying mainly as bicultural,
Brown’s study reveals high fluency of one’s heritage language, in this case Korean, cannot
always be positively correlated strong ethnic identity.
Along with many stereotypes faced by the participants today in the Brown study, in the
first wave of Korean immigrants into American, many faced discrimination but still managed to
assimilate into the country.
In Migration and the Korean Diaspora: A Comparative Description of Five Cases
(2012), by In-Jin Yoon, Yoon describes the main reasons for Korean immigration into America.
After the United States assisted during World War II, large waves of Korean women and
children began immigration to the United States after many U.S troops and Korean women were
romantically involved. Moreover, during the Korean War, many Koreans began migration to
foreign countries, but in a ‘refugee migration’, which includes marriage migration, but was
mostly Koreans feeling from danger due to the fear rampaging the state during the war (Yuh)
Many Koreans continued migration to America as the U.S further assisted Korea during the
Korean war, by becoming “Korea’s primary supplier of capital...as well as its largest overseas
market, helping Korea to build an economic infrastructure and the foundation for a free market
economy” (Yoon).
With the tremendous help offered by the United States, many Koreans took this
opportunity to move to the United States for another reason: globalization. Josh DeWind, in
Korean Development and Migration , found that soon after moving internationally, Korean
“overseas professionals and self-employed businessmen have become committed to their host
societies and begun a process of assimilation” (DeWind). This idea from DeWind’s study aligns
with that was Lee’s, who found that Korean Americans were more likely to be bicultural because
America encourages Koreans to assimilate rather than supporting a multinational country such as
China.
KOREAN ETHNIC IDENTITY AND ASSIMILATION LEVELS 4
Methods Section
The Korean Diasporic Experience: Measuring Ethnic Identity in the United States and
China by Richard M. Lee, found the ethnic identity of Koreans in the University of Austin,
Texas, an area with a relatively small Korean population. My study, the SHS study, aligns with
Lee’s study as we both sought to find the assimilation and ethnic identities of Koreans in a
certain area with similar research methods.
R.M Lee recruited 122 students at the University of Austin, Texas to take the survey and
offered $2 for their participation. All of the respondents completed a questionnaire that asked
questions from Jean Phinney’s 1992 MEIM survey along demographic questions such as: sex,
age, generation, language proficiency, p arents’ ethnicity, and personal ethnic identification.
Although ethnic identity measures only on dimension of a person’s cultural orientation, “The
MEIM measured three major dimensions of ethnic identity: identity achievement, affirmation
and belonging, and ethnic behaviors” (Lee 211). Throughout the paper, the researcher performed
many tests, such as principal-component analysis and examining psychometric equivalence
across cultures. With the information gathered from the tests, Lee eliminated components of the
1992 MEIM to reduce item bias, which may be caused by poor translation of the text. Because
the translations were from English to Korean, I did not have to consider this bias in my survey.
But, even after contacting the researcher, I was unable to receive information on the order of the
questions or the specific questions and could not use the exact same study as the researcher’s.
As a high school student with limited resources and minimal understanding of statistics, I
was unable to perform many of the tests my foundational source used. Moreover, because I
lacked information about the survey and the data from Lee’s survey, my SHS survey was
modeled around the information provided in the text along with Phinney’s 1992 MEIM. From
my total data, I received 42 usable data from Korean students in a standard high school.
Although I will be using the results from the SHS survey, the data will be compared to multiple
foundational sources with only the method based solely around Lee’s paper. In Lee’s work,
Korean Americans at the University of Austin, Texas averly identified themselves as bicultural
and with the five point likert scale used in my survey, I will be comparing my means and

KOREAN ETHNIC IDENTITY AND ASSIMILATION LEVELS 5
averages against Korean ethnic identification in Lee’s research. Moreover, because my research
is conducted in a neighborhood with a prominent Korean presence, I expect a difference in
assimilation between my research and Lee’s.
Setting: The SHS study was conducted on the campus of a high school located in a large,
suburban area. The high school, according to the 2015 fall enrollment, is comprised of 4,478
students: 38% Hispanic, 27% Asian, 27% White, and 4% African American. Located in a
suburban neighborhood with middle to upper middle class residents, the school represents a
standard high school with an ethnically diverse student population in California. My survey was
conducted in a contrived setting to mimic the research style of my foundational source.
Subjects : All of my participants were Korean students because my sources only interviewed and
studied Korean students’ ethnic identity. So, it is believed that the high school can be a proxy for
Koreans who have grown up in a fairly Korean dominated neighborhood. SHS was also chosen
because its location was cost and time effective than other locations especially because I
currently attend SHS.
Survey Design : Data for my research was gathered in a contrived setting for the target SHS
population of Koreans in SHS to mimic the setting from my foundational source (Richard M.
Lee). The data was collected between 7:25-8:20AM, when the majority of students entered
campus for Period 1. I conducted the research on my own and went out to the different school
gates in the morning. In order to find as many Koreans possible, I asked the ethnicity of asians
who were possibly Korean, and if they were, I introduced myself and my research situation, If
they agreed to participate, I emailed my survey (made on Google Forms) to their school email
for their convenience. In order to protect the identity of the subjects, the subjects will be
anonymous. The survey will be non-disguised and subjects will be aware of the data collection
process.
Study Design Proposal: After a couple weeks of thinking, my research question became: “Does
a larger Korean community affect the assimilation and ethnic identity of Koreans?”. My survey
is a mixture of the demographic questions modeled after Lee’s paper and Phinney’s 1992 MEIN
in order to ensure maximum connections with the foundational source and my paper. There were
two types of questions in the survey: Categorical (What is your gender?), and Quantitative ( I
KOREAN ETHNIC IDENTITY AND ASSIMILATION LEVELS 6
have spent time trying to find out more about my ethnic group, such as its history, traditions, and
customs). All of the questions were divided into three different areas: relationships between
heritage language and ethnic identity (How fluent are you in Korean?, In terms of ethnic group I
consider myself to be…), generational status and other percentages compared ( What is your
generational status?), and level of assimilation ( I have a strong sense of belonging to my own
ethnic group).
Proposed Setting of Data Collection: A stratified random sampling was chosen to ensure that all
Korean students of the SHS student population were equally likely to be selected in my SHS
study. The Korean population at SHS was subdivided based on entry into the school. We studied
the access of students to the school at different gate areas and discovered that students can be
exclusively distributed to a single gates of initial entry. The population was divided into 7
heterogenous stratas (the 7 gates):
Random Selection Of Subjects From Target Population: Random selection of subjects within
each strata was conducted. Originally, I set out to conduct a stratified selection of students, but
because the non-response rate was higher than expected, I accepted any Koreans. This degree of
self-selection is not expected to have impacted the responses from the survey takers. In the span
of two weeks, I went to all seven gates and asked Asians who seemed potentially Korean their
ethnicity to confirm if they were Korean. From there, they either accepted or denied my request
to take my survey. I attempted to ask all seemingly Koreans, as asking every other or every third
could decrease my sample population. After gathering data, the survey responses were directly
downloaded from Google Forms and into the spreadsheet, then analyzed in Excel spreadsheet.
Potential Sources of Bias/Proposed Mitigation Measures:
Three potential sources of bias and measures taken to deter students from being biased are:
● Selection Bias: Although the SHS study initially used stratified sampling, the low
response rates led me to abandon stratified sampling and use random sampling instead.
This type of self selection is not expected to have impacted my responses.
● Undercoverage Bias: Although I did receive a small number of respondents, to ensure
that each gate was properly represented, I matched the percentage of respondents from

KOREAN ETHNIC IDENTITY AND ASSIMILATION LEVELS 7
each gate to the number of students who entered the campus from that specific gate.
● Nonresponse bias: Because of low response rates, as mentioned above, I did use random
sampling rather than stratified. But, to ensure a proper representation of Koreans in the
SHS Study, I proportioned the students in the study to the number of students who
entered the school from specific areas.
Findings
Before discussing the findings, it’s important to note that there were some limitations in
my research. As mentioned in the Methods Section, my research process mimics that of Richard
M. Lee (who also used Phinney’s 1992 MEIM Survey) and because of that, comparing and
contrasting his data from mine would have been ideal. Unfortunately, his literature contained no
specific data and findings from his survey, making it difficult to compare my findings. I e-mailed
Lee a few times in hopes of receiving additional data, but he admitted to the difficulty in
acquiring the data from his research and was unable to provide more information.
With that in consideration: my findings are separated into three different groups which
allowed me to compare information primarily from Lee and Brown:
● Preliminary Analyses:
○ Findings 1: Generational Status and Gender (demographic information)
○ Findings 2: Language Fluency (demographic information)
● Survey:
○ Findings 3: Assimilation and Ethnic Identity (MEIM 1992 Survey)
Findings 1: Generational Status and Gender
Both Lee and I included questions about demographical questions about gender and
generational status in the paper with similar results.
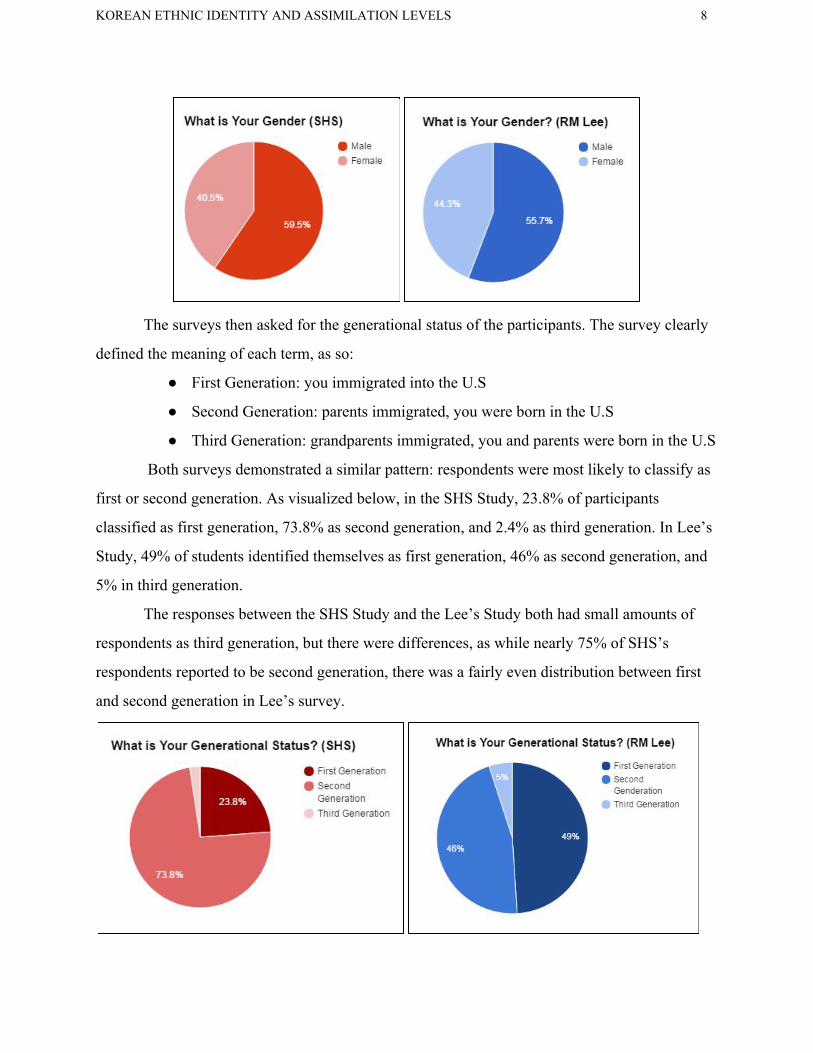
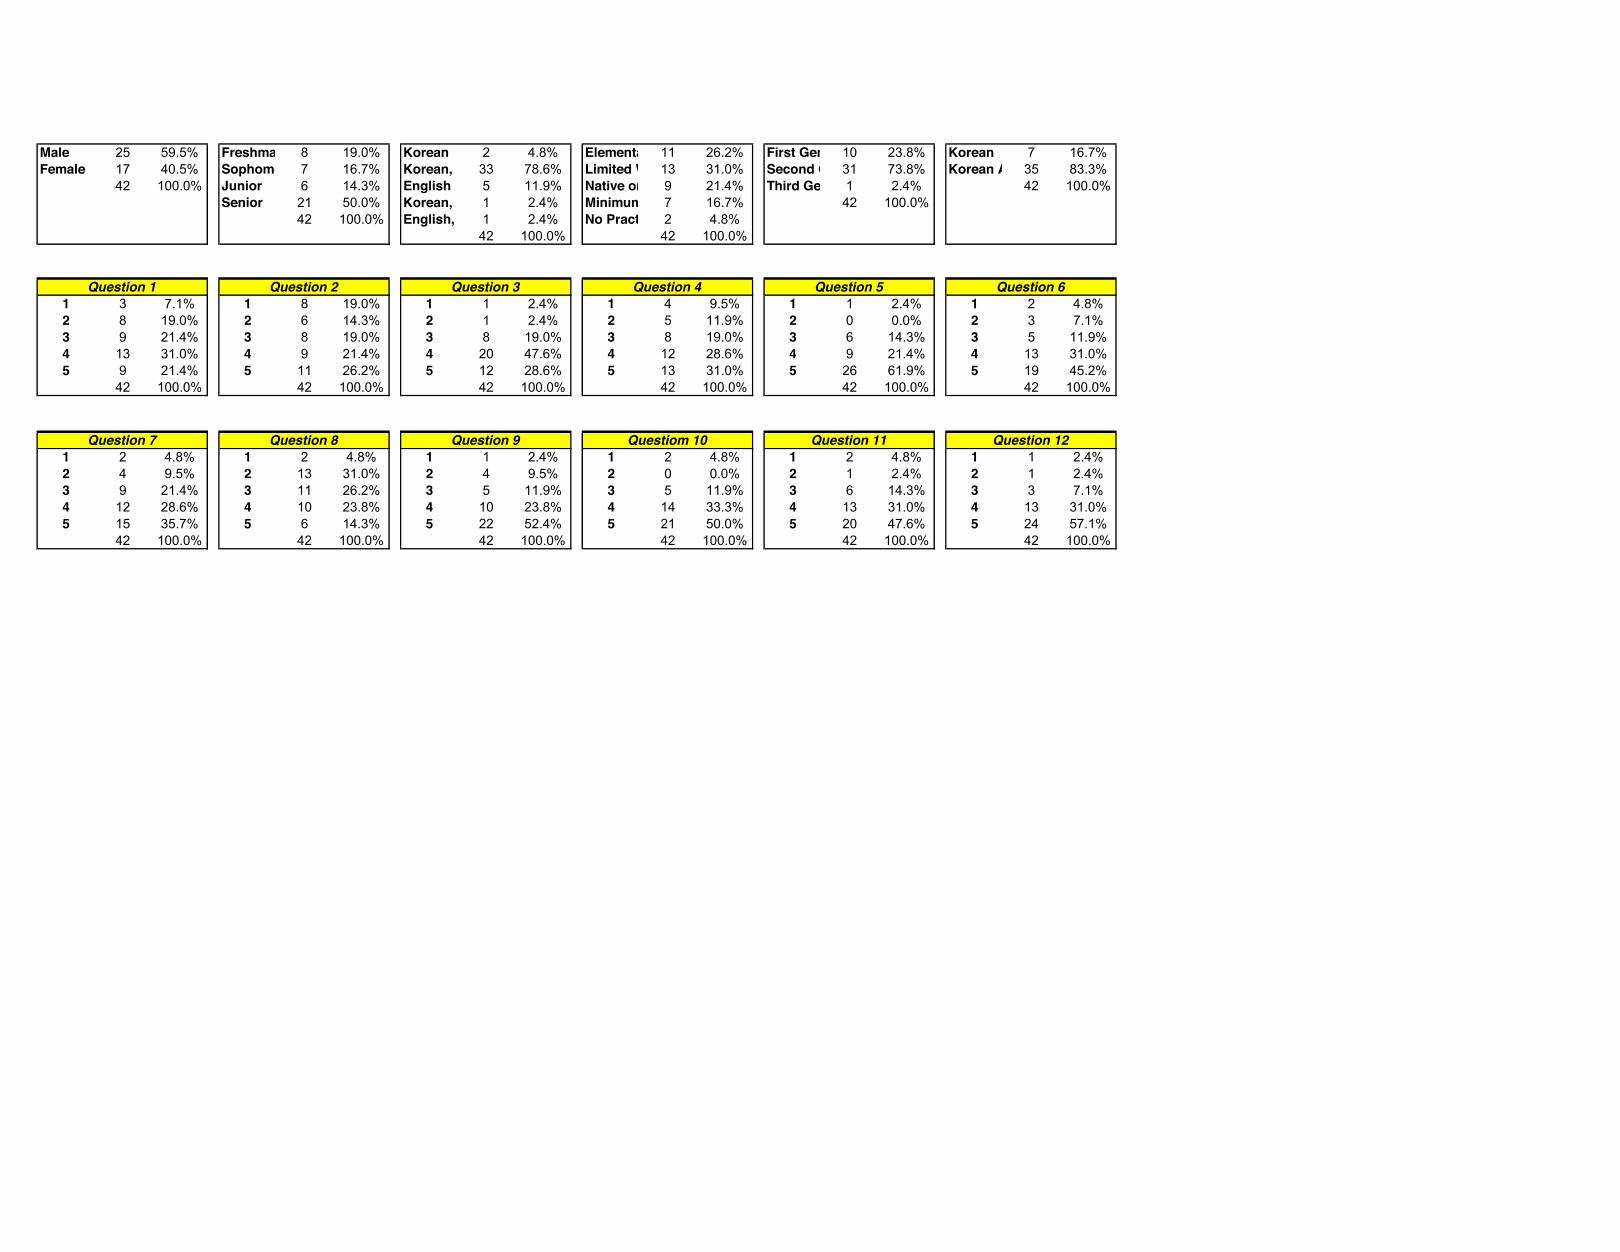
For gender, the respondents were predominantly male in both the SHS Study and the Lee
Study. In the SHS, 59.5% of respondents were male and 40.5% were female. In Lee’s Study,
55.7% were male and 44.4% were female, as shown below:
KOREAN ETHNIC IDENTITY AND ASSIMILATION LEVELS 8
The surveys then asked for the generational status of the participants. The survey clearly
defined the meaning of each term, as so:
● First Generation: you immigrated into the U.S
● Second Generation: parents immigrated, you were born in the U.S
● Third Generation: grandparents immigrated, you and parents were born in the U.S
Both surveys demonstrated a similar pattern: respondents were most likely to classify as
first or second generation. As visualized below, in the SHS Study, 23.8% of participants
classified as first generation, 73.8% as second generation, and 2.4% as third generation. In Lee’s
Study, 49% of students identified themselves as first generation, 46% as second generation, and
5% in third generation.
The responses between the SHS Study and the Lee’s Study both had small amounts of
respondents as third generation, but there were differences, as while nearly 75% of SHS’s
respondents reported to be second generation, there was a fairly even distribution between first
and second generation in Lee’s survey.

KOREAN ETHNIC IDENTITY AND ASSIMILATION LEVELS 9
Findings 2: Language Fluency
To determine the language fluency of the respondents, both Lee and I offered five answer
choices in the order of no fluency to complete fluency of Korean:
1. No Practical Fluency
2. Elementary Fluency
3. Limited Working Fluency
4. Professional Working Proficiency
5. Native or Bilingual Proficiency
In the SHS Study, more than 40% considered themselves to be at Professional Working
Proficiency and higher, with 4.8% at No Practical Fluency, 26.2% at Elementary Proficiency,
31% at Limited Working Proficiency, 21.4% at Professional Working Proficiency, and 16.7% at
Native or Bilingual Proficiency.
In the Lee Study, 2% considered themselves at No Practice Fluency, 21% at Elementary
Proficiency, 35% at Limited Working Proficiency, 29% at Professional Working Proficiency,
and 12% at Native or Bilingual Proficiency.
Between the two graphs, both have a small percentages of respondents in the No Practical
Fluency category and similar percentages in both elementary Proficiency and Limited Working
Proficiency. The SHS Study and Lee Study differ in the top two categories, as in the SHS study,
there were more students with Korean fluency levels at Native or Bilingual Proficiency than
Professional Working Proficiency, while in the Lee Study, the results were flipped.

KOREAN ETHNIC IDENTITY AND ASSIMILATION LEVELS 10
Findings 3: Assimilation and Ethnic Identity
In both the SHS Study and the Lee Study, Phinney’s 1992 MEIM Survey was utilized to
find the assimilation levels and ethnic identity of the survey participants. As aforementioned, in
this findings section, I did not have access to Lee’s specific questions list and his data from the
survey, making it impossible to compare findings directly.
For the first question in this finding both Lee and the SHS Study asked participants to
identify which ethnic group they consider themselves to be in: Korean, Korean American, or
Asian American.
In the SHS Study, 83% of students identified as Korean American, 16.7% as Korean, and
0% as Asian American, whereas in Lee’s Study, 53.6% of students identified themselves as
Korean American, 26.4% as Korean, and 20% as Asian American.
For Phinney’s 1992 MEIM Survey, the questions in Lee’s survey were scored on a
four-point Likert scale, while the SHS survey was based on a five-point Likert Scale. In both the
scales, 1 represented strongly disagree, while 4 (Lee’s Study) or 5 (SHS Study) represented
strongly agree.
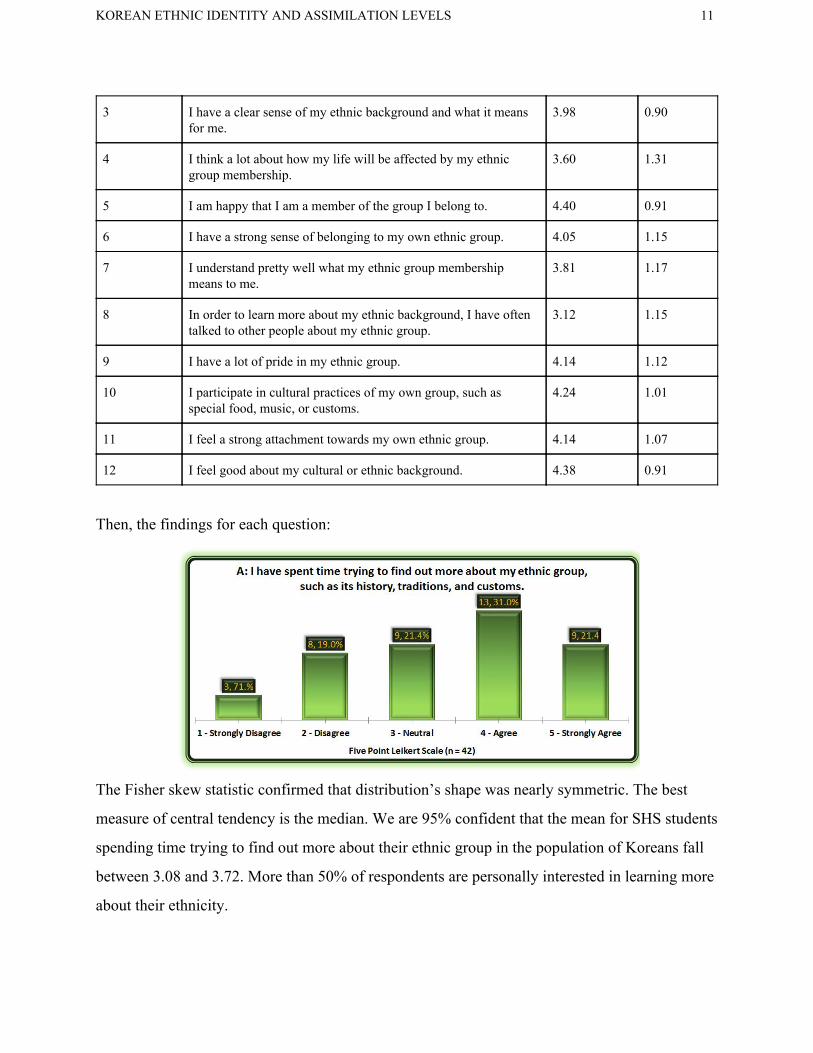
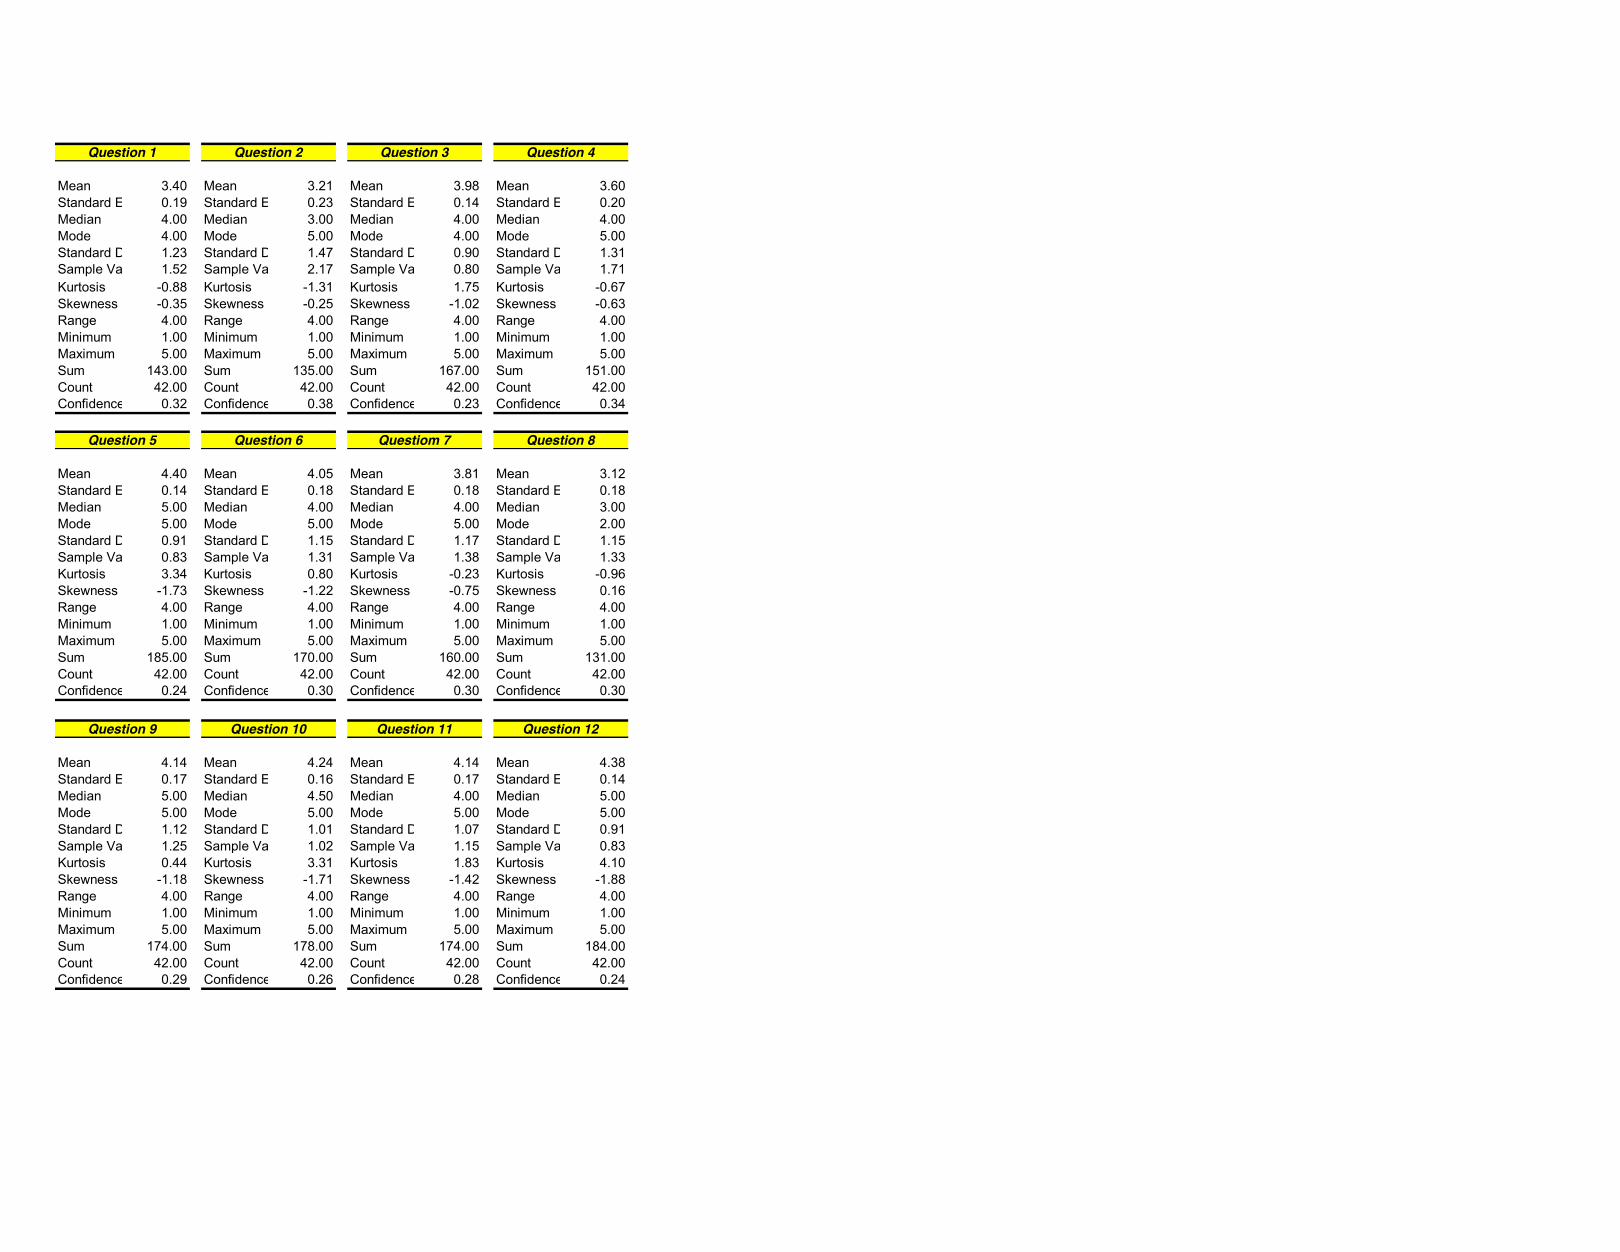
The Phinney’s 1992 MEIM contains the 12 questions below. In the next two columns are
the means and standard deviations from my survey:
# Question Mean Stnd Dev
1 I have spent time trying to find out more about my ethnic group, such as its history, traditions, and customs.
3.4 1.23
2 I am active in organizations or social groups that include mostly members of my own ethnic group
3.21 1.47
KOREAN ETHNIC IDENTITY AND ASSIMILATION LEVELS 11
3 I have a clear sense of my ethnic background and what it means for me.
3.98 0.90
4 I think a lot about how my life will be affected by my ethnic group membership.
3.60 1.31
5 I am happy that I am a member of the group I belong to. 4.40 0.91
6 I have a strong sense of belonging to my own ethnic group. 4.05 1.15
7 I understand pretty well what my ethnic group membership means to me.
3.81 1.17
8 In order to learn more about my ethnic background, I have often talked to other people about my ethnic group.
3.12 1.15
9 I have a lot of pride in my ethnic group. 4.14 1.12
10 I participate in cultural practices of my own group, such as special food, music, or customs.
4.24 1.01
11 I feel a strong attachment towards my own ethnic group. 4.14 1.07
12 I feel good about my cultural or ethnic background. 4.38 0.91
Then, the findings for each question:
The Fisher skew statistic confirmed that distribution’s shape was nearly symmetric. The best
measure of central tendency is the median. We are 95% confident that the mean for SHS students
spending time trying to find out more about their ethnic group in the population of Koreans fall
between 3.08 and 3.72. More than 50% of respondents are personally interested in learning more
about their ethnicity.
KOREAN ETHNIC IDENTITY AND ASSIMILATION LEVELS 12
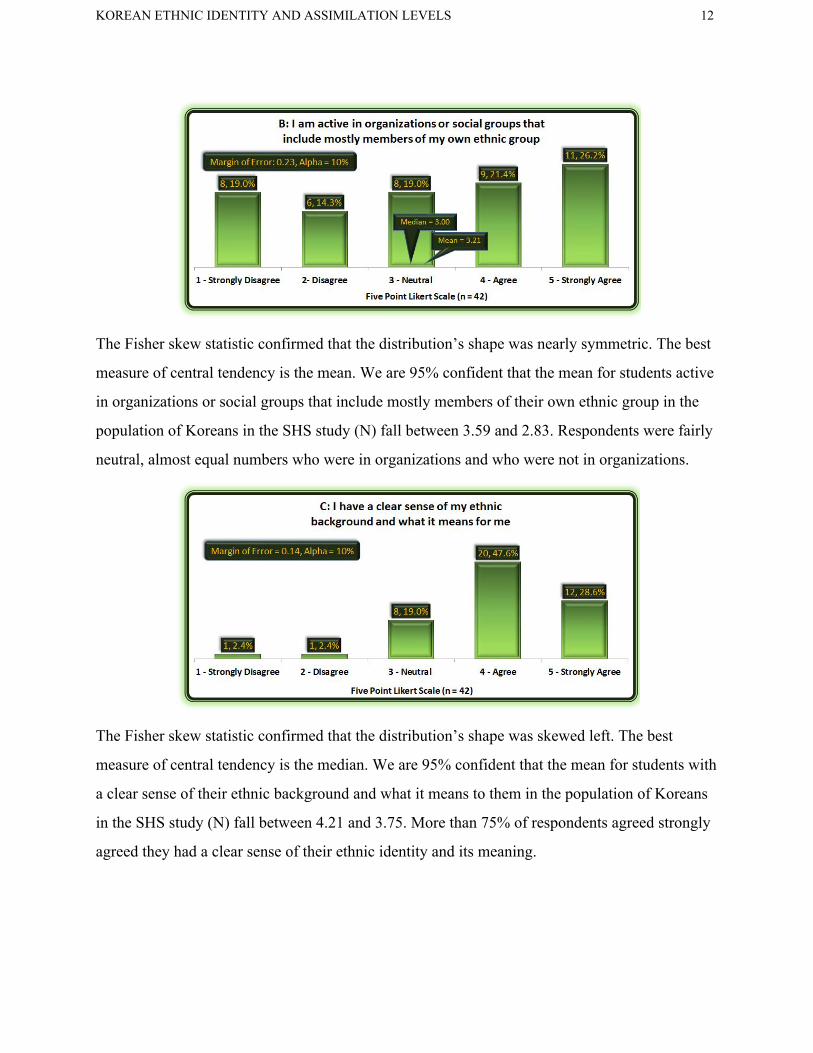
The Fisher skew statistic confirmed that the distribution’s shape was nearly symmetric. The best
measure of central tendency is the mean. We are 95% confident that the mean for students active
in organizations or social groups that include mostly members of their own ethnic group in the
population of Koreans in the SHS study (N) fall between 3.59 and 2.83. Respondents were fairly
neutral, almost equal numbers who were in organizations and who were not in organizations.
The Fisher skew statistic confirmed that the distribution’s shape was skewed left. The best
measure of central tendency is the median. We are 95% confident that the mean for students with
a clear sense of their ethnic background and what it means to them in the population of Koreans
in the SHS study (N) fall between 4.21 and 3.75. More than 75% of respondents agreed strongly
agreed they had a clear sense of their ethnic identity and its meaning.

KOREAN ETHNIC IDENTITY AND ASSIMILATION LEVELS 13
The Fisher skew statistic confirmed that the distribution’s shape was highly skewed left. The best
measure of central tendency is the median. We are 95% confident that the mean for students
thinking a lot about how their life will be affected by their ethnic group membership in the
population of Koreans in the SHS study (N)fall between 3.94 and 3.26. More than 50% thought
of being a Korean American/ Korean in their lives, whether it be professional, personal, or
social.
The Fisher skew statistic confirmed that the distribution’s shape was slightly skew left. The best
measure of central tendency is the median. We are 95% confident that the mean for students who
are happy that they are members of the group they belong to in the population of Koreans in the
SHS study (N) fall between 4.64 and 4.17. More than 75% of respondents were happy about
their ethnic group membership.
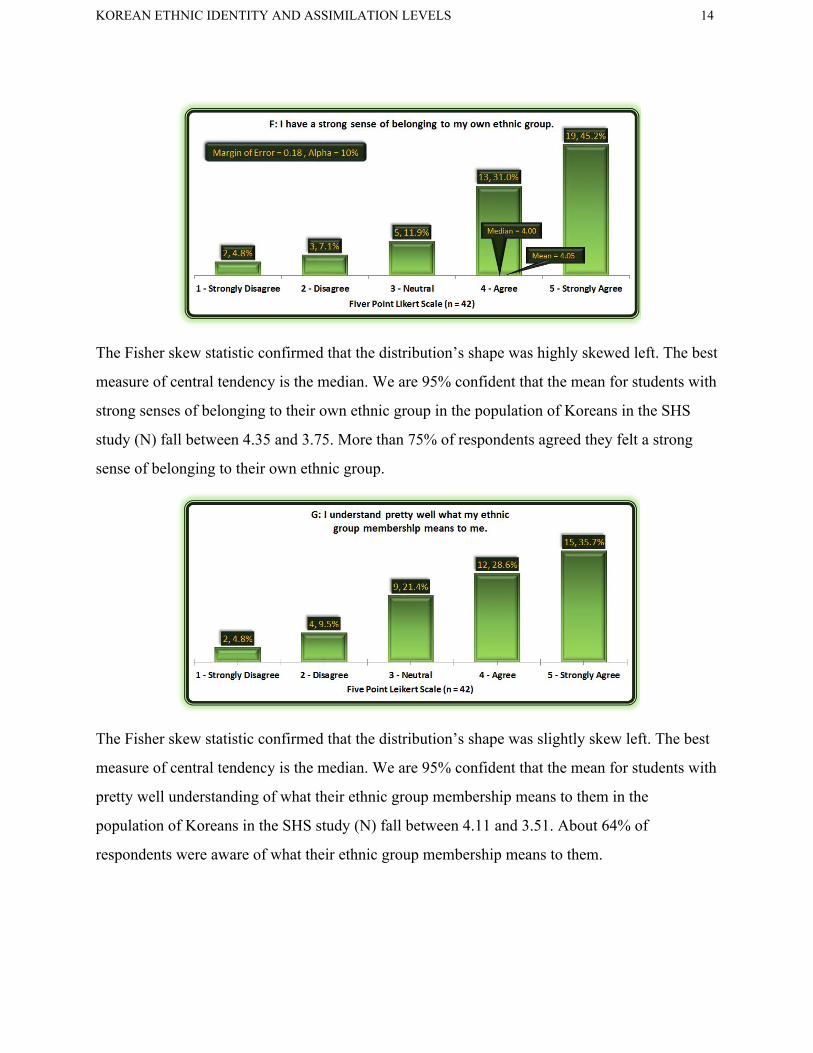
KOREAN ETHNIC IDENTITY AND ASSIMILATION LEVELS 14
The Fisher skew statistic confirmed that the distribution’s shape was highly skewed left. The best
measure of central tendency is the median. We are 95% confident that the mean for students with
strong senses of belonging to their own ethnic group in the population of Koreans in the SHS
study (N) fall between 4.35 and 3.75. More than 75% of respondents agreed they felt a strong
sense of belonging to their own ethnic group.
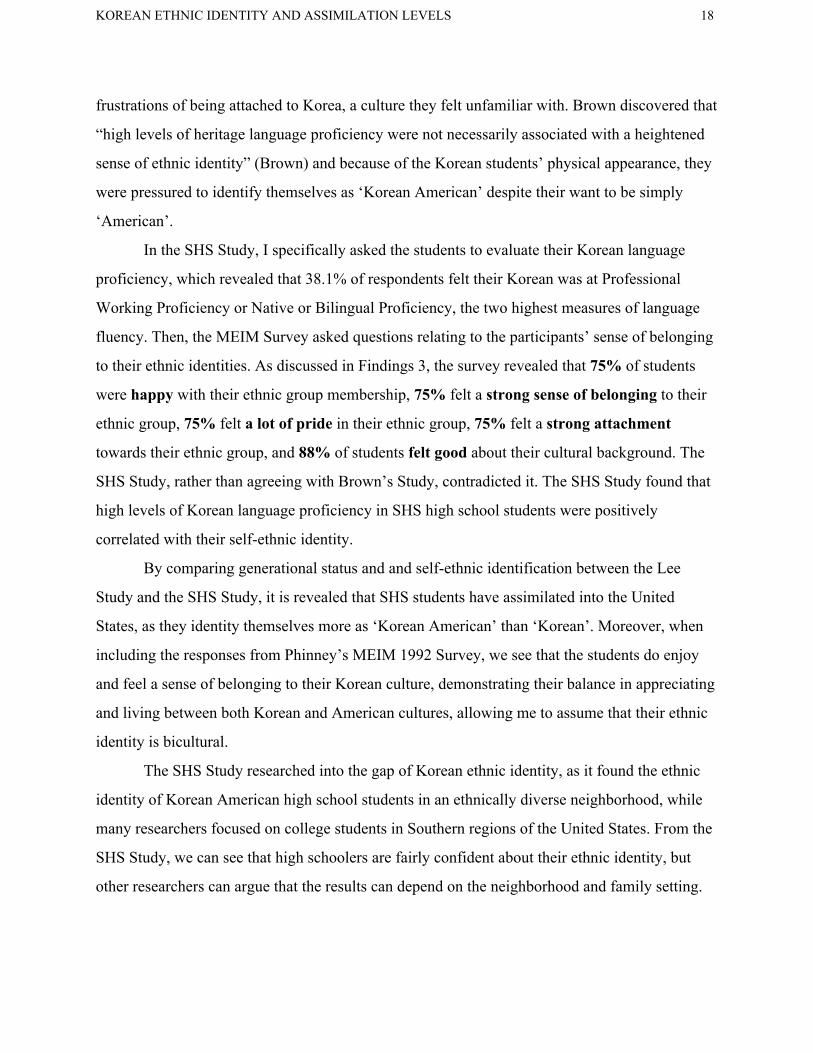
The Fisher skew statistic confirmed that the distribution’s shape was slightly skew left. The best
measure of central tendency is the median. We are 95% confident that the mean for students with
pretty well understanding of what their ethnic group membership means to them in the
population of Koreans in the SHS study (N) fall between 4.11 and 3.51. About 64% of
respondents were aware of what their ethnic group membership means to them.

KOREAN ETHNIC IDENTITY AND ASSIMILATION LEVELS 15
The Fisher skew statistic confirmed that the distribution’s shape was slightly skew right. The
best measure of central tendency is the median. We are 95% confident that the mean for students
who often talk to other people about their ethnic group to learn more about their ethnic
background in the population of Koreans in the SHS study (N) fall between 3.42 and 2.82.
Respondents were fairly neutral in talking to other people about their ethnic group to learn more
about their background.
The Fisher skew statistic confirmed that the distribution’s shape was highly skewed left. The best
measure of central tendency is the median. We are 95% confident that the mean for students with
a lot of pride in their ethnic group in the population of Koreans in the SHS study (N) fall
between 3.85 and 4.43. More than 75% of respondents agreed they have a lot of pride in their
group.

KOREAN ETHNIC IDENTITY AND ASSIMILATION LEVELS 16
The Fisher skew statistic confirmed that the distribution’s shape was highly skewed left. The best
measure of central tendency is the median. We are 95% confident that the mean for students who
participate in cultural practices of their own group in the population of Koreans in the SHS study
(N) fall between 3.98 and 4.50. More than 83% of respondents participate in cultural practices of
their own group.
The Fisher skew statistic confirmed that the distribution’s shape was highly skewed left. The best
measure of central tendency is the median. We are 95% confident that the mean for students who
feel strong attachments towards their own ethnic group in the population of Koreans in the SHS
study (N) fall between 3.86 and 4.42. More than 75% of respondents feel a strong attachment
towards their own ethnic group.

KOREAN ETHNIC IDENTITY AND ASSIMILATION LEVELS 17
The Fisher skew statistic confirmed that the distribution’s shape was highly skewed left. The best
measure of central tendency is the median. We are 95% confident that the mean for students who
feel good about their cultural or ethnic background in the population of Koreans in the SHS
study (N) fall between 4.41 and 4.62. More than 88% of respondents feel good about their
cultural or ethnic background.
Conclusion
Through comparing and analyzing results between my study and that of Richard M. Lee’s
and Clara Lee Brown’s, I determined that the ethnic identity and assimilation levels of high
school students in an ethnically diverse California high school was: bicultural. From Findings 1, more than 75% of students were second or third generation, meaning
the students were mostly likely surround by American culture throughout their lives. The effect
of American influence is also revealed in Findings 3 as almost 75% of students identified
themselves as bicultural by declaring their ethnic identity as “Korean American” rather than
“Korean”. In Lee’s work, 46% of students identified as second generation and 53.6% considered
themselves to be Korean American. Although these are not the only factors that determined the
ethnic identity of Koreans in Lee’s Study, it is easy to see that in the SHS Study, the students
were more inclined to assimilation in American through their generational status and self-ethnic
identification, allowing me to assume the respondents were bicultural.
Moreover, when focusing on the data from Phinney’s MEIM 1992, Brown’s concern of
forced dual identity was not apparent in my findings. In Brown’s study, her participants raised
KOREAN ETHNIC IDENTITY AND ASSIMILATION LEVELS 18
frustrations of being attached to Korea, a culture they felt unfamiliar with. Brown discovered that
“high levels of heritage language proficiency were not necessarily associated with a heightened
sense of ethnic identity” (Brown) and because of the Korean students’ physical appearance, they
were pressured to identify themselves as ‘Korean American’ despite their want to be simply
‘American’.
In the SHS Study, I specifically asked the students to evaluate their Korean language
proficiency, which revealed that 38.1% of respondents felt their Korean was at Professional
Working Proficiency or Native or Bilingual Proficiency, the two highest measures of language
fluency. Then, the MEIM Survey asked questions relating to the participants’ sense of belonging
to their ethnic identities. As discussed in Findings 3, the survey revealed that 75% of students
were happy with their ethnic group membership, 75% felt a strong sense of belonging to their
ethnic group, 75% felt a lot of pride in their ethnic group, 75% felt a strong attachment
towards their ethnic group, and 88% of students felt good about their cultural background. The
SHS Study, rather than agreeing with Brown’s Study, contradicted it. The SHS Study found that
high levels of Korean language proficiency in SHS high school students were positively
correlated with their self-ethnic identity.
By comparing generational status and and self-ethnic identification between the Lee
Study and the SHS Study, it is revealed that SHS students have assimilated into the United
States, as they identity themselves more as ‘Korean American’ than ‘Korean’. Moreover, when
including the responses from Phinney’s MEIM 1992 Survey, we see that the students do enjoy
and feel a sense of belonging to their Korean culture, demonstrating their balance in appreciating
and living between both Korean and American cultures, allowing me to assume that their ethnic
identity is bicultural.
The SHS Study researched into the gap of Korean ethnic identity, as it found the ethnic
identity of Korean American high school students in an ethnically diverse neighborhood, while
many researchers focused on college students in Southern regions of the United States. From the
SHS Study, we can see that high schoolers are fairly confident about their ethnic identity, but
other researchers can argue that the results can depend on the neighborhood and family setting.

KOREAN ETHNIC IDENTITY AND ASSIMILATION LEVELS 19
For me, this research was an eye-opening experience. As someone who was born in a
foreign country and later immigrated into the United States, I was often struggling with
identifying myself as bicultural, as I spent about 12 years of my life in the United States. From
this research, I realized that yes, I am bicultural and that bicultural does not mean taking halves
of each culture, but being able to completely appreciate and be a part of two different cultures.
Bibliography
Berry, John W. "Immigration, Acculturation and Adaptation." Applied Psychology: An
International Review 46.1 (1997): 5-68. Web. Brown, Clara Lee. "Heritage Language and Ethnic Identity: A Case Study of Korean-American
College Students." International Journal of Multicultural Education 11.1 (2009): 1-16. Print.
Chan, Sucheng. Asian Americans: An Interpretative History . Detroit: Gale Cengage Learning, 2008. Print.
DeWind, Josh, Eun Mee Kim, Ronald Skeldon, and In-Jin Yoon." Korean Development and
Migration." Journal of Ethnic and Migration Studies 38.3 (2012): 371-88. Print.
Han, J. D. "Korean Migration to North America: Some Prices That Matter." Canadian Studies in
Population 32.2 (2005): 155-76. Web. Hatch, J. A. “Doing qualitative research in education settings.” Albany, NY: State University of
New York Press (2002). Print. Khan, Saera R., and Alan J. Lambert. "Perceptions of Rational Discrimination: When Do People
Attempt to Justify Race-Based Prejudice?" Basic and Applied Social Psychology 23.1 (2001): 42-53. Web.
Kim-Ju, Greg M., and Ramsay Liem. "Ethnic self-awareness as a function of ethnic group status,
group composition, and ethnic identity orientation." Cultural Diversity & Ethnic Minority
Psychology 9.3 (2003): 289-302. Web. Kim, Kichung. "Affliction and Opportunity: Korean Literature in Diaspora, a Brief
Overview." Korean Studies 25.2 (2001): 261-76. Web.
Lafromboise, Teresa, Hardin L. Coleman, and Jennifer Gerton. "Psychological impact of biculturalism: Evidence and theory." Psychological Bulletin 114.3 (1993): 395-412. Web.
Lee, Hye-Kyung. "The Korean Diaspora and It's Impact on Korea's Development." Asia and
Pacific Migration Journal 14.1-2 (2005): 149-65. Print. Lee, J. S., Oxelson, E. "It's not my job: K-12 teacher attitudes toward students' heritage language
maintenance.” Bilingual Research Journal 30.2 (2006) 453-477. Print. Lee, Richard M., Toni Falbo, Hyun Sim Doh, and Seong Yeon Park. "The Korean Diasporic
Experience: Measuring Ethnic Identity in the United States and China." Cultural
Diversity and Ethnic Minority Psychology 7.3 (2001): 207-16. Print.
Mylonas, Harris. "The Politics of Diaspora Management in the Republic of Korea." The Asian
Institute for Policy Studies 81 (2013): 1-12. Print. Park, H. O. "Repetition, Comparability, and Indeterminable Nation: Korean Migrants in the
1920s and 1990s." Boundary 2 32.2 (2005): 227-51. Web.
Phinney, J. S. “The multigroup ethnic identity measure: A new scale for use with diverse groups.” Journal of Adolescent Research 7 (1992):156-176. Print.
Phinney, Jean S., and Linda L. Alipuria. "At the Interface of Cultures: Multiethnic/Multiracial
High School and College Students." The Journal of Social Psychology 136.2 (1996): 139-58. Web.
Phinney, J. S., I. Romero, M. Nava, and D. Huang. "The role of language, parents, and peers in
ethnic identity among adolescents in immigrant families." Journal of Youth and
Adolescence 30.2 (n.d.): 135-53. Web. Seo, Seunghyun. "A Comparative Study of the Korean, German, and Polish Diasporas in the
Russian Far East & Central Asia and the Results of Repatriation to Their Homelands." Asian Social Science 6.4 (2010): 61-69. Web.
Tse, Lucy. "Resisting and Reversing Language Shift: Heritage-Language Resilience among U.S.
Native Biliterates." Harvard Educational Review 71.4 (2001): 676-709. Web. U.S. Bureau of the Census. Statistical abstract of the United States: 2010 Washington, DC: U.S.
Government Printing Office. Yoon, In-Jin. "Migration and the Korean Diaspora: A Comparative Description of Five Cases."
Journal of Ethnic and Migration Studies 38.3 (2012): 413-35. Print.
Yoon, In-Jin. "Understanding the Korean Diaspora from Comparative Perspectives." Asia
Culture Forum (2006): 1-21. Print.
You, Byeong-Keun. "Children Negotiating Korean American Ethnic Identity Through Their Heritage Language." Bilingual Research Journal 29.3 (2005): 711-21. Web.
Yuh, Ji-Yeon. "Moved by War: Migration, Diaspora, and the Korean War." Journal of Asian
American Studies 8.3 (2005): 277-91. Web.


Research Analyst: ELStudy: Korean Ethnic Identity and AssimilationSurvey Design: Stratefied Random SampleSample Size: n = 42Inventory of Survery Questions
1. Which gate did you come through (in the morning)?2. What time did you enter school?3. What is your gender?4. What grade are you in?5. Languages spoken at home (check all that apply):6. How fluent are you in Korean?7. What is your generational status?8. In terms of ethnic group, I consider myself to be…
Q1. I have spent time trying to find out more about my ethnic group, such as its history, traditions, and customs.Q2. I am active in organizations or social groups that include mostly members of my own ethnic group.Q3. I have a clear sense of my ethnic background and what it means for me.Q4. I think a lot about how my life will be affected by my ethnic group membership.Q5. I am happy that I am a member of the group I belong to.Q6. I have a strong sense of belonging to my own ethnic group.Q7. I understand pretty well what my ethnic group membership means to me.Q8. In order to learn more about my ethnic background, I have often talked to other people about my ethnic group.Q9. I have a lot of pride in my ethnic group.Q10. I participate in cultural practices of my own group, such as special food, music, or customs.Q11. I feel a strong attachment towards my own ethnic group.Q12. I feel good about my cultural or ethnic background.


Research Analyst: ELStudy: Korean Ethnic Identity and AssimilationSurvey Design: Stratefied Random SampleSample Size: n = 42
Timestamp Email Address Number assigned: Which gate did you come through (in the morning)What time did you enter school?What is your gender? What grade are you in? Languages spoken at home (check all that apply):1/23/2017 7:59:24 [email protected] 14 Flagpole 7:22:00 AM Female Senior Korean, English1/25/2017 8:57:03 [email protected] 34 Flagpole 8:18:00 AM Male Sophomore English1/25/2017 9:35:52 [email protected] 35 Flagpole 8:10:00 AM Male Junior English1/25/2017 12:19:27 [email protected] 43 Flagpole 7:10:00 AM Male Senior Korean, English1/25/2017 12:26:22 [email protected] 49 Flagpole 7:30:00 AM Male Senior Korean, English1/25/2017 14:53:58 [email protected] 39 Flagpole 7:30:00 AM Female Freshman Korean, English1/25/2017 23:55:25 [email protected] 26 Flagpole 8:20:00 AM Female Senior Korean, English1/26/2017 19:30:19 [email protected] 31 Flagpole 7:15:00 AM Female Freshman English1/27/2017 14:31:16 [email protected] 46 Flagpole 7:05:00 AM Male Sophomore English, Other1/19/2017 8:39:00 [email protected] 6 Hiawatha Male Senior Korean, English1/23/2017 9:22:21 [email protected] 15 Hiawatha 7:55:00 AM Male Senior Korean, English1/24/2017 8:28:45 [email protected] 22 Hiawatha 7:15:00 AM Female Senior Korean, English1/25/2017 12:27:02 [email protected] 51 J Gate 8:20:00 AM Female Senior Korean, English1/25/2017 12:32:19 [email protected] 50 J Gate 8:20:00 AM Male Senior Korean, English1/20/2017 16:38:52 [email protected] 8 Kingsbury Gate 8:15:00 AM Female Senior Korean, English1/24/2017 22:03:55 [email protected] 36 Kingsbury Gate 8:00:00 AM Female Freshman Korean, English1/25/2017 10:11:09 [email protected] 23 Kingsbury Gate 6:50:00 AM Male Senior Korean, English1/25/2017 11:15:32 [email protected] 40 Kingsbury Gate 7:45:00 AM Female Junior Korean, English1/25/2017 11:52:31 [email protected] 32 Kingsbury Gate 7:15:00 AM Male Freshman Korean, English1/27/2017 21:16:04 [email protected] 48 Kingsbury Gate 8:15:00 AM Male Junior Korean, English1/23/2017 9:41:16 [email protected] 21 Kingsbury Gate 7:10:00 AM Female Senior Korean, English1/24/2017 18:18:57 [email protected] 38 Kingsbury Gate 9:01:00 AM Male Freshman English1/23/2017 8:31:28 [email protected] 6 Surface Road East (C Building) 8:00:00 AM Male Senior Korean, English1/23/2017 20:22:20 [email protected] 20 Surface Road East (C Building) 8:05:00 AM Male Sophomore Korean1/24/2017 9:40:12 [email protected] 19 Surface Road East (C Building) 7:50:00 AM Male Senior Korean1/25/2017 9:56:39 [email protected] 37 Surface Road East (C Building) 8:00:00 AM Male Freshman Korean, English1/25/2017 9:40:38 [email protected] 29 Surface Road East (C Building) 8:25:00 AM Female Senior Korean, English1/31/2017 14:16:13 [email protected] 13 Surface Road East (C Building) 8:00:00 AM Female Senior Korean, English1/18/2017 11:15:19 [email protected] 2 Surface Road West (Next to M building & Baseball field) Female Freshman Korean, English1/18/2017 11:40:55 [email protected] 4 Surface Road West (Next to M building & Baseball field) Male Senior Korean, English1/20/2017 17:29:56 [email protected] 9 Zelzah Parking 7:20:00 AM Male Junior Korean, English1/23/2017 7:43:27 [email protected] 11 Zelzah Parking 7:35:00 AM Male Junior Korean, English1/23/2017 8:37:32 [email protected] 10 Zelzah Parking 7:30:00 AM Male Junior Korean, English1/23/2017 9:04:35 [email protected] 18 Zelzah Parking 7:55:00 AM Female Sophomore Korean, English, Other1/23/2017 10:24:01 [email protected] 16 Zelzah Parking 7:50:00 AM Male Sophomore Korean, English1/23/2017 12:23:48 [email protected] 12 Zelzah Parking 7:22:00 AM Female Senior Korean, English1/24/2017 13:54:48 [email protected] 24 Zelzah Parking 8:00:00 AM Male Senior Korean, English1/24/2017 17:30:39 [email protected] 30 Zelzah Parking 9:14:00 AM Male Senior Korean, English1/24/2017 23:29:34 [email protected] 17 Zelzah Parking 8:18:00 AM Male Sophomore Korean, English1/25/2017 7:27:28 [email protected] 27 Zelzah Parking 7:10:00 AM Male Sophomore English1/25/2017 10:45:24 [email protected] 28 Zelzah Parking 8:10:00 AM Female Freshman Korean, English1/27/2017 13:36:20 [email protected] 45 Zelzah Parking 7:10:00 AM Female Senior Korean, English
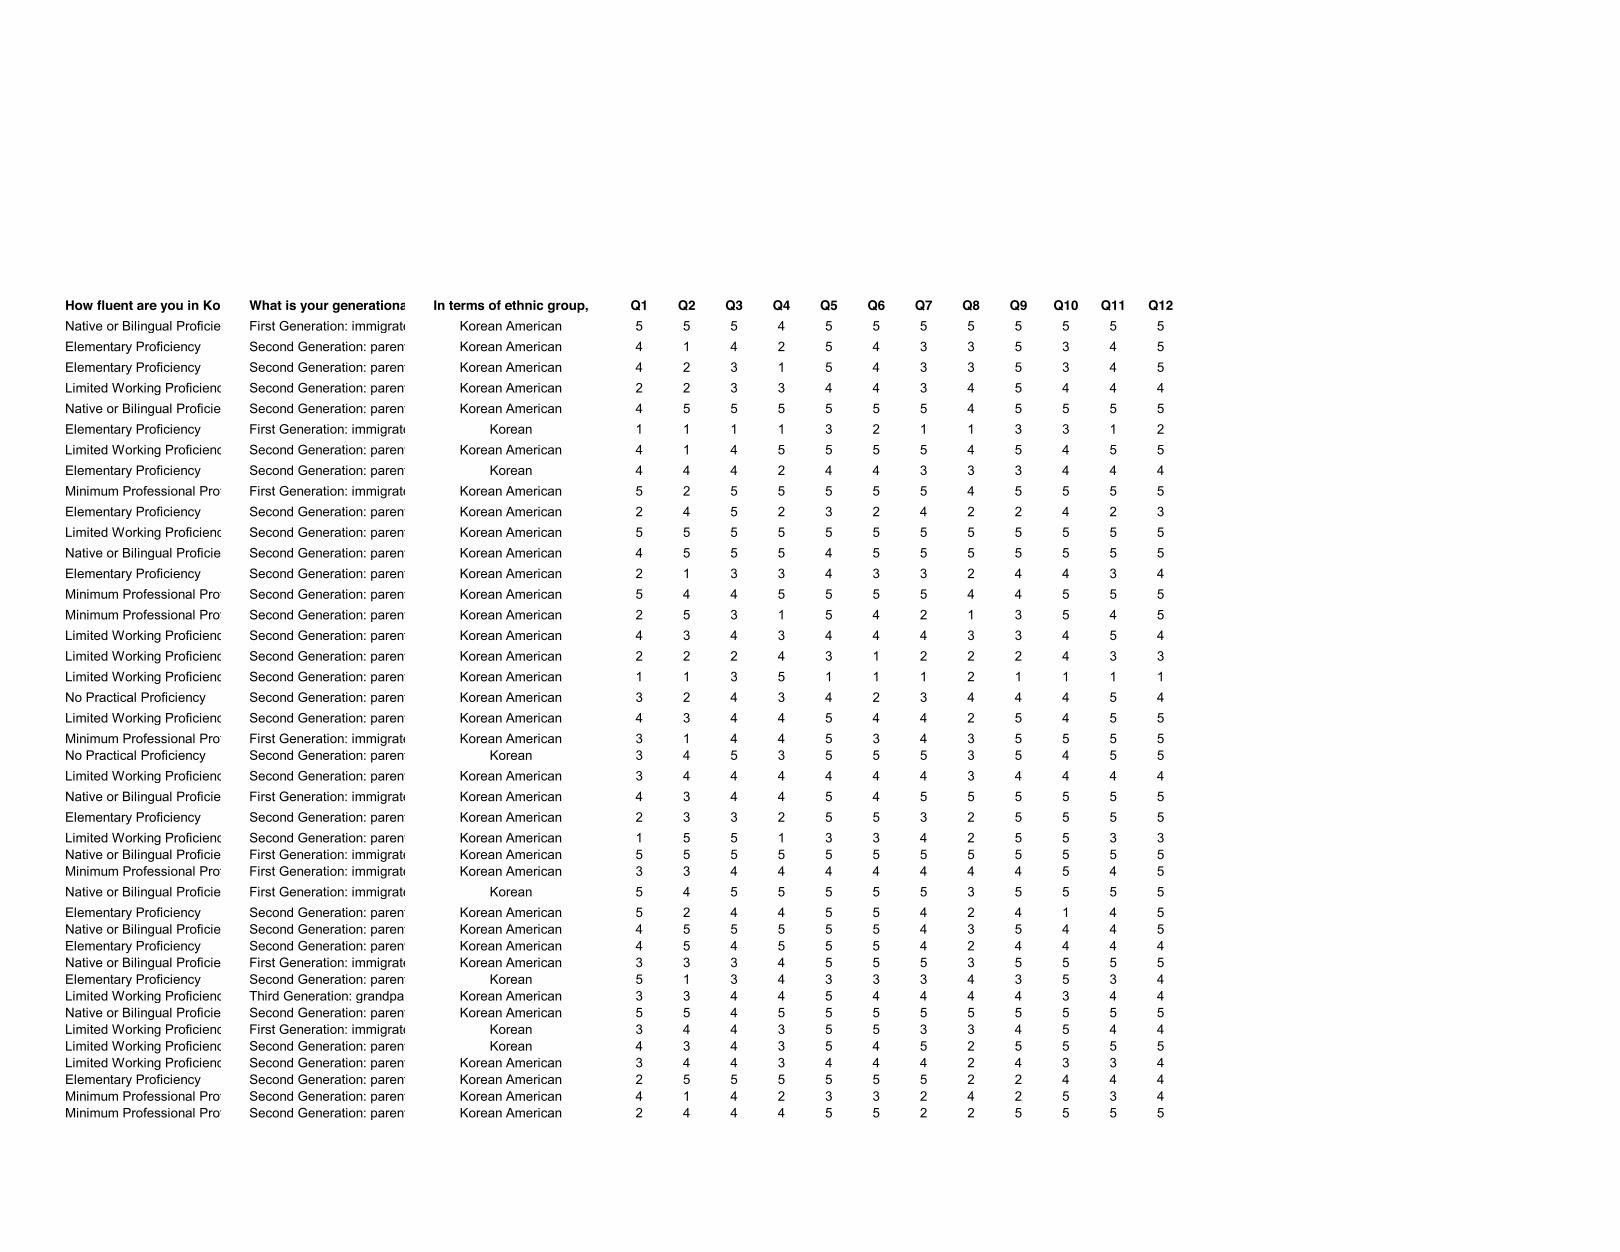
How fluent are you in Korean? What is your generational status? In terms of ethnic group, I consider myself to be... Q1 Q2 Q3 Q4 Q5 Q6 Q7 Q8 Q9 Q10 Q11 Q12Native or Bilingual Proficiency First Generation: immigrated into the USA Korean American 5 5 5 4 5 5 5 5 5 5 5 5Elementary Proficiency Second Generation: parents immigrated, you were born in the US Korean American 4 1 4 2 5 4 3 3 5 3 4 5Elementary Proficiency Second Generation: parents immigrated, you were born in the US Korean American 4 2 3 1 5 4 3 3 5 3 4 5Limited Working Proficiency Second Generation: parents immigrated, you were born in the US Korean American 2 2 3 3 4 4 3 4 5 4 4 4Native or Bilingual Proficiency Second Generation: parents immigrated, you were born in the US Korean American 4 5 5 5 5 5 5 4 5 5 5 5Elementary Proficiency First Generation: immigrated into the USA Korean 1 1 1 1 3 2 1 1 3 3 1 2Limited Working Proficiency Second Generation: parents immigrated, you were born in the US Korean American 4 1 4 5 5 5 5 4 5 4 5 5Elementary Proficiency Second Generation: parents immigrated, you were born in the US Korean 4 4 4 2 4 4 3 3 3 4 4 4Minimum Professional Proficiency First Generation: immigrated into the USA Korean American 5 2 5 5 5 5 5 4 5 5 5 5Elementary Proficiency Second Generation: parents immigrated, you were born in the US Korean American 2 4 5 2 3 2 4 2 2 4 2 3Limited Working Proficiency Second Generation: parents immigrated, you were born in the US Korean American 5 5 5 5 5 5 5 5 5 5 5 5Native or Bilingual Proficiency Second Generation: parents immigrated, you were born in the US Korean American 4 5 5 5 4 5 5 5 5 5 5 5Elementary Proficiency Second Generation: parents immigrated, you were born in the US Korean American 2 1 3 3 4 3 3 2 4 4 3 4Minimum Professional Proficiency Second Generation: parents immigrated, you were born in the US Korean American 5 4 4 5 5 5 5 4 4 5 5 5Minimum Professional Proficiency Second Generation: parents immigrated, you were born in the US Korean American 2 5 3 1 5 4 2 1 3 5 4 5Limited Working Proficiency Second Generation: parents immigrated, you were born in the US Korean American 4 3 4 3 4 4 4 3 3 4 5 4Limited Working Proficiency Second Generation: parents immigrated, you were born in the US Korean American 2 2 2 4 3 1 2 2 2 4 3 3Limited Working Proficiency Second Generation: parents immigrated, you were born in the US Korean American 1 1 3 5 1 1 1 2 1 1 1 1No Practical Proficiency Second Generation: parents immigrated, you were born in the US Korean American 3 2 4 3 4 2 3 4 4 4 5 4Limited Working Proficiency Second Generation: parents immigrated, you were born in the US Korean American 4 3 4 4 5 4 4 2 5 4 5 5Minimum Professional Proficiency First Generation: immigrated into the USA Korean American 3 1 4 4 5 3 4 3 5 5 5 5No Practical Proficiency Second Generation: parents immigrated, you were born in the US Korean 3 4 5 3 5 5 5 3 5 4 5 5Limited Working Proficiency Second Generation: parents immigrated, you were born in the US Korean American 3 4 4 4 4 4 4 3 4 4 4 4Native or Bilingual Proficiency First Generation: immigrated into the USA Korean American 4 3 4 4 5 4 5 5 5 5 5 5Elementary Proficiency Second Generation: parents immigrated, you were born in the US Korean American 2 3 3 2 5 5 3 2 5 5 5 5Limited Working Proficiency Second Generation: parents immigrated, you were born in the US Korean American 1 5 5 1 3 3 4 2 5 5 3 3Native or Bilingual Proficiency First Generation: immigrated into the USA Korean American 5 5 5 5 5 5 5 5 5 5 5 5Minimum Professional Proficiency First Generation: immigrated into the USA Korean American 3 3 4 4 4 4 4 4 4 5 4 5Native or Bilingual Proficiency First Generation: immigrated into the USA Korean 5 4 5 5 5 5 5 3 5 5 5 5Elementary Proficiency Second Generation: parents immigrated, you were born in the US Korean American 5 2 4 4 5 5 4 2 4 1 4 5Native or Bilingual Proficiency Second Generation: parents immigrated, you were born in the US Korean American 4 5 5 5 5 5 4 3 5 4 4 5Elementary Proficiency Second Generation: parents immigrated, you were born in the US Korean American 4 5 4 5 5 5 4 2 4 4 4 4Native or Bilingual Proficiency First Generation: immigrated into the USA Korean American 3 3 3 4 5 5 5 3 5 5 5 5Elementary Proficiency Second Generation: parents immigrated, you were born in the US Korean 5 1 3 4 3 3 3 4 3 5 3 4Limited Working Proficiency Third Generation: grandparents immigrated, you and parents were born in the US Korean American 3 3 4 4 5 4 4 4 4 3 4 4Native or Bilingual Proficiency Second Generation: parents immigrated, you were born in the US Korean American 5 5 4 5 5 5 5 5 5 5 5 5Limited Working Proficiency First Generation: immigrated into the USA Korean 3 4 4 3 5 5 3 3 4 5 4 4Limited Working Proficiency Second Generation: parents immigrated, you were born in the US Korean 4 3 4 3 5 4 5 2 5 5 5 5Limited Working Proficiency Second Generation: parents immigrated, you were born in the US Korean American 3 4 4 3 4 4 4 2 4 3 3 4Elementary Proficiency Second Generation: parents immigrated, you were born in the US Korean American 2 5 5 5 5 5 5 2 2 4 4 4Minimum Professional Proficiency Second Generation: parents immigrated, you were born in the US Korean American 4 1 4 2 3 3 2 4 2 5 3 4Minimum Professional Proficiency Second Generation: parents immigrated, you were born in the US Korean American 2 4 4 4 5 5 2 2 5 5 5 5

Mean 3.40 Mean 3.21 Mean 3.98 Mean 3.60Standard Error 0.19 Standard Error 0.23 Standard Error 0.14 Standard Error 0.20Median 4.00 Median 3.00 Median 4.00 Median 4.00Mode 4.00 Mode 5.00 Mode 4.00 Mode 5.00Standard Deviation1.23 Standard Deviation1.47 Standard Deviation0.90 Standard Deviation1.31Sample Variance 1.52 Sample Variance 2.17 Sample Variance 0.80 Sample Variance 1.71Kurtosis -0.88 Kurtosis -1.31 Kurtosis 1.75 Kurtosis -0.67Skewness -0.35 Skewness -0.25 Skewness -1.02 Skewness -0.63Range 4.00 Range 4.00 Range 4.00 Range 4.00Minimum 1.00 Minimum 1.00 Minimum 1.00 Minimum 1.00Maximum 5.00 Maximum 5.00 Maximum 5.00 Maximum 5.00Sum 143.00 Sum 135.00 Sum 167.00 Sum 151.00Count 42.00 Count 42.00 Count 42.00 Count 42.00Confidence Level(90.0%)0.32 Confidence Level(90.0%)0.38 Confidence Level(90.0%)0.23 Confidence Level(90.0%)0.34
Mean 4.40 Mean 4.05 Mean 3.81 Mean 3.12Standard Error 0.14 Standard Error 0.18 Standard Error 0.18 Standard Error 0.18Median 5.00 Median 4.00 Median 4.00 Median 3.00Mode 5.00 Mode 5.00 Mode 5.00 Mode 2.00Standard Deviation0.91 Standard Deviation1.15 Standard Deviation1.17 Standard Deviation1.15Sample Variance 0.83 Sample Variance 1.31 Sample Variance 1.38 Sample Variance 1.33Kurtosis 3.34 Kurtosis 0.80 Kurtosis -0.23 Kurtosis -0.96Skewness -1.73 Skewness -1.22 Skewness -0.75 Skewness 0.16Range 4.00 Range 4.00 Range 4.00 Range 4.00Minimum 1.00 Minimum 1.00 Minimum 1.00 Minimum 1.00Maximum 5.00 Maximum 5.00 Maximum 5.00 Maximum 5.00Sum 185.00 Sum 170.00 Sum 160.00 Sum 131.00Count 42.00 Count 42.00 Count 42.00 Count 42.00Confidence Level(90.0%)0.24 Confidence Level(90.0%)0.30 Confidence Level(90.0%)0.30 Confidence Level(90.0%)0.30
Mean 4.14 Mean 4.24 Mean 4.14 Mean 4.38Standard Error 0.17 Standard Error 0.16 Standard Error 0.17 Standard Error 0.14Median 5.00 Median 4.50 Median 4.00 Median 5.00Mode 5.00 Mode 5.00 Mode 5.00 Mode 5.00Standard Deviation1.12 Standard Deviation1.01 Standard Deviation1.07 Standard Deviation0.91Sample Variance 1.25 Sample Variance 1.02 Sample Variance 1.15 Sample Variance 0.83Kurtosis 0.44 Kurtosis 3.31 Kurtosis 1.83 Kurtosis 4.10Skewness -1.18 Skewness -1.71 Skewness -1.42 Skewness -1.88Range 4.00 Range 4.00 Range 4.00 Range 4.00Minimum 1.00 Minimum 1.00 Minimum 1.00 Minimum 1.00Maximum 5.00 Maximum 5.00 Maximum 5.00 Maximum 5.00Sum 174.00 Sum 178.00 Sum 174.00 Sum 184.00Count 42.00 Count 42.00 Count 42.00 Count 42.00Confidence Level(90.0%)0.29 Confidence Level(90.0%)0.26 Confidence Level(90.0%)0.28 Confidence Level(90.0%)0.24
Question 1 Question 2 Question 3 Question 4
Question 9 Question 10 Question 11 Question 12
Question 5 Question 6 Questiom 7 Question 8
Male 25 59.5% Freshman 8 19.0% Korean 2 4.8% Elementary Proficiency11 26.2% First Generation: immigrated into the USA10 23.8% Korean 7 16.7%Female 17 40.5% Sophomore 7 16.7% Korean, English33 78.6% Limited Working Proficiency13 31.0% Second Generation: parents immigrated, you were born in the US31 73.8% Korean American35 83.3%
42 100.0% Junior 6 14.3% English 5 11.9% Native or Bilingual Proficiency9 21.4% Third Generation: grandparents immigrated, you and parents were born in the US1 2.4% 42 100.0%Senior 21 50.0% Korean, English, Other1 2.4% Minimum Professional Proficiency7 16.7% 42 100.0%
42 100.0% English, Other1 2.4% No Practical Proficiency2 4.8%42 100.0% 42 100.0%
1 3 7.1% 1 8 19.0% 1 1 2.4% 1 4 9.5% 1 1 2.4% 1 2 4.8%2 8 19.0% 2 6 14.3% 2 1 2.4% 2 5 11.9% 2 0 0.0% 2 3 7.1%3 9 21.4% 3 8 19.0% 3 8 19.0% 3 8 19.0% 3 6 14.3% 3 5 11.9%4 13 31.0% 4 9 21.4% 4 20 47.6% 4 12 28.6% 4 9 21.4% 4 13 31.0%5 9 21.4% 5 11 26.2% 5 12 28.6% 5 13 31.0% 5 26 61.9% 5 19 45.2%
42 100.0% 42 100.0% 42 100.0% 42 100.0% 42 100.0% 42 100.0%
1 2 4.8% 1 2 4.8% 1 1 2.4% 1 2 4.8% 1 2 4.8% 1 1 2.4%2 4 9.5% 2 13 31.0% 2 4 9.5% 2 0 0.0% 2 1 2.4% 2 1 2.4%3 9 21.4% 3 11 26.2% 3 5 11.9% 3 5 11.9% 3 6 14.3% 3 3 7.1%4 12 28.6% 4 10 23.8% 4 10 23.8% 4 14 33.3% 4 13 31.0% 4 13 31.0%5 15 35.7% 5 6 14.3% 5 22 52.4% 5 21 50.0% 5 20 47.6% 5 24 57.1%
42 100.0% 42 100.0% 42 100.0% 42 100.0% 42 100.0% 42 100.0%
Question 1 Question 2 Question 6Question 3 Question 5Question 4
Question 12Question 8Question 7 Question 9 Questiom 10 Question 11