kordsa investor presentation
TRANSCRIPT
Kordsa Investor Presentation Nov, 2019
Disclaimer
External
The information and opinions contained in this
document have been compiled by KORDSA Teknik
Tekstil Anonim Şirketi (the “Company”) from sources
believed to be reliable and in good faith, but no
representation or warranty, expressed or implied, is
made as to their accuracy, completeness or
correctness. No undue reliance may be placed for any
purposes whatsoever on the information contained in
this presentation or on its completeness, accuracy or
fairness. This document may contain forward-looking
statements by using such words as "may", "will",
"expect", "believe", "plan" and other similar
terminology that reflect the Company management’s
current views, expectations, assumptions and
forecasts with respect to certain future events. As the
actual performance of the companies may be affected
by risks and uncertainties, all opinions, information
and estimates contained in this document constitute
the Company’s current judgment and are subject to
change, update, amend, supplement or otherwise
alter without notice. Although it is believed that the
information and analysis are correct and expectations
reflected in this document are reasonable, they may
be affected by a variety of variables and changes in
underlying assumptions that could cause actual
results to differ materially.
The Company does not undertake any obligation, and disclaims any duty to update or revise any forward looking statements, whether as a result of new information or future events. Neither this document nor the information contained within can construe any investment advice, invitation or an offer to buy or sell the Company and/or Its group companies’ shares. The Company cannot guarantee that the securities described in this document constitute a suitable investment for all investors and nothing shall be taken as an inducement to any person to invest in or otherwise deal with any shares of the Company and its group companies. The information contained in this document is published for the assistance of recipients, but is not to be relied upon as authoritative or taken in substitution for the exercise of judgment by any recipient. You must not distribute the information in this document to, or cause it to be used by, any person or entity in a place where its distribution or use would be unlawful. Neither the Company, its board of directors, directors, managers, nor any of Its employees shall have any liability whatsoever for any direct or consequential loss arising from any use of this document or its contents.
2
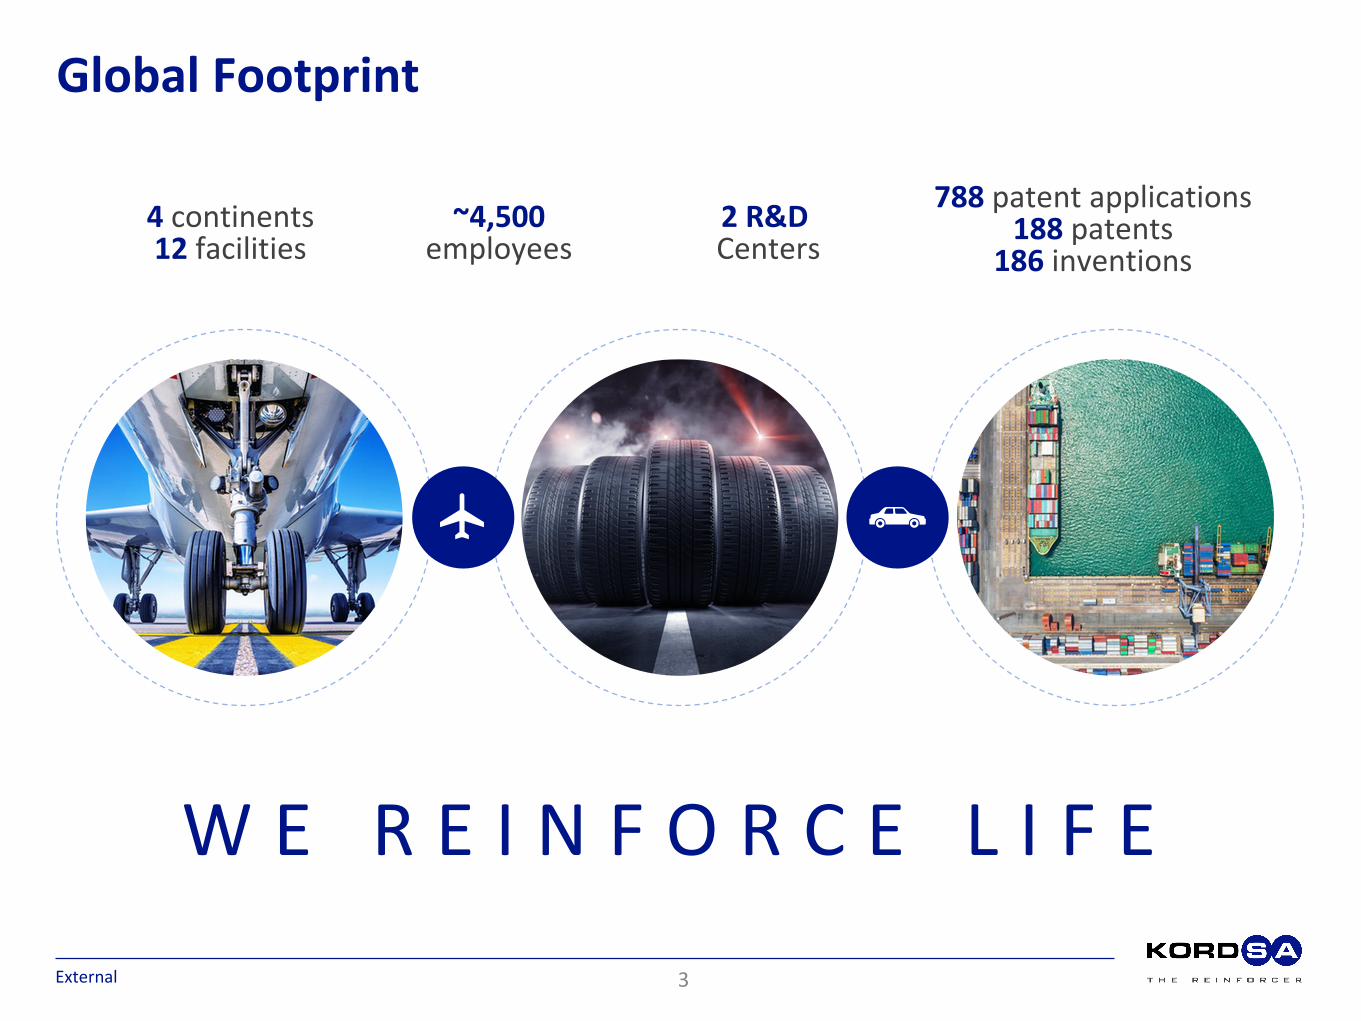
Global Footprint
4 continents 12 facilities
~4,500 employees
2 R&D Centers
788 patent applications 188 patents
186 inventions
W E R E I N F O R C E L I F E
External 3
Milestones
External 4
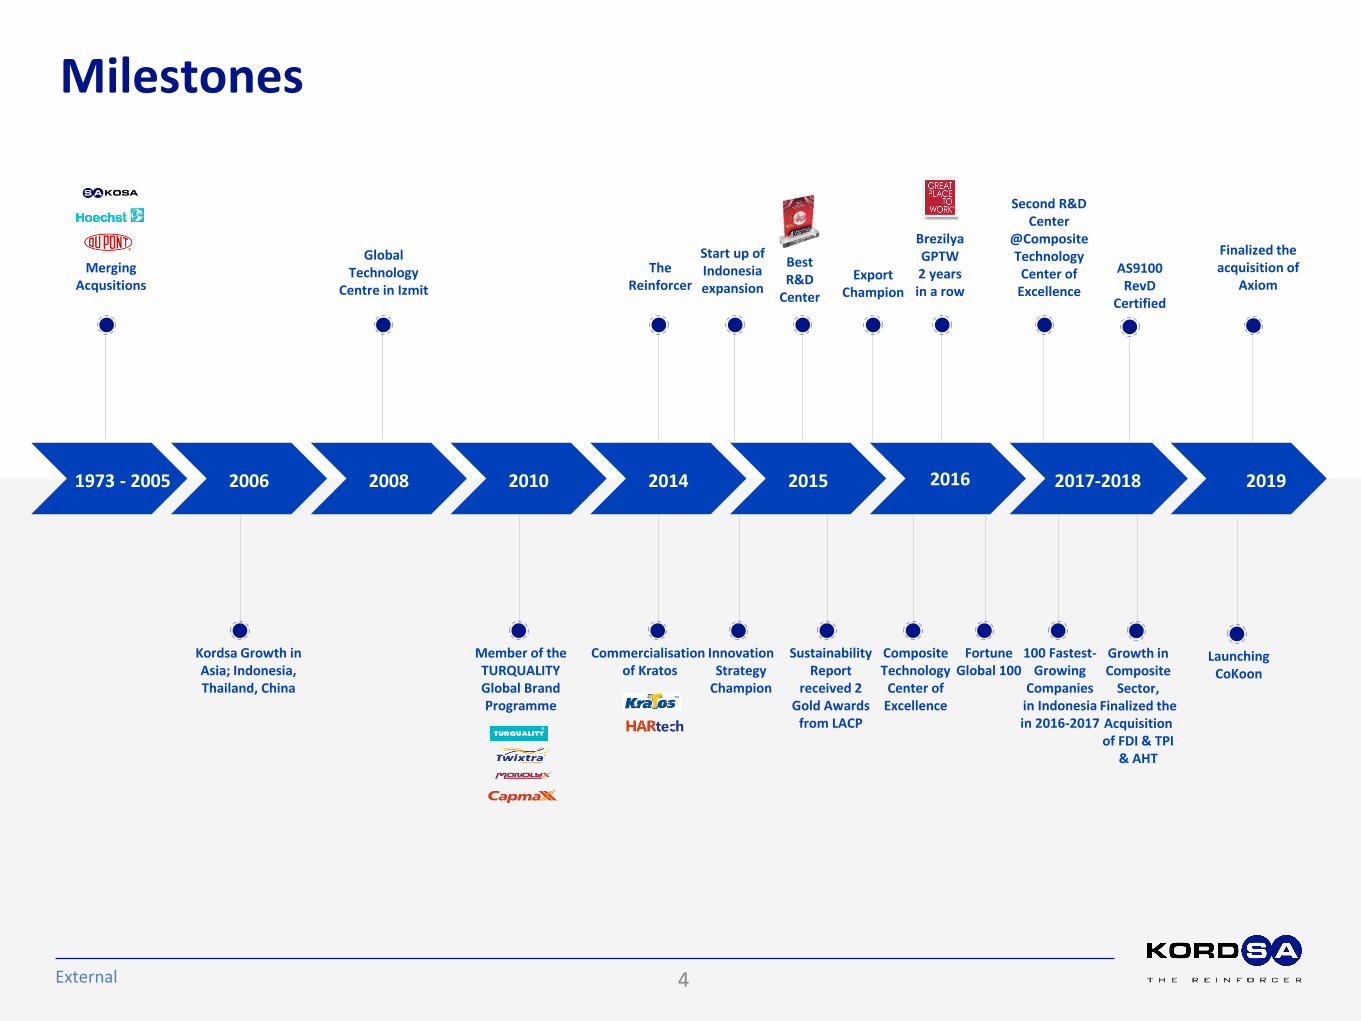
1973 - 2005 2006 2008 2010 2014 2015 2016 2017-2018 2019
Merging Acqusitions
Global Technology
Centre in Izmit
The Reinforcer
Start up of Indonesia expansion
Best R&D
Center
Export Champion
Brezilya GPTW 2 years in a row
Second R&D Center
@Composite Technology
Center of Excellence
AS9100 RevD
Certified
Kordsa Growth in Asia; Indonesia, Thailand, China
Member of the TURQUALITY Global Brand Programme
Commercialisation of Kratos
Innovation Strategy
Champion
Sustainability Report
received 2 Gold Awards
from LACP
Composite Technology
Center of Excellence
Fortune Global 100
100 Fastest-Growing
Companies in Indonesia in 2016-2017
Growth in Composite
Sector, Finalized the Acquisition of FDI & TPI
& AHT
Finalized the acquisition of
Axiom
Launching CoKoon
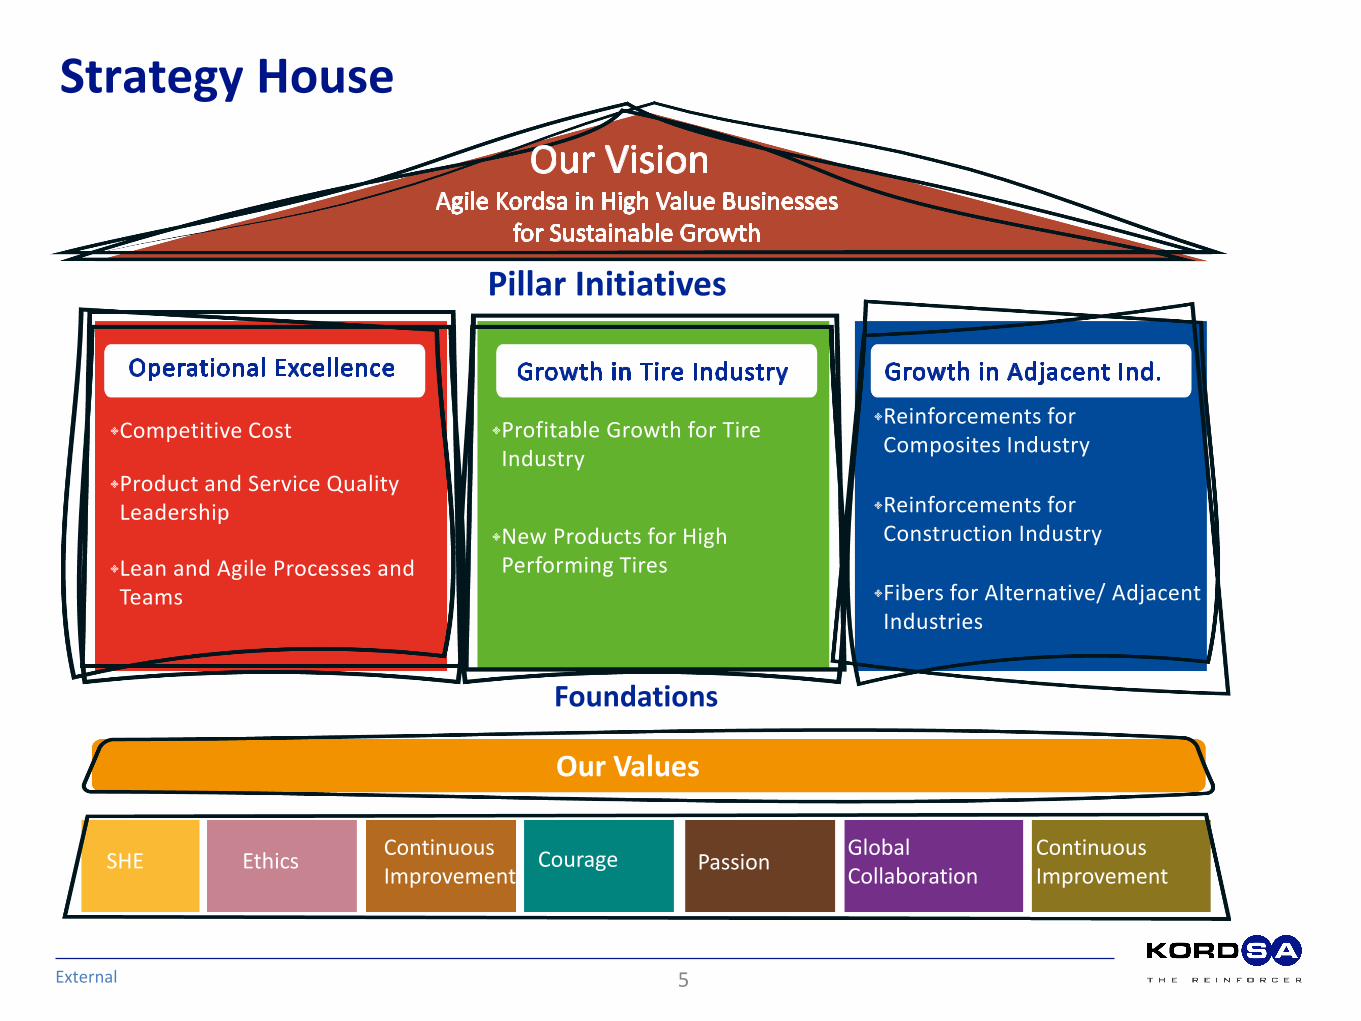
Strategy House
External
•Competitive Cost •Profitable Growth for Tire Industry
•Reinforcements for Composites Industry
•Product and Service Quality Leadership
•New Products for High Performing Tires
•Reinforcements for Construction Industry
•Lean and Agile Processes and Teams •Fibers for Alternative/ Adjacent
Industries
Pillar Initiatives
Foundations
Our Values
SHE Ethics Continuous Improvement
Courage Passion Global Collaboration
Continuous Improvement
5

External
Description
End markets
Selected end-market participants
Tire cord fabrics (“TCF”) Next generation fabrics Composite
• Nylon and polyester based tire reinforcement fibers and fabrics for radial and bias tires
• Global #1 by revenue/ #2 by capacity @ NY66 TCF
• Global #2 by revenue / #3 by capacity @PET TCF
• Textile reinforcement materials for green tires
• High performance Monofilaments
• Green Products with Resorcinol Formaldehyde Free Dipping
• Highly engineered hybrid cords with superior properties
• Carbon fiber, aramid, hybrid fabrics, and pre-pregs
• Production technologies for composite materials
• High value added thermoplastic and thermoset resins
Construction
• Macro and micro fibers for concrete reinforcement
Kordsa in Brief
6

Focus on tire industry for profitable growth, selectively grow adjacencies
Must Win Battles
External
1. Operational Excellence
2. Profitable Growth in
Tire Industry
3. Profitable Growth in Adjacent Industries
a. Continue TPM implementation at every site for zero
incident, zero defect, zero downtime
b. High capacity utilization and/or optimisation at all
entities
c. Local Talent Development for cost and productivity
d. Focus on high value added segments
e. Investing for smart plant, deployment of Industry 4.0
developments to support growth - future plant concept
f. Continuous Renewal of Product Portfolio – new product
revenue and increase approval base
g. Ramp up Composite Reinforcement Business and
complete inorganic growth
h. Ramp up Construction Reinforcement Business - PP line
start up and global collaboration/ partnership
i. Find out Alternative end uses for NY6.6
7
Products
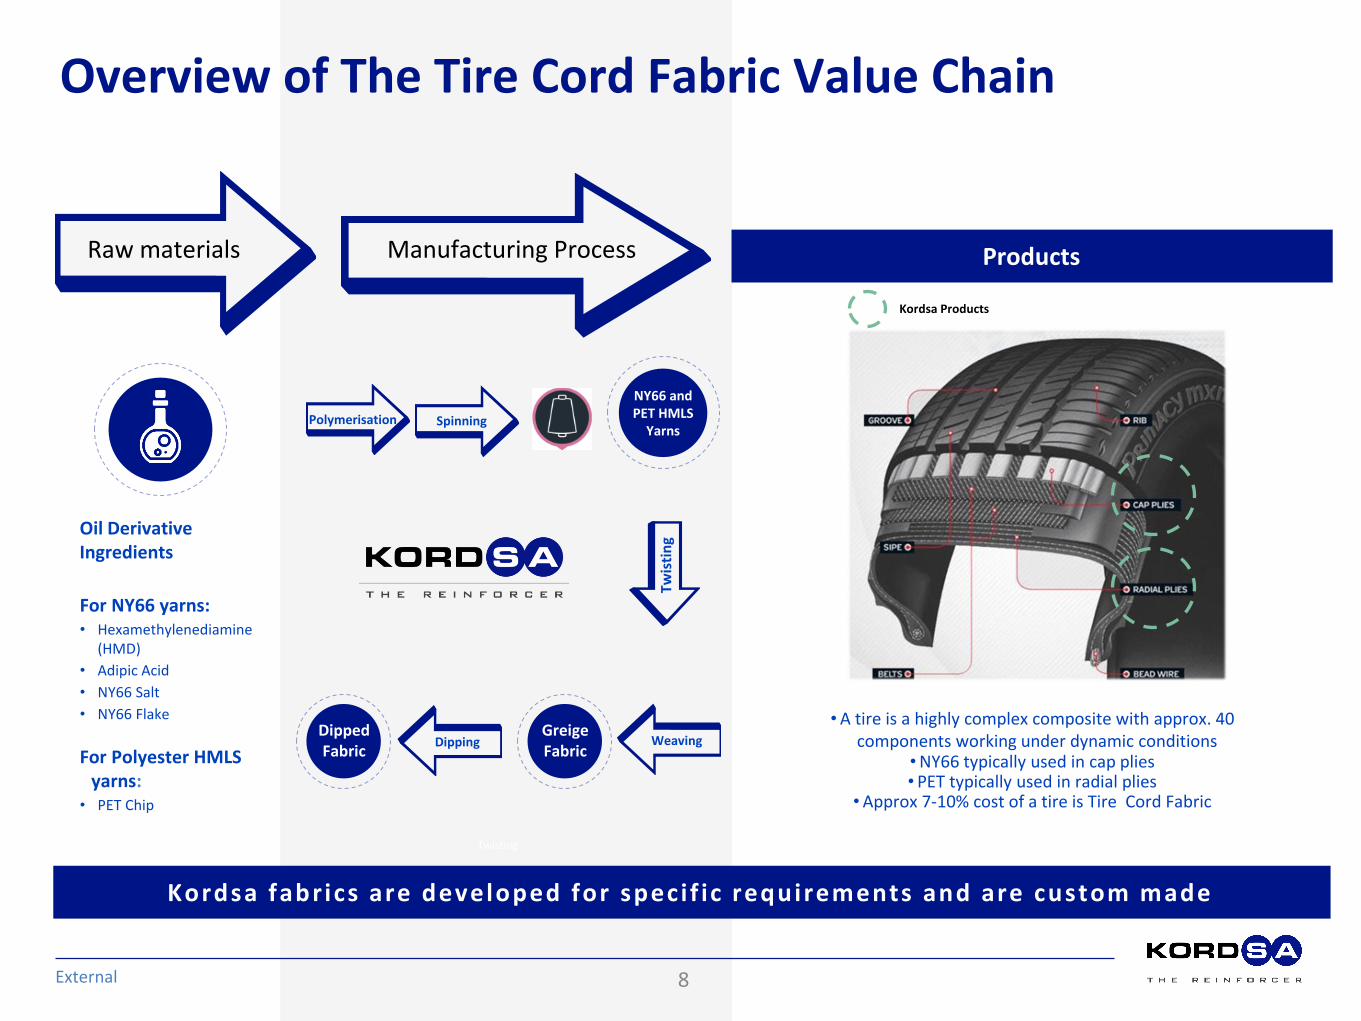
Overview of The Tire Cord Fabric Value Chain
External
Raw materials Manufacturing Process
Kordsa fabrics are developed for speci f ic requirements and are custom made
Kordsa Products
Oil Derivative Ingredients
For NY66 yarns: • Hexamethylenediamine
(HMD)
• Adipic Acid
• NY66 Salt
• NY66 Flake
For Polyester HMLS yarns:
• PET Chip
Twisting
•A tire is a highly complex composite with approx. 40 components working under dynamic conditions
•NY66 typically used in cap plies • PET typically used in radial plies
•Approx 7-10% cost of a tire is Tire Cord Fabric
Spinning
NY66 and PET HMLS
Yarns Polymerisation
Twis
tin
g
Weaving Dipping Greige Fabric
Dipped Fabric
8
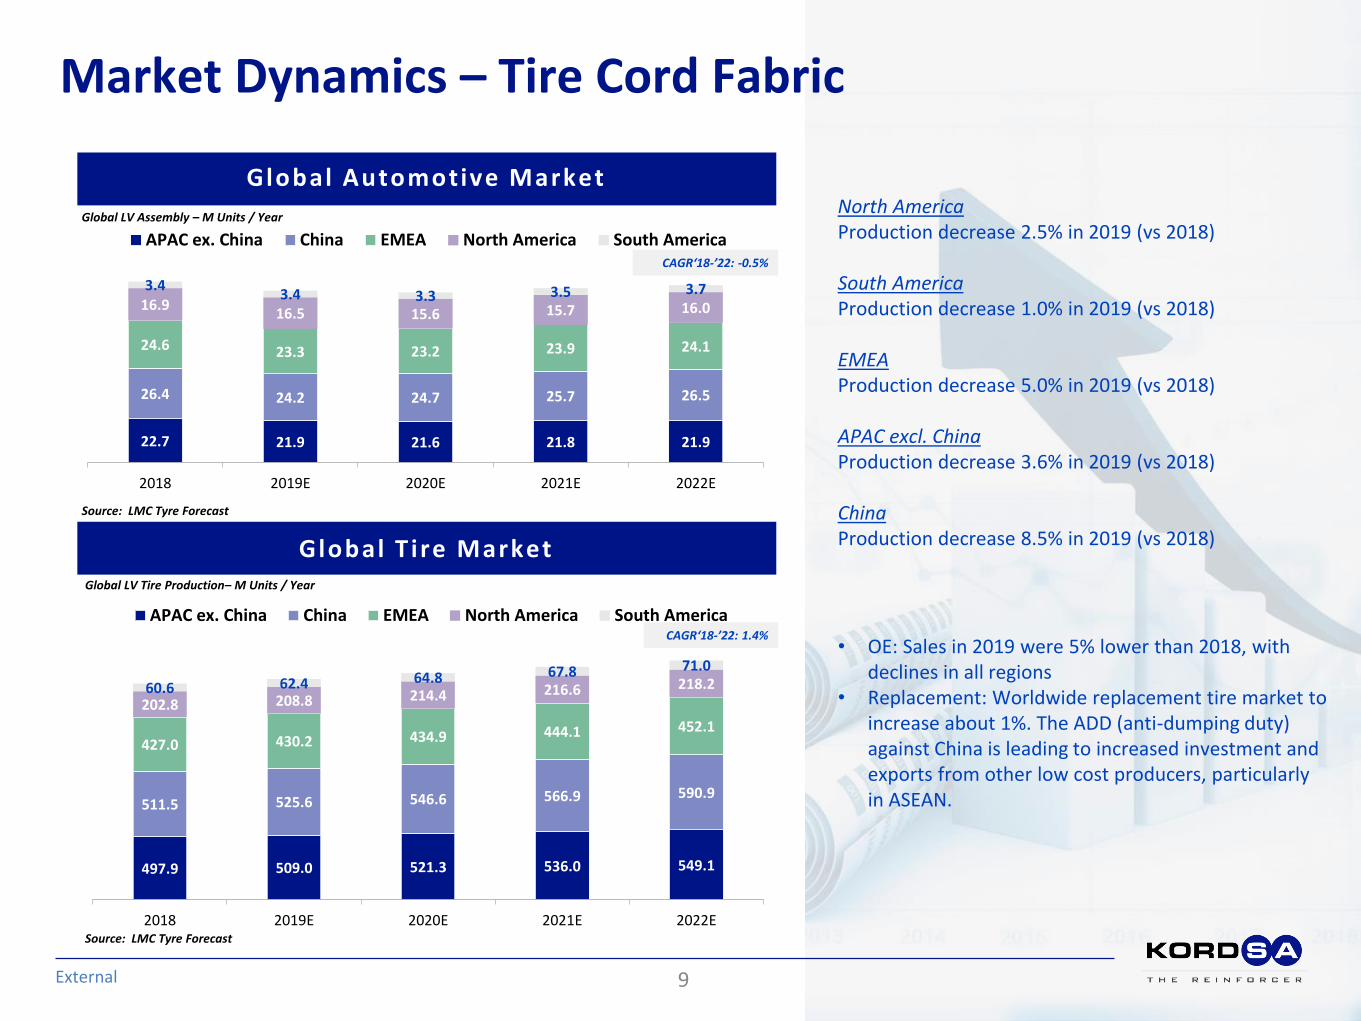
Market Dynamics – Tire Cord Fabric
External
Global T ire Market
Global Automotive Market
9
Global LV Assembly – M Units / Year
Source: LMC Tyre Forecast
Global LV Tire Production– M Units / Year
Source: LMC Tyre Forecast
497.9 509.0 521.3 536.0 549.1
511.5 525.6 546.6 566.9 590.9
427.0 430.2 434.9 444.1 452.1
202.8 208.8 214.4 216.6 218.2 60.6 62.4 64.8 67.8 71.0
2018 2019E 2020E 2021E 2022E
APAC ex. China China EMEA North America South America CAGR‘18-’22: 1.4%
22.7 21.9 21.6 21.8 21.9
26.4 24.2 24.7 25.7 26.5
24.6 23.3 23.2 23.9 24.1
16.9 16.5 15.6 15.7 16.0
3.4 3.4 3.3 3.5 3.7
2018 2019E 2020E 2021E 2022E
APAC ex. China China EMEA North America South America CAGR‘18-’22: -0.5%
North America Production decrease 2.5% in 2019 (vs 2018) South America Production decrease 1.0% in 2019 (vs 2018) EMEA Production decrease 5.0% in 2019 (vs 2018) APAC excl. China Production decrease 3.6% in 2019 (vs 2018) China Production decrease 8.5% in 2019 (vs 2018)
• OE: Sales in 2019 were 5% lower than 2018, with declines in all regions
• Replacement: Worldwide replacement tire market to increase about 1%. The ADD (anti-dumping duty) against China is leading to increased investment and exports from other low cost producers, particularly in ASEAN.
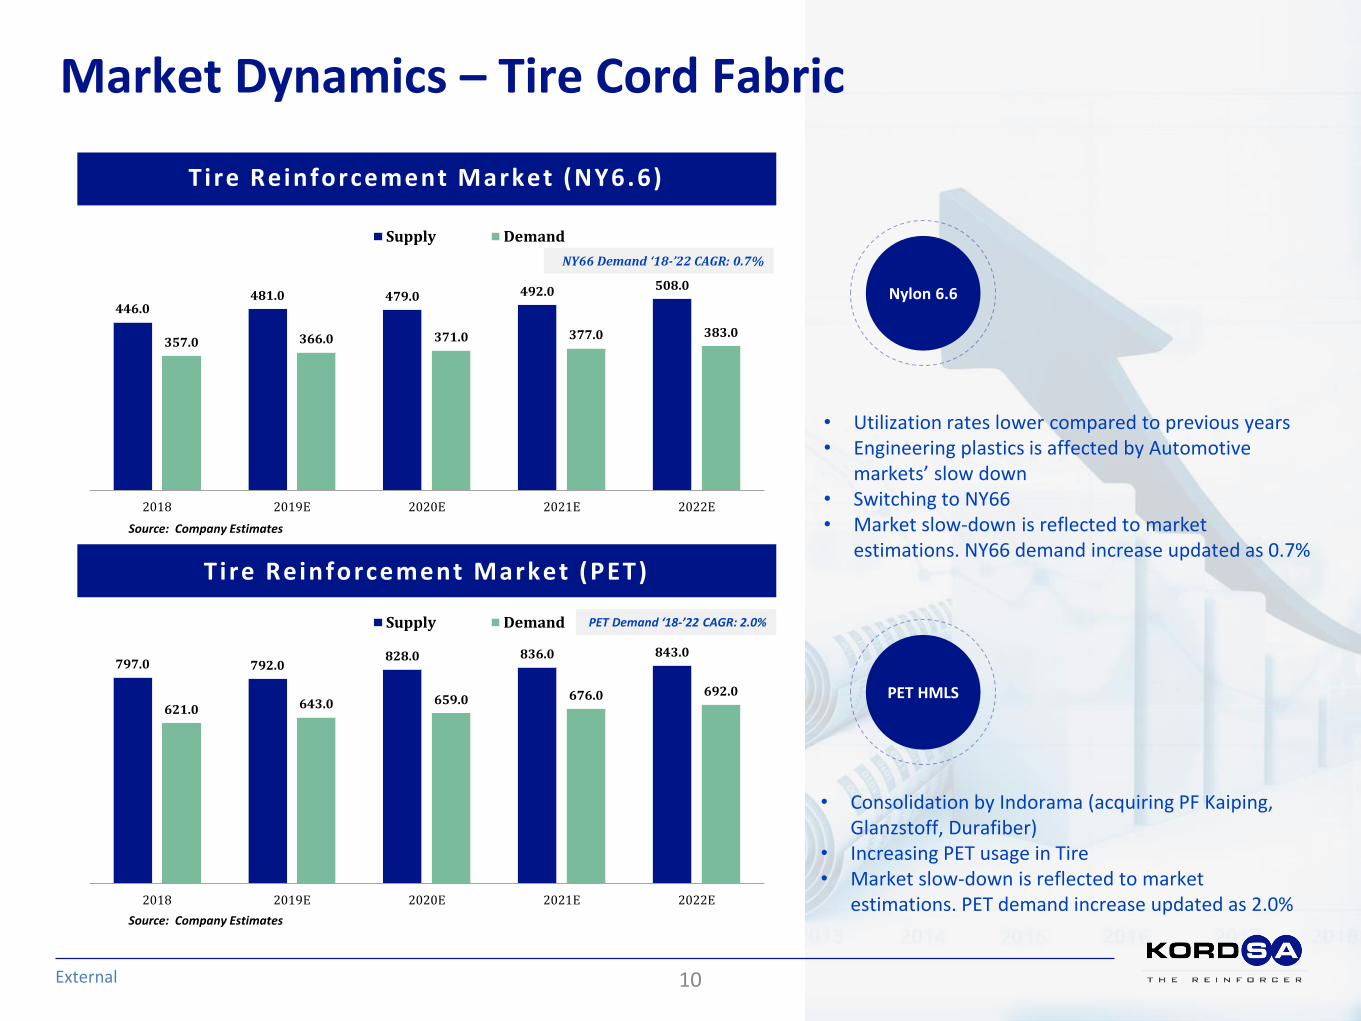
Market Dynamics – Tire Cord Fabric
External
Tire Reinforcement Market (PET)
T ire Reinforcement Market (NY6.6)
10
Source: Company Estimates
Source: Company Estimates
• Utilization rates lower compared to previous years • Engineering plastics is affected by Automotive
markets’ slow down • Switching to NY66 • Market slow-down is reflected to market
estimations. NY66 demand increase updated as 0.7%
Nylon 6.6
PET HMLS
• Consolidation by Indorama (acquiring PF Kaiping, Glanzstoff, Durafiber)
• Increasing PET usage in Tire • Market slow-down is reflected to market
estimations. PET demand increase updated as 2.0%
446.0 481.0 479.0 492.0 508.0
357.0 366.0 371.0 377.0 383.0
2018 2019E 2020E 2021E 2022E
Supply Demand
NY66 Demand ‘18-’22 CAGR: 0.7%
797.0 792.0 828.0 836.0 843.0
621.0 643.0 659.0 676.0 692.0
2018 2019E 2020E 2021E 2022E
Supply Demand PET Demand ‘18-’22 CAGR: 2.0%

RM Price Drivers – Tire Cord Fabric
External
NY Raw Material Trend ( Indexed)
Source: Company Estimates
11
Forecast
Jan-13 Jul-13 Jan-14 Jul-14 Jan-15 Jul-15 Jan-16 Jul-16 Jan-17 Jul-17 Jan-18 Jul-18 Jan-19 Jul-19 Jan-20 Jul-20
Benzene Propylene Butadiene Crude Oil

PET Feedstock West Europe
PET Feedstock As ia
RM Price Drivers – Tire Cord Fabric
External 12
20
30
40
50
60
70
80
90
100
110
120
Jan-13 Aug-13 Mar-14 Oct-14 May-15 Dec-15 Jul-16 Feb-17 Sep-17 Apr-18 Nov-18 Jun-19 Jan-20 Aug-20
Do
llars
pe
r to
n
MEG Asia Contract PX Asia Contract PTA Asia Contract Crude Oil Dubai
Source : IHS Markit
20
30
40
50
60
70
80
90
100
110
120
Jan-13 Jul-13 Jan-14 Jul-14 Jan-15 Jul-15 Jan-16 Jul-16 Jan-17 Jul-17 Jan-18 Jul-18 Jan-19 Jul-19 Jan-20 Jul-20
Do
llars
pe
r to
n
MEG Europe Contract PX Europe Contract PTA Europe Contract Crude Oil Dubai
Further Growth Opportunities: Composite
External
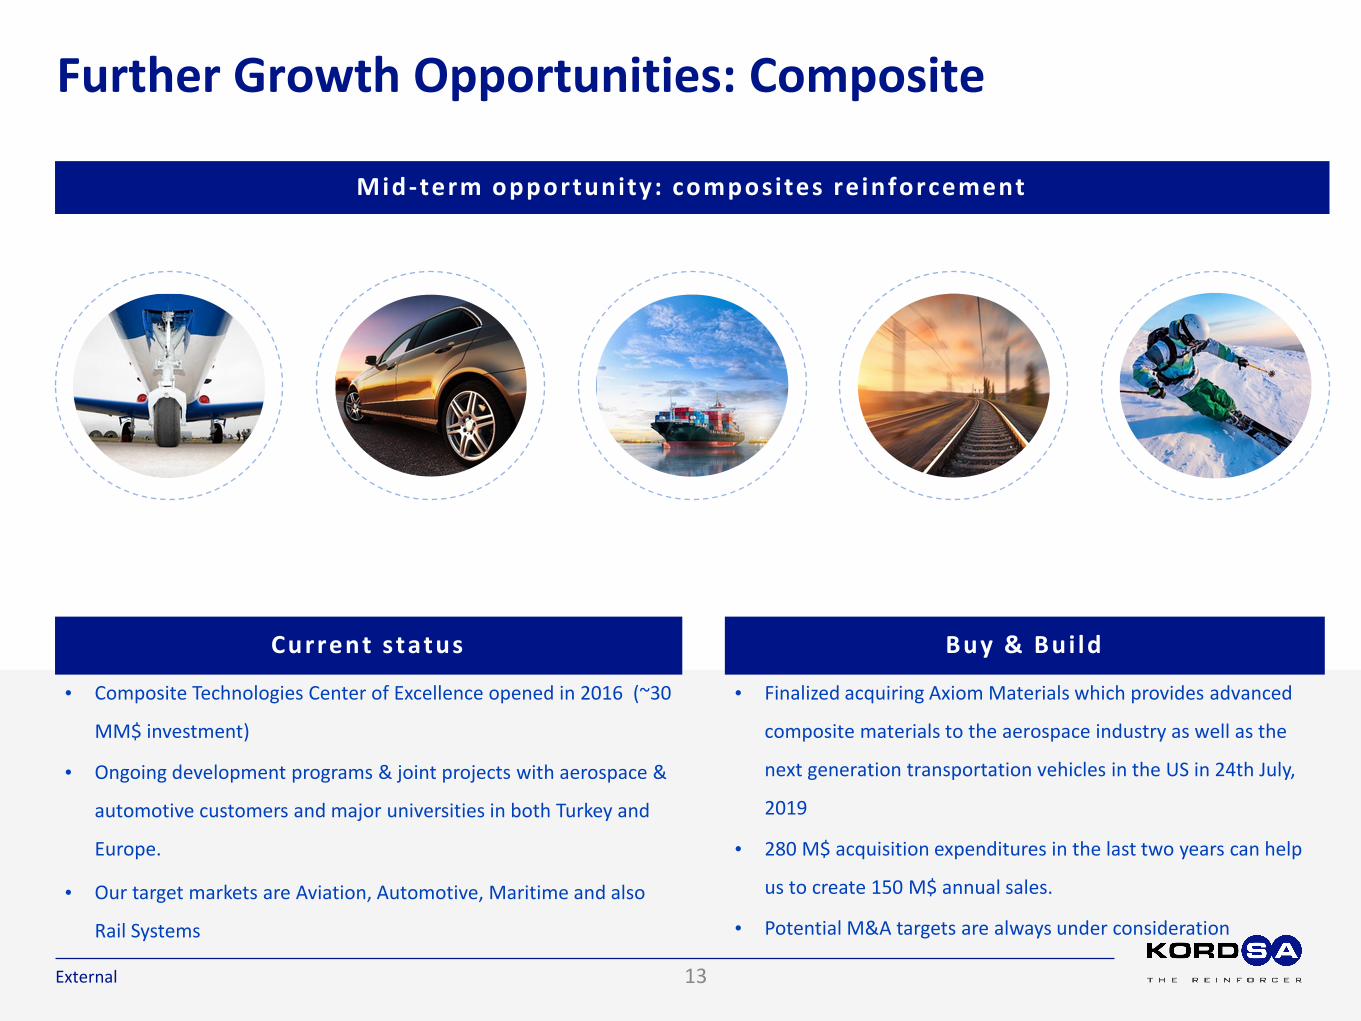
Mid-term opportunity: composites re inforcement
• Composite Technologies Center of Excellence opened in 2016 (~30
MM$ investment)
• Ongoing development programs & joint projects with aerospace &
automotive customers and major universities in both Turkey and
Europe.
• Our target markets are Aviation, Automotive, Maritime and also
Rail Systems
Current status
• Finalized acquiring Axiom Materials which provides advanced
composite materials to the aerospace industry as well as the
next generation transportation vehicles in the US in 24th July,
2019
• 280 M$ acquisition expenditures in the last two years can help
us to create 150 M$ annual sales.
• Potential M&A targets are always under consideration
Buy & Bui ld
13

Composite Parts
Overview of The Composites Value Chain
External
Raw materials Intermediates
Kordsa fabrics and prepregs offer cutt ing edge solutions for aerospace & automotive markets
Precursors & Fibers: • PAN Precursor
• Carbon Fiber
• Aramide
• Glass Fiber
• ...
Resins: • Phenolic
• Epoxy
• Cyanate ester
Twisting
• Composites use in aerospace & automotive is increasing, due to improved material properties and weight savings
over conventional materials
• «Lightweighting» is a major theme, driven by emission regulations as well as fuel-efficiency needs
Weaving
Prepregging
14
Market Dynamics – Composite Prepreg
External 15
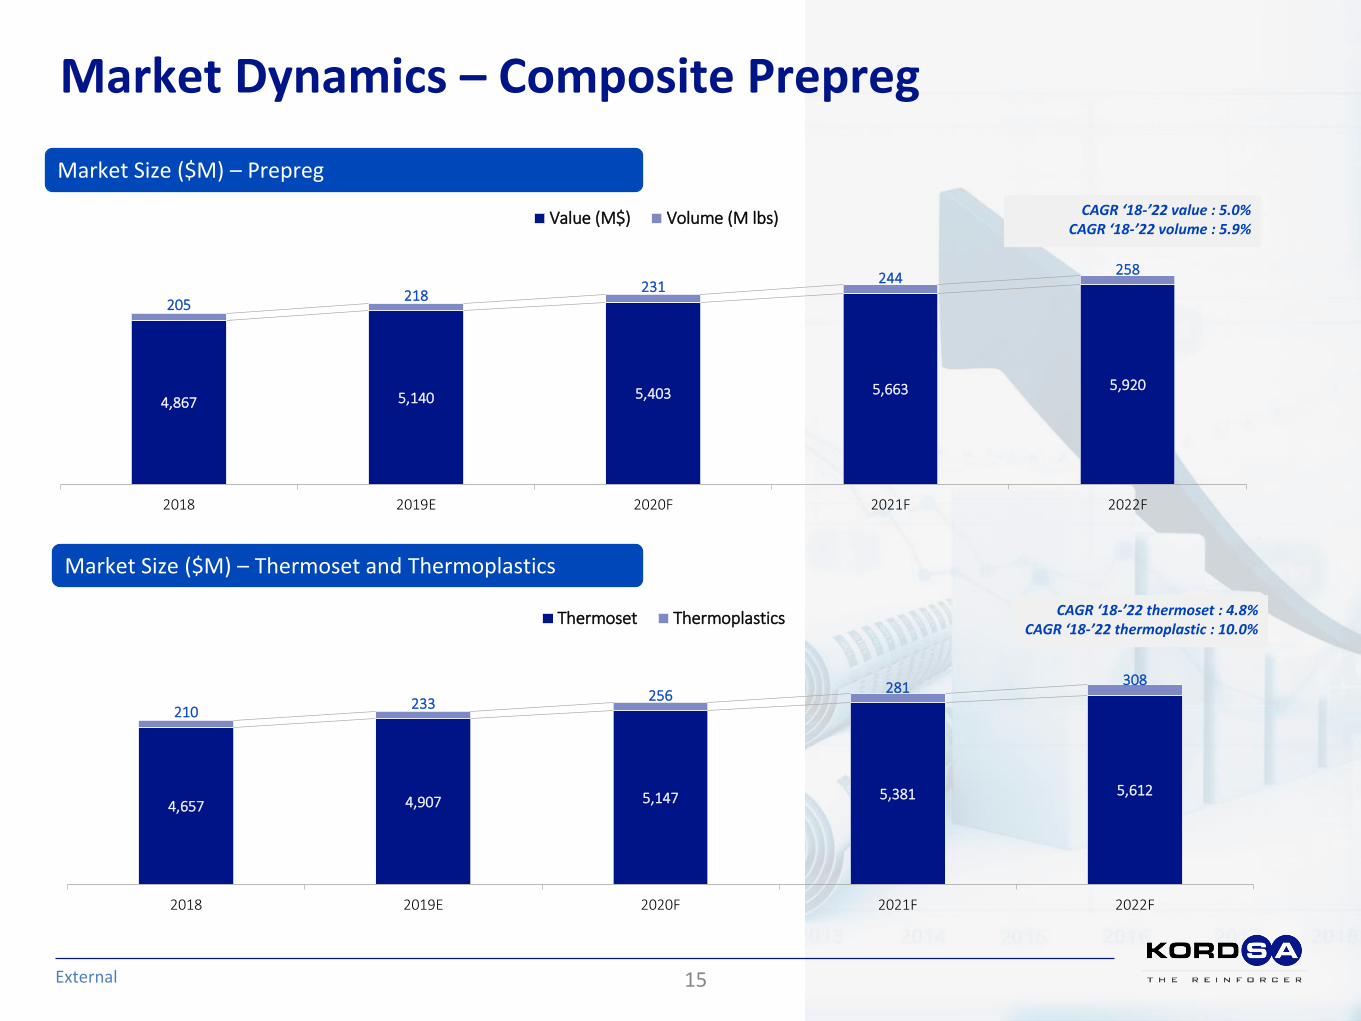
Market Size ($M) – Prepreg
4,867 5,140 5,403 5,663 5,920
205 218
231 244
258
2018 2019E 2020F 2021F 2022F
Value (M$) Volume (M lbs) CAGR ‘18-’22 value : 5.0% CAGR ‘18-’22 volume : 5.9%
Market Size ($M) – Thermoset and Thermoplastics
4,657 4,907 5,147 5,381 5,612
210 233
256 281 308
2018 2019E 2020F 2021F 2022F
Thermoset Thermoplastics CAGR ‘18-’22 thermoset : 4.8% CAGR ‘18-’22 thermoplastic : 10.0%
Market Dynamics – Carbon Fabric
External 16
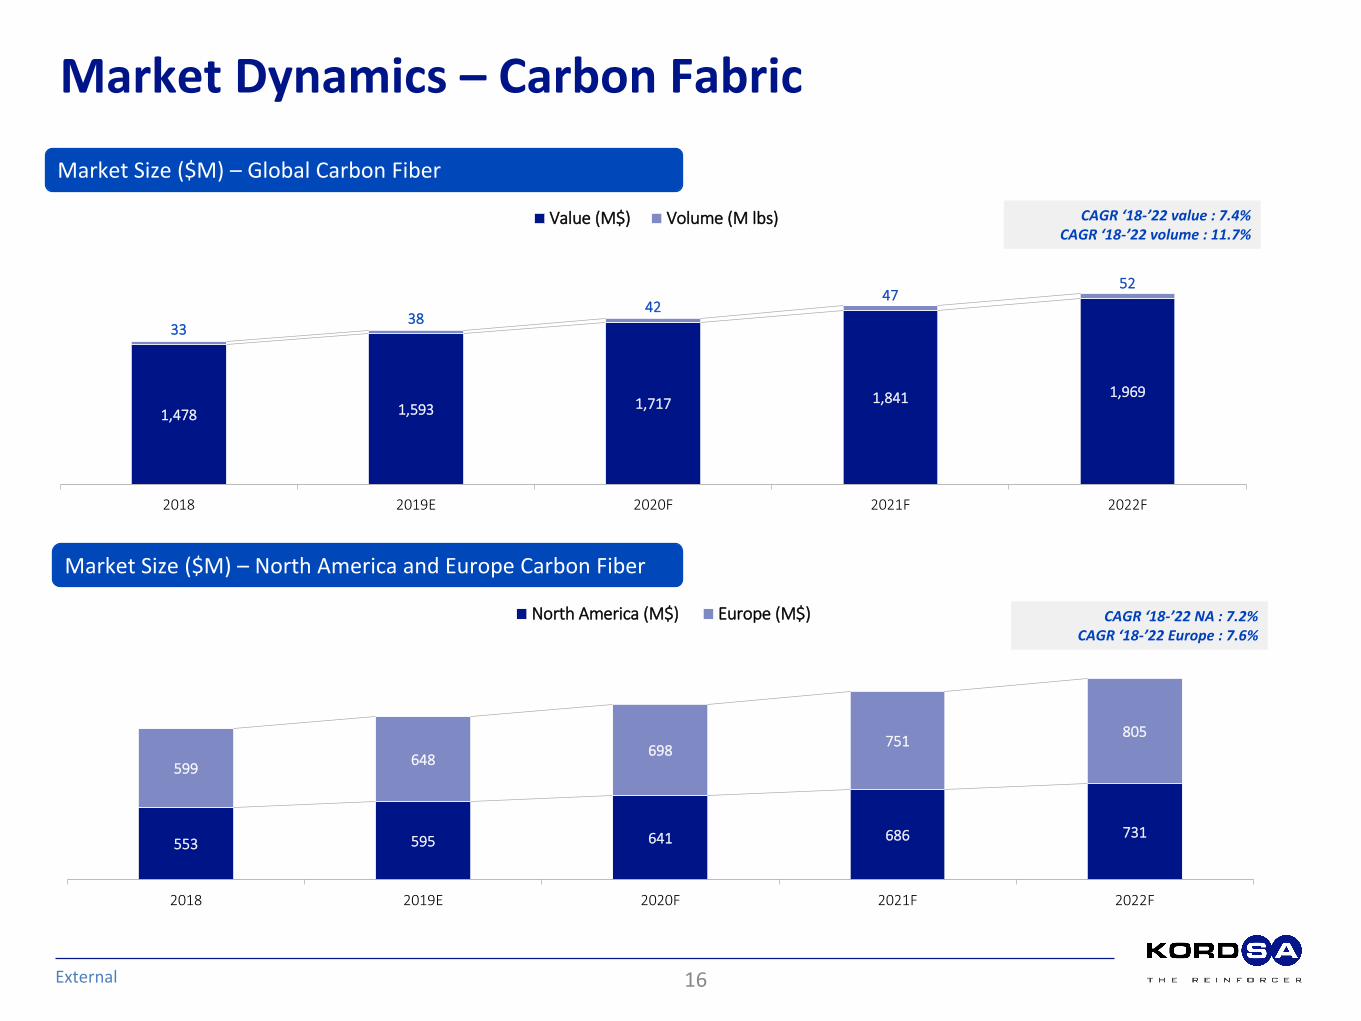
Market Size ($M) – Global Carbon Fiber
Market Size ($M) – North America and Europe Carbon Fiber
1,478 1,593 1,717 1,841 1,969
33 38
42 47
52
2018 2019E 2020F 2021F 2022F
Value (M$) Volume (M lbs) CAGR ‘18-’22 value : 7.4% CAGR ‘18-’22 volume : 11.7%
553 595 641 686 731
599 648
698 751
805
2018 2019E 2020F 2021F 2022F
North America (M$) Europe (M$) CAGR ‘18-’22 NA : 7.2% CAGR ‘18-’22 Europe : 7.6%
Kordsa Investment Highlights
External
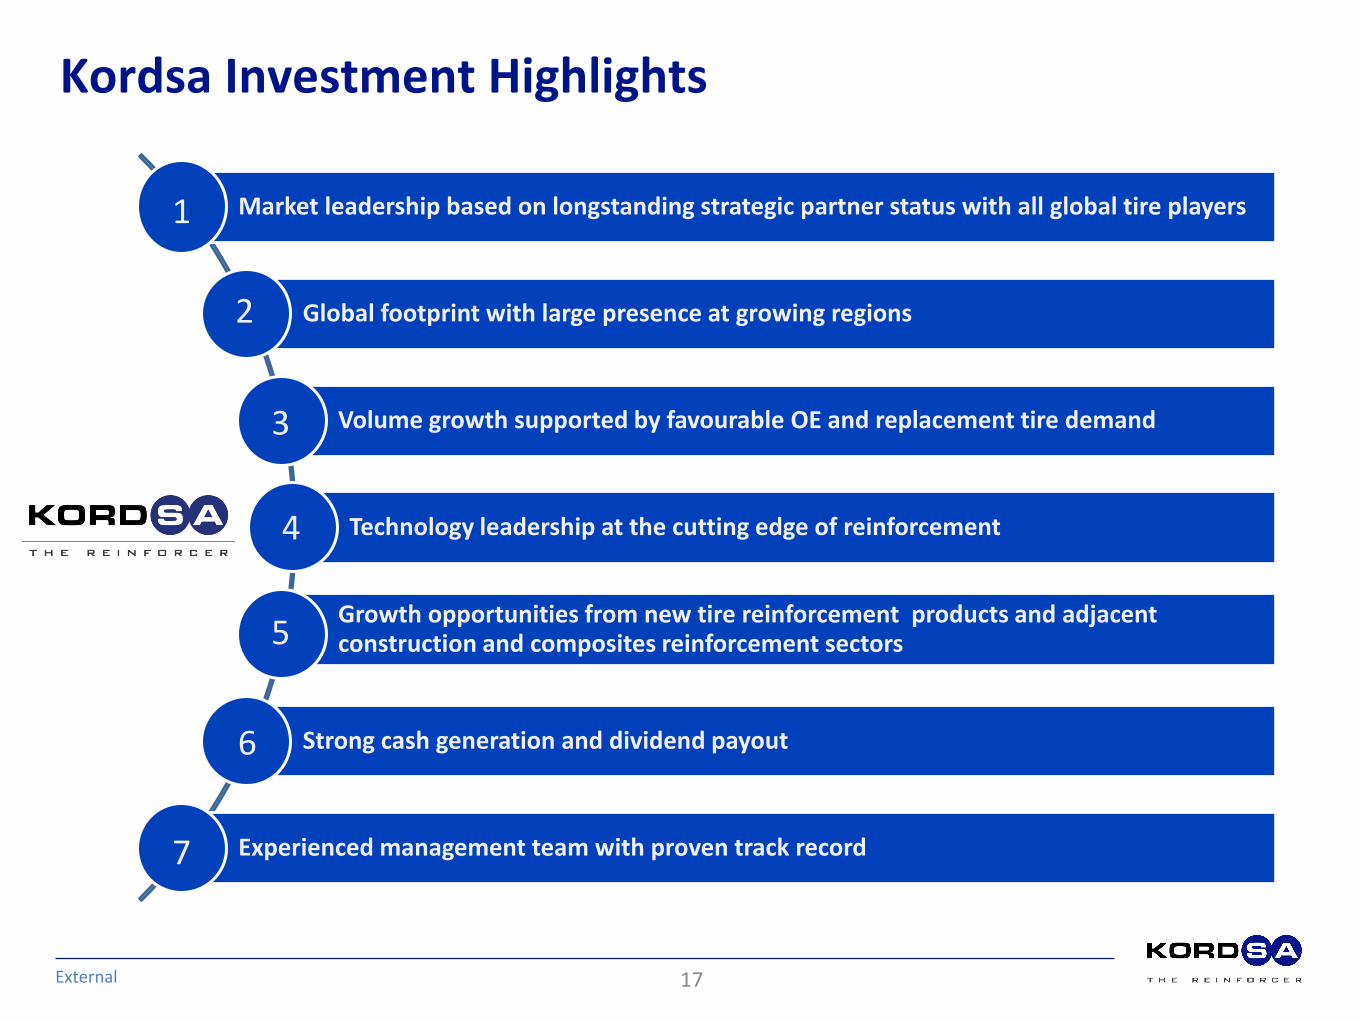
Market leadership based on longstanding strategic partner status with all global tire players
Global footprint with large presence at growing regions
Volume growth supported by favourable OE and replacement tire demand
Technology leadership at the cutting edge of reinforcement
Growth opportunities from new tire reinforcement products and adjacent construction and composites reinforcement sectors
Strong cash generation and dividend payout
Experienced management team with proven track record
1
2
3
4
5
6
7
17

External
Kordsa in Brief
2018 Guidance
18
Key F inancials
(a) EBITDA* = Gross Profit – OPEX + Depreciation/Amortization
18
Million TL Million USD
Sep'18 Sep'19 Sep'18 Sep'19
Sales 2,776 3,871 608 688
Gross Profit 606 760 133 135
Gross Margin (%) 21.8% 19.6% 21.8% 19.6%
EBITDA* 493 583 108 103
EBITDA* Margin 17.8% 15.0% 17.8% 15.0%
OPEX Margin 7.6% 8.5% 7.6% 8.5%
Net Income 290 301 64 53
Effective Tax Rate 18.8% 19.7% 18.8% 19.7%
WC Turnover 2.83 3.48 2.83 3.48
CAPEX 94 118 21 21
Net Debt / EBITDA 2.85 3.07 2.12 3.09
Dept./Amort 150 99 33 18
External
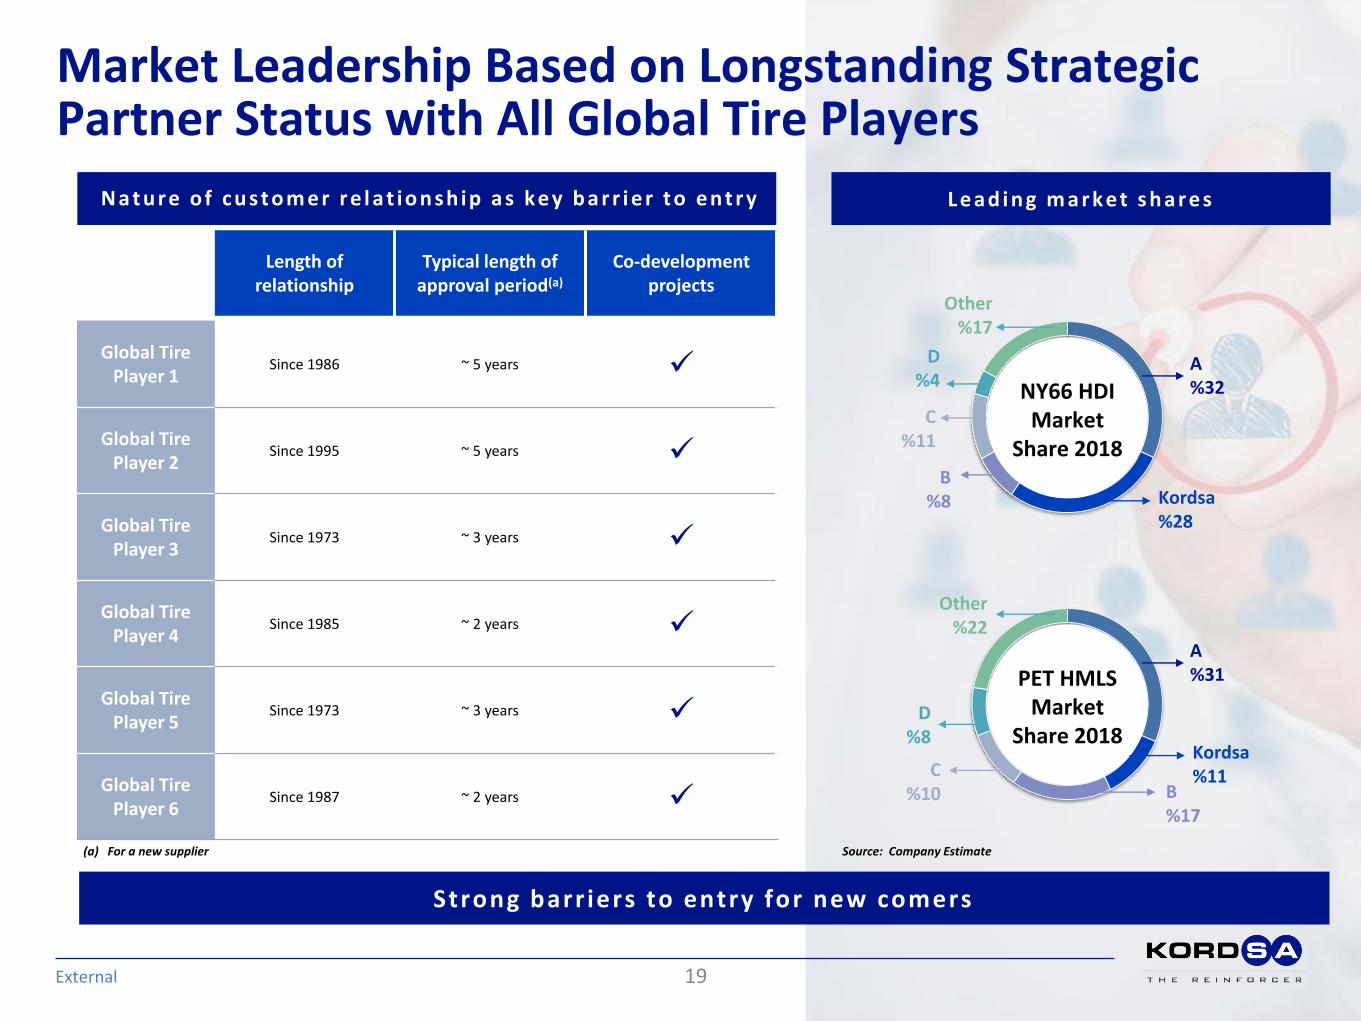
N a t u r e o f c u s t o m e r r e l a t io n s hip a s k e y b a r r i e r t o e n t r y L e a d i n g m a r k e t s h a r e s
Length of relationship
Typical length of approval period(a)
Co-development projects
Global Tire Player 1
Since 1986 ~ 5 years
Global Tire Player 2
Since 1995 ~ 5 years
Global Tire Player 3
Since 1973 ~ 3 years
Global Tire Player 4
Since 1985 ~ 2 years
Global Tire Player 5
Since 1973 ~ 3 years
Global Tire Player 6
Since 1987 ~ 2 years
(a) For a new supplier
Strong barr iers to entry for new comers
Market Leadership Based on Longstanding Strategic Partner Status with All Global Tire Players
Other %17
Kordsa %28
D %4
C %11
B %8
A %32 NY66 HDI
Market Share 2018
Other %22
Kordsa %11
D %8
C %10 B
%17
A %31 PET HMLS
Market Share 2018
Source: Company Estimate
19

Capitalize on Global Footprint and Entrenched Supplier Status with All Key Tire Manufacturers - Segmental Progress
External 20
66% 65% 64% 64% 66%
9% 9% 8% 8% 8%
4% 5% 5% 5% 4%
21% 22% 23% 24% 21%
2016 2017 2018 Sep'18 Sep'19
Global Players Regional Players Emerging Players Others

Global Footprint – Regional Breakdown of Revenues
Confidential
Kordsa market position
• #1 NY TCF producer
• #1 PET TCF producer
• #1 NY TCF producer in the US
• #2 NY TCF producer
• #2 PET TCF producer
• The only PET yarn, TCF and SEC producer in LATAM
21
Regional footprint
versus key competitors
36%
18% 15%
31%
37%
17% 14%
32% 35%
24%
12%
29%
36%
22%
13%
29% 30% 33%
11%
26%
EMEA NA SA APAC
2016 2017 2018 Sep'18 Sep'19

Kordsa volume development(a)
Comments
Well – Positioned to Enable Volume Growth
External
• Fabric form contributes the highest value add • Disciplined approach to optimizing footprint • 2015 investment in Indonesia has increased polyester tire
cord fabric capacity by 18 ktons • Enables regional growth in technology-advantaged PET
segment with global and emerging customers • Further investment in PET HMLS for new generation yarns
• In TR for 6-6.5 ktons – completed in 1H 2019. • In Indo for 6,5 ktons – completed in Jan-2018.
(a) Volume development adjusted for divested volumes
Vo
lum
e s
old
(
20
06
ind
exed
to
10
0)
L i g h t V e h i c l e T i r e m a n u f a c t u r i n g m a r k e t e v o l u t i o n
K o r d s a r e g i o n a l c a p a c i t y d e v e l o p m e n t
NA %21
EMEA %32
APAC %41
NA %13
EMEA %25
NA %28
SA %20 NA
%21
EMEA %38
APAC %59
EMEA %33
APAC %32
APAC %19
SA %4
SA %6
SA %9
2005
2005 2018
2018
22
100
139 146 156 165
2006 2015 2016 2017 2018
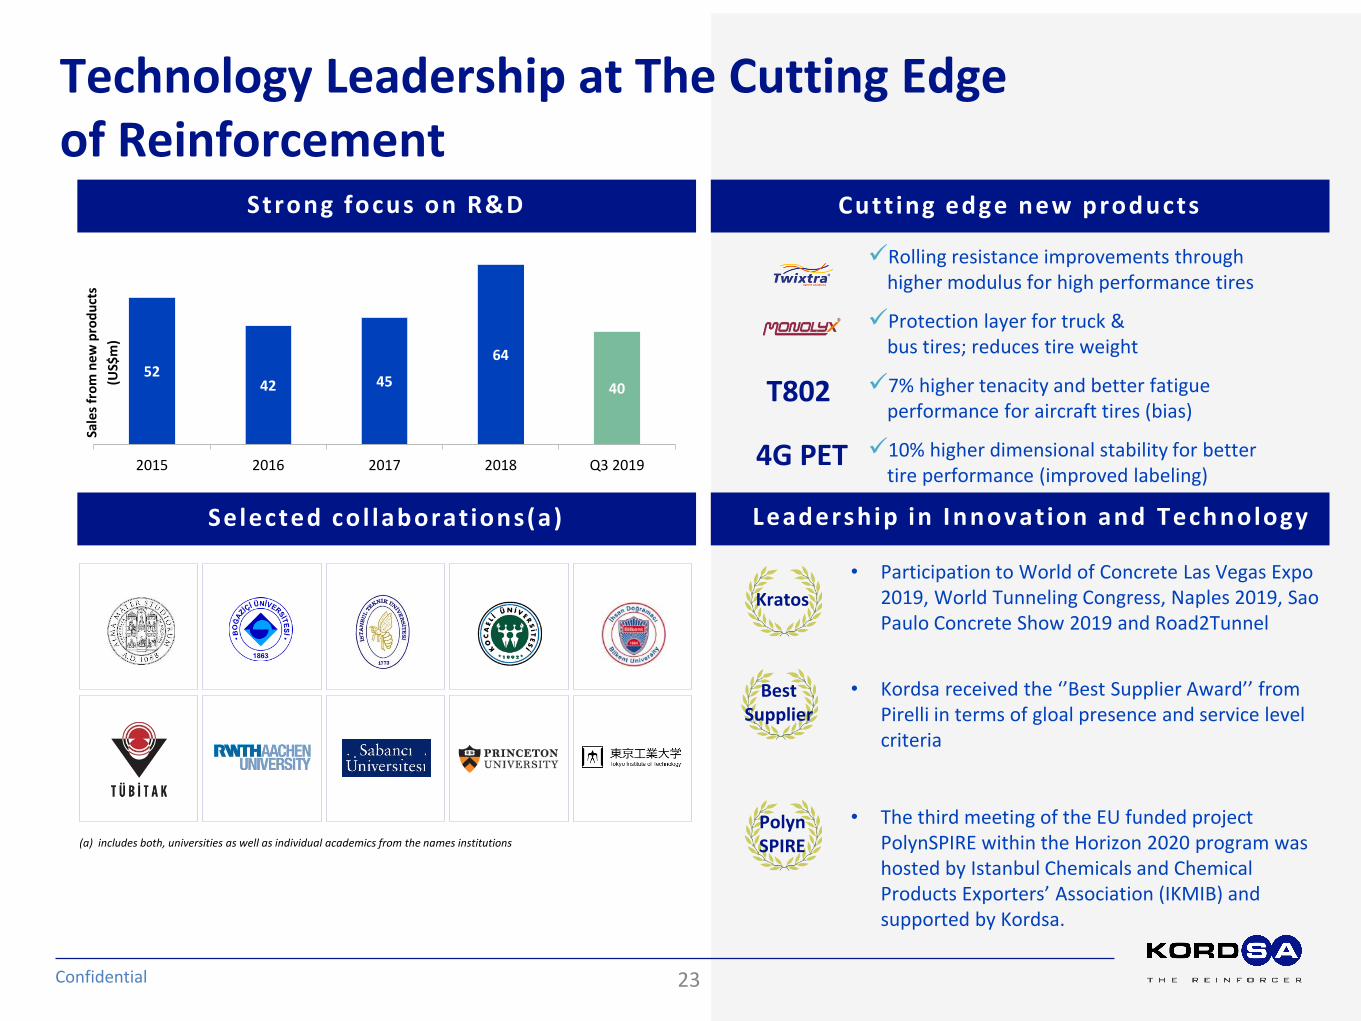
Technology Leadership at The Cutting Edge of Reinforcement
Confidential
Strong focus on R&D Cutt ing edge new products
Sale
s fr
om
ne
w p
rod
uct
s
(US$
m)
Selected col laborations(a) Leadership in Innovation and Technology
Rolling resistance improvements through higher modulus for high performance tires
Protection layer for truck & bus tires; reduces tire weight
7% higher tenacity and better fatigue performance for aircraft tires (bias)
10% higher dimensional stability for better tire performance (improved labeling)
T802
4G PET
(a) includes both, universities as well as individual academics from the names institutions
23
52 42 45
64
40
2015 2016 2017 2018 Q3 2019
• Participation to World of Concrete Las Vegas Expo 2019, World Tunneling Congress, Naples 2019, Sao Paulo Concrete Show 2019 and Road2Tunnel
• Kordsa received the ‘’Best Supplier Award’’ from Pirelli in terms of gloal presence and service level criteria
• The third meeting of the EU funded project PolynSPIRE within the Horizon 2020 program was hosted by Istanbul Chemicals and Chemical Products Exporters’ Association (IKMIB) and supported by Kordsa.
Polyn SPIRE
Best Supplier
Kratos

FX exposure
EUR %19
US$ %81
Revenue (Sep’19)
Costs (Sep’19)
US$ %82
TL %6
BRL %4
IDR %7 Baht
%1
• Hard currency revenues • FX exposure on costs => EM footprint on local
costs + hard currency priced raw materials • Benefit from US$ appreciation vs. TL, IDR and BRL
• Demonstrates value-based pricing model • Ability to pass through raw material price
volatility: (Revenue – raw material costs) tracked as a KPI by sales team
• Conversion costs as a key metric for management KPIs (main components are personnel expenses and energy costs)
Other %6
Raw Materials %65
Sep’19 expenses by
nature
Distribution & Packaging
%2
Energy Expenses %11
Personnel Expenses %12
Cost development (US$)
Well-Positioned for Strong Cash Generation and Dividends
External 24
100
91 90
91 88
93
87
90
84 91
92
88
78
2014 2015 2016 2017 2018
Co
st p
er
ton
(in
dex
ed)
TCF NY Yarn PET Yarn
100
85 89
89 86
2014 2015 2016 2017 2018
Tota
l fix
ed c
ost
(i
nd
exed
)

Dividend distr ibution
Gross prof i t
Well-Positioned for Strong Cash Generation and Dividends
External
EBITDA*
Price is a function of • Value Proposal of Product including services
offered • Product type (nylon vs polyester or fabric vs yarn) • Raw Material Price Movement (formula based
pricing with adjustment on raw material indexes)
10 yrs avg EBITDA margin 12,0% Target is progressive improvement in EBITDA
margins over the medium term • Focus on value • Improved Total and per kg Fixed Cost • Successful selling, general and administrative
(“SG&A”) cost reduction initiatives across all business units
• Positive contribution of new products and adjacent businesses
606 760
0100200300400500600700800900
1,000
Sep'18 Sep'19
(TLm
)
493
583
400
450
500
550
600
Sep'18 Sep'19
(TLm
)
0
68 61 58 67 68
0
20
40
60
80
2013(paid in 2014)
2014(paid in 2015)
2015(paid in 2016)
2016(paid in 2017)
2017(paid in 2018)
2018(paid in 2019)
(TLm
)
% margin
% of sales
Comments
21.8%
19.6%
17.8%
15.0%
EBITDA* = Gross Profit – OPEX + Depreciation/Amortization
25
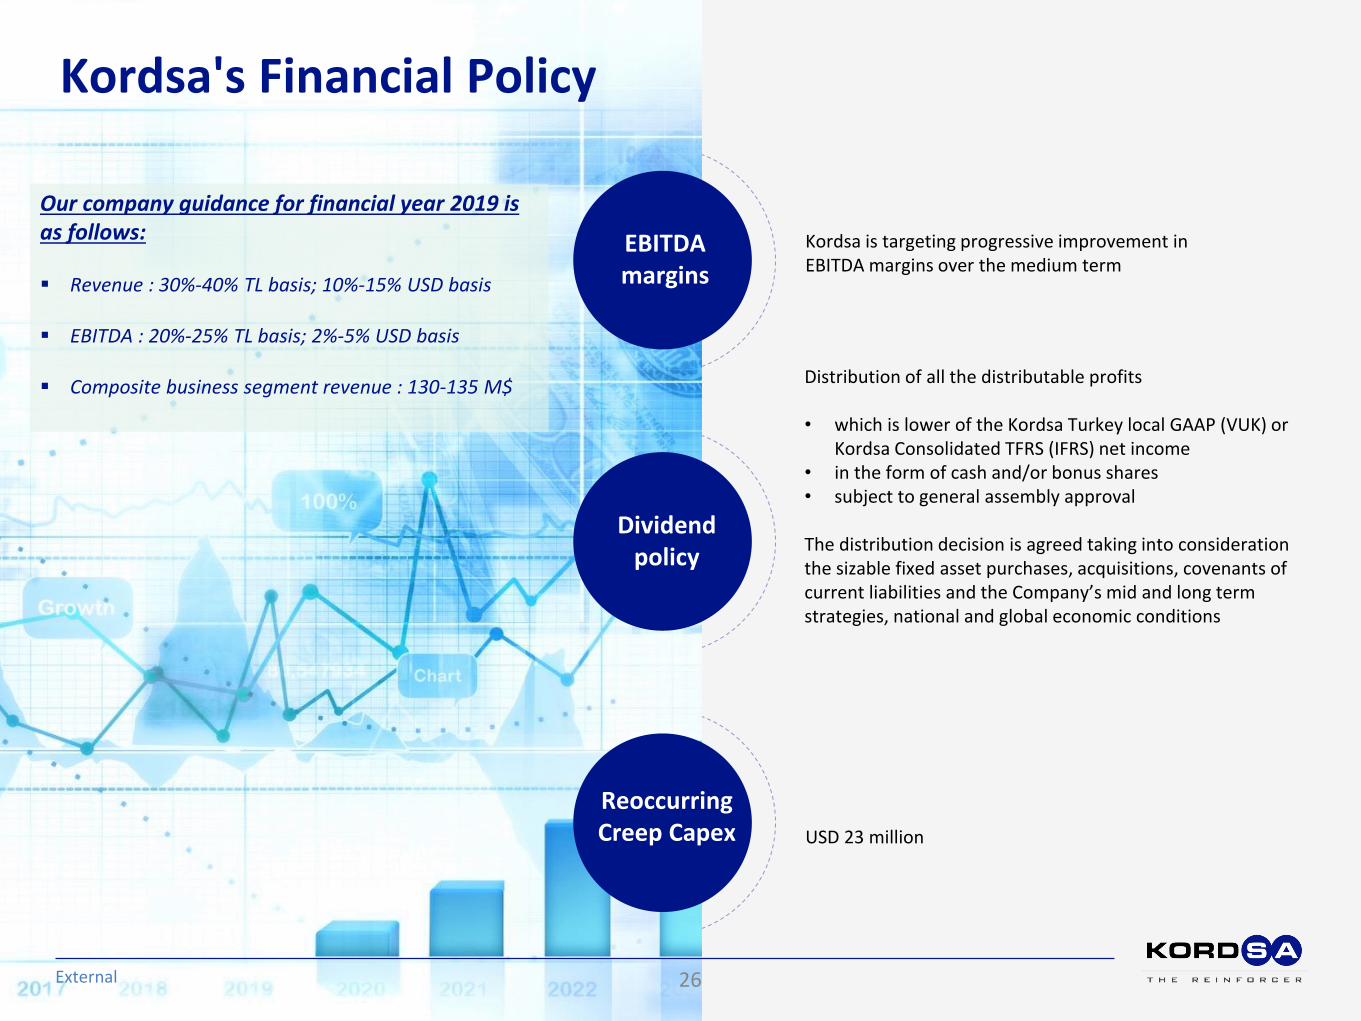
Kordsa's Financial Policy
External
EBITDA margins
Dividend policy
Reoccurring Creep Capex
Kordsa is targeting progressive improvement in EBITDA margins over the medium term
Distribution of all the distributable profits • which is lower of the Kordsa Turkey local GAAP (VUK) or
Kordsa Consolidated TFRS (IFRS) net income • in the form of cash and/or bonus shares • subject to general assembly approval
The distribution decision is agreed taking into consideration the sizable fixed asset purchases, acquisitions, covenants of current liabilities and the Company’s mid and long term strategies, national and global economic conditions
USD 23 million
26
Our company guidance for financial year 2019 is as follows: Revenue : 30%-40% TL basis; 10%-15% USD basis
EBITDA : 20%-25% TL basis; 2%-5% USD basis
Composite business segment revenue : 130-135 M$
Appendix

2016 – 2019 Financial Trend (MTL)
Confidential 28
1,816 1,908
2,485
3,947
2,776
3,871
171 233 261
511 493
583
99.33 143.08
165.10
292.46
258.00 268.64
2015 2016 2017 2018 Sep'18 Sep'19
Revenue
EBITDA
Net Income (parent)
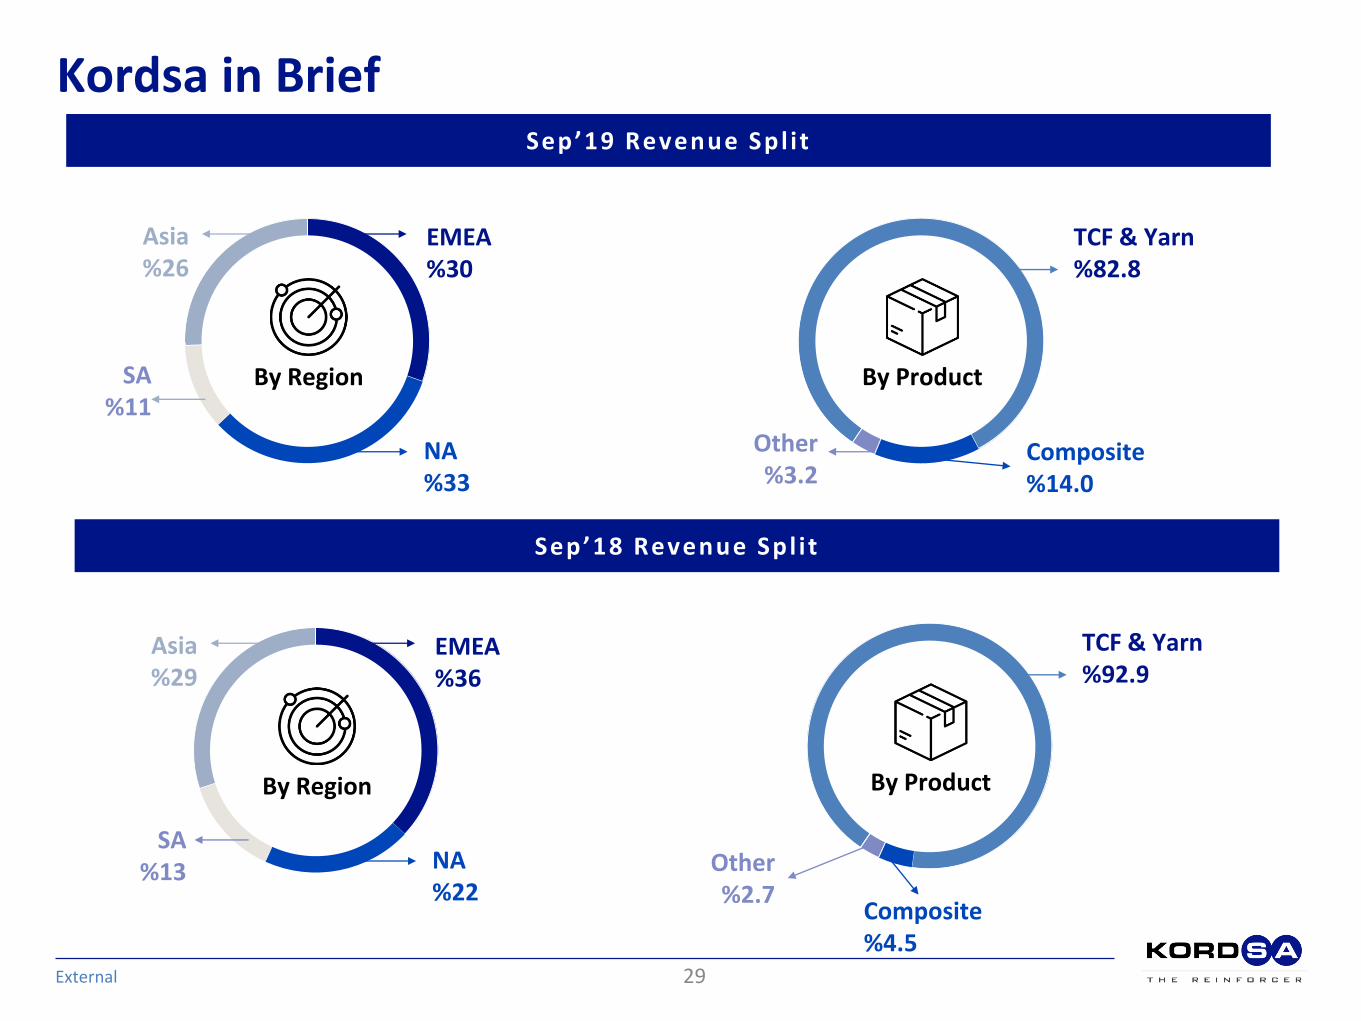
Sep’19 Revenue Spl i t
By Product
TCF & Yarn %82.8
Composite %14.0
Other %3.2
Asia %26
EMEA %30
NA %33
SA %11
By Region
External
Kordsa in Brief
Sep’18 Revenue Spl i t
By Product
TCF & Yarn %92.9
Composite %4.5
Other %2.7
Asia %29
EMEA %36
NA %22
SA %13
By Region
29

External
FX Rates FX Rates as of Sep,19
Monthly Avr Sep’19 Sep’18 2018 YE $/TRY 5.63 4.57 4.81 EUR/$ 1.12 1.19 1.18
$/BRL 3.89 3.60 3.65 $/IDR 14,173 14,052 14,237 $/THB 31.30 32.14 32.31
Month End Sep’19 Sep’18 2018 YE $/TRY 5.66 5.99 5.26 EUR/$ 1.09 1.16 1.15
$/BRL 4.16 4.00 3.87 $/IDR 14,174 14,929 14,481 $/THB 30.59 32.41 32.45
30
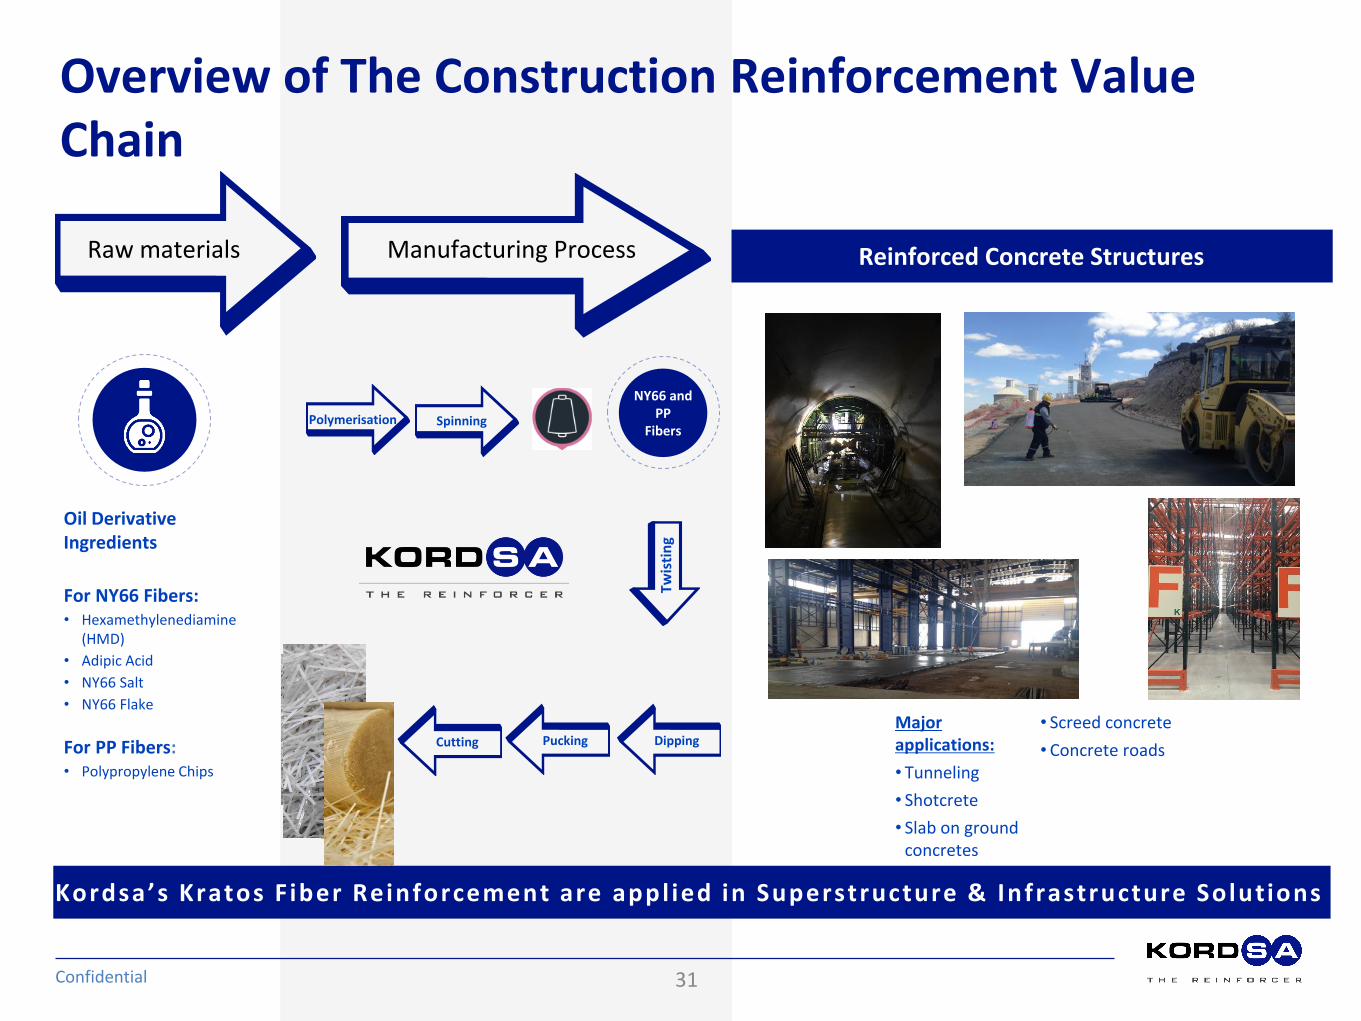
Reinforced Concrete Structures
Overview of The Construction Reinforcement Value Chain
Confidential
Raw materials Manufacturing Process
Kordsa ’ s Kratos F iber Reinforcement are appl ied in Superstructure & Infrastructure Solutions
Major applications:
• Tunneling
• Shotcrete
• Slab on ground concretes
• Screed concrete
• Concrete roads
Oil Derivative Ingredients
For NY66 Fibers: • Hexamethylenediamine
(HMD)
• Adipic Acid
• NY66 Salt
• NY66 Flake
For PP Fibers: • Polypropylene Chips
Spinning
NY66 and PP
Fibers Polymerisation
Twis
tin
g
Dipping Cutting Pucking
31
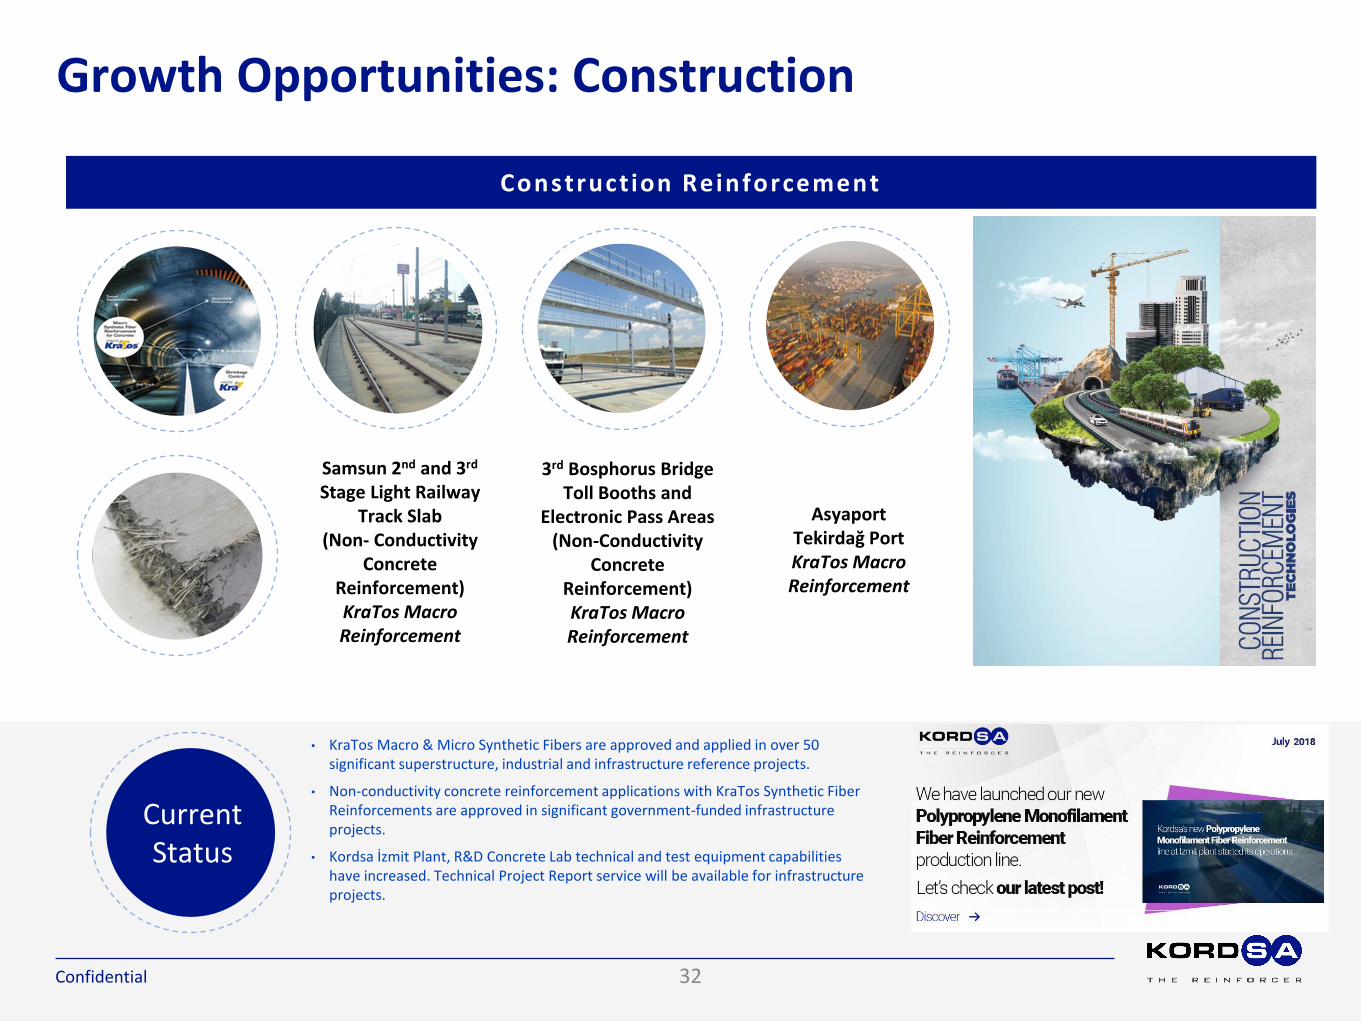
Growth Opportunities: Construction
Confidential
Construction Reinforcement
• KraTos Macro & Micro Synthetic Fibers are approved and applied in over 50 significant superstructure, industrial and infrastructure reference projects.
• Non-conductivity concrete reinforcement applications with KraTos Synthetic Fiber Reinforcements are approved in significant government-funded infrastructure projects.
• Kordsa İzmit Plant, R&D Concrete Lab technical and test equipment capabilities have increased. Technical Project Report service will be available for infrastructure projects.
3rd Bosphorus Bridge Toll Booths and
Electronic Pass Areas (Non-Conductivity
Concrete Reinforcement) KraTos Macro Reinforcement
Samsun 2nd and 3rd Stage Light Railway
Track Slab (Non- Conductivity
Concrete Reinforcement) KraTos Macro Reinforcement
Asyaport Tekirdağ Port KraTos Macro Reinforcement
Current Status
32