konica minolta, inc. 1st quarter/march 2015 consolidated
TRANSCRIPT

Konica Minolta, Inc.
1st Quarter/March 2015 Consolidated Financial Results
(April 1, 2014 – June 30, 2014)- Announced on July 30, 2014 -
Shoei Yamana
President and CEO
Konica Minolta, Inc.
1
Cautionary Statement:
The forecasts mentioned in this material are the results of estimations based on currently
available information, and accordingly, contain risks and uncertainties. The actual results of
business performance may sometimes differ from those forecasts due to various factors.
Remarks:
Yen amounts are rounded to the nearest 100 million.
Main points of 1Q/Mar 2015 financial results
2
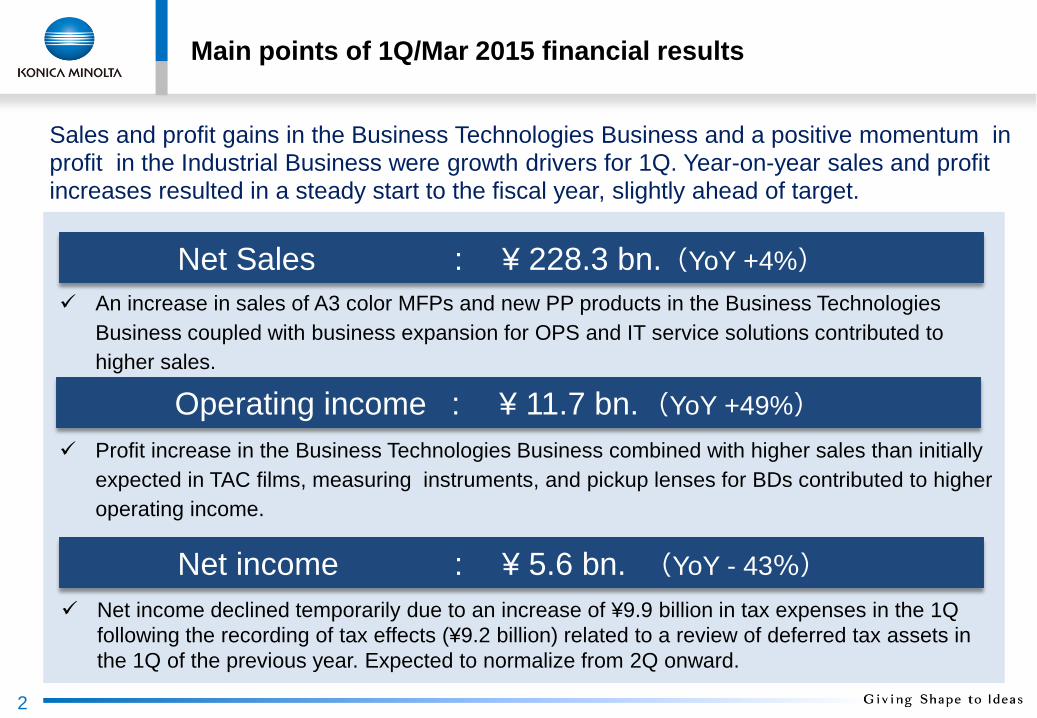
Net Sales : ¥ 228.3 bn.(YoY +4%)
Operating income : ¥ 11.7 bn.(YoY +49%)
Net income : ¥ 5.6 bn. (YoY - 43%)
Sales and profit gains in the Business Technologies Business and a positive momentum in profit in the Industrial Business were growth drivers for 1Q. Year-on-year sales and profit increases resulted in a steady start to the fiscal year, slightly ahead of target.
An increase in sales of A3 color MFPs and new PP products in the Business Technologies
Business coupled with business expansion for OPS and IT service solutions contributed to
higher sales.
Net income declined temporarily due to an increase of ¥9.9 billion in tax expenses in the 1Q
following the recording of tax effects (¥9.2 billion) related to a review of deferred tax assets in
the 1Q of the previous year. Expected to normalize from 2Q onward.
Profit increase in the Business Technologies Business combined with higher sales than initially
expected in TAC films, measuring instruments, and pickup lenses for BDs contributed to higher
operating income.
Acquisition of Own Shares and Cancellation of Treasury Shares
3
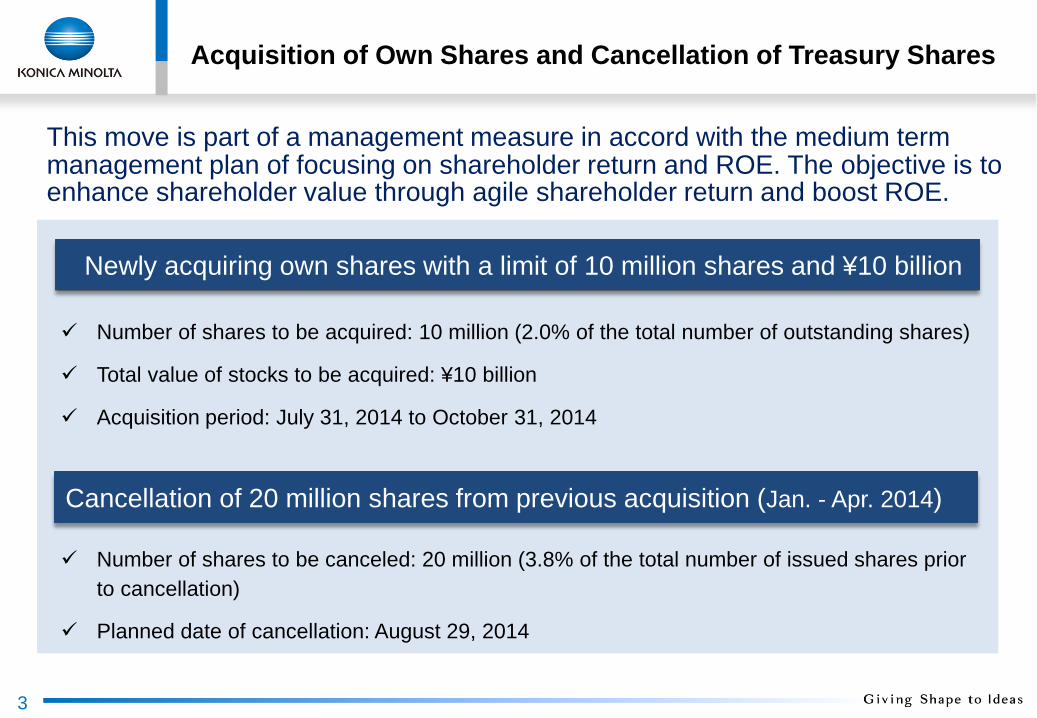
Number of shares to be acquired: 10 million (2.0% of the total number of outstanding shares)
Total value of stocks to be acquired: ¥10 billion
Acquisition period: July 31, 2014 to October 31, 2014
Newly acquiring own shares with a limit of 10 million shares and ¥10 billion
Cancellation of 20 million shares from previous acquisition (Jan. - Apr. 2014)
This move is part of a management measure in accord with the medium term management plan of focusing on shareholder return and ROE. The objective is to enhance shareholder value through agile shareholder return and boost ROE.
Number of shares to be canceled: 20 million (3.8% of the total number of issued shares prior
to cancellation)
Planned date of cancellation: August 29, 2014
1Q/Mar 2015 financial results highlight- overview
4
1Q 1Q
Mar 2015 Mar 2014 YoY
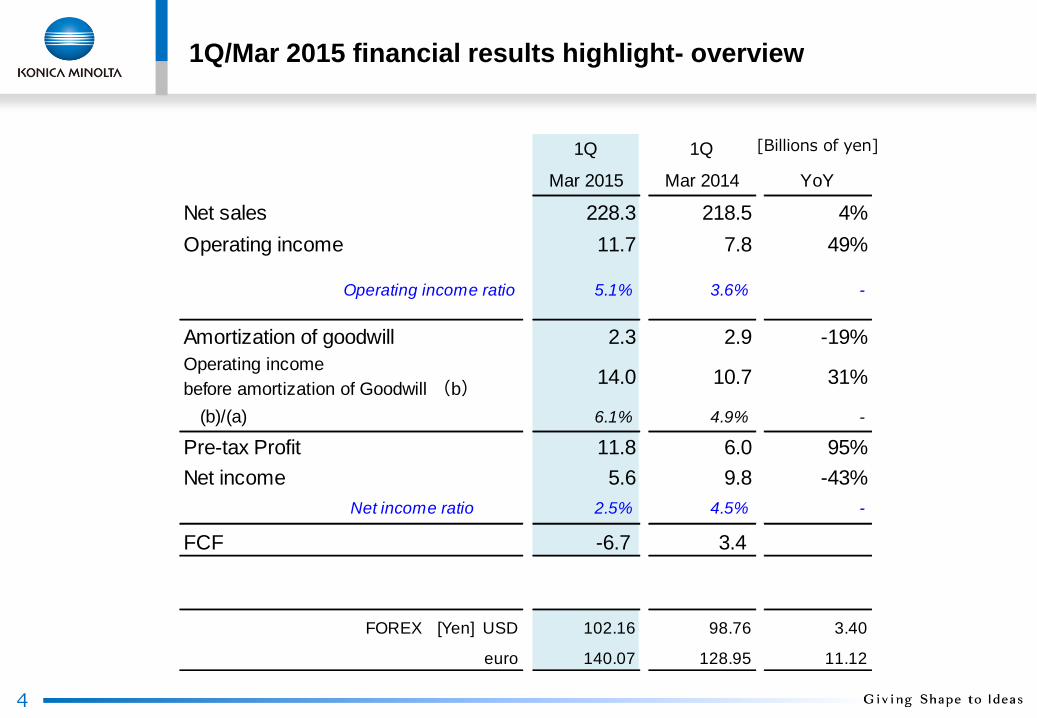
Net sales 228.3 218.5 4%
Operating income 11.7 7.8 49%
Operating income ratio 5.1% 3.6% -
Amortization of goodwill 2.3 2.9 -19%
Operating income
before amortization of Goodwill (b)14.0 10.7 31%
(b)/(a) 6.1% 4.9% -
Pre-tax Profit 11.8 6.0 95%
Net income 5.6 9.8 -43%
Net income ratio 2.5% 4.5% -
FCF -6.7 3.4
FOREX [Yen] USD 102.16 98.76 3.40
euro 140.07 128.95 11.12
[Billions of yen]

1Q/Mar 2015 financial results highlight- segment
5
[Billions of yen]
Net Sales1Q 1Q
Mar 2015 Mar 2014
Business Technologies 181.4 169.8 7%
Office Services 138.2 131.7 5%
Commercial/Industrial print 43.2 38.1 13%
Healthcare 16.1 16.3 -1%
Industrial Business 30.1 31.0 -3%
Industrial Optical Systems 13.3 16.1 -18%
Performance Materials 16.8 14.9 13%
Others 0.8 1.5 -
Group Overall 228.3 218.5 4%
Operating income1Q 1Q
Mar 2015 Mar 2014
Business Technologies 11.8 6.5% 10.1 6.0% 17%
Healthcare 0.0 -0.1% 0.1 0.4% -
Industrial Business 6.6 21.8% 4.3 13.8% 54%
Eliminations and Corporate -6.7 -6.7 -
Group Overall 11.7 5.1% 7.8 3.6% 49%

OfficeServices
Commercial/Industrial print
38.1
138.2
43.2
169.8181.4
10.1
11.86.0%
6.5%
131.7
Business Technologies Business - Overview
6
Manufacturing
cost reduction
Sales Volume
change, others.+1.4
SG&A
change
△4.7
FY13.1Q FY14.1Q
10.1
+2.8
FOREX 11.8Price
Change
△0.8
+3.0
FY13.1Q FY14.1Q FY13.1Q FY14.1Q
Left: Net sales Right: Operating income ●OP Ratio [ ¥ billions ]
Operating Income AnalysisNet sales/Operating income
[ ¥ billions ]
Net Sales: ¥ 181.4 bn. (YoY +7%) Sales increased due to sales growth of core products, expansion of service businesses,
and foreign exchange effects.
Operating income: ¥ 11.8 bn.(YoY +17%) An increase in gross profit associated with sales growth and profit ratio increase in the
production print field contributed to the increase in operating income.
Increase SG&A for transform:△2.7
・ R&D expenses : △1.0
・ New consolidations, BIC,etc.: △1.7

121.9 127.6 128.5
144.7
126.8
9.8
11.1 11.4
11.9
11.3
138.8
131.7
140.0
156.6
138.2
Business Technologies Business:Office Service business – sales performance
Quarterly Net Sales Transition
IT service
Solution
Office
Product
Sales 1Q -summary
¥11.3 bn.(YoY +16%)
¥15.3 bn.(YoY +68%)
¥126.8 bn.(YoY +4%)
¥5.3 bn.(YoY+26%)
OPS Sales
GMA Sales
1Q
FY13
2Q
FY13
3Q
FY13
4Q
FY13
1Q
FY14
7
[¥ billions]
Net sales: ¥ 138.2 bn.(YoY +5%) Sales increased due to sales gains in A3 color units and expansion of hybrid-type sales, mainly in
Europe and the US
Sales of OPS and GMA also grew steadily following reinforcement of global sales systems.
Introduction of OPS to major customer BMW led to expansion into the US, Japan and Asia following Europe.
Gained new contract from a world-class foodstuffs company headquartered in Europe.
Hybrid-type sales penetrated the market, mainly in Europe and the US. The pipeline was also built up further.
Sales of A3 color models increased, mainly in emerging countries.
Sales of color PVs increased due to expansion of color MIFs, mainly in advanced nations.
28.631.6 33.1
38.3
31.7
7.2
6.98.3
8.8
8.62.2
2.4
2.6
2.9
2.9
50.0
40.9
43.9 43.2
38.1
Business Technologies Business:Commercial/Industrial Print Business – sales performance
Production
MPM・Print service
¥2.9 bn.(YoY + 32%)
Sales 1Q -summary
Industrial
Ink-jet
¥8.6 bn.(YoY+ 18%)
¥31.7 bn.(YoY+ 11%)
1Q
FY13
2Q
FY13
3Q
FY13
4Q
FY13
1Q
FY14
8
Quarterly Net Sales Transition
[¥ billions]
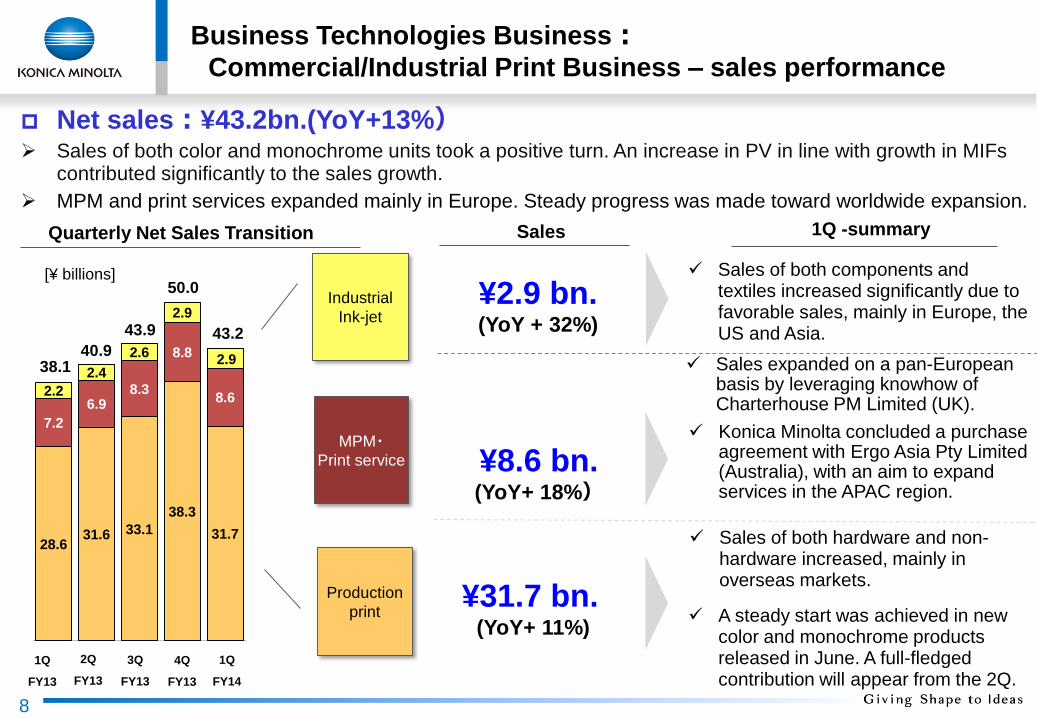
Net sales:¥43.2bn.(YoY+13%) Sales of both color and monochrome units took a positive turn. An increase in PV in line with growth in MIFs
contributed significantly to the sales growth.
MPM and print services expanded mainly in Europe. Steady progress was made toward worldwide expansion.
Sales of both hardware and non-hardware increased, mainly in overseas markets.
Sales of both components and textiles increased significantly due to favorable sales, mainly in Europe, the US and Asia.
Sales expanded on a pan-European basis by leveraging knowhow of Charterhouse PM Limited (UK).
Konica Minolta concluded a purchase agreement with Ergo Asia Pty Limited (Australia), with an aim to expand services in the APAC region.
A steady start was achieved in new color and monochrome products released in June. A full-fledged contribution will appear from the 2Q.

15.2 15.3 17.0 17.4 17.9
53%
49%
51%
45%
56%
-1%
3%1%
-1%
10.0%
11.0%12.0%
11.2%
13.1%
64.5 64.2 67.4 69.2 67.9
53%50% 53%
48%
54%
1.6%
1.7%
2.8%
0.9%0.8%
2Q
FY13
1Q
FY14
<Ref.>Sales results of Non-hard
1Q
FY13
JP
EUUS
ROW
4Q
FY13
3Q
FY13
2Q
FY13
1Q
FY14
1Q
FY13
4Q
FY13
3Q
FY13
2Q
FY13
1Q
FY14
1Q
FY13
4Q
FY13
3Q
FY13
2Q
FY13
1Q
FY14
1Q
FY13
4Q
FY13
3Q
FY13
YoY sales increase of Non-hardSales & ratio of Non-hardYoY sales increase of Non-hard
(regional)
Office product
Production Print
(w/o FOREX) (w/o FOREX)
[¥ billions]
[¥ billions]
【FY2014-1Q】
9
7%
11%
15%
19%
ROWEUUSJP
Healthcare Business - Overview
10
Manufacturing
cost reduction
Sales volume
change, others.
+0.5
SG&A
change
△0.7
+0
FOREX
△0.0
Price
change
△0.2+0.3
16.3 16.1
0.1 △0.0
0.4%
△0.1%
FY13.1Q FY14.1Q FY13.1Q FY14.1Q FY13.1Q FY14.1Q
0.1
Left: Net sales Right: Operating income ●OP Ratio
Operating Income AnalysisNet sales/Operating income
[ ¥ billions ][ ¥ billions ]
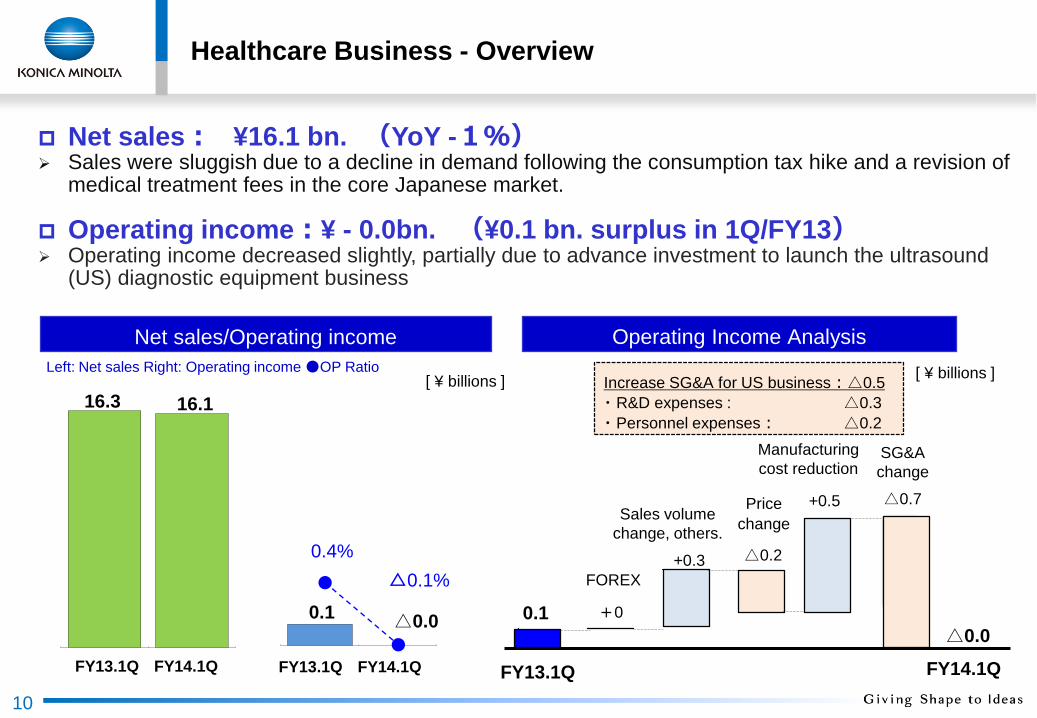
Net sales: ¥16.1 bn. (YoY -1%) Sales were sluggish due to a decline in demand following the consumption tax hike and a revision of
medical treatment fees in the core Japanese market.
Operating income:¥ - 0.0bn. (¥0.1 bn. surplus in 1Q/FY13) Operating income decreased slightly, partially due to advance investment to launch the ultrasound
(US) diagnostic equipment business
Increase SG&A for US business:△0.5
・ R&D expenses : △0.3
・ Personnel expenses: △0.2
Healthcare Business – sales performance
Sales 1Q -Summary
1Q
FY13
2Q
FY13
3Q
FY13
4Q
FY13
1Q
FY14
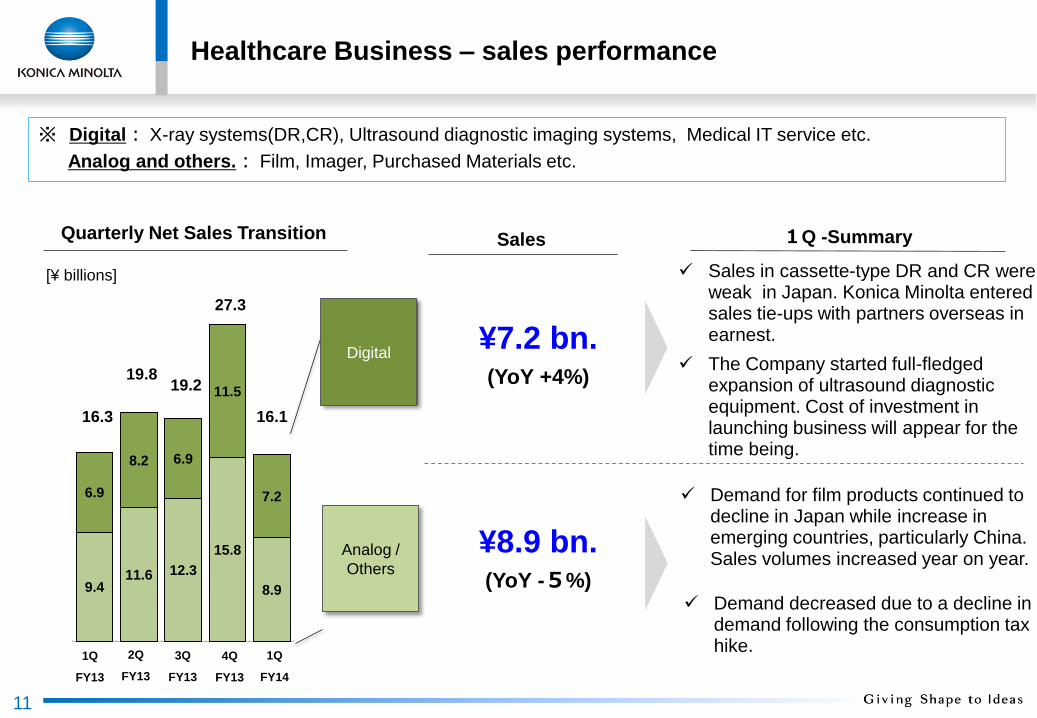
¥8.9 bn.(YoY -5%)
Analog /
Others
Digital
11
※ Digital: X-ray systems(DR,CR), Ultrasound diagnostic imaging systems, Medical IT service etc.
Analog and others.: Film, Imager, Purchased Materials etc.
¥7.2 bn.(YoY +4%)
9.411.6 12.3
15.8
8.9
6.9
8.2 6.9
11.5
7.2
16.3
19.819.2
27.3
16.1
[¥ billions]
Quarterly Net Sales Transition
Sales in cassette-type DR and CR were weak in Japan. Konica Minolta entered sales tie-ups with partners overseas in earnest.
The Company started full-fledged expansion of ultrasound diagnostic equipment. Cost of investment in launching business will appear for the time being.
Demand for film products continued to decline in Japan while increase in emerging countries, particularly China. Sales volumes increased year on year.
Demand decreased due to a decline in demand following the consumption tax hike.
12
Industrial Business - Overview
14.9 16.8
16.1 13.3
31.0 30.1
4.3
6.613.8%
21.8%
Industrial
optical
Systems
Performance
materials
Manufacturing
cost reduction
Sales Volume
change, others +0.4
SG&A
change
+0.5
4.3 +0.1
FOREX
6.6
Price
change
△1.8
+3.3
FY13.1Q FY14.1Q FY13.1Q FY14.1Q FY13.1Q FY14.1Q
Left: Net sales Right: Operating income ●OP Ratio
Operating Income AnalysisNet sales/Operating income
[ ¥ billions ][ ¥ billions ]
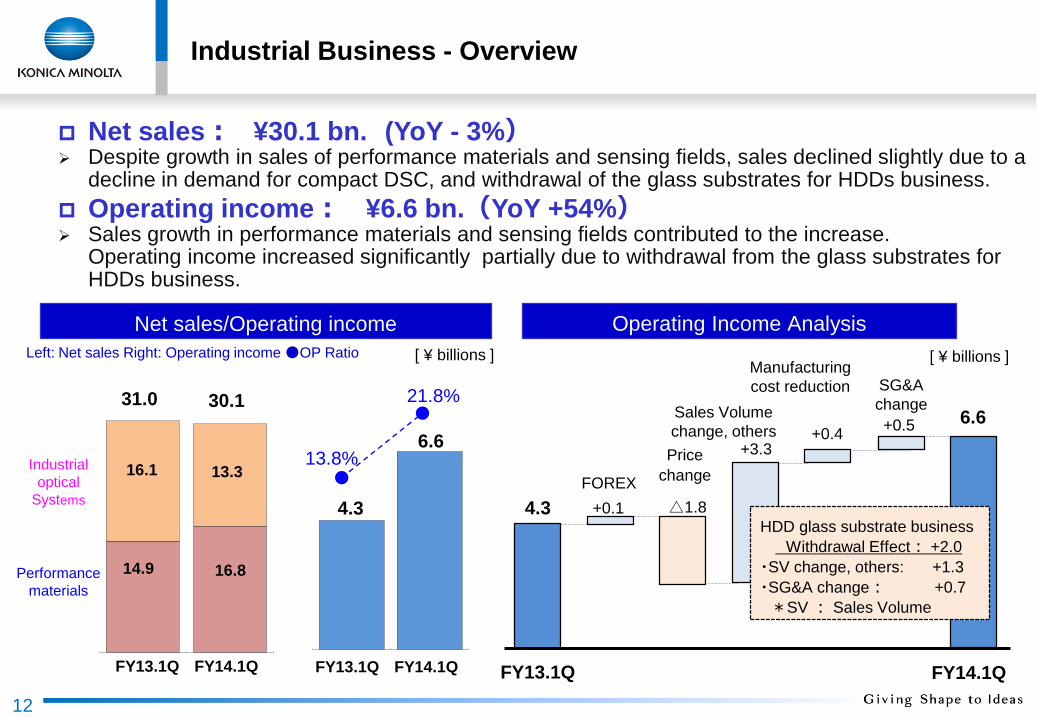
HDD glass substrate business
Withdrawal Effect: +2.0
・SV change, others: +1.3
・SG&A change: +0.7
*SV : Sales Volume
Net sales: ¥30.1 bn. (YoY - 3%) Despite growth in sales of performance materials and sensing fields, sales declined slightly due to a
decline in demand for compact DSC, and withdrawal of the glass substrates for HDDs business.
Operating income: ¥6.6 bn.(YoY +54%) Sales growth in performance materials and sensing fields contributed to the increase.
Operating income increased significantly partially due to withdrawal from the glass substrates for HDDs business.

Industrial business:Industrial Optical Systems – sales performance
Sales 1Q -Summary
¥6.0 bn.
(YoY +12%)
1Q
FY13
2Q
FY13
3Q
FY13
4Q
FY13
1Q
FY14
Industrial &
professional
Lens and
Components
Measuring
instruments
¥3.5 bn.
(YoY -0%)
¥3.8 bn.
(YoY - 47%)Others
13
[¥ billions]
7.2 7.05.3
4.2 3.8
3.5 3.4
4.0
3.2 3.5
5.4 5.4
4.9
4.36.0
13.3
16.1
11.7
15.8
14.3
Quarterly Net Sales Transition
Net sales: ¥13.3 bn.(YoY - 17%) Measuring instruments sales remained solid at Instrument Systems. Pickup lenses for BDs also
continued to be strong for home video game consoles. Sales went down due to market contraction for compact DSCs and the impact of withdrawal from the glass substrates for HDDs business.
Konica Minolta continued to earn
benefits from M&A of IS. Object color
application performance was solid.
Lenses for projectors and
interchangeable lenses for D-SLR
cameras were solid in general.
Pickup lenses remained strong in the
home video game console sector. A
year-on-year decrease was recorded
for DVDs.
Sales decreased in lens units for
compact DSC and mobile phones.

Industrial Business:Performance materials – sales performance
1Q -Summary
For FPD
・ Large size
・ Small & medium size
For new field business
1Q
FY13
2Q
FY13
3Q
FY13
4Q
FY13
1Q
FY14
14
[¥ billions]
14.915.7
13.6 14.1
16.8
Quarterly Net Sales Transition
・ Window film
・ Barrier film
Net sales: ¥16.8 bn.(YoY +13%) Sales volumes of TAC film increased due to market factors such as improvement in small- and
medium-size panels, and improvement in market conditions for LCD TVs associated with reputation for high product quality.
Multiple businesses were established in the new business areas focusing on B2C.
Orders increased for both VA-TAC and
plain TAC due to increase in inch size
and recovering market demand.
Window film sales started in China and
ASEAN through B2C channel.
Barrier film commenced sales for
flexible display applications.
Thin-film products for booming
smartphones and tablets expanded.
Demand for notebook PCs was
stronger than expected following
termination of support for Windows XP
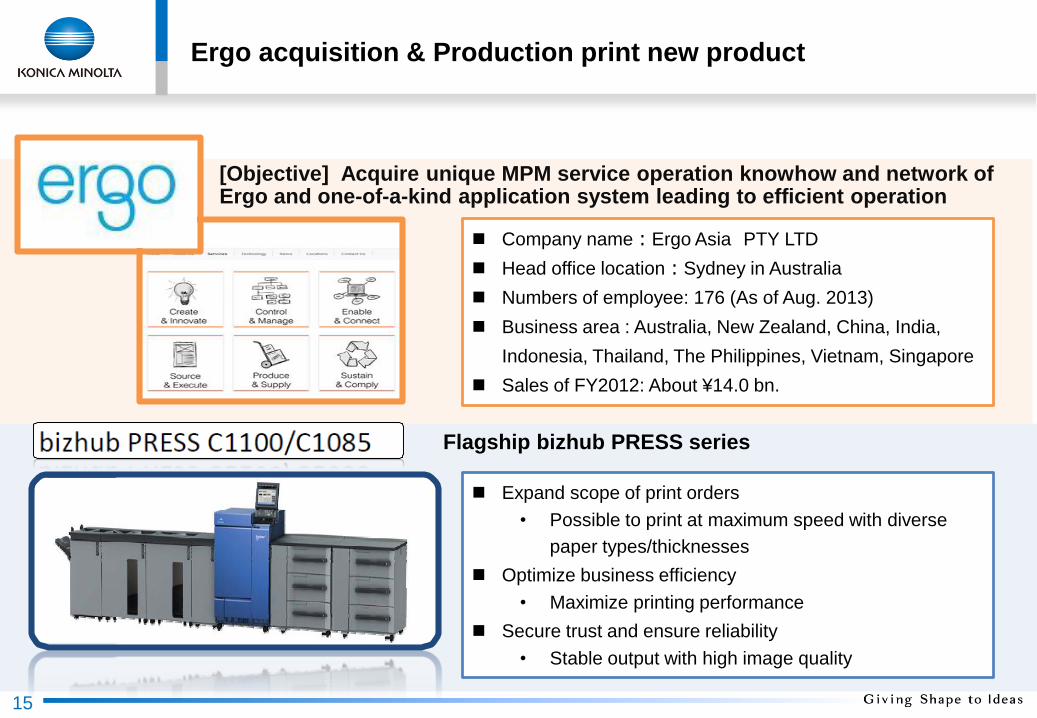
Ergo acquisition & Production print new product
15
Company name:Ergo Asia PTY LTD
Head office location:Sydney in Australia
Numbers of employee: 176 (As of Aug. 2013)
Business area : Australia, New Zealand, China, India,
Indonesia, Thailand, The Philippines, Vietnam, Singapore
Sales of FY2012: About ¥14.0 bn.
Flagship bizhub PRESS series
[Objective] Acquire unique MPM service operation knowhow and network of Ergo and one-of-a-kind application system leading to efficient operation
Expand scope of print orders
• Possible to print at maximum speed with diverse
paper types/thicknesses
Optimize business efficiency
• Maximize printing performance
Secure trust and ensure reliability
• Stable output with high image quality

Strategic progress for realizing “Transform”
- MPM concept & PP new products -
MPM Concept
Establish business foundation
Expand MPM business globally
Further global expansion
Stage 2
Action
*Medium- to large-size CP: 20-200 employees as medium-scale CP
Partner-type competitive axisCreate a print supply system that meets customer needs through partnership and harmonious relationship with CP.
For small- and medium-
size CP markets: Full-
fledged market entry
with partner-type
business model
HPP
MPP
LPP
HPP
MPP
LPP
Vendor- type competitive axisEquipment performance, service, channel
Gain print orders directly from marketing departments of large companies Create symbiotic relationship with medium- and large-size commercial printing companies
and expand business in HPP domain.
Small- and medium-size print
buyers
Small- and medium-size CP
KMMake partners with
medium- and large-size CP
KM
Large print buyers
For LPP market: Continue
to strengthen Vendor-type
sales with bizhub PRESS
C1070/1060
Conventional Business Model MPM Business Model
May 2012
Acquired
November 2012
Charterhouse Acquired
Stage 1
Stage 3
Release new bizhub PRESS
C1100/1085/2250/1250
targeting MPP-HPP market
Expand into other areas including the US
Concluded
agreement to
acquire in June
2014
16

Full-year forecast of FY 2014
17
Net sales : ¥ 1 trillion(YoY +6%)
Operating income : ¥ 62 bn. (YoY +7%)
Net income : ¥ 26 bn. (YoY +19%)
Interim & year-end dividend: ¥10 per share each
FOREX assumption(2Q):1 US$=¥100,1€=¥135 (assumed rate unchanged from initial forecast)
Dividend forecast : ¥ 20 per share(total annual)
※ Increase by ¥2.5 per share on a year-on-year basis
While recognizing the uncertain business environment, initial forecasts (announced on
May 9) remain unchanged in light of steady progress in results for the 1Q driven by
Industrial Business.

Supplementary Information
18

19
1Q/Mar 2015 financial results highlight- overview
1Q 1Q
Mar 2015 Mar 2014 YoY
Net sales(a) 228.3 218.5 4%
Gross income 114.4 102.3 12%
Gross income ratio 50.1% 46.8%
Operating income 11.7 7.8 49%
Operating income ratio 5.1% 3.6% -
Amortization of goodwill 2.3 2.9 -19%
Operating income
before amortization of Goodwill (b)14.0 10.7 31%
(b)/(a) 6.1% 4.9% -
Ordinary income 10.4 7.1 48%
Pre-tax Profit 11.8 6.0 95%
Net income 5.6 9.8 -43%
Net income ratio 2.5% 4.5% -
EPS [Yen] 10.97 18.43
CAPEX 14.2 11.5
Depreciation 11.6 11.6
R&D expenses 18.3 17.3
FCF -6.7 3.4
Investment and loan 7.2 2.5
FOREX [Yen] USD 102.16 98.76 3.40
euro 140.07 128.95 11.12
[Billions of yen]

[Billions of yen]
Forecast Results
Mar 2015 Mar 2014 YoY
Net sales 1,000.0 943.8 6%
Operating income 62.0 58.1 7%
Operating income ratio 6.2% 6.2%
Ordinary income 57.0 54.6 4%
Net income 26.0 21.9 19%
Net income ratio 2.6% 2.3%
EPS [Yen] 51.51 41.38
ROE(%) 5.6% 4.6%
CAPEX 60.0 47.4
Depreciation 55.0 47.4
R&D expenses 75.0 71.2
FCF 2.0 34.2
Investment and loan 40.0 14.5
FOREX [Yen] USD 100.00 100.24
euro 135.00 134.37
20
FY2014 financial forecast highlight - overview
FOREX impact per 1yen movement
(Full year)
Net sales Operating income
3.0 0.4
1.4 0.8

YOY
Business Technologies 800.0 739.9 8%
Office Services 600.0 567.1 6%
Commercial/Industrial print 200.0 172.9 16%
Healthcare 90.0 82.4 9%
Industrial Business 110.0 116.1 -5%
Industrial Optical Systems 61.0 57.8 5%
Performance Materials 49.0 58.3 -16%
Others 0.0 5.3 -
Group Overall 1,000.0 943.8 6%
Business Technologies 72.0 9.0% 66.6 9.0% 8%
Healthcare 7.0 7.8% 4.5 5.5% 56%
Industrial Business 12.0 10.9% 15.2 13.1% -21%
Eliminations and Corporate -29.0 - -28.2 - -
Group Overall 62.0 6.2% 58.1 6.2% 7%
Mar 2014Net Sales
Forecast Results
Mar 2015
Operating incomeForecast Results
Mar 2015 Mar 2014
21
FY2014 financial forecast highlight - segment
[Billions of yen]
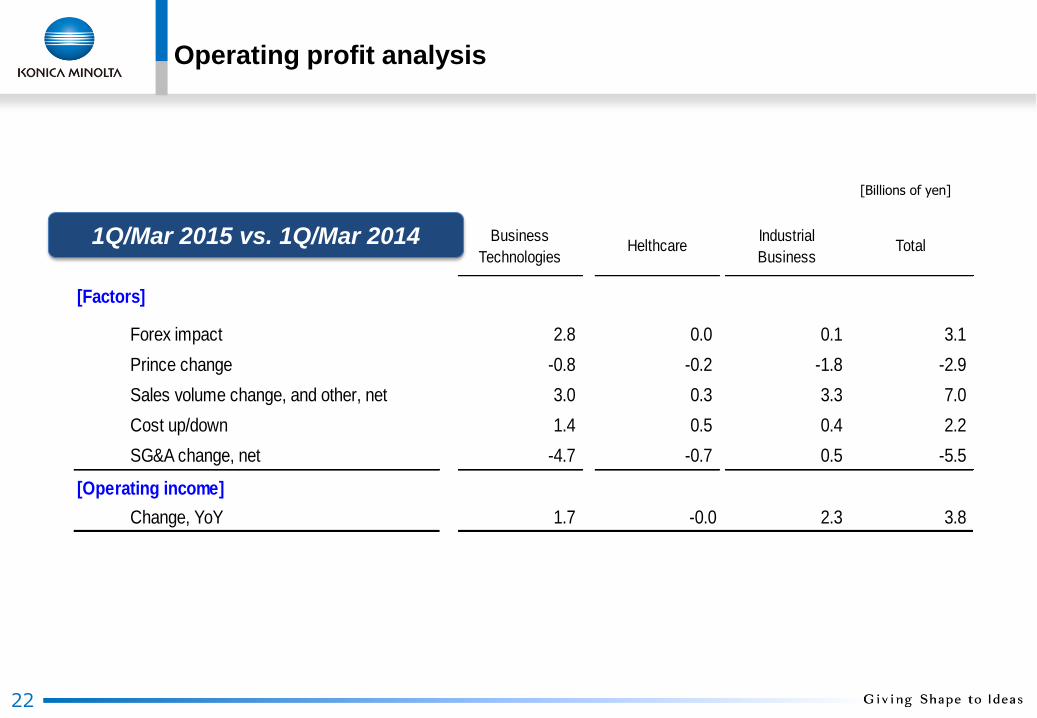
Operating profit analysis
22
Business
TechnologiesHelthcare
Industrial
BusinessTotal
Forex impact 2.8 0.0 0.1 3.1
Prince change -0.8 -0.2 -1.8 -2.9
Sales volume change, and other, net 3.0 0.3 3.3 7.0
Cost up/down 1.4 0.5 0.4 2.2
SG&A change, net -4.7 -0.7 0.5 -5.5
Change, YoY 1.7 -0.0 2.3 3.8
[Operating income]
[Factors]
[Billions of yen]
1Q/Mar 2015 vs. 1Q/Mar 2014

23
SGA, non-operating and extraordinary income/loss
[Billions of yen]
SG&A:
Mar 2015
1Q
Mar 2014
1QYoY
Selling expenses - variable 12.9 11.6 1.3
R&D expenses 18.3 17.3 1.0
Labor costs 44.4 40.7 3.7
Other 27.2 24.9 2.2
SGA total* 102.7 94.5 8.2
* Forex impact: + \ 2.7 bn. (Actual: \5.5 bn.)
Non-operating income/loss:
Interest and dividend income/loss, net 0.2 -0.1 0.2
Foreign exchange gain, net -0.1 -0.4 0.3
Other -1.3 -0.3 -1.0
Non-operating income/loss, net -1.2 -0.8 -0.4
Extraordinary income/loss:
Sales of noncurrent assets, net 1.3 -0.3 1.6
Sales of investment securities 0.0 0.0 -0
Business structure improvement expenses - -0.6 0.6
Other 0.0 -0.1 0.1
Extraordinary income/loss, net 1.3 -1.0 2.4

24
Cash flows
[Billions of yen]
1Q
Mar 2015
1Q
Mar 2014YoY
Income before income taxes and minority
interests11.8 6.0 5.7
Depreciation and amortization 11.6 11.6 0.0
Income taxes paid -5.1 -5.6 0.4
Change in working capital -11.6 2.8 -14.4
I.Net cash provided by
operating activities6.7 14.9 -8.2
II.Net cash used in
investing activities-13.4 -11.5 -1.9
I.+ II. Free cash flow -6.7 3.4 -10.1
Change in debts and bonds -6.0 0.9 -6.9
Purchase of treasury shares -3.5 0.0 -3.5
Cash dividends paid -3.8 -3.8 0.1
Other -0.4 -0.5 0.1
III.Net cash used in
financing activities-13.7 -3.4 -10.3

25
B/S
[Billions of yen]
Assets: Jun 2014 Mar 2014 Change
Cash and short-term investment securities 167.7 188.5 -20.8
Notes and A/R-trade 200.1 220.1 -20.0
Inventories 120.2 115.3 4.9
Other 63.8 65.4 -1.6
Total current assets 551.8 589.3 -37.5
Tangible assets 175.6 173.4 2.2
Intangible assets 111.1 111.4 -0.3
Investments and other assets 97.4 92.0 5.4
Total noncurrent assets 384.0 376.7 7.3
Total assets 935.9 966.1 -30.2
Liabilities and Net Assets:
Notes and A/P-trade 84.9 96.2 -11.3
Interest bearing debts 189.3 196.1 -6.9
Other liabilities 194.1 193.6 0.5
Total liabilities 468.3 486.0 -17.7
Total shareholders' equity* 465.9 478.4 -12.5
Other 1.7 1.7 0.0
Total net assets 467.5 480.1 -12.5
Total liabilities and net assets 935.9 966.1 -30.2
[yen]
June 2014 Mar 2014 YoY
US$ 101.36 102.92 -1.56
euro 138.31 141.65 -3.34
Main indicators
Mar 2014 Jun 2014
D/E ratio 0.41 0.41
Inventories turnover (Month) 2.52 3.17
Shareholders' equity(%) 49.5 49.8

26
Unit sales trend: Business Technologies
100 101
113 119
111
1Q 2Q 3Q 4Q
Mar 2014 Mar 2015
100 101 106
110
102
1Q 2Q 3Q 4Q
Mar 2014 Mar 2015
100
122 116
156
108
0 0 0 1Q 2Q 3Q 4Q
Mar 2014 Mar 2015
100
118 106
132
104
0 0 0 1Q 2Q 3Q 4Q
Mar 2014 Mar 2015
100
148
126
156
106
0 0 0 1Q 2Q 3Q 4Q
Mar 2014 Mar 2015
Production Non-hardware*
Color Production Print – Units* A3 color MFP – Units*
(w/o forex effects)
* Base index : “1Q Mar2014”= 100
YoY: +4%
Mono Production Print – Units*
Office Non-hardware *
A3 mono MFP – Units*
(w/o forex effects)
100 103 90
109
88
0 0 0 1Q 2Q 3Q 4Q
Mar 2014 Mar 2015
YoY: +8% YoY: +4%
YoY: -12% YoY: +6% YoY: +11%

27

28

29

30

31