kongsberg automotive asa - cisionmb.cision.com/main/1438/2461332/798494.pdf · – north american...
TRANSCRIPT

Kongsberg Automotive ASA
Fourth quarter 2017 - February 28, 2018

2
Highlights for Q4 2017
Revenues
• We achieved MEUR 267.4 in revenues which is an increase of MEUR 17.6
(7.1%) compared to Q4 2016, including negative currency translation effects of
MEUR -9.8.
• Annualized business wins in the fourth quarter amounted to MEUR 122, bringing
the total business wins for 2017 to MEUR 291. This compares to MEUR 119 and
MEUR 281 for Q4 2016 and 2016, respectively.
Performance
• Adjusted EBIT was MEUR 13.0, up MEUR 5.6 compared to Q4 2016.
• We successfully closed the Heiligenhaus plant.
• We agreed to sell the ePower business in December, and closed the transaction
on January 15th, 2018.
Gearing • The adjusted gearing ratio at the end of Q4 2017 was 2.4x NIBD/EBITDA.

3
▸ 2017 was our first full year of improvement activities and we performed well in becoming a better
organization and established a good spirit.
▸ We further worked on our improvement plan, communicated and implemented it rigorously.
▸ We strengthened our senior leadership team with a good mix of people from inside and outside
and started to act as a global company.
▸ We also aligned our remuneration principles to the overall objectives of the company and those of
our shareholders demonstrating our transition towards a performance-driven organization.
▸ From seven planned factory closures we completed two, two are solidly underway, one is still
delayed and two have not yet been initiated due to the delay.
– We are behind on one closure that again delays the last to closures as the receiving plants to a large extent
are the same. We expect the one delayed closure to be finalized no later than the end of Q2, 2018.
▸ We completed the sale of our North American headrest and armrest business and agreed to sell
our ePower business.
– We also pruned our portfolio of some small sub-scale products as we closed down our Basildon and
Heiligenhaus plant.
▸ Our new Headquarter is fully functional and the benefits are starting to show. Step one of our
principal model was implemented in 2017.
– One of our goals was to reduce our tax cost. In 2017, we were impacted by a non-cash write-down of our
US deferred tax assets (MEUR 8) due to the US tax reform. Excluding this effect, we were satisfied that our
overall tax cost was reduced significantly compared to our old business model.
– Although the write down of our US deferred tax assets was a direct “hit” to our 2017 net income, the future
cash and tax cost impacts of the reduced U.S. tax rates will, however, be positive for KA.
Q4 2017 concludes an eventful year 2017 (1/3)Organizational changes

4
▸ Our 2017 new business wins amounted to €291 million, up from last year’s €281 million.
– This ensures continued top line growth in coming years. It is particularly encouraging that the 2017 business
wins consisted of many smaller programs compared to earlier years. This reduces our exposure to single
large programs.
▸ After deciding to keep our Light Duty Cable (LDC) business, we have revitalized this business
and are seeing good first results in the form of awarded business for LDC.
– In 2017, we booked more new LDC business than in any of the preceding 5 years.
▸ We successfully launched possibly the biggest single program in KA’s history within the P&C
segment in our Nuevo Laredo facility for an automated manual heavy duty transmission program.
▸ Both the passenger car and commercial vehicle markets held up very well in 2017 with growth in
most geographies for both markets.
– From a profitability standpoint, this underlying growth helped make up for other external headwinds,
particularly the increased raw material commodities pricing and some unfavorable exchange rate
movements.
Q4 2017 concludes an eventful year 2017 (2/3)Business update
5
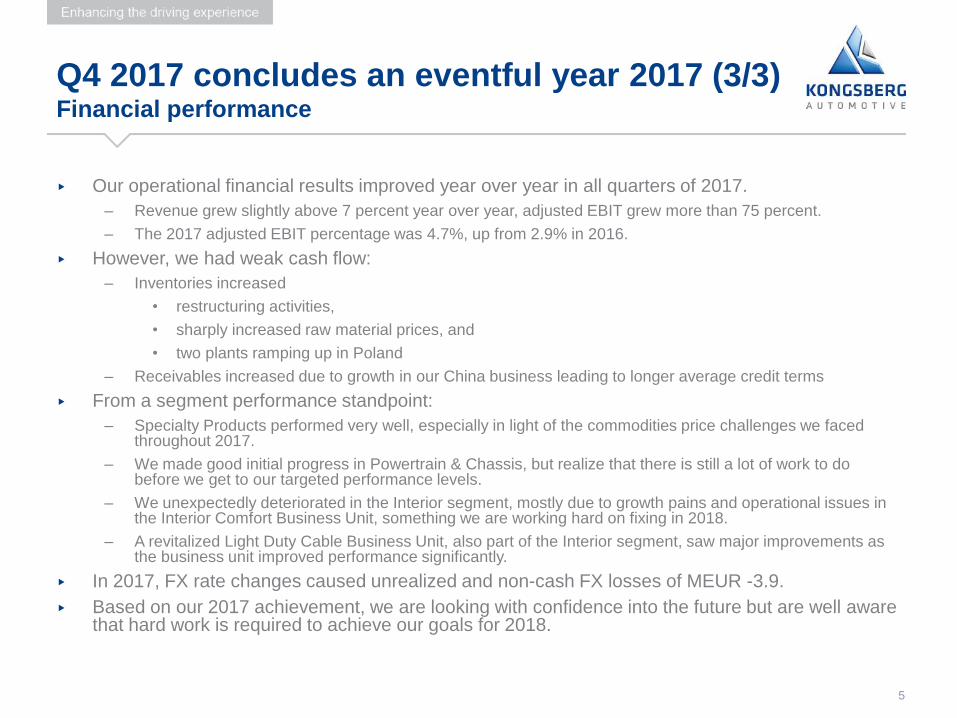
▸ Our operational financial results improved year over year in all quarters of 2017.
– Revenue grew slightly above 7 percent year over year, adjusted EBIT grew more than 75 percent.
– The 2017 adjusted EBIT percentage was 4.7%, up from 2.9% in 2016.
▸ However, we had weak cash flow:
– Inventories increased
• restructuring activities,
• sharply increased raw material prices, and
• two plants ramping up in Poland
– Receivables increased due to growth in our China business leading to longer average credit terms
▸ From a segment performance standpoint:
– Specialty Products performed very well, especially in light of the commodities price challenges we faced throughout 2017.
– We made good initial progress in Powertrain & Chassis, but realize that there is still a lot of work to do before we get to our targeted performance levels.
– We unexpectedly deteriorated in the Interior segment, mostly due to growth pains and operational issues in the Interior Comfort Business Unit, something we are working hard on fixing in 2018.
– A revitalized Light Duty Cable Business Unit, also part of the Interior segment, saw major improvements as the business unit improved performance significantly.
▸ In 2017, FX rate changes caused unrealized and non-cash FX losses of MEUR -3.9.
▸ Based on our 2017 achievement, we are looking with confidence into the future but are well aware that hard work is required to achieve our goals for 2018.
Q4 2017 concludes an eventful year 2017 (3/3)Financial performance

Market Summary

7
New business wins in Q4 2017
New business wins LTM (per annum value)EUR Million
New business wins per quarter (per annum value)EUR Million
36
5966
119
36
7162
122
20
40
60
80
100
120
140
Q1-16 Q2-16 Q3-16 Q4-16 Q1-17 Q2-17 Q3-17 Q4-17
302
290288
281 281
292
288
291
270
275
280
285
290
295
300
305
Q1-16 Q2-16 Q3-16 Q4-16 Q1-17 Q2-17 Q3-17 Q4-17

8
Market summary
▸ Global Passenger Car Production
– Global light vehicles production was 95.3 million units in
2017, which was up 2.3% from last year.
– Production in Europe increased 3.7% compared to
2016, main driver were France, Russia and Turkey.
– North American production decreased by 3.9% in 2017.
The US and Canadian market even decreased by more
than 8%. However, the US market had a strong shift
towards more higher priced vehicles.
– Production in South America, has shown the long
awaited turn around and increased by 20.3% in 2017.
– Growth in Asia was moderate in 2017 with 2.0% in
China and 3.2% outside of China.Source: IHS Light Vehicle Production Base, December 2017
23.0
Q3-16
25.1
Q1-17Q1-16
22.0
Q2-16
24.3
Q4-16
23.0 22.5
Q2-17
23.0
Q3-17 Q4-17
25.4
Global Passenger Car Production, Units in millions
794834
794801764
614
695676
Q3-16 Q1-17Q4-16Q2-16 Q3-17 Q4-17Q2-17Q1-16
Source: LMC Global Commercial Vehicle Forecast, Q4 2017
Global Truck Production, Units in thousands ▸ Global Truck Production
– Production of medium and heavy-duty commercial
vehicles increased by 17.2% in 2017 to 3.2 million
vehicles. The strong growth in 2017 derived mainly from
the Chinese market (+38.5%) where advanced truck
purchases extended into 2017 driven by expectation for
future tightened emissions regulations.
• Production in Europe increased by 5.1%, Asian
production outside of China only increased by 0.9%
in 2017.
• The North and South American production bounced
back after decreases in 2016 with growth rates of
8.9% and 35.5% respectively in 2017.

9
▸ We sell to OEMs and Tier 1 companies
▸ KA has a diversified and well-balanced customer base
KA’s customer base
0%
1%
2%
3%
4%
5%
6%
7%
8%
9%
10%
Shar
eo
fKA’s
Tota
l Rev
enu
e
OEM customers Tier1 customers

Operational Summary

11
▸ Revenues of MEUR 66.5, up MEUR 6.5 compared to Q4 2016
– Revenue growth in both the European and Chinese comfort business was offset by a decrease in both the
North American business.
– Negative currency effects of MEUR 1.1
▸ Adjusted EBIT of MEUR 1.2, up MEUR 0.3 compared to Q4 2016
– The still unsatisfactory low EBIT was related to continuing industrialization costs of new production lines,
negative FX effects and negative change in raw material prices. This was partially offset by higher sales
volume and lower R&D costs.
▸ In Q4, Interior booked new business wins worth a total of MEUR 28.5 annualized, primarily in
China
InteriorOperational update for Q4 2017
Pro forma without HR/AR business sold in Q1 2017

12
▸ Revenues of MEUR104.8, up by MEUR 10.9 from Q4 2016
– Revenue growth in all regions
– Negative currency effects of MEUR -4.2
▸ Adjusted EBIT of MEUR 1.6, up 1.2 MEUR compared to Q4 2016
– Higher sales volumes and cost improvements, partially offset by plant and product start-up costs and
increased raw material prices
▸ In Q4, Powertrain & Chassis booked new business wins worth a total of MEUR 44.2 annualized
– Shift by Wire products to a major Chinese OEM, with estimated annual value of approximately MEUR 19.5
– SOP in early 2019 from KA’s manufacturing facility in Wuxi, China
▸ Rationalizing the footprint and reduction of fixed costs
– The closure of the Heiligenhaus plant (Germany) was completed in Q4
– The closure of the Rollag plant (Norway) is progressing and is now expected to be completed in Q2 2018
Powertrain & ChassisOperational update for Q4 2017

13
▸ Revenues of MEUR 96.1, up MEUR 9.4 from Q4 2016
– The sales growth was mainly driven by growth in the Couplings commercial vehicle business in China and
FTS industrial business in Europe
– Negative currency effect of MEUR -4.5
▸ Adjusted EBIT of MEUR 12.7, up MEUR 3.0 compared to Q4 2016
– Higher sales volume partially offset by increased material and freight costs
▸ In Q4, Specialty Products booked new business wins worth MEUR 49.6 annualized
– Couplings was awarded contract to supply couplings to a major global truck manufacturer with estimated
annual value of MEUR 7.0
▸ Closure of the manufacturing plants in Easley and Burton are progressing in line with plan
– The operations will be discontinued by the third and fourth quarters of 2018, respectively
Specialty ProductsOperational update for Q4 2017

Financial Update
Norbert Loers

15
Special financial analysis items for 2017
Sale of
Headrest
Armrest
Business
• In line with the audited annual report 2017, but different from Q1 to Q3 2017
quarterly reports, the North American headrest and armrest business will not be
reported as „discontinued business“. Consequently, HR/AR figures are included in
2017 actual and 2016 comparative figures. In 2016, HR/AR accounted for
revenues of MEUR 41.9 (Q4: MEUR 9,1) and Adjusted EBIT MEUR 0.6 (Q4:
MEUR 1.0).
Interest
Expense and
FX effects
• Compared to 2016, our interest expense increased by MEUR 3.2 (Q4: MEUR 1.3)
in 2017 driven by higher waiver period interest margins and higher underlying
LIBOR rates for the USD portion of the bank loan.
• FX rate changes caused unrealized and non cash FX losses of MEUR -7.8.
These losses were not anticipated in our CMD 2017 guidance on „financial items“.
Taxes and
Net Profit
• Per Dec 31st, the US tax reform triggered an extraordinary non cash write-down
of our U.S. deferred tax asset (“DTA”) by MEUR -8.0. Although this is a direct “hit”
to our 2017 net income, the future cash and tax cost impacts of the reduced U.S.
tax rates are positive for KA.
Net Profit• Both the FX and tax non cash effects (the MEUR -7.8 FX loss and the -8.0 DTA
write-down) negatively impacted our Q4 Net Income by a combined MEUR -15.8
versus the CMD 2017 guidance. Without these unexpected effects, our Net
Income would have been MEUR 4.5; in line with our CMD guidance of MEUR 4.0.

16
Revenue and Adjusted EBIT
15.2 13.9
7.7
13.0
5.4% 5.2%
3.2%
4.8%
12.6
9.1
(0.8)
7.4
4.9%
3.6%
-0.3%
3.0%
Q1 Q2 Q3 Q4
Adjusted EBIT and Adjusted EBIT margin**MEUR and percent
Note: *) Including HRAR; **) EBIT adjusted for restructuring. See details in the quarterly report.

17
Q4 2017 - Revenue development
Revenue:
► MEUR 17.6 (7.1%) above the
fourth quarter 2016
► Growth in all segments
► Growth driven by Europe and
China
► New programs
Note: *) Variances excluding FX translation effects
RevenuesMEUR

18
Full Year 2017 - Revenue development
Revenue:
► MEUR 70.9 (7.2%) above 2016
► Growth in all segments
► Growth mainly driven by Europe and China
► Interior: mainly driven by the phasing out programs in the global head-restraint business in North America, partly offset by increased sales in the Interior comfort business in Europe and China.
► P&C: growth mainly related to increased sales of gear shift systems in the passenger car business in Europe, China and America.
► SPP: mainly driven by strengthened air couplings business in Europe and China, and increased sales in Europe for the commercial vehicle business.
Note: *) Variances excluding FX translation effects
RevenuesMEUR

19
Q4 2017 - Adjusted EBIT development
Adjusted EBIT:
► MEUR 5.6 above the fourth quarter
2016
► Interior: Only smalls improvements
due to operational challenges, raw
material and negative transactional
FX effects. Partially offset by the
higher sales volumes.
► P&C: Positive impacts from higher
volumes and lower R&D costs,
partially offset by the increase of raw
material prices and start-up costs
► SPP: Driven by higher sales
volumes and lower R&D costs in
part offset by costs increase in
material and freight
► Other: Mainly reduced group
overhead costs
Note: *) Variances excluding FX translation effects and restructuring costs
Adjusted EBITMEUR

20
Full Year 2017 - Adjusted EBIT development
Adjusted EBIT:
► MEUR 21.5 above 2016
► Interior: related to negative changes
in raw material prices and higher
costs related to supplier issues,
partially offset by lower engineering
and development costs.
► P&C: mainly related to the effect of
higher volumes, partially offset by
product start-up costs and increased
raw material prices.
► SPP: driven by higher sales
volumes, partially offset by
increased raw material costs.
► Other: Mainly reduced group
overhead costs
Note: *) Variances excluding FX translation effects and restructuring costs
Adjusted EBITMEUR

21
Q4 2017 - Net Profit development
Net profit:
► Q4 2017 follows the same
drivers as for the full year
2017 (see comments
following slide)
Note: *) Variance excluding FX translational effects
Net ProfitMEUR

22
Full Year 2017 - Net Profit development
Note: *) Variance excluding FX translation effects
Net ProfitMEUR
Net profit:
► Higher adjusted EBIT driven by stronger sales volume
► Higher interest cost by increased interest margins and LIBOR
► Influenced by a one-time MEUR -8.0 tax effect in USA
► Impacted by higher restructuring cost

23
Free Cash Flow
Fourth quarter Free Cash Flow before debt
repayments:
► Cash flow from operating activities decreased
from MEUR 40.6 in Q4 2016 to MEUR 13.5 in
Q4 2017 due to higher taxes paid, increase of
Net Working Capital (restructuring bank build)
and cash out related to restructuring (MEUR
10.6 cash out during the quarter)
► Investments of MEUR 17.2
► Increase of interest expenses due to bank
waiver conditions and higher LIBOR rates
-7
13
-10
17
-4
8
-18
-9
-20.0
-15.0
-10.0
-5.0
0.0
5.0
10.0
15.0
20.0
Q12016
Q22016
Q32016
Q42016
Q12017
Q22017
Q32017
Q42017
Net Free Cash Flow MEUR

24
Q4 2017 - Cash flow and facility development
Available fundsMEUR
Note: *) Excluding Restructuring; **) Excluding unrealized foreign currency gains/losses, ***) Including MEUR 0.7 increase of restricted cash

25
FY 2017 - Cash flow and facility development
Available fundsMEUR
Note: *) Excluding Restructuring; **) Excluding unrealized foreign currency gains/losses, ***) Including MEUR 1.2 increase of restricted cash

26
Financial ratios
Note: *) Excluding restructuring costs, see details in the quarterly report.
6.2% 6.8%7.9%
9.9%11.2%
Q4 2016 Q1 2017 Q2 2017 Q3 2017 Q4 2017
Adjusted ROCE (Ltm)*
30.2%29.1% 29.4%
28.5%26.4%
Q4 2016 Q1 2017 Q2 2017 Q3 2017 Q4 2017
Equity ratio
2.8 2.72.4 2.4 2.4
Q4 2016 Q1 2017 Q2 2017 Q3 2017 Q4 2017
Adjusted NIBD/EBITDA* (Ltm)

27
Segment financials 4th quarter
87
103 100
8796
Specialty Products
Revenues
0.4
-1.3
0.1 1.11.6
0.4%
-1.3%
0.1%1.1% 1.5%
Q42016
Q12017
Q22017
Q32017
Q42017
Adjusted EBIT
94102 105
96105
Powertrain & ChassisRevenues
Revenues and Adjusted EBIT*MEUR and percent
9.6
14.8 14.6
9.0
12.7
11.1%14.4% 14.6%
10.4%13.2%
Q42016
Q12017
Q22017
Q32017
Q42017
Adjusted EBIT
1.9
6.5
1.8
0.51.2
2.8%
8.6%
2.9%0.8% 1.9%
Q42016
Q12017
Q22017
Q32017
Q42017
Adjusted EBIT
Note: *) Including HRAR; **) Excluding restructuring costs, see details in the quarterly report.

28
Breakdown of financial items
-1.5-2.3 -2.4 -2.3 -2.8
-7.8
0.2
-2.7
3.9
-7.5
-0.5
-0.4
-0.3
-0.4
-0.3
(9.8)
(2.6)
(5.4)
1.2
(10.5)
Q4 2016 Q1 2017 Q2 2017 Q3 2017 Q4 2017
Other items Currency effects
Net interest Net financial items
Net financial itemsMEUR
Net financial items:
► Net interest in line with bank loan
utilization
► Unrealized currency loss of MEUR 7.8
in Q4 2017

Summary & Outlook

30
Summary
▸ We delivered in 2017 consistent financial improvements year over year in all quarters
of 2017 and achieved our Revenue and Adjusted EBIT projections outlined in the
CMD 2016.
▸ We are confident, that 2018 will be a year of continued and measurable progress and
that we will achieve our financials as outlined in the last CMD. We are certain that
with our operational improvement projects, we will bring additional values to our
customers, shareholders, employees and all other stakeholders of KA.
▸ Revenues in Q1 2018 are expected to be MEUR 280, an increase of
MEUR 10 compared to Q1 2017 excl. HR/AR business.