knowledge networks as channels and conduits: the effects of
TRANSCRIPT

Knowledge Networks as Channels and Conduits: The Effects of Spillovers in the Boston Biotechnology Community*
[Word count 9412, inclusive] ***FORTHCOMING, Organization Science***
FINAL VERSION – 12/01/03
Jason Owen-Smith Walter W. Powell [email protected] [email protected] Department of Sociology 509 Ceras Bld. 1225 S. University Ave. Stanford University Ann Arbor, MI 48104-2590 Stanford, CA 94305-3084 Abstract: We contend that two important, non-relational, features of formal inter-organizational networks -- geographic propinquity and organizational form -- fundamentally alter the flow of information through a network. Within regional economies, contractual linkages among physically proximate organizations represent relatively transparent channels for information transfer as they are embedded in an ecology rich in informal and labor market transmission mechanisms. Similarly, we argue that the spillovers that result from proprietary alliances are a function of the institutional commitments and practices of members of the network. When the dominant nodes in an innovation network are committed to open regimes of information disclosure, the entire structure is characterized by less tightly monitored ties. The relative accessibility of knowledge transferred through contractual linkages to organizations, which are not a party to specific ties, determines whether innovation benefits accrue broadly to membership in a coherent network component or narrowly to centrality. We draw upon novel network visualization methods and conditional fixed effects negative binomial regressions to test these arguments for a sample of human therapeutic biotechnology firms located in the Boston metropolitan area. Keywords: knowledge networks, economic geography, spillovers, biotechnology, patenting We acknowledge research support from the National Science Foundation (Grant #0097970), the Merck Foundation (EPRIS Project), and the Hewlett Foundation through a grant to the Santa Fe Institute. This paper has been improved by thoughtful comments from the editor and from three very helpful anonymous reviewers. Bruce Kogut, Ken Koput, Mark Mizruchi, Richard Nelson, John Padgett, and Kjersten Bunker-Whittington also provided excellent feedback. We have benefited from comments from audience members at seminars given at the Department of Management Science and Engineering at Stanford University, the conference on Science as an Institution at the University of Siena, the National Bureau of Economic Research's productivity workshop, the 2002 Sunbelt meetings, and the Economic Sociology Seminar and the Center for Research on Electronic Work seminar, both at the University of Michigan. All errors and omissions are, of course, our own.
1

Introduction A central tenet of the new economic sociology is that networks are both the
wellsprings and the 'plumbing' of markets (White 1981, 2002; Powell 1990; Burt 1992;
Podolny, 2002). Whether operationalized in terms of informal ties among individuals
(Granovetter 1985; Uzzi 1990), interlocking affiliations among corporations (Mizruchi
1992; Davis, Baker, and Yoo 2003), or formal, contractually defined, strategic alliances
(Eisenhardt and Schoonhoven 1994; Powell, Koput, and Smith-Doerr 1996), networks
are an essential component of markets because they channel and direct flows of
information and resources from position to position within a social structure.
The conceptualization of networks as “pipes” underscores the strategic benefits
that accrue to well-situated individuals, organizations, and collectivities because of their
position at the confluence of information and resource flows. This conception has proven
highly fertile in explaining a wide range of organizational, economic, and social
phenomena. Nevertheless, limited attention has been paid thus far to how important non-
structural features -- such as the characteristics of the organizations that represent nodes
in a network, geographic location, or the institutional underpinnings of the larger
structure -- alter the character of information flows.
We begin with a consideration of the varied ways in which formal contractual
alliances might be understood to channel information and resource flows between
organizations, arguing that these linkages can represent either 'open' channels or more
proprietary, 'closed' conduits. We then turn to a discussion of two non-structural
considerations that might affect the accessibility of formal contractual pipelines. We draw
upon economic geography to link a more unfettered conception of information flow to
2

the well-established benefits of regional industrial agglomeration (Romer, 1986;
Krugman, 1991; Anselin, Varga, and Acs 1997). We turn next to organizational theory,
and the sociology and economics of science, to argue that the characteristics of the
dominant nodes in a network can alter the flow of information throughout the entire
structure. We contend that integrating considerations of the geographic propinquity of
network structures and the institutional demography of network nodes offers new insights
into the relationship between social structural position and firm-level outcomes.
Moreover, this conception contributes to the development of an organizational network
theory that is sensitive to diverse meanings of location and to the varied institutional
arrangements that typify complex organizational fields.
Networks as both Channels and Conduits
Social connections among individuals and the various linkages among
organizations can be conceptualized in two general terms. We posit a pair of logical
possibilities. The first sees linkages as channels that diffusely and imperfectly direct
transfers between nodes, facilitating information spillovers (and other externalities) that
benefit both loosely connected and centrally positioned organizations. An alternative
conception of pipelines represents closed conduits, characterized by legal arrangements
(e.g., non-disclosure agreements and exclusive licensing contracts that transfer
intellectual property rights) designed to ensure that only the specific parties to a given
connection benefit from the information that is exchanged. While the former
interpretation suggests that ‘weak’ connections among participants in a network may
offer returns to its members in terms of spillovers from network channels, the latter
understanding implies that centrality and ‘strong’ connections involving tighter, more
3

proprietary conduits are the primary sources of competitive advantage derived from
networks. The literature on inter-organizational linkages has, to date, emphasized the
latter view over the former.
Organizations collaborate within their own industries, as well as across sectors,
for both strategic and social purposes (Eisenhardt and Schoonhoven 1996). Such
partnerships represent the 'plumbing’ of the market, and the strategic benefits of location
in dense alliance networks have been well documented. Powell, Koput and Smith-Doerr
(1996) characterize such diverse industry networks in biotechnology as the 'locus of
innovation,' emphasizing the positive benefits of increased rates of learning and access to
knowledge on a rapidly developing research frontier. To test ideas about organizational
learning, many researchers have focused on the relationship between strategic alliance
networks and innovative outputs in the form of patents.
Hagedoorn and Schankenraad (1994) demonstrate a positive relationship between
the formation of technology partnerships and firm-level innovation. Shan, Walker, &
Kogut (1994; Walker, Kogut, & Shan, 1997) provide evidence that strategic alliance
networks increase patent rates for biotechnology firms. Stuart (2000) also finds that
technology-based alliances predict innovation rates in the semiconductor industry, but
demonstrates that the effects of those affiliations depend strongly on partner
characteristics. Similarly, Ahuja (2000) draws on a variety of network indicators to
examine the relationship between position in strategic alliance networks in the
international chemical industry and patenting outcomes, finding a beneficial effect of
direct network connections on innovative outputs.
4

These works largely spotlight the effects of technology-based network ties among
competitor firms in the same industry. Research on innovation in biotechnology, which
attends much more to the diverse set of institutions engaged in basic research and product
development, has assessed the implication of ties to diverse types of partners, particularly
universities and research institutes (Powell 1996; Owen-Smith et. al. 2002). While
reiterating the importance of connections among firms, this line of research offers
somewhat mixed findings on the role that ties among different types of organizations play
in the biotechnology industry. Shan, Walker and Kogut (1994), for instance, find a
positive effect of firm-to-firm alliances on biotech patenting but not a significant effect of
R&D agreements with universities. George, Zahra and Wood (2002), however, observe
that firms with ties to universities produce more patents, and have lower R&D costs than
those lacking such ties. Similarly, Arora and Gambardella (1990) demonstrate that
pharmaceutical ties to small biotechnology firms and universities represent
complementary strategies for innovation.
The literature on networks and innovation emphasizes the strategic benefits of
formal connections conceptualized a focused pipelines, while underplaying the role of
ties to non-firm alters and the social aspects of alliances. Such collective benefits have
been found for many other types of networks, however (Powell 1990). Buyer-supplier
networks in industrial districts in the 'Third Italy' (Piore and Sabel 1984) and in the
Manhattan garment industry (Uzzi 1996, 1997) have been shown to offer benefits to
connected partners by channeling information and resources and by locating members in
a dense communal web of overlapping affiliations and obligations. In these settings,
5
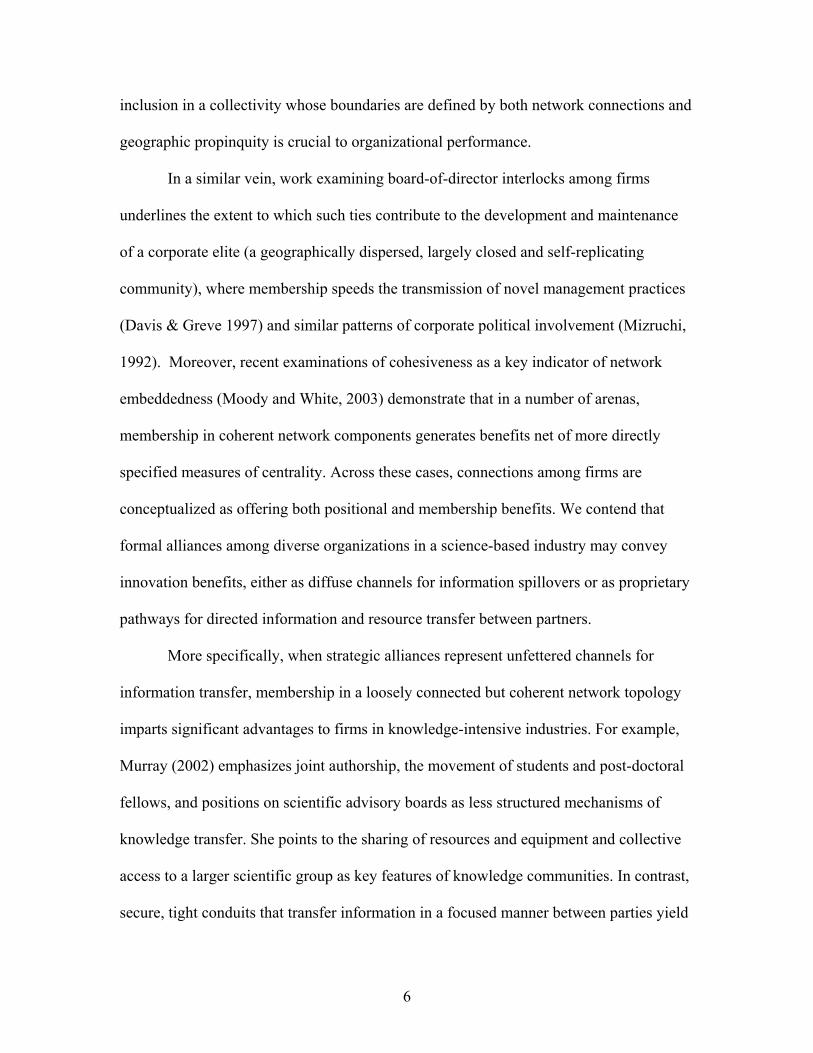
inclusion in a collectivity whose boundaries are defined by both network connections and
geographic propinquity is crucial to organizational performance.
In a similar vein, work examining board-of-director interlocks among firms
underlines the extent to which such ties contribute to the development and maintenance
of a corporate elite (a geographically dispersed, largely closed and self-replicating
community), where membership speeds the transmission of novel management practices
(Davis & Greve 1997) and similar patterns of corporate political involvement (Mizruchi,
1992). Moreover, recent examinations of cohesiveness as a key indicator of network
embeddedness (Moody and White, 2003) demonstrate that in a number of arenas,
membership in coherent network components generates benefits net of more directly
specified measures of centrality. Across these cases, connections among firms are
conceptualized as offering both positional and membership benefits. We contend that
formal alliances among diverse organizations in a science-based industry may convey
innovation benefits, either as diffuse channels for information spillovers or as proprietary
pathways for directed information and resource transfer between partners.
More specifically, when strategic alliances represent unfettered channels for
information transfer, membership in a loosely connected but coherent network topology
imparts significant advantages to firms in knowledge-intensive industries. For example,
Murray (2002) emphasizes joint authorship, the movement of students and post-doctoral
fellows, and positions on scientific advisory boards as less structured mechanisms of
knowledge transfer. She points to the sharing of resources and equipment and collective
access to a larger scientific group as key features of knowledge communities. In contrast,
secure, tight conduits that transfer information in a focused manner between parties yield
6

innovation benefits only to those organizations that are centrally positioned in a network
structure. Put simply, the network conduits view focuses on point-to-point transmission
in which benefits are garnered only by the nodes at the end of the pipes. But when
pipelines are 'leaky' -- either due to membership in a regional economy or because of the
normative practices of key members of the network -- they function more like sprinklers,
irrigating the broader community. This irrigation metaphor, drawn specifically from work
in economic anthropology on cooperative agricultural practices (Lansing, 1991;
Scarborough, Schoenfelder, & Lansing, 1999) underscores the collective benefits derived
from membership in a community rich in relational linkages.
Economic geography and institutional demography
Both the geographic location of organizations connected by formal ties and the
institutional characteristics of nodes in a network may alter the character of information
flows. Propinquity is commonly linked to a variety of information spillovers. In addition,
organizations vary in the extent to which they adhere to the institutional and legal rules
designed to prevent the diffusion of information beyond the parties to a formal tie.
The evidence for geographically concentrated knowledge flows in research-
intensive industries is compelling. Studies drawing on ethnographic analysis (Saxenian
1994) and patent citation data have demonstrated that: (1) knowledge spills across
organizations more readily when they are co-located (Jaffe et. al 1993; Almeida, Dokko,
and Rosenkopf, 2000); (2) the size and mobility of the science and engineering labor pool
in a region increases localized spillovers (Almeida and Kogut 1999); and (3) strategic
alliances among firms increase the likelihood of such spillovers (Almeida et. al. 2000).
7

Research on the biotechnology industry has documented that the geographic co-
location of firms is a function of access to scientific talent and the skills of 'star' scientists
who are active in both academic and commercial research communities (Audretsch and
Stephan 1996; Zucker, Darby, and Brewer 1996). In high technology regions, the secrets
of industry may not be floating freely in the air (Marshall 1920), but they are situated in
informal communities of practice that constitute a local technology labor market (Brown
and Duguid 1991).
In sum, we argue that formal ties among regionally agglomerated organizations
are important in accounting for innovation to the extent that they signal membership in a
local technology community. Such membership offers firms access to information
transmitted through informal network channels in the region, while raising the firm's
visibility in competitive local labor markets for technically trained employees.
Conceptualizing formal ties as a means to access informal communities emphasizes the
public character of relationships and illuminates the importance of community
membership above and beyond the specifics of structural position. To formalize these
ideas, we suggest:
Proposition 1: Membership in a geographically co-located network will positively effect innovation, but centrality in the same network will have no effect. Proposition 2: Centrality in a geographically dispersed network will positively effect innovation, but membership per se will have no effect.
Another potential source of network openness lies in the dependence of regional
economies, and high technology industries more generally, on diverse organizational
forms. Indeed, the strength and robustness of U.S. high technology regions lies in their
joint reliance upon the contributions of both public and private research organizations
8

(Owen-Smith, Riccaboni, Pammolli, and Powell, 2002). Even when individual alliances
may be sealed by a partner’s commitment to proprietary norms, the dominance of the
larger network by organizations that pursue open science can render the overall structure
more accessible. When public research organizations anchor networks, even those
concerned with commercial applications, the systems manifest greater spillovers.
Public research organizations (PROs), such as universities and nonprofit
institutes, increasingly conduct research that is both advanced scientifically and
immediately valuable to industry. This class of organizations differs from research-
intensive firms on two key dimensions. Institutional differences between PROs and for-
profit organizations stem from: (1) their disparate approaches to rules for the
dissemination and use of scientific findings (Dasgupta and David 1987, 1994; Owen-
Smith 2003), and (2) sharply divergent selection environments.
Two related strands of thought offer insights into the effects of these distinctive
institutional regimes. First, Nelson (1981, 1986) emphasizes the key role that
organizational diversity plays in the development of knowledge on a research frontier,
emphasizing the importance of public research institutions to the generation of
innovation. New knowledge flows out of universities much more readily than it does
from commercial organizations (Jaffe et. al. 1993). Similarly, sectors in which non-
commercial organizations are prominent in early stage research activities promote more
open technological trajectories (Dosi 1982). Some high-technology sectors – most
notably biotechnology – owe their rapid emergence to the robustness and expansiveness
that PROs add to networks (Powell 1996).
9

A second feature of PROs is their durability and resilience. Public entities, such as
universities or government institutes, do not routinely fail or merge. Thus, they contribute
to the stability of highly volatile technological fields. In contrast to firms, which are
subject to potentially strong market pressures and experience liabilities of newness and
obsolescence, PROs add a presence that is focused on longer-term criteria of evaluation.
PROs also promote information transmission because they adhere to the norms of open
information disclosure characteristic of public science. The implication of these two
lines of argument is that networks centered on PROs should yield greater benefits to
general community membership than to specific structural position. Consequently, we
propose:
Proposition 3: In networks dominated by PROs, membership will positively effect innovation, but centrality will have no effect. Proposition 4: In networks dominated by commercial entities, centrality will positively effect innovation, but membership per se will have no effect.
We turn to an examination of an institutionally diverse biotechnology region, Boston, to
examine patterns of information flow.
Propinquity and Centrality in Biotechnology
The biotechnology industry exemplifies many of the general features of science-
based sectors. Biotechnology firms in the U.S. and Europe are clustered in a small
number of geographic regions and are strongly dependent upon public research
organizations, such as universities, for skilled labor and novel scientific competencies
(Audretsch & Stephan, 1996; Anselin, Varga, and Acs 1997; Zucker, Darby, & Brewer
1998). These firms are embedded in multiple networks of strategic alliances and gain
competitive advantage from continuous scientific and technical innovation (Powell et. al.
10

1996). Access to new knowledge and capabilities in this field occurs both via localized
information spillovers and through diverse strategic alliance networks that are
international in scope.
Consequently, geographic propinquity and network centrality represent
substantively different locations in a field where the ability to innovate determines
survival. One goal of this paper is to bridge the gap between geographic and network
explanations for innovation rates of biotechnology firms. An important aspect of this
question involves the diversity of organizational forms located in different regions, thus
our second purpose is to examine the relationship between the institutional demography
of nodes and network effects on innovation.
Biotechnology is a field where all the relevant capabilities are seldom found under
a single organizational roof (Powell & Brantley, 1992). The field had its origins in
university labs, where research was supported by decades of substantial government
investment in R&D. As the field developed, universities, nonprofit research centers,
major research hospitals, and start-up firms all had a hand in moving research from the
lab into clinical development. On the financing side, venture capital firms bankrolled
many of the small firms, and large, multinational corporations later joined in as they
came to see the merits of new, more directed methods of drug discovery (Henderson &
Cockburn, 1996; Malerba & Orsenigo 2001). Until very recently, we did not find all
these types of organizations located in physical proximity, so the maturation of the
industry involved reaching out across regional clusters to access diverse resources.
These varied participants represent more than novel combinations of
organizations, however. We suspect that the combination of the responsiveness of private
11

firms and the dedicated resources of public organizations is crucial to the generation of
novel technologies. To examine this idea, we analyze patenting by dedicated human
therapeutic and diagnostic biotechnology firms (DBFs) located in the Boston
metropolitan area, an important regional cluster for the U.S. biotechnology industry. We
first introduce the Boston region – highlighting the scale of biotechnology activity and
the diversity of organizational forms and selection environments in the area. We examine
the network ecology of the region as a means to test our general propositions about the
relationship between propinquity, institutional diversity, network position and innovation.
Why Boston?
We examine the relationship between local and non-local network position and
patent volume for DBFs located in the Boston metropolitan area, which is home to one of
the largest concentrations of biotechnology firms in the world (Stuart & Sorenson, 2003).
In addition to DBFs, however, Boston boasts a rich population of public research
organizations, including public and private universities (e.g. Harvard, MIT, and the
University of Massachusetts), independent research institutes (e.g. the Dana Farber
Cancer Institute), and research hospitals (e.g. Massachusetts General Hospital). Finally,
numerous venture capital (VC) firms are also located in the Boston region.1
1 We follow Pratt’s Guide to Venture Capital Sources and focus on venture companies that are oriented toward high-risk, high-involvement, early-stage investment in entrepreneurial firms. Pratt’s does not include angel investors, pension funds, or university technology offices in the category of VCs. In our database on venture capital, we have measures of company age, capitalization, number of offices and whether the firm primarily invests its founder’s own money or other investors’ money. In previous work (Powell, Koput, Bowie, & Smith-Doerr, 2002), we documented the dramatic growth of venture capital disbursements to biotechnology companies in the 1990s. In Boston, the great bulk of VC financing was local until 1996, when external financing from Bay Area VCs expands. Some of these VCs opened branch offices in Boston, but given their (relatively) late arrival on the scene, we code their location as outside of Boston. Researchers working on venture capital financing have yet to sort out the allocation of decision making responsibilities between home offices and branch locations.
12

The joint presence of a sizeable number of DBFs, PROs, and VCs makes Boston
the most organizationally diverse regional cluster in the U.S. biotechnology industry.
The considerable heterogeneity of organizational forms in Boston (public,2 nonprofit,
private; large and small) coincides with a diverse set of selection environments. By
diversity we mean variation in both organizational form and mission. These varying
approaches to innovation and information dissemination are linked, so that they constitute
a local organizational field or knowledge community. Boston is a strong candidate for a
geographic region where information could diffuse widely and informally through a
thriving technological community and labor market.
At the same time, the institutional diversity of the organizations that populate this
region offers the possibility for an examination of the effects node demography has on
innovation. Because PROs are primarily focused on non-proprietary academic research,
they are ‘leakier’ organizations than firms. Thus their diversity and number may increase
spillovers within a region by rendering even formal network ties more diffuse. Boston
area venture capitalists are also more likely to invest locally than are VC firms in the Bay
Area, the other populous biotechnology cluster (Powell, et. al. 2002). This type of
ecology produces an environment where we expect firms to derive innovation benefits
from membership in a weakly connected, but coherent network ‘community.’
Two possibilities are immediately apparent. First, formal network connections
among co-located organizations may be unlocked by the broader externalities that
accompany propinquity. Alternatively, partnerships may act as channels that direct
2 Both government agencies (e.g. the National Institutes of Health) and universities might be considered ‘public.' Because of their different funding roles however, we separate government institutes from universities, nonprofit research institutes and hospitals by assigning such agencies to the category ‘Government.’ No federal research institutes are located in the Boston region.
13

information flows while emitting spillovers due to a community’s dominance by
organizations dedicated to a more academic, or public research mission. We first
describe the data set and sources that afford a test of these alternative propositions, then
turn to network visualization methods to portray the evolution of the Boston network,
mapping its transition from a strong anchor in PROs to a more ‘proprietary’ network
dominated by commercially oriented nodes. This transition, we argue, allows us to
discriminate between two possible sources of ‘openness’ in formal network pipelines:
geographic propinquity and institutional demography.
14

Inter-Organizational Networks in Biotechnology
Data Sources. Our primary explanatory data are drawn from a relational dataset of formal
network connections involving 482 dedicated biotechnology firms for the period 1988-
1999. 3 The data on firms and inter-organizational arrangements were coded from
BioScan, an industry publication that reports information on firms and the formal
arrangements in which they are involved. The organizational data include firm age, size,
public status, and (where applicable) reasons for exit. Tie data allow us to calculate
measures of network experience, diversity, and centrality, and to classify individual ties
by the type of business activity (R&D, Finance, Commercialization, Licensing) they
entail.4 These data represent yearly ‘snapshots’ of the formal network that constitutes the
‘locus of innovation’ in biotechnology (Powell et. al. 1996). Our dependent variable, a
count of patents assigned to those corporations, was developed using the United States
Patent Office's online database.
Defining the networks. Our focus is on the geographic and organizational conditions
affecting information flows through formal networks. Our database enables us to develop
two different networks. 5 The first, which we dub ‘Boston,’ includes only organizations
located in the region and the ties among them. In this group are 58 DBFs, 19 PROs, and
37 VC firms. We observe 201 formal contractual relationships, including R&D
partnerships, licensing deals, commercialization and marketing arrangements, and
investment ties among these 114 organizations over the period 1988-1999.
3 We define DBFs as independently held, profit seeking firms involved in human therapeutic and diagnostic applications of biotechnology. 4 Our data draws upon the April edition of BioScan, in which new information is added for each calendar year. 5 For further details on the database from which these data are derived, see Powell et. al. 1996: 124-129; Powell et. al. 2004.
15
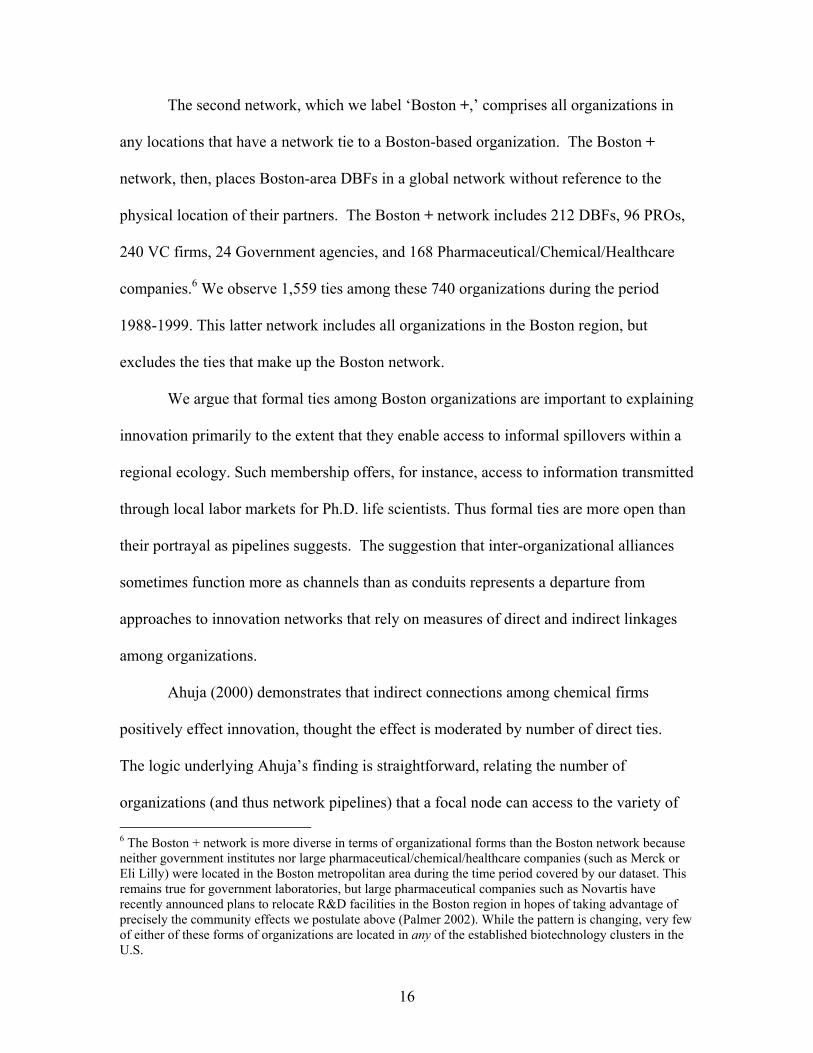
The second network, which we label ‘Boston +,’ comprises all organizations in
any locations that have a network tie to a Boston-based organization. The Boston +
network, then, places Boston-area DBFs in a global network without reference to the
physical location of their partners. The Boston + network includes 212 DBFs, 96 PROs,
240 VC firms, 24 Government agencies, and 168 Pharmaceutical/Chemical/Healthcare
companies.6 We observe 1,559 ties among these 740 organizations during the period
1988-1999. This latter network includes all organizations in the Boston region, but
excludes the ties that make up the Boston network.
We argue that formal ties among Boston organizations are important to explaining
innovation primarily to the extent that they enable access to informal spillovers within a
regional ecology. Such membership offers, for instance, access to information transmitted
through local labor markets for Ph.D. life scientists. Thus formal ties are more open than
their portrayal as pipelines suggests. The suggestion that inter-organizational alliances
sometimes function more as channels than as conduits represents a departure from
approaches to innovation networks that rely on measures of direct and indirect linkages
among organizations.
Ahuja (2000) demonstrates that indirect connections among chemical firms
positively effect innovation, thought the effect is moderated by number of direct ties.
The logic underlying Ahuja’s finding is straightforward, relating the number of
organizations (and thus network pipelines) that a focal node can access to the variety of 6 The Boston + network is more diverse in terms of organizational forms than the Boston network because neither government institutes nor large pharmaceutical/chemical/healthcare companies (such as Merck or Eli Lilly) were located in the Boston metropolitan area during the time period covered by our dataset. This remains true for government laboratories, but large pharmaceutical companies such as Novartis have recently announced plans to relocate R&D facilities in the Boston region in hopes of taking advantage of precisely the community effects we postulate above (Palmer 2002). While the pattern is changing, very few of either of these forms of organizations are located in any of the established biotechnology clusters in the U.S.
16

information it can gather. In this view, network reach carries innovation benefits by
enabling firms to access information that their partners have gathered through focused
network connections. These benefits, however, are greater for firms that are themselves
party to relatively few alliances. Research emphasizing the importance of such indirect
connections is predicated on knowledge spillovers from nodes (in this case, information
transferred by a tie between two other organizations is accessible to ego via its own
partnership).
Local membership, trans-local centrality. Despite the established importance of network
reach, our emphasis on the signaling effects of formal ties adds an additional dimension
to analyses of information transmission through networks. We contend that informal
regional networks and open institutional regimes alter the extent to which formal
connections direct and restrict information flows. While the nodes in a network transmit
information at one remove, more transparent pipelines distribute information both to
partners and to other organizations that are not party to the alliance. The primary analytic
challenge for this view is to discern the minimal level of affiliation that might convey
access to such spillovers. We focus our empirical attention on membership in the largest
weakly connected component in a given network. This structure, the ‘main component,’
represents membership in a loosely linked but coherent community. Such membership,
we contend, offers a channel to the widest available range of information flows
(spillovers from ties) while increasing a firm’s visibility in local labor markets and in
informal networks among scientists. To the extent that regional agglomeration effects
open network ties, membership in the main component of the Boston network will
increase a firm’s ability to tap into information flows. Following proposition one
17

concerning the salutary effect of membership in a geographically co-located network, the
specific corollary for the Boston network is: connection to the main component will
positively effect the volume of patents successfully prosecuted by local DBFs while
centrality will have no effect.
In contrast, we expect that informal channels for information transfer will be
much less salient in larger, geographically dispersed networks. Where the partners in a
relationship are physically distant, weaker informal networks and greater monitoring
difficulties will close formal contractual ties limiting the extent to which information
might be accessible to the surrounding community. Under these conditions, position in
the formal plumbing of the market, rather than membership in a weakly connected
community, will yield information benefits. We thus take the analogy relating networks
to pipes carrying information and resources seriously, arguing that position in
geographically dispersed networks will increase firm-level innovation. Where physical
distance limits the openness of network avenues, centrality at the convergence of
multiple, tightly bounded conduits will enable access to knowledge transmitted directly
from partner to partner. Centrality makes organizations an obligatory passage point for
the information flowing through a network structure. Under these conditions,
membership confronts a firm with a web of opaque linkages it has few means to tap.
Thus, the formalization of proposition two suggests that centrality in the more dispersed
Boston + network will have a positive effect on patent volume while main component
membership will have no effect.
Our argument to this points hinges upon the differential role that connections to a
weak component play in networks that vary by propinquity. Proximity, however, is only
18

one possible factor in network accessibility. We have also argued that the institutional
underpinnings of a network, that is, the extent to which it is dominated by divergent
organizational forms, will alter the role that alliances play in innovation. In particular, we
contend that networks dominated by public research organizations will manifest
innovation effects characterized more by membership than by position. Due to their
commitment to the norms of 'open' science, public sector organizations weaken the
contractual strictures that close formal alliances and thus contribute to the irrigation of
the larger community. To further develop this line of argument, we provide
visualizations of the Boston and Boston + networks.7 These visualizations reveal
differences across location, and also demonstrate that the evolution of the Boston
network is well suited to an analytic approach designed to partial out geographic and
organizational sources of network openness.
Images of the Boston networks. Figure 1 presents a series of images of the Boston
network in 1988. The shape of nodes in the network represents organizational type --
triangles represent PROs, circles indicate DBFs, squares reflect the position of
pharmaceutical companies and governmental agencies are characterized by brown
triangles. Red nodes are organizations located in Boston, gray and brown nodes are
located outside the region. The color of ties reflects the type of activity they involve --
red=R&D, green=financial, blue=commercialization, and magenta=licensing.
7 We use Pajek, a freeware program developed by Vladimir Batagelj and Andrej Mrvar, to develop meaningful and replicable visual representations of these two networks. Pajek implements two minimun-energy, or spring-embedded, network drawing algorithms based on graph theoretic conceptions of distance and the physical theory of random fields (Guyon 1995). We draw on these two algorithms (Kamada & Kawai 1989; Fruchterman & Reingold 1991) to create images that position nodes by appeal to the overall pattern of connections in the network. These images locate isolates on the periphery of the image while situating more connected nodes centrally. For more information on the algorithms or their use for visualization, see Owen-Smith et. al. 2002; Powell, White, Koput and Owen-Smith 2004, and http://vlado.fmf.uni-lj.si/pub/networks/pajek.
19

[Figure 1 here]
Note several interesting features of Figure 1. First consider the Boston network at
the upper left. In 1988 this network is relatively sparse with the bulk of organizations
isolated from the network of formal relationships.8 The ties that do exist, though, form a
dominant weakly connected network component.9 More interestingly, note the critical
role that PROs (triangles) play in connecting the main component of the network and the
relative absence of VC firms (there are few squares and only one is connected even
peripherally to the main network corridor). Six public research organizations (MIT,
Boston University, Tufts, Harvard, the Dana Farber Cancer Center, Massachusetts
General Hospital, and the New England Medical Center) appear in the most connected
cluster of organizations. In 1988, then, the Boston biotechnology community is only
sparsely connected internally by formal collaborations. While the network contains
nearly 43% of active Boston-area DBFs, the main component is heavily dependent for its
cohesiveness upon key public research organizations.10 Removing these organizations
from the network results in the complete collapse of the main component.
Figure 2 represents the Boston + network in 1988. Notice first that this network
is both larger and much more organizationally diverse than the Boston network, due to
the inclusion of government agencies (represented by brown triangles) and large
pharmaceutical companies (represented by gray diamonds). The complete Boston +
network in the upper left quadrant of Figure 2 is also strikingly different visually. While 8 Isolates are placed at the periphery by the drawing algorithms we employ. 9 In every year for which we have data, both the Boston and Boston + networks are characterized by a large network component of this sort. 10 Recent work on the development of strategic alliance ties and their role in innovation has emphasized the importance of more cohesive networks as opposed to networks rich in structural holes (Walker, Kogut and Shan 1997; Ahuja 2000). As Ahuja frames the argument, ego networks rich in structural holes negatively effect patenting because such networks tend to reduce trust, hindering the free flow of information and limiting network-channeled spillovers.
20

the Boston-only network is a sparse corridor, strongly reliant upon PROs for
cohesiveness, the Boston + network is dominated by hub and spoke configurations where
otherwise isolated VCs and large pharmaceuticals connect to individual Boston-area
DBFs. The main component of the network contains more than 57% of Boston biotech
companies. More firms in the area are reachable through trans-local network connections
than through local ties. These external linkages offer a variety of benefits, including
access to capital, approaches and solutions to problems different from those used locally,
and downstream support in new product development.
[Figure 2 here]
The great majority (67%) of the 182 organizations connected to this component
have only one tie. In order to visually explore the cohesiveness of this network, we
remove those organizations. The resulting image is more densely and redundantly bonded
than the Boston structure. Note that this network is dependent for its cohesiveness on
two distinct types of organizations. In order to disconnect this component, both Boston-
area PROs and external large corporations must be removed from the network. Removing
only one type of organization (we remove PROs in the final call-out of Figure 2) shrinks
the main component somewhat, but does so without disconnecting any Boston DBFs
from the core of the network.
Figures 1 and 2 suggest that, early in its development, the Boston biotechnology
community was weakly linked with less than half of all local DBFs reachable through
network channels. The early coherence of this regional network stemmed from the active
participation of local public research organizations. Extending the network to include
physically distant partners and, thus, greater organizational diversity, highlights the
21

extent to which venture capital firms and large companies from outside the region reach
in and attach to Boston-area biotechs. These outside ties also altered the composition of
the main component, reducing its structural dependence upon local research
organizations. Nevertheless, this increased network robustness may well have come at the
expense of open information flow. Large pharmaceutical companies and research
universities put scientific findings and intellectual property to very different uses.
The evolutionary pattern in which for-profit technological progress springs from
public sector roots proposed by Nelson (1981, 1986) appears to hold for the Boston
network. Consider Figure 3, which presents two simple descriptive statistics for the
Boston and Boston + main components. Figure 3 represents (1) the percentage of ties in
each component that connect DBFs to PROs in a given year, and (2) the percentage of
Boston area biotech firms that are members of the main component in each year.
[Figure 3 Here]
This visualization suggests a qualitative change in the Boston network’s level of
dependence upon ties involving public research organizations across the period covered
by the data, but implies no such transition for the Boston + network. The shifts reflected
in Figure 3 capture an important transition in the institutional foundations of the Boston
biotechnology community, highlighting the growing role of for-profit organizational
forms in the local community. As a point of comparison, Figure 4 reprises Figure 1 to
present a series of minimum-energy representations of the Boston network in 1998.11
[Figure 4 here]
11 We do not present a visualization of the Boston + network in 1998 because change in this network from 1988 to 1998 represents quantitative growth in the main component, but not a qualitative shift in its demography.
22

By 1998 more than 71% of Boston DBFs were connected to this component.
More importantly, the network itself has undergone a marked change as local biotech
firms began working directly with one another, rather than forming indirect ‘chains’
through shared connections to PROs. Local VC firms are now much more active in the
network, which is notably apparent in the portion of the corridor to the right of MIT.
PROs (particularly MIT, BU, Harvard, and Brigham and Women’s Hospital) still play an
important role in the network in 1998, but their dominance is decreasing, as evidenced by
the image of the component with PROs removed.
Consider the final frame of Figure 4, which illustrates that nearly 30% of Boston
DBFs remain connected in a component that does not rely on public organizations.
Indeed, the growth of biotech-to-biotech ties and the increasing support of local VCs
suggest that Boston is undergoing a transition from its early dependence upon PROs to a
more market-oriented regime where small science-based firms play a connective role
similar to the ones held by large companies in the trans-local network.
This modification occurs within the local network but no similar alteration is
apparent trans-locally. This qualitative shift in the node demography of the Boston
network offers the opportunity to test multiple sources of network openness. If PRO-
based networks are more open than those dominated by proprietary organizations, then
we expect (following propositions two and three) that membership in the Boston main
component will positively affect patenting, while a central position in the Boston +
network will positively influence innovation. If PRO dominance maintains the openness
of formal network connections, however, then the growing importance of local DBFs and
VCs will be reflected in more closed connections. Such closure will limit spillovers in
23

the network, curtail membership effects on innovation, and increase the effect of
centrality. Thus, the application of proposition three for Boston suggests that: as a
network’s reliance on firms increases, centrality in the network will have a positive effect
on patent volume.
If, on the other hand, propinquity drives the level of spillovers expected in a formal
alliance network, regardless of institutional features, then the Boston network’s changing
levels of reliance upon PROs should have no effect upon the structure's openness. Hence
we expect no change in the effect of local centrality upon innovation and, following
proposition four, we contend that: As the Boston network’s reliance on firms increases,
centrality in the network will have no effect on patent volume.
We turn to a conditional-fixed-effects negative binomial regression of an 11-year
pooled cross-section of firm-level patent data for the 58 Boston-area DBFs to test these
hypotheses.
Models & Methods
Network Variables.
Independent variables. Several network measures derived from the Boston and Boston +
networks provide the independent variables for this analysis. The first, which we call
membership, is a dummy variable set to one if a firm has at least one tie to the largest
weakly connected component of the network in a given year. This variable
operationalizes our conception of membership in a loosely linked, coherent community.
We calculate this measure independently for both the Boston and the Boston + networks.
Our second variable, position, is an indicator of network centrality based on
Freeman’s (1977, 1979) measure of betweeness, which captures the extent to which firms
24

sit astride network pathways between other organizations.12 Betweeness centrality, then,
indicates a firm’s ability to absorb (or interrupt) information flows through tightly sealed
network pipes. We calculate betweeness for both the Boston and Boston + networks. In
the latter case, the measure is calculated on a geographically dispersed network that
excludes ties among Boston area organizations. Finally, we include a multiplicative
interaction between Boston area betweeness and a time period dummy variable to
indicate the differential effects of centrality in a network anchored by PROs (time
period=0) and by firms (time period=1).
Control variables. We also include a variety of organizational and network control
variables. Firm level controls include a dummy variable indicating whether a company is
publicly traded in a given year, age and a quadratic age term in years, and a variable
measuring firm size (operationalized as the log of the number of employees). Network
controls are designed to clarify the effects of membership and centrality. We include two
additional network measures that we expect to effect firm patenting along with their
multiplicative interaction. First, Boston R&D Ties: PRO is a simple count of research and
development ties connecting Boston DBFs and PROs in a given year.13 Similarly, Ties to
NIH complex is simply the number of ties connecting Boston firms to the National
Institutes of Health and its sub-agencies in Bethesda, Maryland. All models are
estimated in a conditional fixed effects framework with firm and year effects to control
12 We use betweeness centrality rather than degree centrality so we can take seriously the importance of indirect pathways for information flows (Ahuja 2000). In unreported sensitivity analyses we find that the effects of degree and betweeness measures are qualitatively the same. Despite the availability of more complex, weighted, centrality measures such as information or flow centrality, we choose betweeness for its ready interpretability. Biases may be introduced as firms at the center of small stars, unconnected to the main component will have higher betweeness scores. Such biases work against our arguments about the relative importance of membership and position, however. We thank Phil Bonacich for a conversation reminding us of the benefits of simplicity in network measures. 13 We use R&D ties to minimize collinearity among network measures for Boston. Such ties also represent the most intensive involvement of for-profit organizational forms in non-proprietary research.
25

for unobserved heterogeneity across organizations and time. Table 1 defines our
variables and relevant interaction terms while appendix table 1 presents descriptive
statistics and a correlation matrix.
[Table 1 here]
Model specification. We model counts of patents by application date in an 11 year
pooled cross-section for a panel of 58 DBFs located in the Boston metro area employing
a conditional fixed-effects negative binomial specification (Hausman, Hall, & Griliches,
1984; Cameron & Tivendi, 1998) to correct for over-dispersion in patent counts.14 Such
models also control for unobserved heterogeneity by estimating effects using only within
firm variation. Thus, these models drop firms with no year-to-year variation in patent
rates.
Results.
Table two reports findings from a series of regressions that test hypotheses 1-4.
Model six is best fitting.
Local membership, non-local position. Our first two hypotheses address the differential
role formal network ties play within and outside an established high-tech region.
Hypothesis one, that connection to the Boston area main component positively effects
patenting, finds support in all models. The second component of the hypothesis, that local
position will have no effect, finds support only in models that do not include time period
interactions suggesting that institutional and propinquity effects may be interdependent.
14 Using application date rather than issue date is common practice in literatures relating to patents as it represents the best measure of the time when patentable research was actually completed while avoiding numerous methodological issues raised by the lags between patent filing and issue (Hall, Jaffe, Trajtenberg, 2000). Modeling patents in this fashion allows us to assume a simultaneous (with the same year) effect of network ties on patents and thus also limits the possibility of reverse causality. Nevertheless, regressions run in a two-stage least squares framework find no evidence of reciprocal causality from patents to ties.
26

Likewise, proposition two, which predicts that centrality will increase patenting for the
Boston + network, is also supported in all model specifications.
[Table 2 Here]
The implication of hypothesis one is clear. Within a major regional biotechnology
community, collaborations among organizations matter for explaining the innovative
outputs of firms. Such ties, we contend, are important to the extent that they signal
membership in a local technological community. A weak connection to the diffuse formal
ties that constitute the main component of the local network enables firms to capture
geographically bounded information spillovers by providing an entry ticket to rich
informal networks of academic and industrial scientists, while also raising visibility in the
local labor market.15 We also find negative (models 1-3) and non-significant (models 4-
6) effects of membership in the larger and more diverse Boston + main component. This
weak finding is suggestive of the difficulties that firms might face in capturing
information flows through membership in a web of opaque connections. Where main
component ties signal community membership locally, in a physically dispersed and
institutionally diverse network of tightly monitored network pipelines, a comparable
weak connection might be more akin to a competent minor leaguer attempting to play in
the majors while lacking the necessary skills.
Hypothesis two also carries clear connotations. In the Boston + network, physical
distance and the dominance of organizations committed to proprietary uses of knowledge
15 This robust effect is net of both direct R&D ties to local Boston PROs and local measures of betweeness centrality in model six. In unreported sensitivity analyses, we tested the possibility that our ‘membership’ variable actually proxies for a distinction between isolated DBFs and organizations with ties (whether connected or unconnected to the main component) by including a variable indicating whether organizations were true isolates or simply connected to smaller network components in the region. We found no effect of connections to smaller regional components. The relevant distinction, then, is truly between being linked to or isolated from the largest weakly connected component in the region.
27

render formal ties more closed, limiting the viability of informal network and labor
market mobility as mechanisms for information transfer. Local codes of conduct and
rules for interaction are unlikely to extend outside a region where point-to-point
transmission of information through proprietary linkages is typical. Under these
circumstances, being situated at the intersection of numerous formal pipelines enhances
firm-level knowledge outputs. Model six provides clear support for propositions one and
two relating differences in the geographic dispersion of formal alliance networks to
variations in patterns of information flow and thus in innovation.
To take the irrigation analogy one step further, consider a system where the
‘leakiness’ of information and resource pipelines is dependent upon the types of nodes
through which ideas typically pass. In Boston, for instance, the great majority of
structurally important paths flow through PROs committed to open norms of information
disclosure. In contrast, the Boston + network is anchored by multiple types of
organizations that share varying commitments to proprietary uses of information. If node
demography is important to the maintenance of loosely fettered formal ties, then the
qualitative change in the Boston network’s reliance on PRO ties (documented in figures
1, 3, and 4 above) suggests that as the importance of proprietary information channels
grows in the region we should see an increasing effect of local network position.
Our hypothesis three predicts just this effect. We test the hypothesis by use of a
multiplicative interaction between local betweeness centrality and a dummy variable set
to one for the period 1993-1998. This variable is interpretable as the effect of local
28

centrality on patenting in the later half of our time period.16 The main effect of Boston
position, similarly, can be understood to represent the effect of local betweeness
centrality in the early years of the time series. Finally, the main effect of time period
represents the effect of a betweeness centrality score of zero (reflecting either an isolate
or a firm with only one tie) in the later time period. We find consistent support for
hypothesis three. As the Boston biotechnology community shifted from structural
reliance on PROs towards dependence upon for-profit organizations (DBFs and VCs),
local centrality began to generate benefits for innovation. Specifically, model six
coefficients for the Boston position and the time period interaction variable suggest that
in the early part of the time series a standard deviation increase in betweeness centrality
was associated with a 23% decrease in expected patenting. In contrast, the same standard
deviation increase in centrality in the second half of the time series implies a 28%
increase in expected patenting. Not surprisingly, this transition is accompanied by a
negative effect of having a very low centrality score in the last half of our time series.
Consider also the interesting, though not hypothesized, negative main effect of
Boston position. This finding may reflect the aspects of power and arbitrage captured by
betweeness centrality. In addition to enabling firms to appropriate information flows,
high betweeness offers the possibility for firms to interrupt or alter transmissions to the
detriment of their partners. The betweeness measure, then, offers two possibilities for
arbitrage; a negative form where powerfully positioned middlemen extract value by
interrupting or distorting information and a more positive form where cupids pass
information on to distantly positioned network alters.
16 Note that our separation of our 11 year time frame into two periods corresponds with the beginning of increasing volatility and growth in DBF membership in the local component and a period of steep decline in the component’s reliance on PRO ties. See Figure 3.
29

The robust negative effect of Boston position in models including time period
interactions suggest that negative brokerage efforts by firms may be actively punished in
communities dominated by PROs.17 While still only suggestive, one implication of this
finding is that opportunistic behavior on the part of firms embedded in networks
dominated by PROs magnifies the negative externalities that can be associated with
playing a tertius role. Such 'punishment' may take multiple forms, such as university
limitations on connections to 'pushy' commercial firms or resistance by partners to more
stringent legal mechanisms to 'close' alliances in order to limit spillovers. Similarly,
aggressive strategic use of a powerful structural position in the context of a more
community-oriented network may limit access to informal information flows as scientists
working in 'academic' institutional regimes tend to shy away from proprietary limitations
on the use of their findings.
Our hypothesis four -- that increased local reliance on firms will not effect
patenting -- is not borne out by our best fitting model. This hypothesis, however,
represents a strong form of our argument as it implies that either geographic propinquity
or node demography may alter the flow of information through a network structure.
Model six, however, demonstrates that this is not the case. Consider the robustly positive
effect of membership in the Boston main component (net of both local centrality and
direct R&D ties to local PROs). The robust support that model six provides for
hypotheses one and three implies that both propinquity and institutional characteristics --
two attributes of formal inter-organizational networks that are independent of structure --
17 This finding is not inconsistent with research demonstrating that networks rich in structural holes hinder innovation in industries characterized by high innovation rates (Walker et. al. 1997; Ahuja 2000). Our findings, however, suggest a further question about the role that different organizational forms play in mediating the effects of network characteristics on information flows.
30

alter that network effects on information flow. Both attributes of network nodes in the
Boston biotechnology affect the relationship between network position and rates of
innovation.
Conclusion and Implications
Our results demonstrate the importance of considering non-relational features of
networks that alter the character of information transmission through a formal topology.
These findings also indicate the extent to which formal partnerships between
organizations represent the outcroppings of informal social relationships in a community.
In sum, we find that two attributes -- geographic propinquity, and the institutional
characteristics of key members in a network -- transform the ways in which an
organization's position within a larger network configuration translates into advantage.
This effect is driven, we contend, by variations in the security of the network ties
themselves. The extent to which information transmitted through formal linkages is
accessible is a function of: (1) the extent to which ties are embedded in a dense, regional
web of formal and informal affiliations, and (2) whether the nodes that anchor a network
pursue public or private goals. These findings suggest that studies of innovation should
take into account the dual importance of physical location and institutional anchors. The
joint examination of propinquity and centrality, we contend, links economic geography’s
emphasis on concentrated information spillovers with economic sociology's focus on
knowledge flows through an abstract social topology.
Emphasizing key organizational features of network nodes, in contrast, reminds
us that the institutional and legal arrangements that secure directed information
transmission are an outcome of participant commitments and efforts. Independent of
31

propinquity effects, we find that differences in the composition of network participants
shift the relationship between centrality and innovation. In more general terms, this
finding represents a first step toward blending network and institutional approaches thus
illuminating the central role of key nodes in a network as carriers of the rules and
practices. We present a relatively simple typology of node types, considering only the
extent to which an organization conducts research under academic or proprietary
institutional regimes. The practices and commitments of network nodes can be sharply
divergent, with one set of organizations emphasizing open at the expense of restricted
relationships. Under such conditions, dominant logics emerge at the level of both
networks and communities. Transparent modes of information transfer will trump more
opaque or sealed mechanisms when a significant proportion of participants exhibit
limited concern with policing the accessibility of network pipelines.
To pursue the image we employ, closed conduits offer reliable and excludable
information transfer at the cost of fixity, and thus are more appropriate to a stable
environment. In contrast, permeable channels rich in spillovers are responsive and may
be more suitable for variable environments. In a stable world, or one where change is
largely incremental, such channels represent excess capacity. The implications of both
node characteristics and network features, then, are deeply conditioned by environmental
volatility and this possibility has not been well attended to in literatures relating network
position to organizational outcomes.18
Thus, proprietary arrangements can come to dominate once open architectures as
fields stabilize and innovation becomes less radical. Indeed, this is a common
18 We thank an anonymous reviewer whose questions about the substitutability of pipe and conduit ties in innovation networks greatly aided our thinking.
32

evolutionary pattern in the emergence of new sectors and one that has shaped a variety of
industrial and technological trajectories. Examining the conditional effects of
institutional regimes and network topologies upon industrial and regional development
opens the possibility that institutional factors and propinquity may contribute to studies of
emergence, maintenance, and change in networks and sectors. At the same time,
attending to interdependencies across categorical features of nodes and structural features
of networks implies that research relating central positions to outcomes may do well to
account for the presence and role multiple organizational forms play in the constitution
and maintenance of innovation systems. While we limit our consideration to the effects
of organizational commitments in an existing network, concern with the dominance of
different logics of appropriateness offers a new set of tools to examine structural and
technological change, an approach that emphasizes normative rules guiding partner
selection, and access to information systems of varying opacity.
33

Works Cited. Ahuja, G. 2000a. Collaboration Networks, Structural Holes, and Innovation: A
Longitudinal Study. Admin. Sci. Quart 45 425-455. ----- 2000b. The Duality of Collaboration: Inducements and Opportunities in the
Formation of Interfirm Linkages. Strategic Management Journal 21 317-343. Almeida, P and B. Kogut. 1999. Localization of Knowledge and the Mobility of
Engineers in Regional Networks. Management Sci. 45 905-917. Almeida, P. G. Dokko and L. Rosenkopf. 2003. Startup Size and the Mechanisms of
External Learning: Increasing Opportunity and Decreasing Ability? Res. Policy. 32 301-315.
Anselin, L, A Varga, and Z Acs, 1997. Local Geographic Spillovers between University Research and High Technology Innovations. J. Urban Economics 42 422-448.
Arora, A. and A. Gambardella, 1990. “Complementarity and External Linkages – The Strategies of the Large Firms in Biotechnology.” J. Ind. Economics 38 361-379.
Audretsch, D. and P. Stephan, 1996. Company-Scientist Locational Links: The Case of Biotechnology. Am. Econ. Rev. 86 641-652.
Brown, J.S. and P. Duguid. 1991. Organizational Learning and Communities-of-Practice: Toward a Unified View of Working, Learning, and Innovation. Organization Sci. 2 40-57.
Burt, R.S. 1992. Structural Holes: The Social Structure of Competition. Cambridge, MA: Harvard University Press.
Cameron, A. C. and P. K. Trivendi, 1998. Regression Analysis of Count Data. Cambridge, UK: Cambridge University Press.
Dasgupta, P. and P. David, 1987. Information Disclosure and the Economics of Science and Technology. in G.R. Feiwel (ed.) Arrow and the Ascent of Modern Economic Theory. New York: New York University Press. Pp. 519-542.
----- 1994. Toward a New Economics of Science. Res. Policy 23 487-521. Davis, G. and H. Greve, 1997. Corporate Elite Networks and Governance Changes in the
1980s. Am. J. Sociology 103 1-37. Davis G.F., M. Yoo, and W.E. Baker, 2003. The Small World of the American
Corporate Elite, 1991-2001. Strat. Organization 1 301-336. Dosi G. 1982. Technological Paradigms and Technological Trajectories – A Suggested
Interpretation of the Determinants and Directions of Technical Change. Res. Policy 11 147-162.
Eisenhardt, K.M. and C.B. Schoonhoven. 1996. Resource-Based View of Strategic Alliance Formation: Strategic and Social Effects in Entrepreneurial Firms. Oranization Sci. 7 136-150.
Freeman, L.C., 1977. A Set of Measures of Centrality Based on Betweenness. Sociometry 40 35-41.
-----, 1979. Centrality in Social Networks: Conceptual Clarification. Soc. Networks 1 215-239.
Fruchterman, T., E. Reingold. 1991. Graph Drawing by Force-Directed Replacement. Software -- Practice and Experience 21 1129-1164.
George, G., S.H. Zahra, and D. R. Wood. 2002. The Effects of Business-University
34

Alliances on Innovative Output and Financial Performance: A Study of Publicly Traded Biotechnology Companies. J. Bus. Venturing 17 577-609.
Granovetter, M. 1985. Economic Action and Social Structure – The Problem of Embeddedness. Amer. J. Sociology 91 481-510.
Guyon X., 1994. Random Fields on a Network. Berlin, Springer. Hagedoorn, J. and J. Schankenraad. 1994. The Effect of Strategic Technology Alliances
on Company Performance. Strategic Management Journal 15 291-309. Hall, B.H., A. Jaffe, and M. Trajtenberg, 2000. Patent Citations and Market Value: A
First Look. NBER Working Paper #7741. Hausman, J. B.H. Hall, and Z. Griliches, 1984. Econometric Models for Count Data
With an Application to the Patents R&D Relationship, Econometrica 52 909-938.
Henderson, R. and I. Cockburn, 1996. Scale, Scope, and Spillovers: The Determinants of Research Productivity in Drug Discovery. Rand J. Econ. 27 32-59.
Kamada, T. and S.-Kawai, 1989. An Algorithm for Drawing General Undirected Graphs. Inform. Process. Lett. 31 7-15.
Krugman, P. 1991. Increasing Returns and Economic Geography. J. Polit. Econ. 99 483- 499.
Jaffe, A. M. Trajtenberg, and R. Henderson, 1993. Geographic Localization of Knowledge Spillovers as Evidenced by Patent Citations. Quart. J. Econ. 63 577-598.
Lansing, J.S. 1991. Priests and Programmers: Technologies of Power in the Engineered Landscape of Bali. Princeton: Princeton University Press.
Malerba, F. and L. Orsenigo, 2002. Innovation and Market Structure in the Dynamics of the Pharmaceutical Industry and Biotechnology: Toward a History Friendly Model. Ind. Corp. Change 11 667-703.
Marshall, A. 1920. Industry and Trade. London: U.K.: Macmillan. Mizruchi, M.S. 1992. The Structure of Corporate Political Action: Interfirm Relations
and Their Consequences. Cambridge, MA: Harvard University Press. Moody, J. and D.R. White, 2003. Group Cohesion, Nesting, and Embeddedness. Am.
Soc. Rev. 68 103-127. Murray, F. (2002) Innovation as the Co-evolution of Scientific and Technological
Networks: Exploring Tissue Engineering. Res. Policy 31 1389-1403. Nelson, R.R. 1981. Assessing Private Enterprise: An Exegesis of Tangled Doctrine. Bell
J. Econ. 12 93-111. -----, 1986. Institutions Supporting Technical Advance in Industry. Am. Econ. Rev. 76
186-189. -----, 1990. Capitalism as an Engine of Progress. Res Policy 19 193-214. Owen-Smith, J. 2003. From Separate Systems to a Hybrid Order: Accumulative
Advantage Across Public and Private Science at Research One Universities. Res. Policy 32 1081-1104.
Owen-Smith, J. M. Riccaboni, F. Pammolli, and W.W. Powell, 2002. A Comparison of U.S. and European University-Industry Relations in the Life Sciences. Management Sci. 48 24-43.
Palmer, T.C. 2002. Building on Biotech With Lab Space Tight, Developer Banks on Sector’s Future. Boston Globe 06/20/02: C1.
35

Podolny, J. 2001. Networks as the Pipes and Prisms of the Market. Amer. J. Sociology 107 33-60.
Powell, W.W. 1990. Neither Market Nor Hierarchy: Network Forms of Organization. Res. Org. Behavior 12 295-336.
----- 1996. Inter-Organizational Collaboration in the Biotechnology Industry. J. Inst. And Theoretical Econ. 152 197-215.
Powell W.W. and P. Brantley, 1992. Competitive Cooperation in Biotechnology: Learning Through Networks. In N. Nohira & R.G. Eccles (eds.) Networks in Organizations.
Powell, W. W., K. Koput, and L. Smith-Doerr, 1996. Interorganization Collaboration and the Locus of Innovation: Networks of Learning in Biotechnology. Admin. Sci. Quart. 41 116-145.
Powell, W.W., K.W. Koput, J. Bowie, and L. Smith-Doerr, 2002. The Spatial Clustering of Science and Capital. J. Reg. Studies 36 291-305.
Powell W.W., D.R. White, K.W. Koput and J. Owen-Smith, 2004. Network Dynamics and Field Evolution: The Growth of Interorganizational Collaboration in the Life Sciences. Amer. J. Sociology. Forthcoming.
Romer, P.M. 1986. Increasing Returns and Long Run Growth. J. Polit. Econ. 94 1002- 1037.
Saxenian, A. 1994. Regional Advantage: Culture and Competition in Silicon Valley and Route 128. Cambridge, MA: Harvard U. Press.
Scarborough. V.L., J.W. Schoenfelder, and J.S. Lansing, 1999. Early Statecraft on Bali: The Water Temple Complex and the Decentralization of the Political Economy. Res. Econ. Anthropology 20 299-330.
Shan, W., G. Walker and B. Kogut. 1994. Interfirm Cooperation and Startup Innovation in the Biotechnology Industry. Strategic Management Journal. 15 387-394.
Stuart, T. 1998. Network Position and Propensities to Collaborate: an Investigation of Strategic Alliance Formation in a High-Technology Industry. Admin. Sci. Quaterly 43 668-698.
----- 2000. Interorganizational Alliances and the Performance of Firms:A study of Growth and Innovation Rates in a High-Technology Industry. Strategic Management Journal 21 791-811.
Stuart, T. E. and O. Sorenson, 2003. The geography of opportunity: Spatial heterogeneity in founding rates and the performance of biotechnology firms. Res. Policy 32 229-253.
Uzzi, B. 1996. The Sources and Consequences of Embeddedness for the Economic Performance of Organizations: The Network Effect Am. Soc. Rev 61 674-698.
---- 1997. Social Structure and Competition in Interfirm Networks: The Paradox of Embeddedness. Admin. Sci. Quart. 42 35-67.
Walker G. B. Kogut, and W.J. Shan, 1997. Social Capital, Structural Holes, and the Formation of an Industry Network. Organ. Sci. 8 109-125.
White, H.C. 1981. Where Do Markets Come From? Amer. J. Sociology 87 517-547. ----- 2002. Markets from Networks: Socioeconomic models of production. Princeton:
Princeton University Press. Zucker L.G. and M. Darby, 1996. Star Scientists and Institutional Transformation:
36

Patterns of Invention and Innovation in the Formation of the Biotechnology Industry. P. Natl. Acad. Sci. 93 12709-12716.
37
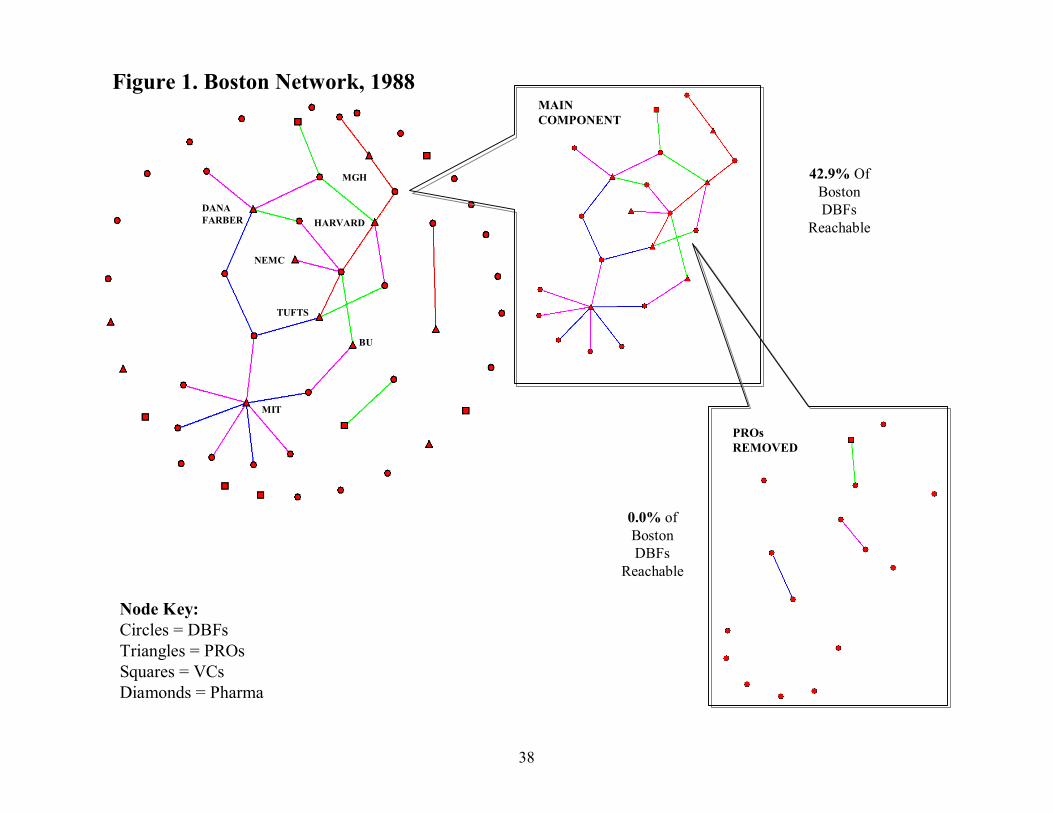
Figure 1. Boston Network, 1988
Node Key:Circles = DBFsTriangles = PROsSquares = VCsDiamonds = Pharma
MIT
BU
TUFTS
DANA FARBER HARVARD
MGH
NEMC
MAIN COMPONENT
PROs REMOVED
42.9% Of Boston DBFs
Reachable
0.0% of Boston DBFs
Reachable
38

Node Key:Circles = DBFsTriangles = PROsSquares = VCsDiamonds = PharmaRed = Boston Gray = Other Area
Figure 2. The Boston + Network, 1988
MAIN COMPONENT
MAIN COMPONENT, TIES ≥ 2
MAIN COMPONENT, TIES ≥ 2, PROs REMOVED
57.1 % Of Boston DBFsReachable
45.7% Of Boston DBFs
Reachable
45.7% Of Boston DBFs Reachable
39

Characteristics of the Main Component: Boston
0.3
0.35
0.4
0.45
0.5
0.55
0.6
0.65
0.7
0.75
0.8
0.85
88 89 90 91 92 93 94 95 96 97 98 99
Year
% DBFs: Boston% PRO Ties: Boston
Characteristics of the Main Component: Boston +
0.15
0.2
0.25
0.3
0.35
0.4
0.45
0.5
0.55
0.6
0.65
0.7
0.75
0.8
0.85
0.9
0.95
1
88 89 90 91 92 93 94 95 96 97 98 99
Year
% DBFs: Boston +% PRO Ties: Boston +
Year % DBFs: Boston % DBFs: Boston + % PRO Ties: Boston % PRO Ties: Boston +88 42.9% 57.1% 76.3% 18.6%89 43.2% 64.9% 78.4% 21.8%90 43.6% 61.5% 65.9% 19.1%91 48.8% 68.3% 52.9% 19.4%92 47.7% 68.2% 60.4% 21.5%93 44.7% 66.0% 54.9% 25.6%94 51.1% 74.5% 55.4% 26.7%95 41.7% 79.2% 51.9% 23.3%96 55.3% 91.5% 45.3% 20.5%97 66.7% 97.8% 39.5% 21.1%98 71.1% 97.8% 40.5% 20.3%99 72.1% 95.3% 41.2% 22.4%
Figure 3. Characteristics of the Boston and Boston-Plus Main Components, 1988-1999
40

Node Key:Circles = DBFsTriangles = PROsSquares = VCsDiamonds = PharmaRed = Boston Gray = Other Area
HARVARD
MIT
MGH
BUBWH
BCH
WHITEHEAD
Figure 4. Boston Network, 1998MAIN COMPONENT
PROs REMOVED
71.1% of Boston DBFs reachable
35.6% of Boston DBFs reachable
41

Table 1. Variable labels and definitions
VARIABLE DEFINITION Dependent Variable
# Patents (application)
Yearly count of successful patent applications
Independent Variables Boston Membership
Dummy variable, 1=connected to the main network component in Boston network.
Boston Position
DBF betweenness centrality score, Boston Network
Boston + Membership
Dummy variable, 1=connected to the main component in the Boston + network
Boston + Position
DBF betweenness centrality score, Boston + Network (Boston ties removed)
Time Period
Dummy Variable, 1=1993-1998
Time Period X Boston Position
Interaction between a time period dummy variable (1=1993-1998) and Boston Position
Controls Public
Dummy variable, 1= publicly traded firm
Age
Age in years since firm founding
Age2
Age in years since firm founding, squared
Log(size)
Log(number of employees)
Boston R&D Ties: PRO
Number of R&D ties to Boston Area Public Research Organizations
Ties to NIH Complex
Number of ties (all types) to the National Institutes of Health and sub-agencies
Boston R&D Ties: PRO X NIH Ties
Interaction between number Boston R&D ties to PROs and a dummy variable capturing the presence of one or more ties to the NIH and sub-agencies
42

Table 2. Conditional Fixed-Effects Negative Binomial Regressions of Successful Patent Applications, 1988-1998
*p<.05, **p<.01Pseudo R2 calculated manually relative to an intercept only model of patent applications.All models include fixed firm and year effects.
Model 1 Model 2 Model 3 Model 4 Model 5 Model 6 Public (SE)
-0.090 (0.190)
-0.090 (0.190)
-0.075 (0.190)
-0.044 (0.189)
-0.015 (0.190)
0.003 (0.189)
Age
0.190 (0.081)*
0.190 (0.081)*
0.223 (0.083)**
0.149 (0.088)
0.145 (0.089)
0.193 (0.090)*
Age2
-0.008
(0.003)* -0.008
(0.003)* -0.010
(0.003)** -0.006 (0.003)
-0.006 (0.003)
-0.009 (0.004)*
Log(Size)
0.679 (0.132)**
0.679 (0.132)**
0.657 (0.132)**
0.654 (0.130)**
0.656 (0.130)**
0.633 (0.129)**
Boston Main Component
0.376 (0.118)**
0.376 (0.118)**
0.368 (0.118)**
0.413 (0.118)**
0.425 (0.119)**
0.411 (0.119)**
Boston Betweeness
-4.328 (3.589)
-4.328 (3.589)
-10.420 (5.275)*
-4.768 (3.671)
-6.914 (3.867)
-15.626 (5.992)**
Boston + Component
-0.585 (0.258)*
-0.585 (0.258)*
-0.556 (0.259)*
-0.363 (0.277)
-0.459 (0.277)
-0.471 (0.277)
Boston + Betweeness
15.960 (4.257)**
15.960 (4.257)**
14.001 (4.420)**
9.689 (4.789)*
10.892 (4.794)*
9.521 (4.832)*
Time Period
-2.142 (0.569)**
-2.286 (0.559)**
-1.940 (0.601)**
-1.918 (0.600)**
-2.103 (0.579)**
Time Period X Boston Betweeness
11.019 (6.519)
14.520 (7.161)*
Boston R&D Ties: PRO
0.132 (0.106)
0.325 (0.135)*
0.392 (0.138)**
NIH Ties
0.172 (0.061)**
0.197 (0.061)**
0.186 (0.061)**
Boston R&D PRO X NIH Ties
-0.317 (0.152)*
-0.436 (0.164)**
Constant
-4.073 (1.004)**
-1.931 (0.683)**
-1.967 (0.682)**
-1.913 (0.690)**
-1.794 (0.699)*
-1.798 (0.697)**
Pseudo R2 0.445 0.450 0.452 0.456 0.459 0.461 Log-likelihood -441.748 -441.749 -440.274 -436.742 -434.604 -432.464 N 337 337 337 337 337 337
43

Appendix Table A1. Descriptive statistics and correlationsMean SD Min Max 1 2 3 4 5 6 7 8 9 10 11 12 13 14
1 # Patents (application) 2.756 4.693 0.000 36.000 1.0002 Public 0.656 0.476 0.000 1.000 0.130 1.0003 Age 8.903 4.893 0.000 29.000 0.099 0.170 1.0004 Age2 103.139 112.428 0.000 841.000 0.059 0.046 0.953 1.0005 Log(Size) 4.420 1.079 1.099 8.132 0.454 0.470 0.325 0.223 1.0006 Boston Membership 0.493 0.501 0.000 1.000 0.060 0.140 0.021 -0.028 0.215 1.0007 Boston R&D Ties: PRO 0.147 0.528 0.000 4.000 0.053 0.013 0.137 0.097 0.117 0.243 1.0008 Boston Position 0.007 0.017 0.000 0.130 -0.026 0.033 0.075 0.037 0.178 0.378 0.309 1.0009 Time Period 0.575 0.495 0.000 1.000 0.110 0.238 0.192 0.181 0.013 -0.011 -0.072 0.003 1.000
10 Time Period X Boston Position 0.004 0.014 0.000 0.130 0.004 0.105 0.093 0.073 0.118 0.272 0.103 0.754 0.244 1.00011 Boston-Plus Membership 0.898 0.304 0.000 1.000 0.016 0.211 -0.124 -0.185 0.159 0.333 0.094 0.133 0.025 0.096 1.00012 Ties To NIH Complex 0.685 1.330 0.000 8.000 -0.030 0.066 0.020 -0.019 0.064 0.159 -0.016 0.052 -0.104 0.070 0.174 1.00013 Boston-plus Position 0.021 0.020 0.000 0.100 0.180 0.229 0.099 0.017 0.448 0.405 0.128 0.386 -0.054 0.375 0.343 0.420 1.00014 Boston R&D Ties: PRO X Ties to NIH 0.042 0.296 0.000 3.000 0.047 0.009 0.041 0.011 0.112 0.144 0.533 0.104 -0.147 0.030 0.048 0.154 0.270 1.000
44