knowledge discovery in databasesdimitris/5311/kd-9.pdfintroduction •knowledge discovery in...
TRANSCRIPT
Knowledge Discovery in Databases-Justinas Lingys-Farhad Bin Siddique

Introduction
• Knowledge discovery in databases (KDD) is the non-trivial process of identifying valid, novel, potentially useful and ultimately understandable patterns in data
• Data -> Knowledge
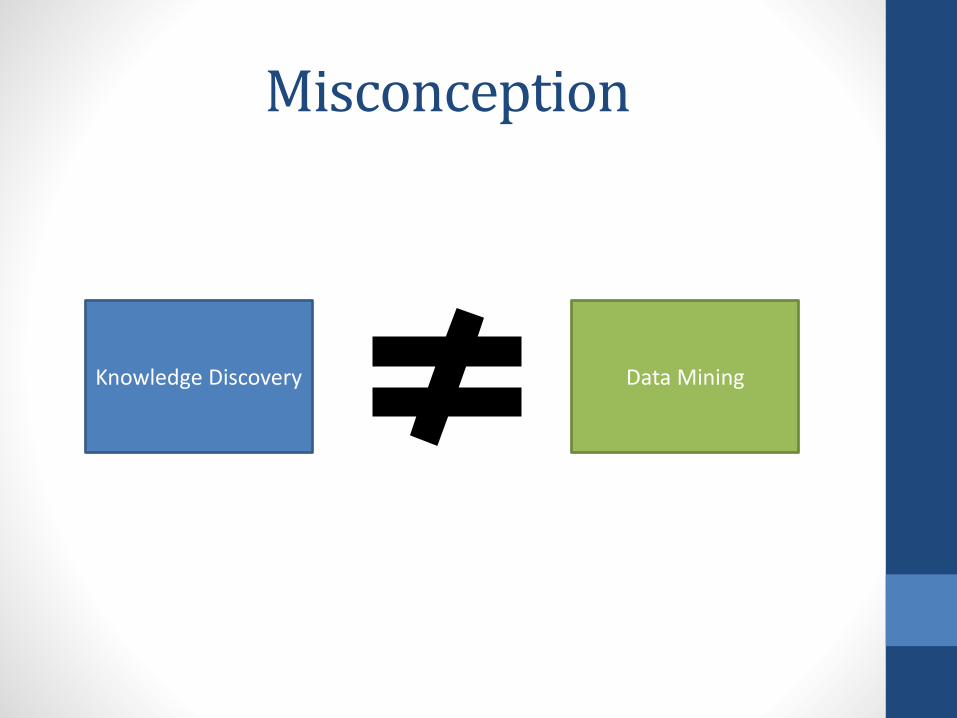
Misconception
Knowledge Discovery Data Mining
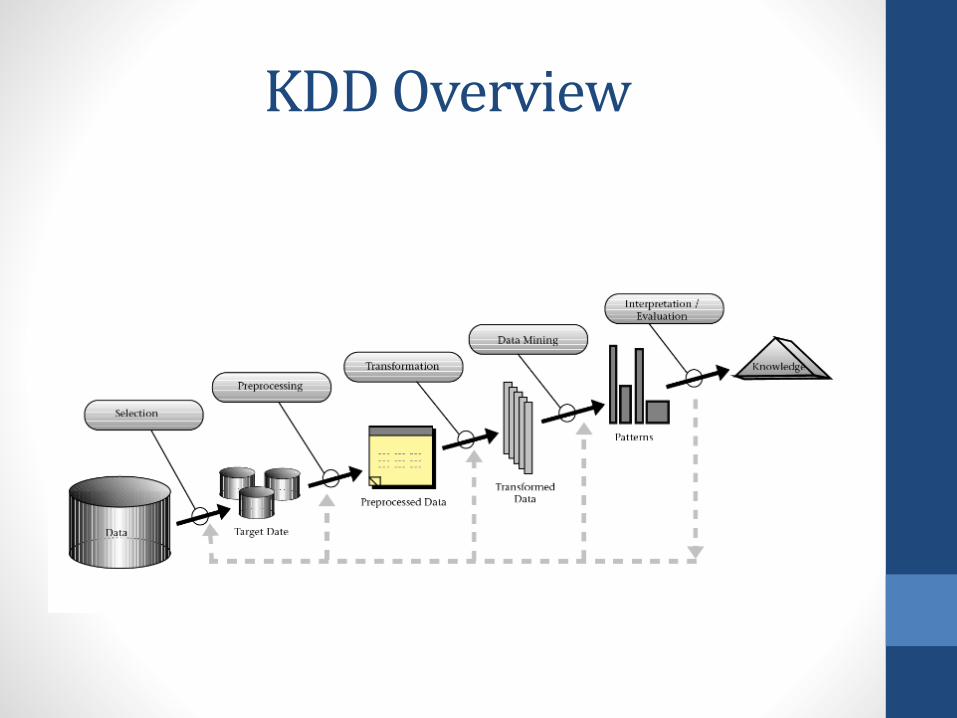
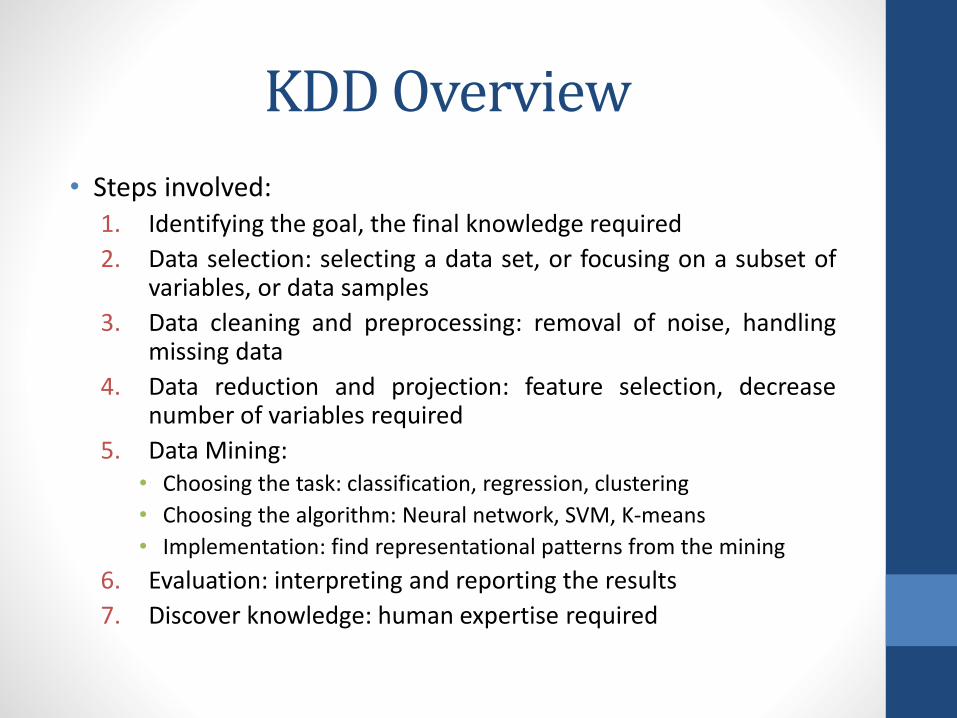
KDD Overview
KDD Overview
• Steps involved:1. Identifying the goal, the final knowledge required
2. Data selection: selecting a data set, or focusing on a subset ofvariables, or data samples
3. Data cleaning and preprocessing: removal of noise, handlingmissing data
4. Data reduction and projection: feature selection, decreasenumber of variables required
5. Data Mining:• Choosing the task: classification, regression, clustering
• Choosing the algorithm: Neural network, SVM, K-means
• Implementation: find representational patterns from the mining
6. Evaluation: interpreting and reporting the results
7. Discover knowledge: human expertise required

Example Situation
• A big fishing company requires some knowledge discoveryfrom existing databases on fishing boats, sailors and fishermen
• Some of the existing data:
Boat ID Width Length Color Fuel consumption
Boat table:
Staff ID Emp. Date
Date of Birth
Name Address HKID Sailor/Fisherman
Staff table:
Boat ID Staff ID Date Production
Assignment table:
Identifying the Goal
• The company wants to improve production levels andrevenue, and needs the team to perform knowledge discoveryon the existing database:
• To identify bottleneck in production: boat capacity, staffperformance
• Visualise different groups of better performing boats and staff,and distinguish them from the underperforming ones
• Finally, provide solution in terms of action to take: buy moreboats, hire more sailors, etc.

Data Selection
• We as data analysts first have to select the tables required toidentify our goals
• The previous tables, along with some extra tables described later,are chosen
• Perform SQL queries to get the relevant data variables

Data Errors
Instance level errors
(Data entry errors)
Schema level errors
(Lack of integrity constraints,
poor schema design)
Staff ID Emp. Date Date of Birth
Name Address HKID Sailor/Fisherman
78553853 15/05/1012 15/05/1990 Lee, Jon Bakery street,Bla city
12584680 S
11111111 10/09/2014 01/04/1985 NULL Some street, Bla city
-15185835 NULL
Staff table:
Misspelled Baker’s streetIC problem Poor schema designIC problem

Data Cleaning
• Data cleaning is usually a two-stage process: error detectionand error correction
• There two major approaches to error detection andcorrection:
• Quantitative techniques, largely used for outlier detection, usestatistical parameters (e.g., mean and standard deviation) toidentify possibly incorrect attribute values
Boat ID Staff ID Date Production
1230 78553853 05/2015 10000
1230 58874568 06/2015 1000000000
2220 12345678 06/2015 7500
3560 85547563 07/2015 9856
8540 11111111 04/2005 12450
Assignment table:

Data Cleaning
• Qualitative techniques use constraints, rules, patterns todetect errors (much current research on data cleaning)
• Many works use simple solutions to resolving constrains: tupledeletion and insertion
FD: (staff id {name, address})
Staff ID Emp. Date Date of Birth
Name Address HKID Sailor/Fisherman
55555555 15/05/2014 15/05/1990 Lee, Ben NULL 12584681 S
66666666 10/09/2010 01/04/1982 Smith,Jane
NULL 78854245 NULL
Simple Techniques
• Deleting tuples or inserting new ones in order to fix integrityconstraints may result in useful data loss (tuples of sailors)
• By applying the above techniques, the company might not beable to succeed in KDD due to crucial information loss
Dependencies
• Traditional dependencies (e.g., functional dependencies) weredeveloped for schema design, but can also be used for errordetection and correction
• Values can be modified in a such way that they would fulfillthe constraints without introducing data inconsistency
• Such an approach requires a cost function: accuracy andsimilarity.

Accuracy
Two staff tables:
Staff table 1 (Shipping department):
Staff ID Emp. Date Date of Birth
Name Address HKID Sailor/Fisherman
55555555 15/05/2014 15/05/1990 Lee, Ben NULL 12584681 S
Staff table 2 (HR department):
Staff ID Emp. Date Date of Birth
Name
Address
HKID Position Salary
55555555 15/05/2014 15/05/1986 Lee, Ben
Some addr, city
12584681 3 $X
Similarity
• Similarity:• How different tuples or attributes are
E.g., edit distance – a way of quantifying how dissimilar twostrings are to one another by counting the minimum number ofoperations required to transform one string into the other:
• The Levenshtein distance between "kitten" and "sitting" is 3. A minimal edit script that transforms the former into the latter is:
• kitten → sitten (substitution of "s" for "k")
• sitten → sittin (substitution of "i" for "e")
• sittin → sitting (insertion of "g" at the end)

Data Repair
• A repair of a database D is a database D’ such that:1. tuples appearing in D appear in D’ with possible
modifications,
2. zero or more tuples might be inserted in D’ but not in D,3. and D’ satisfies some constraint set C’.
▪ Repair cost is the total sum of products of a tuple weight inthe original database D and distance measured betweenthe two corresponding tuples in the two databases:
cost = ∑i wi × dist(D (attri),D’’(attri))
• Minimizing the cost function and simultaneously satisfyingthe constraint set C’ are an NP-complete problem.
Method Briefly
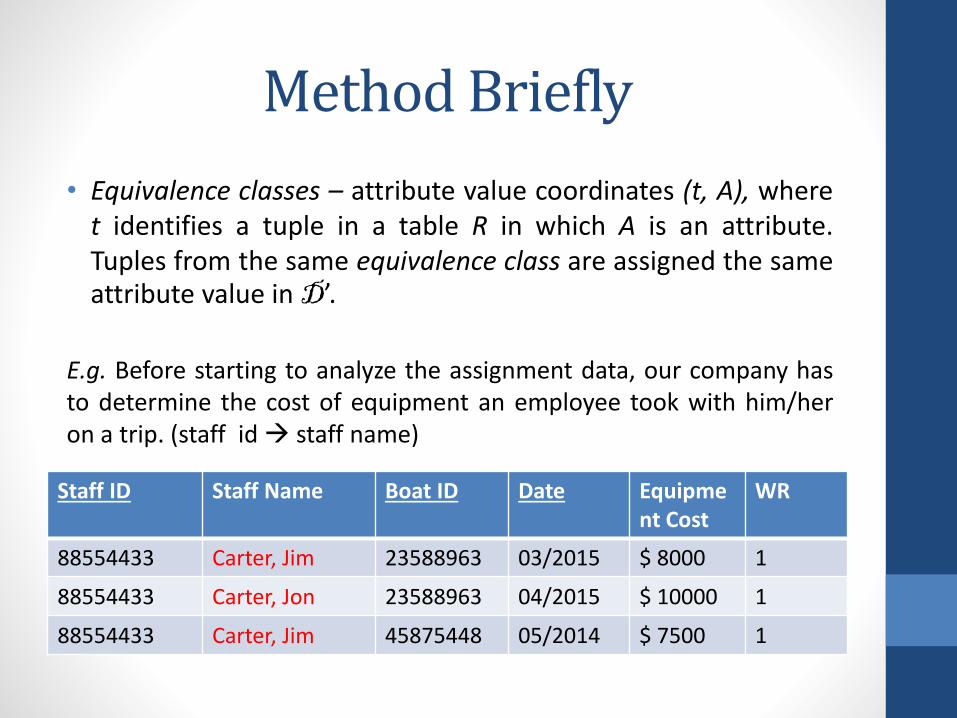
• Equivalence classes – attribute value coordinates (t, A), wheret identifies a tuple in a table R in which A is an attribute.Tuples from the same equivalence class are assigned the sameattribute value in D’.
E.g. Before starting to analyze the assignment data, our company hasto determine the cost of equipment an employee took with him/heron a trip. (staff id staff name)
Staff ID Staff Name Boat ID Date Equipment Cost
WR
88554433 Carter, Jim 23588963 03/2015 $ 8000 1
88554433 Carter, Jon 23588963 04/2015 $ 10000 1
88554433 Carter, Jim 45875448 05/2014 $ 7500 1
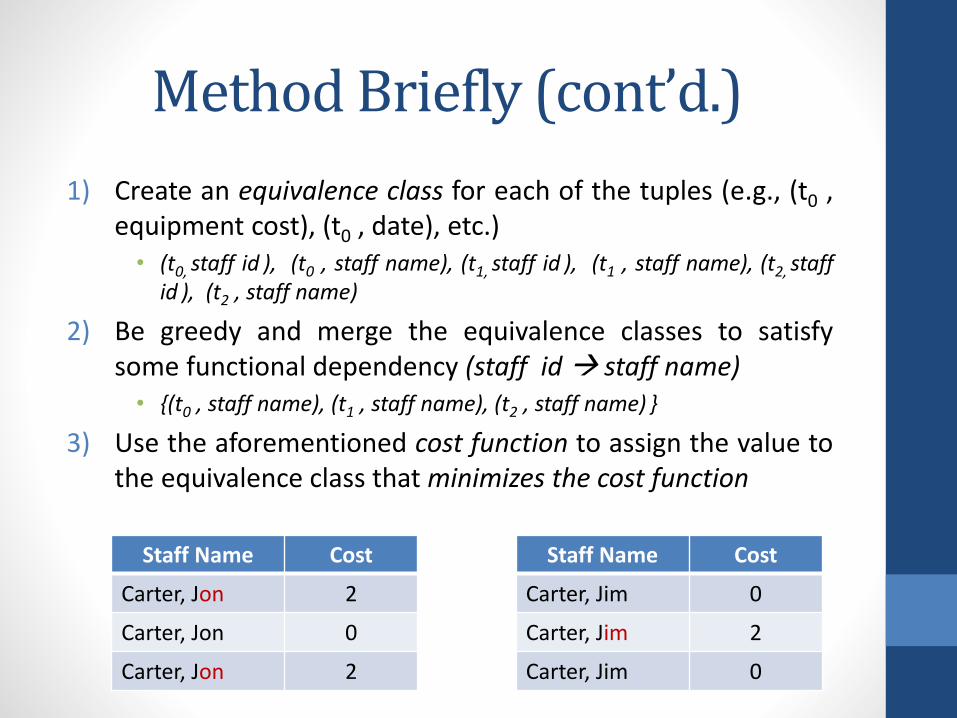
Method Briefly (cont’d.)
1) Create an equivalence class for each of the tuples (e.g., (t0 ,equipment cost), (t0 , date), etc.)• (t0, staff id ), (t0 , staff name), (t1, staff id ), (t1 , staff name), (t2, staff
id ), (t2 , staff name)
2) Be greedy and merge the equivalence classes to satisfysome functional dependency (staff id staff name)• {(t0 , staff name), (t1 , staff name), (t2 , staff name) }
3) Use the aforementioned cost function to assign the value tothe equivalence class that minimizes the cost function
Staff Name Cost
Carter, Jon 2
Carter, Jon 0
Carter, Jon 2
Staff Name Cost
Carter, Jim 0
Carter, Jim 2
Carter, Jim 0

Data Transformation
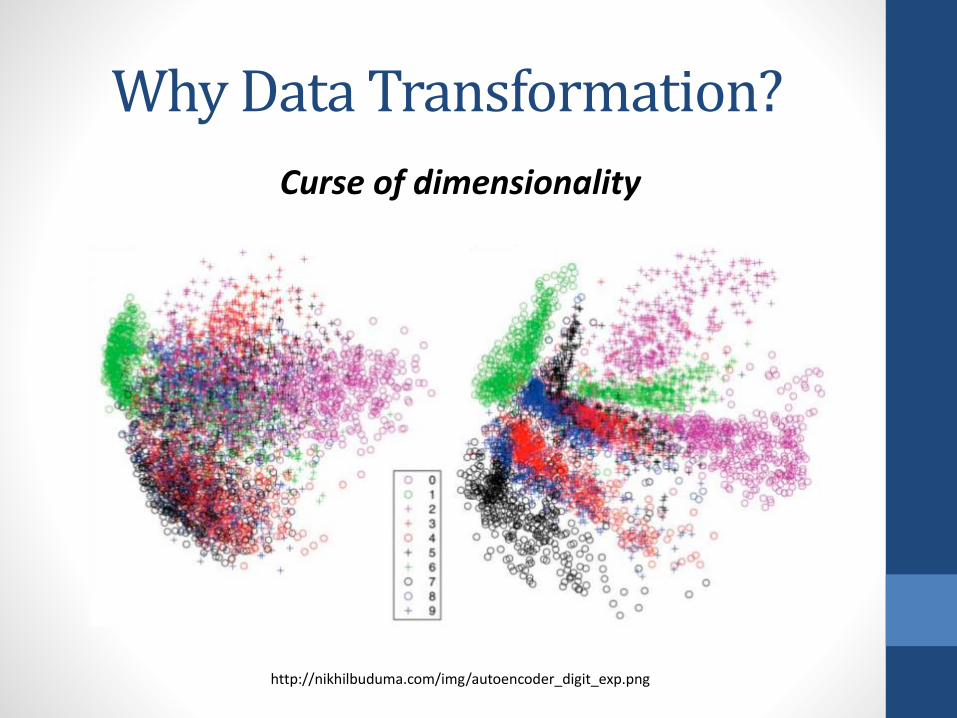
Why Data Transformation?
http://nikhilbuduma.com/img/autoencoder_digit_exp.png
Curse of dimensionality

Data Transformation
• Feature selection refers to the process of reducing the inputsfor processing and analysis, or of finding the most meaningfulinputs.
• Feature extraction refers to the process of extracting usefulinformation or features from existing data.
X A B
1 important not important
2 important not important
X A
1 important
2 important
Feature Selection
X A B
1 important not important
2 important not important
Feature ExtractionZ K
X xxxx
y yyyy

Why is Feature SelectionImportant?
• Implies some degree of cardinality reduction – data miningmodels are trained faster and models get better performance
• Some attributes of a table might not affect the identifiedproblem, in our case production, but might affect data miningmodels
Boat ID Width Length Color Fuel consumption
12345678 60 40 red 600 l/h
23456789 80 55 blue 1200 l/h
Do we need this to discover some information related to production?
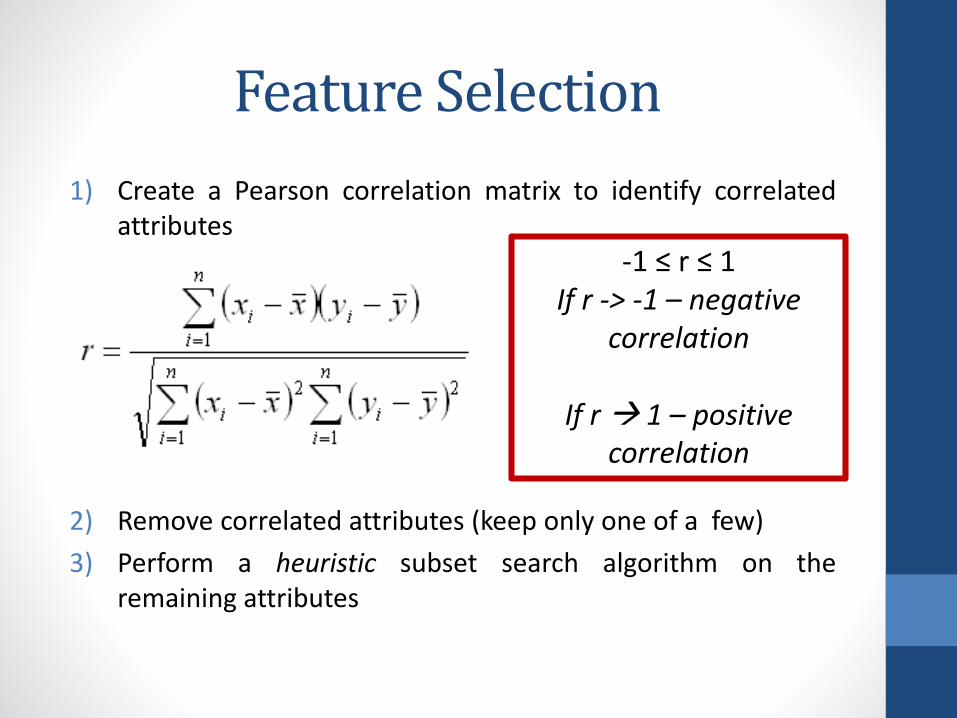
Feature Selection
1) Create a Pearson correlation matrix to identify correlatedattributes
2) Remove correlated attributes (keep only one of a few)
3) Perform a heuristic subset search algorithm on theremaining attributes
-1 ≤ r ≤ 1If r -> -1 – negative
correlation
If r 1 – positive correlation

Our Example
Boat ID Width Color Fuel consumption
12345678 60 red 600 l/h
23456789 80 blue 1200 l/h
Correlations (threshold = (> 0.75 or < -0.75)):
• Width and length = 0.87• Color and dimensions = ~ 0.06• Color and fuel consumption = ~ -0.12• Fuel consumption and dimensions = ~ 0.67
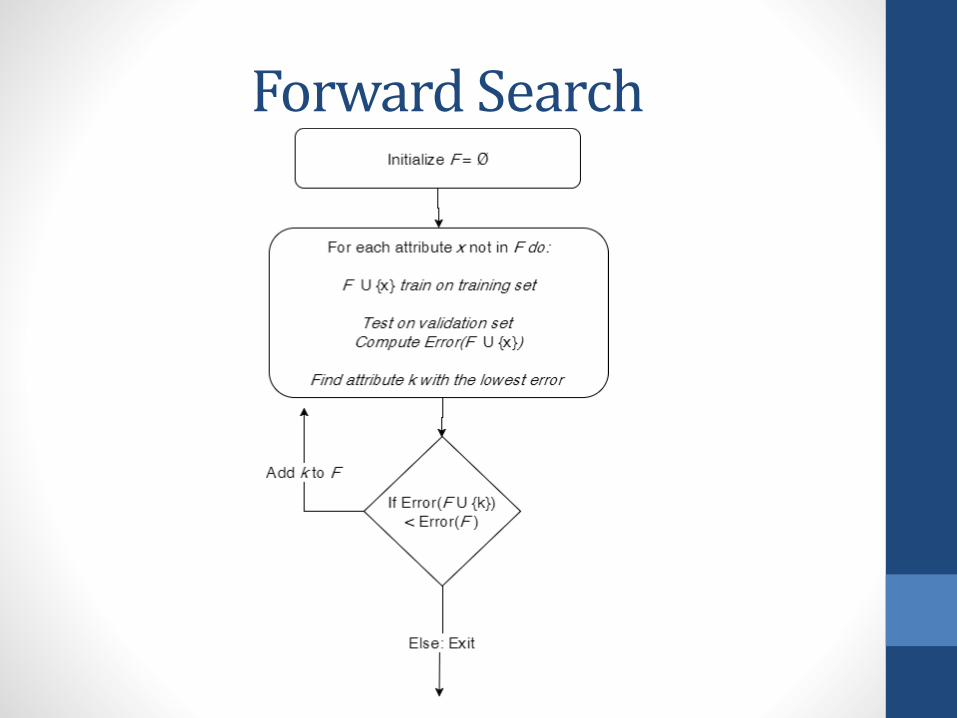
Forward Search

Backward Search
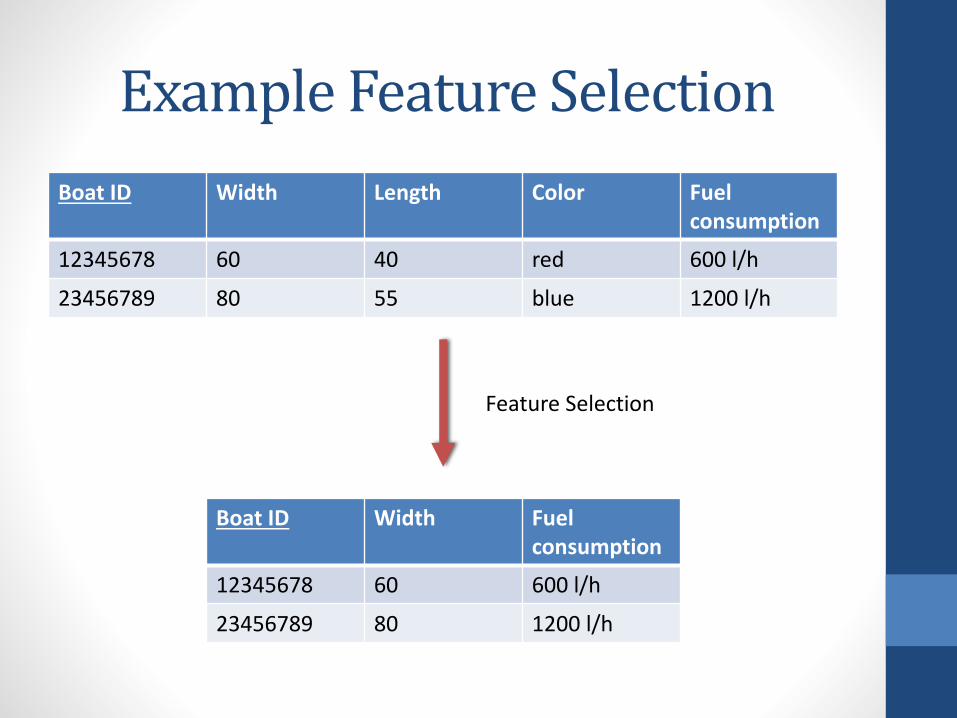
Example Feature Selection
Boat ID Width Fuel consumption
12345678 60 600 l/h
23456789 80 1200 l/h
Boat ID Width Length Color Fuel consumption
12345678 60 40 red 600 l/h
23456789 80 55 blue 1200 l/h
Feature Selection

Feature Selection
• Database management systems (DBMS) usually use attributeranking/scoring for feature selection
• Microsoft SQL Server Data Mining supports automatic attributescoring which is based on the algorithms used in the data miningstage
• Oracle Data Mining supports the attribute importance miningfunction, which ranks the attributes according to theirimportance in predicting a target

Data Mining
Data Mining
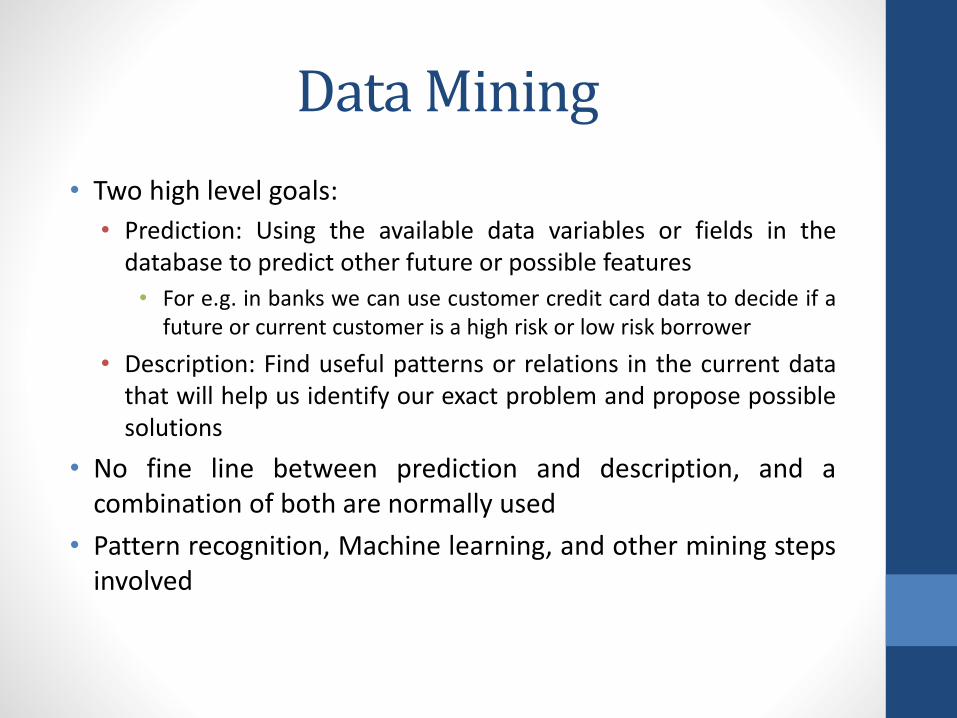
• Two high level goals:
• Prediction: Using the available data variables or fields in thedatabase to predict other future or possible features
• For e.g. in banks we can use customer credit card data to decide if afuture or current customer is a high risk or low risk borrower
• Description: Find useful patterns or relations in the current datathat will help us identify our exact problem and propose possiblesolutions
• No fine line between prediction and description, and acombination of both are normally used
• Pattern recognition, Machine learning, and other mining stepsinvolved

Data Mining

Association Rules Mining
• To check for relations between items in database that arefrequently used together, using simple if-then statements
• For example, in a supermarket, if a customer buys bread thenit’s highly likely that the same person will buy jam
• Bread => jam
• Single dimension association rules
• Buys(bread) => Buys(jam)
• Multi dimension association rules
• Occupation(IT), age(>22) => salary(>$15,000)

Association Rules Mining
• Three metrics of evaluation, support, confidence and lift
• For example for an association: A => B
• Support =𝑓𝑟𝑒𝑞(𝐴,𝐵)
𝑁
• Confidence =𝑓𝑟𝑒𝑞(𝐴,𝐵)
𝑓𝑟𝑒𝑞(𝐴)
• For example, if there are 100 transactions; 40 of them buybread, and 20 of them buy both bread and jam• support of bread=>jam: 20/100 = 20%
• confidence: 20/40 = 50%
• These metrics can be used to identify items with higherrelation to each other
• Can be useful for companies to target and identify customersbased on transactions

Association Rule – AprioriAlgorithm
• Commonly used algorithm to identify frequently used lists orsets of items
• Condition: A subset of the frequent itemset must also be afrequent itemset
• Uses a process called pruning to create iteratively listscontaining k items and then increasing to k+1, until the list isempty
• For example for our fishing company example, we have adatabase containing sales information of different types offish, labelled in numeric {1,2,3,…}
• Each transaction has a transaction ID and tells us the types offish (or items) bought
• The algorithm is described next
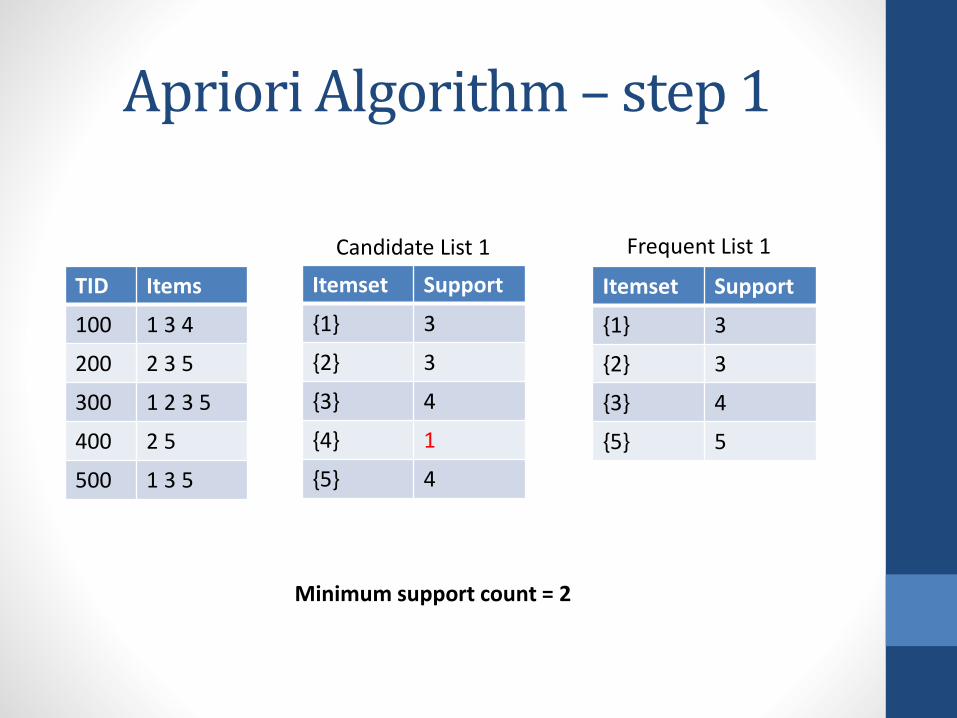
Apriori Algorithm – step 1
TID Items
100 1 3 4
200 2 3 5
300 1 2 3 5
400 2 5
500 1 3 5
Itemset Support
{1} 3
{2} 3
{3} 4
{4} 1
{5} 4
Candidate List 1
Itemset Support
{1} 3
{2} 3
{3} 4
{5} 5
Frequent List 1
Minimum support count = 2

Apriori Algorithm – step 2
TID Items
100 1 3 4
200 2 3 5
300 1 2 3 5
400 2 5
500 1 3 5
Itemset Support
{1,2} 1
{1,3} 3
{1,5} 2
{2,3} 2
{2,5} 3
{3,5} 3
Candidate List 2
Itemset Support
{1,3} 3
{1,5} 2
{2,3} 2
{2,5} 3
{3,5} 3
Frequent List 2
Minimum support count = 2
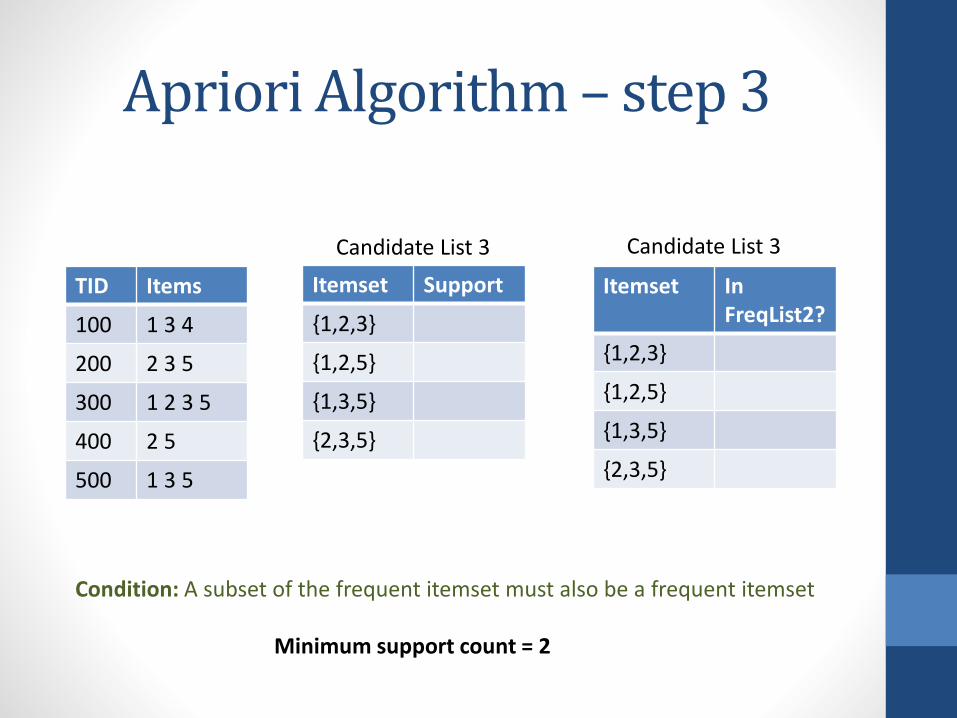
Apriori Algorithm – step 3
TID Items
100 1 3 4
200 2 3 5
300 1 2 3 5
400 2 5
500 1 3 5
Itemset Support
{1,2,3}
{1,2,5}
{1,3,5}
{2,3,5}
Candidate List 3 Candidate List 3
Minimum support count = 2
Condition: A subset of the frequent itemset must also be a frequent itemset
Itemset In FreqList2?
{1,2,3}
{1,2,5}
{1,3,5}
{2,3,5}

Apriori Algorithm – step 3
TID Items
100 1 3 4
200 2 3 5
300 1 2 3 5
400 2 5
500 1 3 5
Candidate List 3 Frequent List 2
Minimum support count = 2
Condition: A subset of the frequent itemset must also be a frequent itemset
Itemset In FreqList2?
{1,2,3}{1,2},{1,3},{2,3}
No
{1,2,5}{1,2},{1,5},{2,5}
No
{1,3,5}{1,3},{1,5},{3,5}
Yes
{2,3,5}{2,3},{2,5},{3,5}
Yes
Itemset Support
{1,3} 3
{1,5} 2
{2,3} 2
{2,5} 3
{3,5} 3

Apriori Algorithm – step 3
TID Items
100 1 3 4
200 2 3 5
300 1 2 3 5
400 2 5
500 1 3 5
Candidate List 3
Frequent List 3
Minimum support count = 2
Condition: A subset of the frequent itemset must also be a frequent itemset
Itemset In FreqList2?
{1,2,3}{1,2},{1,3},{2,3}
No
{1,2,5}{1,2},{1,5},{2,5}
No
{1,3,5}{1,3},{1,5},{3,5}
Yes
{2,3,5}{2,3},{2,5},{3,5}
Yes
Itemset Support
{1,3,5} 2
{2,3,5} 2

Apriori Algorithm – step 4
TID Items
100 1 3 4
200 2 3 5
300 1 2 3 5
400 2 5
500 1 3 5
Itemset Support
{1,2,3,5} 1
Candidate List 4 Frequent List 4
Minimum support count = 2
Condition: A subset of the frequent itemset must also be a frequent itemset
Itemset Support
Empty

Apriori Algorithm - return
Frequent List 3
Itemset Support
{1,3,5} 2
{2,3,5} 2
Frequent List 2
Itemset Support
{1,3} 3
{1,5} 2
{2,3} 2
{2,5} 3
{3,5} 3
Itemset Support
{1} 3
{2} 3
{3} 4
{5} 5
Frequent List 1
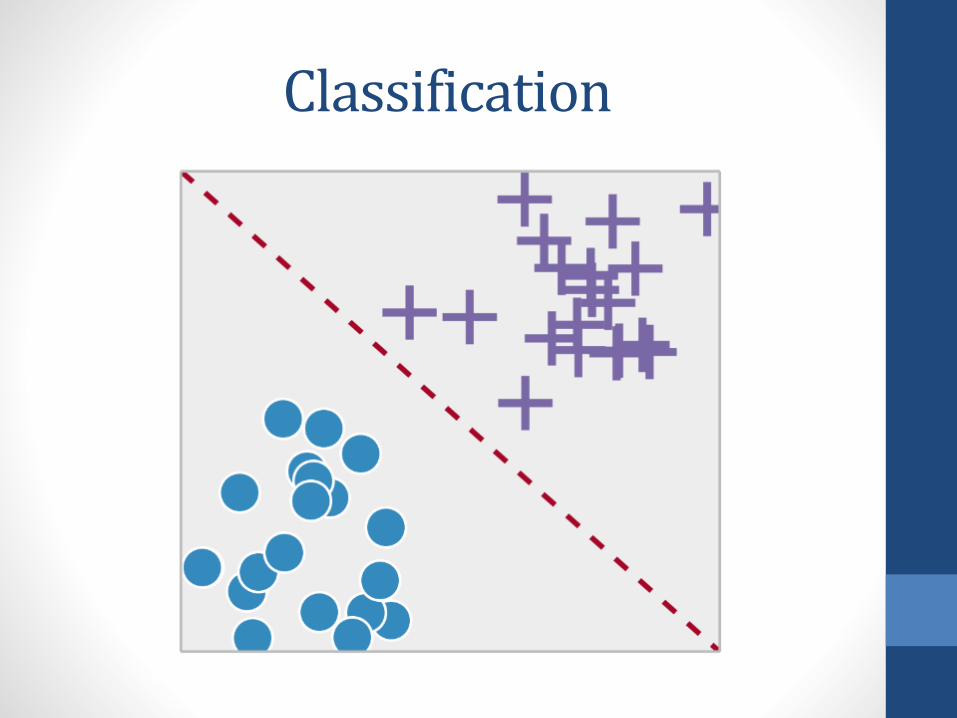
Classification

Problems with Large Database
• Most classification models, such as neural networks andsupport vector machines, require us to look at each datasample (or batch) and train our model
• Too slow for the retrieval task for large databases, so overallefficiency is low
• Better approach: Decision trees
• Can develop efficient SQL queries to select certain tuplesbased on predefined conditions

Decision Trees
• For example in our fishing company case, we want to classifyour boat assignment (crew and boat information) based onthe production (high, medium and low production)
• We first join the tables required and select the attributesessential
• Perform splitting of the trees until we get to a pure distinctionof classes
• The idea is to decrease uncertainty (entropy) in the data
• Can be applied to the whole database using simple SELECTqueries in SQL
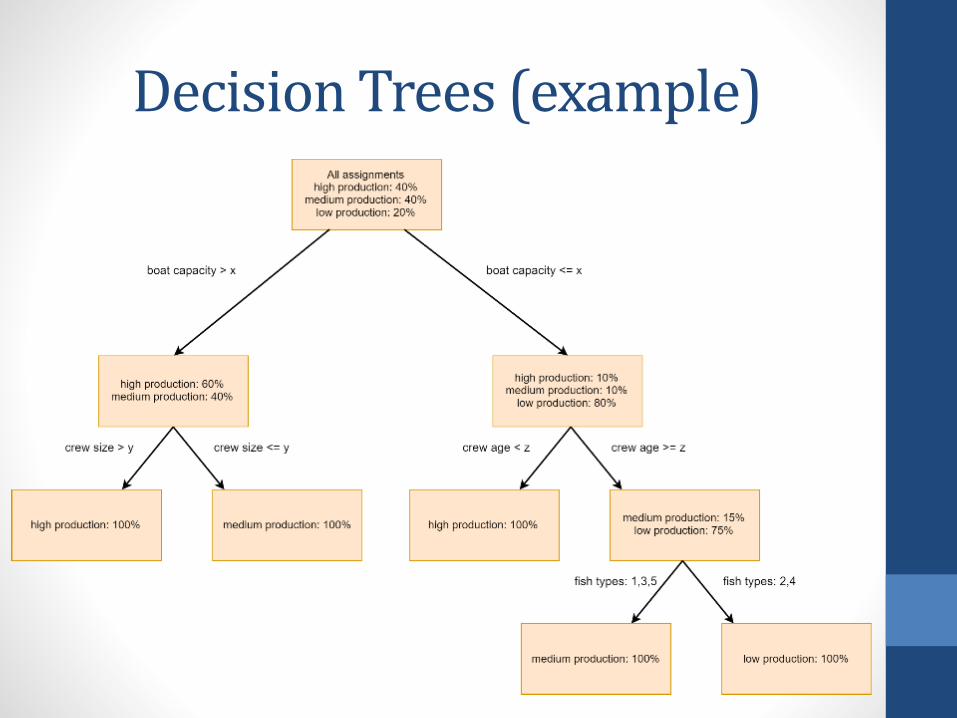
Decision Trees (example)

Clustering
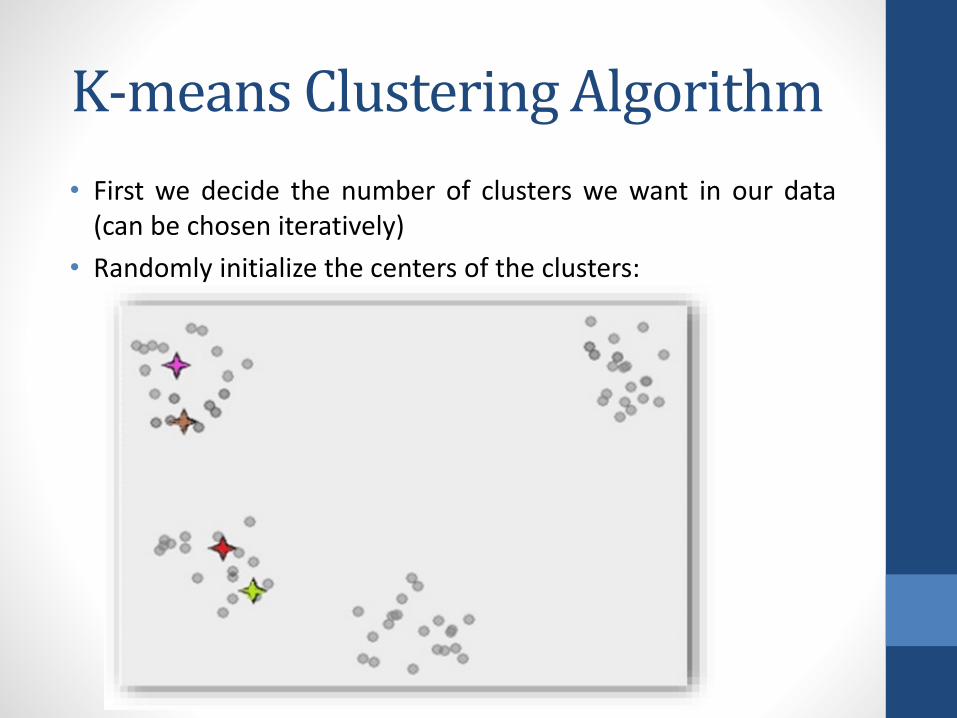
K-means Clustering Algorithm
• First we decide the number of clusters we want in our data(can be chosen iteratively)
• Randomly initialize the centers of the clusters:

K-means Clustering Algorithm
• Assign each point to the nearest centroid:

K-means Clustering Algorithm
• Update the centroids by taking the mean of all the points in the respective cluster:
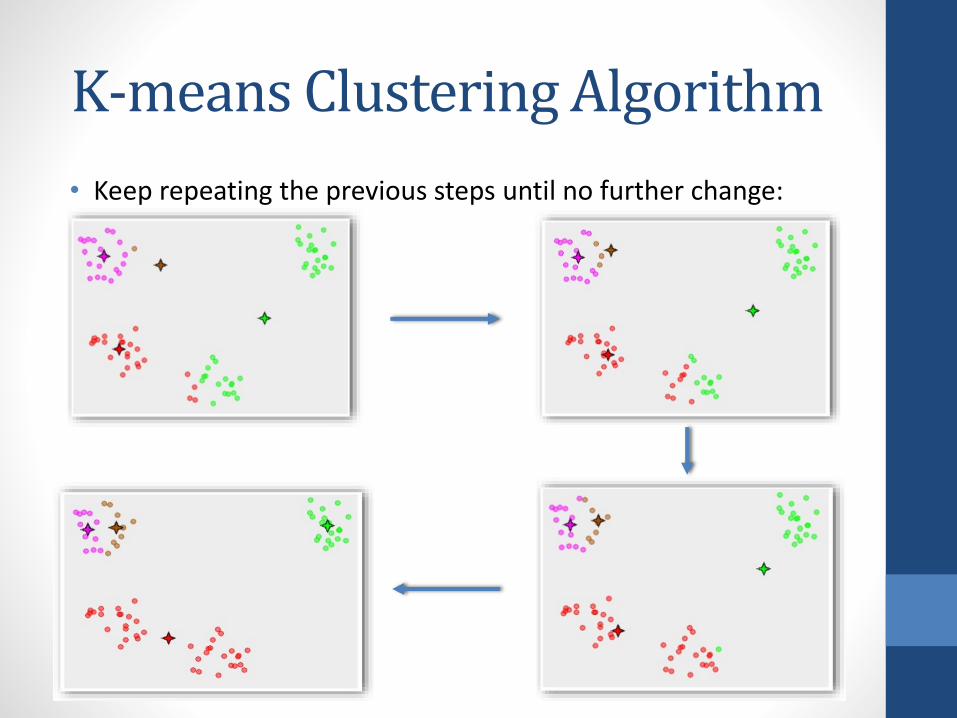
K-means Clustering Algorithm
• Keep repeating the previous steps until no further change:

K-means Clustering Algorithm
• Can be performed efficiently using multiple SQL queries:
1. Generate the data table containing the feature dimensions (x,y), and the cluster it belongs to
2. Generate a cluster table, where the points (x,y) are randomly initialized in the beginning
3. Iterate through the data table and assign each data point to thenearest cluster, having the least Euclidean distance
4. GROUP BY cluster id for the data table and calculate mean of allthe data points in that cluster; update the particular cluster id(x,y) values with the mean
5. Keep repeating until convergence
Data id Cluster id x y
Cluster id x y
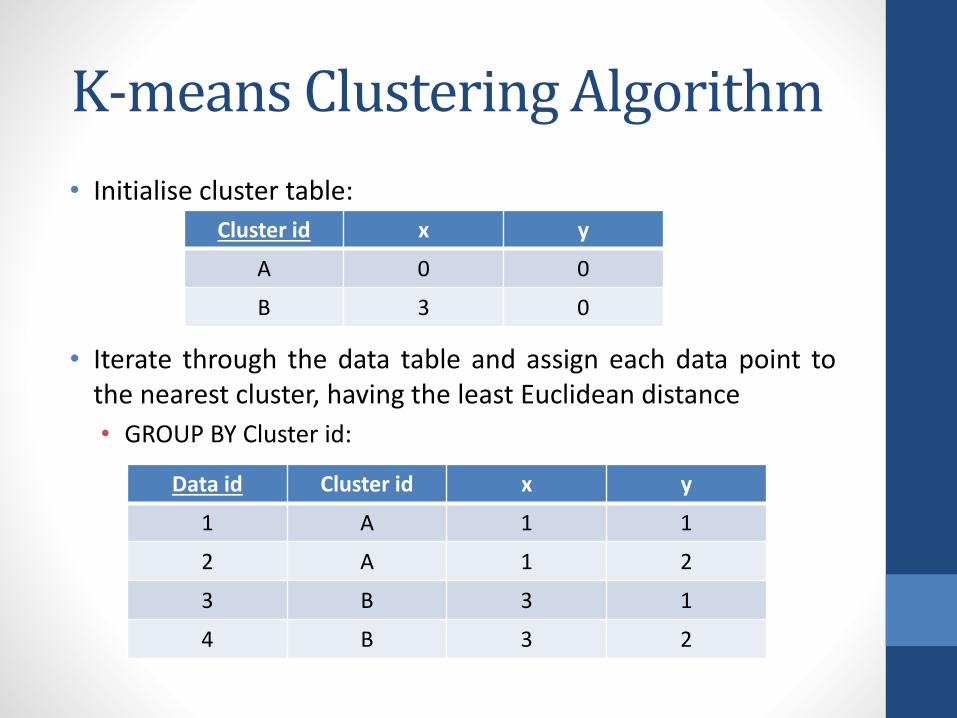
K-means Clustering Algorithm
• Initialise cluster table:
• Iterate through the data table and assign each data point tothe nearest cluster, having the least Euclidean distance
• GROUP BY Cluster id:
Data id Cluster id x y
1 A 1 1
2 A 1 2
3 B 3 1
4 B 3 2
Cluster id x y
A 0 0
B 3 0

K-means Clustering Algorithm
• Update cluster table by taking average of the respective groupof data:
• Done here since the data points have reached convergencealready:
Data id Cluster id x y
1 A 1 1
2 A 1 2
3 B 3 1
4 B 3 2
Cluster id x y
A 1 1.5
B 3 1.5

Evaluation
• Every model’s results are validated by testing them on a designated test set
• Test set can be a subset of the data having human labels
• Metrics of evaluation:
• Accuracy
• Precision
• Recall
• F-score:
2 ×𝑃𝑟𝑒𝑐𝑖𝑠𝑖𝑜𝑛×𝑅𝑒𝑐𝑎𝑙𝑙
𝑃𝑟𝑒𝑐𝑖𝑠𝑖𝑜𝑛+𝑅𝑒𝑐𝑎𝑙𝑙

Knowledge Representation
Knowledge Representation
• Provide useful insights based on the data mining results
• Go back to previous steps if needed, and iteratively come upwith new results
• Examples:
• Fish types association rules: enables the company to targetbuyers based on the relations
• Production information: identifies the features affectingproduction most
• Low salary of employees?
• Need larger/more boats?
• Catch more of certain fish types (variable net size)?
• Etc…

Summary
• Overall KDD process:
• Data Selection
• Data Preprocessing
• Data Transformation
• Data Mining
• Evaluation
• Representation/Visualization
• Many more methods involved and optimization of eachmethod is necessary when dealing with large databasestructures

Thank you!