knowledge discovery in an object-oriented … discovery in an object-oriented oceanographic database...
TRANSCRIPT

Knowledge Discovery in an Object-Oriented Oceanographic Database System
Annual Report September 1,1997 - August 31,1998
ONR EPSCoR Grant N00014-96-1-1276 PR Number 96PR07924-00
Julia Hodges Susan Bridges
Department of Computer Science Mississippi State University
Box 9637 Mississippi State, MS 39762-9637
Abstract
The rate at which scientific data is collected today has overwhelmed the ability of scientists to store and analyze the data. Current research in knowledge discovery in databases is addressing this problem by developing techniques that can automatically extract knowledge of interest in a particular problem domain. This report describes the results of the second year's efforts in the development of a knowledge discovery system for use by oceanographers at the Naval Oceanographic Office (NAVOCEANO) at the Stennis Space Center in the identification of certain oceanographic features. The system is composed of a knowledge discovery component built to interact with a database system currently in use at Stennis Space Center. The database system will be extended to store metadata and knowledge extracted by the knowledge discovery component. Working with scientists at NAVOCEANO, we determined that the focus of our work is the identification and characterization of regions of sand waves in acoustic imagery data.
1. Introduction
Fayyad, Piatetsky-Shapiro, and Smyth (1996) describe the knowledge discovery problem as the need to develop "a new generation of techniques and tools with the ability to intelligently and automatically assist humans in analyzing the mountains of data for nuggets of useful information." The goal of this project is to develop a knowledge discovery system consisting of an oceanographic database and the tools needed to support the automated extraction of information from the database. Such a system will aid oceanographers in the analysis of complex oceanographic data sets that are too large to be analyzed manually. This work involves the development of knowledge discovery tools that aid oceanographers in their data analysis tasks and mechanisms for storing the discovered knowledge in an existing oceanographic
Appswsd for puhhm rol«oMj DJetribaüan U*dlmlt«d

REPORT DOCUMENTATION PAGE Form Approved
OMB No. 0704-0188
Public reporting burden for this collection of information is estimated to average 1 hour per response, including the time for reviewing instructions, searching existing data sources, gathering and maintaining the data needed, and completing and reviewing the collection of information. Send comments regarding this burden estimate or any other aspect of this collection of information, including suggestions for reducing this burden to Washington Headquarters Services, Directorate for Information Operations and Reports, 1215 Jefferson Davis Highway, Suite 1204, Arlington, VA 22202-4302, and to the Office of Management and Budget, Paperwork Reduction Project (0704-0188), Washington, DC 20503.
1. AGENCY USE ONLY (Leave blank) 2. REPORT DATE
Sept. 30. 1998
3. REPORT TYPE AND DATES COVERED
Performance Report, 9/1/97 - 8/31/98 4. TITLE AND SUBTITLE
Knowledge Discovery in an Oceanographic Database System
6. AUTHOR(S)
Julia Hodges Susan Bridges
5. FUNDING NUMBERS
Grant No. N00014-96-1-1276 P.R. No. 96PR07924-00
7. PERFORMING ORGANIZATION NAMES(S) AND ADDRESS(ES)
Mississippi State University P.O. Box 6156 Mississippi State, MS 39762
8. PERFORMING ORGANIZATION REPORT NUMBER
P.O. Code 321SI
9. SPONSORING / MONITORING AGENCY NAMES(S) AND ADDRESS(ES)
Office of Naval Research Regional Office Atlanta 101 Marietta Tower Suite 2805 101 Marietta St. Atlanta, GA 30321-0008
10. SPONSORING /MONITORING AGENCY REPORT NUMBER
AGO Code N66020
11. SUPPLEMENTARY NOTES
a. DISTRIBUTION /AVAILABILITY STATEMENT
Approved for public release
12. DISTRIBUTION CODE
N68892
13. ABSTRACT (Maximum 200 words)
The rate at which scientific data is collected today has overwhelmed the ability of scientists to store and analyze the data. Current research in knowledge discovery in databases is addressing this problem by developing techniques that can automatically extract knowledge of interest in a particular problem domain. This report describes the results of the second year's efforts in the development of a knowledge discovery system for use by oceanographers at,the Naval Oceanographic Office (NAV0CEAN0) at the Stennis Space Center in the identification of certain oceanographic features. The system is composed of a knowledge discovery component built to interact with a database system currently in use at Stennis Space Center. The database system will be extended to store metadata and knowledge extracted by the knowledge discovery component. Working with scientists at NAV0CEAN0, we determined that the focus of our work is the identification and characterization of regions of sand waves in acoustic imagery data.
14. SUBJECT TERMS
Knowledge Discovery, Data Mining, Acoustic Imagery, Object- Oriented Database
15. NUMBER OF PAGES
13 16. PRICE CODE
17. SECURITY CLASSIFICATION OF REPORT
unclassified
18. SECURITY CLASSIFICATION OF THIS PAGE
unclassified
19. SECURITY CLASSIFICATION OF ABSTRACT
unclassified
20. LIMITATION OF ABSTRACT
Standard l-orm 258 (Rev. 2-85) Prescribed by ANISE Sad Z39-18

database. This work is being done in collaboration with scientists at the Naval Oceanographic Office at the Stennis Space Center. Although we have consulted with a number of scientists at NAVOCEANO at Stennis, our primary points of contact have been Dr. Martha Head, Supervisory Oceanographer, Modeling and Techniques Department; Mr. Steve Lingsch, Geophysicist, Geophysical Techniques Department; and Dr. Peggy Haeger, Oceanographer, Geophysical Techniques Department.
The scientists at NAVOCEANO are interested in a knowledge discovery system that can aid in the identification of certain oceanographic features. We are working with them to develop a prototype knowledge discovery system that uses acoustic imagery and other data to province the ocean floor. Currently the prototype system assists in the identification of provinces that contain sand waves, a task chosen by the NAVOCEANO scientists as the focus for the system.
2. The Oceanographic Database
Although we initially established the design and implementation of the object-oriented oceanographic database as the first major task in this project, this approach was abandoned for two major reasons. First, the delay in ordering the object-oriented DBMS tool that we reported last year caused us to concentrate our first-year's efforts on the knowledge discovery aspects of the project. This delay, along with the encouraging results of our first year's work on the knowledge discovery component, have caused us to concentrate our efforts on the KD component. Second, we, in consultation with the NAVOCEANO scientists, determined that it would be better to extend the geographical information system already in use at NAVOCEANO to handle the new data types rather than design a new database system. We are currently in the process of obtaining and installing this system and will extend it to accommodate meta data and discovered knowledge during the third year of this project.
3. The Knowledge Discovery System
The overall goal of the knowledge discovery system we are building is to aid the scientists at NAVOCEANO in the analysis of large sets of complex oceanographic data. More specifically, the scientists at NAVOCEANO wish to have a system that can use acoustic imagery and other data to province the ocean floor. Geologists currently do this job manually. Our system extracts texture statistics from acoustic images (collected from a 100 kHz Chirp Side- Scan Sonar using a Data Sonics SIS 1000) and applies clustering algorithms to identify classes of textures. In our first year's report, we described:
1) the knowledge discovery process that we are using including both texel-based and region- based extraction of texture statistics,
2) sets of experiments that we conducted to select a parameters such as texel size and number of classes for the texel-based approach,
3) the results of feature selection experiments, 4) the results of experiments comparing the texel-based approach and the region-growing
approach, and 5) techniques used to visualize the results of the classification.
Because the scientists at NAVOCEANO found the results from the region-growing approach much more satisfactory than those from the texel-based approach, we have concentrated our

second-year's effort on refining and extending this approach. Figure 1 below shows a small portion of one of the acoustic images with two distinct areas of sand waves and the classified image based on region-growing.
Figure 1. Acoustic image with distinct sand wave regions and classified image.
In the second year of our research, our major focus has been to apply the knowledge discovery process based on region-growing to a much larger number of images and to conduct experiments to parameterize the region-growing algorithm to make it applicable to a wider variety of images. We have also compared clustering results based on a Bayesian classifier (Autoclass) and a decision-tree clustering algorithm (Cobweb), have investigated methods for parallelizing the knowledge discovery process, and are in the process of developing methods for characterizing regions identified as containing sand waves.
3.1 Application to a Wider Range of Images
When we began applying our knowledge discovery process to a larger set of images, we found it necessary to adjust both the boundary and region parameters of the region-growing algorithm and to repeat the feature selection experiments. In order to adjust the region-growing algorithm parameters, it was necessary to be able to visually identify the regions found by the algorithm. A visualization tool was developed which displays the original image with red lines outlining all regions identified by the region-growing algorithm.
There are two major tunable parameters for the region-growing algorithm. The boundary threshold is used to decide whether a given cell should be marked as a region cell or a boundary cell. A region cell is simply a cell which is deemed fit, by way of the threshold test, to join a region, the specific region being decided later. In contrast, a boundary cell fails this test and is not considered for membership in any region, but rather is excluded from the region-growing process. Boundary cells are those with a mixture of textures; they should not be confused with
what are sometimes referred to as border cells, which are cells on the edge of a region that abut a cell of a different region (or a boundary cell). The threshold test is a comparison of the ratio of a given cell's pixel intensity standard deviation to the cell's pixel intensity mean with the boundary threshold parameter. Only cells with a ratio at or below the threshold value are allowed to join regions. Lowering the threshold restricts the pool of region member cells to those of more homogeneous texture. Conversely, a higher value allows more cells to join regions.
The region threshold is used to determine what region a cell will join. There is no doubt that the particular cell will join some region; that question was settled with the boundary test. The tests performed now are used to determine if the cell will join one of the neighboring cells in either the W, NW, N, or NE directions; if the cell cannot join an existing region, it will be the first cell in a new region. If the cell's mean pixel intensity differs from the mean pixel intensity of a neighboring region by less than the region threshold value, the cell will be merged with the region that it matches most closely. If none of the neighbors satisfies the bounds set by the threshold value, the cell in question will be used to start a new region. A lower region threshold value demands a closer match (i.e., a smaller difference) between the cell and an existing region. This should make for a greater number of smaller, more homogeneous regions, at least in terms of pixel means. Higher region threshold values on the other hand, result in fewer regions with member cells that vary more widely.
In order to determine which parameters would probably produce the best results, experiments were conducted in which one of the parameters was held constant and the other was varied. Very low boundary threshold values resulted in many cells that were not added to regions. We selected a boundary threshold value at the higher end of those tested (1.6). When the region threshold was very low, region-growing degenerates into a texel-based system. When the region threshold is too high, the region-growing algorithm tries to do the job of the classifier based on only the st. dev./ mean ratio. A region parameter of 3.0 was found to give satisfactory results.
The feature selection experiments described in the first report for texel-based classification were repeated for region-growing-based classification. A larger number of images were evaluated (16 as compared to 2 in the original experiments). In our first set of experiments, we had found that classifications based on the features AIDM and mean were as good as those based on the full set of features. This result did not hold for the larger set of images-when a larger variety of images was considered, the full set of features resulted in the best classification.
3.2 Comparison of Clustering Algorithms
In our initial experiments, we used Autoclass (Cheeseman and Stutz 1996) as the clustering algorithm. We have subsequently also applied the decision-tree based clustering algorithm Cobweb (Fisher et al. 1993) to the data. In general, Cobweb is much slower than Autoclass; Cobweb is also sensitive to the order in which the training data is presented. The advantage of Cobweb is that the results are presented in a hierarchical structure and a single classification can be interpreted at different levels of abstraction. Experiments are currently underway to compare the "goodness" of the results of the two algorithms.

3.3 Scalable Knowledge Discovery
Knowledge discovery from large acoustic images is a computationally intensive task. An approach that has proven successful for parallelizing supervised learning algorithms has been to partition data and distribute it to multiple processors, each running a learning algorithm. Then some sort of voting scheme or tree construction technique is used to combine results of the classifiers in order to predict the class of an instance. Systems built using such an approach have proven to be effective both in reducing computation time and in yielding better classification results. We have developed a technique for using this approach to parallelize unsupervised learning tasks. The process is more complicated for unsupervised learning because one must determine a correspondence between classes learned by the different classifiers and determine how to combine the classes. We have obtained preliminary results from using this approach for knowledge discovery with large acoustic images where the number of instances to be classified is greater than 10,000 and scalable knowledge discovery is a very important issue. A paper describing these results has been accepted at ANNIE '98 (Wooley et al. 1998).
One approach to scaling the knowledge discovery process is to directly parallelize the learning algorithm (AutoClass in this case). An alternative approach, which has received a great deal of attention in the literature recently, partitions the data into subsets, distributes the subsets to different processors, applies a sequential learning algorithm to each subset, and then combines the learned results to yield a single classifier (Chan and Stolfo 1995). This work has generally been motivated by two goals: 1) to reduce execution time, and 2) to improve accuracy (Kittler et al. 1998). The reduction in execution time results from the distribution of the expensive learning step to multiple processors. The improvement in accuracy that is often seen using this approach comes from the fact that each of the classifiers tends to make different types of errors, and the consensus opinion of multiple classifiers is often more accurate than that of a single classifier.
Almost all previous work on combining classifiers has been done with supervised learning algorithms, where the predicted classes from multiple classifiers can be combined based on some sort of voting scheme or by building hierarchical structures to combine predictions (Chan and Stolfo 1995; Kittler et al. 1998). In our domain, we are using an unsupervised learning algorithm because the set of classes cannot be predetermined - the system must be able to recognize significant classes in the imagery that may not have been previously observed. Thus, any algorithm that combines classifiers based on unsupervised learning must first determine a correspondence between classes learned by the different classifiers, and then determine how to combine the results of the different classifiers when classifying a specific instance.
We have developed an approach for adapting Chan and Stolfo's meta-learning techniques (specifically the use of an arbitration rule and arbiter) for use with unsupervised learning. Chan and Stolfo use an arbiter to predict the class of an instance using two base classifiers and an arbiter. As defined by Chan and Stolfo (1995), "an arbiter is learned by some learning algorithm to arbitrate among predictions generated by different base classifiers. This arbiter, together with an arbitration rule, decides a final classification outcome based upon the base predictions." A commonly used arbitration rule is to return the class with the plurality of votes from the base classifiers and the arbiter, with preference given to the arbiter's choice in case of a tie. This straightforward approach cannot be used with unsupervised learning algorithms because the
number and labels of the classes are not fixed. One does not know the "correct" class for the training instances. This means that in order to combine the results of more than one classifier, one must determine the correspondence of classes that have been learned by the different classifiers. In our method, the arbiter combines the sets of classes produced by the base classifiers to produce a single set of classes for the meta-classifier. An arbitration rule is then used to assign instances to these classes based on the prediction of the base classifiers and knowledge of the correspondence of classes learned by the arbiter.
In order to train the meta-classifier, the training data is partitioned into p disjoint training subsets (Di. . Dp) that are distributed to p processors. The learning algorithm runs on each of the processors and is applied to each subset resulting inp classifiers (C/. . Cp). Each classifier identifies a certain number of classes in the data. The jth class identified by classifier Q is referred to as class C/j. In order to determine the correspondence between classes learned by the p classifiers, data from all training sets is pooled and classified by each of the classifiers. A p- dimensional matrix MC for the meta-classifier is constructed that counts the co-occurrences of classifications of instances into classes by the each of the classifiers. Each matrix entry can be thought of as a candidate class for the meta-classifier. If each of the classifiers discovers n classes in its subset of the training data, there are potentially rf non-zero entries (candidate classes) in the matrix. In our application, we have found that the number of non-zero entries is typically much smaller than this and that a large percentage of the instances are classified into a relatively small number of entries in the matrix.
The major problem that must be resolved is how to determine a set of classes for the meta-classifier. One approach is to consider every non-zero entry in MC to be a class (we will call these combination classes.) Unfortunately, this approach can potentially result in a very large number of classes. Another approach is to specify a class threshold, t, based on some attribute of the candidate classes that determines whether or not each should be included as a class in the meta-classifier. We have investigated three different techniques for determining such a threshold:
1. Let the class threshold t represent a minimum fraction of the training instances that must be in the candidate class in order for it to be included in the meta-classifier.
2. In our application, each of the instances represents an irregularly shaped region of adjacent pixels that vary in size. It is possible, using approach 1, that a candidate class with only a few instances, but representing a large number of pixels from an image, could be discarded. The class threshold can be based on the fraction of the total number of pixels in the training data represented by the combined class, rather than the fraction of total instances.
3. If the classifier provides the probability of each classification, use this information to select candidate classes in which instances were predicted with a high probability.
A problem that remains is to determine how to classify instances from the training or test data that do not fall into one of the classes included in the meta-classifier. We considered two alternatives:

1. Create an extra class labeled "other" (c0) and put all instances that do not fall into one of the combined classes into this class.
2. Pool all training instances that do not fall into one of the combined classes to form a training set for another classifier. This classifier will serve as an arbiter.
In the experiments described below, the training set was composed of 23,835 instances (feature vectors) extracted from 12 acoustic images and the test set was composed of 7,239 instances extracted from 4 acoustic images. All training instances were selected from one set of images and all test instances from another set of images in order to allow us to evaluate the results of the classification for both the training and test sets. Since there is no known "correct" class for each of the instances, the classification results from the multicomputer runs were visually compared to those from the single processor run. Results from single processor runs were evaluated based on information provided by geologists at NAVOCEANO.
The algorithm described above was run on 1, 2, 3, 4, and 5 processors. Instances from the training dataset were distributed to the processors. A class threshold of t = 0.01 was used to determine which combined classes to include in the multi-classifier. Instances that did not fall into any of the combined classes were pooled into one other class, c0. If AutoClass is allowed to determine the number of classes in the data, it usually finds in excess of 30 classes. Our domain experts, however, identify a much smaller number of classes in the data. For this reason, we fix the number of classes to be found by each of the classifiers to five. Since the size of MC grows exponentially with the number of processors, a sparse matrix representation has been used for MC. Note that in the results for one processor, this number of classes was fixed prior to the run (although AutoClass sometimes finds fewer than the specified number of classes). As the number of processors increases, the number of candidate classes increases and a larger percentage of the instances from the training data are classified into c0. We experimented with several ways to modify the class threshold fas a function of the number of processors. An approach that seemed to work well was to let t be the original class threshold and tt be the class threshold for/? = /'. The function tt = t*(2/p) worked quite well as a scaling factor for the class threshold.
Figure 2 shows sample classification results for one image for each number of processors using the class thresholds in Table 1. In the classified images, each class is represented by a different gray level. Corresponding classes in images produced by different classifiers may not be mapped to the same gray level. The results with 1, 2, and 3 processors are visually very similar. All of the classifiers identified the major provinces that are of primary interest in our domain, although some of these were subdivided into more than one class as the number of processors was increased.
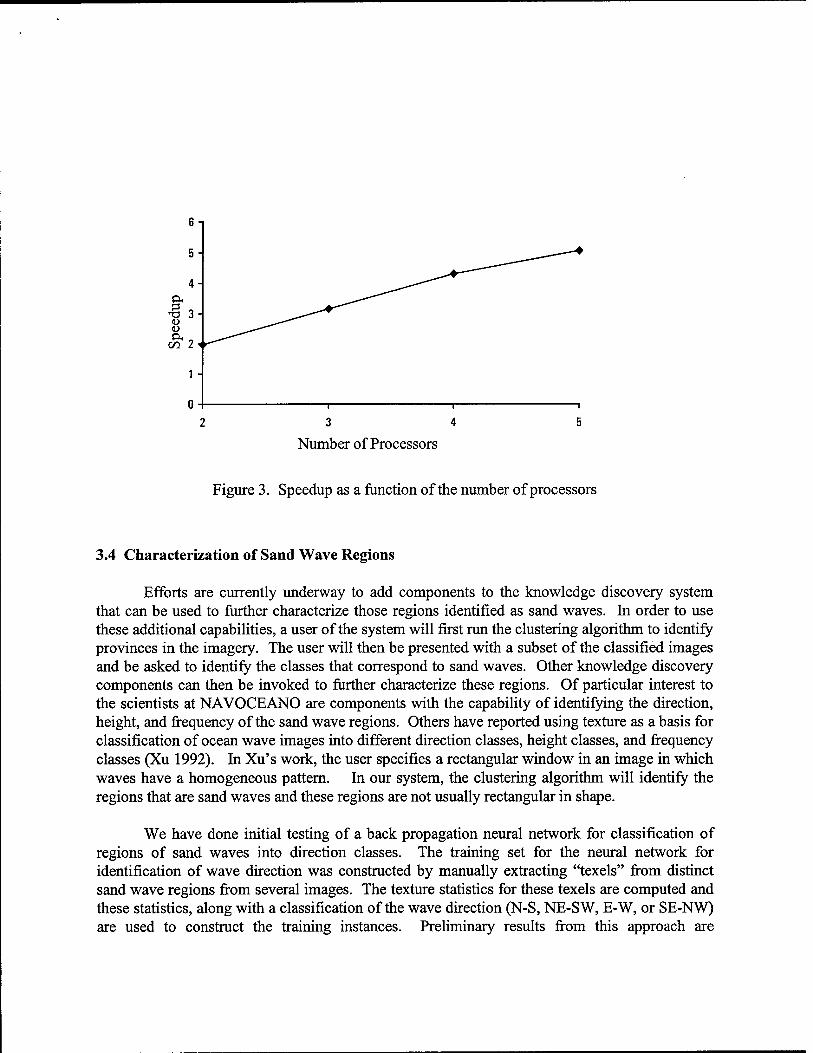
The speedup results that were obtained are shown in Figure 3. Table 2 gives values for execution time, speedup, and efficiency. Efficiency near 1.0 shows that the overhead to parallelize the procedure remained within reasonable bounds and did not drown out the execution time benefits from the parallelization.

We plan further investigations in which we will explore other methods for combining multiple classifiers. The arbiter and combiner tree approaches of Chan and Stolfo (1995; 1996) will be adapted for unsupervised learning. Another avenue that we would like to explore is the use of different learning algorithms to learn the classifiers that are combined. Other investigators have found that the classification results when using different learning algorithms are often superior to that achieved with one algorithm (Kittler et al. 1998).
Number of
Processors
Candidate combined
classes
Classes included in
meta-classifier
Fraction of instances
from training set in c0
1 5 5 0
2 14 8 0.053
3 34 6 0.033
4 52 13 0.034
5 100 10 0.060
Table 2. The number of candidate classes and classes included in the meta-classifier with
different numbers of processors and t = 0.01 scaled by 2/p.

<N II OH
J3
<u
iß 'cO
co d
U
<H-H o co !-H <D
3 Ö
3 <u ;-< <£
OH
tö
T3
°co co cd
U
3- <D T3 3 2 3 OH O co T3
too s a e
-Ö o u O
10 "— 'co
co to .2 Ö O CO
(j_, CO O U O ü 3 O CO »^
'C cd O
s O Ü
<
l-l 3

j3
a B
• T—I
co
U
OH
J=!
£ id tu
3 a c o
T3 o <N
<u CO 1-H OT 3 ca M u PH
bo eö B
e
■a o
3 4
Number of Processors
Figure 3. Speedup as a function of the number of processors
3.4 Characterization of Sand Wave Regions
Efforts are currently underway to add components to the knowledge discovery system that can be used to further characterize those regions identified as sand waves. In order to use these additional capabilities, a user of the system will first run the clustering algorithm to identify provinces in the imagery. The user will then be presented with a subset of the classified images and be asked to identify the classes that correspond to sand waves. Other knowledge discovery components can then be invoked to further characterize these regions. Of particular interest to the scientists at NAVOCEANO are components with the capability of identifying the direction, height, and frequency of the sand wave regions. Others have reported using texture as a basis for classification of ocean wave images into different direction classes, height classes, and frequency classes (Xu 1992). In Xu's work, the user specifies a rectangular window in an image in which waves have a homogeneous pattern. In our system, the clustering algorithm will identify the regions that are sand waves and these regions are not usually rectangular in shape.
We have done initial testing of a back propagation neural network for classification of regions of sand waves into direction classes. The training set for the neural network for identification of wave direction was constructed by manually extracting "texels" from distinct sand wave regions from several images. The texture statistics for these texels are computed and these statistics, along with a classification of the wave direction (N-S, NE-SW, E-W, or SE-NW) are used to construct the training instances. Preliminary results from this approach are

encouraging. Further development of these capabilities will be a focus of our work in the third year of the project.
4. Summary
In the second year of this project, we have extended and refined our first year's work in using texture to identify regions of interest in acoustic imagery. These efforts include experiments to parameterize the region-growing algorithm in order to make it applicable to a wider variety of images and further experiments on feature selection. Two student conference papers based on this work were presented (Karpovich 1998; Wooley and Smith 1998). In addition, a journal paper describing the work is under revision (Bridges et al. 1998). We have also compared clustering results based on a Bayesian classifier (Autoclass) and a decision-tree clustering algorithm (Cobweb). The computational requirements of the algorithms used in our knowledge discovery work and the size of the data sets involved has prompted us to investigate methods for parallelizing the knowledge discovery process. A paper describing our initial work in this area has been accepted for presentation at ANNIE '98 (Wooley, et al 1998). We have applied for and been awarded a Hearin grant from the College of Engineering at Mississippi State to help support further work in this area. NAVOCEANO has determined that our work on identification of sand waves is mature enough that it can be incorporated into some of their image analysis software. They have awarded us a $99,000 grant for the next year to integrate our knowledge discovery software with their system. The focus of our last year of work on the DEPSCoR project will be to extend the database currently in use at NAVOCEANO to accommodate metadata and discovered knowledge, to extend the knowledge discovery capabilities of the system to be able to further characterize regions of interest, and to continue our work in scalable knowledge discovery.
References
Bridges, Susan, Julia Hodges, Bruce Wooley, Donald Karpovich, and George Brannon Smith. 1998. Knowledge discovery in an oceanographic database. Under revision for Applied Intelligence.
Chan, Philip K., and Salvatore J. Stolfo. 1995. Learning arbiter and combiner trees from partitioned data for scaling machine learning. In Proceedings of the First International Conference on Knowledge Discovery and Data Mining. Edited by Usama Fayyad and Ramasamy Uthurusamy. Menlo Park, CA: AAAI Press. 39-44.
Chan, Philip K, and Salvatore J. Stolfo. 1996. Scalable exploratory data mining of distributed geoscientific data. In Proceedings of the Second International Conference on Knowledge Discovery and Data Mining. Edited by Evangelos Simoudis, Jiawei Han and Usama Fayyad. Menlo Park, CA: AAAI Press. 2-7.

Cheeseman, Peter, and John Stutz. 1996. Bayesian classification (AutoClass): Theory and results. Advances in knowledge discovery and data mining. Edited by Usama M. Fayyad, Gregory Piatetsky-Shapiro, Padhraic Smyth, and Ramasamy Uthurusamy. Menlo Park, CA: AAAI Press. 158-180.
Fayyad, Usama M., Gregory Piatetsky-Shapiro, and Padhraic Smyth. 1996. From data mining to knowledge discovery: An overview. Advances in knowledge discovery and data mining. Edited by Usama M. Fayyad, Gregory Piatetsky-Shapiro, Padhraic Smyth, and Ramasamy Uthurusamy. Menlo Park, CA: AAAI Press. 1-36.
Fisher, Doug, Lin Xu, James R. Carnes, Yoran Reich, Steven J. Fenves, Jason Chen, Richard Shiavi, Gautam Biswas, and Jerry Weinberg. 1993. Applying AI clustering to engineering tasks. IEEE Expert 8(6): 51-60.
Hodges, Julia, Susan Bridges, Bruce Wooley, Donald Karpovich, and Brannon Smith. 1997. Knowledge Discovery in an Object-Oriented Oceanographic Database System. October 21, 1997. Mississippi State University Technical Report #971021.
Karpovich, Donald. 1998. Choosing the optimal features and texel sizes in image categorization. In Proceedings of the 36th ACM Southeast Conference held in Marietta, GA, April 1-3, 1998. 104-107
Kittler, Josef, Mohamad Hatef, Robert P.W. Duin, and Jiri Matas. 1998. On combining classifiers. IEEE Transactions on Pattern Analysis and Machine Intelligence. 20(3). 226- 239.
Reed, Thomas Beckett TV, and Donald Hussong. 1989. Digital image processing techniques for enhancement and classification of SeaMARC II side scan sonar imagery. Journal of Geophysical Research 94(B6): 7469-90.
Wooley, Bruce, Yoginder Dandass, Susan Bridges, Julia Hodges, and Anthony Skjellum. 1998. Scalable knowledge discovery from oceanographic data. To appear in Proceedings of the Artificial Neural Networks in Engineering Conference (ANNIE '98), St. Louis, MO, November 1998.
Wooley, Bruce and George Brannon Smith. 1998. Region-growing techniques based on texture for provincing the ocean floor. In Proceedings of the 36th ACM Southeast Conference held in Marietta, GA, April 1-3, 1998. 99-103.
Xu, Jian-hua. 1992. Texture analysis approaches to extract ocean wavelengths, directions, and heights from ocean wave images. Optical Engineering 31(8): 1705-1714.