knowledge-based study of protein structure-function ... · pdf file0.35 0.4 0.45 0.5 0 0.04...
TRANSCRIPT
KnowledgeKnowledge--Based Study of Protein Based Study of Protein StructureStructure--Function Correlations Function Correlations using Computational Geometry using Computational Geometry
Iosif Vaisman, George Mason University
email: [email protected]: proteins.gmu.edu
BIBM-2009 Tutorial
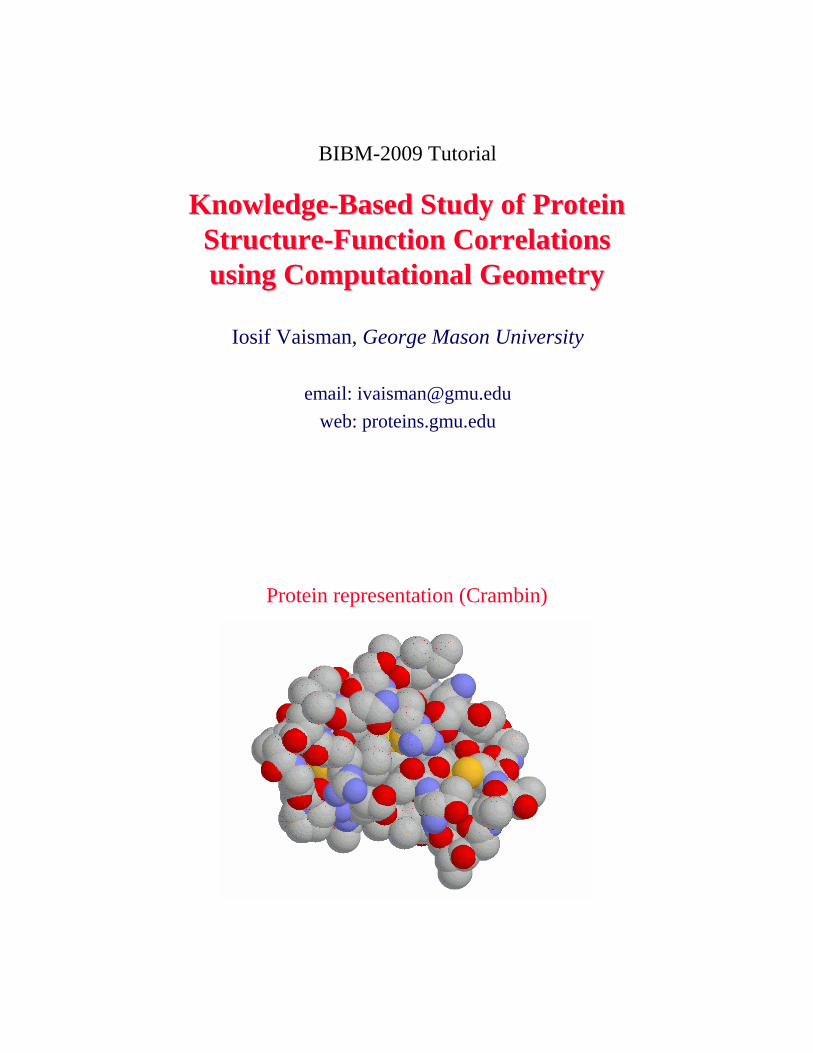
Protein representation (Crambin)
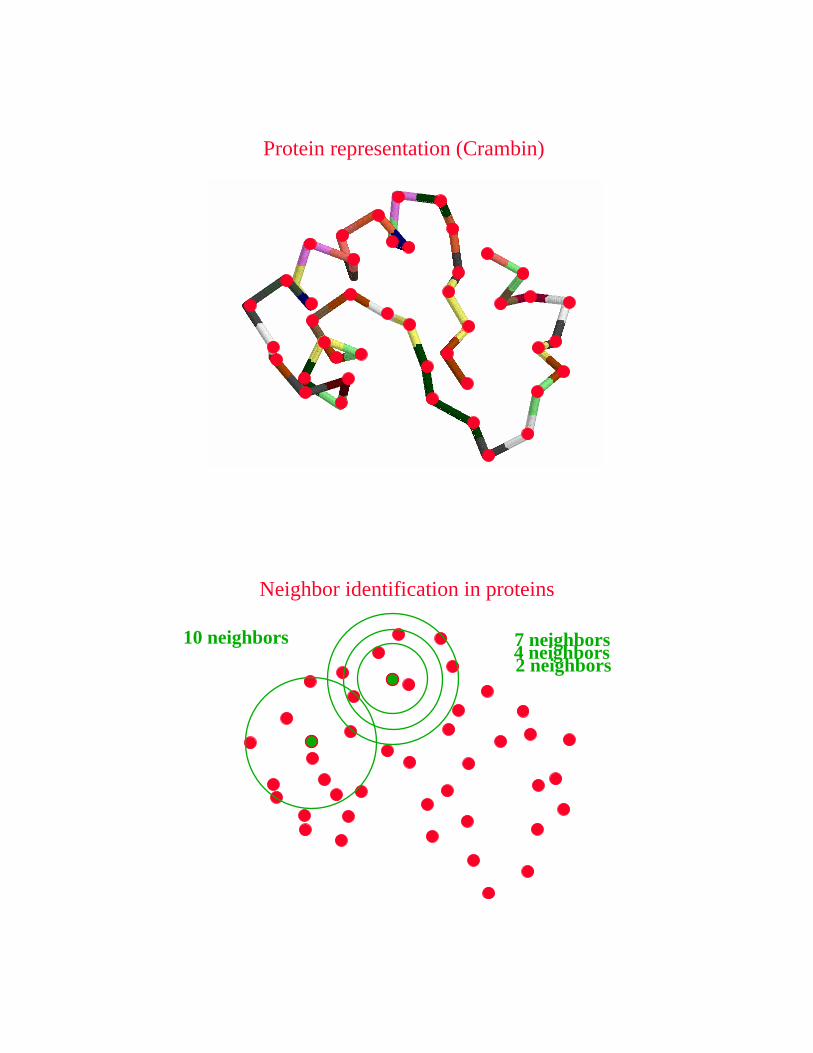
Protein representation (Crambin)
4 neighbors7 neighbors2 neighbors
10 neighbors
Neighbor identification in proteins
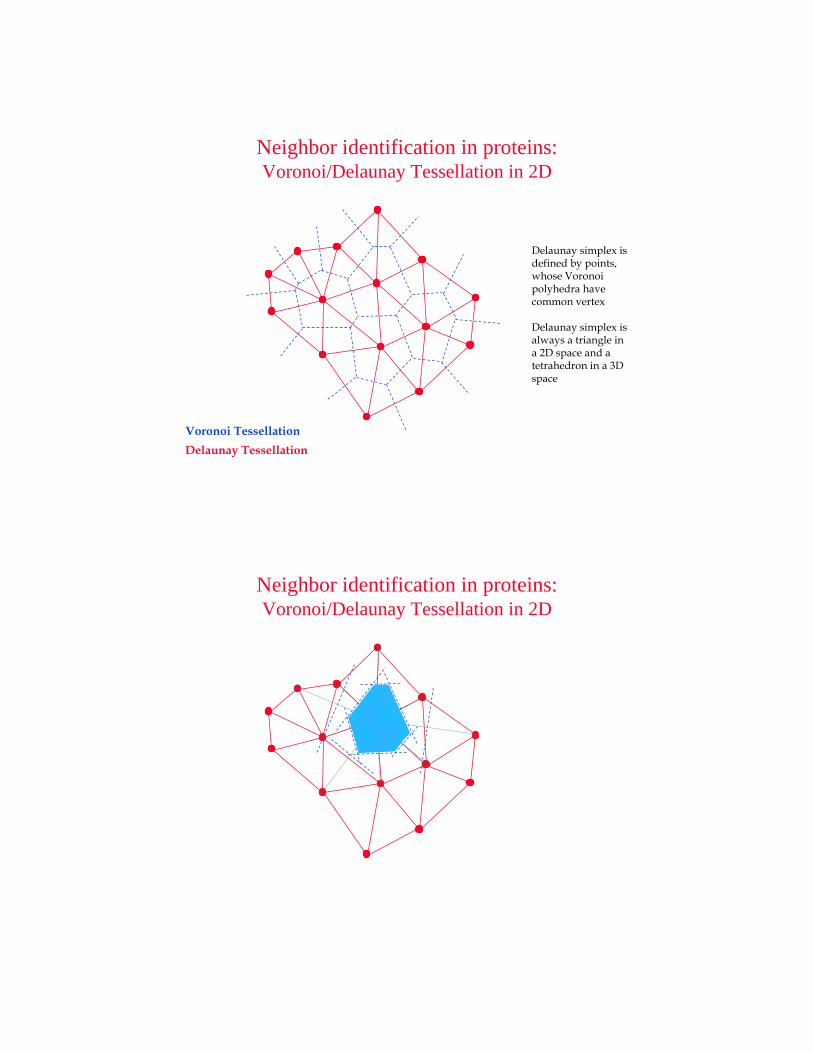
Voronoi Tessellation
Delaunay simplex isdefined by points,whose Voronoi polyhedra have common vertex
Delaunay simplex isalways a triangle ina 2D space and a tetrahedron in a 3Dspace
Delaunay Tessellation
Neighbor identification in proteins:Voronoi/Delaunay Tessellation in 2D
Neighbor identification in proteins:Voronoi/Delaunay Tessellation in 2D

Voronoi Tessellation Delaunay Tessellation
Neighbor identification in proteins:Voronoi/Delaunay Tessellation in 2D
67
6
Voronoi tessellation of Che Y protein
Adopted from Angelov et al., Proteins, 2002, 49(4):446
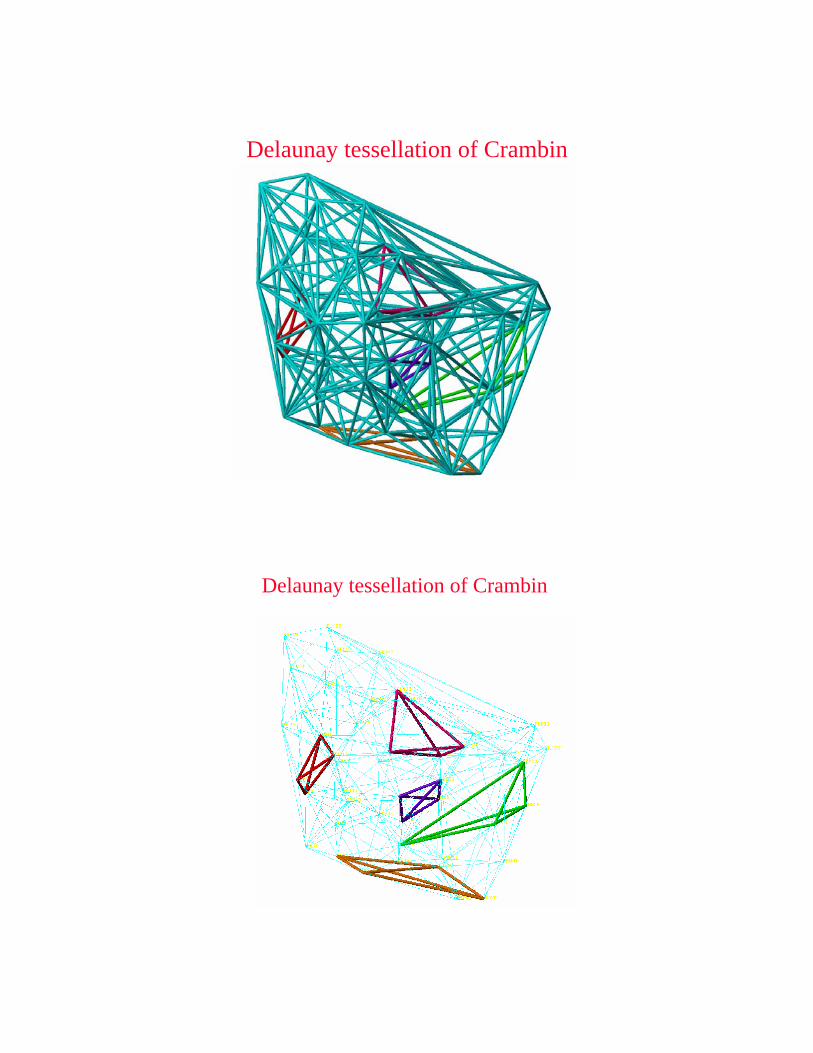
Delaunay tessellation of Crambin
Delaunay tessellation of Crambin

Dealunay simplices classification
d ij
d jk
dkl
j k
i
l
ii+1i+2
i+3j
ii+2 i+1
j+1
j
ii+1
k
j
ii+1l
k
j
i
{1-1-1-1} {2-1-1} {2-2} {3-1} {4}
Classification of Delaunay simplicesby sequential proximity

{4}(11,12,13,14)
{2,2}(3,4,32,33)
{2,1,1}(6,7,42,45)
{3,1}(38,39,40,46)
{1,1,1,1}(2,23,27,34)
Types of Delaunay simplices in Crambin
l
( ) /l l lii j
j>∑ − 2 215T =
Tetrahedrality of Delaunay simplices

Tetrahedrality distribution of Delaunay simplices
00.05
0.10.15
0.20.25
0.30.35
0.40.45
0.5
0 0.04 0.08 0.12 0.16 0.2 0.24 0.28 0.32 0.36 0.4
Tetrahedrality
Freq
uenc
y Class {1,1,1,1}Class {2,1,1}Class {2,2}Class {3,1}Class {4}
Correlations between protein structure family assignment and relative content of classes of
Delaunay simplices
0
0.1
0.2
0.3
0.4
0.5
10 20 30 40 50 60 70 80 90 100
Proteins
−α −α/β −β

Compositional propensities of Delaunay simplices
qijkl = logfijkl
pijkl
C =4!
i
n
Π (ti!)
f- observed quadruplet frequency,
pijkl = Caiajakal, a - residue frequency
il
k
j
AAAA: C = 4! / 4! = 1
AAAV: C = 4! / (3! x 1!) = 4
AAVV: C = 4! / (2! x 2!) = 6AAVR: C = 4! / (2! x 1! x 1!) = 12
AVRS: C = 4! / (1! x 1! x 1! x 1!) ) = 24
Counting Quadruplets• assuming order independence among residues comprising
Delaunay simplices, the maximum number of all possible combinations of quadruplets forming such simplices is 8855
D F E C
C C D E
C C D D
C C C D
C C C C
204
⎛ ⎞⎜ ⎟⎝ ⎠
1920
2⎛ ⎞
⋅ ⎜ ⎟⎝ ⎠
202
⎛ ⎞⎜ ⎟⎝ ⎠
20 19⋅
20
4845
3420
190
380
20
8855
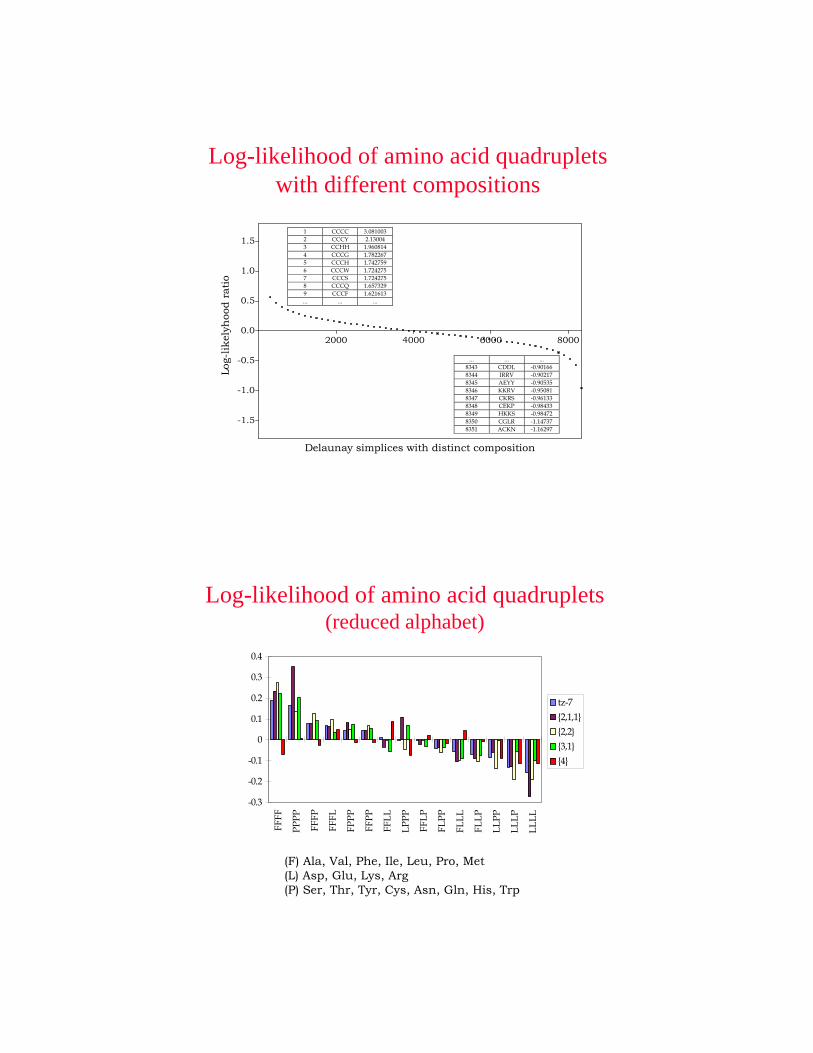
Delaunay simplices with distinct composition
Log-
likel
yhoo
d ra
tio
2000 4000 6000 8000
-1.5
-1.0
-0.5
0.0
0.5
1.0
1.51 CCCC 3.0810032 CCCY 2.130043 CCHH 1.9608144 CCCG 1.7822675 CCCH 1.7427596 CCCW 1.7242757 CCCS 1.7242758 CCCQ 1.6573299 CCCF 1.621613... ... ...
... ... ...8343 CDDL -0.901668344 IRRV -0.902178345 AEYY -0.905358346 KKRV -0.950818347 CKRS -0.961338348 CEKP -0.984338349 HKKS -0.984728350 CGLR -1.147378351 ACKN -1.16297
Log-likelihood of amino acid quadruplets with different compositions
-0.3
-0.2
-0.1
0
0.1
0.2
0.3
0.4
FFFF
PPPP
FFFP
FFFL
FPPP
FFPP
FFLL
LPPP
FFLP
FLPP
FLLL
FLLP
LLPP
LLLP
LLLL
tz-7{2,1,1}{2,2}{3,1}{4}
(F) Ala, Val, Phe, Ile, Leu, Pro, Met(L) Asp, Glu, Lys, Arg(P) Ser, Thr, Tyr, Cys, Asn, Gln, His, Trp
Log-likelihood of amino acid quadruplets(reduced alphabet)

Log-likelihood of amino acid quadruplets
Log-likelihood of amino acid quadruplets
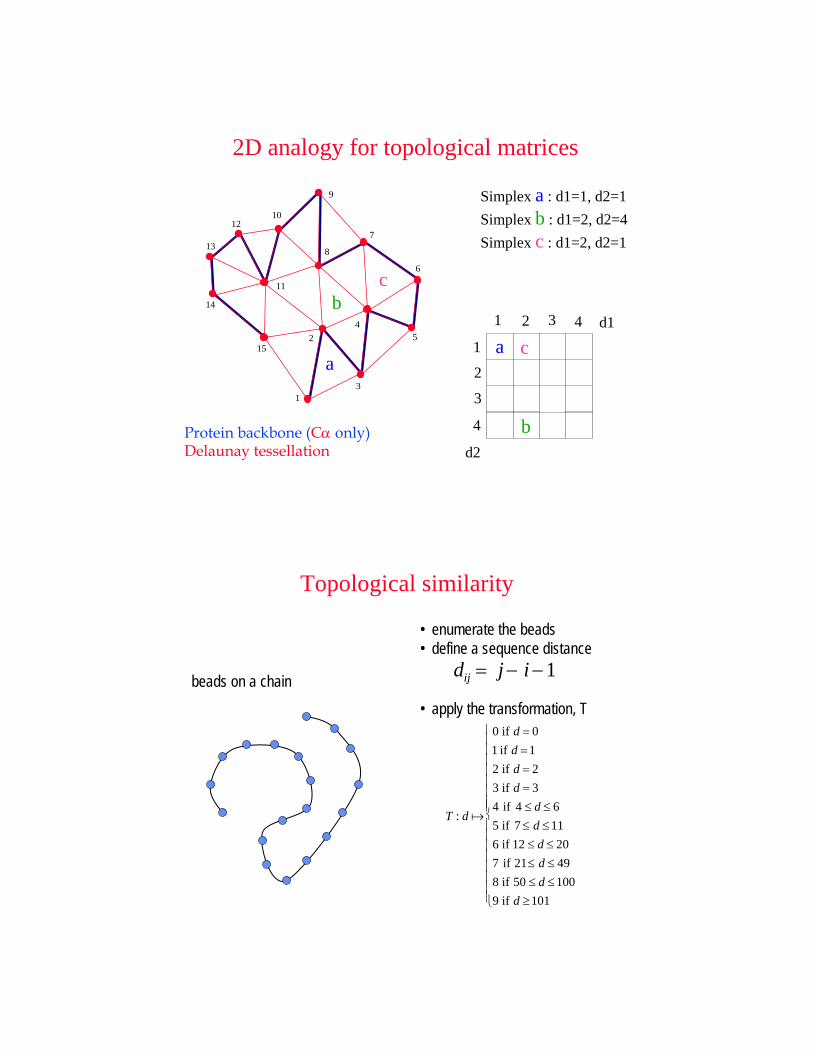
Protein backbone (Cα only)Delaunay tessellation
3
45
6
7
10
14
152
9
8
12
13
1
11
Simplex a : d1=1, d2=1Simplex b : d1=2, d2=4Simplex c : d1=2, d2=1
a
bc
a
b
cd1
d2
1 2 3 4
1
2
3
4
2D analogy for topological matrices
beads on a chain
• enumerate the beads• define a sequence distance
dij = j − i −1
• apply the transformation, T
T : d a
0 if d = 01 if d =12 if d = 23 if d = 34 if 4 ≤ d ≤ 65 if 7 ≤ d ≤116 if 12 ≤ d ≤ 207 if 21≤ d ≤ 498 if 50 ≤ d ≤1009 if d ≥101
⎧
⎨
⎪ ⎪ ⎪ ⎪ ⎪ ⎪ ⎪ ⎪
⎩
⎪ ⎪ ⎪ ⎪ ⎪ ⎪ ⎪ ⎪
Topological similarity

djk=0
dkl=2
dlm= 35
j
k=j+1
l=j+4
m=j+40
T:djk→0T:dkl→2T:dlm→7
map the protein onto a 3-D array, M,where the elements, Mnpr are thenumber of simplices whose edgessatisfy:
(a) The euclidean length of any one simplex edge is less than 10 Å(partial tessellation).
(b) djk=n(c) dkl=p(d) dlm=r
Topological similarity
create a 1000-tuple vector from the the elements, Mnpr
M = {M000, M001, …, M010, M011, …, …, M999}
compare the topology by computing the supremum norm (supnorm)between two proteins’ 1000-tuple vectors:
supnorm(M,M’) = Σ ⎪Mi - Mi’ ⎪
Topological similarity

Ns = Mii= 0
999
∑inherent length dependence:
power law trend:~Cx1/2
average correlationcoefficient
0.99
Topological similarity
geometry changes with local structure.topology does not.
Topological similarity

removing intrinsic score length dependence:
it’s simple … normalize the vectors before comparing proteins.
ˆ M =v M v M
Score = ˆ M i − ˆ ′ M ii
∑
Topological similarity
all-to-all comparison from WHATIF set of non-redundant proteins:
1424 chains with R-factor < 0.25, resolution < 2.5, Sequence ID < 30%
Topological similarity

insensitivity to secondary structure content
Correlation coefficient:0.89
Topological similarity
example from FSSP: 2 proteins close in RMSD but far in topology
1thg_
Topological similarity

1alv A 1thg _
topological score: 4.77RMSD: 3.0 Angstroms
Topological similarity
example from FSSP: 2 proteins close in topology but far in RMSD
1qlg A
Topological similarity

1qlg A 2bbk H
topological score: 4.17RMSD: 4.2 Angstroms
Topological similarity
example from CATH: a protein classified as α-β by topological comparisonbut as “zero” by CATH.
each structure has 8 secondary structure elements
1hip _ 1gua B
CATH: neither alpha nor beta Neighbor by topology … however,CATH: alpha-beta
Topological similarity
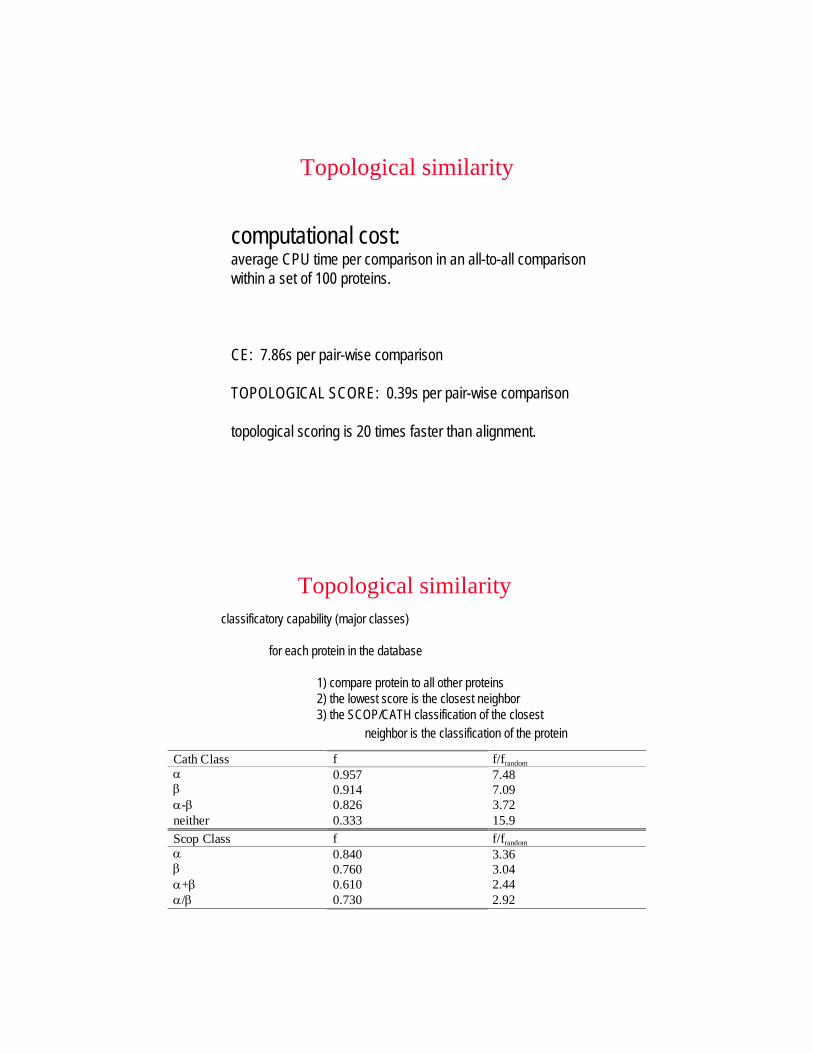
computational cost:average CPU time per comparison in an all-to-all comparisonwithin a set of 100 proteins.
CE: 7.86s per pair-wise comparison
TOPOLOGICAL SCORE: 0.39s per pair-wise comparison
topological scoring is 20 times faster than alignment.
Topological similarity
Cath Class f f/frandomα 0.957 7.48β 0.914 7.09α-β 0.826 3.72neither 0.333 15.9Scop Class f f/frandomα 0.840 3.36β 0.760 3.04α+β 0.610 2.44α/β 0.730 2.92
classificatory capability (major classes)
for each protein in the database
1) compare protein to all other proteins2) the lowest score is the closest neighbor3) the SCOP/CATH classification of the closest
neighbor is the classification of the protein
Topological similarity
rmsd
0 1 2 3 4 5
TOPO
LOG
ICA
L SI
MIL
ARIT
Y SC
OR
E
0
300
600
900
1200
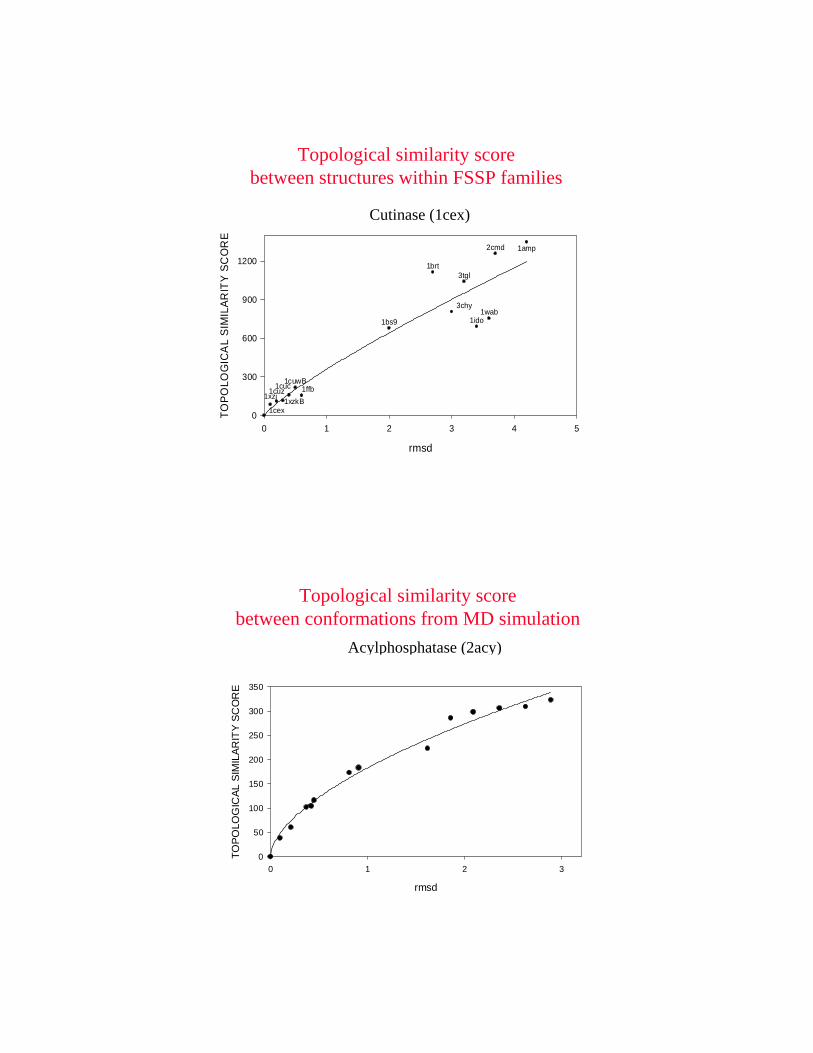
1cex
1cuc1cuwB1cuz 1ffb
1xzj1xzkB
1bs9
1brt
3chy
3tgl
1ido1wab
2cmd 1amp
Cutinase (1cex)
Topological similarity score between structures within FSSP families
Topological similarity score between conformations from MD simulation
Acylphosphatase (2acy)
rmsd
0 1 2 3
TOPO
LOG
ICAL
SIM
ILAR
ITY
SCO
RE
0
50
100
150
200
250
300
350

Protein backbone (Cα only)Delaunay tessellation
3
3 3
3
222
22
2
3 333
11 1
a
b
Residues a and bparticipate in 3 simplices of class 3each, i.e. they belong to a helix.
In 3D the assignmentto a helix requires 4 simplices of class 4
2D analogy for topological secondary structure assignment
0 50 100 150 200 250
1cex
01234
0 50 100 150 200 250
1arb
01234
0 50 100 150 200 250
1akz
01234
0 50 100 150 200 250
1ah7
01234
DSSP
DSSP
DSSP
DSSP
Topological profiles and DSSP assignment of helices

Secondary structure assignment
−100 0 100
−10
00
100
DSSP
−100 0 100
−10
00
100
C4.5
−100 0 100
−10
00
100
t4_motif
−100 0 100
−10
00
100
DEFINE
−100 0 100
−10
00
100
P−SEA
−100 0 100
−10
00
100
secstr
−100 0 100
−10
00
100
STRIDE
−100 0 100
−10
00
100
XTLsstr
Residue number
t4 v
alue
t4 profile and DSSP helix call for 2mnr
Residue and mutant score
q1q6
q5
q4
q3
q2 qres= Σqi
Qmut= Σ(qres – qres)wt mut

Residue Environment Scores
• assuming order independence among residues comprising Delaunay simplices, the maximum number of all possible combinations of quadruplets forming such simplices is 8855
• log-likelihood:– = frequency of quadruplets containing residues i,j,k,l in a
representative training set of high-resolution protein structures with low primary sequence identity
– = frequency of random occurrence of the quadruplet• total statistical potential (aka topological score or sequence-structure
compatibility score) of protein: sum the log-likelihoods of all quadruplets forming the Delaunay simplices of the protein tessellation
• individual residue potentials (aka residue environment scores): sum the log-likelihoods of only those quadruplets in which the given residue participates as one of the four vertices– yields a 3D-1D potential profile
( )logijkl ijkl ijklq f p=
ijklf
ijklp
DNA binding residues in HMG1
Residue number10 20 30 40 50 60 70
Scor
e
0
KPRGKMSSYAFFVQTCREEHKKKHPDASVNFSEFSKKCSERWKTMSAKEKGKFEDMAKADKARYEREMKTY
Coordinate file 1ckt: Ohndorf U-M et al. Nature 399:708
F37A

Protein-protein and protein-DNA interfaces (HMG-D)
Residue number0 10 20 30 40 50 60 70
Sco
re
Coordinate file 1qrv: Murphy F V et al. EMBO Journal 18:6610
A
A`
B`
A-A`
A`-B`
Computational mutagenesis of T4 lysozymeReversibility of mutations
R2 = 0.9886
-3
-2
-1
0
1
2
3
4
-4 -3 -2 -1 0 1 2 3
Protein Mutation Score change
1l63 T26E -2.49180l E26T 2.01
1l63 A82S 1.49123l S82A -1.49
1l63 V87M -0.281cu3 M87V 0.22
1l63 A93C -1.98138l C93A 1.78
1l63 T152S -1.081goj S152T 1.12

Reversibility of mutations
Reverse Mutation Potential Difference Score
-15 -10 -5 0 5 10 15
Forw
ard
Mut
atio
n P
oten
tial D
iffer
ence
Sco
re
-15
-10
-5
0
5
10
15
HH (22)PH (33)HP (40)PP (112)