klára katona – lászló Árva – andrás schlett stages of...
TRANSCRIPT

Klára Katona – László Árva – András Schlett
STAGES OF GLOBALISATION


KLÁRA KATONA LÁSZLÓ ÁRVA ANDRÁS SCHLETT
Stages of GlobalisationAlternative Ways from Eastern Europe
and the Far East
Kalligram 2013

Copyright © Klára Katona, László Árva, Péter Csillik, András Schlett 2013ISBN 978-80-8101-778-0

Contents
I. INTRODUCTION: WHAT IS GLOBALISATION? Different Theories on Globalisation and the Relation between the Financial System and the Real Economy (Péter Csillik) . . . . . . . . . . . . . . . . . . . . . . . . . . . . . . . . . 9
II. SEQUENCES OF GLOBALISATION THE PROBLEM OF MEASUREMENT . . . . . . . . . . . . . . . . . . . . . . . . . . . . 21
III. CHARACTERISTICS OF TIDES AND EBBS OF GLOBALISATION . . . . . . . . . . . . . . . . . . . . . . . . . . . . . . . . 26
1. First tide of globalisation: the great discoveries (15-16th century) 26
1.1. Economic thought at the timeof the first wave of globalisation . . . . . . . . . . . . . . . . . . . . . . . . . . . . . . . 26
1.2. Background and motivation of the First globalisation . . . . . . 331.3. The scope and structure of the first globalisation . . . . . . . . . . . . 371.4. Effects of the first wave of globalisation
with special attention to Eastern Europe . . . . . . . . . . . . . . . . . . . . . 381.5. First ebb of globalisation (17-18th century) . . . . . . . . . . . . . . . . . . . 38
2. The second tide of globalisation (1820-1914) . . . . . . . . . . . . . . . . . . . . . . . . 39
2.1. Economic theories at the timeof the second globalisation Adam Smithand the theory of the “invisible hand” . . . . . . . . . . . . . . . . . . . . . . . . 39
2.2. Background and motivation of the second tide of globalisation . . . . . . . . . . . . . . . . . . . . . . . . . . . . . 55
2.3. Scope and structure of the second wave of globalization . . . 582.4. Effects of the second tide of globalization
on different countries . . . . . . . . . . . . . . . . . . . . . . . . . . . . . . . . . . . . . . . . . . . . 652.5. Ebb of the second globalization (1914-1975) . . . . . . . . . . . . . . . . . . 67
3. Years of transition and transformation between 1945-75 . . . . . . . . . . 76
3.1. Globalising efforts of the developed countriesafter World War II: the opening towards free economy . . . . 77

3.2. Independence of the former colonies: self-relianceand import substitution . . . . . . . . . . . . . . . . . . . . . . . . . . . . . . . . . . . . . . . . 83
3.3. Outside of the globalisation: the Socialist countries . . . . . . . . . . . . . . . . . . . . . . . . . . . . . . . . . . . . . . . . . . 88
4. Third tide of globalisation (1975-2008) . . . . . . . . . . . . . . . . . . . . . . . . . . . . . . 89
4.1. The theoretical background of the third GlobalizationMonetarist counter-revolution of Milton Friedmanand the Chicago School . . . . . . . . . . . . . . . . . . . . . . . . . . . . . . . . . . . . . . . . 90
4.2. Background and motivations . . . . . . . . . . . . . . . . . . . . . . . . . . . . . . . . . . 944.3. Scope and structure of the third wave of globalisation . . . . . 984.4. Effects of the Third globalisation on the Host Countries . . 1064.5. The regression of the third globalisation . . . . . . . . . . . . . . . . . . . . . 113
IV. THE EMERGING ECONOMIES CLOSING UP STRATEGIES AT THE TURN OF THE MILLENNIUM . . . . . . . . . . . . . . . . . . . . . . . 127
1. Globalisation in Central and Eastern Europe: The third wave of globalisation is CEE . . . . . . . . . . . . . . . . . . . . . . . . . . . . . 128
1.1. Background and motivations . . . . . . . . . . . . . . . . . . . . . . . . . . . . . . . . . 1311.2. Scope and structure of the third wave of globalisation . . . . 1491.3. Effects of the third wave of globalisation in CEE . . . . . . . . . . . 156
2. Third wave of globalisation in Hungary . . . . . . . . . . . . . . . . . . . . . . . . . . . . 162
2.1. Background and motivations . . . . . . . . . . . . . . . . . . . . . . . . . . . . . . . . . 1652.2. Scope and structure of the third wave of globalisation
in Hungary . . . . . . . . . . . . . . . . . . . . . . . . . . . . . . . . . . . . . . . . . . . . . . . . . . . . . 1812.3. Effects of the third wave of globalisation in Hungary . . . . . 1942.4. Third ebb of globalisation in CEE and in Hungary . . . . . . . . 205
3. Globalisation in Asia with special focus on China . . . . . . . . . . . . . . . 213
3.1. Background and motivation . . . . . . . . . . . . . . . . . . . . . . . . . . . . . . . . . . 2133.2. Scope and structure
of the third wave of globalisation in China . . . . . . . . . . . . . . . . . 2233.3. Effects of the third wave of globalisation . . . . . . . . . . . . . . . . . . . . 2253.4. China steers globalization – during low tide . . . . . . . . . . . . . . . 232
4. Third waves of globalization in the Far East . . . . . . . . . . . . . . . . . . . . . . . 238

4.1. Background and motivation . . . . . . . . . . . . . . . . . . . . . .. . . . . . . . . . . 2384.2. Scope and structure
of the third wave of globalization . . . . . . . . . . . . . . . . . . . . . . . . . . 2514.3. Effects of the third wave of globalisation . . . . . . . . . . . . . . . . . . 256
V. CONCLUSIONS . . . . . . . . . . . . . . . . . . . . . . . . . . . . . . . . . . . . . . . . . . . . . . . . . . . . 262


I. Introduction: What is Globalisation?
Defining globalisation is not easy, though it seems to be a simple notion widely used in the past decades. Although this wide usage is the very reason for the difficulty of defining this notion, as different authors have applied the term of globalisation to very different phenomena. Some authors concentrate uniquely on economic aspects of globali-sation, and under globalisation they mean increasing economic and financial integration of different parts of the world, but others rather focus on cultural aspects and under globalisation they mean cultural homogenisation of different people. Some others maintain that best examples of globalisation are political integrations.
Instead of giving new definitions for globalisation, in our book our starting point is Marshall McLuhan’s concept of Global Village. In this respect for us Globalisation is the global interdependence of different actors of World economy – of governments, of companies, and of natu-ral persons as well. Globalisation is understood here as a mainly eco-nomic phenomenon, having at the same time very important political and social consequences as well.
DIFFERENT THEORIES ON GLOBALISATION AND THE RELATION BETWEEN THE FINANCIAL SYSTEM AND THE REAL ECONOMY
Globalisation presumes that different parts of the world are somehow alike. The world is a set of communities structured by power. Almost 100 years ago Max Weber has invented an approach which is still used today- with the words of his American follower Talcot Parsons - We-ber divided communities into three sub-systems: economy, society and politics.

10
The components of power: wealth, prestige, power
Sub-system What does it do?
Who does it? (typical groups of society)
What is its motivation? (success indicators)
Economy Produces goods Classes Wealth
Society Consumes goods Stände Prestige
Politics
Regulates the produc-tion and the consumption
Parties Power
Source: M. Weber: The distribution of power within the communities: Classes, Stande, Parties. (1920)
Power is a three-dimensional term, the key of economic power is wealth, the key of social power is prestige, and the key of political power is power. The three most important traits of the sub-systems of the communities are 1, what they do 2, who they are 3, what their motivations are. In economics people are divided into groups by their wealth (owners of properties vs. not owners), these separated groups are called classes, they produce the goods and their success indicator is the size of their fortune or the wealth increase, that is the profit. In society the consumption follows norms. The right way of consumption brings prestige to the consumer.
The typical groups are called stände. Politics regulates the production and the consumption as well. Their typical groups are the parties; these groups are in a race for power. The term “political market” was con-structed by László Csontos (Hungarian economist): two participants are in the demand-side (citizens and lobbyists) and two participants are in the supply-side (bureaucrats and politicians). The citizens claim public goods and they give their votes in exchange. The lobbies claim favourable regulation for them and they finance the campaigns in ex-change. Politicians create coherent preferences and they claim votes in exchange, the bureaucrats control the public goods for good salaries and bonuses.

11
The primary problem of the communities is the efficient distribution of the resources.
Basically three methods have been formulated in the past:1st method: When the basic aim is to strengthen social relations,
then the economy does not appear as an independent sub-system. Károly Polányi’s (Hungarian sociologist) economic anthropological study about ancient societies upholds, that the main target of the dis-tribution of goods is to strengthen kinship relations. An ancient per-son did not care for palms in his own territory but in his cousin’s while another member of the family cared for his palms. After a hunt, the hunter gets a piece of his own prey not on the first place but on an umpteen place. This is the integrator system of reciprocity. Instead of rational acts traditional ones control the system.
2nd method: Political will (king, dictator, planning office) distrib-utes the resources. This system operated for over a thousand year. It does not favour growth: it deprives goods and redistributes them, its aims are not rational and its aims are not questionable because the autocrat defines them personally. The correlation between the partici-pants’ effect and their reward is quite low. The system does not urge the participants to spare or to invest. The distributor might deprive the goods or redistribute the lands.
3rd method: This method is frequently referred as the efficient one. An economic institution, the Market distributes the economic re-sources. The Market is able to distribute the resources efficiently by the financial intermediary system. According to Robert C. Merton the financial market has six duties, it a) supports trade and exchange by transactions, b) collects the resources c) rearranges the resources in space and time between the sectors, d) supplies information about the prices e) manages risk, f) incites at dissymmetrical information situ-ations.
Ad a) Textbooks frequently display the role of money by the para-digm of the ‘naked farmer’: The naked farmer goes into the town to find a hungry tailor who suits clothes to him in exchange of chickens. The farmer loses a big amount of money while seeking; he is not only encumbered by the expense of the care for the chickens. If the farmer would sell his chickens to somebody for money, then he could go to the fair to buy some clothes. According to institutional economic-science the expense of production, the transfer of the goods is almost equal
12
to the transactional expense of seeking, decision making and moni-toring. The transactional expense would be even higher without the existence of money.
Ad b) Collecting the resources means that the distributor sends the savings (the part of the income-consumption which was not spent) to the consumers who claim to use them. In this case, distribution is very much different from the stock market, which sells stocks, the bank, which transforms deposits to credits or the selling of government bonds, which finances the government’s overspending.
Ad c) Because of the financial system, it is possible that the resources might move from their original place. If everything would stay at its original place, you could not talk about growth but stagnancy, as Jo-seph Schumpeter (Austrian-American economist) has shown.
Ad d) It would be impossible to make right business choices about the place of investment without price information, necessarily busi-nessmen need to calculate the risk and the output as well.
Ad e) Risk management is a multi-stage process. First, you must identify the risk, which is a kind of counting quandary. Than you must analyse its gross, you must decide how you approach that kind of risk. You can repulse it, you can keep it, you can control it, and you can transpose it. In case you transpose it, then you can exclude the price change, or by paying insurance, you can avoid the greater problems while you still collect profit. Or by diversification you reduce the sin-gular companies’ unique risk, by that the only remaining risk would be the market-risk.
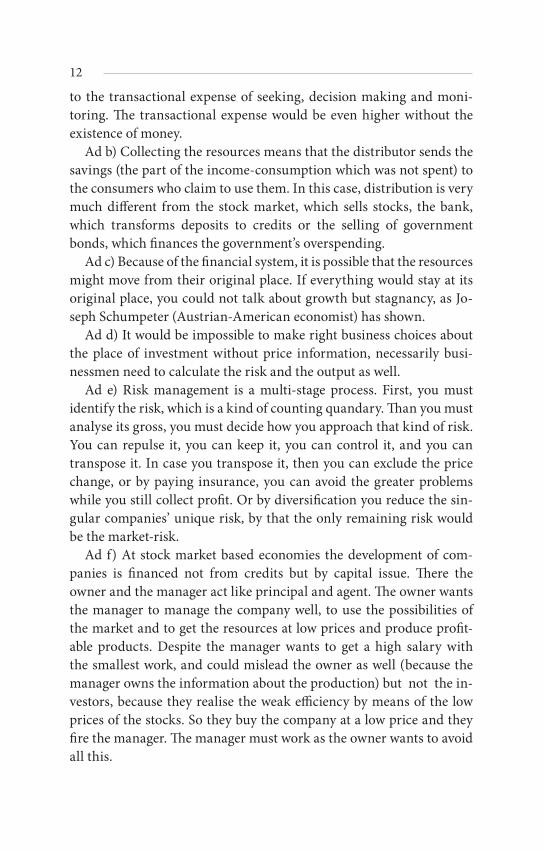
Ad f) At stock market based economies the development of com-panies is financed not from credits but by capital issue. There the owner and the manager act like principal and agent. The owner wants the manager to manage the company well, to use the possibilities of the market and to get the resources at low prices and produce profit-able products. Despite the manager wants to get a high salary with the smallest work, and could mislead the owner as well (because the manager owns the information about the production) but not the in- vestors, because they realise the weak efficiency by means of the low prices of the stocks. So they buy the company at a low price and they fire the manager. The manager must work as the owner wants to avoid all this.

13
The world culturally is quite diverse. Samuel Huntington says there are eight major civilisations. a) Euro-Atlantic b) Orthodox (Russian) c) Latin-American d) Japanese e) Chinese f) Hindu g) Islam h) Afri-can.
Global world and civilisationsforglobalisation
ECONOMY SOCIETY POLITICS
Euro-Atlantic rational rational rational
Chinese rational rational irrational
Japanese rational irrational rational
Orthodox rational irrational irrational
Hindu? irrational rational rational
Latin Ameri-can? irrational rational irrational
African? irrational irrational rational
Islam? irrational irrational irrational
It is hard to classify civilisations as sub-systems, but you can find help if you analyse the political system. In democracies it is easier, than in a dic-tatorships to explore the preferences and to govern a country according-ly. Economics separate rational sub-systems or irrational sub-systems at the markets. The caste system, the acts influenced by the Sharia, are irrational. The classification is not accurate, the possibilities are infinite. The table could be accurate enough to understand globalisation: the first ‘station’ of globalisation was the Euro-Atlantic civilisation then Japan joined and lately the BRIC countries (Brazil, Russia, India, and China) got close to globalisation. The African region and the Islam part of the world show such irrational symptoms, that it is hardly believable, that they would join the globalisation in the near future.
It is easy to describe economic growth. Till the 19th century the world economy had stagnated (GDP per capita), but since then –at some spe-cific areas in the World – the GDP per capita started to rise. In the past millennia, the technological and economic growth was quite slow.

14
According to Angus Maddison, from the beginning of modern times to 1800, the GDP per capita has been just doubled in Europe and in the world economy; between 1870 and 2010 the GDP per capita has grown 1.8% a year, so according to the rule of 72 (72/1.8=40) it’s been duplicated in 40 years. The economy of the US has grown 45-50 times faster, than the rest of the World in history. 1870/40=47, it takes 47 years to duplicate. The size of GDP has also grown lately, but because of the population growth it has hardly manifested in the GDP per capita.
From the beginning of modern times to 1820, the population in-creased by 4.6 times while the GDP got bigger 6.6 times. The GDP per capita was 1.4 times bigger than at the beginning of our era. Growth theory courses like to ask students to compare the results of the Eu-ropean-Chinese civilisation (firearms, navigation with compass, and printing), with those of the American civilisation in pre-Columbian times, who did not know the wheel, but they had an advanced state and pyramids, with those of the native Australians, who produced plates, clothes and boomerangs and with those of the Tasmanian natives, who used smooth stone tools, and lived liked ancient communities for a very long time. The students’ task is then to find out what is the key of development. They always find out easily. Development is a product of human brain: where a lot of people live together, knowledge cumulates and development is fast; where only a few people live, they would be less motivated to develop.
The question is: what was the exact thing which boosted growth around 1820 in England and how did it escalate?
Economic historians mention two things, which were created around that time: a) the protection of intellectual property, and b) the system of trade banks.
Ad a) Before that time it was not worth to invent technological contriv-ance, because who was working on an invention could not do his daily job, so he did not get paid, and even if he invented something, anybody could steal it, because the inventors had no chance to protect their own inventions. Around 1820 the protection of intellectual properties was born, so who invented something useful, became a rich man.

15
Ad b) To bring inventions to life, inventors then needed money, and the banks lent that money to them.
The growth in England has been also followed by the continent, but the framework and institutions of growth were different. Gerschenkron classified the growth in Europe by the development of the countries. The most developed country was England, because the firms produced enough profit to cover the cost of new assets.
In Western and Central Europe (France and Germany) the entre-pre-neurs did not have enough capital to cover the cost of new tools so they had to ask the banks for credit. The money transformed to credit was from the savings of citizens. In the poorer regions of Europe (Russia) the entrepreneurs did not have enough capital, and the banks could not give them credit, either. The Russian state guaranteed the inter-est rate to entrepreneurs, who invested into railroad constructions. If the railroad network had already been built, like in Hungary by 1870, then they could transport their grain into the industrialized European countries. It first beneficially affected the mill-industry, then the fac-tories which produced the mills, and that affected the technological development.
The technological development in England stopped around 1870 dur-ing the Second Industrial Revolution. England did not want to join the revolution of the chemical industry, because they did not want to replace their original factories, and they refused to modernize their polytechnic universities. The USA gradually became the leader of tech-nological development, where the stock based capitalism came to life.
Around 2000, a large-scale comparative analysis commenced to find an explanation to the facts that the per capita GDP is higher by 30% in the USA than in the EU, and that this difference is constant for 30 years. The basic assumption was that there are more people working in the US, and they also work more and the quality of their work is higher. All these three elements mean 10%, whereas you get the 30% difference. More people work in the US, because 100% of middle-aged males want to work, but much fewer European women, youth and sen-iors than in the US. They work more, because considering the flexible

16
labour economics they do not have the chance to finance their living from unemployment benefits. They receive less paid holidays. Prob-ably the most important is the third element: their quality of work is higher. They are not afraid of innovation; they make new products, so almost every new product is coming from the US. Employees of big corporations leave their jobs to establish their own businesses to give life to their own ideas. In the EU, big corporations are more frequent, and they do not focus on invention, instead they are always trying to produce US productions more economically.
Per Capita GDP in the USA, from 1870
Source: Maddison
Finally, we arrived to the theoretical questions of economic growth. Schumpeter observed, that the economic circulation can be infinite, unless somebody ‘frees’ the resources to be used from their original place. In case of innovation, it is possible to use the resources differ-ently.
There are four kinds of innovation: a) new products, b) new method, c) new input- or output market, d) new corporate organisation.
Ad a) a new product is something which has not existed before. There is a need for that, created by the raising standard of living, and thus

17
people want to consume different products. The number of the types of goods is rising harmonically with the increase of the per capita GDP.
Ad b) a new method, the appropriate production technique is different in every country, where manpower is cheap in terms of the machine prices; it is more efficient to employ more workers.
Ad c) It is expedient to explore new output-markets because producing more items will be still profitable.
Ad d) Fukuyama wrote an excellent book about the importance of corporate organisation, called The Trust. He listed the economically important countries where the corporations are stuck at the level of small- and middle-corporations (not listing foreign or state owned corporations) or where some managed to break through the level of small- and middle corporations. Fukuyama has shown that in case of a lack of trust, a corporation can develop until it is able to find a leader from the kinship, because they trust no outsiders. In the US and in Germany people are able to trust an outsider; in China, however they only trust their relatives. Lewis has shown another aspect of limits on upper sizes. In Japan the size of the automotive industry is greater than in the US, but the national production in Japan is 30% lower than in the USA. The reason is quite simple: Japanese governments protect Japanese small-corporations (in exchange for votes) and in Japanese cities it is forbidden to start big corporations, like Wall Mart, which is very productive in the US.
Schumpeter’s innovation first appears as an idea (invention), which be-longs to the entrepreneur, then comes the great change: invention be-comes innovation. According to the logic of this model the resources now have stable places, and the bank credit is the power competent to rearrange them.
Financial depth has a vast literature whether in theoretical terms or in a statistical approach. Studies on the relationship between financial depth and economic growth use the Schumpeterian growth theory (1912/1934) as a starting point. It is argued, that entrepreneurial inno-vation may only become part of the economy if there is a bank to pro-vide finance for the required investment projects, thereby transferring a part of the purchasing power to the entrepreneur, for a certain inter-

18
est, and in exchange for his successful innovation, the entrepreneur receives a profit. The underlying idea is nearly a hundred years old. Exercises to statistically prove the correlation between financial inter-mediation and growth began about twenty years ago with the study of King and Levine (1993). Since then many has followed, and they all agree that for understanding economic growth, it is essential to find out the link between growth and financial depth. Such correlation is based on the works of Bagehot (1873), Schumpeter (1912), Gurley and Shaw (1955), Goldsmith (1969) and McKinnon (1973).
According to Haber (2008) the referring studies employ long-run his- torical evidence, cross-country regressions or within country stud-ies. Some economic historians emphasize the crucial role of financial revolution in the economic development of 17th century Holland, 18th century England and 19th century United States. Financial economists came to a similar conclusion. Using data from 80 countries for the pe-riod between 1960 and 1989, King and Levine (1993) have proven that a deeper financial intermediation leads to a more rapid accumulation of physical capital, so to a higher economic growth. Levine and Zervos (1998) took the capital market (the stock market) also into the study and found a positive correlation between the liquidity of the capital mar-ket, the development of the financial sector, the capital accumulation and economic growth. Focusing on industries and countries, Rajan and Zingales (1998) concluded that financial development might foster economic growth especially in capital-intensive industries. Fishman and Love (2004) found that on the short-run, financial development helps to allocate the resources by directing the resources where growth potential is higher. On the long-run the capital intensive industries which are more in need of external finance grow faster in countries with more developed financial system.
Beck, Levin and Loayza (2000) found a strong and positive correlation of the development level of the financial system and both the total fac-tor productivity (TFP) and the growth rate by applying a new econo-metric model, based on an analysis of data from 74 countries for the period between 1960 and 1995. The third group of studies contains works that apply cross- region and cross-time analyses within coun-tries. Jayaratne and Strahan (1996) studied the impact on economic

19
growth of the relaxation of bank branch restrictions over 50 states of the USA. They provide evidence, that after intrastate branch reform, per capita income growth increased significantly. Similar studies were conducted by Dehejia and Lleras-Muney (2007), or by Black and Stra-han (2002).
Economists during the past decade have focused on the specific mechanisms of the finance-growth nexus. Guiso, Sapienza and Zin-gales (2004) by comparing regions of Italy, studied how financial sys-tem affects entrepreneurial activity. They found that if the entrepre-neur moved from a region with the less developed financial system to a region with a more developed financial system, then the probability of becoming an entrepreneur would increase by 5.6%. Many study the finance – entrepreneurship nexus (for example Haber 1991 and 1997, Haber and Perotti 2007).
Cetorelli and Strahan (2004) found that the stronger the competi-tion is among banks, the higher the entrepreneurial activity will be. Demirgüç-Kunt, Laeven and Levine (2004) analysing data from 36 in-dustries of 44 countries , came to a conclusion that financial develop-ment will disproportionately accelerate the growth of industries with relatively high proportion of small firms (by technological reason) and a higher rate of manufacturing GDP is generated by small firms dominated industries in countries, where the financial system is more developed.
Recent researches let an insight to the ways financial system affects growth. Beck, Levine and Loayza (1999) have proven that financial in-termediation promotes growth not so much by increasing the per cap-ita capital accumulation or savings rates as by increasing productivity and allocating resources. There is a correlation between the access to external finance and the entry of new firms (Klapper, Laeven and Ra-jan, 2006) or the dynamics and innovation of firms (Aghion, Fally and Scarpetta, 2007; Ayyagari, Demirgüç-Kunt and Maksimovic, 2011).
Rajan and Zingales (1998), Beck et al. (2005, 2006) have concluded that good financing supports the expansion of businesses and pro-motes successful new investments. According to the findings of Beck et al. (2005, 2008) financial depth matters more for the expansion and performance of small firms than those of the large ones. a developed financial system not only promotes economic growth, but it may also mitigate the volatility thereof. Aghion at el. (2010) conclude that a de-

20
veloped financial system alleviates liquidity constraints on firms and promotes investment, which reduces the volatility of growth and in-vestment, and also helps firms to maintain their liquidity, even if ex-change rates are volatile. The IMF (2012) says that on a macro level, a developed financial system fosters monetary policy, widens the fiscal policy space and offers the opportunity of a choice among exchange rate systems.
However, some research has proven, that the relationship between financial development and growth is not linear, it is stronger among middle-income countries (Rioja and Valev, 2004) and the richer the country is, the more modest the effect would be (Aghion, Howitt and Mayer-Foulkes, 2005). But the 2007 global crisis also showed the fra-gility of the financial system (Beck, 2012). While the positive impact of a financial system on a real economy is that it transforms short-term deposits to long-term investments, this also renders the system fragile, susceptible to shocks. Bank runs may have several external impacts, for example because of contamination it can lead to increased costs for other institutions, but it may have a negative impact on the economy as a whole, reaching over 50% of GDP as fiscal costs (Laeven and Valencia, 2008). Cross-country analysis have pointed to that bank crisis hurts industries more that are more dependent on external finance, and the more developed financial system a country has, the stronger the effect will be. (Dell’Ariccia, Detragiache and Rajan, 2008, Kroszner, Laeven and Kinglebiel, 2007). Significant external costs of bank failures have made banking one of the most regulated sectors, and have led to the introduction of a safety net to protect creditors and sometimes also eq-uity holders in the majority of the countries. Financing this safety net explains the over-expansion of the financial sector and forces banks to take more risks (see for example Demirgüç-Kunt and Kane, 2002).
Péter Csillik

II. Sequences of Globalisation The problem of measurement
Though the term of globalisation is generally used for new develop-ments at the end of the 20th or the beginning of the 21st century, there are important new tendencies, which place globalisation in a wider perspective.
Susan Berger has convincingly proved (2003) that our present glo-balisation had already been preceded by another wave of globalisation in the 19th Century. During this time not only international trade, but also international investments and international migration were very important, and due to these forces, new forms of economic integra-tions have emerged. Other authors (Carroué, Collet, Ruiz, 2005) have gone back even further in history, and have maintained that the first globalisation has arrived during the 15th-16th century as the conse-quence of the great discoveries.
If you look at globalisation in a historical perspective, you have to see that globalisation is not a “one way street”, not even an “ever in-creasing process”, but something that can develop and can regress as well. Looking back at the history, you might have the feeling that waves of globalisation were followed by ebbs, when national or regional sepa-ration, protectionism, and reclusion became dominating.
Naturally, distinction between periods of waves and ebbs of globali-sation is possible only on an intuitive or a qualitative way, but at the same time it is also possible to try to measure the level of globalisation more precisely, by a quantitative way.
Naturally, there are some more or less successful attempts to meas-ure the level of globalisation already. The Centre for the Study of Glo-balisation at the Warwick University has developed a complex system of measurement of globalisation. This system measures economic, po-litical and cultural aspects of globalisation and creats a synthetic CSGR globalisation index by giving different weights to the different meas-

22
urements.. CSGR globalisation index is highly developed and there is a sound and elegant mathematical basis behind (see: http://www2.warwick.ac.uk/fac/soc/csgr/index/technical_appendix.pdf). The only problem is that this index is only appropriate for cross-section analysis and it is not easy to find a long time series for the sub-indices proposed for the CSGR index.
In order to measure fluctuation of globalisation during longer time periods, you should define indices which can be measured on a longer time series. It is useless to create a complicated synthetic index for this purpose, if the long-term series of the components of the synthetic in-dex are not available.
In order to compose a relatively simple Long Term Globalisation Index you might propose the ratio of GDP growth and the growth of foreign trade. It is evident, that during the periods of globalisation for-eign trade is developing more rapidly than the GDP of the countries concerned; and vice versa: during a “globalisation ebb”, foreign trade is developing less rapidly than the GDP. Here you also have problems of measuring GDP and foreign trade before the 19th century, but An-gus Maddison has performed very profound researches in this field, and today you can have rather reliable estimations of foreign trade and GDP of the major countries and regions of the World for the last 2-3 centuries.
Though this Long Term Globalisation Index might be regarded as a very simple or even oversimplified one, lacking all mathematical sta-tistical “finesse”, even this simple index is indeed unreliable for longer periods. Though Maddison made an enormous work by generating long term GDP and trade statistics, debate on these data show that even these figures could only be regarded as approximate estimations.
In the following chapters we will base our researches mainly on Maddison’s estimations when attempting to determine different peri-ods of globalisation.
Looking at the development of foreign trade, international capital movements, international economic and political integration, you can instinctively distinguish tides and low ebbs of globalisation. Looking at the simple Long Term Globalisation Index of the growth of foreign trade and GDP you can – not surprisingly – identify the same periods.
23
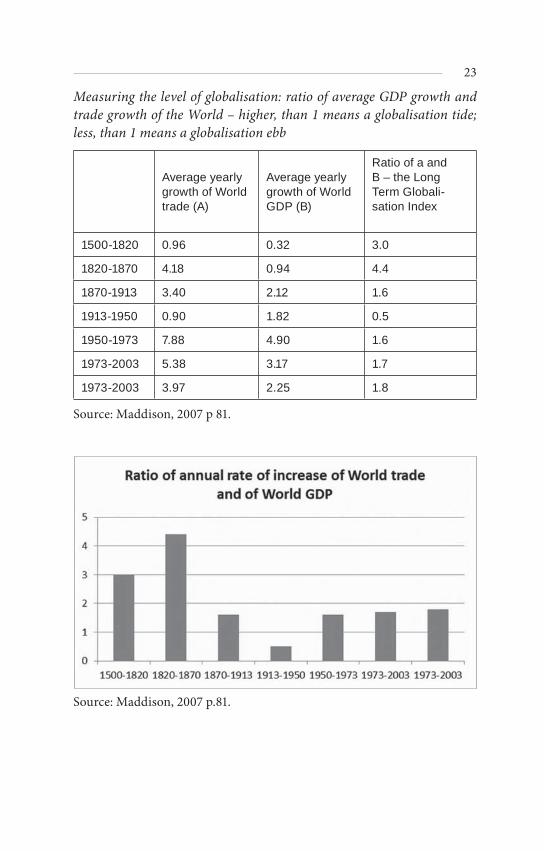
Measuring the level of globalisation: ratio of average GDP growth and trade growth of the World – higher, than 1 means a globalisation tide; less, than 1 means a globalisation ebb
Average yearly growth of World trade (A)
Average yearly growth of World GDP (B)
Ratio of a and B – the Long Term Globali-sation Index
1500-1820 0.96 0.32 3.0
1820-1870 4.18 0.94 4.4
1870-1913 3.40 2.12 1.6
1913-1950 0.90 1.82 0.5
1950-1973 7.88 4.90 1.6
1973-2003 5.38 3.17 1.7
1973-2003 3.97 2.25 1.8
Source: Maddison, 2007 p 81.
Source: Maddison, 2007 p.81.

24
This rather rough picture can be refined by adding further qualitative analysis of foreign trade, international investments, international mig-rations and political and economic integrations. Consequently, we can more-or-less clearly distinguish three high tides of globalisation and two low ebbs of globalisation between them:
The first round of globalisation was the time of the Great Discov-eries in the 15-17th century, when foreign trade has increased at least three times more rapidly according to Maddison’s estimation than the GDP of the World;
At the end of the 18th Century the first ebb of globalisation can be distinguished, mainly due to political turbulences in Europe and in America – unfortunately available trade and GDP statistics are not de-tailed enough to reflect these tendencies in the Long Term Globalisa-tion Index;
In the 19th Century the second wave of globalisation can clearly be distinguished – Susan Berger has given a detailed and convinc-ing analysis of this phenomenon. Between 1820 and 1870 world trade has increased four times more rapidly than global GDP. Though after the recession of 1873 lots of European countries have started to apply modest protectionist measures by introducing higher customs, growth of foreign trade still remained larger than growth of GDP till World War I broke out;
After 1914 the process of the 2nd globalisation has completely stopped and only after the end of the World War II has started to gain momentum again.
The transition years started after World War II and lasted until the Great Oil Crisis in the ‘70s, in spite of the efforts of the developed industrialised countries in order to stabilize and liberalise the world economy by introducing new organisations as the IMF, the World Bank, the OECD or the GATT.
The most recent, 3rd globalisation has started to gain momentum only after the Great Oil Crisis of 1973, but it was only after the collapse of the Soviet Union and the Socialist Block, that our present (third) globalisation has started to operate at full speed.
The future of our 3rd globalisation is rather uncertain after the Great Economic Crisis of 2008. We cannot know yet, if globalisation could survive the Crisis or it will be replaced by new ebb of globalisa-tion, as it happened after the World War I.

25
Next it will be shown, that the subsequent waves of globalisation were subject to important technological preconditions in the fields of trans-port and communication. During the period of the Great Discoveries such a precondition was the development of navigation, in the 19th century railways, steamships, the telegraph and the telephone meant these preconditions, while nowadays these are embodied in large cargo airplanes, large capacity cargo vessels, the internet and telecommuni-cations satellites.
Meanwhile it can also be seen, that development of transport and communication is a necessary, yet insufficient condition of globalisa-tion. The political and the legal environment, institutional structures, the means of state intervention are all equally important factors. The legal environment, the institutions and the role of state must all be changed, otherwise globalisation is impossible. It will also be shown below, that the decline of globalisation in the 18th and in the early 20th century was caused by fundamental changes of the legal environment, the institutional structures, and state intervention.
Globalisation waves and ebbs did not have the same effect on every country at a given time: every globalisation waves and ebbs had their losers and winners. Hereinafter our primary perspective is based on Eastern Europe, examining how the particular changes have affected the countries of this region.

III. Characteristics of tides and ebbs of globalisation
1. FIRST TIDE OF GLOBALISATION: THE GREAT DISCOVERIES 1516TH CENTURY
Carroué, Collet és Rouz (2005) considered the period of the Great Geographical Discoveries the first wave of globalisation, what paved the road for future globalisation waves, while other authors contend this, and uphold, that the first features of globalisation could have onlybeen seen in the processes started in the late 20th century, or, like S. Berger, identify the first globalisation with events of the 19th century, what was followed by a globalisation ebb of the early 20th century and subsequently our recent globalisation. Whatever the case may be, it cannot be doubted, that throughout known history, it was the first time when every part of the world became accessi-ble – even though practical accessibility of these territories was not achieved until the end of the 19th century. After the great discover-ies, international trade increased three times faster, than world pro-duction, and this globalisation of trade was only exceeded for a brief period in the 19th century, even the period of late 20th century was just lagging behind.
.. Economic thought at the time of the first wave of globalisation
Mercantilism
By the 16th century the amount of precious metals resulted in signifi-cant changes by dramatically increasing the money supply. Traditional European financial stocks increased by six times. Due to the discover-

27
ies, a global market unravelled, and the importance of intercontinental trade had increased. Expansion of state borders also entailed a closer scrutiny over national economies. As a consequence of these changes, the role of money in the economy increased, so did the ratio of trade and the importance of market share.
According to this increased role of money, the first economic ex-planations related to the circulation of money, and covered basically foreign trade. Economists of the period were labelled as “mercantilists” in later times (mercator=merchant), although these mercantilists had much more been economic politicians. Mercantilism is not a mere eco-nomic thought; it was full of life and practice. Overall, this group was mainly composed of lawyers and merchants, advising their respective monarchs and other leaders of their countries.
The focal point of their attention was the enrichment of their coun-try. They were convinced, that the wealth of the country increases, if the amount of precious materials within its territory increases. Lack-ing access to precious metal mines in the country, this goal can be achieved by means of an active foreign trade balance. Foreign trade balance becomes positive, if the country has a developed industry. En-richment of the country is thus realised by the export of industrial products.
The first major personality of the mercantilist thought was Thomas Mun (1571-1641). He was born in a family of merchants in London, and he obtained a considerable fortune from colonial trade. He later became the director of the East India Company. His works:
– a Discourse of Trade from England unto the East Indies, (1621)– England’s Treasure by Forraign Trade, or the Ballance of our For-
raign Trade is the Rule of our Treasure), (1664, post humus).
Mun suggested that the economy of a given country depends fun-damentally on the foreign trade thereof, rather than on its produc-tion. Money in England – should it be invested home or abroad – cre-ates profit anyhow. Capital outflow is a natural form of investment, since the money finally would flow back to the country of origin. He already used abstract economic terminology, like profit, interest, capi-tal, goods, money, all of what he considered dependant on trade. He described three types of profit: (1) profit of the state (2) profit of the public (3) profit of the merchants.
28
Mun formulated the following economic policy proposals for Eng-land:
– Agriculture shall involve in cultivation formerly uncultivated lands, in order to sell abroad the volume increase of production.
– Imports must be decreased. – The country shall specialize in activities unavailable elsewhere.– An own fleet must be established (not rented).– Goods depots on foreign soil shall be established. – The state must intervene economic life, the most important tool
whereof would be customs. (Low customs on exports, high cus-toms on imports).
– A leading role of human resources: lucrative professions must be educated for the people.
Images of the ideas of Mun were present in many parts of Europe, most notably in the French mercantilism, often referred to as Colbertism, af-ter its most prominent representative. Jean Baptist Colbert (1619-1682) was born to a cloth-merchant, so he was also trained as merchant, and later he managed the incredible wealth of the cardinal and minister Mazarin. He was the one to recommend Colbert to the attention of Louis XIV. Colbert acted as Controller-General for Finances from 1665, and as such, he formulated the main tasks for the French econ-omy. The primary objectives were to create the inner independence of France, to strengthen foreign trade, to increase state incomes and the foreign policy positions of the country. Colbert acquired the money supporting the tremendous constructions and famously extravagant habits of Louis XIV. He set up an ordinary budget, managed to termi-nate the previously commonplace corruption and embezzlements, and he really managed to recreate a financial equilibrium. (Kaposi, [1995])
His measures:
– Customs, as a tool was implemented. a Royal Decree on Customs in 1664 declared a ban on Dutch industrial goods, what led to a subsequent customs war between the two countries, finally re-sulting in a withdrawal of the Customs Decree in 1678.
– Following the English model, trading monopolies were estab-lished. These however remained state companies, and not private ones. They bankrupted soon. Such companies only managed to take a foothold in Quebec, West India and certain African coasts.

29
– Large-scale fleet and port constructions begun, old ports were developed.
– Roads assisting domestic trade were developed, some channels also (Canal du Midi, Loire-Seine channel, never finished)
– Industrial development. State supported manufactures were founded; manufacturers were supported by means of subven-tions. The industry was divided: (1) regulated part (luxury goods, fashionable goods) (2) functioning, yet not regulated part
– Colbert supported the operations of the Protestants and the Jews as well.
French economic policy was less successful in the 17th century, com-pared to that of England, what resulted in a growing difference be-tween the levels of development of the two countries, and also sent the agriculture into a major crisis.
Mercantilist principles entered the Hapsburg Monarchy in the sec-ond half of the 17th century. Since trading bourgeoisie was weak at this time in Central Europe, the emphasis here was laid on increasing the incomes of the monarch. This branch of Mercantilism is thus usually referred to as Cameralism, the most prominent figure within the em-pire was Johann Joachim Becher, who issued his work “Political Dis-cussions” in 1668. The source of enrichment in this work was identified in colonisation. 1685 was the year, when the famous pamphlet of Phil-ipe Wilhelm Hörlig was published (“Austria above all else”), where he argued, that the economic unity of the Habsburg Monarchy can only be achieved by owning Hungary, what was rich in ore, gold, silver and salt mines, and particularly in food stocks, thus he connected driving out the Ottoman Empire to the Austrian idea on statehood. He con-cludes that an independent and self-providing empire can be created; where the industrialized Western regions and the agricultural Eastern ones may supplement each other, while a custom on foreign trade with third countries can protect the country from competition with more developed industrialized economies. He suggested achieving a bal-anced central budget alongside mercantilist and protectionist ideas.
Mercantilism thus means economic policies bearing a number of unique features. Self-regulative capacities of capitalist economies had not yet been realised and expected regulations from the state. Objec-tives were always set centrally; the economic policy of the state had

30
been attached to fiscal policy, the policy on poverty and employment. Mercantilists had taken hold of a demand of their era, and sped up the development of feudal countries to capitalist economies. Costs of industrialisation were transferred to the agriculture. Agricultural products were taxed heavily; exports thereof had been prohibited or seriously burdened. These measures led the agriculture to nigh-bank-ruptcy in many countries, prominently in France. Certain elements of mercantilism exist even today, built in the regulators of various eco-nomic systems. (Ivicz-Schlett [2001])
Physiocrats
The first school of economics was born in France, where a single the-oretical system started to evolve. “Physiocrat” comes from the Greek word for nature (physis), what is an apparent clue, that members of this school were the first to realise, that economics are subject to such rules as those of nature. They started to examine economic phenomena like simple natural features. They analyse the recurrences of the economic life, the inherent connections, reasons and consequences, and they conclude, that laws similar to those of nature govern economic life.
Francois Quesnay (1694-1774) was the founder of this school. He was born eight among the thirteen children of a peasant family in 1694, in the village of Méré, close to Versailles, and he ran the pos-sibly most impressive carrier in economics of his age. He apprenticed to a surgeon, but the ‘30s already found him in Paris, where in the royal court he became the doctor of Mme Pompadour and soon after became the doctor of Louis XV himself. The king befriended his doc-tor, and with this help his book was published. He was already 60 years old, when he started to write about economics. His work, “Economic Table” was published in 1758, and a year after that “Remarks” followed. He was the author of two articles, on “Fermiers” and on “Grains”, in the French Encyclopedia. He also was the core of a circle of writers together forming the Physiocrats school. Most notably this circle in-cluded: Mirabeau Victor (1715-1789), Du Pont de Nemours (1739-1817) and Mercier de la Riviére (1720-1797).
He based his theory on economic circulation on the blood circuit. The biology of diabolism served for him as a model to visualize the process starting with production, continued by consumption of the produced goods, and then turning back by various means to pro-

31
duction again. He believed that the only ground for economics was nature. This provides mankind everything needed for survival. Indus-try and trade are based on agriculture. Agriculture is productive only, because this is the sector, where material actually thrives, one seed produces a multiplicity. Growth of material is the key to the wealth of a country. Money is only a medium of exchange. If the financial wealth is increased in a country, it only means that export increased, but the country did not get any wealthier. The only source of wealth thus must be land and agriculture, what in turn is interpreted as a business activ-ity. This is already a capitalist, input demanding, productive agricul-ture. (Mátyás [1990])
The “Tableau économique” launched the professional academic ex-amination of economics. Issues of natural law are also treated here, and the philosophical fundamentals of physiocracy are also formu-lated within. By describing the circulation of social product and by observing the flow of income among participating social classes, this work pictured the economic life of a society as a system based on in-terdependencies
Man is subject to two sets of rules, “ordre naturel” and “ordre positif ”. The first derive the laws of economics from God, and therefore such rules are eternal and unchangeable. These are also so self-evident, that by means of reason, like axioms, can be recognized by observing the surrounding phenomena. These rules are the same at every time, for every man. These are not necessarily binding rules; however, every man is urged unknowingly, at a level of instincts to find them. The pri-mary example thereof is the instinct of self-preservation, what projects to the economy the feeling of property or ownership.
Ordre positif is the artificial civil order. The starting point is the hu-man being; therefore it changes by the circumstances, needs, eras or natural surroundings. Every written law fall into this category. The best way of governance is the one to make closer to the realisation of ordre naturel.
Physiocrats identified three social classes: (1) peasants, (2) land owners (3) manufacturers, traders and other freelancers. The first two classes strongly relate to land, where the so-called pure product is made. The third class does not create pure products, because it only produces as much as it receives from agriculture. The notion of agriculture, as the only productive sector was further strengthened by the fact that

32
a whole class (landowners) lived from the income thereof without ac-tual work.
Quesnay believed that agriculture is capable of optimal operation on its own, but he also knew rather well, that in many aspects this operation is far from optimal. He was convinced, that agriculture was encumbered by the state. He believed that tax burdens are too large on production, and this prevents growth of savings. Moreover, the government should take measures to involve new lands in cultivation; rich people should be encouraged to new agricultural investments. He urged the government, to release the economy from trade barriers, what kept the rental fees of land artificially low, and diminish invest-ment mood in agriculture. His tax theory correlates his production theory. As agriculture is productive only, therefore he considered le-gitimate only proportionate tax on the pure yield of land. Thus, tax is laid on the yield, and on the land itself, and it shall be collected from the owners of the land. Any other taxes, including customs and indi-rect taxes shall be terminated. The third “unproductive” class cannot be taxed, as this tax would be assigned further to landowners finally, meanwhile costs of recovery would increase.
Wealth of the nation of the country can only be achieved by a high price level of agricultural products. There is only one way to reach that: full trade liberty. The state may enact laws regulating economics, if necessary, but by means of that, agriculture must be supported, as the source of every wealth.
A major step for the practical application of physiocratism was his appointment to Minister of Finance in 1774. In this capacity he or-dered:
– for free trade in grains, exemption from foreign and domestic du-ties
– easing the tax burden on peasants – terminated a number of duties for work done– released some debts – he tried to provide investment benefits from the central budget
His measures failed: a rapid inflation followed, and he enraged the privileged classes, who overturned him. The next minister, Necker, had withdrawn most of his orders. Turgot turned to his academic work for the future.

33
Physiocratism had hardly any followers outside France; their im-pact on economic thought was only realised in the early 20th century. Their thinking had already accepted the notion of capital: constant capital, involving land ownership agricultural buildings; working cap-ital, what for them meant the instruments required for agricultural work. Physiocrats were the first proponents of the emancipation of serfs. They expected a lot from this, as they believed, that by strength-ening lower classes, nobility, the clergy and the land owner class will be raised along as well. The historical success of physiocratism was to counter the prevalent rigid economic principles of the period, the economic works of Quesnay had a major impact on the learned people of his time, and also future generations of economists have been fasci-nated by his teachings. (Bekker [2000])
.. Background and motivation of the First globalisation
Among the technological preconditions of the Great Discoveries, revo-lution of the navigation and military techniques could be first men-tioned. Meanwhile, in relation to the Great Discoveries the insufficient technical possibilities must also be noted, along with the importance of changes in the legal system, and changes in the behaviour of the states.
In case of China, navigation techniques and perhaps even military technologies were as much or even more developed as in Europe in the 15th century. This development was proved by the voyage of the Chinese Admiral Zheng He, who sailed from China to the Indonesian islands, to India, and even to East Africa between 1405 and 1411. It is highly possible that with their sophisticated navigation technolo-gies Chinese traders and solders could have arrived even to Europe, but the Chinese state has decided something else. The Ming and Qing dynasties have forbidden all overseas sea trips, what made further voyages impossible. The Chinese legal system made it impossible to travel overseas without having official state permission and it was also impossible to find other financial resources for such trips but state subsidies.
In China, technologies, which could have been used “to start glo-balisation of the world”, were present, but they have lacked the political

34
will and the appropriate legal system, which could have made overseas voyages possible.
Returning to the preconditions of the Great Discoveries, or as you might call it, of the first globalisation you can enumerate the following technological, demographical, legal, and political preconditions:
Technical preconditions of the first globalisation were the widely used navigational tools, as the compass and the astrolabe and the de-velopment of shipbuilding art, which was able to produce sea-faring vessels.
Demographical development has also contributed to the great dis-coveries – simply by producing large number of adventurers who were ready to go to unknown places of the World. As Cameron and Neal (2003) has stated, in the middle of the 15th century: “after a century of decline and stagnation, Europe’s population has started to grow once more”. This population increase has lasted until the middle of the 17th century, when – mainly because of the great wars – it started to decline again.
Among the institutional preconditions you should first mention the political determination of the European states, as the Great Discover-ies were largely financed by the governments – though later expedi-tions were more and more often financed by private resources.
The process of globalisation in itself contributed also to the de-velopment of the legal system. During the first globalisation period, important innovations could be observed in the field of finances and economic law as well, and these innovations were closely connected to financial speculations.
In the Middle Ages the dominant form of economic enterprises were the simple proprietorship, the unlimited partnership, and lim-ited partnership, joint stock (or corporate) forms of business organisa-tion were not accepted. However, the Great Discoveries have rapidly increased the financial need, and the traditional company forms were not enough to satisfy it, so the governments in Europe let the pressure and authorized the creation of the first joint stock companies.
The first joint venture company was the British East India Com-pany, followed by the Dutch East India Company; both were created in the first years of the 17th century (1604 and 1606 respectively) by gov-ernment decrees. These companies received government mono-polies to carry out colonial activities in Asia and their funding was financed partly by stock emission. These companies have marked the increas-

35
ing participation of private capital in the Great Discoveries and in the further economic utilisation thereof.
The Amsterdam Stock Exchange (1602) was the first place of inter-national monetary transactions and the shares of these newly formed companies were also traded here. The first joint stock companies all worked under strict government control and their activities were sound and safe.
But in England during the euphoria of the “Glorious Revolution” (1688) the court started to give more and more permissions for the funding of joint stock companies, and later joint ventures were created even without royal permission. As Cameron and Neal (2003) wrote in their Concise Economic History, “the Glorious Revolution has resulted in the creation of a number of joint-stock companies in the 1690s…and it culminated in the speculative financial boom known as the South Sea Bubble.”
This is how the first big financial bubble and financial crisis has ar-rived. The South Sea Bubble has originated in the creation of the South Sea Company for the trade with the colonies in 1711. This was a joint venture company, following the tradition of similar joint venture com-panies founded in order to develop trade with the colonies. The prob-lem was that in that case – contrary to the British East India Company – the “business plans” of the society highly overestimated the profit, which later could be realised. Euphoria among investors was so high that the price of the shares of the South Sea Company has skyrocketed – till the collapse, which arrived in 1720.
Similar financial bubble has emerged in France around the Missi- ssippi Company. In May 1716, John Law, a Scotchman, whose rather innovative ideas on monetary system were rejected in his country, suc-cessfully convinced the French Royal Court to establish the Banque Générale Privée in order to introduce the use of paper money in France, and finance by such means the huge deficit of the kingdom. Law also wanted to use paper money in order to boost economy, as he maintained that the scarcity of silver and gold is one of the causes of the economic stagnation. Law has maintained that the money supply should be adapted to the needs of the economy, and this could be done only by using paper money, that can be printed according to the needs of the real economy. In 1718, the Banque Générale Privée became the Banque Royale (Royal Bank) meaning the notes were guaranteed by the king, Louis XV of France. Lots of economists have regarded this

36
idea very modern in the 20th Century, even seeing in Law a forerunner of the Keynesian thinking.
But Law did not stop after introducing paper money in the French economy, he also conceived a joint stock trading company called the Compagnie d’Occident (or, The Mississippi Company) in August 1717. Law was named the Chief Director of this new company, which was granted a trade monopoly of the West Indies and North America by the French government. The Company absorbed the Compagnie des Indes Orientales, Compagnie de Chine, and other rival trading compa-nies and became the Compagnie Perpetuelle des Indes on 23 May 1719 with a monopoly of commerce on all the seas.
Simultaneously, the bank began issuing more notes than it could represent in coinage; this led to an economic inflation. In the over-heated financial climate lots of investors have invested in the shares of the Compagnie Perpetuelle des Indes. The only problem was that in the short run the company was not able to produce any profit – though in the long run it could had been as profitable as the British East India Company was.
In 1720, the bank and the company were united and Law was ap-pointed Controller General of Finances to attract more capital.
The “bubble” burst at the end of 1720, when the people has suddenly lost confidence and started to sell their shares and also attempted en masse to convert their notes into spices, forcing the bank to stop pay-ment on its paper notes. The follow-up was a great financial collapse and by the end of 1720, Law was dismissed from his positions and then fled from France to Venice
The consequence of the South Sea Bubble and the Mississippi Bubble was an important change of sentiment among the people and everyone have turned against the financial innovations which had ruined lots of investors in Western Europe, as not only English or French investors were caught in those traps. Today we would call this a certain “anti-globalisation” sentiment. Both in England and in France governments forbade creation of joint venture companies without having special permission from the state. The Bubble Act was repealed in 1825 but it was made possible only in the 1844 Joint Venture Companies Act to register and incorporate companies without specific legislation. In France funding joint venture companies (société par actions) was pos-sible without special permission only after the second half of the 19th century.

37
Though financial bubbles have shaken confidence in financial and economic innovations, the demise of the first globalisation has arrived by political causes. The wars in America, the French revolution and the Napoleonic wars in Europe ended the first glorious years of globalisa-tion of the Great Discoveries. The second half of the 18th century, and even the first decades of the 19th century were marked by great wars, revolutions and – last but not least – by the rise of Napoleon – who has pushed Europe into devastating wars again.
.. The scope and structure of the first globalisation
It is very difficult to measure exactly the level of globalisation before the 19th century, simply due to the lack of reliable economic statistics. More or less reliable estimations of foreign trade and GDP of the most important countries and of the world as a total are available in the precious works of Angus Maddison, but for foreign investments such reliable data is missing.
Estimations on development of foreign trade and on GDP are pro-viding surprising figures as one finds that the world trade has devel-oped between 1500 and 1800 three times more rapidly than the global GDP. It means that tha pace of development ofglobalisation was ex-tremely fast in this period.
From the figures published by Maddison (using his own and oth-ers’ researches) we can see, that the greatest difference between world trade and global GDP growth rates could be measured in the 19th century – so we might conclude that this was the time of the most rapid globalisation. The second greatest difference was during the first globalisation, between 1500 and 1820. Not surprisingly globalisation has developed very slowly between the two World Wars – this was the time of “protectionalism” and “renfermement”, when world trade has developed by a much slower rate than world GDP.
At the same time it is unclear when was the end of the first globali-sation – data are simply not reliable for determining annual fluctua-tion of trade or investments. But it seems to be sure that the great wars and revolutions of the 18th century disrupted processes of globalisa-tion.

38
.. Effects of the first wave of globalisation with special attention to Eastern Europe
The first globalisation had catastrophic consequences to Eastern Eu-rope and for the Mediterranean, since trade routes apparently shifted to the Atlantic coastline, Portugal, Spain, France, England and the Netherlands.
Moreover, Eastern European economic development was further hampered by the constant threat from the East by the Ottoman Em-pire, what turned the territory of today’s Hungary, Romania, Serbia, Bulgaria, Albania, Greece etc. into battlefields.
If one looks for the reasons of Eastern European economic deve-lopment (in terms of per capita GDP or GNI) reaching only the half of a Western European average, then these two factors – relocation of trade routes and continuous Ottoman wars – must be highlighted apparently.
.. First ebb of globalisation (-th century)
Though globalisation was rapid according to the available data, we have to underline that the first globalisation wave in the 15-16th cen-tury was relatively weak and has touched only a relatively small part of the globe, Western Europe, the limited coastal zones of America and some scattered colonies in Africa and in Asia, but undoubtedly it was the time when Europe has opened up the door of the world in front of the globalisation.
Meanwhile the first globalisation was a lasting procedure of ebbs and waves, interrupted by several wars of different magnitudes. The first one of these had been the Thirty Years War (1618-1648), covering virtually all Europe, what is usually called a 17th century world war.
Although the French revolution and the subsequent Napoleonic wars mark the ebb of the first globalisation, these wars had contrib-uted to the dissemination of modern legal systems, and therefore can be considered as the foundations of the second globalisation in 19th century.

39
2. THE SECOND TIDE OF GLOBALISATION 18201914
Susan Berger drew attention to the similarities between the 19th cen-tury and the end of the 20th Century, and wrote about the globalisa-tion of the 19th century. Globalisation of the 19th century has started during the long years of peace following the Napoleonic wars, after 1820. This was the time of the famous Pax Britannica, when Great Brit-ain was able to maintain peace in Europe, and outside Europe, Euro-pean powers were able to expand their political and economic system to a large part of the Globe.
Maddison underlines (1991), that “until the nineteenth century, pros-perity gained through trade usually involved a beggar-your-neighbour element because of the limited size of the world market and its rather slow growth [...] but [...] since 1820, trade has greatly accelerated and has grown significantly faster than output” (Maddison, 1991, p. 74.).
.. Economic theories at the time of the second globalisation Adam Smith and the theory of the “invisible hand”
Technological and trade advancement, the unraveling industrial revo-lution, capitalisation of economic life in the second half of the 18th century have all raised the need of a theoretical approach to economic and trade issues. Adam Smith spearheaded the emancipation of eco-nomic thought from the political one. His revolutionary work titled “An Inquiry into the Nature and Causes of the Wealth of Nations” was published in London in 1776.
The works of Smith were written before the industrial revolution. The dominant actors of the economic sphere at that time were manu-facturies, small-scale producers of commodities. Smith considers them in establishing his value theory: he states, that when the small-scale producers exchange their goods at the market, they really exchange each others’ work. As he puts it, they are buying goods not for money, but for work. The comparison of different types of work is not really exact; instead it is based on market bargains and agreements. This is not precise, yet sufficient for everyday life. As it was stated above, Smith also was fond of moral philosophy, and he relied heavily on the Scot-

40
tish moral thought. His long-criticized selfishness theory is also rooted therein. “It is not from the benevolence of the butcher, the brewer, or the baker that we expect our dinner, but from their regard to their own interest […] and never talk to them of our own necessities, but of their advantages.” The guiding principle of economics thus must be self-interest, since everybody is chasing his own advantage. If he would not do so, but instead regard the interests of others, then he would not act economically, but out of charity.
Smith believed that the distribution of labour also originates from nature. Human selfishness and the aptness for exchange are the main motives for the very existence thereof. Productivity is defined in terms of distribution of labour, because there had been no machinery to radi-cally increase output. As such, increasing output at the time of man-ufactures was dependant on the intensity of work. He identified two types of distribution of labour: (1) that based on specialisation within the manufacture, and (2) that among companies and sectors of social production.
A famous example of Smith is the needle manufacture, of which he writes: “I have seen a small manufactory of this kind, where ten men only were employed, and where some of them consequently performed two or three distinct operations. […] Those ten persons, [...] could make among them upwards of forty-eight thousand pins in a day. […] But if they had all wrought separately and independently, […] they certainly could not each of them have made twenty,” As it is apparent from the quotation, separation of labour makes possible professionalism, and therefore it offers a better option to perfect certain phases of the work and technological development, what results in a saving of work time.
(2) Assessing distribution of labour among companies and sectors, Smith separates from both mercantilist and physiocratist thought, when he states, that every sector is capable to create surplus value.
Smith also noted, that the fact, that man is driven by his own needs does not lead to anarchy, but to a most ideal order in the economic life. In his own words: “every individual endeavours to employ his capital as near home as he can, and consequently as much as he can in the sup-port of domestic industry, provided always that he can thereby obtain the ordinary, or not a great deal less than the ordinary profits of stock.” This “invisible hand” became the symbol of the economic theory of Smith. Equilibrium is reached in the economic life by means of market

41
mechanisms. In the course of billions of transactions at competitive markets, “selfish” actors regarding their own interests select the im-portant and valuable products or services by their votes in terms of prices. The producers of such goods are thus rewarded by prices gener-ating high profits beyond the refund of their costs, while the producers of unimportant or valueless products or services are punished by low prices not even covering their costs. This way the market is cleared from the unworthy actors. By these means the best available welfare is achieved also at a social level. The market economy theory of Smith formulated a number of preconditions that must be fulfilled at a given market, in order to achieve a publicly efficient price level. The most important such condition is the perfect competition. The state must withdraw from economic procedures, because every entrepreneur can better assess his own situations, than any politician can. In his evalu-ations Smith emphasised, that if the mobility of goods, money, capital and labour are free, then the society is going to utilize its own eco-nomic and human resources the most rationally and optimally. The role of the state shall be decreased to a minimum level, involving only the protection of property and securing the conditions where individ-uals can achieve a maximum level of income. The state must secure incomes for the maitainance of public services and commodities, what are not profitable for private individuals, but taxation must not ham-per the natural social and economical order.
Smith was convinced, that free trade supports more a common man than a baron. He believed, that state supported and protected monopo-lies are extremely harmful, since these are effecting against the opti-mal allocation to be created by the invisible hand. The consequence of monopolies is that labour and capital do not flow into place, where these could work the most efficiently. Smith was against any form of monopolistic authority, what he defined as the capacity of the seller to maintain the price above the natural level. Smith disliked govern-ments as well, what he considered as tools, what is supporting the priv-ileged by means of taxation and interferes with market procedures for the protection of monopolies. Once he wrote: “Civil government, so far as it is instituted for the security of property, is, in reality, instituted for the defence of the rich against the poor, or of those who have some property against those who have none at all.” Smith criticised the seclu-sion of state powers by the economically powerful. The state must act

42
as an impartial judge, but if supply and demand mechanisms result in a need for advocacy of the weaker, state interference would be legiti-mate for the solution of social issues. (Buchholz [1998])
Smith advocated for an international distribution of labour, where every nation would specialize in goods they are able to produce the most efficiently, where they have an absolute advantage.
The brilliance of the economic theory of Smith is marked by him to be the first to realise the guiding principles of a complex, self-regulato-ry human system. He worked out the ideal model of a self-regulatory economic system, where the efficient distribution of social resources is achieved, in order to produce the commodities most demanded by the people, without interference by a strong central regulatory power.
Although this market theory presupposes individuals driven by their own interests, and real markets often do reward greedy, infamous or immoral acts, the everyday transactions of an efficient market are based on trust. a market, where the actors are only motivated by greed and acquisition of a momentary advantage in the competition at all costs – in other terms, a market without trust and cooperation – would be unfavourable not just because of the bad mood of market actors, but also because of such a market would not operate economically, large amounts of money should be spent on lawyers, security and other pro-tective measures. There cannot be a society or market economy, which functions effectively without solid moral foundations. (Muzslai [1993])
David Ricardo and the theory of comparative advantage
Besides Adam Smith, David Ricardo (1772-1823) was the one to sig-nificantly contribute to the establishment of economics as a doctrinal science in the 19th century. Ricardo did not have any connections with theoretical economics for a long time, but as a successful businessper-son, his influence increased, his opinion was heeded to – particularly in taxation, customs and finances related issues – also by the English government. His interest was driven to economics after reading the Wealth of Nations from Adam Smith in 1799. Ricardo’s work set up economical theses by reflecting the economic relations of his age. By the 1820s, he became a prominent figure of the English academic life. At this period he could practically test his theories, when he was elect-ed Member of the Parliament in 1819 and actively participated finan-cial and monetary discussions.

43
Active 50 years after Smith, Ricardo was the economist of the in-dustrial revolution. Factories boosted in England at that time, the de-mand for agricultural products required for the industry increased. However, this happened in England before the parliamentary reform. Parliamentary majority was hold by landowners, who realised, that the demand increases, prices increase, so they again and again voted for customs on grain. As the demand increased – along with prices – cus-toms were raised, and thus agricultural price level was maintained at an artificial high level. Workers needed increasingly larger amounts of salary to reach a minimum standard of living. If pecuniary salaries in-crease, profit decreases. High protective customs on grains in the end increase the incomes of landowners and decrease those of industrial-ists, what results in the slowing down of capital accumulation , what otherwise would be the engine of growth for Ricardo. This situation can be solved by the dissolution of grain customs.
The foreign trade theory of Ricardo claimed, that free trade allows consumption of more commodities for households, regardless of the actual level of development of the partners. Inter-state trade is not de-termined by relative costs of production and differences of national price levels, but it becomes desirable due to the exploitation of com-parative advantages. Ricardo’s arguments flow from the comparative advantage theory, what states that trade can be beneficial for both countries. The more specialized a country is, the more beneficial for-eign trade would be, if it only trades in goods, where it has comparative advantage. This theory states, that mutually beneficial foreign trade can derive not only from situations, where every partner has absolute advantage in terms of efficiency of production of a given product, but such can be derived if it bears no absolute advantage at all in any prod-uct, but it is suffers from a smaller development shortfall in certain products, and thus by specialisation it can enjoy in that product a com-parative advantage. The essence of comparative advantage theory is that the less developed country produces for export by means of a larg-er labour input, than the more developed partner, but even this way obtaining imported goods are cheaper, than it would be, if produced domestically. The more developed country enjoys a comparative ad-vantage in the products, where its efficiency advantage is larger, there-fore it can exploit this advantage by specialisation, and it can increase its wealth by foreign trade.

44
The theory of comparative trade advantage served to prove that two or more countries could be involved in mutually beneficial foreign trade, even if only one of them bears absolute advantage. Relative or comparative advantage wanted to prove for the country suffering ab-solute disadvantage, that involvement in international trade is poten-tially beneficial.
The consequence of the comparative advantage theory is that every country must specialize in a product and trade, where it has the larger comparative advantage. a major asset of the theory is its applicabil-ity to the international distribution of labour. Ricardo had foreseen that England would soon become the factory of the world. However, even his reasoning was insufficient to terminate grain customs, what remained in force up until 1846. (Kaposi [1995])
Observing the radical industrial development, Ricardo was opti-mistic, in spite of the apparent social drawbacks. He believed that the emerging problems would be sooner or later solved by automatisms. Rising unemployment due to the application of machines can only be temporary, what would be settled soon. This would be made possible by the cheap mechanized production, leading to cheaper products, the capitalist would be able to obtain consumption quantities at a lower price, and therefore it can save more from its profit. Savings become capital; it is accumulated, what can finance new investments, factories, leading to new employment facilities. Meanwhile aggregate demand grows with aggregate supply. There can be no general oversupply, only temporarily, in relation to certain goods. a prominent formulation of this theory can be read in the work of the French economist, Jean-Baptise Say (1767-1832) titled “A Treatise on Political Economy” (Traité d’économie politique). Say believed, that every producer produces in or-der to fulfil his needs by commodities obtained from others, therefore he denied the possibility of a general overproduction, because every seller is a buyer, and every buyer is a seller at the same time. Say stated, that the producer wants to spend the money received in exchange of his goods soon, therefore he considered money merely a tool assisting the exchange of goods. In his views therefore aggregate demand grows together with aggregate supply. This theorem has had a lasting effect on the world of economics, even up to now. (Bekker [2000])
The impacts of David Ricardo in England have marked the 19th cen-tury economic thought. His most famous followers were James Mill
45
and John Stuart Mill. His followers had seen the victory of his theory and politics in 1846, when grain customs were finally terminated.
Ricardo is often cited today, yet the world has changed...
Criticism of the theories of Smith and Ricardo Thomas Robert Malthus and his criticism of the market theory
In his 1820 work titled “Principles of Political Economy: Considered with a View to their Practical Application”, Thomas Robert Malthus (1766-1834) had denied the Say doctrine, widespread among classical economists, what stated, that every product creates a market for other goods, therefore market grows with production. This theorem seemed problematic to Malthus, because the consumption of the capitalist class is rigid, therefore it does not grow in the same extent, as the supply of consumption goods. In a pure capitalist economy, where there are only productive workers and productive capitalists, the increased produc-tion of commodities resulting from investments can only be realised, if real wages increase, what decreases profits. Decreasing profits in turn decrease accumulation of capital; therefore production increase is di-minishing, what results in unemployment. Malthus therefore believed, that non-productive consumers are needed, who does not increase the supply of goods, but by their demand raise the price level above pro-duction costs. In his views this was to be the role of the aristocracy.
When can Say’s theorem be true? If one common good is exchanged to another common good (barter). If however the exchange is realised by involving money, buying and selling is separated from each other. Malthus highlights that sales problems are commonplace at the mar-ket of agricultural products, and this served as a base for his criticism on Say’s theory.
According to Malthus, in order to diminish sale problems and to increase market stability, a consumer class is required beyond the pro-ductive workers and capitalists. Members of this class do not pro-duce and do not increase supply, but they buy and consume. By their pur-chases, they increase prices over the level of production costs; therefore the price of the good may include profits. The constant demand from this consumer class results in the stability of the market. Members would include landowners, but also the service personnel assigned to their personal needs. The maid, the instructor, the gardener etc. re-ceive money for their work, and for that they buy food. The larger this
46
third consumer class becomes, the more stable the market would be. Landowners however need to obtain sufficient incomes to be able to employ such personnel, therefore food prices should increase to make much larger profits, than they actually do.
Comments on Malthus have been highly controversial in later times. Two extreme points can be identified in the works of Marx and Keynes. Marx has called the works of Malthus scholastically superfi-cial and priestly pretentious. Keynes on the other hand believed, that if Malthus had been the founding father of 19th century economics instead of Ricardo, the world would be a much wiser and wealthier place. Keynes considered Malthus an outstanding economist, because instead of the mainstream optimism of his age – stating that aggregate demand grows with aggregate supply – Malthus realised, that growth depend heavily on demand, thus his theory preceded that of Keynes in the 20th century.
Friedrich List and the critics of free trade theories
One of the early critics of the free trade was Friedrich List (1789-1846). In his 1846 “A national system of political economy”, he contended free trade theory on logical grounds, and he had proven, that it is only beneficial for economically powerful countries, while less industrial-ized states would lag behind. He observed that during the continental blockade Napoleon excluded English goods from Europe, German ter-ritories quickly industrialized, while the termination of the blockade resulted in a flow of cheap English goods and the consequent decline of the German industry. At that time the German industry was not competitive, was still waiting for construction, and List intended to create that by means of protective customs. Factors of production are not homogenous, they are not interchangeable even within national economies, and their reallocation among different secondary produc-tions is partly time demanding and partly faces a number of bottle-necks. Future international competitiveness depends on a number of factors: changing market structures, technological development, sup-ply-demand changes, etc. Comparative advantages existing at a given time therefore cannot be considered eternal, and as such, cannot be the main standard of specialisation. The considerably lower rate of productivity increase in the agriculture compared to that in more dy-namic fields of industry must also be taken into account. From the per-

47
spective of stimulating development, technological advancement and the driving force of sectorial connections must also be accounted for.
List believed that every nation has its own specific economy. This means, that the free trade ideas of Smith and Ricardo are not applica-ble to every nation. On the contrary the theory of Smith (about buy-ing, where it is cheaper) only applies among states of equal economic weight and power. If there are two countries trading with each other, where one of them has a highly developed industry, then it can produce industrial products with a high surplus value cheaper, consequently, it can sell it cheaper to the less industrialized partner. Moreover, the industrialized country manages risks much better, since it has larger savings. The application of Smith’s theory leads to the failure of the less developed country to evolve its own industry, because its initially more expensive, lower quality products are not going to be demanded. Such a country can only sell agricultural products, raw materials, where the surplus value is lower, therefore in this trade one country gains wealth, the other becomes poorer. According to List, the conditions of produc-tion of a given product must be evaluated along with its price, when a purchase is made. It is thus possible, that buying a more expensive, lower quality, but domestically produced good is more beneficial, be-cause it creates domestic employment, offers a possibility to develop local industry, in other words it increases forces of production. The citizens of the nation must be forced to buy domestic products on their own accords: the tool for this would be protective customs on foreign goods. List also emphasized, that protective customs are only required until a sector of the industry becomes competitive. After that, prod-ucts can face the competition at the market. He fails to bypass the fact that the free trade ideology called for by Smith serves primarily Eng-lish interests. The best proof thereof is the English practice of protec-tive customs on goods, where its price levels are not competitive, for example in the case of grains.
List takes into account nations and increasing forces of production as well. Every nation has its own position and features, and the classical school disregards these. Due to the special positions, there are always certain sectors, which are more sensitive, than others, and the protec-tion thereof is the responsibility of the state. In other terms, it must limit the freedom of economic activity for the sake of the development

48
of the nation. This holds true for the less developed territories, as well as to fields relevant to the very existence of the nation, such as defence and security. The objective of state intervention is to ensure, that the economy does not only fulfils the needs of the present, but it aids living in the future as well. The easiest way to achieve that is the improvement of forces of production, because these are the sources of wealth and labour. Improvement of forces of labour is more important than actual production, therefore a certain part of these potentially available com-modities must be sacrificed for talents, potentials, capacities and forces getting more sophisticated and strengthened. The main force of pro-duction is the industry, because the industry bears the capacity and the desire to improve the situation, therefore it bears a potential to create new jobs, while the agriculture is often a rigid, traditional structure, what is not capable of further development after a given point. This theory holds the seeds for the surplus value theory.
Protective customs are not worth for every nation, because each has its own specific situation. The only reason for protective customs can be to strengthen industry. Where it is impossible, only poverty would in-crease. He rejects customs in agriculture, because this sector depends on natural surroundings, and there is no use in raping the nature. In-dustry depends on physical capital, but also on intellectual resources, consequently it can be located anywhere. Although List introduces the notion of intellectual resources, he still considers financial profit the only relevant factor of productivity.
The protectionist system of List should not be confused with autar-chy, what is an attempted self-provision system. List only intends to develop certain sectors, if the conditions are given thereof, and after a development period he would terminate the protection, and would introduce the product in the competitive market of free trade.
His theory on infrastructure is pragmatic, like his other observa-tions. He maintained, that development is only reasonable, if it makes profit for the whole country, and not just to a specific region, otherwise the region getting wealthy would drain the resources of poorer regions of the country, and therefore it fails to increase the overall wealth of the country.
Partly due to his experienced life, List does not hide in theoretical orthodoxy. The most important proof of this is that he does not re-

49
ject Smith’s theories, just limiting their scope. His theorems are always flexible; one of his implicit premises would be that measures should always respond to the actual circumstances. He boldly uses histori-cal examples for his reasoning, therefore he can also be considered as a forerunner of the historical school.
Among the main objectives of protectionism one finds the protec-tion of domestic producers and the strengthening of local markets. a number of positive historical examples support the beneficial im-pact of reasonable national economic policy, structural policy and ex-port oriented development to national income level, growing exports, strengthening positions and competitiveness at the world market. The rise of Germany and Japan in the world economy from the 19th century and after World War II or the blossom of the Asian tigers (South Korea, Taiwan, Singapore, and Hong Kong) are all good examples thereof.
Neoclassical economics and general equilibrium theories
From the 1870s, several new tendencies unfolded in economics. One of those was the Austrian school (Vienna), what focused on the psy-chological motivations behind economic activities, or the mathemati-cal school (Lausanne), what was looking for mathematical functions in trade. These new schools are also called together marginal utility school. They conducted their examinations by the road paved by the classical thinkers (Adam Smith, David Ricardo), and their activities served as a basis to new (macro) economic ideas. The fundamental building brick of these new theories is the principle of diminishing marginal utility. The main representatives were W. Stanley Jevons (1835-1882), Karl Menger (1840-1921), Léon Walras (1834-1910) and Vilfredo Pareto (1848-1923).
They focused on the observation of the market equilibrium. They are as optimistic about the operation of market mechanism, as Ricar-do is. Market mechanisms secure full employment, and the demand grows with the supply. a general crisis of overproduction is impossible, and employment must be full as well. Later Keynes called this school Euclidean, because they formulated all their theorems under the as-sumption of full employment. Every market actor is price recipient, inasmuch as it faces a determined price. The system of the distribution of incomes is given along with the scale of preferences of economic actors, what serves as a standard for everybody to optimize their situ-ation.

50
The notion of marginal utility leads back to the laws of H. H. Gossen (1810-1858) on needs satisfaction. The work of Gossen (Die Entwick-lung der Gesetze des Menschlichen Verkehrs und der daraus Fließenden Regeln für Menschliches Handeln, 1854) was not recognized by his con-temporaries, and was only drawn to the attention of economists by Jevons after his death. The concept of marginal utility had a dominant effect on the future development of economics. Beyond value theory, price and income distribution theories gained new foundations by this idea.
The starting point for neoclassical thought was the examination of the motivations of the economic actors (worker, capitalist, and entre-preneur) for the actions. All of them want to optimize their situation as much as possible given their circumstances, what is achieved by gaining a maximum level of aggregate utility. In order to understand maximum utility, the concept of marginal utility is introduced. Ac-cordingly, if someone buys something at the market, than the inten-sity of the demand for that good decreases, since the demand would be satisfied sooner or later. This is the law of diminishing utility, and utility of the last bought good is the marginal utility. When someone buys something, he gains utility, but also sacrifices utility, because he could have bought something else for his money. The marginal utility of the last bought piece is larger for those, whose financial income is smaller, because they can buy less for their money. On the contrary, in case of higher incomes, the marginal utility of the last piece is going to be smaller.
The worker sells his free time in exchange of his wage. In this pro-cess he gives up more and more free time in exchange of more and more money. The limit of employment would be the point, where the utility of free time is bigger, than the amount of wage increase achieved by its sacrifice.
For the determination of demand functions of factors of produc-tion changes of labour and capital were used, inasmuch as technical advancement was taken constant. This has the following results on labour, if the other factor is left constant: in case of a given capital stock, increasing employment would increase productivity for a while, and then it increases with diminishing returns. Since every worker receives the same amount of real wage, optimal employment equilib-rium is reached where the increase in production is still greater than the increase in paid wages. If the productivity of capital surpasses the

51
current interest rate, then the profit increases, otherwise it is better to keep the money in a bank. Obviously, if the interest rate decreases, the demand for capital grows. (Ivicz-Schlett [2001])
Neoclassical economics are based on the assumption that market actors, companies and consumers, according to their characteristics, wish to rationally optimize their situation. Companies are reduced to the production function, while consumers are characterized by the utility function. The pursuit for their needs is open and honest. This model does not calculate with human opportunism (cheating or misleading others). Information flow has no costs, what suggests all-knowing market actors. Freely available market alternatives protect market actors from their partners’ unfair treatment. The identity of market actors is irrelevant in this model. Faceless buyers and sellers meet to exchange standard goods at an equilibrium price. Institutions are given, and they do not influence economic processes. Notably, the representatives of these ideologies rely on artificial apprehension of human beings, as well as observations on the operation of artificial economic structures.
Moralities have to be accounted for even in such abstract model of economics. Traditional modern economics denying the measurable nature of utility and the comparison of utility between individuals, can only discuss social wealth in terms of the Pareto principle: if the welfare of individuals increases, while others’ welfare does not de-crease, social welfare will increases. Social welfare is Pareto optimal at a point, where individual welfare can only be increased by decreas-ing that of someone else. Such Pareto situation can be found in any system of income distribution, because the curve showing the social production possibility frontier can be crossed at an infinite number of points by the social indifference curve, depending on actual distribu-tion structure.
Abram Bergson (1914-2003) and later Paul A. Samuelson (1915-2009) attempted to find a solution for the dilemma of optimal situations by introducing an external factor, moral judgment into this theoretical model. According to this theory, the starting point of the discussion for the variables of the economic system is a function, which is char-acterized by certain ethical considerations. a theory is thus required, what makes a clear decision possible in the question of whether an economic system is better, worse or indifferent compared to others.

52
Subsequently, Tibor Scitovsky (1905-2002) American economist of Hungarian origins envisaged the solution in the establishment of a double criterion that would be able to grab the welfare effects of a change in the economic policy, regardless of changes in the circum-stances of income distribution. According to this double criteria, social welfare increases if the beneficiary of a change in the economic policy can compensate the adversely effected, but these adversely affected are unable to corrupt beneficiaries. Many contested this reasoning later, like M.D. Little, who had pointed out, that this theory only implies in-crease in social production, but fails to assess whether the new income distribution circumstances have managed to increase social welfare or not.
It can be concluded, that neoclassical theoretical ideas generated several new problems. They have further enhanced the understanding of economics by an ever-wider expansion of the optimisation-result maximisation principle. (Mátyás [1993])
Critics of neoclassical economics German historical school
The German historical school was founded as a counterpart of the classical theories in German territories. As it was seen earlier (List, Thünen), economic thought passed a different route in German ter-ritories, therefore it had different traditions. Empirical and inductive perspectives dominated the works of German thinkers, instead of deduction and an abstract approach to economics. While early his-torical school (main representative: Wilhelm Roscher, 1817-1894) re-sponded to English classical teachings, the new school (led by: Gustav Schmoller, 1838-1917) contested neoclassical ideas.
Their critical approached focused on the economics separated from other phenomena, while the economy forms an integral part of the so-ciety. Economics is the field of action not just for economic forces, but moral, cultural, psychological ones as well. Classical thinkers disregard all these. Their other objection is that economic actors are moved by an unchanging motive; therefore these works lack a historical perspec-tive. They believed that every available economy must be examined in every historical period, including the non-economic circumstances as well. This is the way to know the operative forces of a given period,

53
in the economy of a given country. Subsequently, the results achieved in different fields must be compared, and if one finds common ele-ments, regularities, then these can be accepted as common organising principles. Economic action is thus taken among general laws and lo-cal, national characteristics as well. The economist ought to examine past economies, because that is the way to chart the operative forces of previous ages. If today one finds similar circumstances today, then one can assess the consequences thereof. According to Roscher, he learned the most from Thucydides. Just like his forerunner, Schmoller identi-fies as the main task to describe all operative changes of all operative factors. The results must be recorded, and sooner or later this will es-tablish a theoretical system.
The historical school questioned the exclusive reliance on deduction, and it emphasized the need for a historical and statistical perspective. It rejected the existence of unchanging natural laws of economics, it focuses on the relations among theories and institutions, and it shows, that different ages and countries demand different systems. They failed to establish an independent theoretical system, what they justified by the sheer number of factors in the economy, that cannot be assessed adequately (e.g. the scientific psychology of various nations).
Institutionalism
The German historical school had its impacts shown in the United States as well. The development of economy follows the changes of the institutions. Institutions in turn change, because in their fight for survival, circumstances keep on changing. The economical motives, consumer habits of individuals are all derivatives of institutions, and change along with those. Two emblematic representative of this school was Thorstein Veblen (1857-1929) and John Kenneth Galbraith (1908- 2006).
Galbraith criticized the neoclassical thought of his age, because it observed an economy only existing at the beginning of the 20th cen- tury, because the relevant institutions existed only at that time. How-ever, the reality was that the huge companies which operated in the economy cannot be run by a classic entrepreneur; instead pro-fessional specialisation becomes more relevant, and technocracy re-places the entrepreneur. Another significant change would be that this

54
techno-structure intends to conquer the market, in order to avoid adjusting itself, although in textbooks the company adjusts to market conditions. One of his important insight suggests, that earlier it was near impossible to manipulate consumers, but today there is a whole industry called marketing in pursuit of this very goal. Regardless of this fact, economists still rely on consumer sovereignty. Free time is becoming less important for workers, because they want to purchase more in this consumer society. Corporate enterprises also want to be-come independent from financial markets; therefore, they raise their own financial funds, and use that to finance their investments. It is also untrue that the entrepreneur aims for profit maximalization. This was only true until the enterprise aligned with the market conditions. Today it does not face the challenges of the market; its goal is to pre-vent its power and autonomy.
The founder of the institutional school was Ronald H. Coase (1910-), and another major representative is Oliver E. Williamson (1932-). They viewed action as determined action, and created an independ-ent theoretical system. Williamson’s result is the theory of transaction costs. His arguments stem from the institutions not being neutral in-stead they influence economic processes. Classical economists believe that the market is a form of co-ordination of production, although the major part of this co-ordination does happen within the company. What is the reason of their tendency to forget that the operation of the market has its own costs, that it is subject to transaction costs? This reason can be an assumption of ideal persons, who were driven by perfect rationality. This person knows the alternatives of his actions, his possibilities. He knows, what road leads to what result. Besides, he follows his interests, which means that he intends to achieve his goals in a simple and honest way. He uncovers his goals and conditions to his partners. Coase suggests to the contrary, that real people must be accountable, are characterized by a limited rationality and have a lim-ited knowledge of their own possibilities. Moreover such people are also opportunistic, meaning here that they want to keep their condi-tions and information secret, or even to mislead their partners. These all result in transaction costs. People need to have perfect information on the products, the quality and the price thereof. The vendor must search for its customers, and vica versa. Contracting is also complex: a form of contract has to be chosen, execution of the obligations must
55
be controlled, in case of a disagreement; litigation costs must also be paid,costs of protecting the property may emerge. (Coase [1960])
We may finally conclude that the American school – similar to the German one – drew attention to the weakest points in classical and neoclassical ideas, and made major corrections thereto. The largest service of the American school of economics in general was deepening empirical research, and supplementing theories with statistical data, which helped the quantitative analysis of relations between produc-tion, supply and demand.
.. Background and motivation of the second tide of globalisation
Technological preconditions of 19th century globalization were the invention of steam locomotives, steam ships, development of railway systems in transportation and use of telegraphs and even telephones in telecommunication. Use of steam engines made mass production possible for the first time in manufacturing as well as in agriculture.
During the 19th century transportation and communication tech-nologies developed rapidly. Development of railway systems connect-ed those parts of the continents into a network of trade and commerce, which previously were separated. Railways made development possible in the Far West of the United States and have started economic devel-opment in Central Europe, in the Balkans and in Russia as well.
By the second half of the 19th century, development of telegraphs and later telephones revolutionized communication, and largely con-tributed to the development of international trade and international investments. This telecommunication revolution allowed the estab-lishment of affiliated companies abroad – and this was the very begin-ning of the recent transnational companies.
Naturally, technological developments alone aren’t enough to ex-plain globalization during the 19th century, it is important that we could see the political will of globalization and the role of development of the legal system as well.
First of all, we have to mention the ambitions of the European pow-ers to build colonies. Colony building has paved the way forinterna-tional trade and investments by bringing political stability and a stable legal system to the overseas colonies.

56
Second, it is important that liberal, free-trade ideas of British econ-omists were more and more accepted during this period, and during the second half of the 19th century the protectionist ideas of Friedrich List and Alexander Hamilton have lost their influence. Trade barriers and customs have diminished over the century, at least until the Great Crisis of 1873, when protectionism suddenly became popular, and im-port duties increased again. However, this protectionist wave was only temporary, and at the beginning of the 20th century, liberalism has gained ground again.
The magnitude of the increase of world trade is shown by the fact that world trade has increased between 1830 and 1910 from 710 mil-lion USD to 10 462 USD in current prices (Benichi, 2003). Geographi-cal distribution of world trade was very uneven, international trade was focused in Europe (60-62% of exports originated from Europe).
Third, there were also important legal innovations during this pe-riod, which helped globalization. In the 19th century the laws on econ-omy have also has been profoundly liberalized.
David Landes (1969) has described development of the legal system of the 19th century, as one to permit accumulation of more capital and the creation of more efficient enterprises.
At the beginning of the 19th century, guilds have been abandoned and freedom of enterprise has been accepted, and from the middle of the 19th century shareholding companies were allowed to be estab-lished without a royal permission – this also has increased freedom of entrepreneurship. In Britain the Bubble Act, which forbade foun-dation of shareholding companies was repealed in 1825. Until 1825, incorporation still required a special charter, but in 1844 this rule was also abolished and no permission was needed for funding sharehold-ing companies.
In Continental Europe adoption of the Napoleonic Codes, the Code Civil and the Code de Commerce were important preconditions of economic development and globalization. Code Civil distinguished three main types of business organisations, as
– simple partnerships, in which partners were individually and collectively liable for all debts of the business,
– société en commandite, limited partnership, in which one active partner or active partners assumed unlimited responsibility, as other partners risked only the amounts they actually subscribes,

57
– and société anonyms, corporations, with limited responsibility of the owners.
As in the case of société anonyms, the owners could remain truly “anonymous”, it later has paved the way for foreign investments, as it was not generally known who the owners of a company were. This ano-nymity has already foreshadowed the principle of “national treatment” at the end of the 20th century, which has prohibited distinguishing between foreign and locally owned enterprises by government acts.
It is also important to note that these modern legal solutions have very rapidly spread all over Europe and laterthe world. European coun-tries, the USA and the newly independent Latin-American countries voluntarily implemented these innovations, while in Eastern Europe, or in Latin America, and in the Colonies, in Africa, and in Asia, these innovations were introduced by force.
In Great Britain, the Bubble Act was repealed in 1825 but it was only in the 1844 Joint venture companies Act that the registration and incorporation of companies was permitted without specific legislation. In France, creation of the first “Société a resposibilité limité (SARL)” became possible after 1867, and all limitations on SARLs were abol-ished in 1867. In Germany (more precisely in Prussia), automatic reg-istration of companies was introduced in 1870.
Interdiction of usury was lifted in Great Britain in 1854, in Holland in 1857, in Belgium in 1865, and in Pruissia in 1867 (sees Landes, 1969).
Colonisation has largely contributed to the globalization in the 19th century, as it has spread the modern and universal legal system all over the world, has demolished custom duties and financial barriers between colonies and mother countries and has spread (more or less successfully) European value systems to the Colonies in Africa and in Asia.
An international financial system also helped international pay-ments and international investments. The gold standard system had given great flexibility to the international monetary system, facilitating current account balance operations (payments for import and export, spending of tourists, and all other international monetary transfers, including repatriation of profits). All major nations of the world were more or less part of the Gold standard system by the end of the 19th century, and naturally, the colonies also have belonged to this system.

58
.. Scope and structure of the second wave of globalization
International trade
Foreign trade in the 19th century focused on Europe, other continents did not have important trade between each other, only by the begin-ning of the 20th century did the USA begin to join in with the other countries more intensively.Foreign trade of Europe has increased from 1830 until 1910 from 645
million USD to 8646 USD. More than 65% of this trade was between European countries, 8-8% went to North and Latin America, 10% to Asia, and 5% to Africa.
– Beside the use of new technologies, like utilization of steam en-gines, a major increase of foreign trade was made possible by lib-eralization.
– At first, in the 19th century, restrictions of using foreign ships for international transportation had been abolished first in Britain, then in other countries as well.
– At second, Great Britain has repealed its Corn Law, which has levied high tariffs on imported bread grains, and other countries also have reduced import tariffs later.

59
– At third, bilateral trade agreements were signed between devel-oped countries. The Cobden-Chevalier Anglo-French Treaty in 1860 has abolished in Britain import tariffs on all French goods, except for wine and brandy, and France has removed prohibition of import of British textile and largely reduced tariffs on British products generally.
It is important to note that the Cobden-Chevalier treaty has includ-ed the most-favoured-nation clause, what is the basis of the modern commercial law. This means that if one party negotiated a treaty with a third party, the other party to the treaty would automatically benefit from any lower tariffs granted to the third country.
In the 1860s, France negotiated commercial treaties with Belgium, Germany, Italy, Switzerland, the Scandinavian countries, and other European countries also have negotiated similar bilateral trade agree-ments with each other. The new lower tariffs have contributed to the further increase of foreign trade after 1860.
An important new phenomena was – as Rosenberg has stated -- the emergence of a “truly worldwide agricultural division of labour...” as by the end of the 19th century rapidly growing population of Europe were importing more and more foodstuff from North America, Aus-tralia, New Zealand and from Latin America (Rosenberg, 1982). This is the time when Latin America has started to specialize to food produc-tion for European export – and this process was abruptly broken in the 20th century, during the Great Depression and by World War II. However at the end of the 19th century globalization of agricultural market was proceeding rapidly, integrating peripheral countries into world Economy.
In 1873 a great economic crisis broke out and the following depres-sion has temporarily changed the tide and at the end of the 19th century protectionist measures were introduced again by the European coun-tries, which have caused the temporary slowdown of world trade, but trade has recovered already in the 1890s (see Cameron, R. Neal, L. 2003).
There is not a full agreement among historians and economists about the importance of this temporary protectionism and about the “slowdown” of globalization. Cameron and Neals wrote that the im-portance of increasing protectionism after 1873 is often exaggerated, and they have concluded that the “world economy at the beginning of

60
the 20th century was more integrated and interdependent that it had ever been, or would be again until well after World War II”.
At the other hand, Angus Maddisons’ (2007) calculations proved the slowdown of globalization. As it was seen above, the “rate of glo-balization” can be measured relatively easily by the ratio of the growth of world trade to the growth of world GDP. This ratio was extremely high: 4.4 between 1820 and 1870, but after 1870 it slowed down to 1.6, what means that 1873 really was an important turning point of 19th century globalization. In any case, this protectionism has no influence on the international trade of foodstuffs, as Western European coun-tries were too highly dependent on food import from overseas.
It is interesting that the temporary increase of protectionism in Eu-rope has contributed to the development of the “other leg of globaliza-tion”, foreign investments. Evidently, when import duties and tariffs are higher, it might be profitable to set up a company abroad and in this case the products of this company are regarded as local products and don’t have to pay import duties. Naturally, this method can be used only in case of manufacturing goods. At the end of the 19th cen-tury some companies were already set up abroad just in order to avoid paying tariffs, though it is true that this practice was not as widespread then, as it was later in the 20th century.
International investments
One of the most important characteristics of 19th century globalization was the very dynamic development of international investments. The increase of international capital flow was much more rapid this time than the growth of world trade. Stock of foreign investments increased between 1830 and 1913 from 1 bn. USD to 48 bn. USD (Benichi, 2003). It is important to note that nearly 80% of foreign investments were port-folio investments, investments in government bonds or in shares, but without having control in the companies whose shares were obtained.
Definitions of the two fundamental types of foreign direct investment: foreign direct investment (FDI) and foreign portfolio investment
International capital movements may take essentially two forms:
– those not involving the acquisition of ownership rights; and – those involving the acquisition of ownership rights.

61
Capital movements failing to vest the investors with ownership rights include primarily international credit transactions, buying cor-porate or government securities as well as non-refundable interna-tional grants-in-aid, while capital movements establishing ownership rights include diverse forms of international investments. From among international capital movements, this study undertakes the discussion of international investments.
Foreign investment is divided into the following two major classes:
– foreign portfolio investment; and – foreign direct investment (FDI).
When a portfolio investment is made, an investor purchases foreign public securities or securities issued by companies, without making efforts to use his ownership rights to bring the foreign company un-der his control. When it comes to foreign direct investment, however, the investor wishes to use his ownership rights acquired in a particu-lar company for taking control of it. Thus portfolio investments are driven primarily by a mere pursuit of a profitable investment of sav-ings, while by gaining partial or total control over foreign enterprises, direct investments tend, in a number of cases, to reach further goals – in addition to making a profitable investment, of course. Such goals may include, among others, the utilization of cheap local labour, the establishment of firm supplier relations, or in other cases, penetration into a closed market.
Four fundamental groups may be differentiated within foreign direct investments:
– establishment of a new enterprise abroad,– purchase of an ownership share in quantities to provide control
over an already existing foreign company,– re-investment of a foreign company’s profit,– loan extension or the increase of capital stock, transacted between
a parent company and its affiliated firm abroad (inter-company loan).
Statistical data issued in diverse countries differ in many ways – for instance in the limit above which foreign participation is considered

62
as foreign direct investment or the inclusion or exclusion of profit re-investment (e.g. in Hungary and in the other Central European coun-tries before 1997) and loan extension between parent companies and subsidiaries. In the majority of cases the ownership limit is set at 20%, but there are countries where already 10% held by a single foreigner is considered as foreign direct investment, while again other countries fix this limit at higher than 20%.
The majority of investments originated from Europe, from the UK, France, and Germany, but by the end of the 19th century, the USA has also transformed from a capital importer country to a capital exporter one.
Aims of these investments were first of all to control production and transportation of the resources in the colonies, then to increasethe political influence of a country in a faraway part of the world through investments, and third, to realize higher profits than at home. Since after the crisis of 1873 tariffs and import duties were increased by most countries, this gave a new impetus for foreign investments aiming to obtain important resources abroad.
Foreign investments – besides buying government securities – largely went into infrastructure – transportation and storage – then to the mines, plantations, and less than 10% to manufacturing.
Geographical distribution of foreign investments is also interesting. More than 40% of all foreign investments in 1910 arrived from Great Britain, altogether 20 billion USD at current prices. These investments first targeted continental Europe, British investors bought government bonds and invested in railway projects. After the revolutions of 1848, British investors turned away from Europe and started to invest heav-ily in North America, Latin America and in the British colonies.
French foreign investments in 1910 were estimated at 10 billion USD level, and mainly targeted the neighbouring countries. French invest-ment arrived to Portugal, Spain and to Italy, but by the end of the 19th century, French investors’ interest turned more and more toward Rus-sia and the French colonies. This changing attitude can only be ex-plained by political causes – by the rapprochement between France and Russia and by the colonization of Africa and Indo-China.
Germany attracted foreign investments during the 19th century, but at the same time, German investors invested abroad, too. German investors mainly targeted the neighbouring countries.
An important development of foreign investments was possible during the 19th century, because of the favourable legal and political

63
conditions. Inflow and outflow of investments were not controlled in Europe and in North and Latin America, and barriers to foreign in-vestment were demolished by colonization of large parts of Africa and Asia.
European countries and the USA during the 19th century, estab-lished a largely universal legal system all over the world, which made possible the free flow of investments between different countries. By the end of the 19th century, practically all countries of the world were part of the system based on the free flow of international finances.
Foreign investments and politics were closely interconnected. French investments in Russia – buying state bonds, investing in rail-way projects and even in manufacturing enterprises – were the conse-quences of political rapprochement between France and Russia.
Banks were important players and movers of foreign investments. Joint stock banks were funded in France, in Germany, in Italy, in Bel-gium, in Austria and in Hungary, and were very active in the field of international investments. In France, in Germany, in Austria and in Hungary banks often invested in agricultural, mining and manufac-turing ventures, often using funds from abroad.
As it was already noted, a temporary increase of protectionism after 1873 also contributed to the foreign investments, as by creating a com-pany abroad the higher import tariffs could be avoided. However, it is important to underline that this was possible only because profit repatriation was not controlled and currencies were freely exchanged under the Gold Standard System during the 19th century in the “civi-lized countries” – and in the “non-civilized countries” the same legis-lation was applied after these countries were conquered and colonized. This is how some textile and other manufacturing factories were set up e.g. in Russia by French entrepreneurs, or how British investors set up machine building factories in Hungary and elsewhere.
Regarding the profitability of the foreign investments during the 19th century, the picture is very mixed. Susan Berger (2003) has pre-sented in her book on 19th century globalization the debates in France at the beginning of the 20th century about economic consequences of the capital outflow from France. The critiques of French capital export have pointed out the capital outflow slowed down the economic de-velopment in France, and Berger added to these arguments that large parts of these investments were lost forever during and after the First World War – mainly in Russia and in Asia.

64
International migration
During the 19th century, movement of people was also very impor-tant. Between 180? and 1914 more than 50 million Europeans left the continent and moved to the USA, Latin America, and to the colonies in Africa and Asia. Immigration to Europe was negligible at that time. This important movement of people has contributed to the spread of European values all over the world, and unsurprisingly the two impor-tant European legal systems, the British Common Law and the Code Napoleon also dominated the world. Even independent “emerging countries”, like Japan or Siam, have tried to take over these values and legal systems.
Governments and globalization in the 19th century
State intervention in economy was rather limited in the 19th century, as state redistribution did not reach generally 10% of the GDP and in international trade, liberal free trader mentality ruled. On the other hand, globalization in the 19th century was largely promoted by ac-tions of European and North American governments through colo-nizing Asia and Africa by the UK, France, Belgium, the Netherlands, Germany and Italy, and through politically influencing Latin-America by the USA.
Colonization meant that under-developed countries were occupied and governed by representatives of European governments, who in-troduced modern legislation in the colonies in Africa and Asia. These legislations made possible the creation of modern companies and fa-cilitated investments from abroad. Tariffs and custom duties were also highly reduced or even abolished between the colonizing power (le Metropol, in French) and the colonies.
Even in case when an underdeveloped country was not colonized, like in case of Japan, China or Siam, European countries (and the USA also at the end of the 19th century) often used military pressures to force opening at least some harbours for European traders. The “Opi-um Wars” of Great Britain against China or the naval demonstration of Commodore Perry of the US Navy in Japan are good examples of these pressures.
Colonizationmeant that the legal systems of the European countries were implemented in the colonies and they largely helped increasing
65
the economic influence of these countries all over the world. Globali-zation largely spread all over the world during the 19th century by colonization.
While globalization arrived by colonization to Africa and Asia, between independent countries there were bilateral and multilateral customs and tariff agreements, which have contributed to the develop-ment of globalization.
Political treaties or even official visits of certain rulers in the capital of another country have also boosted foreign trade and even foreign investments between different countries. Visit of the Russian tsar in Paris and the close political cooperation of the French and Russian governments at the end of the 19th century, also contributed to the development of trade and foreign investments between the two coun-tries.
It is interesting to note that even the most beautiful bridge of Paris, the Pont Alexander has also contributed to the sales of Russian gov-ernment bonds among French investors – who have naturally lar- gely lost their investments after the Russian Revolutions in 1917. The bridge was named after the father of the Russian tsar Nicolas II, after his visit to Paris in 1896, in order to symbolize Russian-French friend-ship.
.. Effects of the second tide of globalization on different countries
Looking back at the 19th century, you can see that the globalization was very rapid, international investments increased much quicker than international trade and it also increased more rapidly than the global GDP. International migration was also very important during this period. Western Europe was the main exporter of manufactured goods, capital, and people to the rest of the world in the 19th century; though by the turn of the century the USA also became an exporter of goods and capital. Latin America, Africa and Asia have exported in exchange raw materials (agricultural and mining products) to Europe and to the USA.
Economic interrelations between different countries increased rap-idly in the 19th century, and until the outbreak of the Great War, near-

66
ly everyone was convinced that economic cooperation of the countries would make war impossible forever. Who would destroy infrastruc-tures and industrial capacities in another country, if these capacities are largely owned by our citizens, our banks, and our companies, they asked.
The second globalization of the 19th century, seemed to be so strong even in its last days and it developed so rapidly that Norman Angell, a British economist and columnist of the prestigious London based paper, The Economist published in 1910 a book (Angel, 1910), in which he maintained that war was already impossible is Europe because of the strong economic interdependence among the nations of the conti-nent.Obviously, this prediction was proven false in 1914.
Reliable or at least acceptable statistical data on economics are avail-able only from the early 19th century, largely due to the comparative statistical calculations and estimations of Angus Maddison. These es-timations are obviously not precise to several decimals, for example in relation to economic growth or population changes; nevertheless, they offer a good starting point for the assessment of differences in develop-ment among certain regions and countries.
According to the calculations of Maddison (1995), economic growth concentrated to Western Europe and its so-called offshoots (USA, Canada, New Zealand and Australia) in the 19th century. The driving force of technological advancement in the first half of the 19th cen-tury was the United Kingdom, this was the source of new technolo-gies spreading all over the world. Meanwhile, as Maddison wrote, the United Kingdom was the target for one quarter of the world’s export, mainly agricultural products and raw materials, while the country was primarily exporting industrial goods. The UK further strengthened its economy by becoming the largest service provider of various trade related services (primarily in the fields of navigation, insurance, and financing of navigation).
Per capita GDP growth of different regions of the world in the 19th century (%)
1820-1870 1870-1913
Western Europe 1 1.3
Western Offshoots 1.4 1.8
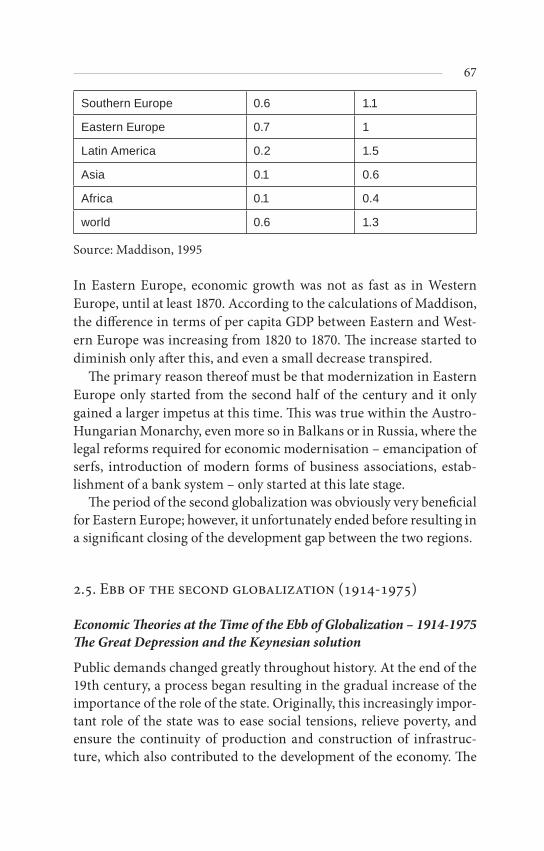
67
Southern Europe 0.6 1.1
Eastern Europe 0.7 1
Latin America 0.2 1.5
Asia 0.1 0.6
Africa 0.1 0.4
world 0.6 1.3
Source: Maddison, 1995
In Eastern Europe, economic growth was not as fast as in Western Europe, until at least 1870. According to the calculations of Maddison, the difference in terms of per capita GDP between Eastern and West-ern Europe was increasing from 1820 to 1870. The increase started to diminish only after this, and even a small decrease transpired.
The primary reason thereof must be that modernization in Eastern Europe only started from the second half of the century and it only gained a larger impetus at this time. This was true within the Austro-Hungarian Monarchy, even more so in Balkans or in Russia, where the legal reforms required for economic modernisation – emancipation of serfs, introduction of modern forms of business associations, estab-lishment of a bank system – only started at this late stage.
The period of the second globalization was obviously very beneficial for Eastern Europe; however, it unfortunately ended before resulting in a significant closing of the development gap between the two regions.
.. Ebb of the second globalization (-)
Economic Theories at the Time of the Ebb of Globalization – 1914-1975 The Great Depression and the Keynesian solution
Public demands changed greatly throughout history. At the end of the 19th century, a process began resulting in the gradual increase of the importance of the role of the state. Originally, this increasingly impor-tant role of the state was to ease social tensions, relieve poverty, and ensure the continuity of production and construction of infrastruc-ture, which also contributed to the development of the economy. The

68
two reasons are apparently in close connection, since further increase of social tensions would have hampered the continuity of production, which in turn endangered market competition. More over the unrest encouraged at the political field the then appearing left wing move-ments, which all justified the social legislation of Bismarck in Germa-ny regulating work time and conditions. Meanwhile in England the in-creasing power of trade unions resulted in some progress in this field.
In Bismarck’s Germany, an economist called Adolph Wagner de-clared around 1890 that the ration of state expenditure increases in the utilization of national income. This theorem became known as the Law of Wagner. This law not only states that public expenditures increase with the GDP, but also that ratio of public expenditure is in-creasing even within the GDP growing generally exponentially. Wag-ner thought that the reason for this is the increasing role of the state in social policy, administration, defence and welfare activities, not just in terms of value, but also in proportion to the national income. Today these are supplemented by emphasizing – or criticizing – the social security, civil defence, environmental, economic and financial devel-opment.
War economy during World War I further increased state interven-tion, although we can only understand this as a subsidiary function of governance, since the Keynesian theoretical foundations of an inter-ventionist economic policy were not yet formed. The first really active interventionist state in the development of the 20th century, states was the Keynesian welfare state.
During the economic crisis of 1929-1933, when goods, labor, and stagnant productive capital of the capitalist economy all went into per-manent and exaggerated capacities, several earlier economic models failed. Such was the model supposing an equilibrium point between aggravated supply and aggravated demand, and the doctrine of J. B. Say, stating that every supply creates its own demand.
Following from lessons learned in the Great Depression, the ques-tion of state intervention became urgent. According to these lessons of the economic depression the English economist, J.M. Keynes called for widening of the economic role of the state. Analyzing the connection of employment, interest rate and money, he pointed out that the state can have an important role in the ultimate redistribution of incomes, and by means of state investments, by developing infrastructure and public services it can also increase production and consumption.

69
John Maynard Keynes argued in the 1920s that the uncontrolled market economy was rushing to its doom, because it had been unable to diminish the increasingly wider amplitudes of the development cy-cle, in other terms the overproduction crises.
He believed that consumption increase does not keep up with the increase in production and incomes, because the higher the income level becomes the larger the marginal propensity to save becomes. This means that people save an increasingly larger portion of their supplementary incomes, thus the savings gap increases. The savings flow through the banks into production, increasing further the sup-ply, which leaves consumption behind, and an overproduction crisis breaks out.
Keynes argued that a large consumer must be inserted, who is not involved in production, and who locks up the majority of savings, and spends it in a non-productive manner. This large consumer, this un-productive actor is the state, which takes away a part of the incomes in the form of taxes, and it invests in infrastructural investments, social policy, etc.
After the Great Depression of 1929-33, President Franklin Delano Roosevelt introduced his New Deal program, which was a practical implementation of the ideas of Keynes. He raised taxes and spent the income on public works, constructed motorways, but this was also ap-parent in the regulation of the River Tenessee or the construction of the Hoover Dam. He introduced mandatory social security and un-employment benefits. In sum, he saw a way out of the crisis not in aus-terity, but on the very contrary, on raising the standard of living and increasing demand. The most important tool of intervention was the fiscal policy.
A cornerstone of Keynesian ideology is that large polarization of in-comes is harmful for the growth of the economy. The reason for this is the small aggregated consumption of the rich, compared to the many poor, while aggregated savings of the rich leaves far behind the aggre-gated social savings achieved from the same amount of GDP in case of a more egalitarian redistribution. In other terms, the aggregated consumption of a wide middle-class is far bigger than the aggregated consumption of the many poor or the many rich of a polarized society, supposing the same amount of GDP in each case.

70
The basic problem for Keynes was the low level of consumption, which hampered market realisation of social production. Keynesian policy is also called anti-cyclist, because the objective was to narrow the amplitudes of the economy, while securing a maximum of growth tendencies. If the economy slowed down, the state could speed up by subsidiary deals, and if inflation rose, the state could “cool off” the economy by means of cutting expenditures and raising taxes and in-terest rates. (Mátyás, [1993])
After World War II, many Western European countries saw an in-creasing role of the state alongside this conception. As a result of last-ing growth, institutionalized welfare benefits have been introduced beyond the active participation of the state.
The government gained a new function to maintain and widen the market sphere in order to neutralize the anti-capitalist movements set-ting foot in many Western countries alike. The objective was to limit the adverse impacts of market processes, such as unjustified income inequalities or monopolies.
In post-war Europe, the need for reconstruction further strength-ened state intervention in Europe. Market failures became interesting for theoretical economists as well. They focused - beyond political and social problems - on economic efficiency, examining, what factors cur-tail a more efficient distribution of resources.
The following reasons or market failures were identified:
– the existence of public goods, what can be consumed by any indi-vidual, and their consumption is not rivalling, therefore the mar-ket supply of these cannot be organized,
– monopolies, oligopolies distorting the market,– externalities, deciding whether an enterprise means advantage or
not for its contractual partners,– asymmetrical information of market actors (see: doctor-patient
relation).
These flaws in the market a narrow sense cause productivity loss. In a broader sense, unjust or unfair situations created by market process-es are also called market failures.
Classification of goods entered mainstream economic literature. These examinations focused on the identification of fields from where the state can withdraw without problems.

71
The development of welfare states was based on a significant eco-nomic growth, whereas the state considered securing a sustainable growth a primary objective. Therefore, investments were encouraged along with job creation. Increase of market demand was fuelled by conjuncture, increasing incomes and state orders. State investments, widening public services and social expenditures of the state could be financed from the increasing growth rate, from the growing tax in-comes.
Beyond the fundamental financial needs, making a living (feeding, clothing, habitation), quality elements of welfare started to become more important. a sense of social security and the trust in worthy future have been such important quality elements. This resulted in a changing role of the state with new priorities, such as health care, education construction and development of public infrastructures.
Along with the increasing role of the state, GDP redistribution also significantly increased in these countries. The ratio of the central budget in financing finally reached 40-50% of the GDP from a 35% rate seen in the early 20th century. Welfare expenditures reached 28% of the GDP in OECD countries, wherein 9% was transfers to elderly people, 8% to transfers of non-elderly people, 6% for education, 5% health care. Increasing redistribution proved beneficial for a while, en-couraging economic growth and aggregated demand. Increasing cen-tralization of national incomes, however, resulted in increasing taxes and other state withdrawals; therefore sooner or later it was to become a bottleneck for the growth of the economic activity of the private sec-tor. State expenditures induced less and less investments, and resulted in damming the economic costs.
Keynesian policy worked well in terms of state intervention until the end of the 1960s, but by then fiscal policy tools became exhausted. The main problem was the revenues and expenditures of the budget becom-ing too rigid, if the state wanted to cut down expenditures, trade unions protested, and if it wanted to increase taxes, enterprises were insulted.
Dysfunctions of the welfare state (overspending) strengthened, the trust in the capacity to overcome the problems weakened, and the financing of the provision was limited. Furthermore, the interest of capital holders in real investments decreased (because stock exchange speculations yield better), and so did the interest of workers in in-creasing productivity. a further problem was that the reasonableness

72
(effectiveness) of state redistribution decreased, while bureaucracy increased, which restricted encouraging development in many coun-tries. The main problem of subventions is it’s constraining more effec-tive fields by reallocating the resources produced there, and this way it cuts back the further development thereof. If the economy is hit by a lasting crisis, financing of the welfare state is shaken. (Wee van der, H. [1987])
Challenges to the welfare state are thus mainly of external origin: new technologies and globalization of trade and capital flow results in labor market disorders, the ratio of homogenous mass workers drops due to bigger social differentiation. Also, the population is growing older and family structures are changing. These all undermine the conditions supporting post-war social policy. If the welfare state is in a crisis, then it is the outcome of its institutional rigidness in a social system not valid anymore today. Today’s challenge is to rethink and modernize the previous conditions on labor, family and social risks.
The income growth of the swollen public sphere is an inflated flight of income, what causes inflation. The income level of state employees has to be adjusted to that of employees of productive sectors for politi-cal reasons. However, no naturally measurable production was back-ing their work. The unproductive large consumer inserted into the sys-tem to avoid overproduction generated inflation, which was topped by the 1973 first oil price explosion.
After four decades of successful market regulation practice, the Keynesian model of state intervention failed to solve the crisis emerg-ing after 1973. Its traditional toolkit was exhausted, and for the first time in history stagnation and inflation became connected, often re-ferred to as „stagflation”. This was most probably related to the grave pressure of inflation due to external reasons. The 1968 the European political crisis and social tensions led to significant increases in wages all over WesternEurope, which the companies responded to by in-creasing their prices, starting an upward spiral of prices and wages. Subsequently, it was contributed to by the also politically induced oil crisis, which raised the price of oil ten times between 1973 and 1980. The Keynesian policy of controlled inflation, creating additional de-mand, which helped during the Great Depression and the subsequent 40 years was not helping any longer. It even added to the inflation pressure.

73
Background and scope of the ebb
Globalization suffered not only the bows of the Great War between 1914 and 1918, but the war was rather rapidly followed by the Great Recession in 1929 and by World War II in 1939.
From 1914 to 1945 the globalization process of the 19th century has been reversed and the level of globalization declined radically. As we have seen earlier, the level of globalization can be measured by the ratio of the growth of world trade to the growth of global GDP. According to estimates of Angus Maddison, between 1913 and 1950 this ratio was less than 1, which means that globalization declined (as we have seen, this ratio was 4.4 between 1820 and 1870 and 1.6 between 1870 and 1913).
The first blow to globalization arrived from the War: belligerents started economic warfare against each other from the beginning of the War. Disruption of international trade was imminent, and naval blockade on the Atlantic further increased this disturbance. Foreign investments have also suffered: some investments lost their values; some even were confiscated, like foreign investments in Russia. Cam-eron and Neal (2003) maintained that the total value of British foreign investments declined by 15%, and those of France by 50%! Only the USA was able to increase its international economic activity, either by trade or by international investments.
The peace treaties after World War I did not help the economic re-covery. Even John Maynard Keynes warned in his famous book writ-ten on economic consequences of peace (1920) that war reparations and territorial changes seriously damaged the economies of Germany, Austria and Hungary and consequently hindered recovery of world economy.
After the revolution, Russia was largely excluded from the world economy. Though trade with Russia began to grow in the 1930s, for-eign investments in the Soviet Union were strictly controlled till 1990.
International finances were disrupted by the War. Great Britain abandoned the gold standard in 1914 and other major belligerent countries followed this model rapidly – except for the USA, which has remained on the gold standard throughout the war.
After the War, all countries wanted to return to the Gold Standard, but that was easier to say than to do in the chaotic post-war economic conditions. Great Britain returned to the Gold standard in 1925 at a much overvalued parity – against the warnings of John Maynard

74
Keynes – which largely reduced competiveness of British products abroad. France also returned to the gold standard in 1928. On the oth-er hand, Germany has never been able to return to the gold standard.
But the Gold Standard System was finally disrupted by the Great Depression in 1929-33. England abandoned the gold standard in 1931, France in 1932 and the USA in 1934.
The representatives of principal economic powers gathered in Laus-anne in 1932 to discuss possibilities of restoring the pre-war economic system and to design an appropriate frameset for the world economy, and in 1933 a World Monetary Conference was organized in order to restore the Gold Standard, but all these efforts failed and instead preparation for the new war started first in Germany then in other countries as well.
Per capita GDP growth, averages (%)
Per capita GDP 1870-1913 1913-1950
Western Europe 1.3 0.9
Western Offshoots 1.8 1.6
Southern Europe 1.1 0.4
Eastern Europe 1 1.2
Latin America 1.5 1.5
Asia 0.6 0.1
Africa 0.4 1
world 1.3 0.9
Source: Maddison, 2000
According to Maddison (1995), Eastern Europe suffered the most in the period between the world wars and during the Great Depression, between 1913 and 1945. The number of victims perished directly from wars reached 3.3 million, according to the estimation of Maddison. Nevertheless, the actual losses were far graver, if victims of the bomb-ings and the Holocaust are accounted for (including those who have lost their lives or left the region forever).
Eastern Europe lost approximately 10 million lives in the wars (in-cluding the European territories of the Soviet Union), which were fur-

75
ther increased by the millions killed by collectivizations and state ter-ror in the USSR.
According to the calculations of Maddison, the gap between Eastern and Western Europe was increasing in the period from 1913 to 1950. Obviously, results for certain countries varied, due to the different lev-el of their involvement in the world economy, and the different level of destruction the war has caused.
The differences are obvious also in the former territories of the Austro-Hungarian Empire, succeeded by Czechoslovakia or Hungary. While in Czechoslovakia per capita GDP increased faster than in the case of several Western European countries (Germany, France and the UK), and only the war years resulted in a change of descent, then Hungary only managed to grow faster than the slower growing United King-dom. Hungary’s distance from the development level of France or Ger-many further increased until 1937, which was then made worse by the devastation of the wars.
Per capita GDP level in some Eurpean countries
1913 1937 1946 1938/1913 1946/1913
Czechoslovakia 2096 2882 1800 1.38 0.86
Hungary 2098 2543 1721 1.21 0.82
Germany 3833 4809 2503 1.25 0.65

76
UK 5032 5937 6440 1.18 1.28
France 3452 4444 3819 1.29 1.11
Source: Maddison, 1995
The ebb of globalization between 1913 and 1945 therefore affected ad-versely Eastern Europe and Hungary therein. These effects can be sum-marized as follows:
– due to the major reallocation of state territories, growth in this region was considerably slower than in Western Europe, there was a failure in closing up to the Western part of the continent, and the gap was even growing further
– the destruction of the war was far more serious in Eastern Europe than in Western countries (not including Germany at this point), what also further increased the gap between the two regions
– finally, post-war reconstruction was partially financed in West-ern Europe through the Marshall Aid plan, while Eastern Euro-pean countries rejected this, making reconstruction much harder and more demanding.
3. YEARS OF TRANSITION AND TRANSFORMATION BETWEEN 194575
After World War II very strong forces appeared for and against global-isation. Developed countries – mainly the victorious “Allied Nations” – the USA, the UK, France, and later other Western European count-ries, plus Canada, Australia and New Zealand – made great efforts to dismantle barriers of free trade to allow the free movement of pay-ments and investments. As these countries followed the economic phi-losophy of Smith and Ricardo, they can be called the “Smith-Ricardo free trade economies”.
But these efforts to liberalise world economy were not accepted unanimously. Ironically, at the same time other countries of the world, especially the socialist ones and the newly independent former colonies – plus some other underdeveloped countries, mainly in Latin

77
America – made efforts to apply protectionist measures to introduce control not only over foreign trade, international payments and for-eign investments, but even over the free indefinite flow of ideas as well. These countries had largely applied the economic philosophy of Alexander Hamilton and Friedrich List, and in the socialist countries, the philosophy of Lenin, Stalin and Mao as well. These countries’ phi-losophy was mainly “self-reliance” and “import substitution”.
.. Globalising efforts of the developed countries after World War II: the opening towards free economy
After World War II, exactly as it happened after the first great war of the 20th century, the victors dominated developed countries – the USA, the UK, and to a smaller extent France –made efforts to establish a political and an economic system, which could boost international trade and finances. The real aim of these efforts was to go back some-how to the good old days of the 19th century, to “our first glorious globalisation”.
The following international agreements and institutions were to es-tablish the legal bases of the new globalisation wave after World War II:
– the United Nations Organisation, the institutions and treaties around the UN, aimed to give a solid international legal basis of the economic and political system of the world
– the Bretton Woods System – with the IMF, the IBRD, and the World Bank Group -- aimed to give the legal basis of the inter-national monetary system, serving as the bases of international trade, international payments and international investments: they were to facilitate internationalisation (we might say that glo-balisation) of world economy.
– GATT, the General Agreement on Tariffs and Trade, the legal and institutional framework aimed to eliminate obstacles of foreign trade.
These institutions and treaties after World War II were the following:
UN – the United NationsThe United Nations (UN) was founded in order to ensure the bases
of political stability.. The UN is an international organisation aiming at facilitating cooperation

78
– in international law, – international security, – economic development, – social progress, – and human rights.
The UN was founded in 1945 after World War II to replace the League of Nations, and it contains multiple subsidiary organisations to carry out its missions.
The organisation of the UN has six main bodies: the General As-sembly, the Security Council, the Economic and Social Council, the Secretariat (it provides studies etc… studies, information, and facili-ties needed by the UN); the International Court of Justice; and the United Nations Trusteeship Council. The leading person of the UN isthe Secretary-General.
The name of the “United Nations” was first officially used on 1 Janu-ary 1942, when 26 governments signed the Atlantic Charter, pledging to continue their war efforts. In July 1944, the Bretton Woods Confer-ence was also organized by the United Nations, which aimed to re-es-tablish a unified and efficient international monetary system – in spite of the fact that the UN officially was founded only on 24 October 1945 upon ratification of the Charter by the five permanent members of the Security Council — France, the Republic of China, the Soviet Union, the United Kingdom and the United States — and by a majority of the other 46 signatories.
The UN was set up to assure the final decisions of the victorious powers – permanent members of the Security Council were given were given a possibility for a veto over all decision of the UNSC.
Though this mechanism was working rather well in the beginning of the 1950s, as former colonies have received independence, and as Soviet diplomacy learnt to use the mechanisms of the UN much bet-ter that they did during the Korean War, when American diplomats cleverly outmanoeuvred their Russian colleges, the United Nations General Assembly was more and more dominated by the newly inde-pendent former colonies.
The Bretton Woods SystemAfter the collapse of the Gold Standard System, the lack of a unified
and standard monetary system has largely hindered the development of foreign trade, international payments and foreign investments – in one word, the globalisation.

79
The Bretton Woods system was created after World War II just in order to rectify this problem.
As World War II came to its end, 730 delegates from all 44 allied-nations gathered at the Mount Washington Hotel in Bretton Woods, New Hampshire, United States, for the United Nations Monetary and Financial Conference. The delegates deliberated upon made the deci-sion and signed the Bretton Woods Agreements during the first three weeks of July 1944.
The Bretton Woods system had an important institutional frame-work, the International Monetary Fund (IMF) and the International Bank for Reconstruction and Development (IBRD) belongs to this group. These organisations became operational in 1945 after the suf-ficient number of countries had ratified the agreement.
The main idea of the Bretton Woods system was to fixexchange rates, exactly as it worked during the Gold Standard System. The major difference between the Gold Standard system and the Bretton Woods system was that in the Gold Standard system international reserves were gold and national banks have promised complete convertibility of national currencies to gold, but in the Bretton Woods system US dollar was used as the international currency and national banks guaranteed convertibility of the currencies to US dollar, and the American nation-al bank, the FED has promised the convertibility of the US dollar to gold – but only to the partner national banks. In this system the United States had a prudential status – for example the USA could increase foreign trade deficits and current account balance deficits much more easily than other countries.
The rather rigid Bretton Woods system was not able to survive the great transformation of world economy in the 60s and on August 15, 1971, the United States unilaterally terminated convertibility of the dollar to gold. As a result, the Bretton Woods system officially ended and currencies started to fluctuate more or less freely.
Organisations of the Bretton Woods System
For the smooth and successful operation of the Bretton Woods System, international institutions were set up in order to act as watchdogs and to usher back world economy to the right way. It is interesting that these organisations survived the collapse of the Bretton Woods System and even today those are regarded the most important organisational

80
engines of globalisation. The most important organisation has been the IMF, and the other has been theWorld Bank Group.
IMF – the International Monetary Fund
One of the major institutional watchdogs of the Bretton Woods System and later, after the collapse of the Bretton Woods system, the engine of internationalisation of world economy is the International Monetary Fund (IMF). IMF is an intergovernmental organisation that oversees the global financial system and in case of troubles, intervenes by giving macroeconomic policy advice and financial resources to the govern-ments in need. Its intervention has been mainly aimed to intervene in case of serious imbalances of exchange rates and the balance of pay-ments.
The objectives of the IMF are
– to stabilize international exchange rates, and– to help economic development.
In order to realise these goals, IMF provides advices – mainly preaches the benefits of liberal economic policies and globalisation and as a last resort, offers loans with varying levels of conditionality to countries which have temporary economic problem.
The International Monetary Fund was conceived in July 1944 orig-inally with 45 members and came into existence in December 1945 when 29 countries signed the agreement.
Signatory countries contributed to a pool which could be borrowed from, on a temporary basis, by countries with international payment imbalances. Today there are 187 member countries of the IMF, but election of the major representatives are made according to the finan-cial contributions of the members, and even today, influence of the United States is determining the IMF.
The headquarter of the IMF is in Washington, D.C.
The World Bank Groups
The World Bank Group (WBG) is a group of five international organi-sations that gives loans to poor countries. The Bank came into formal existence on 27 December 1945 following the international ratification of the Bretton Woods agreements, which emerged from the United Nations Monetary and Financial Conference (1–22 July 1944).

81
Its five agencies are:
– International Bank for Reconstruction and Development (IBRD)– International Development Association (IDA – for the least de-
veloped countries)– International Finance Corporation (IFC – investments’ in private
ventures)– Multilateral Investment Guarantee Agency (MIGA)– International Centre for Settlement of Investment Disputes (ICSID)
The term “World Bank” generally refers to the IBRD and IDA, whereas the World Bank Group is used to refer to the institutions col-lectively.
The activities of the World Bank (i.e. the IBRD and IDA’s) focus on developing countries, in such fields as human development (e.g. education, health), agriculture and rural development (e.g. irrigation, rural services), environmental protection (e.g. pollution reduction, es-tablishing and enforcing regulations), infrastructure (e.g. roads, urban regeneration, electricity), and governance (e.g. anti-corruption, legal institutions development). IBRD and IDA provide loans at preferential rates to member countries, as well as grants to the poorest countries. IDA generally helps the development of the poorestcountries. Loans and grants of IBRD and IDA are often tied to policy measures what ex-perts of the World Bank Group think useful for the beneficiary coun-tries. The activities of the IFC and MIGA include investment in the private sector and provisioning insurance respectively.
International Centre for Settlement of Investment Disputes deals with investment related disputes kind of arbitration body.
It is often stated that World Bank Group focuses mainly on long term economic and social problems, the IMF focuses mainly on short term problems and its solutions and proposals often disregards long term social consequences.
GATT – General Agreement on Tariffs and Trade
The General Agreement on Tariffs and Trade GATT) was negotiated during the UN Conference on Trade and Employment and it was the outcome of the failure to create the International Trade Organisation (ITO). GATT was signed in 1947 and in 1993 it was replaced by the World Trade Organisation in 1995. In the framework of GATT re-

82
duction of tariffs and custom duties were negotiated in the so called rounds, which were closed down by signing the agreement. More and more countries have participated at each consecutive rounds.
The first round was in Geneva, in 1947 and important tariffs reduc-tions were accepted. 27 countries have signed the agreement.
The second round took place in 1949 in Annecy, France. 13 countries took part in the round. The main focus of the talks was more tariff reductions, around 5000 in total.
The third round occurred in Torquay, England in 1950. Thirty-eight countries took part in the round. 8.700 tariff concessions were made totalling the remaining amount of tariffs to ¾ of the tariffs which were in effect in 1948. The contemporaneous rejection by the U.S. of the Havana Charter signified the establishment of the GATT as a govern-ing world body.
The fourth round returned to Geneva in 1955 and lasted until May 1956. Twenty-six countries took part in the round. $2.5 billion in tariffs were eliminated or reduced.
The fifth round occurred once more in Geneva and lasted from 1960-1962. The talks were named after U.S. Treasury Secretary and former Under Secretary of State, Douglas Dillon, who first proposed the talks, that is why it is called “The Dillon Round”. Twenty-six countries took part in the round. Along with reducing tariffs, it also discussed the creation of the European Economic Community (EEC).
Kennedy Round took place from 1964-1967. Here anti-dumping meas-ures and further tariff reductions were accepted.
The Tokyo Round - 1973-1979 – reduced tariffs and established new regulations aimed at controlling the proliferation of non-tariff barriers and voluntary export restrictions. 102 countries took part in the round.
The Uruguay Round – 1986-1994 – was the most ambitious round to date, hoping to expand the competence of the GATT to important new areas such as services, capital, intellectual property, textiles, and agri-

83
culture. 123 countries took part in the round. The Uruguay Round was also the first set of multilateral trade negotiations.
These legal instruments – international agreements and institutions – have largely contributed to the proceeding of globalisation in the 50s and 60s – but mainly in the developed countries. By the end of the 1950s na-tional currencies of the developed countries became freely convertible, facilitating international payments, international trade and investments.
Socialist countries were clearly not involved in the economic globalisa-tion of the 1950s and only from the 1960s these states started to slowly open up their economy to the outside world – but until the 1980s, or in some cases even till the 1990s, these countries tried to stay outside globalisation.
.. Independence of the former colonies: self-reliance and import substitution
The two most important colonial powers, the United Kingdom and France have found themselves in the camp of victorious countries after

84
World War II – though in case of France it could have happened dif-ferently, as the government in French territory, the Petain government in Vichy closely collaborated with Nazi Germany. Anyhow, these two countries have lost their credibility and above all, its invincibility in the eyes of the political and economic elites of the colonies – and they have grasped the opportunity after the war to go gain independence.
India has become independent in 1947, Indonesia in 1949, Burma in 1948, Iraq in 1947. Malaysia, where political troubles were frequent between Chinese communists and the local Malay population gained independence later, in 1959. The French were more reluctant to leave the colonies where large French communities lived, but the wars of In-dochina and Algeria made them to change their mind, and they left In-dochina in 1954 and Algeria in 1962. Colonies in Sub-Saharan Africa have gained independence manly in the 60s, except for the Portuguese colonies, which were among the last colonies to become independent in and around 1975. After that time only smaller islands and enclaves remained colonies, but these are mainly touristic destinations. We only remind here that Latin American countries have gained independence generally in the 19th century.
In the newly independent former colonies, the so called “Third world Countries”, new legal frameworks were established and these countries often tried to cut all economic ties with the former “mother countries” with the “metropol” and they introduced economic policies based on the philosophy of “self-reliance”.
Newly independent countries generally had two common points in their economic policy:
– Local economic elites wanted to take over the place of the for-eigners who generally dominate their economies, and
– They wanted to modernize and industrialize rapidly their econo-mies, and in order to achieve this goal, these countries have ap-plied import substitution industrialisation and strong state plan-ning – similarly to the socialist countries.
In order to take over the place of the foreigners in the economy in lots of newly independent countries properties of foreigners were con-

85
fiscated and nationalised, and generally further foreign direct invest-ments – i.e. investments where the owners exercise control over the company where they have acquired ownership – were prohibited or at least strictly controlled.
Another common feature was that after having gained their inde-pendence, governments of the former colonies generally introduced state regulated foreign trade regimes, where imports and exports were strictly regulated by the state. At the same time foreign properties – mostly properties of the former colonial countries – were confiscated and nationalised.
Indonesia is a good example for the confiscation of foreign properties. In Indonesia between 1963 and 1965, nearly 100 foreign companies were nationalised by the Indonesian government. Among these com-panies we could find oil companies, plantations, manufacturing plants fields. The companies were taken by the state and some of them were later privatised for local entrepreneurs.
In 1965 all foreign direct investment in Indonesia was prohibited by law. The elimination of foreign investments in Indonesia during this period was the result of a nationalistic, import-substituting industrial-ising policy, similar to the policies, which were followed in other newly independent countries.
In Malaysia foreign owned tin mines and rubber plantations owned mainly by British citizens were also nationalised after independence.
In Africa British and Indian properties were the main targets in the former British colonies of the nationalisation fever. In the former French colonies in North Africa, French planters’ properties were con-fiscated.
All over in the newly independent colonies during the 1950s and in the 1960s foreign properties were often nationalised and further foreign direct investments became strictly controlled, practically banned.
Latin America had become independent much earlier, in the 19th century, but as the basic structure of world economy has been trans-

86
formed during the 20th century – their major export markets in Western Europe has been cut during the war and even afterwards, economic recovery was very slow in Europe – so Latin American countries have also started to find new roles in the international divi-sion of labour.
There were common features of the third world countries – in Asia, in Latin America and even in Africa – in the 50s and 60s, such as they wanted rapidly overcome their economic backwardness and for that the leaders of these countries have opted for the so called “import sub-stitution industrialisation – ISI”.
The logic behind of this decision was that they were sure that if these less developed countries remain open economies, fierce competition with the most developed and often cheaper products imported from developed countries will hinder fast industrialisation in the third world countries, and these countries would remain inferior raw mate-rial suppliers of the industrialized developed countries, as the USA, France, the UK and Germany. By protecting their local industry they hoped to obtain the capacity to develop it, as a modern industry would be the basis of a modern society.
The simplest way to protect their industry was to apply high import duties and quotas, and to implement a strict state control on imports. Economic philosophy of this import substitution industrialisation was originally based on the writings of Alexander Hamilton and Friedrich List from the 19th century, and later it was theoretically worked out in details by Raúl Prebisch (1950), Celso Furtado (1964) and other “struc-tural economic” thinkers.
It is interesting to note that the theory of substitution industrialisation (ISI) was worked out after the war for Latin America, but this theory was applied in the 50s and 60s also in the newly independent colonies of Asia and Africa.
It was originally the restructuring of world economy which forced Latin American countries to turn towards Import Substitution Indus-trialisation after World War II.
Latin American countries were raw material suppliers of Western Eu-rope from the middle of the 19th century, and also sold large quantity

87
of agricultural products in the old continent. The great economic crisis of 1929-33 and later World War II disrupted this lucrative trade and even after the war, European countries were not able to buy agricul-tural products from Latin America as they used to, because of their economic difficulties.
At this point the idea of changing the development model emerged, as Furtado, Prebisch and other economists of the United Nations have suggested to abandon the one-sided reliance on agricultural export and to start an indigenous industrialisation. It was also evident, that industrialisation would not be successful without having effective pro-tection from the competition of foreign products, which naturally were often more modern and much cheaper than the similar products of the newly developed local industry. Nevertheless, import protection-ism was not a new idea, as Alexander Hamilton and Friedrich List have already suggested this method back in the 19th century – and even the USA, Germany and Japan have relied on this method efficiently during their industrialisation.
India was the first country among the newly independent former colo-nies to apply import substitution industrialisation in Asia.
India introduced a strict state control of foreign trade in order to pro-tect local industrial development as early as the beginning of the 50s. Notably, most of such measures have survived till the liberalisation wave of the 1990s, and even today you can find many protectionist elements.
This state control of the foreign trade in India is called the Licence Raj.
The architect of the Licence Raj system was Jawaharlal Nehru, India’s first Prime Minister. In this system the government has applied strict quantitative control over imports and exports, in order to protect the new Indian industry.
The basic instrument of private industry control was the Industries Act of 1951, which covered all manufacturing, mining and power genera-tion. It gave the government authority to grant licenses for expand-ing capacity and to control the allocation and prices of raw materials

88
and in some cases even the prices of finished products. The most im-portant instrument of state control was the state regulation of foreign exchange and import. In order to justify import, the domestic user had to demonstrate that the commodity is essential and it cannot be purchased from a local source. (Gregory – Stuart, 1995) This was the basis of the Licence Raj.
Similar import substituting industrialisation was applied in Indo-nesia, in Malaysia, in Egypt, in Turkey, an in the majority of the Latin American countries, such as Argentina, Brazil, Chile and Mexico.
To mobilize their meagre resources and to speed up import substitu-tion industrialisation, third world countries – especially those in Asia and in Africa – have applied elements of state planning. Elements of this state planning were often borrowed directly from the Soviet Un-ion which has politically and even economically backed these coun-tries in the 50s and the 60s.
Though newly independent former colonies generally have not applied as rigid economic planning measures as the Socialist Countries, the differences were not significant, especially in the 50s and 60s, when these “third world” countries had tried to apply important elements of state interventions and state planning.
These measures in the newly independent colonies – in the so called “third world countries” – represented serious drawbacks to the glo-balisation process and hindered development of foreign trade and for-eign investments.
.. Outside of the globalisation: the Socialist countries
As it was shown, international institutions and agreements were set up after World War II in order to liberalise foreign trade and foreign investments, but the will to create a more liberal world economy was mainly present in the political leaders of the developed countries. The other part of the world, namely the Socialist Countries and the “third world countries” opted for a different path of economic development.
These other parts of the world – the socialist countries and the “third world countries” (the newly independent colonies and other develop-

89
ing countries) often enjoyed the benefits of increasing world trade, but these countries were not as enthusiastic about globalisation as the de-veloped ones. The Socialist countries and the “third world countries” often applied a strict state control on imports and on foreign invest-ments, and generally did not have convertible currencies either.
The “Socialist Countries” (the Soviet Union, the Eastern European countries, China, North Korea, Mongolia and North Vietnam) have started to follow a completely different economic development than the developed market economies with their state regulated foreign trade and finances remaining outside of the game of globalisation – till the middle of the 80s.
Socialist countries were convinced that they had to rely on their own resources and had to protect their industry by applying a strict control on foreign trade.
In order to speed up industrialisation in the socialist countries, a com-plete and very rigid planning system was used from the 50s to the 80s, and only few countries, such as Yugoslavia and Hungary attempted to mix elements of free market with state planning. Their industrialisa-tion policy was based on import substitution.
Naturally, socialist countries strictly controlled foreign investments as well, but the rigid state planning alone was enough to discourage all potential foreign investors to bring their money into these countries.
The difference between the per capita GDP in the Eastern European and Western European countries continued to increase after 1950 till 1973, and in the 80s this difference further increased.
The rapid collapse of the socialist system in Eastern Europe has proved that the peoples of these countries have also been convinced of the failure of the socialist economic model.
4. THIRD TIDE OF GLOBALISATION 19752008
It is an important question, when our “Present Third globalisation” has begun? There are lots of causes to uphold that it started sometime

90
in the late 70s, early 80, when third world countries and some Euro-pean and Asian socialist countries, as Hungary, China, and Vietnam, introduced certain economic reforms, and have started to give up the formerly dominant “import substitution industrialisation” and turned toward “export-led growth strategies”. In some countries elements of “import substitution” and “export orientation” policies were applied side-by-side, some other countries had rather gave up slowly import substitution and have opened up their economy for the outside world.
One of the most important features of the “Third globalisation” is the rapid development of foreign direct investments (FDI) and the in-creasing role of the transnational companies (TNCs).
.. The theoretical background of the third Globalization: monetarist counter-revolution of Milton Friedman and the Chicago School
Speeding up the third globalisation
The way out of the 1929-33 Great Depression was obviously marked by the Keynesian principles, state intervention and creating demand. The three decades of development after World War II also originates in these principles. The oil price explosion however redrawn the picture, and the developed Western world was shaken by a huge structural cri-sis. The 1973 oil crisis terminated the foundations of the overspending Keynesian policy, what led to its obvious failure.
At the time of the Keynesian system growing weaker, Milton Fried-man (1912-2006), as the central personage of the Chicago School chal-lenged the followers of Keynes. He considered the Keynesian method to create demand by state expenditure wrong and harmful, because the government this way spent the resources that would have been oth-erwise available to private investors. Moreover, if the state enters the financial market as a potential borrower, it will extort market actors, since financial institutions usually consider the state a more reliable debtor, than any other private investor.
Friedman stated that automatisms would solve the problems of the real sector on the short run. Aggregated demand cannot be insufficient, if

91
it was, then the price level would decrease, and the purchasing value of money would increase. Opposing the ideas of Keynes, Friedman also believed that there is no mandatory unemployment; unemployment can only be voluntary, because real wages flow would balance the mar-ket. Anomalies of the labour market are caused by spatial and profes-sional immobility. In relation to the Keynesian economic policy, he was also convinced, that it managing demand would not solve voluntary unemployment, because it does not follow demand, or at least not for that much. Friedman observed that instead of governmental expendi-tures the increasing amount of money raises aggregated demand. The question is, if the volume of money is increased, would it affect the real flows? Friedman answer was negative, stating, that price level does not affect real flows, the demand, the supply and the production. These are only affected by real variables, such as price ratio or real wages. In his theory, changes in the volume of money can only affect real flows due to “imperfect information”. If the amount of money increases, so does the price level. a company would first realize from this the price of its product growing. It would fail to realize, that the price level in-creased in general, therefore it is going to increase its production, and thus increases its demand for work force. Pecuniary wages will increase, therefore the worker believes his real wages increased, and therefore of-fers more work. In the meantime, real wages must decrease, since the marginal productivity of the work decreases. After a while economic actors realize, that only the price levels, and not the ratio of prices have changed, and subsequently the production of the company falls back to the original level, and the real wages would also have the same value as originally. Those who were unemployed at the previous level of real wages would become unemployed again. Therefore the changing vol-ume of money affects the real size only in the short run, on the long run only nominal sizes change. The solution can be the central bank main-taining the money supply at a constant level. This way everybody can estimate the future changes of the price level, and none confuses chang-ing price level with changing price ratio. Workers would not evaluate changing pecuniary wages as changing real wages. (Friedman [1962])
Monetarist theory upholds that real wages (and other macro indica-tors, like unemployment, inflation, and growth rate) have their natural rate, what can be disturbed by dire consequences only. The 1963 work

92
of Friedman and Anna Schwarz (1915-2012), “A Monetary History of the United States, 1867–1960) showed by analysing a century’s statisti-cal data, that every crisis was caused by disturbances in the natural rate, due to wrong monetary policy. The troublemaker was either mon-etary expansion, or the careless monetary restrictions of the state. Ar-tificial monetary expansion (oversupply of credits, low interest rates) was first applied by the states during the conjuncture of the 1920s. When money supply seceded from the real economic growth, and the crisis hit, states have added only added fuel to the fire by an opposite direction breaking manoeuvre, by their large scale monetary and fiscal restrictions, what soon shrank purchasing value, and this time really resulting in overproduction. The role of the governments – accord-ing to Friedman – would be to control the money supply by monetary regulations, but otherwise do not interfere with real economy flows at an equilibrium level. The economic actions of the state can only be required in three fields, such as supplying the legal framework of the economy, limiting monopolies and to support those, who are unable to provide themselves.
The global recession of the 1970s and the strengthening globalisa-tion were followed by a conservative turn in economic theory and in politics as well. The central element thereof was neoliberal economics, or “laissez faire” individualism. The pioneers of this thought – Frie-drich Hayek, Milton Friedman – and other personages of the neolib-eral school have vividly attacked any state intervention, state property or state redistribution systems from the mid-1970s. They believed, that only deregulation, privatisation and a market free of intervention can respond to the challenges of the brutal market competition.
Citing governmental failures, neoliberals have demanded privatisation of various state functions. They expected lower costs and increasing efficiency from such measures. They believed that human welfare can only be based on a self-regulatory market, and that the most important social problems will be solved by the market. Market harmonies can only be tuned by money supply regulated by the central bank, accord-ing to their suggestions.
In this period, the neoclassical school (R. Lucas, R. Barro, T. Sar-gent) emerged as an even more radical opponent of the Keynesian ide-as. They stated that every state measure is inefficient and consequently

93
useless. Supply economics became the most popular idea from the 80s for theorists and also for politicians looking for a way out of the crisis. Their most important theorem stated that high fiscal evasion is the most effective constraint on investment activities. The famous theory of Arthur Laffer states, that decreasing taxes makes possible the achievement of higher tax incomes. The ratio of this theorem is that lower tax rates induce an economic growth, what gives the gov-ernment the opportunity to realize tax incomes from a wider range of taxpayers.
The doctrine of the so-called Washington consensus marked the mainstream of world economic politicians in the 1990s. This was coined from the IMF oriented treatments of the debt crises of the 80s, and became the new hegemonic ideology of the early 90s claiming re-ception of the neoliberal crisis management solutions of the previous decade. The main macro elements of this have been: currency devalu-ation, balanced budget, monetary restrictions, whereas at a micro level the policies included: liberalisation of finance and trade, deregulation and privatisation; all these finally revived and strengthened neoclassi-cal economic ideas in the post-Cold War era.
Neoliberals claim that the welfare state must be restricted, and a larger freedom must be granted to individual choices and the markets. The other way would be a presently yet unclear concept of a redefined wel-fare state, what places emphasis on the flexibility of the supply, main-tenance of active incomes and an active state investment policy. Key words of this would be lifelong learning, flexibility or active labour market policies.
In many aspects, the role of the state is thus not devolving, but re-forming. In order to maintain financeability, the financing mecha-nisms of welfare systems are placed on new foundations, whereas pay-ments and allowances are better connected to each other, in a more reliable way. Burdens cannot be avoided, but easier and more expedi-ent financing solutions are discussed. Countries thus have turned to-ward the realisation of a more efficient state engaged in smaller-scale redistribution.

94
.. Background and motivations
One of the major technological preconditions of our 3rd globalisation was the communication revolution, which made possible to send large volume of messages real time to any part of the Globe. Computers, large capacity telecommunication networks, and communications sat-ellites made possible to run a complete production factory at the other side of the Globe.
One of the most important economic causes of the “Third globalisa-tion” was the debt crisis of the Socialist and the “third world” countries after the oil crisis in the 70s. The debt crisis followed “import sub-stitution industrialisation” policy of developing countries, which was largely financed by foreign credits. This was the case in Latin America, but in many other developing countries as well. The logic was that developing countries has financed their import substituting industri-alisation by foreign credits and they hoped that these credits could be paid back later from the revenues generated by these new investments. This structure was successful till world economy was stable and inter-national credit was available at a relatively low interest rate, but in the 70s this has changed abruptly.
The changes arrived with the Yom Kippur war in 1973 and by the Irani-an revolution and later the Iran-Iraq war. In the 70s, oil prices started to increase dramatically which increased the import costs of all non-oil producing countries. This was the case in the developing countries as well, especially in the countries of Latin America, which had just started development of their energy thirsty heavy industrial projects.
In the beginning these increased energy bills could be financed as oil producing countries has flooded financial markets with liquidities, be-cause oil producing countries did not have enough investment possi-bilities at home. International credit supply has increased temporarily as oil producing countries have invested their money in the European banks which “recycled” this money as credit to the developing coun-tries. Developing countries following the import substitution path en-joyed the benefits of this increased liquidity and started to increase their indebtedness rapidly. This was the time when foreign debt of the

95
developing countries in Latin America, Asia, in Africa started to in-crease dramatically. Some European socialist countries, e.g. Poland, Romania and Hungary has also followed this example and started to borrow massively from the world market.
By the end of the 1970s inflation became the most important preoc-cupation of the governments in the developed countries, especially as economic activities slowed down at the same time, creating the famous “stagflation”, which has resisted to the traditional Keynesian solutions. In the USA the Federal Reserve System had a new president from 1979, Paul Volcker, who raised the federal funds rate, which averaged 11.2% in 1979, to a peak of 20% in June 1981. The prime rate rose to 21.5% in 1981 as well.
After this measure dollar denominated credits started to increase in the USA and in the euro-dollar market. Developing countries already had a high level of foreign debt by that time and after 1979 they were obliged to renew their credits with more and more expensive new loans. As the development of the world economy remained relatively slow that time, developing countries (and the socialist countries which have followed the same development path, as Hungary and Poland) had more and 1-l more difficulties to service their more and more ex-pensive international debts. The collapse was imminent.
As in 1982 Mexico announced that they are not able to continue repay-ment of the foreign credits, international banks became very cautious suddenly and commercial banks have largely reduced lending to the developing countries. This was the beginning of the long history of the debt crisis of the 80s, which resulted in the “lost decade” for the Latin American countries.
Beyond the Latin American countries Poland, Hungary, some Afri-can and Asian countries were affected, but East Asian ones were spared.
As the interest rate of the credits started to increase and the energy prices started to hit the skies, lots of developing countries have found themselves in a debt trap. From this trap one logical way out was to privatise and to let foreign direct investments to enter. These foreign investments often were channelled into export orientated activities, which helped these countries to generate necessary export revenues for paying back foreign debts.

96
In the end of the 80s lots of developing countries have started to lib-eralise their foreign investment legislation in order to attract foreign direct investments.
The Washington Consensus: the Basic Rules of globalisation
The Washington Consensus has two meanings; first of all, it is a set of ten policy recommendations written by an American economist, John Williamson (1989). These policy recommendations were written in order to help Latin-American countries to speed up their economic developments and to balance their economies after the difficulties of the 80s, but later it was regarded as the general recommendations for all underdeveloped countries, and in the 90s it was regarded as the credo of the neo-liberal economic school.
To better understand the background of the Washington Consensus, we have to take a glance at the economic development of the Latin-American countries during the 20th century.
As Jan Kregel clearly presented in his paper (Kregel, 2008), Latin America experimented with two different development strategies over the last two centuries. From the 19th century to the middle of the 20th century Latin America pursued increasing integration into the Global Economic system, via an outward-oriented development strategy based on exports of primary goods, mainly on agricultural products, and in the second half of the 20th century this continent has opted for a completely different path of import substituting in-dustrialisation.
Increasing integration of Latin-America to the world economy was very successful till the Great Depression of the 1930s, when agricultur-al prices have collapsed. As the main import market of Latin-America was Western Europe, Latin American exports have further suffered because of World War II and because of the slow recovery of Europe after the war.
Collapse of the traditional markets of the Latin American agriculture has caused that this continent was forced to find an alternative growth model. This policy was import substitution industrialisation, which
97
was largely successful in Latin America till the 1970s, but after the oil crisis and the sharp increase of interest rates, Latin American coun-tries have accumulated high foreign debt and their economic develop-ment has slowed down radically during the 80s.
Industrialisation of the Latin-American countries have based on foreign credit. In the 60s and in the 70s Latin American countries have borrowed heavily from international creditors, but as this time eco-nomic development in the region was rapid (between 1950 and 1970 average GDP rate of the major countries of the region was around 5%), and as interest rate internationally was relatively low, this has not caused any problem for Latin America.
The oil crises of the 1980s had double effects for the Latin Ameri-can countries. First of all, as the oil crises hit, this countries needed further international financial resources to finance their oil import, but it was relatively cheap in the first years of the oil crises, as oil producing countries have deposited their revenues in financial banks which were happy to lend it at low interest rates for the countries which needed resources. But as the interest rates increased globally in 1979, debt payments also increased, and as exchange rates of the Latin American countries with the US dollar deteriorated, it became more and more difficult for Latin American countries to pay back their debts.
Mexico announced in 1982 that they are not able to repay their debts, which triggered a large scale economic crisis in Latin America leading to a decade long economic stagnation (the famous “lost decade”) and the intervention of the IMF. The IMF suggested that these countries should give up their import oriented industrialisation in exchange for international financial support.
To turn back to the Washington Consensus, the famous ten points of this paper were the most important suggestions to the Latin American countries by the most important organisations in Washington, namely the IMF, and the government of the USA.Williamson in 2005 has wrote a paper (Williamson, 2005) in which he has summarised the circumstances which have led to the publication of his famous “ten points”.

98
The “10 points” of “Washington Consensus” were the following:
1. Fiscal Discipline2. Reordering Public Expenditure Priorities3. Tax Reform4. Liberalising Interest Rates5. A Competitive Exchange Rate6. Trade Liberalisation7. Liberalisation of Inward Foreign Direct Investments8. Privatisation9. Deregulation10. Property Rights
Critical voices have emerged concerning the “Washington Consensus” already after the East Asian Crisis, but the Great Economic Crisis of 2008 brought along articles related to the “Washington Consensus” often speaking about the “Fall of the Washington Consensus”. The Washington Consensus were criticized not only theoretically in past years but politically as well, as left wing governments came to power in some Latin American countries and have started to give up major points of the Washington Consensus.
.. Scope and structure of the third wave of globalisation
International trade
One of the most important ways to measure the level of globalisation is to compare trade to production. After the rapid increase of the world exports in the 70s, the 80’s have brought a slowdown of foreign trade compared to the GDP of the world, then after the 90s we could see again that the share of export has increased in terms of the GDP.
World exports, in terms of world GDP %
1970 13
1975 17
1980 20
1985 18

99
1990 19
1995 21
2000 25
2005 28
2010 29
But the most important features of world trade after the 70s were that – as Lipsey (2004) has stated “First, the flow of trade is no longer exclu-sively manufactured goods going from Europe and the US to the rest of the world and raw materials and foodstuffs going in the reverse direc-tion. Increasingly, the flow of manufactured goods has been two-way, coming as much from the developing nations as from the developed ones…. and there is a vast increase in the volume of internationally traded services”.
International investments
FDI has increased rapidly in the 70, as it has jumped from 10 bn USD in 1970 to 54.5 bn. USD by 1980. In the 80s the rapid increase of FDI continued as it reached 212 bn USD by 1990. The nineties have wit-nessed further increase of FDIs, as it reached 1623 bn USD by the year 2000, but after the end of the century the steady growth of FDI has been replaced by a hectic growth and major slowdowns.
Disregarding a minor intermission in the beginning of the 1980’s, for-eign direct investments increased at a fast and evenly pace between 1970 and 1990. The annual average growth of foreign direct investment made 14.5% between 1970 and 1980, while the same figure worked out at 17.2% between 1980 and 1990, that is to say, they increased almost twice as fast as the entire amount of world export and nearly two and a half times faster than the total production of the world. In the 1990s foreign direct investments increased even more dramatically.
Another way of measuring the level of globalisation is to compare FDI to GDP. As in the early 70s, total FDIs were around 0.36% of total GDP of the world, by 1980 it has reached 0.5%, and by 1990 this arrived to 0.96% and by 2000 it jumped to 5%, but after that time it has fluctuated widely from year to year and by 2010 it has been around 2%.

100
FDI as % of gross capital formation
1990-95 2000 2005 2008 2010
World 4.1 22 10.4 12.3 11
EU 5.4 49 18.2 12.7 12
Source: UNCTAD
Triad of investments: New tendencies in FDI flow after the 60s
FDIs amongst developed countries continued to dominate after the 60s with around 60% of the total FDIs having arrived in the developed regions, whereas the remaining 40% had been distributed within the developing countries. Traditionally, FDIs in the developing countries used to be directed towards primary sectors, such as extractive indus-try, agriculture and forestry. Before the 70s, only a negligible range of FDIs entered into the manufacturing industries of the developing
countries, partly because of their underdeveloped economies, partly due to the non-FDI-friendly economic and legal environment.
Investments among(s)t developed countries have primarily served the purpose of avoiding tariff and non-tariff barriers. While successive GATT rounds have gradually reduced the average tariff level all over the world – especially in the developed countries were these reductions significant –, such powerful producers like the Japanese manufactur-

101
ers of semi-conductors and cars were forced to introduce “voluntary” volume cutbacks first by the United States and later on by the coun-tries of the European Common Market. The Creation of the European Common Market, on one hand has abolished trade barriers within the European economies, on the other hand though, it could be inter-preted as a strong protectionist measure against outsiders. At the same time non-tariff barriers, like the application of specific standards and quality requirements, were also often used to slow down the inflow of imported goods even in the most developed countries.
These protectionist measures elicited gradually increasing efforts on the establishment of affiliated companies (or on the take-over of already existent enterprises) abroad as a way of escaping trade barri-ers. The reason for this was that all these protectionist measures were relatively easy to outwit by founding subsidiaries within the indi-vidual tariff frontiers, since these functioned similarly to lots of „Gre-cian horses”: subsequently to the establishment they were considered domestic producers and could sell their products without having to account for the quotas specified earlier for foreign products.
The flow of foreign direct investments among developed countries is also described by the terms of the stream of foreign trade substitut-ing or market purchasing investments, as they often replace merchan-dise exports (Dunning, 1986). In that case, export income was at least partially replaced by the increased inflow of profits from the affiliates producing abroad.
The 1970’s and 1980’s saw not only a rapid increase of foreign direct investment, but the transformation of their geographical structures as well. One of the most significant changes in the international scene included Japan having caught up with Europe and North America as a capital exporter, resulting in its capital export growing by leaps from the mid-1970’s. The fast pace of growth in Japanese capital export is well illustrated by the following figures: in 1970 it amounted to no more than roughly USD 1 billion , which then soon reached USD 4.5 billion in 1980, USD 6 billion in 1985 and USD 48 billion in 1990. In the same period the foreign direct investments made by the United States actually showed a much less spectacular increase. In the 1970 the amount of foreign direct investments raised in the United States reached approximately 13 billion USD, whereas by 1980 this figure dropped to 9 billion USD, by 1985 it climbed up again to 13 billion USD , and by 1990 it culminated in 33 billion USD.

102
However, when it comes to the changes in the relative proportion of the individual economic regions, and specifically to Japan’s constantly increasing foreign direct investment, it must be stressed that in the 1970’s and 1980’s – while the member states of the European Economic Community and the United States both exported and received capital simultaneously – Japan’s increasingly important role was confined to capital export, whilst as a capital importer it remained insignificant.
The 1960’s saw a transition not merely in the geographical direc-tion of foreign direct investments, but also in their sectorial structure. One of the most significant changes included a slow increase in the importance of foreign direct investments to the tertiary sector. While in the beginning of the 1960’s only about 20% of all foreign direct in-vestments transacted among developed countries found their way into extractive industries and agriculture, approximately 65% of them went to the processing industry and about 15% was invested in services.
This trend continued in the 1970’s and 1980’s. In the early 1970’s roughly 20% of the entire exported foreign direct investments found its way to the tertiary sector, in the beginning of the 1980’s this figure increased to approximately 25%, and by the beginning of the 1990’s it exceeded 30%.
Concerning capital export to developed countries, this tendency was even more obvious. By the beginning of the 1990’s, the rate of capital export invested in the service sector of developed countries ex-ceeded 50% of the total amount of foreign capital streaming to these countries, while the investments made in extractive sectors and the processing industry dropped accordingly.
From the second half of the 1980’s, the peculiar triangular geo-graphic structure of foreign direct investment, or as it is called, the “FDI Triad”, grew remarkably. If a map is drawn to present the flow of foreign direct investments among the major economic regions in the second half of the 1980’s and the beginning of 1990’s, two differ-ent movements become clearly visible: a flow between North America, Europe and Japan (in the literature denominated as “Triad interpolar movement”) and the movements between the vertexes of the Triad and the peripheries having evolved around them. The North America—Europe—Japan economic triangle was called the “Triad” for the first time by the Japanese economist Kenichi Ohmae (1985) in his book on the new world economic system, in which he gives a detailed discus-sion on foreign direct investment.

103
Ever since the beginning of the 1970’s, the Triad interpolar capital movement has worked out at more than 60% of all the FDI movements, and this rate remained roughly at the same level all the way through the 1990’s (Sachwald, 1993).
The FDIs between the poles of the Triad serve a primary function for getting round the protectionist efforts of the major economic cen-tres and the quantitative barriers impeding trade. Bypassing those via the establishment of assembly plants in the United States these invest-ments enable Japan, for example, to have access to the American mar-ket, where unlimited access – e.g. in the field of cars and computers – is otherwise impeded by extremely strict quantitative restrictions. Naturally, during the course of making such investments, good care is taken to keep the rate of goods imported from the parent company high. The host country, on the other hand, often endeavours to coun-terbalance this by specifying a minimum “domestic rate” to be in-cluded in the products manufactured on their territories if – from the aspect of tariffs and other taxes – they are to be treated as domestic and not as imported goods. Again, these foreign direct investments are used practically as means in the struggle of three highly developed economic regions and a powerful implement of penetration into one another’s spheres. Thus, they may be classified as essentially belonging to the foreign trade substituting kind of capital export and explained as a manifestation of rivalry between the three great advanced regions.
At the same time foreign direct investments from the poles of the TRIAD to the peripheries has developed. It is interesting that in the 70s these investments differed from those traditionally arriving in the developing countries. Traditionally foreign investments in the de-veloping countries went into the primary sector (extractive industry and agriculture) and to infrastructure (harbours, road and railway construction). These investments have traditionally characterised the colonies, but in the 70s already 60% of them was aimed at the manu-facturing industry in contrast with the primary and service sectors, where the total investments amounted to roughly 30% in the former and approximately 10% in the latter.
Foreign direct investments initiated in the manufacturing indus-tries of developing countries have reflected the increasing importance of offshore outsourcing, the logic of which stands for the transfer of

104
those production phases that are executable by or require low skilled, cheap labour force available in developing countries, where wages are much lower than in any of the developed countries.
The roots of these offshore outsourcings can be found in the Toy-ota-type organisation method, where a large part of the value chain is organised into independent units and proprietary relations are re-placed by contractual relations (Berger, 2006). In the traditional Ford-ist company organisational structure the majority of the value chain was organised within the company itself, until the introduction of the “lean production” philosophy and the “just-in-time” system by the Toyota Company achieved the result of concentrating a company to its “core competences” while outscoring all other elements to independ-ent partners.
As Suzanne Berger stated (2006), companies in the developed countries had realised that different elements of the value chain can be outsourced not only to other local partners, but to foreign ones as well, especially if there are significant differences in the resource re-quirements of thementioned elements. As certain components of the value chain did not require very highly trained, costly labour force (in assembling activities for example), it was not necessary to keep these activities in a developed country, where wager were high, consequently all these activities could be outsourced to developing countries with cheap labour force at hand.
At the same time, offshore outsourcing in the majority of the cases was realised by establishing new foreign investments in developing countries, for in these states proper production capacities were not present at that time. Therefore major companies from the developed countries have invested in the developing countries in order to allow the transfer of those elements of the production chain requiring low skilled, cheap labour by creating the adequate production capacities
To be able to apply this “Lego type” organisational structure (Berg-er, 2006), important technical, organisational and legal preconditions had to be met/fulfilled.
These preconditions were the following:
– Development of communication technology, which enabled rap-id information flow between different units of a company even if these units were in different continents.

105
– Development of transportation technology, which was unavoid-able in the “just-in-type” supply system.
– Development of a production management system, which ena-bled the efficient organisation of the production realised by inde-pendent contractual partners.
– Development of a favourable international investment environ-ment, as offshore outsourcing generally required foreign invest-ments, for in the developing countries there were no adequate production capacities and proper management techniques read-ily available in the local companies owned by local businesses.
– Long-lasting, peaceful environment allowing for enhanced con-fidence, which was essential to createworldwide production sys-tems.
It is interesting to note that in the early 70s, mainly Japanese compa-nies used to invest in manufacturing ventures in the developing coun-tries in contrast with American and Western European companies, which have not yet started “offshore outsourcing to cheap labour coun-tries” at that time.
Since offshore outsourcing transfers production from a centrally lo-cated advanced country to a less developed peripheral country provid-ing cheap labour, large share of the produced goods are to be exported back to the developed region, denominated in the literature as “for-eign trade generating” foreign direct investments (see: Kojima, 1973).
In addition to
– traditional colonial FDI,– market purchasing (trade substituting) FDI and– trade generating FDI (offshore outsourcing – délocalisation),
in the 1990’s a new theoretical type of FDI, the “government sub-sidy-hunting FDI” evolved. As in the 1990s, governments considered foreign direct investment as one of the most powerful tools of acceler-ating economic development and pushing back unemployment, there-fore an increasing number of governments decided to attract FDI by ge-nerous government subsidies and tax concessions. Consequently, a new type of FDI relying on government support emerged. It has not been infrequent that even 10-30% of a given FDI has been financed by government support.

106
.. Effects of the Third globalisation on the Host Countries
Foreign direct investment (FDI) is expected to produce major benefits within the economies where the investment is realised as well as where it originates. According to Kindleberger (1969), the FDI process is not a zero-sum game; one country’s losses are not necessarily another’s gains. Ex ante, both countries anticipate greater benefits, but there is no guarantee that these will actually materialise ex post.
The effects of FDI can be categorized into economic, political and social areas. Herein, we are mainly concerned with the economic ef-fects, which in the host country include: effects on capital provision, output and growth, employment, balance of payment, trade, links with local suppliers (backward effect), productivity (forward effect), technology and environment (Moosa 2005). Another dimension of differentiation is the economic level of these effects; consequently, we can distinguish between macroeconomic and microeconomic ef-fects.
Amongst the potential benefits identified in the literature , we focus only on two types of microeconomic effects on the host country: pro-ductivity and competitiveness. Productivity and competitiveness are complex indicators of the externalities of FDI. These two categories re-flect most of the other effects of FDI on the host country and the firms, but vice versa, they are dependent on the beneficial effects of them as well. Productivity and competitiveness do produce an impact on the total sale and export volume of the firms, which indirectly have the ability to influence the balance of foreign trade and the GDP growth of the country.
The main question is whether foreign direct investment and the ac-tivity of foreign subsidiaries can positively affect the productivity of the host economy. Sometimes connections cannot be realised and the economy will develop a dual character, where the activities of the for-eign firms are isolated.
The catalyst for the increased productivity of the host economy can be the spillover of technology, knowledge, managerial skills and the supplying links between foreign and local firms. Technology can ar-rive in a country in many ways (e.g. by buying licences) but the most

107
effective and rapid method is by FDI. In this case, the spillover of knowledge isn’t limited to technical solutions, but rather in general terms it also includes the learning of corporate culture and managerial skills. Technological spillover is a key element in connection with the competitiveness of the host economy and the GDP growth as well.
echnology spillover measurement is based on multiple varieties of new conditions, which are the following:
Intensity of competition, existence of large and vital domestic firms, technological gap between investing and recipient countries, pace of FDI, level of new foreign technology, sectorial differences, rate of for-eign ownership in firms, absorptive capacity of domestic firms, level of human capital in host country, government policy of the host country, financial system in recipient country, presence of backward linkages, which are dependent on: investors’ intention, size of the MNC, global strategy of MNC, motives of investment, technological level, size and capacity of domestic firms, governmental measures.
The figure below shows the critical contingencies for the realisation of FDI-related spillover. (Paus-Gallagher 2008)
How do the above-mentioned catalysts influence the technological spillover in host countries?
By generating competition in the markets of inputs and goods, FDI can contribute to the improvement of market structures and the gen-eral competition in the host country. Yet this positive consequence of FDI is not a certainty. Reuber et al in 1973 pointed out the danger of
108
the absence of large and vital firms in local markets. Small local firms cannot compete with new rivals supported by strong parent compa-nies, which is a problem factor, for MNCs (multinational companies) can dominate the whole local market. This means that the appearance of foreign subsidiaries may induce a higher degree of monopolistic or oligopolistic concentration. More concentrated industries are able to engage in monopoly pricing and should therefore display higher la-bour productivity. (Flores et al 2007) a high concentration level may imply that, due to limited competition, conditions favourable to spillo-ver diffusion do not take place. It is even possible that the foreign sec-tor performs as an enclave, producing a dual structure at the sectorial level, where the activiiest of the foreign firms are isolated.
Beside the intensity of competition, the narrow technological gap between the investors’ and the hosts’ countries could contribute to the spillover effects as well as to the improvement of the productivity and competitiveness of the host country (Wang and Blomstrom 1992). Ac-cording to Perez (1997), beyond the low technology gap sufficient time is required to adjust to new technologies; it means that the slower the pace of FDI diffusion is in a host country, the greater the spillover ef-fect will be. The case study of Portugal sophisticated the relationship between the technology gap and the spillover effect. (Flores et al 2007): the technological gap seemed to be a precondition for spillovers, but only within a certain range. The study showed significant interaction between these two variables and then by progressively arriving at ‘an optimal gap range’ for spillovers. Significant spillovers require proper technological differential between foreign and domestic producers and favourable sectorial characteristics.
If foreign direct investment targets high-tech sectors then FDI may produce mutual advantages for both partners. The high technical level of foreign investment is one of the most important elements of tech-nological spillover. One of the main factors explaining the limited spillover potential of FDI in Costa Rica and Mexico is associated with the slow diffusion of high-tech FDI. The high-tech production in both countries started with low-tech assembly processes, and did not move up the value chain much over time. Like in the rest of Latin America, foreign R+D expenditures in Mexico and Costa Rica have been small. (Paus–Gallagher 2008)
Another aspect of the production efficiency gains in terms of tech-nology transfer and labour productivity shifts is the diverse degree of

109
foreign ownership. a Greek study analysed this condition using a sam-ple of 4056 manufacturing firms operating in Greece in 1997 (Dimelis, S.- Lourit, H. 2002). The interesting results showed a positive effect on labour productivity of foreign ownership, which stemmed exclusively from full and majority owned affiliates. At the same time, local firms benefiting from productivity spillovers were also differentiated, with minority holdings exercising a stronger effect. The minor foreign and – consequently – major domestic ownership in enterprises may have a positive effect on spillover, because these firms have much more direct and indirect connections with local markets, labour and government.
The most relevant of technological spillover is the so-called absorp-tive capacity of host counties. The ‘absorptive capacity’ hypothesis states that the technological capability of the host country relates posi-tively to FDI spillover benefits. This hypothesis is supported by empiri-cal evidences. In 2005, Dimelis conducted a study based on a sample of 2589 manufacturing firms operating in Greece between 1992 and 1997. The evidence provided by this analysis illustrates that the significance of spillovers varies in conjunction with the relative technological posi-tion of domestic firms. The case study of the Argentine manufacturing sector between 1992 and 2001 pointed out that domestic firms with high absorptive capabilities are more likely to receive positive spillo-vers from MNC-presence than those with low absorptive capabilities. When domestic firms have high absorptive capabilities, they are able to reap positive spillovers regardless of the innovative behaviour of MNC affiliates. It means that firm capability is a key determinant of the possibilities of domestic enterprises to benefit from foreign invest-ments (Chudnovszky et al 2001). Where absorptive capacity is absent from domestic firms, they may, instead of reaping technological ben-efits from FDI, be ‘crowded out’ (Agosin and Mayer. 2000).
The absorptive capacity of firms cannot be separated from the level of human capital and government policy in the host country (Borren-stein et al 1995). The quality of existing manpower is the most impor-tant condition of the learning process and the diffusion of the new technology. The divergent results of researches conducted in Central and Eastern Europe proved the relevance of human capital on com-petitiveness or productivity.
Financial infrastructure is an outstanding domestic condition-with potential influence on the spillover effect and economic growth.

110
a more developed financial system positively contributes to the process of technological diffusion associated with FDI. Hermes and Lensink (2003) empirically investigated the role of the financial system in eco-nomic growth. Between 1970 and 1995, 37 out of 67 countries in data set developed a financial system in order to let FDI contribute posi-tively to their growth.
Potential liaisons built up by multinational firms can be mutually advantageous for both partners (Sauvant 2001). The MNCs can pro-cure the required materials and inputs at lower prices, the local firms on the other hand can connect to international production networks, while the high requirements of the MNCs may contribute to the com-petitiveness of the domestic firms via technological spillover. From long-term governmental aspects, another beneficial effect may derive from these liaisons: with the integration of MNCs into domestic econ-omy, the extraction of foreign capital becomes much more difficult and costly for the investor.
At the same time, the global strategy of the MNC prefers its own global backward liaisons, since this is frequently the most effective way to reach synergy in global dimension.
The original goal of the investment may also influence the inten-tions of MNCs along with the level of backward effect. As Giuliani proved in Costa Rica’s case (2008), market seeking subsidiaries with a longer history of operation in domestic country formed backward and knowledge linkages with domestic firms, but – by contrast – the efficiency-seeking subsidiaries did not generate substantial exchange of knowledge with local firms. The interaction occurs among foreign subsidiaries.
The low capacity and technological level of the local firms may be an obstacle for interaction with foreign subsidiaries, in particular when the MNC’s size would require greater production capacity from the suppliers. In the case of Slovenia (Bucar at al 2009), the local firms had insufficient technological, financial and organisational capabilities, consequently only a small number of Slovenian firms became strategic suppliers to globally active MNCs.
The literature also emphasises the role of governmental measures. Görg and Ruane (2001) provided empirical evidences on the impor-tance of this through the case of the Irish electronic industry. In Ire-land, a National Linkage Program was initiated targeting the develop-

111
mentand assistance of local sub-supply industries in order to facilitate their growth, which was necessary to serve their customers.
Winters [38] has cast light on the danger of failure in technological absorption. a dual economy can evolve, where a small number of devel-oped foreign companies produce the essential proportion of export ac-tivity and GDP growth while domestic firms have to cope with lack of capital, inability for growth and lag in competition. If a foreign inves-tor uses an outdated, though capital-intensive technical method, the deriving negative effects may be exaggerated, since capital-intensive technology requires capital generally unavailable todomestic firms.
As the benefit from foreign technology is not automatic, the host government is required to stop pursuing the comfortable “Laissez-fair” policy and instead, intervene using direct measures in order to exert pressure ontechnological and R&D cooperation among foreign and domestic firms.
A large empirical literature deals with the existence and extent of FDI-generated spillovers, both in developed and developing countries. There are at least as many studies finding negative spillovers as there are those reporting positive ones. In conclusion, empirical evidence makes it clear that the theoretically postulated spillover effects do not materialize themselves automatically solely due to a country’s ability to attract FDI. (Mortimore- Vergara 2004)
The ffects of FDI on Global Power Structures
Foreign direct investment has not only changed corporate structures, but also the global power-distribution. In 1996, Kenichi Ohmae con-ceptualised the idea of a tripartite model of world economy under-pinned by North America, Western Europe and Japan as the three piers, which are simultaneously surrounded by satellites of peripheral areas making part of the system through a special division of labour. a significant element of this structure is its organisation along FDI trends and foreign trade relations are more and more presented as de-rivatives FDI.
60% of FDI circulates between these three piers, while the remain-ing 40% flows towards the backyard peripherals. Nowadays the form of the latter is not a “colonial type of investment” (whichretained its relevance in oil and natural gas production), much rather is it the out-

112
sourcing or delocalisation of cheap labour-intensive activities with low added value (László Erdey, [2004]).
Countries in the centres trade among each other in highly processed products (or subassemblies in the case of transnational companies, due to the international flow of goods). Export of cheap, labor-intensive products with low surplus value characterizes the export from the pe-ripherals to the centres. While the relation between centre and periph-ery had previously been defined as a division of labor in relation to processed goods, raw materials and agricultural products, this divi-sion changed significantly in the 21st century.
Three pole world in the 21st century
Source: Dr. László ÁRVA – Bertalan DICZHÁZI – Kornélia KISS: Globali-zation and Foreign Direct Investments in Hungary, EURO-MIDI Ltd. Bu-dapest, 2004.
Countries of the centres in the early 21st century:
– produced goods and services of high added value;– intended to obtain a greater share for their own companies of the
large and solvent markets of the other two centres by means of their market purchasing FDIs;
– secured FDI export to the peripherals they had contact with;– organised and administered cheap, labor-intensive activities pro-
ducing low surplus value in the peripheral countries offering low wages;

113
– organised and administered the production and distribution of raw materials and agricultural products unavailable in the cen-tral countries.
The peripheral countries in the early 21st century:
– were often connected to the central areas in a “backyard” capac-ity, acquiring capital, technology, organisational know-how and market;
– produced basically cheap, labor-intensive products with low sur-plus value for the global market, particularly to the solvent mar-kets of the developed central countries.
The transnational companies’ connection to the local economy oper-ating in the peripherals varies from one country to another. In some cases, they are closely and vertically integrated with the local suppliers, this way creating a considerable technology transfer, though in differ-ent cases local branches of transnational companies operate separately in a desert of backwardness, and as such, fail to induce significant de-velopment in the local economies.
By the beginning of the 21st century, all European post-communist countries and former member states of the USSR and China - appeal-ing to be an independent centre in the second half of the 20th century - have become backyards of their neighbouring centres. Although some of them have not yet given up trying to break freefrom this peripheral role and later on to emerge as a country of the centre in a few years time or even decades. (Árva et al. [2003])
.. The regression of the third globalisation
The Ebb of Globalisation – an economy in doubts
“A rising tide lifts all boats” – heartened the people of the US J.F. Ken-nedy, the king of dreams of all truth-seeking youth in the golden age of the 60s – meaning that the sun of the economic wonder illuminates all. Nevertheless globalisation is a high tide, which defies the laws of nature and raises large yachts while leaves the small boats, or even lets the latter sink. The question is what makes the tide, because it is hard
114
to manually lift those boats of the economy. This question was asked by Robert D. Atkinson, an author of the Washington Progressive Policy Institute and a theorist of third way economics. His response implies that in order to navigate, not only do you need a tide, but alsosome kind of a boat as well!
As we had seen earlier, the discussion on the role of the state took different twists and turns in previous centuries. The modern science of economics and the father of liberal economics opened a centuries-long debate, when writing about the invisible hand for the first time. In his works, even contemporary neoliberal thinkers can find the roots of their anti-state theories.
The crisis hitting in 2008 forced economists to face some facts that became hard to bypass wordlessly. Therefore, many believe that eco-nomics is moving towards a paradigm shift. Critics of the previously fashionable theories assault market-supporting theories from many sides, but there is one thing they seem to find their common grounds on: markets cannot be left on their own, because the invisible hand of Adam Smith can be feared to turn on itself. It is easy to believe, that a paradigm shift - the likes of which could not be seen in the last hun-dred years, except for the crisis in the 1930’s and the inflation period of the 1970’s – is truly at hand.
The first mathematical models, proved to be of some use for politi-cians in their actual decision-making as well, were elaborated after the Great Depression. The oil price explosion has led to the founda-tions of a new macroeconomic school of thought laying ground for market fundamentals. One of the most important theorems of this new school was the doctrine of reasonable expectations, which later became the source for the majority of our contemporary economic theses. Although the neoclassical basic model has no academically proven alternative, economics will most probably be reformed based on the current foundations. This means a shift in emphasis from the market operations toward state intervention is to come, proving the reasons for more market failures, than it had previously been expected.
Many argue today, that markets aspiring equilibrium was a false as-sumption, because equilibrium is a rare and radical situation in any social system, financial markets included. For this end, since perfect markets do not exist, they cannot be left to operate without interven-

115
tion. The government remains responsible for crisis insomuch as they have established an environment, where banks do not only have an opportunity to act without due risk assessment, but they are even en-couraged to do so.
When Francis Fukuyama wrote his work entitled “The End of His-tory and the Last Man” in the late 90s envisioning the collapse of the Soviet Empire, many believed that capitalism along with Western de-mocracy has finally prevailed. Although the number of democracies did indeed increase in the 90s, the years following the turn of the Mil-lennium have turned the tide. Autocratic systems have emerged and a completely new international system has suddenly appeared. Nowa-days two ways of capitalism can be outlined: free market vs. autocratic state capitalism.
The Economic Crisis of 2007-08 and its reasons
Third globalisation has suddenly collapsed during the crisis in 2007-2008, although for a longer period the situation has not seemed too grave. One proof for this is experts’ optimism in relation to the ability of governments to overcome the crisis by Keynesian anti-cycle eco-nomic policies. The crisis of 2007-2008 however, although it resulted in a slowing increase of the global GDP, had a different impact on states. Those of them relying on a large domestic market and having pro-duced rapid growth rates before the crisis – like China, India or Russia – had to face a slowdown in their growth rate, but managed to avoid recession and maintain their growth positive.
Many factors can be considered to be the reasons for the crisis, among them are the following:
– deregulation, such as rescinding the Glass-Steagal Act, which permitted the merger of investment and commercial banking ac-tivities; (The separation of these two fields was a major step after the 1933 crisis.)
– “Subprime Crediting”, standing for credits being offered to non-creditworthy clients;
– Complex financial products, the so-called “derivative products” covering their “dangerous” or unsafe contents (such as Credit Default Swap / CDS or Collaterized Debt Obligation / CDO);

116
– The careless, or sometimes even seemingly insider trading activi-ties of credit risk agencies;
– The insufficienciespresent in the regulation of financial activities;– The fraudulent activities of certain financial institutions;– and finally the burst of the US real estate bubble.
Owing to the deregulation and the development of financial interme-diaries, the income of financial intermediaries in terms of GDP-shares in the US between 1950 and 2000 increased from 3% to 8% (Philip-pon 2011)for which reason they started to offer such complex financial products, as the aforementioned CDO, whichgranted them the ability to increase the credit supply.
The most important factor in the outbreak of the 2007-2008 crisis was possibly deregulation, which had been preceded by a quick credit expansion within the US, followed by the collapse of the real estate market, resulting in the exhaustion of liquidity in developed countries. Against this background, quite logically, governments strived to pro-vide supplementary sources for the financing institutions, what was achieved by financial support from banks and other financial institu-tions. Logically, this led to a deficit even in the budgets of those coun-tries that had previously pursued a solid and healthy budgetary policy.
As in market economies, central banks are primarily concerned with upholding the purchasing value of money, in other terms fight-ing inflation. Therefore, budgetary deficit can only be financed from the financial markets, meaning that the central bank cannot directly purchase government securities – only the US central bank, the FED dared to do so, because its objectives include not only safeguarding stability, but also encouraging economic growth.
Since central banks of the EU cannot purchase state bonds, it was foreseeable that should the governments fail to act, the deficit in the budgets of these counties would become unbearable, since the credit risk agencies had started to blow their whistles and the deficit boosted in several countries as well.
And so did it happen.While in 2008–2009 governments were striv-ing to offer liquidity for the financial sector, in the period of 2009–2012 more and more governments (mainly on the peripheries of the EU and in Southern Europe) faced a situation in which they were no longer able tofinance their deficit from the market.

Sour
ce: I
MF

118
At this stage, the IMF and the EU entered the scene offeingr safety nets or bailout packages to the troubled countries, whereas at the same time directing them to quickly cut down their deficit. This policy naturally brought about austerity measures, which in turn resulted in a signifi-cant slowdown of economic growth.
As for the time being, developed countries can hardly finance their deficits, or – where it was attempted, like in Greece, Portugal or Spain – their attempts resulted in a slowdown of economic growth and a boost of unemployment.
The relation between globalisation and the crisis
The first to lose their jobs in EU-countries have been either those who were less educated or with less experience (career-starters), because they could be more easily substituted with local work force in coun-tries with lower wages (China, India, Eastern Europe).
This is an apparent sign of the casual link between globalisation and unemployment in developed countries, in other terms it proves that deregulation as an important feature of globalisation was not only the source of the crisis, but also the source of an important consequence thereof, namely unemployment.
Political consequences
Today it is not yet foreseeable, what the political consequences of the 2007-2008 crisis and the ebb of globalisation will be. It is obvious that even the very term of “globalisation” has greatly lost its popularity even

119
before the crisis and become an international curse word, marked by strengthening antiglobalist or altermondialist movements.
2012 has seen demonstrations in many EU member states against the global economic order or against globalisation, but no serious alterna-tives have yet been formulated. Today, in the early days of 2013, develop-ments are still awaited and one can only hope that the third globalisation would come to such a tragic end like the second one in 1914, when coun-tries marched from the fields of globalisation to those of battle.
Developments in international trade and investments
Foreign trade and investments has not declined in an extent like it was seen at the time of ebb of the second globalisation, namely after 1914. This is hardly surprising, because in the post-1914 period foreign trade and investments were artificially cut down due to political reasons.
The contemporary events are rather similar to those in 1929-33, when international trade gradually decreased, until in the mid-1930s it started to increase again.
Source: UNCTAD Statistics

120
BIBLIOGRAPHY:
A.Demirguc-Kunt, E. Kane, Deposit Insurance Around the Globe? Where Does it Work, Journal of Economic Perspectives 16:175-195 (2002)
A.Demirguc-Kunt, L. Laeven, R. Levine, regulations, Market Structure, In-stitutions and the Cost of Financial Intermediation, Journal of Money, Credit and Banking, 36(3):593-622 (2004)
Alternatives Economiques, Paris.Angell, Norman (1910): The Great Illusion. a Study of the Relations of Mili-
tary Power to National Advantage. London.Árva László [1990]: Előzésben, a gyorsan iparosodó dél-kelet-ázsiai országok
sikereinek és ritka kudarcainak okai. Közgazdasági és Jogi Könyvkiadó, 1990.
Árva, L. – Diczházi, B. [2003]: Globalisation and Foreign Direct Investment in Hungary - EURO-MIDI Kft, ISBN 963 204 272 7
Árva, L. – Ivicz M. – Katona K. - Schlett A. [2003]: Globalizáció és külföldi működőtőke-beruházások [Globalisation and foreign direct investment] - Szent István Társulat, Budapest, ISBN 963361497
Bekker Zsuzsa (2000): Alapművek, alapirányzatok. Aula, 2000. p. 112.Bekker, Zs. (2000): Alapművek, alapirányzatok. Aula Kiadó, BudapestBenichi, R. (2003): Histoire de la Mondialisation. Vuibert, Paris, 2003.Berend, T.I. Ránki, Gy. (1987): Európa gazdasága a 19. században. Gondolat.
Budapest.Berger, S. 2006): Made in Monde. Les Nouvelles Frontieres de l’Economie
Mondiale. Seuil. Paris.Berger, S.(2003): Notre premiere mondialisation. Seuil. Paris, 2003.Bertin, Y. G.:(1967) L’investissement international. PUF. Paris, 1967.BORENSZTEING, E. – DE GREGORIO, J. – LEE, J. W. How Does Foreign
Direct Investment Affect Economic Growth? – NBER Working Paper No. 5057. 1995
Bourguinat, H. ed. (1990): Investissment international et dynamique de l’économie mondiale. Economica. Paris.
BUČARA, M. – ROJECA, M. – STAREA, M. Backward FDI linkages as a channel for transferring technology and building innovation capabil-ity: The case of Slovenia, European Journal of Development Research (2009) 21, 137–153.
Buchholz, T. G. (1998): Új ötletek halott közgazdászoktól. Európa Könyvki-adó, Budapest
Cameron, R. Neal, L. (2003): a Concise Economic Histrory of the world. 4th ed. Oxford University Press.

121
Carroué, L. Collet, D. Ruiz, C. (2005): La mondialisation, Genese, acteures et enjeux. Bréal, Roissy-sous-Bois.
Coase R. H. (1960): The Problem of Social Cost THE JOURNAL OF LAW AND ECONOMICS University of Chicago Press Vol. 3
Coase R. H. (1960): The Problem of Social Cost The Journal of Law and Eco-nomics University of Chicago Press Vol. 3
Dicken, P. : The Global Shift. Paul Chapman Publishing, London, 1998.Diederiks, H. A. et alii (1995): Nyugat-Európai Gazdaság- és Társadalomtör-
ténet. Osiris, BudapestDIMELIS, S. – LOURIT, H. Foreign ownership and production efficiency:
a quantile regression analysis – Oxford University Press, Oxford Eco-nomic Papers 54, 2002. 449-469 pp
Dunning, J. (1988): Explaining International Production. Unwin Hyman, 1988. Fukuyama (1992): The End of History and the Last Man. Free Press
Dunning, J. H.: The Determinants of International Production. Oxford Economic papers, Vol. 25. 1973.
Dunning, J.H. (1986): Japanese participation in British industry. Routledge, London,
Erdey, L. [2004]: a működőtőke – áramlás a telephelyválasztás elméletének tükrében – Közgazdasági Szemle, LI. évf. 2004. május, pp. 472-494
F. Rioja, N. Valev, Does One Size Fit All? a Reexamination of the Finance and Growth Relationship, Journal of Development Economics 74:429-447 (2004)
FLÔRES Jr, R. G. – FONTOURA, M. P. – SANTOS, R. G. Foreign Direct Investment Spillovers in Portugal: Additional Lessons from a Country Study The European Journal of Development Research, Vol.19, No.3, 2007, pp.372–390
Friedman, M. (1962): Capitalism and Freedom. University of Chicago Press, 1962
Furtado, C. (1964): Development and Underdevelopment, Los Angeles: Uni-versity of California Press
G. Dell’Ariccia, E. Detragiace, R. Rajan, The Real Effect of Banking Crisis, Journal of Financial Intermediation 17:89-112 (2008)
G. Favara, An Empirical Reassessment of the Relationship between Finance and Growth, IMF Working Paper, WP/03/123 (2003)
Galbraith, J. K. (1967-1985): The New Industrial State. Princeton University Press, Princeton
Görg, H. – Ruane, F. [2001]: Multinational Companies and Linkages: Panel-Data Evidence for the Irish Electronics Sector – International Journal of the Economic of Business, Vol. 8, No. 1, pp. 1-18

122
Gregory, P.R. Stuart, R.C. (1995): Comparative Economic Systems.Hough-ton Mifflin Co. Boston.
Hay, C.- Marsh, D. (2000): Demystifying globalisation. Polsis, University of Birmingham.
Hermes, N. – Lensink, R. [2003]: Foreign Direct Investment, Financial De-velopment and Economic Growth – Frank Cass, The Journal of Develop-ment Studies, Vol. 40. No. 1, October 2003, pp. 142-163
Huntington, S. (2000): Civilizációk összecsapása BudapestIvicz, M. – Schlett, A. (2001): a közgazdasági gondolkodás kialakulása és
fejlődése. PPKE JÁK, BudapestJ. Jayarte, P. Strahan, Teh Finance-Growth Nexus: Evidence from Bank
Branch Deregulation, Quarterly Journal of Economics 111(3):639-70 (1996)
J. Schumpeter, The Theory of Economic Development, Harvard University Press, Cambridge, MA(1934)
J.G. Gurley, E.S. Show, Financial Aspects of Economic Development, The American Economic Review 45:515-538 (1955)
Kaposi, Z. (1995): a gazdasági folyamatok és a közgazdasági gondolkodás kapcsolata a 18. században. JPT, Pécs
Kenicsi Ohmae [1996]: The End of the National State: The Rise of Regional Economies, The Free Press, ISBN 0684825287
Kenwood, A. G. - Lougheed, A. L. (1983): The Growth of the Internacional Economy 1820-1980. Allen & Unwin, London
Keynes, John Maynard (1920). The Economic Consequences of the Peace. New York: Harcourt BraceKojima, K.: Direct Foreign Investment, a Japa-nese Model of Multinational Business Operation. London, 1973.
Kindleberger, C. P. [1969]: Speculation and Forward Exchange – Journal of Political Economy, vol. 47, pp. 163-181
Kojima, K.: Direct Foreign Investment, a Japanese Model of Multinational Business Operation. London, 1973
Korten, D. (1996): Tőkés társaságok világuralma. Kapu Kiadó, BudapestKregel, Jan (2008): The Discrete Charm of the Washington Consensus. The
Levy Economics Institute of Bard College, Working paper No. 533.L. Guiso, P. Sapienza, L. Zingales, Does Local Financial Development Mat-
ter? Quarterly Journal of Economics, 119(3):929-969 (2004)L. Klapper, L. Laeven, R.Rajan, Entry Regulation as a Barrier o Entrepre-
neurship, Journal of Financial Economics, 82(3):591-692 (2006)L. Laeven, F. Valencia, Systematic Banking Crisis: a New Database IMF WP
08/224, Washington DC (2008)Landes, D. (1986): Az elszabadult Prometheusz. Gondolat, Budapest

123
Landes, D.S. (1969): The Unbound Prometheus. Technological Change and Industrial Development in Western Europe from 1750 to the Present. Cambridge University Press. 1969
Lipsey, Richard (2004): Some plusses and minuses of globalisation. Paper presented to preliminary session of The WTO and Beyond: Global Gov-ernance and State Power in the 21st Century July 15-16 2004 at Harbour Centre Simon Fraser University
M. Ayyagari, A. Demirguc-Kunt, V. Maksimovic, Firm Innovation in Emerging Markets, the Role of Finance, Governance and Competetion, Journal of Financial and Quamtitative Analysis 46:1545-80 (2011)
Maddison, A. (1991): Dynamic Forces in Capitalist Development. Oxford University Press.
Maddison, A. (1995): Monitoring the world economy, 1820-1992. OECD. Paris
Maddison, A.: (2007): Contures of the world economy, 1-2003 AD. Oxford University Press.
Martin, H. P.–Schumann, H.: a globalizáció csapdája. Perfekt Kiadó, Buda-pest, 1988.
Mátyás, A. (1990): a korai közgazdaságtan története. Aula Kiadó, BudapestMátyás, A. (1993): a modern közgazdaságtan története. Aula Kiadó, Buda-
pestMcLuhan, Marshall: The Gutenberg Galaxy: The making of Typographic
Man. Univ. of Toronto Press, Toronto, 1962. Meadows, D. H.–Measdows, J.R.–Behrens, W.: The Limits to Growth. Club
of Rome, Universe Books, 1972.Minsky, H. (1986/2008): Stabilising an Unstable Economy. McGraw Hill.
New York.Moosa, I.A. (2005): Foreign Direct Investment: Theory, Evidence and Prac-
tice, London: Palgrave.MORTIMORE, M. – VERGARA, S. Targeting Winners: Can Foreign Di-
rect Investment Policy Help Developing Countries Industrialise? FDI in developing countries 2004. pp.33. The European Journal of Development Research, Vol.16, No.3, 2004. 499–530 pp.
Mundell, R. A.: International Trade and Factor Mobility. In: ”American Economic Review”, June 1957.
Muzslai, I. (1993): Gazdaság és erkölcs. Márton Áron Kiadó, Budapest N. Cetorelli, P. Strahan, Finance as a Barrier to Entry: Bank Competition
and Industry Structure in Local U.S. Markets, NBER WP 10832 (2004)OECD: The Performance of Foreign Affiliates in OECD Countries. Paris,
1994.Ohmae, K. (1990): The Borderless world. London, HarperCollins Business.

124
Ohmae, K. : Triad Power: The Coming Shape of Global Competition. Free Press, New York, 1985
Ohmae, K.: The Coming Shape of Global Competition. Free Press, New York, 1985.
P. Aghion, P. Howitt, D. Mayer-Foulkes (2005): The Effect of Financial De-velopment on Convergence: Theory and Evidence, Quarterly Journal of Economics 120:173-222
P. Aghion, T. Fally, S. Scarpetta (2007): Credit Constraints as a Barrier to the Entry and Post-Entry Growth of firms, Economic Policy 22:731-779
P. Csillik, T. Tarján, Cross-region Analysis through a Myopic Leader-fol-lower Model, Acta Oeconomica, Vol. 60(2):143–159 (2010)
Prebisch, R (1950): The Economic Development of Latin America and Its Principal Problems (New York: United Nations,
R. Dehejia, A. Lleras-Muney, Financial Development and Passways of Growth: State Barnching and Deposit Insurance Lows int he US 1900-1940, Journal of Low and Economics 50:239-72 (2007)
R. Fishman, I. Love, Financial Development and Growth in the Short and Long-Run, NBER WP 10236 (2004)
R. Goldsmith, Financial Structure and Development, New Haven Yale Uni-versity Press (1969)
R. Levine, S. Zervos, Stock Markets, Banks and Economic Growth, Ameri-can Economic Rewiev 88(3):537-58 (1998)
R. McKinnon, Money and Capital in Economic Development Washington DC. Brookings Institution (1973)
R. Rajan, L. Zingales, Financial Dependence and Growth, American Eco-nomic Rewiev 88(3):559-86 (1998)
R.G. King, R. Levine, Finance and Growth: Schumpeter might be right, Quarterly Journal of Economics, CVIII. (1993)
R.H. Day,Y–K. Fan, Myopic Optimising, Economic Growth and the Golden Rule. Hong Kong Economic Paper (1976)10:12–20
R.S. Kroszner, L. Laeven, D. Klinglebiel, Banking Crisis Financial Depend-ence and Growth, Journal of Finance and Economics 84:187-228 (2007)
Rosenberg, Nathan (1982), Inside The Black Box: Technology and Econom-ics, (Cambridge: Cambridge University Press).
Rosenzweig, P.–Gilber, K.–Malnight, T.–Pucik, V.: Accelerating Interna-tional Growth. IMD. Wiley, Chichester-New York. 2001.
Rostow. W. W.: The Stages of Economic Growth. a Non-Communist Mani-festo. Cambridge, 1960.l integration. Brooking Press on Economic Activ-ity.
S. Haber, E. Perotti, The Political Economy of Finance Mimeo, Stanford University (2007)

125
S. Haber, Financial Markets and Industrial Development: a Comparative Study of Government Regulation, Financial Innovation and Industrial Structure in Brasil and Mexico 1840-1930, In: How latin-America Fell Behind: Essays ont he Economic Histories of Brasil and Mexico 1800-1914 ed. Stephen Haber 146-178 Pablo Alto: Stanford University Press (1997)
S. Haber, Industrial Concentration and the Capital Markets: a Comparative Study of Brasil, Mexico and the United States 1830-1930, The Journal of Economic History 51(3):559-580 (1991)
S. Haber, The Finance-Growth Nexus: Theory, Evidence and Implications for Africa (2008) http://www.imf.org/external/np/seminars/eng/2008/afrfin/pdf/haber.pdf
S.E. Black, P.E. Strahan, Entrepreneurship and Bank Credit Availability, The Journal of Finance 57(6): 2807-33 (2002)
Sachs, J.D. Warner, A. (1995) Economic reform and the process of globSachwald, F.: Les entreprises japonaises en Europe. Masson, Paris, 1993. Schumpeter, J. a Theorie der wirtschaftlichen Entwicklung : Eine Untersu-
chung über Unternehmergewinn, Kapital, Kredit, Zins und den Kon-junkturzyklus, Leipzig, Dunker & Humblot(1912)
Schumpeter, J. A. a gazdasági fejlődés elmélete. Vizsgálódás a vállalkozói profitról, a tőkéről, a hitelről, a kamatról és a konjunktúraciklusról. Köz-gazdasági és Jogi Könyvkiadó, Budapest (1980)
Sedlacek, T. (2011): Economics of Good and Evil: The Quest for Economic Meaning from Gilgamesh to Wall Street. OXFORD University Press Ox-ford New York
Senat: Rapport d’information par M. Jean Arthuis. No. 337. Paris, 1993.Stiglitz, J. E (2003): a globalizáció és visszásságai. Napvilág Kiadó. Budapest,
2003.Stiglitz, J.E. (2010): Freefall. Free Market and the Sinking of Global Econo-
my. Allen Lane.Szurovy, G. (1994): a kőolaj regénye. Hírlapkiadó Vállalat, BudapestT. Beck, Finance and Growth- Lessons from the Literature and the Recent
Crisis, LSE Growth Comissin (2012) T. Beck, R. Levin, N. Loayza, Finance and the Sources of Growth, Journal of
Financial Economics, 58 (1-2): 261-300 (2000)Tóth, T. (szerk.): Külgazdaságtan. Aula Kiadó, 1999.UN: world Investment
Reports, 1993-2009. UNCTADVernon, R.: International Investment and International Trade in Product
Cycle. Quarterly Journal of Economics, 1966. májusW. Bagehot, Lombard Street, a Description of teh Money Market, Henry S.
King, London (1873)

126
Wee van der, H. (1987): a lefékezett jólét. Újjáépítés, növekedés és struk-túraváltás a világgazdaságban (1945-1980). KJK, Budapest
Williamson, John (1989): What Washington Means by Policy Reform, in: Williamson, John (ed.): Latin American Readjustment: How Much has Happened, Washington: Institute for International Economics 1989
Williamson, John (2004): a Short History of the Washington Consensus. Paper commissioned by Fundación CIDOB for a conference “From the Washington Consensus towards a new Global Governance”. Barcelona, September 24-25, 2004.

IV. The Emerging Economies Closing up Strategies at the
turn of the Millennium
Since the earliest times, the history of economics has been marked by the fundamental collision of two conflicting approaches regarding the question of economic development, those of the faithful adher-ents to the principle of the free market on the one hand, and those of the devotees of the strong, engaged state on the other. The outlines of this opposition already began to appear in the earliest schools of economics in the views of the physiocrats and the mercantilists. The two conflicting systems of thought emerged clearly in the 19th century in classical English economic theory (the principal representatives of which were Adam Smith and David Ricardo) and, on the other end of the spectrum, the views of American and German economists (first and foremost Alexander Hamilton and Friedrich List).
According to the adherents to the principle of free trade, the eco-nomic prosperity of the world is furthered if governments pose no ob-stacles to free trade, if they get rid of protective tariffs and limits on quantity, and forego any support for local or domestic enterprises and open their economies to foreign investment. In contrast, those believ-ing in the power of the pro-active state are convinced that in the case of underdeveloped countries free trade offers no mechanism or guaran-tee of growthbut merely allows more developed countries to consoli-date their power over the less prosperous.
During the 20th century various countries of Europe, first and foremost West Germany, demonstrated quite clearly that in its efforts to regulate and participate in the economy the state can play a very significant role in the competition with a developed market economy (as for instance the German state did at the time with Great Britain, see Bod, 1987). In the second half of the 20th century, however, the effec-
128
tiveness of state regulations in the promotion of economic growth was the most salient in the formerly colonised, newly independent states (Wonik, 2009). In the 1990s, there were debates regarding the extent to which the economic successes of many of the countries of Asia could be attributed to the conscious strategies of the governments of these states, but by the first years of the 21st century, this view has gained widespread consensus. This was particularly true given the dramatic economic decline suffered by many of the states of Latin America in the last decades of the 20th century, as these states had adopted poli-cies (the so-called Washington consensus) that essentially deprived the state of any role in promoting economic development and favoured the free market instead (Kőrösi, 2008).
Regarding the rapidly developing countries of the Far East, eco-nomic growth was not based on raw materials and sources of energy (indeed Malaysia, the country with the greatest wealth of raw materi-als and sources of energy, was the slowest among the rapidly devel-oping countries of the region, and neither South Korea nor Taiwan has significant amounts of either)raw material. Today economists and analysts are closer to a consensus. The successes of the countries of the Far East are due to their industrious and highly disciplined work forces, and perhaps more importantly to the economic policies of their governments playing a very deliberate and active role in promoting economic stability and growth.
In post-1990 Central and Eastern Europe, however ,economic policy was not administered pragmatically but along incontestable, eternal principles under the auspices of monetarism and adjacent neoliberal-ism. If a problem needed solution, neither its reasons have been asked, nor its best available solution according to the specific circumstances has been sought. Instead, the only question was how to solve the prob-lem according to the mainstream economic thought.
1. GLOBALISATION IN CENTRAL AND EASTERN EUROPE: THE THIRD WAVE OF GLOBALISATION IS CEE
In Central and Eastern Europe (CEE), and especially in Hungary, in the last decade of the 20th century FDI was of outstanding impor-tance in the transition countriesbecause without foreign ca-pital

Cou
ntry
/Law
Hun
-ga
ryTh
e C
zech
R
epub
licB
ulga
riaPo
land
Rom
ania
Slo
vaki
aS
love
nia
1st l
iber
aliz
atio
n of
fo
reig
n ow
ners
hip
1972
1985
190
1986
1970
1985
1965
The
perm
is-
sion
of 1
00%
fore
ign
owne
rshi
p
1988
1989
1991
1988
1989
1989
1989
Ope
ning
of s
tock
ex
chan
ge19
9019
9319
9219
9119
9519
9319
89
Com
pany
law
1988
1992
1991
1991
1990
1992
1993
Com
petit
ion
law
1990
1992
1991
1990
1991
1992
1993
The
mos
t im
port
ant
econ
omic
reg
ula
tion
s in
Cen
tral
-Eas
tern
Eu
rope
an c
ount
ries

130
the market economy could not have established itself in this region. Since sufficient domestic capital had not been accumulated for priva-tisation (e.g. in Hungary) immediately following the transition, the governments opened the door for foreign direct investment. Capi-tal accumulation in the regional economies played a key role in the economic transformation and growth, which preceded EU accession. According to Dobrinsky (2007), however, out of the three sources (do-mestic savings, FDI, bank loans) that helped eliminate the barriers to financial investments, banking loans played a more important role than foreign investments in Central and Eastern Europe, supposedly due to the quick establishment of a high-quality banking system.
Relevant academic works basically cite two reasons for capital inflow to Central and Eastern Europe during the period of market economy transition: investors were attracted by either the opportunity to gain new markets or to reduce production costs (low labour cost, tax allow-ances, etc.) Most studies argue that market oriented investments were dominant (Meyer, 1995; Lankes and Venables, 1996; Tüselmann, 1999; EBRD survey in 2000). The significance of cost reduction was only de-tectable in the case of export-oriented companies and tax allowances alone did not prove to be an effective tool in motivating foreign inves-tors. (Beyer, 2002; Sedmihradsky, M. – Klazar, St. 2002; Edmiston, K. – Mudd, S. – Valev, N. 2003)
The transparent and reliable legal background was much more im-portant in spatial decisions of investors.
After analysing the capital inflow of the period directly preceding EU accession, Patkó (2003) found that the factors, which affected investor decisions related either to regional characteristics (geographical loca-tion) or to sub-regional advantages. As for the former, the countries in the region are nearly identical, while they are different regarding the latter. Sub-regional advantages can be broken down to further sorting criteria like profitability (market size, input costs, and accessibility), country-specific features (political and economic risk, macroeconomic stability, stability of the institution system) and the method, pace and extent of privatisation. According to Patkó’s analysis, the countries under review did not show any major differences regarding profitabil-ity and country-specific features between 1999 and 2003. There were differences, however, with regards to privatisation. Due to this single

131
factor, direct capital investments in the region between 1999 and2003 were as follows: compared to the respective GDP figures, the highest FDI flowed to the Czech Republic and Slovakia while this indicator re-mained unchanged for Hungary and Poland. Therefore, privatisation was decisive for annual FDI flows to the region.
The time elapsed since EU accession (2004) is relatively short for the analysis of capital flows in that period. The analysis is also made difficult by the fact that for a long time now, the region has not been regarded as a separate area in international statistics but as part of the developed countries category (where Western countries belong to). Whether this classification is valid in terms of capital market competi-tiveness is still to be seen.
.. Background and motivations
UNCTAD elaborated an FDI index, which serves to determine the ability of countries to attract foreign capital. International and region-al findings show that capital investment decisions are influenced by the following factors: market size, openness and competitiveness of the country’s economy, development of infrastructure, quality of human capital, country risk, impact of privatisation, tax policy, tax rate, cost and productivity of labour.
The actual values of these variables before and after EU accession need to be analysed for the specific countries in the region. The result-ing benchmark exercise will not only reflect the impact of these factors on the countries’ FDI potential but also point out the different affects EU accession had on the economies concerned.
Change of variables in the inward FDI potential index in Central and Eastern Europe
Market size
Several indicators are in use for measuring the market size of an FDI host country. The most common indices are GDP, GDP growth rate, population and income per capita.
In the first period (1996–2000), the growth rate of CEE countries (except for Estonia) changed more or less simultaneously in a 2-5 per
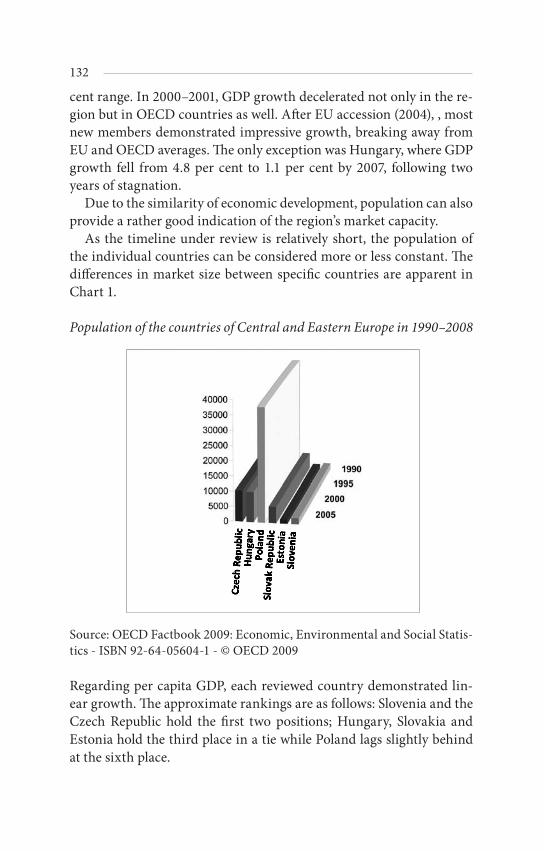
132
cent range. In 2000–2001, GDP growth decelerated not only in the re-gion but in OECD countries as well. After EU accession (2004), , most new members demonstrated impressive growth, breaking away from EU and OECD averages. The only exception was Hungary, where GDP growth fell from 4.8 per cent to 1.1 per cent by 2007, following two years of stagnation.
Due to the similarity of economic development, population can also provide a rather good indication of the region’s market capacity.
As the timeline under review is relatively short, the population of the individual countries can be considered more or less constant. The differences in market size between specific countries are apparent in Chart 1.
Population of the countries of Central and Eastern Europe in 1990–2008
Source: OECD Factbook 2009: Economic, Environmental and Social Statis-tics - ISBN 92-64-05604-1 - © OECD 2009
Regarding per capita GDP, each reviewed country demonstrated lin-ear growth. The approximate rankings are as follows: Slovenia and the Czech Republic hold the first two positions; Hungary, Slovakia and Estonia hold the third place in a tie while Poland lags slightly behind at the sixth place.

133
When examining the role of market size in FDI inflows, the inter-relations between these two factors must also be taken into considera-tion as pointed out in academic works (Agarwal, 1980; Choe, 2003), since direct capital inflow usually triggers a GDP increase in the host country. Consequently, the direction of the cause-and-effect relation-ship is difficult to identify.
Foreign trade/GDP ratio in the CEE region, 1995-2007
Source: OECD Factbook 2009: Economic, Environmental and Social Statis-tics - ISBN 92-64-05604-1 - © OECD 2009
Openness and competitiveness of the economy
Simirarly the direction of causality is unclear in respect of competi-tiveness and openness in exports and imports as well. While direct capital inflow may change the export-import structure and orientation of a country significantly, it can also affect the volume and balance of imports and exports.
One of the best indicators of economic openness is the exports-im-ports/GDP ratio. In the countries of the CEE region (except for Po-land), this indicator significantly exceeded the OECD and EU average in the period under review. While this ratio was high initially, it grew consistently after 1996. After peaking in 2000, it fell slightly at the be-ginning of the new millennium. In the wake of EU accession, how-

134
ever, the region’s dependence on foreign trade began to rise again and reached outstanding levels compared to OECD average which fluctu-ated between 20 and 30 per cent in these 12 years. Openness in foreign trade correlates with country size and thus it is not by accident that Poland’s export-import/GDP ratio blends smoothly with the EU aver-age (see Chart).
Number of telephone lines, use of energy
The key role of infrastructure in capital investment decisions is gain-ing more and more emphasis in academic works. In UNCTAD’s ap-proach, the significance of traditional infrastructure is measured by commercial energy use while the presence of modern IT and telecoms infrastructures is indicated by the growth of telephone main lines. The importance of the latter is pointed out by Moosa et al. (2005) in an article, which suggests that out of all reviewed and possible factors that determine inward FDI potential, the role of telephone penetration is generally proved. Regarding the number of telephone lines and num-ber of households with Internet access and a PC, CEE countries have shown a rather dynamic development. While the telephone penetra-tion was 25–50 per cent of OECD average in 1991, each new member state reached at least 90 per cent of the related OECD figure by 2007 while the Czech Republic and Slovenia even exceeded it. The number of Internet user households has grown at a somewhat lower rate but it is also catching up with the European average.
R+D expenditures and share of tertiary level students
The quality of human capital and technology in an FDI host country is equally important for enticing capital and for the efficiency of tech-nology spillovers (Dimelis, (2005); Sanna – Randaccio, 2002). Both investor and host can only benefit from a capital investment project if a sufficiently developed knowledge base is in place for adapting the imported technology. In academic works, the share of R+D expendi-tures as a percentage of GDP and the ratio of tertiary education gradu-ates within the total population are considered good approximations for determining the quality of this knowledge base. Chart 3 shows the average share of R+D expenditures in GDP in the CEE region, in the EU and in OECD countries. It is apparent that the CEE region lags be-
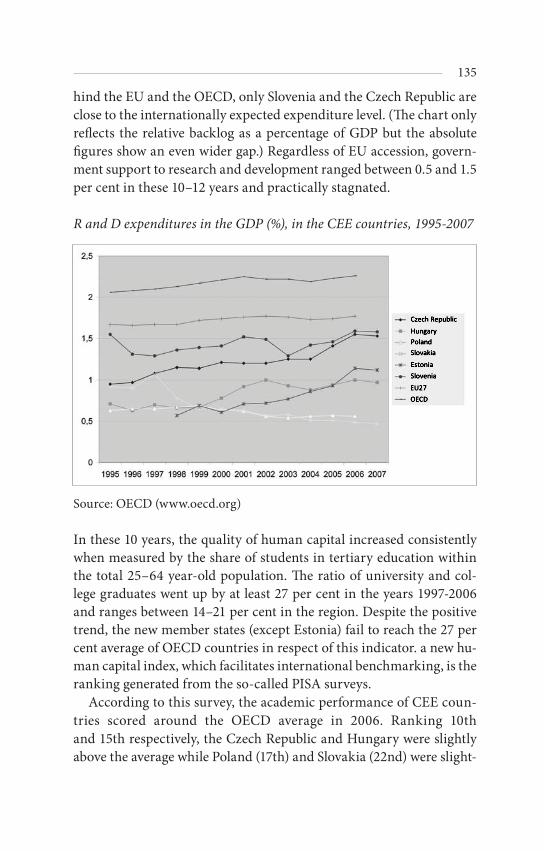
135
hind the EU and the OECD, only Slovenia and the Czech Republic are close to the internationally expected expenditure level. (The chart only reflects the relative backlog as a percentage of GDP but the absolute figures show an even wider gap.) Regardless of EU accession, govern-ment support to research and development ranged between 0.5 and 1.5 per cent in these 10–12 years and practically stagnated.
R and D expenditures in the GDP (%), in the CEE countries, 1995-2007
Source: OECD (www.oecd.org)
In these 10 years, the quality of human capital increased consistently when measured by the share of students in tertiary education within the total 25–64 year-old population. The ratio of university and col-lege graduates went up by at least 27 per cent in the years 1997-2006 and ranges between 14–21 per cent in the region. Despite the positive trend, the new member states (except Estonia) fail to reach the 27 per cent average of OECD countries in respect of this indicator. a new hu-man capital index, which facilitates international benchmarking, is the ranking generated from the so-called PISA surveys.
According to this survey, the academic performance of CEE coun-tries scored around the OECD average in 2006. Ranking 10th and 15th respectively, the Czech Republic and Hungary were slightly above the average while Poland (17th) and Slovakia (22nd) were slight-

136
ly below it. (OECD Fact book, 2009; Economic, Environmental and Social Statistics – ISBN 92-64- 05604-1 – © OECD, 2009)
Country risk
We used Euromoney data and methodology to specify the extent of country risk. Euromoney usually publishes two country risk rankings per year, one in March and one in September. As the volume of capital flows into a country is affected more by trends that prevail at the be-ginning of the year than the risk factors published in the fourth quar-ter, we used the March data as the starting point (except for 1998, be-cause only September data are available for that year.) In Euromoney’s methodology, country risk is calculated from the weighted average of nine categories. a higher score means a higher ranking for a country and the higher the ranking is the lower the associated risk will be. The categories taken into consideration for weighting are as follows:
– economic performance (25 per cent weighting),– political risk (25 per cent weighting) primarily includes the risk
of non-payment or non– repatriation. Scoring is performed by specialists of local credit
institutions,– debt indicator (10 per cent weighting), generated using ratios
from the World Bank’s debt– tables (current account deficit, sovereign debt as a GNP percent-
age),– debt in default or rescheduled (10 per cent weighting), based on
the World Bank’s debt tables,– lending ranking (10 per cent weighting), based on Moody’s rank-
ing,– access to bank finance (5 per cent weighting), calculated with
a view of the ratio of– disbursed loans vs. the country’s GNP,– access to short-term finance (5 per cent weighting), based on
OECD database,– access to capital markets (5 per cent weighting), heads of debt
syndicate and loan– syndications rated each country’s accessibility to the internation-
al bond and syndicated

19
9819
9920
0020
0120
0220
0320
0420
0520
0620
0720
08
Hun
gary
5565
.861
.872
.170
.271
67.7
68.8
268
.50
--
Cze
ch R
epub
lic52
.362
60.2
64.2
68.5
6766
.569
.38
68.8
270
.24
70.6
7
Pola
nd52
.162
.161
.763
.465
.865
.262
.865
.24
66.2
667
.80
68.3
2
Slo
veni
a55
.470
.171
.371
.873
.874
.376
.778
.69
79.6
281
.75
81.1
4
Slo
vaki
a
48.3
48.4
56.9
62.5
59.3
62.4
64.7
364
.87
66.7
067
.37
Sour
ce: E
urom
oney
Cou
ntry
risk
in th
e CEE
regi
on a
ccor
ding
to E
urom
oney
, 199
8-20
08

138
– loan market,– discount on forfeiting (5 per cent weighting), showing the differ-
ence from the risk free – alternative.
The countries in the region demonstrated a more or less similar trend of improvement and stagnation in the period under review and their respective risk ratings were not too different either. 1998 was an ex-traordinary year as the Russian stock exchange crisis triggered a dete-rioration of risk ratings throughout the region.
Changes in other factors that determine the region’s capital market competitiveness
Besides the elements of the inward FDI potential index, two factors play a key role in shaping the capital market competitiveness of CEE countries: tax policy and the cost of human capital. The individual countries made serious steps to influence both. Although academic works failed to prove the existence of a significant correlation between the tax rate and capital inflow (Feld-Heckemeyer, 2009), CEE coun-tries are running a tax race for investors and take turns in offering the highest benefits and tax cuts to them.
According to the cited academic publications, labour costs are im-portant for export-oriented investments and therefore they must be part of the analyses.
Tax policy
In the analysis of tax burdens, benchmarking is based on the tax rates of both investing countries (primarilyl EU member states) and capi-tal market competitors (i.e. CEE countries) in order to reveal existing benefits and drawbacks.
In competitor countries, the legal frameworks already harmonised with EU legislation before EU accession. Foreign investors enjoyed the same rights as their domestic peers. They were fully entitled to acquire equity stakes in companies and the common company forms were present throughout the region. The freedom of capital inflows, capi-tal, and profit transfers were all provided for in Central and Eastern Europe. Consequently, it is taxes where a significant difference can be captured in respect of competitiveness. Corporate tax is an outstand-

139
ingly important tax type for both investor and host countries. From a macroeconomic standpoint, it is a revenue category while on a mi-croeconomic level it is a cost. The reason for its significance is that the corporate tax rate has a fundamental effect on the will to enterprise. Therefore, the tax competition of host countries primarily focused on this tax type. Hungary set a corporate tax rate that was extraordi-narily low not only in comparison to the EU average (30–35 per cent) but compared to the tax rates of other Central and Eastern European countries as well. After the initial 40 per cent, Hungary’s corporate tax rate was reduced dramatically from 36 to 18 per cent in 1995. This rate was the lowest in the region in the late nineties. (From 2004 on, business only paid a 16 per cent tax on their profits.) As shown in the table below, Hungary retained its competitive advantage in respect of corporate tax in the 21st century as well, since Slovakia and Poland were the only rival countries that introduced a similarly low tax rate.
Corporate taxes in the CEE countries in 2007
Country Corporate tax rate (%)
Czech Republic 24.0
Hungary 17.33 (16.0)
Poland 19.0
Slovakia 19.0
www.oecd.hu
(Just for comparison the corporate tax rate was 35 per cent in the USA, 30 per cent in the UK and 26 per cent in Germany in 2007.) After EU accession, however, a new challenge emerged and the contest entered into a new phase as many countries introduced a flat tax. Although most of these countries are in Central and Eastern Europe, Hungary is not among them. (Estonia, Latvia, Lithuania, Romania and Slovakia introduced a flat tax, too.) As a flat tax regime is simple, easy to manage and, last but not least, involves a low rate, it provides the most attrac-tive environment to companies.
On an international benchmark, CEE countries are below the OECD average regarding the share of income tax revenues in the GDP. In the
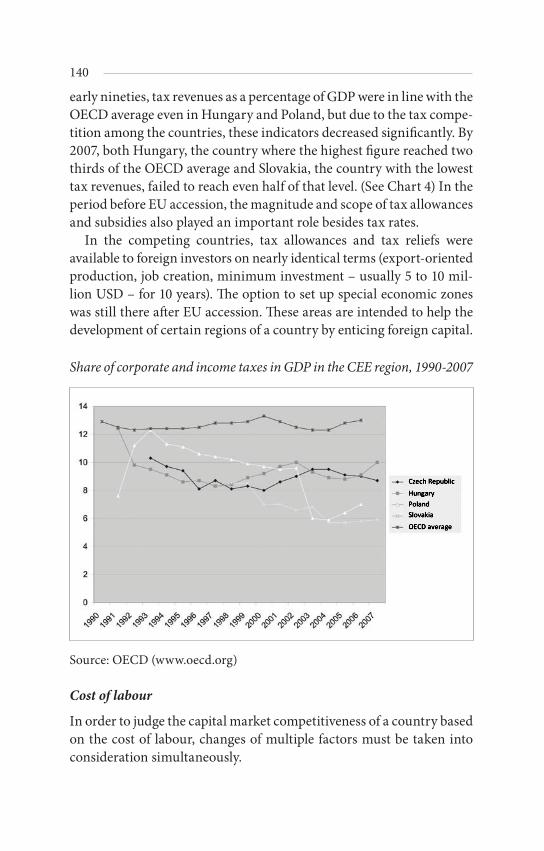
140
early nineties, tax revenues as a percentage of GDP were in line with the OECD average even in Hungary and Poland, but due to the tax compe-tition among the countries, these indicators decreased significantly. By 2007, both Hungary, the country where the highest figure reached two thirds of the OECD average and Slovakia, the country with the lowest tax revenues, failed to reach even half of that level. (See Chart 4) In the period before EU accession, the magnitude and scope of tax allowances and subsidies also played an important role besides tax rates.
In the competing countries, tax allowances and tax reliefs were available to foreign investors on nearly identical terms (export-oriented production, job creation, minimum investment – usually 5 to 10 mil-lion USD – for 10 years). The option to set up special economic zones was still there after EU accession. These areas are intended to help the development of certain regions of a country by enticing foreign capital.
Share of corporate and income taxes in GDP in the CEE region, 1990-2007
Source: OECD (www.oecd.org)
Cost of labour
In order to judge the capital market competitiveness of a country based on the cost of labour, changes of multiple factors must be taken into consideration simultaneously.

141
These factors are as follows: net value of wages, changes of income tax obligations and social security contributions levied on wages, other contributions payable by employers and, last but not least, the changes of labour productivity. The changes of labour costs in four CEE coun-tries are shown in Chart 5. In these four countries, wages grew con-tinuously between 1995 and 2007. No significant differences could be detected regarding average hourly wages. The graphs regarding wages of the Czech Republic and Hungary were almost identical.
Out of the other rivals, Estonia and Slovakia had more competitive wages than the other two.
Unit labour cost in the whole economy in the four new member countries, 1995-2007, USD, PPP
Source: OECD (www.oecd.org)
Gross wages are fundamentally determined by the rate of income tax and employee contributions charged on net wages. In the region, Hun-gary has the highest percentage rate of taxes and contributions charged on average wages. In the past 7 years of the examined period, these rates have been consistently above 50 per cent while counted at an av-erage, the related burdens are 10 per cent lower in the other countries of the region. By introducing a flat tax, Slovakia reduced the overall rate of taxes charged to employees to 38.5 per cent by 2007, which more or less harmonises with the OECD average (37.7 per cent).

142
From the employer’s (foreign investor’s) viewpoint, the rate of social security contribution and employer contribution are more important as these levies are payable exclusively by the employer. Social security contributions charged on wages are nearly identical in the countries under review and match the EU average (social security contributions in EU countries range from 25 to 35 per cent). Slovakia continues to be an exception with reducing one of the highest rates, 38 per cent to less than 15 per cent over 10 years.
If we were to pass a judgement strictly based on percentages, we could conclude (especially for Hungary) that the overall personnel-related expenditures of businesses operating in CEE countries are higher than those of their Western European peers (Schlett, 2003). This approach can be especially damaging for a “superficially informed” foreign in-vestor when making investment decisions.
It is a fact, however, that wage costs, i.e. the calculation base of any income tax and other employer contributions charged on wages are far below the European level in the region. Average gross wages in the euro zone were 8 times higher than Hungarian wages. Leter on due to economic growth, this multiplier dropped to 5 (Eurostat).
From the charts, it can be seen that only Mexico had “more com-petitive” hourly wages than the CEE countries in 2007.
Unit labour cost in the whole economy 1995-2007, USD, PPP
Source: OECD (www.oecd.org)

143
The significance of labour costs cannot be analysed without examin-ing the productivity of labour. The correlation between the two can be measured with the ULC indicator. ULC (Unit Labour Cost) is the ratio of total labour costs to productivity. Productivity can be expressed ap-proximately with the added value generated by the domestic workforce (i.e. the GDP). Obviously, the lower the indicator value, the more com-petitive and attractive the country is for investors. The ULC indica-tor enables the comparison of different countries in terms of labour market productivity without having to struggle with the conversion of national currencies.
Yearly changes of ULC indexes in the CEE region
Source: OECD (www.oecd.org)
The ULC index improved (i.e. decreased) consistently in 1995-2000. From 2000 on, wages grew at a higher rate than productivity. After 2002, Poland’s ULC index decreased the most, and then in 2005 Es-tonia’s ULC figure deteriorated suddenly. In the rest of the region, the respective ULC indices changed together.
In summary, we can conclude that as long as the productivity of labour grows at a higher rate than labour costs or as long as the ratio of these two remains below the corresponding figure of rival coun-tries, changes in labour costs do not affect adversely the region’s FDI potential.

144
Evaluation of empirical analysis
The trends, which individual macroeconomic factors showed before and after EU accession, were very similar in the countries concerned. EU integration had a positive effect on GDP growth in each country except Hungary. The openness of the region’s economies in terms of foreign trade and the share of exports in the GDP were far above the respective OECD averages. With the exception of relatively large Po-land, this openness continued to increase in the region after 2004. Telephone and internet penetration, which represent modern infra-structure, demonstrated dynamic growth in each surveyed country and enabled new member states to catch up with the average of de-veloped countries. R+D spenditure as a percentage of the GDP lags behind the level required in EU and OECD countries – only Slovenia and the Czech Republic are close to the related average figures. Despite the significant growth recently, the ratio of tertiary education gradu-ates in the total population fails to reach the 27 per cent level of OECD countries. Regarding country risk, there is hardly any difference in how the countries of the region are viewed by investors. Changes in tax policy, including corporate tax cuts were the most significant in Hungary until 2004 when Slovakia and Poland followed Hungary’s ex-ample. By introducing a flat tax, Slovakia, the Baltic states and Roma-nia created the most favourable taxation environment for investors in the region. While wages in CEE countries do not differ significantly, tax and social security contribution charges levied on wages are 10 per cent higher in Hungary than elsewhere in the region. At the same time, the ULC index is roughly similar all over Central and Eastern Europe.
Testing the impact of capital market competitiveness factors on capital investments
In order to test the impact of factors of capital market competitiveness on capital market, we applied a regression function to test the pre- sumed effect of macroeconomic changes on inward FDI flows Katona, 2009). The formula used in the linear regression test is in the enclosure.
The survey encompassed the analysis of correlations between indi-vidual factors and foreign direct investment and examined the explan-atory power of the entire model (i.e. all factors combined).

145
The databases of the OECD and the UNCTAD WIR helped to iden-tify and to assess the volumes of affecting factors against an interna-tional benchmark. Only those variables that were fully available for the entire period have been added to the model.
The explanatory variables reflect factors that characterize the coun-try’s competitiveness and the extent of economic policy interventions: market size, in trade openness, state of modern infrastructure, quality of human capital1, cost of labour and tax rates.
The regression formula uses two direct capital data sets among out-put variables. One set demonstrates short-term effects and FDI chang-es in a year (flow data) while the other set (stock data) focuses on long-term effects (and the ability to retain direct capital). As for FDI flow datas the reviewed period was 95-00, while for stockdatas 00-07.
The survey involved the following countries: Hungary, Czech Repub-lic, Slovakia and Poland. (Due to some missing labour cost data, Po-land was not added to every model.)
It is more efficient to assess regression test results by examining the combined effect of variables: with this approach, three explana-tory variables must be excluded from the model, since their excessive impact could overshadow the significance of other equally important factors. The three factors are as follows: the volume of imports and exports and hourly wages, which represents the cost of labour. (The available data sets enabled only an impact analysis of labour costs for three countries: Hungary, Czech Republic, and Slovakia).
All three explanatory variables have so high explanatory power that they force the other factors out from the model. This fact alone would not call for their skipping in model analyses, but due to various rea-sons their revision is still necessary.
1 There are various approaches to capture the quality of human capital: number of students in primary education, in primary and secondary education, in second-ary and tertiary education, only in tertiary education or in education in general, or their share in the total population. Each approach can be reasonable and inter-esting on its own. We have chosen the number of students in tertiary education because this variable is used in the UNCTAD model and because multinational companies often employ college graduates in positions where a lower education would also be sufficient as practically this is the segment of the workforce that speaks foreign languages.

146
Regarding imports and exports, presumably they are not explana-tory, but dependent variables. It also means that the growth of a coun-try’s import and export performance is induced by FDI inflows and not the other way round and thus the direction of causality are just the opposite. This close, almost deterministic correlation highlights many things, nevertheless it does not help to understand the motivations be-hind foreign investor decisions.
The increase of labour costs has a positive (!) and very strong explan-atory power regarding capital investment decisions, which seems to contradict the fundamental assumptions presented in academic works.
At the same time, empirical findings could not confirm at all the as-sumed negative correlation between the cost of labour and FDI inflow, however,it is considered all too obvious in theory.
Empirical facts reflect a very mixed picture and encompass all kinds of effects from significantly negative through neutral to significantly positive correlation. Therefore, an increase in the cost of labour may even trigger a contrary response from investors and attract them in-stead of chasing them away. Several explanations are possible. Firstly, growing wages can generate a boom in capital-intensive industries and thereby help capital inflows. However, this phenomenon is not typical of FDI flows to the CEE region. Secondly, the effect of labour cost can-not be separated from the productivity of labour. If the productivity of labour in the host country grows faster than labour costs, the country can remain attractive for capital investors. The lower the cost of labour per total output is (approximated in our model with the ULC index) , the more attractive the country is for investors. (As expected, the ULC index is a factor with negative or weak/medium effect in the regression equation but it does not help to explain the entire model.)
Last but not least, the cost and productivity of labour strongly cor-relates with the quality of workforce, which is another decisive factor regarding inward FDI potential.
The strong correlation identified in the regression model for the Central European Region mainly stems from the latter finding. In other words, it probably relates to the fact that the increase of wages demonstrates the region’s economic convergence in the quality and cost of human capital.
If we remove the impact of these three factors from the model (the data set for Poland did not include the cost of labour anyway), the fol-

147
lowing correlations can be identified regarding FDI flow and stock vol-umes.
In all four countries, the telephone penetration index provides the most powerful explanation to the flow output variable, which reflects the short-term impact. This finding harmonizes with the conclusion of a former analysis which was based on an extensive database. Moosa – Cardac (2003) tested the scope of the inward FDI potential index in an empirical research project that covered 140 countries. The survey found that two index elements, the number of telephone lines and the share of exports in the GDP showed a significant and consistent cor-relation to direct capital inflow everywhere.
(Althought our analysis confirmed the impact of exports the direc-tion of causality is likely to be reverse in the other countries reviewed. This way, export growth is generated by FDI import and not the other way around.)
The number of phone lines per inhabitant, which reflects the quality of modern infrastructure, also appears among FDI stock data, but it only ranks third in respect of explanatory power. In Central and East-ern Europe, the first and second most important factors behind long-term capital investment decisions are the ratio of tertiary education graduates to the total population and corporate tax rate. This result underlines the related statements of the survey, which analyzed the motivators of FDI flows to Hungary up to 2003, and rendered a nearly deterministic significance to the growing ratio of tertiary education graduates in determining the FDI stock (Katona, 2007).
Correlation of macroeconomic factors to competitiveness and public spending
We assumed the presence of two latent factors behind the 17 macro-economic indices covered by the model. The first is the capital market competitiveness factor defined by the UNCTAD; the second is the role of government influence which is considered to be important in Cen-tral and Eastern Europe according to the relevant academic papers. We tested the relation of explanatory factors to the individual components by way of a factor analysis. The results are presented in the enclosure. Factors that are strongly related to the first component, which includes average wages, telephone penetration, GDP per capita, productivity of labour, ratio of tertiary education graduates, R+D expenditures and the GDP growth rate.

148
Without any simplification, it is fair to declare that these macro-economic variables do contribute to the competitiveness of a country.
Nevertheless, the variables behind the second component are more interesting. The positive correlation between the second component and the ratio of social security contributions, the size of profit and in-come tax revenues and even R+D expenditures seem to confirm the existence of government interference as a factor. The negative correla-tion to the GDP growth rate and the share of exports, however, is sur-prisingly but does not prove that the assumed latent structure would be wrong.
As a next step the impact of these two factors on foreign capital in-vestments were examined both in respect of FDI flow and FDI stock and we came to an interesting yet not surprising finding: Both in the short and the long run, only the first component (competitiveness) has a sig-nificantly positive influence on foreign capital investment decisions.
The outcome of the analysis pointed out that the improvement in the quality of human capital had a fundamental, decisive effect on foreign investment decisions not only in Hungary, but also in all CEE coun-tries. Therefore, the individual countries in this region must focus on attracting products and services having a high added value. This is the area where these countries can retain their competitive edge over other regions in the world in attracting FDI. It also means that the reduction of production costs and thus labour costs schould not be a primary ob-jective. On the contrary, investments into highly educated workforce can increase the region’s attractiveness as a capital investment target. At the same time, the quality of human capital is a decisive element of the latent component behind the explanatory variables of a country’s competitiveness, and competitiveness is the factor that affects foreign capital investment decisions both in the short and the long run.Enclosure
Regression modell:
Where X stands for the group of explanatory variables, Z is the group of variables defining the attracting capacity of Eastern Central European
t
n
j
m
jegjZjtbjXjtaFDI
1 10

149
countries. The survey covers analysis of the foreign direct investment correlation, and by means of filtering autocorrelation the examination of the explanatory power of the entire model (all factors combined).
The volume of the active components were determined and evalu-ated in an international context by OECD and UNCTAD WIR data-bases. Only those variables were included in the model, which have been fully available for the entire period.
.. Scope and structure of the third wave of globalisation
Socialist countries in the Central European region has started to par-ticipate in globalisation only at the end of the 80s, when the socialist economic system were to collapse.
As the same time as legal conditions had made it possible, foreign direct investments started to flow to the Eastern European ex socialist countries from the late 80s.
In 1990 the total FDI inflow to CEE countries were merely 560 mil-lion USD and represented less than 0,3% of total FDI flow of the world, but by 2000 FDI inflow rose to over 10 bn USD, and later increased to 54 bn USD by 2005. Nonetheless, even the highest level FDI inflow to the region has never been more than 3.1% of the world share and it seems that after the 2008 economic crisis FDI inflow to this region has also dropped rapidly, representing 2.2-2-4% of total FDI flows of the world.
FDI inflow to the CEE countries (Bulgaria, Czech Republic, Estonia, Hungary, Latvia, Lithuania, Romania, Slovakia, Slovenia
% of the world bn USD1990 0.26 0.561995 2.56 8.722000 0.81 13.162005 3.11 37.662006 2.56 54.302007 2.22 40.882008 2.35 44.78

150
2009 1.18 15.912010 1.49 19.79
Source: IBRD, UNCTAD, National Banks
FDI stock Pearson correlation R2 sig Pearson
correlation R2 sig
Volume of Im-port (USD) 0.825 0.681 0.000 0.980 0.961 0.000
Volume of Ex-port (USD) 0.775 0.601 0.000 0.950 0.902 0.000
Average hourly wage (USD purchasing power parity)
0.668 0.446 0.000 0.912 0.831 0.000
Population (capita) 0.528 0.278 0.000 0.426 0.181 0.015
Number of phone lines / capita (%) 0.514 0.265 0.000 0.720 0.519 0.000
Ratio of persons educated on de-gree level within the society (%)
0.499 0.249 0.001 0.789 0.622 0.000
GNI (USD pur-chasing power parity)/capita (%)
0.367 0.135 0.006 0.515 0.265 0.003
Source: IBRD, UNCTAD, National Banks

151
For the purposes of its annual reports (the World Investment Report, WIR), UNCTAD (United Nations Conference on Trade and Develop-ment) elaborated a number of indicators and indices to measure the im-pact and significance of capital inflow to different regions of the world from the viewpoint of host countries. Indices of this series that deserve mentioning include FDI flow/gross investment (Gross Fixed Capital) ratio, changes in the number of bilateral or multilateral agreements, the transnationalisation index, FDI performance and FDI attractive-ness. While UNCTAD also tracks the trends of these indicators per re-gion, it considered Central and Eastern European (CEE) countries as a separate region only until 2004, the year of their EU accession. Since that year, the countries concerned have been shown together with other EU member states in the annual reports, and therefore data gathering is only possible on an individual country level. Below we analyse the
GDP growth rate(%) 0.350 0.123 0.015 0.259 0.067 0.184
R+D expendi-tures /GDP (%) 0.063 0.004 0.659 0.269 0.072 0.143
Tax rate on aver-age wage (%) -0.103 0.011 0.575 0.149 0.022 0.451
Revenues from
taxes /GDP (%)-0.107 0.011 0.455 -0.006 0.000 0.977
Foreign trade / GDP (%) -0.283 0.080 0.042 -0.092 0.009 0.615
GDP (USD purchasing power parity)
-0.327 0.107 0.014 -0.325 0.105 0.070
ULC (%)(wage of work force/ surplus val-ue of work force)
-0.362 0.131 0.010 -0.576 0.332 0.001
Ratio of social security contri-bution in terms of wages (%)
-0.387 0.150 0.003 -0.367 0.134 0.039
Public ex-penditure on education (%)
-0.390 0.152 0.044 -0.428 0.183 0.042
Value of corpo-rate tax (%) -0.405 0.164 0.002 -0.486 0.236 0.005

19901991
19921993
19941995
19961997
19981999
Bulgaria
0.000.06
0.040.04
0.110.09
0.110.50
0.540.82
Czech
Republic
0.000.00
0.000.65
0.882.57
1.441.29
3.706.31
Estonia
0.000.00
0.080.16
0.210.20
0.150.27
0.580.31
Hungary
0.551.46
1.482.35
1.144.80
3.294.15
3.343.31
Latvia0.00
0.000.03
0.050.21
0.180.38
0.520.36
0.35
Lithuania0.00
0.000.00
0.030.03
0.070.15
0.350.93
0.49
Rom
ania0.00
0.040.08
0.090.34
0.420.26
1.222.03
1.04
Slovakia
0.000.00
0.000.20
0.270.24
0.350.17
0.560.35
Slovenia
0.000.00
0.110.11
0.120.15
0.170.33
0.220.11
CE
E total
0.561.56
1.823.69
3.328.72
6.308.81
12.2513.08
world Total
212.30166.05
175.84233.30
258.87341.28
391.79485.25
724.621224.10
FDI inflow
to the CEE region, 1990-1999, bn USD
Source: IBRD
, UN
CTA
D, N
ational Banks

2000
2001
2002
2003
2004
2005
2006
2007
2008
2009
2010
Bul
garia
1.00
0.81
0.90
2.10
2.66
4.31
7.76
13.2
19.
983.
392.
17
Cze
ch R
e-pu
blic
4.99
5.64
8.50
2.02
4.98
11.6
05.
5210
.61
6.57
2.87
6.72
Est
onia
0.39
0.54
0.28
0.92
0.97
2.94
1.79
2.72
1.75
1.91
1.54
Hun
gary
2.77
3.94
3.01
2.18
4.28
7.63
6.10
6.48
4.00
3.35
4.00
Latv
ia0.
410.
130.
250.
300.
640.
711.
662.
321.
360.
090.
37
Lith
uani
a0.
380.
450.
710.
180.
771.
031.
842.
022.
070.
130.
62
Rom
ania
1.04
1.16
1.14
1.84
6.44
6.48
11.3
99.
9313
.88
4.85
3.45
Slo
vaki
a2.
050.
004.
100.
563.
042.
414.
173.
363.
23-0
.03
0.55
Slo
veni
a0.
140.
501.
660.
300.
830.
540.
651.
531.
94-0
.64
0.37
CEE
tota
l13
.16
13.1
820
.57
10.4
024
.61
37.6
640
.88
52.1
744
.78
15.9
119
.79
wor
ld T
otal
1623
.24
888.
8674
6.28
650.
6078
3.33
1211
.07
1594
.55
2352
.05
1905
.62
1345
.82
1331
.50
Sour
ce: I
BRD
, UN
CTA
D, N
atio
nal B
anks
FDI i
nflow
to th
e CEE
regi
on, 2
000-
2010
, bn
USD

154
changes of the transnationalisation index, FDI performance and FDI attractiveness in the region. There are several reasons for selecting these indicators from the set described above. Firstly, these ratios provide the most information regarding competitiveness. Secondly, in respect of the other indicators, the trends in CEE countries do not differ signifi-cantly from the global average. Thirdly, the historic figures of these in-dices are available in UNCTAD annual reports for the past 15–20 years.
The level of transnationalisation can be applied to international companies and countries. For the purposes of our analysis, the latter approach is of interest. The level of a country’s transnationalisation is calculated as the average of four ratios: the country’s annual FDI (flow)/gross capital investments, FDI (flow)/GDP and the contribution of the local subsidiaries of foreign parent companies to the country’s GDP and employment. Based on this calculation, the average trans-nationalisation index of developed countries was nearly 25, while the related figure equalled 20 in the developing region and 16 in CEE countries in 2003 (WIR, 2004). Underneath the average points, how-ever, significant differences were found and the deviation of ratios was considerable even for specific countries.
In 2003 Macedonia, Estonia, Hungary and the Czech Republica chived the best scores in the region, with the other countries lagging far behind. The level of transnationalisation in these four countries was above 30 points or close to it, which is outstanding both on a re-gional or global scale. This picture changed somewhat by 2005 but the significance of foreign capital continued to increase. As mentioned be-fore, CEE countries were transferred to the group of developed coun-tries in relevant statistics. However, their exposure to international capital remained either unchanged or increased after accession to the EU. Following Belgium and Luxemburg, from the third to the seventh in rank we find CEE countries. Their respective indices were between 33–49 points, significantly exceeding (actually almost doubling) the group average of 25 points (WIR, 2008). This index value indicates that foreign capital plays a decisive role in GDP generation, capital invest-ments and employment in these countries.
The FDI performance index shows a country’s share in global for-eign capital investments versus the country’s share in the global GDP. If the resulting figure is above 1, the country attracts more capital than generated by its own economic performance. Obviously, a figure below 1 indicates that the country’s attractiveness is under the performance

155
of its economy. In the years from 1988 through 2003, CEE countries consistently achieved a figure above 1 and the average index equalled 1.35 by the end of the period. In the case of transforming and emerging countries this high value is not surprising.
UNCTAD ranks the countries based on the FDI performance index. Surveys carried out in 2001–2003 have shown Estonia ranked tenth on a global ranking, which was the best score in the region. Slovakia and the Czech Republic ranked 12th and 13th. Hungary, Lithuania ranked 33rd and 41st respectively, while Poland slid back to the 68th position. After its EU accession, Estonia was the only country that could retain and improve its position (to 8th). No other new member state could make it to the first 20 countries.
The decrease of the performance index does not necessarily mean a setback. It rather shows that similarly to other developed countries, the new member states reached a quasi equilibrium regarding foreign capital influx, which matches their actual level of development (market size), and thus does not deviate from the group average.
The FDI attractiveness (inward FDI potential) index is a more com-plex indicator. The following twelve variables are needed to calculate it: GDP growth rate, GDP per capita, share of exports in GDP, num-ber of phone lines and mobile phones per 100 inhabitants, commercial energy use per capita, share of R+D expenditures in gross national in-come, share of tertiary level students in the population, country risk, exports natural resources as a percentage of the world total, imports of electronics and automobiles as a percentage of the world total, FDI influx as a percentage of the world total.
By the early 21st century, Central and Eastern Europe caught up with the global average as its inward FDI potential index reached 0.221. (The global average was 0.220). However, considering the 1988–2003 average, none of the region’s countries made it to the world’s top 25 countries in terms of inward FDI potential. This situation did not change after their EU accession either, as new member states’ scores ranged between 33 and 53 on the global ranking.
Rank of the countries in CEE concerning FDI performance and potential index between 2005-2007
FDI performance index FDI potential index
2005 2006 2007 2005 2006 2007

156
Czech Republic 31 34 41 39 39 ….
Estonia 6 9 8 35 34 ….
Hungary 40 38 45 42 41 ….
Latvia 47 33 31 43 42 ….
Livonia 69 52 53 40 38 ….
Poland 56 51 60 44 43 ….
Slovakia 30 28 49 54 53 ….
Slovenia 95 98 94 32 33 ….
Source: UNCTAD WIR 2008
Combining the two indices (performance and inward FDI potential), the UNCTAD assigned each country into one of four groups based on their capital market competitiveness, which thus created a matrix:
– Front-runners: high FDI performance – high FDI potential– Above potential: strong capital market performance – low FDI
potential– Below potential: low capital market performance – high FDI po-
tential– Under-performers: low capital market performance – low FDI
potential
Based on 2006 data, practically all new member states were in the front-runner category in terms of performance and investment opportuni-ties (inward FDI potential). This fact is definitely promising regarding the future of the region and sends a positive message to investors.
Besides the overall inward FDI potential, it is also important to see how the performance of individual countries affects the investment decisions of foreign investors and what factors need to be strengthened or weakened to increase capital market competitiveness.
.. Effects of the third wave of globalisation in CEE
Jensen et al [2002] raised the question, when FDI can beneficial for the host country. Their answer is that this is only possible if the in-

157
vestment has a larger, than neutral positive effect, because only in this case, when it is able to compensate the host country’s loss caused by the incentives. The amount and quality of these incentives and the expect-able effect of the FDI depends on a number of factors, such as:
– Motivation and target industry of the investment (Dunning’s [1988] eclectic theory): resource seeking, efficiency seeking, stra-tegic seeking and market seeking investments have different ef-fects.
– Type of FDI: acquisition or greenfield, the latter is more beneficial for the host.
– Nationality of management: involvement of local management helps the dissemination of knowledge
– Size of the investment: larger investments are more encouraged, but it is also more risky and their effective potential is also larger.
– Period of investment: the longer the investor plans to stay, the better it is for the host country.
– Assessing these perspectives, the effect of FDI on the region was as follows.
Effects on growth and trade
Cernat, L.-Vranceanu, R. [2002] examined the growth expectations and the relevant background reasons during the entire period of the 1990s in those CEE countries, which passed through a political and economic transition. They emphasized the undoubted fact that al-though in a different extent, but every country in the region has man-aged to increase their share in the world economy. The panels datas their analysis was based on had shown, that the possibility of EU ac-cession, increasing openness, along with the demolition of customs had a apparently positive effect on growth and development. Inter-estingly enough, the role of FDI in this better performance has been clearly shown, nevertheless, they considered its significance nominal comparing to other elements (the effect was positive, yet statistically not significant). The other examined factors in the survey, that might have potentially effected growth beyond FDI, were: the size of domes-tic investment in terms of GDP, unemployment rate, inflation rate, do-mestic active components, as well as openness (ratio of export-import in terms of GDP), volume of protectionism (the ratio of custom in ag-

158
gregated import), the ratio of export to the EU in terms of aggregated export, as external determinants. The size of domestic investments and the demolition of protectionism has proven to have the greatest impact to growth from all the above listed elements.
Campos, N.F. – Kinoshita, Y. [2002] analysed data from 25 coun-tries of the region in relation to the effect of foreign direct investment to GDP growth from 1991 to 1998. Their publication was induced by the debate between theoretical and empirical results respective to the relation between FDI and GDP. The authors concluded that the diffi-culty of showing an apparently positive effect is based on the mistaken concept, that GDP growth could only be measured through techno-logical transfer. (Ram, R-Zhang, K [2002] also denies such a connec-tion.) They believe this concept is not true, and they found good evi-dence thereof in the case of the Central and Eastern European coun-tries, since in these countries technological transfer is rather low, while – according to the final conclusion of their work – the impact on GDP growth is positive and significant.
For their estimation they applied a model designed by Borenstein et al. (1998), wherein GDP growth is explained by starting GDP, human capital (number of persons subscribed in basic education), FDI, infla-tion rate, governmental expenditures in terms of GDP %, and a dum-my variable (marking the quality of bureaucracy). Two extensions of the model have been calculated. In the first one, also domestic invest-ments appeare among the variables, while the second version presumes – wrongly, according to the authors – that FDI and human capital are independent and without this FDI cannot contribute to GDP growth. All the three versions resulted in a significant positive impact of FDI on growth, aside from human capital.
The above mentioned authors came to different conclusions with re-gards to the connection between FDI and GDP:
– There is a positive connection, but it is not significant.– The connection is positive and significant.
During the evaluation it also must be taken into account that nei-ther the specific analysis of the countries throughout this period, nor the methodology are wholly comprehensive. Moreover it must also be declared, that the effects of FDI on GDP are not immediate. In theory, a simultaneous examination may seem realistic in the case of those

159
countries, where the inflow of FDI can be considered unvarying (as in developed countries or in Hungary). Although, in most of CEE coun-tries, FDI appeared at different time and with distinct intensity, thus a single and simultaneous analysis of the situation would lead to false conclusions. It is also important to mention, that early FDIs might had delayed effects, for instance, foreing investors besides bringing FDI to the country also laid the foundations of market economy.
It is inevitable to consider all the above mentioned factors to reveal the impact of FDI on growth. Éltető [1999] examined the connections between FDI stocks and foreign trade structures of four regional coun-tries, Czech Republic, Slovakia, Slovenia and Hungary. She pointed out, that beyond efficiency seeking foreign companies;, market-tap-ping ones are also export oriented. (The latter ones aspire to acquire the regional market, and not that of the host country.) Foreign-owned companies are more intensively involved in foreign trade than do-mestic ones. While FDI played an important role in the integration of the region into the world economy, it also made foreign trade of these countries vulnerable, due to its structural concentration. The Euro-pean Union is the most important foreign trade partner for all of the examined countries.
Effect on Competitiveness and productivity
Most empirical researches raised two questions when examining the firms in the CEE region: (1) Do foreign firms perform better than their domestic counterparts do, and (2) Do foreign firms generate spillovers to domestic firms?
In three emerging economies of Central and Eastern Europe, Bul-garia, Romania and Poland Konings (2001) used firm-level sample data to investigate empirically the effects of foreign direct investment on the productivity performance of domestic firms. It is only Poland where foreign firms perform better than firms without foreign par-ticipation. Moreover, for all the three countries, Konings found no sig-nificant evidence of positive spillovers to domestic firms. In contrast, there was a tendency for negative spillovers to domestic firms in Bul-garia and Romania, while there were no spillovers to domestic firms in Poland. This suggests a negative competition effect that outweighs a positive technology effect.

160
Contrary to the results of this research, Barell - Holland (2000) con-cluded that there is a positive effect of FDI on productivity in CEE. According to their study, foreign direct investment is at the forefront of economic policy decisions in Central Europe, as it is believed to ac-celerate enterprise restructuring and aid in the successful transition to a market economy.
Their study contained a sample data study of the effects of FDI in 11 different manufacturing sectors within three Central European econ-omies: Hungary, Poland and the Czech Republic. They found evidence that FDI had increased labour productivity levels in most manufactur-ing sectors. They were able to differentiate between sectors with a high elasticity of substitution between labour and capital and those that are inelastic.
As mentioned above, in the case of Lithuania a definitely positive connection was demonstrable between FDI and improvement of pro-ductivity
The different results of these studies support the theory that the im-pact on labour productivity and diffusion of technology is predomi-nantly due to the human capital level - and in connection with it - the absorptive capacity of the domestic country.
The effects on employment
There have been surveys in the Czech Republic, Slovakia, Hungary, and in Estonia to uncover the extent of FDI contribution to struc-tural and qualitative alterations of employment. (Mickiewitz, T. et al. [2000]) The four countries have shown different pictures. Keeping and creating jobs have been achieved most successfully in Hungary and Estonia, due to the similar privatisation methods applied in these two countries. This model opened a route to foreign investors by means of direct state sales, also offering an opportunity to stipulate for main-taining jobs in the privatisation agreements. Moreover, the structure of employment in Hungary, showing similarities with that of the in-vesting countries, made it possible for the country to be the only state in the region to adopt and integrate foreign capital. It is true for all four countries, that the role of FDI in generating domestic employment was rather supplementary, than subsidiary, in other terms it just contrib-uted to growing employment, but in itself it remained insufficient to achieve that.

161
The essay also highlights, that the larger per capita FDI stock a country has, the wider range of sectors are affected by FDI, what effects the operation of the employment structure. The sectoral diver-sity of FDI also bears the possibility to spread knowledge in a wider part of the economy. Therefore, sectoral diversity creates a larger eco-nomic advantage for the host countries. Economic policies therefore must encourage investors to establish companies in more sectors of the economy.
The surveys done in Poland, in the Czech Republic and in Hungary have been striving to answer, how much FDI presence and structure changing potential are responsible for the differences in wages at the labour markets of qualified and unqualified work force. (Falzoni, A. -Bruno, G.- Crino, R. [2004] ). The assumption, that the demand for trained labour and the wage level thereof have increased, has been found true for Hungary and the Czech Republic, while it turned out to be false for Poland. This way differences in wages are starting to com-ply with the differences in education.
Backward effect: connections with host economy, and suppliers, technological spillover
The political and professional approach of the FDI emphasising only the positive effects and the integral role of FDI in transition is con-troversial (Pavlinek 2004). The effect is balanced neither in its secto-ral nor in its geographical concern. In four CEE countries (Poland, Hungary, Czech Republic, Slovakia) foreign direct investment con-centrated in the capital city, or in larger rural towns. This fact deep-ened the pre-existing regional differences within these countries. The sectoral concentration, observable in the extraordinary role of the automobile industry in the Czech Republic and Slovakia, may contribute to the frailty of these countries’ economies to only one firm’s decision.
The local and regional integration of foreign firms into host econo-mies does not characterise the region. It is not only the main limit of technical absorption by domestic firms, but it helps foreign investors to extract the capital from the country without major difficulties. Con-trary to this general situation, Javorcik drew the attention to the posi-tive backward effect in Lithuania, where due to the number of domestic suppliers in transactions with foreign owned firms, the technological

162
spillover could contribute to the improvement of the productivity of the host country. She found that the minor foreign and - consequently - major domestic ownership in enterprises induced positive spillover effects, because these firms have much more direct and indirect con-nections with local market, labour and government. (This statement is similar to Dimelis’ results in Greece, and the reasons were similar as well.)
Mannik, (2004) analysed the spillover of knowledge and technology in five Central and Eastern European countries, in Estonia, Hungary, Poland, Slovakia, Slovenia. In their approach, the vehicle of spillo-ver effects may be the cooperation between local and foreign firms, which depends on the strategy of subsidiaries. According to empiri-cal evidence, the independence of the subsidiary can reduce the in-centive to cooperate with local firms. (Birkinshaw 1995) The results of the research proved that the technological spillover is not relevant in developed sectors or regions of CEE. This result reflects the study of Campos-Kinoshita (2002), which did not find a correlation between spillover effects and GDP growth in the region.
Foreign direct investments in Central and Eastern Europe have cata-lysed the transition of the region’s countries to market economies and their integration into the world market. The impact of FDI on econom-ic growth is also proven, whereas its contribution to competitiveness and productivity is largely dependent on the human capital and the existing level of the economy in the host country.
As for the employment,foreign companies played supplementary and not a subsidiary role and consequently the demand for trained labour has increased in the countries of the region.
The integration of foreign companies into the domestic economy has been limited: the establishment of the supply chain and the volume of technological spillover are both unsatisfactory.
2. THIRD WAVE OF GLOBALISATION IN HUNGARY
When it comes to empirical researches about the forces influencing di-rect investment, in Hungary as well as in other countries of the region the traditional classification of Dunning is prevalent.

163
The basic question therefore is if investments seeking local resourc-es, based on cheap labour or market-oriented investments were more relevant to Hungary throughout the last 10-15 years.
Meyer [1995] Lankes-Venables [1996] Éltető-Sass [1997] has expe-rienced significant differences among the motivations of investors, depending on their objectives to be realized in Hungary. They sepa-rated two major types, namely market oriented and export oriented investors. Market oriented companies intend to tap the market; while export oriented investors are attracted by the cheap labour force in Hungary. Both types have been affected by the stability and relatively developed infrastructure of the country. Meyer [1995] made a distinc-tion among market oriented, factor-price oriented companies and companies driven by both. In his survey, market oriented investors de-cided according to the size of the market, while factor-price oriented ones decided according to the low costs of labour. Lankes and Venables [1996] identified local and regional supplier companies. In this analy-sis, the local suppliers’ determinant was market access, while export-ers were motivated by the low production costs. Andrea Éltető and Magdolna Sass [1997] published, that access to the Hungarian market was determinant for 61.5% of investors in the country. Qualified and flexible labour force was ranked second or third among the preferenc-es of export-oriented investors. Qualified labour was very important for 44.2% and important for 47.7% of them. Low costs of labour were considered very important or important by 36-37% of those surveyed. (The value of Spearman’s rank correlation coefficient between the two groups, the export oriented and the non-export oriented companies was 0.69, meaning the rankings are only similar to each other in 69%.)
Costs of labour and the role of professional qualifications have been also evaluated by Péter Kaderják [1996]. According to his empirical research, the higher wages were significant to a region within Hun-gary, the larger amount of FDI was present there. Consequently, quali-fied, therefore more expensive labour was more attractive for investors, than the possibility to employ cheap, but unqualified workers.
The essay of György Csáki and Andrea Szalavetz [2004] observed FDI inflow from the perspective of competitiveness. They focused on ULC (unit labour costs), what is important for investors seeking ef-ficiency. They are also the ones pioneering in reinvestments; therefore growing ULC should be avoided also in the long run. (This does not

164
equal to an aspiration to keep labour costs at a low level.) ULC changes are also affected by currency exchange rates. Therefore, the state has a grave responsibility with regards to ULC values beyond exchange rate regulations and supporting training. Between 1995-2000, this value significantly decreased in EU member states (by 10-25%), while in Hungary the decrease was much less, only about 2.2%. Productivity increased fast in the beginning of the cycle, and then it slowed down by the end of the decade, and after the turn of the millennium the ULC indicator started to increase. This increase was visible in every country of the region, except for Poland. FDI flow reacted on the very contrary to these processes. In the Czech Republic and in Slovakia, FDI boost-ed, while ULC indicator worsened by 63%. In these countries, upward turning privatisation balanced the negative effects of ULC changes. The same happened earlier in Hungary, ULC indicator started to effect FDI inflow only after the closure of privatisation. The paradoxon of Káldor [1978] shows, that the dependency between ULC and competi-tiveness is not obvious even in developed countries.
Looking for an explanation of the post-2000 period Hungarian pro-cedures, Miklós Szanyi [2003] also examined the significance of labour costs for the decisions of the foreign investors. Until 1998, real wages decreased, while productivity increased. After 2000 however, the 30% increase of real wages was balanced by only 10% of productivity de-crease. The unit labour cost in Hungary may even show a 40% growth compared to other countries of the region. This all coincides with the closure of privatisation, saturation of the market and the global de-crease in FDI flow. Ann Molin [2004] pointed out furthermore, that in Hungary unemployment increased by 20%, while in the Czech Re-public this increase was only 11%. Thus by 2004 Czech average wage was $554 per month, in Poland $487 per month and in Hungary $424 per month. These countries are interested in attracting products with higher added values.
Beyond the traditional investment-drawing factors, many authors highlight the role of governmental policies, privatisation, various in-centives, subsidies and particularly the quality of the taxation policy, also true for Hungary. Fahy et al. [998] found in the early 1990s, that the Hungarian successes on the foreign investment market were due to the fast realisation of the political, legal and economical transition. The legal background and and applied methodology of privatisation

165
was the most beneficial for foreign investors in the region. The authors believed that entrepreneurship and market perspectives spread fast in Hungary, what created a familiar and attractive environment for for-eigners. In this early period of foreign direct investment, Paliwoda, S.J. [1995] points out the high quality human capital and the overall reform of the legal system, as the competitive advantages of Hungary.
Andrea Éltető and Magdolna Sass [1997] in their aforementioned work also drew attention to the importance of governmental policy. The examined investor groups ranked among the prohibitiveness of investments inflation, taxes, and high social security contributions. Bureaucracy and the constantly changing regulations are also alarm-ing. Export oriented investors are further hampered by restrictions on the foreign market. In every group, tax relief, customs refunds and exchange reate policy proved important. There are certain common elements among the priorities of different business groups, which ob-servation is also supported by the examination of Katalin Antalóczy [2003], closed in 1999. Her interview-based method uncovered, that investment decisions are driven by political and economical consid-erations. The interviewed subjects found political and economical sta-bility and transparency of the legal system most important for their evaluation of the country.
Tax relief customs free area investment opportunities proved to be attractive elements for a majority of foreign investors (Antalóczy – Sass [2001]). (Most tax incentives and allowances terminated after 2000.) Industrial parks had outstanding importance, where a complete infrastructure was available for foreign investors. a special Hungarian feature has been customs free area investment opportunities, because their location is not limited geographically, contrary to the interna-tional practice.
.. Background and motivations
Testing the impact of capital market competitiveness factors on capital investments
Next, we will analyse the relevance of possible determinants of FDI in Hungary and in Central and Eastern Europe.
Throughout the study, two kinds of FDI data have been examined. One was FDI flow in a given year with its short-term effects and the

166
other was FDI stock itself with its long-term effects (this also repre-sents the capability to withhold foreign investments). The two data changes from time to time and there variables influencing them differ significantly.
The possible determinants are market size, openness of the country, infrastructure, country risk, privatisation, and other variables such as taxation, especially the rate of corporate tax, labour costs, qualification of the workforce, D+F (The model is in the enclosure)
Effects of market size and openness to FDI
The market size can be proximated by two factors, growth of GDP and the changes of the final consumption, because the population was al-most stagnant in the period. From 1993, there was a continuous in-crease in the volume of GDP, but the growth rate of it depended on the economic cycle. In the meantime the population decreased by 1.5%. The final consumption did not expand linearly: in the middle of the nineties, there was a reduction in it. The tendency of these two fac-tors was approximately the same; consequently, their effects did not differ from each other essentially. Contemplating the correlation be-tween these factors of market size and the FDI stock with other factor variables, they were excluded from the model, while in the case of FDI flow there is a negative correlation. This would mean that a growing market diminishes a the ability of a country to attract FDI. (This result of course can be explained by the effect of other variables).
Indicators of market size between 1990-2002 in Hungary
YearPopulation on 1st of January (thousands)
GDP(billion HUF)
Growth of GDP (%)
Growth of -
sumption
1990 10375 2089.3 – –
1991 10373 2530.5 – 94.8%
1992 10374 2935.1 93.9% 100.4%
1993 10365 3548.3 99.4% 105.4%
1994 10350 4364.8 102.9% 97.6%
1995 10337 5614.0 101.5% 93.5%
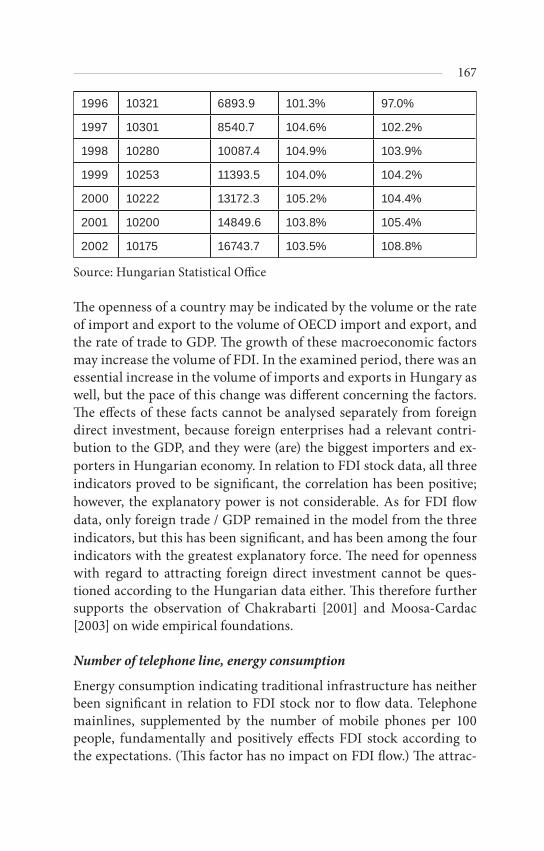
167
1996 10321 6893.9 101.3% 97.0%
1997 10301 8540.7 104.6% 102.2%
1998 10280 10087.4 104.9% 103.9%
1999 10253 11393.5 104.0% 104.2%
2000 10222 13172.3 105.2% 104.4%
2001 10200 14849.6 103.8% 105.4%
2002 10175 16743.7 103.5% 108.8%
Source: Hungarian Statistical Office
The openness of a country may be indicated by the volume or the rate of import and export to the volume of OECD import and export, and the rate of trade to GDP. The growth of these macroeconomic factors may increase the volume of FDI. In the examined period, there was an essential increase in the volume of imports and exports in Hungary as well, but the pace of this change was different concerning the factors. The effects of these facts cannot be analysed separately from foreign direct investment, because foreign enterprises had a relevant contri-bution to the GDP, and they were (are) the biggest importers and ex-porters in Hungarian economy. In relation to FDI stock data, all three indicators proved to be significant, the correlation has been positive; however, the explanatory power is not considerable. As for FDI flow data, only foreign trade / GDP remained in the model from the three indicators, but this has been significant, and has been among the four indicators with the greatest explanatory force. The need for openness with regard to attracting foreign direct investment cannot be ques-tioned according to the Hungarian data either. This therefore further supports the observation of Chakrabarti [2001] and Moosa-Cardac [2003] on wide empirical foundations.
Number of telephone line, energy consumption
Energy consumption indicating traditional infrastructure has neither been significant in relation to FDI stock nor to flow data. Telephone mainlines, supplemented by the number of mobile phones per 100 people, fundamentally and positively effects FDI stock according to the expectations. (This factor has no impact on FDI flow.) The attrac-

168
tiveness of modern infrastructure for foreign direct investment has been certified also in Hungary, just like in 140 other countries exam-ined by Moosa-Cardac.
Country risk
Country risk has only been significant in relation to FDI stock (5%), nevertheless the explanatory power of this factor is not remarkable. Most publications on this issue considered political and economical stability an outstanding factor. The value of regression can possibly be explained by the fact that investors consider Hungary secure com-pared to other countries. The changes in time of the country risk have not effected their decisions.
Effects of privatisation to FDI
The effects of privatisation can only be studied in case of FDI flows (especially in the mid 90s), because this was a unique process and it finished by the end of the period.
State income from the privatisation process between 1990-2002 (billion HUF)
YearIn for-eign currency
in HUF Credit Compensa-tion coupon Total
1990 0.53 0.14 - - 0.67
1991 24.61 5.74 1.01 - 31.36
1992 40.98 24.92 9.07 2.26 77.23
1993 110.67 22.96 21.72 14.56 169.91
1994 10.95 35.41 46.11 64.20 156.67
1995 411.50 35.40 3.99 30.15 481.04
1996 92.73 40.61 2.47 40.70 176.51
1997 208.64 118.22 0.31 23.20 350.37
1998 39.02 67.33 0.99 4.50 111.84
1999 69.53 62.11 - 0.87 132.51
2000 1.22 55.68 - 1.31 58.21

169
2001 6.13 44.96 - 0.64 51.73
2002 - 20.71 - 0.25 20.96
Total 1034.43 788.71 85.67 190.87 2099.68
Source http://www.apvrt.hu/menu1/v22150.html
The result of the regression showed the fact, that the correlation be-tween FDI and the privatisation process was very robust (Pearsons corr:0.844 sig:0.001), almost determining. This factor had the most robust influence on FDI among all factors. The next diagram also pre-sents visually the strong connection between FDI and privatisation.
Revenue from privatisation and FDI in Hungary (billion HUF)
Privatisation did not have any impact on the determination of the annual volume and stock of FDI including reinvestment. It was a sig-nificant factor in the examination of neither FDI stock, nor FDI flow data. This means, that after the privatisation process was closed, other drawing factors gained importance. The dual outcome of the regres-sion in relation to the privatisation can obviously be traced back to the appearance of reinvestment in the volume of FDI.
Effect of Taxation to FDI
The Hungarian governments made serious efforts to motivate inves-tors with tax reductions and to control wage increase. The tax cuts pro-
170
duced a loss in fiscal revenue, and this loss needed to be compensated by a welfare decrease.
In Hungary, indirect taxes and/or social security contributions rep-resent the greatest proportion of the major revenues in the budget. In the past, the revenues in the budget from the employers’ contributions showed a continuous and relative decline. The revenues from personal income tax have been growing slightly. The share of the corporate tax in the revenues in the budget is very small. However, it should be noted that parallel to the steady growth of economic performance, the vol-ume of these revenues is increasing dynamically, and its extent deter-mines the willingness to venture.
Comparatively, Hungary is in the mid-course of OECD countries if the proportion of its total yield of taxation to the GDP is taken into consideration. The reason of this is although in Hungary the extent of the profit tax may be half of the European average, the proportion of consumption taxes considerably exceeds the average. (This does not deteriorate the competitiveness of Hungary directly because its burden may be shifted onto the final user).
Among the different types of taxes, corporate tax has an outstanding importance for the investors because it is a real cost for them.
Hungary set a corporate tax rate that was extraordinarily low, not only in comparison to the EU average (30–35%) but compared to the tax rates of other Central and Eastern European countries as well. Af-ter the initial 40% in the beginning of ‘90s, Hungary’s corporate tax rate was reduced dramatically from 36 to 18 per cent in 1995. This rate was the lowest in the region in the late nineties. From 2004, businesses only paid a 16% tax on their profits. In 2006 this tax rate became pro-gressive; under 5 million HUF revenue it decreased to 10%, but over 5 million HUF it remained 16%. This system remained until 2010, when the upper rate increased to 19%.
As shown in the next table, Hungary retained its competitive ad-vantage in respect of corporate taxes in the 21st century as well, since Slovakia and Poland (and later the Czech Republic) were the only rival countries that introduced a similarly low tax rate. (Just to compare, the corporate tax rate was 35% in the USA, 30% in the UK and 26% in Germany in 2007.)
In Hungary, the legal environment and the company law is har-monised with EU norms, i.e. foreign investors are entitled to have the

20002001
20022003
20042005
20062007
20082009
Czech R
epublic35.3
35.636.3
37.337.8
37.537
37.336
34.8
Hungary
38.537.9
37.837.8
37.437.4
37.239.7
40.239.1
Poland32.8
32.633.1
32.631.7
3334
34.834.3
..
Slovakia
34.133.1
33.333.1
31.731.5
29.429.4
29.329.3
Slovenia
37.537.7
3838.2
38.338.6
38.337.8
37.237.9
OEC
D average
35.535
34.734.7
34.635.2
35.435.4
34.8…
Source: Op. cit. Kállai-Sztanó p.l3.
Total tax revenue as a per-centage of GDP
OECD statistics

172
same rights as domestic investors. However, at the beginning of the nineties, foreign companies were entitled to special advantages. Com-panies with at least 30% foreign contribution, (the volume of the in-vestment had to be over 50.000.000 HUF, about 500.000 USD) could reduce their tax liability by 60% in the first 5 years of their operations and by 40% in additional 5 years. This system was repealed in 1993. Yet, in the next year, the government introduced an exemption from corporate tax for reinvestments exceeding 500 million HUF in Hun-gary for ten years. Since 1998, investors investing at least 10 billion HUF in less developed areas, are eligible for a 10-year-long tax holiday, if the investor creates 500 new jobs and the turnover grows annually by at least 5%. These incentives were available until 2011.
The Hungarian government also established a few special economic zones in regions with high unemployment, which grant 5-year-long tax holidays. These regions were attractive because of the low thresh-old of the investment to qualify for the advantages.
Hungary has a special law regarding offshore companies as well. Therefore, this form of harmful tax competition appeared on the OECD list. Such a company can tax its profit by a 3% rate, and should have the following characteristics:
– none of the owners is a Hungarian resident,– its management members are mostly Hungarian residents,– does not have interest in any other Hungarian companies,– is audited by a Hungarian company,– operational expenses are financed from a bank account in Hungary
This preferential system was for companies registered by 2000 until the end of 2005 and for companies registered later but meeting the requirements until the end of 2003.
The custom free zones, which were preferable for foreign enterpris-es, are special types of allowances because these fields are treated as if they were foreign territory, thus, they are not subject to the Hungarian taxation system. Therefore, foreign enterprises, which were established in custom free zones, did not take advantage from the low Hungarian corporate taxes and other tax allowances.
The effects of the taxation policy are reflected by three indicators in this model: the ratio of income and profit taxes in terms of GDP, the

Cou
ntry
2000
2001
2002
2003
2004
2005
2006
2007
2008
2009
2010
2011
Cze
ch R
epub
lic31
3131
3128
2624
2421
2019
19
Est
onia
26
26
26
26
26
2423
2222
2121
21
Hun
gary
1818
18
18
16
16
17.3
3 (1
6.0)
20.0
(1
6.0)
20.0
(1
6.0)
20.0
(1
6.0)
19
19
Pol
and
3028
28
27
19
19
1919
1919
1919
Slo
vaki
a 29
29
25
25
19
1919
1919
1919
20
Slo
veni
a 25
25
25
25
25
2525
2323
2120
20
Cor
pora
te ta
x ra
tes i
n CE
E (%
)
ww
w.o
ecd.
hu

174
ratio of VAT incomes in terms of GDP and the changes of the corpo-rate tax rate. The increase of tax burdens frightens investors, as ex-pected, while decreasing corporate taxes must have a positive impact, therefore a negative correlation can be expected between the tax policy and FDI.
In case of FDI stock, only the corporate tax rate and the ratio of VAT incomes in terms of GDP was significant (5% and 1% significance level, respectively). However, the explanatory forces thereof were not strong.
Corporate tax data are in strong correlation with FDI flow data. Corporate tax rate is one of the four most important explanatory vari-ables, what have determined FDI flow values in the examined period. This means that decreasing corporate taxes increases FDI on the short run, but it does not affect the capital retaining ability of the country. The conclusions of previous empirical research in the region and in Hungary also support the above mentioned statement.
Effect of Labour cost
In order to judge the capital market competitiveness of a country based on the cost of labour, changes of multiple factors must be taken into consideration simultaneously. These factors are as follows: net value of wages, changes of income tax obligations and social security contribu-tion levied on wages, other contributions payable by employers and last but not least the changes of labour productivity.
Gross wages are fundamentally determined by the rate of income tax and employee contributions charged on net wages. In the region, Hungary has the highest percentage on marginal tax rates (personal income tax and social security contributions) of employees charged on average wages. In the 21st century, these rates have been consistently above 50 percent, the related burdens of other regional countries have been 10 per cent lower in an average. By introducing a flat tax, Slovakia reduced the overall rate of taxes charged to employees to 38.5 per cent by 2007, which more or less corresponds with the OECD average (37.7 per cent).
From the employer’s viewpoint, the rate of social security contri-bution and employer contribution are more important as these levies are payable exclusively by the employer. Social security contributions charged on wages are nearly identical in the reviewed countries and match the EU average (social security contributions in EU countries

175
range from 25 to 35 per cent). Slovakia continues to be an exception, with reducing one of the highest rates, 38 per cent to less than 15 per cent over 10 years.
If we were to pass a judgement strictly based on percentages, we could conclude that the overall personnel- related expenditures of businesses operating in Hungary is higher than that of their Western or Central European peers (Schlett, 2003). This approach can be espe-cially damaging for a “superficially informed” foreign investor when making investment decisions.
It is a fact, however, that the costs of wages, i.e. the calculation base of any income tax and other employer contributions charged on wages are far below the European level in the region. Average gross wages in the euro zone were eight times higher than Hungarian wages. Then due to economic growth, this multiplier dropped to five (Eurostat).
In connection with the revenues of contributions, the considerable reduction of labour costs was a high priority in all governmental pro-grams in Hungary. The governments intended to reduce the employers’ labour costs to increase competitiveness. The social security contribu-tion that an employer is liable to pay by wages was reduced gradually from 44% to 29% in the nineties, which still exceeds the EU average. The social security contribution in the EU ranges from 25% to 30%.
It is worth mentioning that the proportion of personnel costs within the total operating costs at foreign enterprises decreased from 1996 to 2000. This fact indicates the declining relevance of this type of produc-tion cost.
The relevance of the labour cost cannot be analysed separately from the productivity of the enterprises. In the indicated period, the rate of the foreign enterprises did not exceed 12% of the whole business sector. In spite of this, their revenues and contribution to the GDP are more than 50% of the total performance of the companies in Hungary. The productivity of foreign enterprises increased to greater extent than labour costs in the same period. In terms of profitability, foreign enter-prises also overpassed the efficiency of the Hungarian firms.
Two variables reflect labour costs in the model, tax on wages and the amount of contributions and the ULC value, what accounts for labour costs in terms of productivity. Both indicators reflect the impact of labour costs on FDI in a complex form, what is expected to be in the negative.

176
Common public charges on wages were significant to long term FDI, while ULC was significant to short term FDI. ULC has the strongest explanatory force in relation to FDI flow data. It concludes from all this, that movements of the labour costs can effect investors’ decisions on the short run, while – just like taxes – do not have any impact on the long term positions of Hungary on the capital market. In 1996, Péter Kad-erják published an article about the correlation between foreign direct investment and employee wages. According to his research, the higher the wages are, the more relevant the activity of foreign investors will be. This surprising result shows that the competitiveness of Hungary is based on the qualified workforce and not on low costs of employees.
Effects of higher education on FDI
The technological development of the host country, in this case Hun-gary, did not effect the long term decisions of the investors in the ex-amined period of ten years, while the level of human capital appar-ently did. The data on ratio of R+D in terms of GDP was significant in relation to neither FDI stock nor FDI flow data. This rather surprising result is possibly caused by R+D costs return and become effective only in longer terms, therefore it was not measurable in the examined pe-riod. Higher education students are to provide qualified human capital for the market within 4-5 years.
The levels of available work force and human capital have constantly increased since the political transition, if the number of degree level students is accounted for exclusively. The number of higher education degrees quadrupled from 1990 to 2004. If examined for the popula-tion aged 25-64, this change is far less significant, and the tendency is not apparently positive, because it varied between 13-14%. This is still higher by 1-2%, than the regional average, but it lags behind the 20-30% average of OECD countries.
The quality of human capital can be assessed in multiple ways: by the number of people learning in primary, primary and secondary, secondary and higher, or only higher education, or by the number of people participating in any form of education, or the ratio of this num-ber in the given population. Each aspect can be interesting and justi-fied in itself. We opted for the value of the students in higher educa-tion in this paper, because this is the very indicator used in UNCTAD index. However, more and more criticism is aimed at the explanato-

177
ry force of the number of higher education students; however, these criticisms are primarily valid in more developed economies. (In those countries, the ratio of people educated at degree level is already set; therefore, this decision does not really have any effect on the decisions of investors.). In developing countries, or in Eastern Central European countries during the years of market transition, this value in itself can be an important explanatory variable, compared to the previous low level of this indicator. This is supported also by the result of the regres-sion, because the number of graduated people outshines every other explanatory indicator, and shows an almost determinately positive connection with FDI stock data. The short-term effects thereof are far less significant, actually due to the delayed effects. Qualitative labour has effected the most in the whole period the decisions of the foreign investors. This is in harmony with the previous conclusions reached by the model not including reinvestments, and with the findings of Hun-garian authors: the most important attraction of Hungary is posed by its qualified work force.
The result of the analysis can be summed up as follows:
The extent of foreign direct investment was stable during the last dec-ade of 20th century, but comparing to the world trend, Hungarian FDI participation decreased by the end of this period.
In Hungary, the privatisation process had the most important influ-ence on FDI (flow). After 1996, when the privatisation finished, foreign investors established new firms in Hungary, but this type of FDI did not expand substantially.
The Hungarian governments made serious efforts to attract foreign investments into the country through government subsidies and low taxes, but these efforts did not contribute to the long-time attractive-ness of Hungary in world capital markets.
The reduction of corporate tax led to the expansion of FDI in 1995, but after this year, the effect of this incentive disappeared.
While the productivity of the foreign enterprises increased faster than the labour costs, this type of production cost did not have any impact on foreign direct investments.
The competitiveness of Hungary in the foreign capital market is based on the qualified workforce and not on the low costs of labour.

178
In the 1990s, Hungary, like other periphery countries, stressed the cheap workforce and governmental subsidies. To a certain degree, this policy was successful, at least until privatisation ended. After this, FDI dynamics in Hungary slowed. Therefore, the conclusion can be that capital attracting factors that are characteristic to periphery countries lost their significance in the case of Hungary. This is because other countries (to the East of Hungary) have become a more favourable tar-get for resource seeking investments, as they are attracted by cheap production costs.
Hungary has to demarcate from the characteristic strategies of pe-riphery countries and support activities, which create higher value added.
Enclosure
Regression model
t
n
j
m
jegjZjtbjXjtaFDI
1 10
Where X stands for the group of variables determined by UNCTAD, and Z represents the group of variables specifically influencing the at-tractive powers of Eastern Central European countries. There were several databases used in the determination of the volume of active components and the evaluation thereof in an international context.
– indicators on the sizes of the market have been identified by the databases of the Hungarian Central Statistical Authority and that of OECD
– openness and competitiveness of the country have been evalu-ated by OECD statistical tables
– In both modern and traditional senses, the indicators of tech-nological advancement are the numbers of telephone mainlines and the volume of energy consumption. The data source in these regards was CSA.
– The values of country risk are from the March issues of Euromon-ey, except for 1998, where only September data was available.

179
– Data on the quality of human capital and on the technological capacity are based on OECD and CSA data.
– Beyond OECD data, Eurostat data was also used for the interna-tional comparison of labour costs.
– The structure and changes of the volume of the privatisation was published in 2004 by the Hungarian State Privatisation and Asset Management Agency. (APV Rt) .
– The tax policy and the volume of tax burden depend on several coefficients. These have been identified by OECD and CSA data, and according to Act LXXXI of 1996 on corporate and capital return taxes.
Two types of FDI data are marked on the table as resulting variables. The first type shows the short-term effects, the annual FDI flow data, while the second type consists of FDI stock, the data marking long-term effects as well as capital retaining capacities. The variables affect-ing the two sets of data showed considerable differences. The model evaluates the flow and stock data including also reinvestments. Cal-culations on investments without reinvestments, M&A and greenfield investments have already been published (Katona [2005]). (These are shown individually for each variable, inasmuch as there are some add-ed information therein.) The volume of FDI was identified by CSA data for the period before 1995, and the recalculated data of the Hungar-ian National Bank was used for the subsequent period. Both databases contain the amount of FDI in billion HUF.
The examined period was from 1993 to 2004.
The result of macro regression in relation to the individual variables
FDI stock
Pears.corr.
Adj.R2 R2sig Pears.
corr.Adj.R2 R2sig
Energy supply (tons)/capita 0.304 0.226 0.100 0.176 0.048 0.472
Energy consump-tion (petajoul) /1000 persons
0.526 0.276 0.119 0.130 0.017 0.719

180
R+D expendi-tures /GDP 0.273 0.003 0.867 -0.182 0.113 0.287
GDP growth rate 0.544 0.346 0.044 0.618 0.427 0.021
GDP/capita 0.981 0.968 0.000 0.782 0.668 0.002
Volume of export / OECD export 0.959 0.840 0.000 0.413 0.167 0.187
Volume of import / OECD import 0.846 0.722 0.000 0.169 0.061 0.439
Foreign trade / GDP 0.861 0.777 0.000 0.798 0.689 0.001
Telephone and mo-bile phone lines / 1000 persons
0.974 0.950 0.000 0.491 0.241 0.125
Number of higher education students / population
0.994 0.983 0.000 0.610 0.486 0.014
Value of country risk 0.635 0.403 0.036 0.489 0.237 0.127
Annual income from privatisa-tion / total income from privatisation
-0.526 0.153 0.186 -0.193 0.011 0.731
Revenues from
taxes/GDP0.308 0.003 0.872 0.126 0.011 0.747
Tendency of cor-porate tax -0.611 0.460 0.015 -0.774 0.659 0.001
VAT revenues/GDP -0.784 0.593 0.009 -0.692 0.463 0.030
Taxes on wages -0.901 0.811 0.001 0.049 0.002 0.900
ULC in processing in-dustries (1995=100%) -0.513 0.263 0.107 -0.834 0.695 0.001
Model total 1.000 0.000 1.000 0.000
Adjusted R2 stands for already filtered bias.
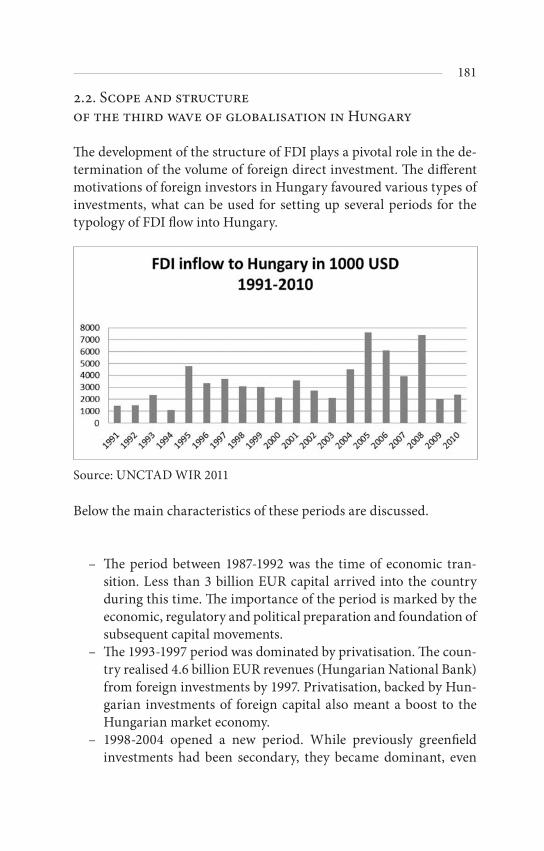
181
.. Scope and structure of the third wave of globalisation in Hungary
The development of the structure of FDI plays a pivotal role in the de-termination of the volume of foreign direct investment. The different motivations of foreign investors in Hungary favoured various types of investments, what can be used for setting up several periods for the typology of FDI flow into Hungary.
– The period between 1987-1992 was the time of economic tran-sition. Less than 3 billion EUR capital arrived into the country during this time. The importance of the period is marked by the economic, regulatory and political preparation and foundation of subsequent capital movements.
– The 1993-1997 period was dominated by privatisation. The coun-try realised 4.6 billion EUR revenues (Hungarian National Bank) from foreign investments by 1997. Privatisation, backed by Hun-garian investments of foreign capital also meant a boost to the Hungarian market economy.
– 1998-2004 opened a new period. While previously greenfield investments had been secondary, they became dominant, even
Source: UNCTAD WIR 2011
Below the main characteristics of these periods are discussed.

182
exclusive in this interval. The amount of additional greenfield in-vestments reached 1.5 billion. Previous investments became ripe, what resulted in profit repatriation and reinvestment as well as a drawback of greenfield investments.
– 2004-2008 was the period following the EU accession of Hun-gary, where the volume of FDI inflow increased compared to the average of previous years. This upward trend lasted until the 2008 global crisis hit. After that, like all over the world, the activity of foreign investors has fallen back considerably.
1987-1992 Economic transition
The enactment of laws relevant to FDI and the transition characterised the first period. Weak GDP results and the unfavourable turn of the balance of payment in the previous years quickened the structural re-forms of the economy.
A two-tier banking system was introduced in 1987. Banking servic-es were gradually liberalised, and the operations of new private banks were licensed. The Parliament accepted the Act on Financial Institu-tions (PIT) in 1991. Consequently the compliance of Hungarian bank-ing regulations with the requirements of the European Community was granted by a modern bank law. a supervisory authority of bank was established in the same year.
The Hungarian insurance sector became largely liberalised. Inter-national insurance corporations gained control over practically every insurance company operating in Hungary.
The reconstruction of a non-banking capital market was attempted by the Hungarian Governement as early as 1982; still the first shares appeared only in 1989. At the same time, numerous new measures wid-ened the available selection of securities, both within and outside the banking system. (Treasury notes, discount papers, bills of exchange, deposit bills, hedge fund securities, etc.) The first broker companies were established in this period. The Parliament accepted the Act on Securities in January 1990, what regulated beyond the public trade in securities, also the establishment and operation of the stock exchange, and the state control over the stock market. The Hungarian Securities Supervisory Authority was established, and in June 1990 the Budapest Stock Exchange (BÉT) was opened.

183
At this point, it is worth referring to the globally unique regulation on customs free areas, what subsequently proved to be a major attrac-tion for FDI. Although this act already existed in 1982, its real effects could only be realised after the enactment of the law on foreign invest-ments.
Structural changes were mainly featuring liberalisation, what in-cluded overall reforms of prices, wages, import control and foreign exchange control as well.2 Consequently the Act on Competition was accepted in 1990. lábjegyzet: centrally planned economy. Reform measures included the strengthening of financial discipline at a mi-croeconomic level. Due to the restrictions of the price-subsidies policy of the government and the 1991 collapse of COMECON, the solvency of many domestic companies became dubious. Every business had to accept considerable risks due to the lack of laws regulating company assessments and satisfactory bankruptcy rules. The modern act on ac-counting, following Western standards and the new bankruptcy law enacted in January 1992 were both aimed at helping this situation.
Three major new regulations opened the way for large-scale priva-tisation in 1988-89:
2 Earlier company managements faced a number of administrative restrictions (such as limitations on prices, wages, imports, utilisation of the financial assets of a company or restrictions on employment decisions, the lack of any act on bankruptcy, and the fact that executive officers were employed by the supervi-sory bodies of the companies). These restrictions were gradually terminated after 1985, and in 1989 a liberalisation wave of prices, wages and imports emerged. Due to the wide-scale liberalisation measures in 1991, more than 90% of the domestic and imported products were accepted in the liberalised category. Control over prices, wages and imports was moved under the scope of competition law in 1990.
Reforms of the foreign exchange control also played a major role in the struc-tural reconstruction. During the central planned economy some really strict regulations had been in force. From 1989 private individuals could place de-posits in foreign currencies. Commercial banks were authorised in 1990 to deal in currencies in connection with their commercial services, and also to collect deposits from domestic companies. The interbank foreign exchange market was opened in July 1993.
Taxation system was completely altered in 1988, personal income taxes were introduced. a new element of the tax policies was the growing importance of the consumption taxes (VAT). The social security system was detached from the central budget.

184
– Act VI of 1988 on Business Associations re-introduced limited liability companies, and allowed for founding private companies regardless to the size and nationality of the owner of the company.
– Act XIII of 1989 on Transformation regulated the shift of state companies into joint ventures.
Act XXIV of 1988 on Foreign Investments defined the rights of foreign share and capital holders, providing them for an unlimited right to obtain interests in Hungarian companies and to establish new compa-nies. The same act offered wide-scale tax benefits for foreign investors.
The aforementioned reforms of the transition created the basis of a market economy. The most important objective thereof was – in ac-cordance with Article 9 of the Constitution – the establishment of a proprietary democracy, based on the private properties of individu-als, collective, institutional and company ownerships are also based thereon, and the differentiated versions of public properties are organ-ically attached thereto.
In this “regulatory race”, Hungary was often ahead of other coun-tries of the region.
After 1990, Hungary quickly integrated into the three-polar TRIAD of the world, and its previously single-sided foreign trade with Euro-pean socialist countries and the Soviet Union was rapidly reshaped in a way to give a dominant role to the European Union in terms of both exports and imports.
Privatisation between 1993-1997
The volume of foreign investments boosted in Hungary, due to the FDI friendly policies of the 1990s. While in 1992 the share of foreign own-erships in the Hungarian economy was only 11%, this value raced to 41% by 1998. The FDI/GDP ratio was 1.7% in 1990, and by 1998, this has reached 33.2% (Árva et al [2002]).
In this period, right after the transition, Hungary attracted an out-standing amount of FDI – compared to other countries of the region – caused by the possibility of FDI inflow catalysed by the possibility of cash down privatisation. Incomes from privatisation and asset utilisa-tion from 1990 to the end of June 2004 reached 2099.68 billion HUF (appr. 14.44 billion USD)(ÁPV Rt [2004]), 74% of which has been real-ised by 1998. The largest income was realised nominally in 1995, pri-marily due to privatisation of the energy sector, what is also visible on

185
the figure below. The volume of incomes from privatisation has drasti-cally fallen back since 1997. The below figure shows Hungarian FDI data cleared from those of the world.
Hungarian FDI flow (without reinvestments) Global FDI flow 1990-1994
Source: Authors’ calculation based on UNCTAD data
The upward sloping diagram represents well, that until 1996 – the clos-ing time of great privatisation capital inflows – foreign direct invest-ment to Hungary surpassed the global FDI growth rate. 1997 was the last year when privatisation contributed to the volume of FDI. After this, greenfield investments dominated, and parallel to this, the invest-ment rate shows a downward trend in relation to the global FDI stock changes. (The Hungarian growth in 2000 is misleading, it is the result of a globally decreasing capital flow.)
1998-2004: Greenfield investments, profit repatriation and reinvestmentNew features became obvious in the nature of foreign direct invest-
ment to Hungary since 1998:
– Greenfield investments became constant between 1-2 billion EUR, then started to decrase,
– the role of proprietary loans changed,– profit repatriation became stable,– the volume of reinvestments incresed,– disinvestment appeared (Katalin Antalóczy [2003])

186
The dynamics of greenfield investments, credits and reinvestments are represented by the diagram below.
Turnover components of foreign direct investment in Hungary 1995-2003
Source: Hungarian National Bank (www.mnb.hu)
The balance of equities and other shares – the line marked by trian-gles – only includes greenfield investments from 1998 onwards. (In previous years, this value represents also the property acquired as part of the privatisation process.) It is clear, that the volume of the inflow became constant, in 2002, it starts to decrease, as a delayed reaction to the international context, and in 2003 it reaches a negative value.
The balance of other capital movements (the line marked by squares) consists of proprietary loans. This value is stagnant until 2000, in 2001 it boosts, and decreases in 2002. This volatile nature of crediting can-not be projected to the future, and cannot be considered a long-term tendency. Probably the political and economic uncertainties of the turn of the millennia are reflected by this fluctuation, and the value of the credit stock has reached equilibrium again.
The amount of reinvestment – the dotted line – was not significant until 1997. However, between 1997-2000 this revenue reached two thirds of the overall FDI inflow, by its annual average of 1.1 billion EUR. Between 2001-2003, reinvested incomes showed an increasing tendency reaching 2 billion EUR by 2003, besides a decrease in FDI inflow. However, this increase cannot balance the overall decrease, therefore the volume of FDI decreased.
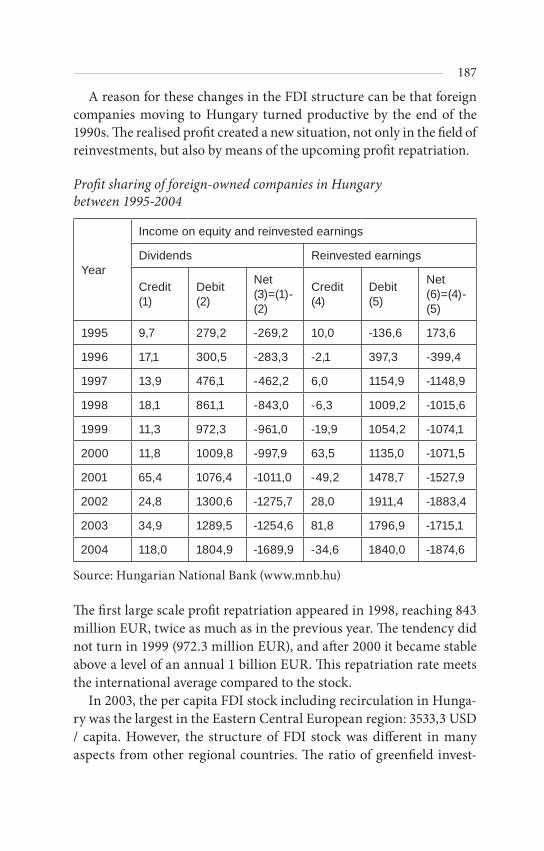
187
A reason for these changes in the FDI structure can be that foreign companies moving to Hungary turned productive by the end of the 1990s. The realised profit created a new situation, not only in the field of reinvestments, but also by means of the upcoming profit repatriation.
Profit sharing of foreign-owned companies in Hungary between 1995-2004
Year
Income on equity and reinvested earnings
Dividends Reinvested earnings
Credit(1)
Debit(2)
Net(3)=(1)-(2)
Credit(4)
Debit(5)
Net(6)=(4)-(5)
1995 9,7 279,2 -269,2 10,0 -136,6 173,6
1996 17,1 300,5 -283,3 -2,1 397,3 -399,4
1997 13,9 476,1 -462,2 6,0 1154,9 -1148,9
1998 18,1 861,1 -843,0 -6,3 1009,2 -1015,6
1999 11,3 972,3 -961,0 -19,9 1054,2 -1074,1
2000 11,8 1009,8 -997,9 63,5 1135,0 -1071,5
2001 65,4 1076,4 -1011,0 -49,2 1478,7 -1527,9
2002 24,8 1300,6 -1275,7 28,0 1911,4 -1883,4
2003 34,9 1289,5 -1254,6 81,8 1796,9 -1715,1
2004 118,0 1804,9 -1689,9 -34,6 1840,0 -1874,6
Source: Hungarian National Bank (www.mnb.hu)
The first large scale profit repatriation appeared in 1998, reaching 843 million EUR, twice as much as in the previous year. The tendency did not turn in 1999 (972.3 million EUR), and after 2000 it became stable above a level of an annual 1 billion EUR. This repatriation rate meets the international average compared to the stock.
In 2003, the per capita FDI stock including recirculation in Hunga-ry was the largest in the Eastern Central European region: 3533,3 USD / capita. However, the structure of FDI stock was different in many aspects from other regional countries. The ratio of greenfield invest-

188
ments is still the highest in Hungary, reaching 33% of the complete stock, and the ration of export oriented investments is still outstand-ing: 15-20%. (Magdolna Sass [2003]).
Summarising the tendencies of the early 21st century, a very important feature cannot be omitted: this is the increasing role of disinvestment.
The amount of disinvestment annually doubled from 1998 to 2001. It considerably decreased in 2002, and in 2003 both investment and disinvestment values were outstanding, taking an overall negative val-ue, what is really disturbing. In subsequent years, the value of shares went back to the 2001 level. The 2003 anomaly could be caused by the uncertainties and incalculableness of the Hungarian political and economic life – fluctuation in exchange rate of the forint, tensions be-tween the Ministry of Finance and the Hungarian National Bank, and expectations towards EU accession.
Changes in investment and disinvestment in Hungary between 1995-2004
YearEquity and other capital
Increase Decrease Net
1995 3625,50 62,8 3562,7
1996 1793,30 47,3 1745,90
1997 2242,80 232,6 2010,20
1998 1620,60 248,9 1371,80
1999 1858,70 423,8 1434,90
2000 2371,10 861,5 1509,60
2001 2349,90 1253,50 1096,30
2002 1690,90 534,2 1156,70
2003 5978,00 6642,10 -664,1
2004 2337,00 1228,10 1108,20
Source: Hungarian National Bank (www.mnb.hu)
Deployment of research and development activities of multinational companies in Hungary became a stronger tendency after 1998, that

189
must also be noted among the changes of the FDI structure. This is particularly important, because the R+D centres also mean the centre of the organisation matrix of the company, a stable division existing for long terms, serving and directing other organisational units, and therefore these are indispensable for the survival of the corporation.
According to the surveys, almost a half of the large multinational enterprises operating in Hungary are engaged in R+D activities as well. The most important ones by sectors are: lighting industry, (GE-Tungsram), manufacturing medical instruments (GE-Medicor); medi-cine (Sanofi-Chinoin, Astra Zeneca, Teva-Biogal, Akzo Nobel-Orga-non); informatics and telecommunication (Ericsson, Compaq, Nokia, Siemens, Motorola); machine production (Audi, Continental Teves, Volkswagen, Temic, Knorr-Bremse, Denso); electronics (Felxtronics, Samsung); tyres (Michelin); household chemicals (Unilever); new ma-terial development (Furukawa); agriculture (Novartis-Sandoz Seeds).
The objective should be the support of the development of these and similar companies into innovation bases and regional centres requir-ing high intellectual potential and the support of investments serving applied R+D activities relevant to high-tech technologies. The founda-tions thereof are given, rooted in long standing research facilities and higher education outstanding in many regards. The research potential of Hungary ranks 25-27 globally. a qualified, flexible and ambitious labour is available for investors. As for the institutional framework: Hungary is a member of all major European R+D networks, therefore the company conducting such activities hereimmediately becomes part of the developing European research area.
2004-2008 Tendencies after the EU accession
The European Agreement, signed in 1991, broke down the trade bar-riers between Hungary and the Communities, and the Hungarian regulatory framework was gradually adapted to that of the Commu-nity, therefore actual accession on 1st May 2004 did not mean a major change in the economic or legal environment. Enlargement has not generated further tasks for multinational companies, because they had been already prepared thereto. EU integration has also not effected the economical operation of their places of business.
The common customs becoming effective with the enlargement changed the economical character equivalent to geographical dis-

190
tance. Common trade policy resulted in some levels of protection in various sectors against cheaper products from third countries.
The requirements of tax benefits, such as the size of the investment, the number of new jobs created could only be met by the largest, i.e. multinational companies. However, the EU does not support direct state incentives of production.
According to the aspirations of the EU, economic development shall be realised by means of community programs, wherein multinational companies and subsidiaries can participate. It is even more so, because Hungary became part of the Union as a territory to be subsidised, par-ticularly the Eastern and Northern regions.
The enlargement resulted in Hungary becoming a regional centre for many companies for their access to markets to the East. The coun-try gained a regional central role in the fields of tourism, logistics and the software industry.
Let us see the new tendencies in some figures! (table p. 191)
The first change to be mentioned is the growing volume of equity capi-tal, which means that after the EU accession Hungary became the tar-get of the Greenfield investments again. In the meantime, the decrease of equity has also shown high values. The possible explanation of this intensive fluctuation in equity is the structure change in FDI inflow. Investors preferred new sectors and they extracted the capital from the old ones. In 2006, there was a relevant decrease in foreign equity of real estate and business activities, which reflected the recession of this sec-tor. In 2007, this tendency continued and the investors extracted more than 3 billion euros equity capital form this sector. Due to this fact this year the whole FDI inflow in Hungary decreased essentially in com-parison with the other years of this period. In 2008 the high volume of inflow equity in service sector resulted in increasing net capital invest-ments.
The second important phenomenon is the rate of profit repatria-tion. The volume of dividend doubled and in some years even tripled of this value in previous periods. The amount of reinvested earnings remained at the same level; it was approximately 1.6-1.8 billion euro per year.

Year
Equi
ty c
apita
lR
einv
este
d ea
rnin
gs
Equi
ty
capi
tal a
nd
rein
vest
ed
earn
ings
Oth
er c
apita
lD
irect
in
vest
men
t in
Hun
gary
Incr
ease
Dec
reas
eN
etLi
abili
-tie
s, n
etA
sset
s,
net
Net
li-
abili
ties
(1)
(2)
(3)=
(1)-
(2)
(4)
(5)=
(3)+
(4)
(6)
(7)
(8)=
(6)-
(7)
(9)=
(5)+
(8)
2004
.2
354.
11
272.
51
081.
62
227.
43
309.
035
5.1
225.
412
9.6
3 43
8.7
2005
.4
442.
347
6.0
3 96
6.2
1 91
7.9
5 88
4.1
770.
948
2.9
288.
06
172.
1
2006
.3
731.
22
255.
91
475.
31
358.
62
834.
03
094.
947
4.5
2 62
0.4
5 45
4.4
2007
.4
583.
73
739.
784
4.0
2 27
4.5
3 11
8.5
3 47
7.6
3 74
4.0
-266
.42
852.
1
2008
.7
539.
74
268.
03
271.
789
5.1
4 16
6.8
2 29
4.3
2 27
0.4
23.9
4 19
0.7
sour
ce: H
unga
rian
Nat
iona
l Ban
k st
atis
tics 2
012
Dire
ct in
vest
men
t in
Hun
gary
, tra
nsac
tions
Eu
ro m
illio
n

192
Profit sharing of foreign-owned companies in Hungary between 2004-2008 Euro million
Year
Income on equity and reinvested earnings
Dividends Reinvested earnings
Credit Debit Net Credit Debit Net
(1) (2) (3)=(1)-(2) (4) (5) (6)=(4)-(5)
2004. 118.9 1 825.8 -1 706.9 397.1 2 227.4 -1 830.3
2005. 366.0 2 374.3 -2 008.3 95.5 1 917.9 -1 822.4
2006. 291.1 3 842.3 -3 551.2 690.7 1 358.6 -668.0
2007. 376.0 4 203.0 -3 827.0 635.6 2 274.5 -1 638.9
2008. 1 120.6 4 064.4 -2 943.8 -705.5 895.1 -1 600.7
Source: MNB statistics 2012
It means that the profitable Hungarian subsidiaries allowed owners to realise more and more money from their Hungarian investments. The above mentioned structure change in FDI targets caused the growing proportion of Greenfield investments in FDI inflow, while the rate of investments in the existing firms were stagnant.
FDI by economic activities in Hungary
Source: wiiw, FDI statistics, 2009, ICEG, 2010

193
Bellow the FDI structure is presented by sectors in the previous dia-gram. (Source: Hungarian National Bank, 2009)FDI stock in Hungary by sectors is as follows: services (56%), manufac-turing (36%), electricity, gas and water (5%) and other (3%).
According to Ernst and Young’s CEE Attractiveness Survey of 2009, investments in services doubled in Hungary between 2004 and 2008 in terms of the number of projects. The share enjoyed by services ex-ceeds that of the manufacturing sector by 20 percentage points. In 2008, Hungary was the target of 21% of all service investments in the CEE although the engine industry was the best performer as far as the number of new jobs is concerned. (ITD 2009)
The stock of FDI increased from 45.134 billion euro to 62.454 billion euro during this period. Despite this positive tendency, Hungary - af-ter the EU accession - lost its leading position in CEE concerning FDI stock per capita. Hungary was the third most attractive economy from the foreign investors’ point of view in CEE, but it could overtake some emerging countries from Southern-Europe as well.
FDI stock per capita in the CEE region, 2009
Source: wiiw, FDI statistics, 2009, ICEG, 2010

194
.. Effects of the third wave of globalisation in Hungary
Hungary – comparing to its size – attracted an essential volume of FDI, which contributed to the economic success of the country [51]. Generally, more FDI-induced positive benefits can be identified in Hungary than in the other countries of the region. Beyond its role in the market transition, foreign capital also contributed to GDP growth to the increase of foreign trade and export potential and to the mod-ernisation of the industry structure.
The ratio of foreign property in the processing industry was 64.5% in 2000, more than 50% thereof was related to machine industry. Three quarters of industrial investments were realised by foreign-owned companies. FDI focused originally on branches with lower surplus val-ues (food industry, textile industry), and later there was a shift toward higher value branches (chemical industry). However, the relevance of that sector within FDI has decrased from 45.1% to 36.8% by the turn of the millennium. In parallel with this, the role of the tertiary sector increased. Foreign ownership reached 58.5% in financial services and 29% in tourism. By the end of the 1990s this sector became the most important one, closing on the FDI structure of developed countries. They feature a high profit ratio and a strong foreign exchange earning capacity.
The establishment of the market economy and the modern sectoral structure, as well as the GDP growth can all be clearly derived from foreign direct investments.
Effect on growth of GDP
The correlation between FDI and GDP was 86%, and if we filter the ef-fect of privatisation, this correlation was 96%. [52].
The questions of the selected approach (what relays impact on growth: spillover, human capital) formulated by international and re-gional authors, also appears in the assessment of the Hungarian FDI-GDP impact mechanism. According to Inotai (1989), three sources of growth can be distincted from FDI: first, increasing demand induced by the investment; second, multiplier effects of the inflow; and third, the productivity increase through spillovers. On the one hand, FDI had a positive and significant effect on GDP, but on the other, the influ-

195
ence of FDI on the Hungarian companies is weak. The competitiveness of manufacturing industry increased in connection with foreign com-panies exclusively. The volume of spillover differs according to the sec-tors, but it is not relevant anywhere. Such positive externalities of FDI can not be identified, which would increase the effectiveness of local firms. a dual economy evolved in Hungary, where foreign companies have performed better than the domestic ones, and there are few link-ages between local and foreign firms.
Effect on the productivity and competitiveness
The productivity of foreign companies is higher than the productivity of domestic firms. Sgard [53] concluded in his analysis on Hungarian productivity between 1992-1999 that foreign firms are more effective compared to domestic firms. The highest growth in productivity is ob-servable at companies with a foreign ownership lower than 50% [54].
The export-import intensity of the foreign enterprises is higher than the trade activity of local firms [56]. In parallel with the modernisation of the trade structure, the concentration appeared in Hungary as well. In the high-tech industry, foreign firms were superior compared to do-mestic enterprises from the beginning. The share of foreign companies in trade is extraordinary in the high-tech industry. The disadvantage of local firms reduced somewhat in this sector by the end of ’90s.
The potential effect of foreign direct investment on Hungarian economy (concerning large enterprises in the manufacturing sector), productivity and competitiveness during the period of 1993-2006 was the subject of another research. (Katona 2011) (Regression model is in the enclosure) In the framework of this microeconomic analysis, the regression model sought to verify or reject the following research hypotheses.
1: The productivity of firms increased linearly with their foreign equity.
2: Increasing the proportion of foreign ownership in total sector equity could contribute to the productivity of the whole sector. The spillover prevailed in Hungarian economy.
3: The export volume of firms relates linearly to foreign ownership in equity. Foreign direct investment was essential for the development of Hungarian competitiveness.
The results confirmed the first and second hypotheses, but only par-tially supported the third one.

196
One-percent growth in foreign share of the firms’ equity generated an increasing positive change in the volume of firms’ sales. The rates of this increase in the five years which were compared to 1993 (1994, 1997, 2000, 2003, 2006) are 3.39%; 4.53%; 5.17%; 5.9% and 5.97% re-spectively. The robustness of this factor also increased from 15% to 29.6%, however the explanatory power of this is not outstanding. The correlation between dependent and independent variables is statisti-cally significant and positive. It means that foreign direct investment had a positive effect on the productivity of Hungarian large companies in the examined period.
The foreign share in the total equity of the branches in the manu-facturing sector, which indicates the spillover effect, had a statistically significant and positive correlation with the total sales of large enter-prises. In other words, it had an influence on the productivity of the sector. The robustness of this factor had passed 50% by the end of the period. This fact verifies the existence of a spillover effect in the manu-facturing sector of the Hungarian economy.
The connection between international competitiveness and foreign direct investment was not as evident as the connection between pro-ductivity and FDI. In the first half of the period, neither the effect of foreign shares in firms’ equity nor its effects on the branches’ total eq-uity on export sales were significant. In 2000, the robustness of these factors exceeded 20%, but both values decreased in 2003. This was due to the decline in export performance of the biggest export-oriented companies. The spillover effect in competitiveness was weaker than the influence of FDI concerning export sales.
The impact on foreign trade
The participation of foreign-owned companies in Hungarian exports is outstanding. (Andrea Éltető [1999]). The intensity of foreign trade by foreign-owned companies is larger than that of the domestic ones, which is true for not only the intensity of exports but for the imports as well. The ratio of export intensities (export/aggregated production) of foreign-owned and domestic companies is particularly prominent in the tobacco and petroleum industries (tobacco industry is com-pletely foreign-owned, and MOL enjoys monopolistic position). For-eign ownership determinates the export intensity of efficiency oriented (processing industry, electronics), market oriented (food industry) and cheap labour intensive (textile industry) companies.

197
Consequently, beyond efficiency seeker companies, market oriented ones also realise major foreign turnover, which is caused by the fact that the market oriented investors originating from non-EU member states want to access the market of the EU, and not only the market of the host country. Trade within the region also boosted, because of many investors targeted the establishment of regional centres. Effi-ciency seeker investors from EU member states exported back to the market of origin country by utilisation of cheap inputs of host country.
Changes in the structure of foreign trade involve an increase in con-centration. The Hirschmann concentration index (ratio of one product type in aggregated export) increased in all regional countries, includ-ing Hungary. In traditional theories, factor endowment motivates trade. Every country specialises in its abundant factors of production. Central and Eastern Europe has a comparative advantage in labour and resource intensive products, but disadvantages are diminishing also in human capital-intensive products as well. In Hungary, this has already turned into the positive, in other terms into an advantage.
The flow of FDI into Hungary aided economic prosperity and the changing of export structures. In the early phase of FDI, processing industry and trade marked the mainstream, but by the end of the dec-ade financial sector became predominant. Besides, real estate business also prospered. (Hamar J [2004])
Foreign companies played an important role in the growing ratio of technology intensive activities. Foreign-owned companies enjoyed prev-alence over domestic ones from the outset. The portion of foreign-owned companies in foreign trade is the most significant in relation to high-tech products. The role of domestic companies in technology intensive indus-tries and exports decreased in the first period of the decade, but this dis-advantage diminished by the end of the 1990s. Overall, Hungarian ex-ports moved toward a higher technological level. Import structures also had changed considerably: by 2002, 10.4% of aggregated import derived from high-tech elements, energy resources and raw materials (except for natural gas) have been superseded. (Antalóczy-Sass [2003])
Hungary became a part of an international assembly network dur-ing the 1990s, but only at a level of a low surplus value. Domestic sur-plus value stabilised around 30% by 2002. In the 1990s, the ratio of machine industry in exports increased from 21% to 60%. High-tech

198
products reached 20% in 2002 in both exports and imports. National surplus value was still at a high level.
Impacts on technological level
While in 1980 2.5% of the Hungarian GDP was spent on R + D, in 1991, this ratio was 1.61%, by 1996 this value decreased to 0.7%, and in 2002 it was around 1% (Hamar [2004]. Half of the companies did not have any R+D activities in the mid-1990s. a certain amount of own innovation appeared only at supplier companies of foreign-owned en-terprises, due to a need of correspondence. Narrowing down of the Hungarian corporate R+D was also strengthened by FDI, since instead of development in many cases, technology was imported. Introduction of new technologies only happened at 45% of Hungarian companies, and at 60% of foreign-owned companies.
Meanwhile the R+D activities of foreign-owned companies far sur-passed those of domestic enterprises: in relation to the total corporate sector, this ration grew from 22% to 80%, and the actual R+D spend-ings increased by five times. Some argue that foreign-owned compa-nies affected the complete corporate sector by means of their R+D and innovative activities. Others state, that an economic-technological duality has been created between foreign-owned and domestic com-panies. According to Szalavecz (1999), originally, products toward the end of their life cycles had been imported into Hungary, but already at the end of the 1990s, several investments settled R+D activities in the country.
Török-Petz [1999] showed, that R+D activities did not explain the increasing export competitiveness of Hungary and the increasing cor-porate productivity. 83% of processing industry companies did not have any innovative results between 1999-2001, while this sector was responsible for the majority of exports.
The quality of the relations with the host countryWhile investors obtained a system of relations during privatisation,
this was not granted for greenfield investments. a greenfield investor brought along its foreign relations and did not formulate new ones. Only 19% of foreign-owned companies have entered into strategic al-liances, the national supplier chain is insignificant. 46% of the sur-veyed companies applied Hungarian suppliers whose highest number appeared in industries at a low technological level. The relations are

199
unsatisfactory both qualitatively and quantitatively. Hungarian small and medium enterprises cannot compete with multinational compa-nies that strengthens the enclave characteristics.
This does not decrease the enclave characteristics of the process-ing industry, either at a high or low level of surplus value: foreign trade is inevitable for high-tech companies due to the high expec-tations toward suppliers, and technologically lower level companies need it because of cheap imports. Examples of two-way horizontal technology transfer are still exceptional, but as a promising tenden-cy, more and more multinational companies deploy R+D facilities in Hungary.
The impact on wages and employment
The level of labour cost was originally higher by 9% than the average in those Hungarian enterprises which were targeted by foreign direct in-vestment. After changing ownership, this wage premium reduced es-sentially, on the long run, the wage level had not exceeded significantly the level before the foreign investment. The change in wage premiums accompanied the change in productivity of the firms. It proves that a higher wage level does not depend on the ownership; it has a connec-tion with other characteristics of the firms. In other words, higher pro-ductivity, better performance and more employers that are qualified induce higher labour cost. These are the very same factors, which at-tract foreign investors into a country [57]. Demand for foreign compa-nies for employers concentrates on developed regions of the country; consequently, FDI contributes to deepening the regional differences.
The impacts of FDI to the employment structure, labour market and regional distribution in Hungary between 1993-2000 were analysed by Fazekas K. [2003]. His empirical researches highlighted a significant role of FDI in the expansion of job opportunities. 80.4% of the new jobs created by the corporate sector were connected to foreign-owned companies. However, 66% of these new jobs concentrated on regions, where unemployment had already been low. The largest problem is the geographical distribution of jobs, namely the jobs offered by foreign-owned companies – and by domestic ones as well – are concentrated in regions already industrialised and highly urbanised regions with high levels of employment. Therefore, the differences in development and productivity among certain regions only deepen.

200
In summary, there are more positive trends in Hungary than in other countries of the region. Beyond its role in the establishment of a market economy, FDI also apparently contributed to GDP growth and increasing foreign trade potential, modernisation of the industry and the structure of exports and imports. It also had a leading role in the creation of new jobs. The productivity of Hungarian companies increased, if they operated in the same sectors, where foreign-owned ones were also active, but produced for different markets. Hungary is not different from other countries of the region in terms of the level of integration based on spillover and the supplier chain.
Enclosure
This research is based upon a linear regression model. The methodol-ogy used a database of Hungarian enterprises made by ECOSTAT which represents close to 90% of the firms in the country. The average number of firms in this database is close to 4800 for each year but includes entries onto and exits from the market. The period includes the 14 years between 1993 and 2006, 11.5 years before the date of EU integration (1st of May 2004) and 2.5 years after it. The records contain all relevant information from annual reports, e.g. balance sheets, profit and loss figures, etc.
In the regression model, the proxy for productivity and competi-tiveness was total factor productivity (TFP), which was calculated based on a standard Cobb-Douglas production function. This allowed the analysis of the interaction between TFP growth on the one hand, and foreign direct investment and other possible determinants of pro-ductive efficiency on the other. The impact of FDI on total factor pro-ductivity in Hungary was assessed with a large enterprise sample in the manufacturing sector. The percentage of large enterprises in this sector increased from 40% to more than 60% by the end of the period, and this fact explains the limitation of examined firms. The research differentiated 22 branches within the sector in order to measure the effect of foreign investment in a branch on total factor productivity in the whole sector. Data was taken from five particular years in the period: 1994, 1997, 2000, 2003, 2006, from which the change in factor productivity was examined compared to the situation in 1993(t0).The following regression equation is estimated:
Yt = SYijt/ Yt (b0 + b1Cijt+ b2Lijt+ b3FDIijt+ b4SPILLijt+eijt)

201
The definitions are as follows: Y: the change in real output of firm i operating in branch j at time
t compared to t0, calculated by reported sales SYijt/ Yt the weights of the individual firms’ share in the sector’s
outputC: the change in capital of firm i operating in branch j at time t
compared to t0, defined by the value of fixed assetsL: the change in labour of firm i operating in branch j at time t
compared to t0, expressed by number of employeesFDI: the change in share in total equity of firm i operating in branch
j at time t compared to t0, owned by foreign investorsSPILL: the change in share in total equity of all firms operating in
branch j at time t compared to t0, owned by foreign investors, deter-mined by the following formula: SFDIijt *(Yijt /Yjt), where Yijt /Yjt is the weight of the individual firms’ share in the branch’s output
The modified regression model is intended to reveal the effects of the aforementioned factors on export activity, and indirectly, the correlation between foreign share and international competitiveness of the firms.
The equation is as follows:EXYt = SYijt/ Yt (b0 + b1Kijt+ b2Lijt+ b3FDIijt+ b4SPILLijt + eijt)Where EXY means the change in export sales of all firms operating
in manufacturing sector at time t compared to t0The factors of K, Y, EXY were deflated by producers’ price index in
manufacturing based on 2000.
Please, find the results of the regression in the table of page 204.
Effect on Productivity
The capital and labour input determined the performance of large en-terprises in the manufacturing sector. In all examined data after 1994, the robustness of these explanatory variables was close to 90% or even exceeded this level. This means that in using more capital and employ-ing more workers, the enterprises had a better chance of increasing the volume of their sales.
For the present research, these traditional factors and their effects are not essential. This work focuses on the impact of foreign shares in firms’ equity and in branches on the total factor productivity in the

202
manufacturing sector. In connection with both of these factors, a posi-tive tendency may be observed. The robustness of these explanatory variables, (FDI and spillover) in the sampled period was growing con-tinuously and the correlation of both factors with the volume of sales was significant and positive. Increasing the foreign share in the firms’ equity by 1% will generate growth between 3.39% and 5.97% in the volume of firms’ sales (diagram 202 p.).
The robustness of spillover was greater than the explanatory pow-er of the foreign share in firms’ equity, where the maximum value of the coefficient was 29.6%. This fact shows that the foreign share in the branch’s total equity had an indirect impact on the productivity of those companies in which there was little or no foreign share.
Growth in sales
The result of the regression supports the assumptions that the com-panies owned by foreign investors had become prosperous by the end of the nineties. Consequently, the positive effect of foreign presence could not have appeared earlier. At the same time, it is very important to note that increasing the productivity of foreign-owned companies was complemented by a stronger, positive effect of foreign share in branches, which verifies the existence of spillover in the manufactur-ing sector of the Hungarian economy.

203
Effect on International Competitiveness
In the equation of export volume, the tendency and robustness of the individual explanatory factors were not as evident as they were in the equation of total sale. The relevancy of traditional explanatory varia-bles also decreased essentially. The coefficient of labour input changed from the initial 59% to 17% by the end of the period. This fact indicates that the growth in export performance of the manufacturing sector was realised in spite of the decreasing relevancy of employment. The effect of capital input was not statistically significant in every exam-ined year, and its robustness fell less than 10% in 2003 and 2006.
Growth in export
The correlation of the foreign share in firms’ equity and in branches’ total equity with export volume became statistically significant and robust only after 1997. It is worth mentioning that contrary to the first regression model, the direct impact of FDI was stronger than the ro-bustness of spillover. The coefficient of the direct impact of FDI was between 25.3-29.4%, while the explanatory power of spillover was be-tween 21.7-25.8%.
Increasing the foreign share in the firms’ equity by 1% will gener-ate a growth between 2.5% and 3.5% in the volume of firms’ exports (diagram 203 p.).
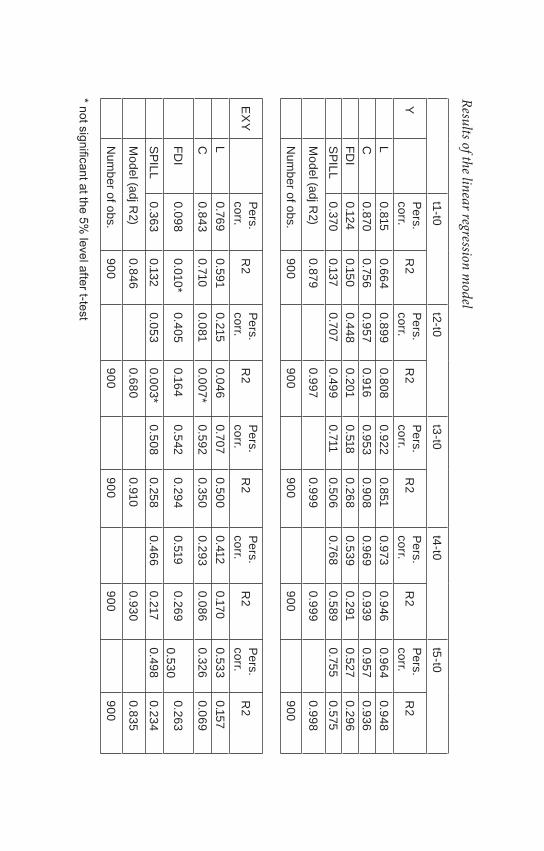
t1-t0
t2-t0t3-t0
t4-t0t5-t0
Y
Pers. corr.
R2
Pers. corr.
R2
Pers. corr.
R2
Pers. corr.
R2
Pers. corr.
R2
L
0.8150.664
0.8990.808
0.9220.851
0.9730.946
0.9640.948
C
0.8700.756
0.9570.916
0.9530.908
0.9690.939
0.9570.936
FD
I0.124
0.1500.448
0.2010.518
0.2680.539
0.2910.527
0.296
SPILL
0.3700.137
0.7070.499
0.7110.506
0.7680.589
0.7550.575
M
odel (adj R2)
0.879
0.997
0.999
0.999
0.998
N
umber of obs.
900
900
900
900
900 E
XY
Pers. corr.
R2
Pers. corr.
R2
Pers. corr.
R2
Pers. corr.
R2
Pers. corr.
R2
L
0.7690.591
0.2150.046
0.7070.500
0.4120.170
0.5330.157
C
0.8430.710
0.0810.007*
0.5920.350
0.2930.086
0.3260.069
FD
I0.098
0.010*0.405
0.1640.542
0.2940.519
0.269 0.530
0.263
S
PILL0.363
0.1320.053
0.003*0.508
0.2580.466
0.2170.498
0.234
M
odel (adj R2)
0.846
0.680
0.910
0.930
0.835
N
umber of obs.
900
900
900
900
900
Results of the linear regression model

205
It is notable that due to the changes in the years between 2000-2003, the effect of foreign share on export volume has decreased in connec-tion with both factors. This tendency may be explained by the fact that the biggest foreign-owned companies cut their export performance in this period. In 2001, the export sales of three companies from the five major export-oriented firms decreased or stagnated and in 2003, their export volume reached 2000 levels. It is likely that the decline in the value of R2 is the consequence of the structural change in the manu-facturing industry.
. Third ebb of globalisation in CEE and in Hungary
According to PriceWaterhouseCoopers’ analyses, FDI inflows to the CEE region decreased by 50% in 2009, while the real estate sector, which accounts for one quarter of all investments to the region, de-clined by 71%.3
The intensity of the recession and the collapse of FDI were not uni-form across the region.
FDI inflows to Poland declined by more than the regional average in 2009. The volume of the foreign investments has decreased by 67% in real estates, by 74% in extractive industries and by 86% in financial services.
The Czech Republic experienced a much smaller decline than the region average. Total FDI into the Czech Republic decreased by 19%. These key sectors experienced declines of around 30% in FDI in real estates and alternative energy, and 65% in automative equipment and components combined.
Slovakia is an exception amongst the countries as FDI rose by 55% in 2009. This rise was driven by one real estate investment. This single investment accounted for more than 40% of total Slovakian FDI in-flows in 2009.
Latvia and Slovenia experienced the largest declines in FDI inflows, at 71% and 70%, respectively. In Latvia and in Slovenia the real estate FDI inflows had accounted for a large share of the total, but in 2009 there was just one investment in this sector in both countries
3 FDI is projected to recover slowly and will surpass pre-2009 levels only by 2014.

206
FDI inflow to Hungary was already on the decrease in 2008, falling by about 30% to 3.1 billion euro (Hungarian National Bank, 2009). This downturn was worse than the CEE average (9% for new member states, UNCTAD, WIR, 2009), but better than the EU-27 average (40%, UNCTAD, WIR, 2009).
In 2009 the number of projects declined by 48% regionally (see table below) in 2009, but Hungary performed better than its peers did. This may result in a quicker rebound in FDI inflows over the next couple of years.
Investment announcements in the CEE region (number of projects)
COUNTRY 2008PROJECTS JOBS 2009
PROJECTS JOBS
Poland 362 30.654 130 (-65%) 7.705
Romania 356 13.753 111 (-70%) 5.337
Slovakia 85 3.220 34 (-60%) 3.619
Czech R. 142 5.412 65 (-55%) 5.289
Bulgaria 145 6.415 70 (-52%) 1.713
Hungary 146 9.963 118 (-20%) 11.015
Source: FDI markets, Financial Times, 2009, January
New trends are not observable either in the world FDI inflow or in de-veloped countries or in CEE according to the available data. It means the effect of the economic crises has not disappeared yet. Post-crisis business environment is still beset by uncertainties. Foreign direct investment (FDI) flows rose moderately in 2010, but were still below their pre-crisis average.
The present prospect in FDI policies is the interaction of industrial policies, nationally and internationally. The challenge is to manage this interaction so that the two policies work together for development. Striking a balance between building stronger domestic productive ca-pacity on the one hand and avoiding investment and trade protection-ism on the other is of key importance, as it is enhancing international coordination and cooperation (UNCTAD WIR 2011 pp 3)


FDI trends in the twenty largest sectors in CEE in 2009
Source: FDI Intelligence from the Financial Times Ltd, PwC analy-sis; figures may not sum due to rounding

209
BIBLIOGRAPHY
AGARWAL, J.P. Determinants of Foreign Direct Investment: a Survey, Weltwirtschaftliches Archiv, 1980. vol. 116, pp,. 739-773 p.
Antalóczy, K – Sass, M [2000]: Működőtőke-áramlások, befektetői motivációk és befektetés-ösztönzés a világgazdaságban és Magya-rországon [Foreign direct investment, investors’ motivation and in-centives in the world and in Hungary](Közgazdasági Szemle XLVII. Budapest)
Antalóczy, K. – Sass, M. [2003]: Működőtőke – befektetések és a kül-kereskedelem modernizációja – nemzetközi kitekintés és hazai ta-pasztalatok – Külgazdaság, XLVII. évf. 2003. december
BARRELL, R.- HOLLAND, D. Foreign direct investment and enter-prise restructuring in Central Europe, Economics of Transition, Volume 8 (2) 2000, 477-504 pp.
Beyer, J. [2002]: “Please invest in our country” –how successful were the tax incentives for
BIRKINSHAW, J. – MORRISON, A. Configurations of Strategy and Structure in Multinational Subsidiaries, - Journal of International Business Studies, Vol. 26/4, 1995. 729-794 pp
Campos, N. F. – Kinoshita, Y. [2002]: Foreign Direct Investment as Technology Transferred: Some Panel Evidence from the Transition Economies – Blackwell Publishers, The Manchester School Vol 70 No. 3. pp. 398-419
Chakrabarti, A. [2001] The Determinants of Foreign Direct Invest-ment: Sensitivity Analyses of Cross-Country Regressions, KYKLOS, 54, 89-114.
Choe, J. I. [2003]: Do Foreign Direct Investment and Gross Domestic Investment Promote Economic
Csáki, Gy. – Szalavetz, A. [2004]: a működőtőke – vonzási képesség mint a versenyképesség mércéje – Külgazdaság, XLVIII. évf. 2004. március
CSENGŐDI, S. – JUNGNICKEL, R. – URBAN, D. Foreign Takeovers and Wages in Hungary – Hamburgisches Welt-Wirtschafts-Arhiv, Flowenla Discussion Paper 3. 2003. ISSN 1616-4814
Edmiston, K. – Mudd, S. – Valev, N. [2003]: Tax Structures and FDI: The Deterrent Effects of Complexity and Uncertainty – Institute for Fiscal Stidies, vol.24, no.3, pp. 341-359

210
Éltető, A. – Sass, M. [1997]: a külföldi befektetők döntéseit és a vállalati működés befolyásoló tényező Magyarországon az exporttevékeny-ség tükrében – Közgazdasági Szemle, XLIV. évf. 1997. június, pp. 531-546
Éltető, A. [1999]: a külföldi működőtőke hatása a külkereskedelemre négy kis közép-európai országban – Közgazdasági Szemle, XLVI. évf. , 1999. január, pp. 66-80
Fahy, J. – Shipley, D. – Egan, C. – Neale, B. [1998]: Motives and expe-rience of international joint venture partners in Hungary – MCB University Press, Journal of Business & Industrial Marketing, Vol. 13 No. 2, pp. 155-165
Fazekas K. (szerk.) [2003]: Munkaerőpiaci tükör 2003. - Közgazdaság-tudományi Kutatóközpont, Magyar Tudományos Akadémia, Buda-pest
INOTAI, András (1989): a működőtőke a világgazdaságban – Alföldi Nyomda, Debrecen
IWASAKI, I. Foreign Direct Investment and Corporate Restructuring in Hungary – Hitotsubashi Journal of Economics , 2004, Volume 45, Issue 2.
KÁDÁR, Z. - MARKOVSZKY, Sz. Külföldi működőtőke - beáramlás Magyarországon – EU Working Papers, 2002, Issue 4.
KADERJÁK, P (1996): a hazai közvetlen külföldi befektetéseket meghatározó tényezőkről – egy kvantitatív elemzés [Essential fac-tors of foreign direct investment in Hungary]. Közgazdasági Sze-mle, Volume 43, Budapest.
KALDOR, N. (1978): The effect of devaluations on trade in manufac-tures. IN: Kaldor, N.: Further Essays on Applied Economics. Duck-worth, London
KATONA, K.: Vállalati versenyképesség és az állam szerepe. Hitek és tévhitek tanulmánykötet (szerkesztő, társszerző): Az állam szerepe a külföldi működő tőke motiválásában és hatékonyságában, Buda-pest.
KATONA K. (2010): Have any Positive Economic Effect of FDI on Hungarian Industry? The 4.th Annual International City-Break Conference: Business and Society in a Global Economy, 20-23 De-cember 2010 in Athens-Greece.
KATONA, K. (2009): Trends of factors that shape capital market com-petitiveness Central and Eastern.

211
KONINGS, J. The effects of foreign direct investment on domestic firms, Evidence from firm-level panel data in emerging economies – Blackwell Publishers, Economics of Transition, 2001, Volume 9, Issue 3, pp. 619-633.
LANKES, H.P. – VENABLES, A. J. (1996): Foreign direct investment in economic transition: the changing pattern of investments. The Economics of Transition, Volume 4, Issue 2.
MÄNNIK, K. – HANNULA, H. – VARBLANE, U. (2004): Country, industry and firm size effects on foreign subsidiary strategy. An ex-ample of five CEE countries – Tartu University Press.
MAYER, K. (1995): Direct Foreign Investment in Eastern Europe. The Role of Labour Costs. Comparative Economic Studies, Volume 37, Issue 4, pp. 69-88.
MOLINE, A. (2004): Global Review – Central and Eastern Europe – Plants Sites & Parks Magazine, January 2004.
MOOSA, I.A. (2005): Foreign Direct Investment: Theory, Evidence and Practice. London: Palgrave.
MOOSA, I.A. – CARDAK, B. A. (2003): The Determinants of For-eign Direct Investmenet: An Extreme Bounds Analysis , School of Business discussion paper a 03.02. Bundoora: La Trobe University, School of Business
PALIWODA, S.J, (1995): Investing in Eastern Europe: capitalising on emerging markets. Wokingham : Addison-Wesley 1995
PATKÓ, SZ. (2003): FDI into Hungary on a regional benchmark (A magyar működőtőke-áramlás alakulása regionális összehasonlítás-ban), ICEG EC Opinion VIII.
PAVLÍNEK, P. (2004): Regional development implications of foreign direct investment in central Europe. SAGE Publications London, Thousand Oaks, CA and New Delhi, European Urban and Regional Studies. 2004, Volume 11, Issue 11, pp. 47-70.
RAM, R. – ZHANG, K. H. (2002): Foreign Direct Investment and Eco-nomic Growth: Evidence from Cross-Country Data for the 1990s.
SANNA-RANDACCIO, F. (2002): The Impact of Foreign Direct In-vestment on Home and Host Countries with Endogenous R&D. Review of International Economics. 2002 Volume 10, Issue 2, pp. 278-298.
ÉLTETŐ, A. – SASS, M. (1997): a külföldi befektetők döntéseit és a vállalati működés befolyásoló tényező Magyarországon az export-

212
tevékenység tükrében . Közgazdasági Szemle, June 1997, Volume 44. pp. 531-546.
SCHLETT, András (2003): Restructuring of the Social System. Private Pension Financing. Question Marks of a Proposal Solution. In De-velopment and Integration in Transition. Kolozsvár/Cluj-Napoca: Universitea “Babes-Bolyai”, 2003, pp. 198-206.
KHAC, N. L. – SEDMIHRADSKY, M. – SVARCOVA I. – TRYTKO D. (2001) Tax and Social Security Systems for Economic Growth, paper delivered at the 57th Congress of the International Institute of Public Finance.
SGARD, J (2001): Direct Foreign Investments and Productivity Growth in Hungarian Firms, 1992-1999. CEPII 2001, Issue 19.
SZALAVETZ, A. (1999): Technológiatranszfer, innováció. Német tu-lajdonban lévő hazai feldolgozóipari cégek esete. Külgazdaság, Issue 5. pp. 29-41.
SZANYI, M. (2003): Tőkevonzás és gyárbezárás: jön, vagy megy a tőke? – VKI 2003/58.
SZEKERES, V. (2003): Foreign Capital and Economic Development in Hungary. Foreign Direct Investment in Central and Eastern Eu-rope, Athenaeum Press Ltd.; Gateshead, Tyne & Wear 2003.
TÖRÖK, Ádám – PETZ, Rajmond (1999): Kísérlet a K+F intenzitás és exportszerkezet közötti összefüggések vizsgálatára a magyar gaz-daságban. Közgazdasági Szemle, March 1999, pp. 213-230.
TÜSELMANN H. J. (1999): German direct foreign investment in East-ern and Central Europe: relocation of German industry? European Business Review, Volume 99, Issue 6, pp. 359-367 .

213
3. GLOBALISATION IN ASIA WITH SPECIAL FOCUS ON CHINA
.. Background and motivation
The Chinese economic model is not without forerunners: transition from a planned to a market economy was attempted by European so-cialist countries already in the 1960s, but they failed to achieve any ap-parent results. The results of the People’s Republic of China realised in the 1980s are largely based on a model, whose theoretical foundations had been designed in the first half of the 1960s in Czechoslovakia and in Hungary, and what was partially realised in the later country after 1968 under the title “New Economic Mechanism”.
The disadvantages of the strictly planned economic model have been assessed by many, but the first such analyses had been done in the early 1960 by Ota Sik and Rezső Nyers in Czechoslovakia and respectively in Hungary. Market oriented reforms also have some roots in Yugoslavia, where the non-viability of the state planning and distribution has been realised as early as the late 1950s.
Measures had been taken toward self-managing state enterprises in Yugoslavia, smaller state intervention and less detailed planning in Czechoslovakia, and wider freedom of agricultural production in Hungary.
Eventually in Eastern Europe these attempts failed. Failure was caused mainly by nationalistic tensions in Yugoslavia, the lack of understanding of the orthodox Soviet leadership, and its subsequent intervention in Czechoslovakia and the anti-Soviet feelings of the in-tellectuals in Hungary. Methods tested in Eastern Europe have been successfully applied in China so far, and negative impacts derive only from the environmental effects of the economic growth being too fast.
Modern Chinese history have been organised around two major per-sonages, Mao Zedong ‘the great pilot’ and Deng Xiaoping ‘the great reformer’. If Mao was the ideology, Deng was the pragmatism. He de-veloped the system of Chinese realism what can be called today a so-cialist market economy overcoming globalisation. Mao and Deng were opponents, but they naturally knew that they need each other. When

214
Mao, out of his revolutionary zeal, started his Great Leap Forward, which was to reach a tragic end, but which originally had been meant to bring China to the technological level of the period (1958-59). An-other goal was to achieve Communism, which was attempted previ-ously by the role model, the Soviet Union, and it eventually resulted in bitter and bloody sacrificies, that none of the two powers ever managed to reach it.
During the years of correction, Deng and his comrade Liu-Saoqi had to bring back China from a deep recession. After enforcing so-called people’s communes in agriculture, a famine broke out, previously un-seen not just in China, but anywhere else in written history (including the Holodomor, hitting the fertile lands of Ukraine due to the agricul-tural policy of Stalin). According to later statistics, approximately 30 million people were missing from the registries. By this time, Mao had fallen out from leadership, to re-enter as the blood-covered Commu-nist Prince of the Cultural Revolution between 1966-1976.
The Cultural Revolution between 1966-1976 turned the social, eco-nomic and political relations of the country upside down, but the vol-untarism applied in this period forced the Chinese leadership to real-ise that they need a new model for the economic structure, which is capable of solving the pressing issues of their population growing over a billion people. Food provision was of primal importance, because alimentation of the population for basic foodstuff was endangered during the Cultural Revolution, and a major famine was again threat-ening. It was thus no accident that the increasing the agricultural pro-ductivity was set as primary objective. In order to achieve that new economic organisation methods were introduced to make the peasants interested in producing more than their actual demands. The failure of the Cultural Revolution proved that this could not be achieved by ideological motivation, political enforcement or by undisguised vio-lence of the law enforcement or the military.
Chinese leadership accepted that rapid changes disrupting everything would cause more harm than good, even if they follow a favourable di-rection, therefore market opening was started in small steps gradually by application of small-scale, local experiments. After 1976 the typical method applied by the Chinese leadership was
215
– to analyse the methods applied elsewhere;– to select the solutions which can be applied in China;– to introduce the models deemed favourable in small scale local
experiments;– and to apply it on a larger scale or the reject its application de-
pending on the results of – experiment.
Today it is hard to assess precisely, which countries served as models of economic organisation practices for Chinese leaders in the late 1970s, but it seems that the applied methods derived from the Hungarian New Economic Mechanism, as well as the successful free trade areas of Mexico and Malaysia working for exports. It is a common allegation against China that every element of its successful economy is a copy of something: there are many traces that their economic reconstruc-tion model itself is truly an implementation of several different foreign examples. It is a scarcely remembered element of the search for the rea-sons of Chinese economic success that Hungary also served as a model for the Asian nation just dealing with the aftermath of the Cultural Revolution. When Deng Xiaoping declared the great modernisation in 1979, Chinese experts started to roam the world in pursuit of possible development models for a successful economic restructuring. There were two models in the 1980s apparently effecting the Chinese econo-my: first, the planned capitalism based strong state intervention of the Asian Tiger economies, which made Taiwan, Malaysia and South Ko-rea so great, and also – less frequently mentioned – the New Economic Mechanism of Hungary, striving to open state property to a market economy (Árva, 1990). The system of special economic areas was pri-marily implemented from Malaysian practice, along with the idea that foreign investors are allowed in the country, but only inasmuch as they accept the state requirements on employment, technology transfer and export ratio. Another Hungarian example utilised was the separate ac-counting of agricultural collectives working also for the market.
The Hungarian Central Planning Bureau often hosted Chinese experts in the 1980s, who intensively studied the Hungarian way of gradual transition and gradual modernisation. At that time, Hungarian ex-perts showed some kind of benign condescension toward showing the

216
methods of market transition, but already at this time some differences between Hungarian and Chinese perspectives were apparent. For the Hungarian economists gradual transition was only an involuntary slo-gan, because as they covertly believed in the IMF and in the teachings of the neoliberal American school of economics, they were convinced, that only full scale liberalisation and privatisation is going to make the Hungarian economy a successful one. Chinese economists were how-ever convinced that only the unity of the market and state planning are going to pave a road to a successful country. Chinese leaders of this time have understood that the Washington Consensus, as the for-mulation of the mainstream neoliberal theories, which proposed fast liberalisation and privatisation for less developed countries along with granting an unlimited access to foreign direct investment would only lead to a rule of multinational companies in those countries where this recipe was about to be followed. (Árva-Schlett, 2011)
The first phase of the Chinese economic reforms lasted from 1978 to 1983/84, and it focused above all on the agriculture. In this period, China increased the security of food alimentation and applied – with minor modifications – the method of household farming already prov-en successful in Hungary in the 1960s-70s. In China, this was called the “responsibility system”. The peasants in this system contracted the state for a part of the goods produced in the household farm, but they could deal and trade the other part mostly freely, without actual state intervention. The household-collective dichotomy was extremely use-ful for the peasants in China (and in Hungary as well), because on the one hand they obtained cheap agricultural input on prices guaranteed by the state, while on the other hand they only had to sell a certain part of their outputs on a set price to the state purchasing system. They were allowed to sell the other part freely. As a result a double price lev-el favourable to farmers and agricultural traders developed in China (and later in Vietnam, following the same methods).
Beyond the agricultural reforms in the late 1970s early 1980s, similar reforms were introduced also in the industry. State planning system was eased, and the company could manage a certain part of the com-pany profits, it could be used for investments or to award workers. This model was also tested first on a small scale in Szechuan; therefore it was

217
called the Szechuan experiment. In this system the companies could keep a part (3-5%) of the profit and could finance their own invest-ments from this sum. In addition, a certain part of the amortisation could be kept by Chinese companies. Besides, any leftover products over the amount planned by the state become freely marketable by the companies. The Szechuan experiment was applied in only a few facto-ries in 1978–79, and subsequently, upon its success, it was enlarged to encompass the whole country.
Another feature of the Chinese model was that communes previously engaged solely in agricultural activities were turned into agricultural, industrial and commercial combines, where the majority of the activi-ties were related to processing of agricultural products and industrial sideline activities. This also resembled the Hungarian solution of the 1970s-80s, where industrial products reached 40% of the sideline units of agricultural collectives. The introduction of supplementary activi-ties in agricultural enterprises, widening of sideline activities practi-cally meant a vertical and horizontal enlargement of the production profile. On the one hand, sideline activities of agricultural companies appeared in the sectors related to the agribusiness (food processing, trade), while on the other hand these activities could appear in other sectors, and started to encompass an ever-larger geographical area. (Schlett, 2007)
Private enterprises have been gradually liberalised in China and in the early 1980s state-municipal, state-private, municipal-private and fully private owned companies were licensed. Naturally, it did not hap-pen shortly: first, it was experimental, applied in less developed areas, and gradually company incorporation was authorised in other fields as well. This was also beneficial for the profit of agriculture and trade transferring into business associations.
An Eastern European model was also applied in connection with the two-tier banking system in China. The Chinese People’s Bank started to play a central bank role from 1984, and among others the Chinese Bank of Agriculture, the People’s Construction Bank, the Investment Bank of China were also established. In the financial sector, approxi-mately one-half of the 800 financial institutions of China in 2010 was

218
owned by foreigners, but the four large state banks own 65% of the deposits. Due to the reform of the banking system, the implementa-tion of international norms and inner structural modernisation a two-tier banking system has been operating in China since 1979. It is often stated that due to the regulated crediting activities the credit portfolio of state-owned banks worsened, their profitability lag behind Western standards. The modernisation of the banking system gained speed af-ter the turn of the millennium, when foreign capital was allowed, al-beit was subject to limitations, to acquire ownership in Chinese banks.
The most important line of the Chinese economic reform – the special economic zones – was nothing to do with Eastern European experi-ences, the source of inspiration could rather be either the Malaysian or the Mexican model. Special economic zones of China followed the examples, which have appeared from the 1970s onward in sev-eral developing countries as duty free areas, or in export processing areas – only on a Chinese scale. These zones played a pivotal role in technology transfer among others. At that time China was already of-ten alleged to disrespect intellectual properties and to copy virtually everything others manufactured there. a widespread explanation for this phenomenon is that Chinese traditions do not consider copying a theft, but it is a form of expressing respect. This difference in tradi-tions is undoubted, but it is not the sole explanation for the Chinese copies. Everly less developed but emerging country faces the problem of innovation and the respect for intellectual property. In the last hun-dred years it happened rather often that the companies of a quickly industrialising country treated patents of others very freely, but only few remember this today and many believe it is a Chinese feature, just because it is their turn now.
Prior to globalisation copying was not such a pressing issue as it is today. If an English or American company copied for example a Zeiss telescope – as it actually happened – and it was retailed in a narrow US market only, German copyright holders have even realised what was going for years, or even if they did, it did not bother their busi-ness interests. However, the divided markets melted into a global one because of globalisation, where anybody’s production anywhere affects the market opportunities and profits of others.

219
However, there are several historical examples in which the disre-spect of intellectual property had no legal constraints. German patents after World War II became publicly available, which was the founda-tion of photographic industry in many countries, for example in Ja-pan. (Walker, 1946). Japanese companies had not only used German patents, but also they copied complete product models and even the brands of their products referred to this German connection. It hap-pened this way, that the product of NipponKogaku factory was called Nikon, referring to Nippon (Japan) and the German company Contax. This company name is reflected also in the brand Pentax of the Ashahi Corporation.
German products have been copied not only by Japanese companies but also in the Soviet Union, where this was facilitated by the fact, that complete factories had been transferred to the USSR as reparation for war damages. The machines and patents of the German company Opel meant the foundation for the production of Moskvich, but also the Zorkij camera was a copy of Leica, and Kiev was a replica of Contax. Even developed countries like France enjoyed the benefits of German patents, where Foca dealt in Leica-copies.4
The practise of replication was thus widespread in the 20th century, and China has introduced nothing new in this beyond having access to the technology of the product to be replicated. However, industrial replicating was never easy. The most efficient protection is not offered by intellectual property rights or patents, but the fact that it is hard to identify how a given product is assembled. While the design and structure can be unravelled reverse engineering, it is impossible to do so with the technology required for the material structure. Those are highly protected commercial secrets of companies, what can only be acquired by corporate espionage. (Katona, 2007)The Chinese government realised quickly that even in mid-term global competitiveness could only be maintained if China produces innova-
4 Beyond freely available German patents, the USSR also illegally copied Amer-ican ones. a famous example thereof was a case of a few B-29 long-distance bombers lost near Japan, and landed in Siberia. The aircrafts were never given back, instead Tupoliev copied them and grotesquely, the B-29 replica Tu-4 bomb-ers meant the regular heavy bombers of the Soviet air force in the early 1950s.

220
tive products of a higher quality than previous ones. Thus, the direc-tions of innovation policies had to be altered, and this process is still going on. Technology transfer is thus realised. The authorities support the establishment of companies with a Chinese majority ownership, particularly for the implementation of developed technologies.
There are other, more sophisticated methods to obtain foreign technol-ogy. Western powers relied on CoCom lists after World War II to pre-vent advanced technology to be obtained by the Eastern block; today China lists those technologies that the companies have to transfer, if they want to get access to this market. Chinese rhetoric calls this phe-nomenon ‘production method for market’, and it seems, that multina-tionals have no choice but to submit their know-how. No one wants to miss this market of a country of 1.3 billion people. Western companies therefore surrender their long-term competitiveness in exchange for short-term profits, and this is well known in China. It is a great mis-take to consider replicating the key to the Chinese success. In the mo-tor industry, for example, China lags behind the Western world as far as combustion engines are concerned, but even today it is the largest producer of electric motors. China intended to increase the production of hybrid and electronic cars from 2100 to half a million by 2011.
Development of the education system has been a central element of the innovation policy. (Katona, 2010). Elementary schools became manda-tory in the 1980s, which was a major breakthrough. Secondary educa-tion was redesigned and enhanced, and about a decade ago, a kind of revolution started in higher education as well. The clear objective is to raise China as an R+D and cultural great power, and to make in-novation the main driving force of the economy. These are ambitious goals, but also realistic ones, particularly considering the money spent in order to achieve them. R+D expenditure reached 2% of the famously huge GDP, and this is to increase to 2.5% by 2020. (This ratio is around 1% in Hungary today.) Results certified this policy. The most recent results of the PISA test surveying reading, mathematical and scientific competences of 15-year-old pupils have been shocking to many: in all three fields, Shanghai children topped all three categories, overcoming education great powers like Finland, Japan, or Germany – not to men-tion the USA’s lag behind. (Salát, 2011)

221
While China reached gorgeous results in elementary and secondary education, until the early 1990s the ratio of higher education students was rather low. Laying emphasis on technical and scientific education, the highest number of IT degrees was issued in China in 2004. The quality of the training is also increasing. An overall reform of the edu-cation was declared in 1999 which included modifications to the eval-uation system and setting up 1500 detailed curricula between 2003-2007. Research and development, and the transfer of its outputs toward the corporate sector became prevalent after 2003, what was a major step forward in the innovation policies. ‘National technology transfer centres’ have been created in many universities with the objectives of the development and distribution of advanced technologies, making those profitable, and offering services to companies.
Today China is growing stronger by the day in defence issues truly sensitive from an innovation perspective. January 2011 brought along the introduction of the J20 stealth aircraft, what can be deployed as a regular instrument in a few years time, but prototypes of a satellite guided middle-range ballistic rocket are also ready.
The main driving force of growth is still the export: cheap mass products have spread all over the world including the US’ market. The balance of trade between these two countries started to shift after the turn of the millennia, and China now exports five times more to the US, than it imports from there. The deficit for the USA is more than an annual 200 billion USD since 2005.
As an outcome of the trade surplus, China today has a currency reserve of 2500 billion, two-thirds of which is in USD, and in easi-ly marketable US treasury notes and corporate securities, what had a high yield until recent times. This way China practically finances the overconsumption of the USA, and its growing national debt, which reached 90% of the GDP since the recent international crisis. The US is thus financially dependent on China.
This is however an interdependency. China cannot market large quantities of US currency and state securities, because in that case in-ternational trust in the dollar would be lost, and the own reserves of China would loose their value. It can only invest new incomes in other currencies and in gold, or redirect those into foreign investments. The USA also wants to leave this trap and it intends to double its export within five years. Chinese export of US companies already increase by 65% in 2011, however eradicating the trade deficit has not been easy:

222
the Celestial Empire has many tricks to maintain its cheap exports and to protect its market from Western products, its most efficient tool for this is the artificially low exchange rate of the yuan. The undervalued yuan has been a debated issue between the two countries for years, and it seemed for a while that China is ready for a compromise: in 2005, yuan has been revalued by 2% (at that time 8.11 yuan was paid against one dollar) and than a gradual upgrade was allowed. The process was stopped by the economic crisis, and early this year 6.83 yuan was paid against one dollar, while the ideal exchange rate would be 5 yuan/USD. The yuan is estimated to be undervalued 20-40% compared to the dol-lar. Chinese trade and financial practices have led to the termination of 2.4 million US jobs in seven years.
Since export is still vital for China, an immediate major upgrade of the currency exchange rate is not affordable for the country. Besides, Chinese trade surplus can be decreased not only by the yuan exchange rate, but another way would be if the Chinese start to consume, and purchase the goods they produced.
Changes of the Chinese foreign currency reserves (in billion dollars)
China wants to increase the role of the yuan on international markets: using yuan for transnational transactions and investments are allowed more frequently, meanwhile China admitted that turning the yuan
Source: DataStream, portfolio.hu
223
into an international currency would take some time. The unfolding picture shows that China striving for a rearrangement of the post-world-war financial markets dominated by the US dollar up to now.
China and the USA still seem today unseparable. The symbiosis of the two countries is based on the Chinese production and export which are purchased by the USA. Finally, the incomes of China are invested again in US state bonds. The interest rate of these bonds are kept low, therefore consumption increases. There are many concerns raised by China in relation to the the self-provision capacities of the US economy, which question the unlimited Chinese crediting to the US. More and more analysts expect a new US recession, and this adversely affects the “greenback”, while China is keeping diminishing amounts in dollar. (Shenkar, 2006)
.. Scope and structure of the third wave of globalisation in China
The operation of foreign direct investment played a pivotal role in the process in which China became in a short while the leading exporter of the world and the country with by far the highest foreign trade surplus.
Special economic zones meant an opening to the foreign direct in-vestment in a world economy of rapid globalisation, while on the other hand they have been closed from other segments of the Chinese econ-omy. Their production targeted foreign markets exclusively, but proved to be a useful experimental field. Due to the starting successes ten new zones were involved beyond the four coastal ones in 1984. This number continuously increased in subsequent years, while in 2003 more than a hundred such zone were operational. Meanwhile basic activities have also changed considerably: the number and significance of high-tech industrial parks have both increased and Chinese domestic market started to open gradually up as well, which was further assisted by the obligations deriving from Chinese WTO membership from 2001.
Foreign capital preferes dominantly more developed coastal areas which also have better infrastructure. Geographical advancement of foreign capital started toward the mainland as well, partly due to the insufficient capacities of coastal areas and partly to the developing in-frastructure.

224
The impact of special economic zones to employment was present in draining labour force from other neighbouring areas, but it started to materialise also in a tighter supplier network. This positive spillover effect further eroded the separation of the zones.
The typical model of global production was that the foreign-owned company – relying on cheap labour force – manufactures the product in China, and then this product would be merchandised globally un-der its own brand. Several major industrial enterprises today do not produce at all; instead, they only work in research and development, marketing, distribution and services, all of which are actually far more profitable. This is beneficial for the Chinese suppliers as well at a given level of the economy: production yields a low, but stable income; they learn Western technology and know-how, obtain experiences, and provide jobs. China had hardly any other option to emerge, but to be-come the factory of the world.
Foreign property was allowed in the beginning only as minority own-erships. Although there are still major restrictions in force for several sectors, the barriers on foreign ownerships are gradually disappearing. a particular result of these restrictions is that in China the ratio of portfolio investments is apparently low, while direct investments reach a higher number.
The capital import of China has several unique features such as the geographical origin of the capital. Unlike it happened in transitional countries of Central and Eastern Europe, capital does not arrive from the most developed countries but from neighbouring ones. In this re-gard Hong Kong is significant, but there are also major capital inflows from Singapore, Taiwan and South Korea. Far-East investors, mostly from expat Chinese communities, have been followed by Western cap-ital exporters from the USA or from Western Europe. U.S. and Euro-pean capital arrives to China via either Hong Kong or through some tax havens.
Industrial sectors have been categorised by the Chinese leadership into supported, limited, prohibited and licensed areas. Supported ar-eas are crucial for the development and long term competitiveness of

225
the country, what means undertakings providing the import of ad-vanced technology, import substitutes, and the export quota reaching at least one half of the production. There are also some areas complete-ly banned from foreign capital, such as the media, telecommunication, and certain segments of the financial sector.
The foreign direct investment in terms of structural distribution shows several similarities with developing countries. More than half of the imported capital falls within the processing industry, real estate mar-ket liberalised in the 1990s also draws a significant amount, and from the early 2000s, gradually liberalised financial sector has become an important target.
80% of FDI inflow was drawn by the coastal regions in 2010, which marks clearly the competitive advantage offered by the proximity of the sea and the special economic zones. Restrictions on capital move-ments have been slowly but gradually liberated since the WTO acces-sion. Consequently by 2006 more than half of the foreign-owned com-panies had majority foreign ownerships. It must be noted however, that restrictions on portfolio investments still direct the majority of capital inflow toward direct investments. a special round tripping is also pre-sent when the capital flows back to China after flowing out, this way it enjoys all the tax and other benefits that are offered to foreign capital.
.. The Effects of the third wave of globalisation
The success story of China started in the 1980s, when Beijing realised that its barely existing domestic market is insufficient to support the country in rising out of backwardness. In order to achieve that it need-ed foreign technology, capital and export markets; therefore it opted for a special version of free market capitalism. Still as a one-party political dictatorship, it introduced market reforms, as a result whereof today 70% of the Chinese GDP comes from the private sector, and the coun-try has an average 10% annual growth rate for already three decades.
The key to Chinese success in the two decades after the opening was dependant on implementing Hungarian, Malaysian, or Korean models by analysing the successes and failures of these countries, and
226
then only the successful elements were applied. The Chinese example proved that in every case their copy was better than the original, be-cause every element had been adjusted to the Chinese reality.
China has learned many lessons from the Asian Tiger economies. a common element of those four economies was their export-oriented development success in the processing industry markets. From the 1960s, the structure of the global economy was dominant for the rise of the Asian Tigers. Efficient, qualified, and relatively cheap labour was crucial for Asian development. Discipline of this work force is also im-portant, which was provided for in all four countries by oppressive means originally. Workers adopted also due to industrialisation, they trained and retrained, and therefore they reached a high level of pro-ductivity beyond a factual increase of living standards. Technological development and R+D results are also particularly noteworthy in rela-tion to the industrialisation of the East-Asian nations. Scientific and technological advancements achieved by these four countries have also contributed to the continuously sustained growth and the resulting maintenance of competitive positions.
The basic novelty of China from the end of the 20th century has been that foreign investments, foreign-owned companies established in China are used for obtaining the secrets of advanced technologies. Due to the complex Chinese investment conditions, foreign-owned companies are mostly mixed ones, where the Chinese partner natu-rally obtains the technological solutions, and these are often applied even next year in a neighbouring, fully Chinese company. Multina-tional companies operating in China offer a wide range of opportu-nities to obtain replicas for Chinese engineers, who do not let these opportunities go unused. Foreign companies naturally have litigation options, but it is rarely resorted to, since the Chinese state in such cases applies widespread retributions, and the foreign company can be even banned under some pretext. Cheap Chinese labour and the tremen-dous market remain highly attractive even in such conditions, and therefore companies rather tolerate reproductions, and they only start to protest when these imitated products are to be marketed in Europe or in North America.
Still it would be a mistake to identify reproduction as the central ele-ment of the emergence of China. The Chinese government was quick to realise that global competitiveness cannot be sustained if China fails

227
to market innovative products of a better quality than previous ones. The directions of innovation policy have been adjusted accordingly. Since 2001 China is a member state of the WTO, and during the last few years its economy has been boosting with incredible speed. Due to the fast liberalisation measures after joining the WTO, Chinese capital market became the second largest in Asia topped only by Japan. The structure of the export – growing exponentially since the 1990s – has been obviously altered, sector demanding raw materials and low levels of technology has withdrawn, and the volume and ratio of machine exports have both dynamically grown. The structure of the Chinese export is more and more similar to that of a developed country.
Foreign investments have been knowingly used in China for the modernisation of the economy which was realised by the wilful imple-mentation of the knowledge of foreign-owned companies established there into Chinese enterprises. There have been several methods to learn from foreign companies, the most simple form is called by many authors ‘spillover effect’ which means that the workers of foreign com-panies in China learn all those modern corporate management and technological information which they can apply when they move for-ward to Chinese companies or establish their own enterprises.
Another method is the training of local suppliers. The principal foreign-owned company often transfers technology to local suppliers which will be used later by them in the production of their own prod-ucts.
It seems that in China obtaining information through Chinese ownership has also been important. Regulations on foreign invest-ments have been continuously modified in China, and only mixed ownership has been authorised for a longer period. Even after the WTO accession, only the companies with smaller than 49% of foreign ownerships could be registered in the motor industry or in telecom-munication. (Gaulier-Lemoin-Ünal, 2011) Chinese ownership has had the natural consequence that local professionals had to be involved in the economic and technological management, whereas they were able to learn modern corporate management and technological informa-tion which they could subsequently use working for Chinese owned companies.
Meanwhile, the leaders of the Chinese economic policy – very simi-lar to the examples of Korea, Taiwan, Singapore or Malaysia – know-

228
ingly strived for encouraging development of local, Chinese owned companies besides encouraging settlement of foreign-owned compa-nies. (Gaulier-Lemoin-Ünal, 2011)
The structure of the export which grows exponentially since the 1990s – has been obviously altered, sector demanding raw materials and low levels of technology has withdrawn, and the volume and ratio of machine exports have both dynamically grown. The structure of the Chinese export is more and more similar to that of a developed coun-try. Laying a larger emphasis on research and development after 2003 meant a major step forward in the process of innovation. An overall reform of the education was declared in 1999 that included modifica-tions of the evaluation system and setting up 1500 detailed curricula by 2007. Research and development and the transfer of its outputs toward the corporate sector became prevalent after 2003, what was a major step forward in the process of innovation. ‘National technology trans-fer centres’ have been created in many universities, with the objectives of the development and distribution of advanced technologies, making them profitable, and offering services to companies.
Various strategies have been applied by Beijing in order to estab-lish good economic relation with other countries. Chinese investment, trade and manufacturing targeted mainly Asia before the early 1990s. The Chinese community of 30-40 million living in the South-East Asian diaspora contributed to these activities in the front line. China became the centre of a regionally established production chain.
This was its ground zero to bombard the world with its cheap ex-port products, but it had to move for the sake of development. It start-ed to obtain technology from developed countries, and raw material as well as energy from less developed ones. Production with a low surplus value does not have good long term perspectives because it minimises profits, because daily practice shows that there will always be a factory (in China, in South-East Asia, or elsewhere) that would be capable to manufacture the same product even cheaper. There-fore after the turn of the millenium Beijing decided, that it will not only be engaged in assembly and export production. It so proclaimed a policy to its companies called “Go out”, that is to spread on the world market.
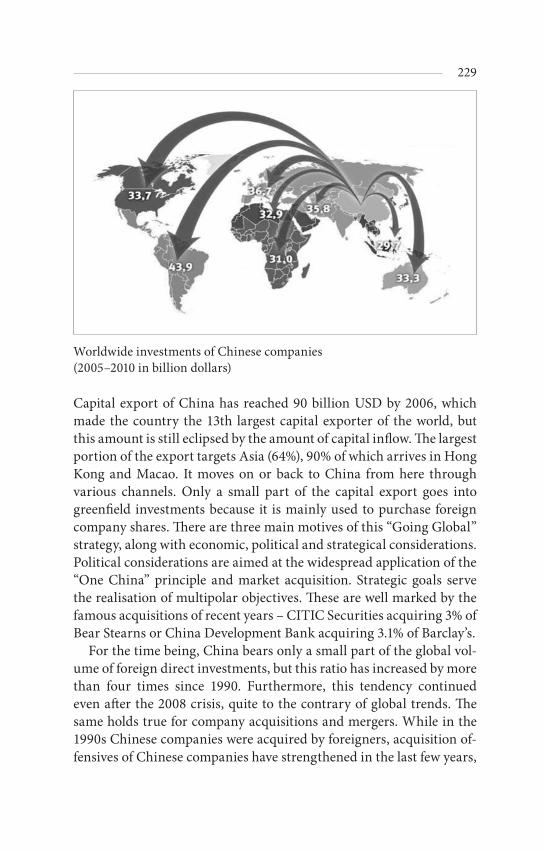
229
Worldwide investments of Chinese companies (2005–2010 in billion dollars)
Capital export of China has reached 90 billion USD by 2006, which made the country the 13th largest capital exporter of the world, but this amount is still eclipsed by the amount of capital inflow. The largest portion of the export targets Asia (64%), 90% of which arrives in Hong Kong and Macao. It moves on or back to China from here through various channels. Only a small part of the capital export goes into greenfield investments because it is mainly used to purchase foreign company shares. There are three main motives of this “Going Global” strategy, along with economic, political and strategical considerations. Political considerations are aimed at the widespread application of the “One China” principle and market acquisition. Strategic goals serve the realisation of multipolar objectives. These are well marked by the famous acquisitions of recent years – CITIC Securities acquiring 3% of Bear Stearns or China Development Bank acquiring 3.1% of Barclay’s.
For the time being, China bears only a small part of the global vol-ume of foreign direct investments, but this ratio has increased by more than four times since 1990. Furthermore, this tendency continued even after the 2008 crisis, quite to the contrary of global trends. The same holds true for company acquisitions and mergers. While in the 1990s Chinese companies were acquired by foreigners, acquisition of-fensives of Chinese companies have strengthened in the last few years,

230
what was not broken by the crisis. The role of state owned sovereign wealth funds have been outstanding in the Chinese capital exports and acquisition offensives. These funds make tremendous deals in the non-financial service and industrial sectors of developing countries. Chinese private capital has also entered the global market in recent years (Artner, 2011).
Chinese investments are driven by several motivations in differ-ent relations. While in developed regions (Europe, USA) the clear ob-jective is the acquisition of technology, Chinese companies move to Africa and other developing regions because of the yet unexploited and abundant raw materials. To deepening the relations with African countries has been served by double taxation rules and preferential crediting.
There are multiple motivations for Chinese capital exports: – Penetration into new markets is particularly important in rela-
tion to those regions where the country has a major trade surplus (e.g. United States) since provision of foreign direct investment is an alternative way to supply the given market. As part of this strategy, Chinese companies acquire local distribution networks as well.
– Capacity increase is another motivation for Chinese companies to set up new overseas factories - mainly in the processing indus-try (manufacturers of TV sets, household electronics etc.). a good example thereof is the joint venture of Chinese TCL and French Thomson: “TCL-Thomson Electronics”, where TCL owns 67% of the shares.
– Cost savings are the normal strategy of production deployment: saturation of the domestic market in recent years caused severe price competition. Companies strengthening due to the foreign direct investment inflow and the rapid economic growth are try-ing to escape competition by deploying moving production to countries with even lower labour costs. (Artner, 2009)
– Capital exports into developed countries are driven by a hunger for technology and brands beyond market acquisition aspira-tions. Chinese TNCs (Transnational Corporation - TNC) strive to acquire shares undervalued for conjunctural reasons, as was the case when TCL bought the bankrupt German Schneider Electronics in 2002 for only 8 million dollars, or as the Shanghai

231
based Huayi Group purchased the American Moltech Power Sys-tem, for 20 million dollars. (UNCTAD [2003], p. 6)
– Chinese companies prefer to establish R+D centres in developed countries, in order to facilitate the acquisition of local knowledge. Such centers are located in Sweden (Huawei Technologies, ZTE Corporation), in Seattle (GuangdongGlanz Group Co.), in the Silicon Valley (Konka) and in a number of other places in the United States, Germany, Japan, and Denmark (UNCTAD [2003] p. 6). In order to improve production technology and the level of productivity, Chinese firms seek to conclude cooperation agree-ments with the producers of the world’s developed markets.
– Capital exports are also driven by the desire to avoid export quo-tas. Some Chinese textile firms (e.g. Guanda Import and Export Co., Ltd.), in order to export to the United States and to the EU, have settled in Cambodia, where the textile import restrictions of these two economies are not applicable.
– Exploitation of the capital attractive benefits of host countries also encourages Chinese capital exports. Some Chinese compa-nies have reported this, referring to investment concessions of the United Kingdom. (Artner, 2009)
China’s FDI-export in the most important sectors - 2005-2010
Sector FDI outward stock – billion USD
Energy (petroleum and natural gas) 72,2 (41%)
Ore mining, metal industry 62,5 (36%)
Financials and real estates 33,4 (19%)
Transport 3,2 (2%)
Others total 2,9 (2%)
Total 174,3
The total value of trade between the Asian country and the African continent in 2010 exceeded 110 billion dollars. Chinese interests in-clude logging in Liberia, Cameroon, Congo, as well as cotton in Tan-zania, iron ore mines in Zambia and Gabon, the mineral-rich Sudan,

232
Ghana, Botswana, Nigeria and the Republic of South Africa. For ex-ample in Sudan, most of the oil fields are owned by Asian companies (China National Petroleum Corporation, Petronas, ONGC), while France’s Total and Sweden’s Ludi are also present (Taróssy, 2010).
In exchange for their natural resources, African countries have re-ceived dozens of new government buildings, stadiums, palaces. Chris Alden, in his book “China in Africa,” defined terms to describe the possible strategies of China in Africa: partner, competitor or hegemon. “Partner” means a long-term co-operation for development purposes. “Competitor” is a predatory expression, which is primarily aimed at the exploitation of resources. The “Hegemon” strives to take over political power. The applicable definition depends on how one approaches the Chinese presence. It can be a partner, since there have been tangible improvements, and the reasons of companies to build roads may be purely selfish, but in the end, others also use those roads. The transfer of technology is sometimes questionable, because sometimes China relies exclusively on its own nationals for work and construction, so this ex-cludes any contacts. Chinese workers are willing to work steady for less and their work ethic is also familiar, so it will not cause a conflict be-tween the investor and the crew, work is finished as quickly as possible and with the least disruption. Sometimes possibly African workers are sidelined due to lack of professional skills, or due to linguistic reasons. However, if one considers ruined enterprises, China’s presence is linked to the notion of the “Competitor”. The Chinese are breaking into sec-tors and markets which were previously dominated by Africans, mak-ing it impossible for local small and medium enterprises to survive. In addition to a wide product range of varying quality, behind the coun-ter there is also a Chinese, the owner themselves, or a family member thereof. Established trade networks and cheaply arriving goods make the situation of traditional African suppliers difficult. (Alden, 210)
.. China steers globalization – during low tide
Today, it has become apparent that the number one winner of the 2008 global economic crisis has been China. China is already the world’s largest exporter and second largest importer, owing to theoutstanding dynamics of its export and import growth over the past decade.

233
China’s rapid economic growth has changed the geopolitical bal-ance of power; the priority of the region closest to them is undeniable in their every intention. The US must consider the emerging new world power triangle: a new form of co-operation among China, India and Russia, who are less and less polite to the Americans. In the Middle East, China’s pragmatic buyer behaviour is visible. This area is vital for its exploding economy (which is based on manufacturing industries) because of the energy carriers. a Chinese advance can be felt all over the world, but perhaps it is most spectacular on the “Forgotten Conti-nent.” China has gained influence at the expense of the West in a large number of African countries; they also enter these places with “thick banknotes in their pockets.” They invest, support and aid to obtain primary access to raw materials. In the process of globalization, Africa was forgotten by almost everyone, but China saw the huge opportu-nity in the neglected “awakening Lions.” Trade growth is incredible. Chinese engineers and technicians are working for the exploitation of Africa’s resources, as well as on the construction of roads, schools and hospitals.
In the last decade, a key area for the Chinese advance was the United States’ increasing indebtedness to Beijing. Chinese household electron-ics manufacturer Haier has already established subsidiary comapnies in South Carolina, the PC sector of IBM and the software company Auctiva were acquired by China’s Lenovo and Alibaba respectively. CIF, a sovereign wealth fund, also buys smaller shares of U.S. firms, such as Apple, Coca-Cola, Johnson & Johnson, Motorola, Visa, Bank of America and Citigroup. Although China still seems content merely to increase its wealth quietly, and does not try to shape the acquired companies to its own image, not all are waiting with open arms. a good example for that is the case of the Chinese state-owned oil company CNOOC, which withdrew an 18.5 billion USD takeover bid in 2005 for the American oil company, Unocal, due to a hostile political climate.
Many think that it is only a matter of time before China takes over the throne of the world economy from the United States. The Asian country has become less identifiable with cheap commodities. Their development focuses on integrated circuits and software development, satellite technology, civil aircraft, and environmentally sound power production. The much-maligned globalism has allowed this ascent. However, it is difficult to digest for the American politicians social-

234
ised in a spirit of anti-communism that a far from democratic China, where market economy elements are combined with an authoritarian system, is striving for global leadership.
Almost at the same time as the 2008 global crisis hit, Beijing imple-mented a new paradigm: it intends to conquer the world market with its own developments and brands. The government supports Chinese companies - such as Haier, Shanghai Automotive, Nanjing Motors, Baosteel, Lenovo, Huawei, ZTE, China Mobile and China Telecom - which may be suitable for this role. “Today we smile on Chery cars designed in China, but the Japanese had begun similarly, and in 2009, Toyota became the world’s largest car manufacturer.”
Chinese investors have targeted crisis-hit Europe as well. It came in handy to them that numerous major brands of high-technology com-panies hit the floor on the old continent. This way they were able to acquire the Swedish car manufacturer Volvo from Ford, which is an-other milestone in this expansion. Beijing is expanding its European bridgehead positions, and it focuses its attempts on near-bankrupt states: Greece has agreed to sell its bonds in exchange for developing its ports and purchasing vessels. Portugal, Spain and Ireland are pre-paring to strike similar deals, and China has already received Spanish government bonds to the value of 635 million euros.
Beijing brings money to Eastern Europe, too: in this region, it had been the most active in Hungary, but now this advance is also present elsewhere. In Serbia, China is building a billion-dollar bridge as well as roads, and it provides a non-repayable grant to Belgrade. The new Zagreb airport in Croatia and an industrial district in Bulgaria are be-ing constructed with Chinese co-operation, but China is also investing in the Romanian energy sector. In Poland, Chinese Covec won a ten-der to build highway and railway sections because it had outbid other contenders by 30%.
China in Europe, like in Africa, is mainly interested in infrastruc-tural investments, and low-cost loans are used to bait some govern-ments. However, Chinese companies in Europe are trying to take a foothold in peripheral countries, and they want to move on to the more expensive markets from here. Beijing’s influence has increased significantly in recent years, and because the current world order has not been questioned so far, despite frictions, a growing part of Europe is ready to bite on Chinese money.

235
Analysts say China’s rise is comparable to that of Wilhelmine Ger-many, which fundamentally altered the balance of power in Europe by the end of the 19th century. British Foreign Minister Lord Curzon described China in the early 20th century as a “great, helpless, hope-less and inert mass”, which is not a colony of one country – a slave, as the Chinese understand it – but of all of us. Many believe that China is only taking back its previous global leadership, as until the late 1500s throughout human history China was the world’s most developed area. The country has come a long way to become the engine of global capitalism. Today, China is the world’s most dynamic economic zone, which also resulted in the prestige of the country growing rapidly. This is indicated by Beijing winning the right to organize the 2008 Olympic Games. The world is thus watching, with suspicious looks, to see which way the red giant moves.
BIBLIOGRAPHY:
Ádám, Z. (n.a.): Fejlődésértelmezések: a latin-amerikai és kelet- ázsiai fejlődés államközpontú értelmezése. (Interpretation of the devel-opment in Latin America and East Asia - a government centered approach.) http://www.econ.unideb.hu/oktatas_es_kutatas/compe-titio/download/comp_konyvek_501_adam_zoltan.pdf
Alden, Chris (2010): Kína az afrikai kontinensen. Publikon Kiadó, 2010.
Árva, L. (1990): Előzésben, a gyorsan iparosodó dél-kelet-ázsiai országok sikereinek és ritka kudarcainak okai. (Overtaking – the reasons for success and failure in rapidly industrialising countries.) Közgazdasági és Jogi Könyvkiadó, Budapest. Árva, L.– Katona, K. – Ivicz, M. – Schlett, A. (2003): Globalizáció és külföldi működőtőke-beruházások. Budapest, Szent István Társulat.
Árva, L. – Schlett, A. (2011): Kína: Jobb a másolat, mint azeredeti (A copy better than the original). In: Magyar Nemzet, 2011. június 11.
ARTNER ANNAMÁRIA: a kínai működőtőke-kivitel és Kelet-Euró-pa. Közgazdasági Szemle, LVI. évf. 2009. november (1041–1056. o.)
Balázs, P. (1998): Magyarország és az Európai Unió. In: Kende Tamás (szerk.): Európai közjog és politika. Budapest, Osiris.
Bassa, Z. (n.a.): Kína innovációspolitikája. (Innovation Policy in Chi-na.) VKI. Hírfutár. No. 7 http://www.vki.hu/hf/HF
236
Bekker, Zs. (1995): Rendszerválság. Budapest, Aula Kiadó Kft.Bernstein, E. (1996): SelectedWritings of Eduard Bernstein, 1900-1921,
Prometheus Books.Botos, K.–Patai, M. – Szalkai, I. (1980): Pénzügyek és nemzetközi gaz-
dasági kapcsolataink. Budapest, Közgazdasági és Jogi Könyvkiadó, Bozzai, R. – Farkas, Z. (1990): Hitelválság. Adósságaink története. Bu-
dapest, Morál-Codex Castells, M. (1998). End of Millennium, The Information Age: Econ-
omy, Society and Culture Vol. III. Cambridge, MA; Oxford, UK: Blackwell.
Csath, M. (2008): Globalizációs végjáték című könyvében. Budapest, Kairosz Kiadó, 2008.
Csillik P. – Tarján T. (2002):Maddison Countries. Growth Paths in a Kornai world. International Atlantic Economic Review, No. 4.
Fehér, I. (2008): Applying Historical Precedent to New Conventional Wisdom on Public Sector Roles in Agriculture and Rural Develop-ment. Ups And Downs of The Hungarian „Agricultural Model”; FAO, Country Case Study.
Gaulier, G.Lemoin, F. Ünal, D. (2011): China’s Foreign Trade inthePer-spective of a More BalancedEconomicGrowth. WIR (world Invest-mentReport). UNCTAD. UN. 1991–2010. CEPII.
George, S. (1999): a luganói tanulmány. Hogyan őrizzük meg a kapital-izmust a XXI. században (The Lugano Reporton Preserving Capi-talism in the Twenty-first Century.) London, Pluto Press.
Katona, K. (2010): a külföldi tőkebefektetések okainak változása Kelet-Közép-Európában. Pénzügyi Szemle. 3. sz.
Katona, K. (2007): Vonzások és választások a tőkepiacon. a külföldi működőtőke-befektetések elmélete és szerepe a magyar gazdasági átalakulásban. (Choices and options on the capital market. The role of foreign working capital int he Hungarian transition.) Budapest, Gondolat Kiadó.
Katona, K. (2010): a külföldi tőkebefektetések okainak változása Kelet-Közép-Európában. (Changes in the reasons for foreign investment in Central Eastern Europe.) PénzügyiSzemle. 2010. 3. sz. 656-673.
Kornai, J. – Maskin, E. – Gerard, R. (2004): a puha költségvetési korlát II. Közgazdasági Szemle, No. 9.
Lester, W. C. (1946): Secrets By The Thousands.Harper’s Magazine. Oct. 1946.

237
Lisányi Endréné Beke, J. (2010): Magyarország és Dánia mezőgazdasági fejlődésének tanulságai. (The lessons of the agricultural develop-ment process in Denmark and Hungary.) In: a falu. Agroinformki-adó, 2010 Spring, XXV. évf. 1. szám, p. 49-60.
Manuel Castells studies the economic startegies of emerging and leg-ging countries in the second half of the 20th century. Lásd: Castells, Manuel: The Information Age: Economy, Society and Culture. Bu-dapest, Gondolat, 2005.
Mises, L. (1920/1990): Economic Calculation in the Socialist Com-monwealth. The Ludwig fon Mises Institute, Auburn, Ala.
Needham, J. (1995): Science et Civilisation en Chine. Une Introduc-tion. Editeur: Philippe Picquier;
Polonyi, P. (2008): Kína rövid története. Budapest, Corvina.Salát, G.(2011): Kulturális forradalom. (Cultural Revolution.) In: He-
tiVálasz, 2011. 03.16.Schlett, A. (2007): Sziget a szárazföldön.(The island on dry land.) Bu-
dapest, Szent István Társulat.Schlett, A. (2010): Harmadikút – avagy a neoliberalismus álruhája. In:
Polgári Szemle, 2010/1. sz.Shenkar, O. (2006): The Chinese Century: The Rising Chinese Econo-
my and ItsImpactonthe Global Economy, the Balance of Power, and Your Job. Wharton School Publishing, 2006.
Tarrósy István (2010): Fenntarható Afrika, Publikon Kiadó.Vági, F. (1986): Vállalatiság és gazdaságirányítás. Gazdálkodás, No. 4.Walker, C. L. (1946): SecretsBy The Thousands. Harper’s Magazine.
Oct. 1946.Weisbrot, M. Ray, R (2011): The Scorecard on Development, 1960-2010:
Closing the Gap? CEPR. 2011. AprilWong, J. (1979): Asean Economics in Perspectives. The MacMillan
Press. Hong Kong. 1979.

238
4. THIRD WAVES OF GLOBALIZATION IN THE FAR EAST
.. Background and motivation
The developing countries of the Far East have a common feature, namely that their economic strategies focus on growth based on capi-tal accumulation and industrialization. The Asia-Pacific region is very heterogeneous both culturally and in terms of development, and the emergence strategies of these countries show some important differ-ences. Northern countries (South Korea, Taiwan, Hong Kong) started to introduce industrialization, modernization policies prior to other South-East Asian countries. In their case, the dominance of Confu-cian ethics is a strong cultural base for the design of an effective state bureaucracy. The South East Asian countries in the 1960’s-70’s suffered from many ethnic and religious conflicts, and social cohesion is still weak today. Due to these problems, the strategies for a developing state and an export-oriented economy were started somewhat later, only in the 1970s. The existence of significant natural resources also meant a strong deterrent in this regard. (Zoltán Bassa, 2011)
In this analysis, we present a Northern and a Southern country, highlighting the specifics and the effects of their development policies.
The Republic of Korea is an outstanding “tiger economy”, by the size of its economy and the spectacular progress achieved in the last quar-ter of a century, forming what today is known as the “Korean miracle”.
Because of its almost unparalleled economic growth, South Korea to-day is one of the leading players in the global marketplace and one of the wealthiest countries in the world. The Republic of South Korea is one of the economic success stories of the first wave of newly industri-alized countries. Barely a few decades ago, the country’s economy was essentially at the level of a third world country. In 1948, at the time the Republic was established, it was one of the poorest countries in the world. In 2010, the per capita GDP was $29.791, and according to data from the Bank of Korea, the pace of economic growth was 6.1 per cent (ITD Hungary, 2011).
In 1970, the per capita GDP was $2.500, calculated according to the current value of the US dollar. By 1995, it had reached $12.600, an in-

239
crease of 500 per cent. It took the United States almost a century, from 1857 to 1954, to attain comparably dramatic growth. Japan was able to achieve similar results in just over two decades, from 1952 to 1973. The key to the transformation of the South Korean economy was an ambitious strategy of economic development that focused on the use of exports as the engine of growth.
In the middle of the 20th century, the future did not seem to hold much promise for South Korea. At the end of World War II, the Ko-rean peninsula was politically divided at the 38th parallel. The occupy-ing Japanese forces were replaced by Soviet soldiers in the North and American troops in the South. In the South, with the active support of the American military, Li Sin Man came to power, the leader of the Ko-rean right wing and a radical nationalist and anti- communist. In the North, the communist government of Kim Ir Sen enjoyed the support of the Soviets. Since each regime considered itself as the sole heir to the national past, demands were soon made for unification of the penin-sula into a single country. The government of Kim Ir Sen resolved to bring the entire peninsula under its control. When it was unable to do so using political means, preparations were made for war.
At the time, both countries were among the poorest states in the world, and the war launched by the North in the summer of 1950 only worsened conditions. When the devastating hostilities ended three years later, the frontlines remained exactly where they had been at the outset of the conflict. Nevertheless, while the war may have done noth-ing to change the borders, it made the political and economic circum-stances all the more precarious.
At that time, no one would have thought that in a few decades, South Korea would perform a veritable economic miracle, showing record growth, while its Northern neighbour would find itself confronted with a crushing economic crisis and increasingly dire poverty. This was all the more striking given that during the period of Japanese occupa-tion the majority of industrial, metallurgic, and electrical factories had been established in the Northern part of the peninsula. Thus, for in-stance, a significant chemical industrial centre had been built near the city of Hamhung with the cooperation of the German conglomerate I. G. Farben, and the Suphun hydroelectric plant was constructed along the River Amnok. The hydroelectric plants in the North had provided electricity for the cities in the South for decades.

240
In the wake of the devastating war, the recovery began much more slowly in the South than in the North. Li Sin Man, who was extremely unpopular, was unable to prevail in the economic crisis. Year in, year out, South Korea was dependent on imported foodstuffs, and it was only thanks to American assistance that the government was able to ensure sustenance for the population. The country was in a state of economic chaos, and the failure to implement radical land reform led to an agricultural crisis.
In contrast, by the end of the 1950s North Korea was able, with the help of the communist bloc (including Hungary, and of course mainly the USSR) in the form of financial aid and loans made on favourable terms, to rebuild the country and ensure a more or less stable standard of living for the population. Given the relative growth of the North, it is hardly surprising that in the course of an uprising against Li Sin Man and his government (both of which had lost all credibility) in the spring of 1960 and during the student protests that followed, slogans and rallying cries expressing sympathies with the North were heard with increasing frequency.
The growth of South Korea’s GDP over the past century
Source: http://en.wikipedia.org/wiki/

241
The industrialization of South Korea began with the export-oriented development of certain branches of light industry, which demand considerable labour. This was followed by the creation of branches of heavy industry. In the 1950s and 1960s this served to meet the de-mands of the domestic market. The focus was on the production of textiles, leather and shoes, sports and recreation equipment, machines used in the chemical industry, and the necessary primary materials for these industries. With the rapid growth in production, however, emphasis soon shifted to exports to other countries in the region. The most important elements of the South Korean system of enterprise, the so-called Chaebols (roughly equivalent to the concept of a business conglomerate) developed quickly. Several of the companies known to-day throughout the world began as small undertakings that enjoyed generous state subsidies and created separate industrial plants to pro-duce the necessary machinery and basic materials.
Like the old Japanese conglomerates (so-called Zaibatsus), the Chaebols were diversified, with the understanding that the Chaebols did not have their own banks, as back then banks were not allowed to be held in private hands. Like the Japanese, the South Korean enter-prises strove to create their own brand names. The high quality and competitive prices of their goods soon made their influence felt.
Compared to other companies, the Chaebols managed to reduce their risks in the fields of finances, market stability and rapid struc-tural changes, by means of diversification of markets and products, and by horizontal and vertical integration. Due to vertical integration, the dependence on monopolistic suppliers could be reduced, and the continuous supply of raw materials was ensured.
Horizontal integration, on the other hand, facilitates the flow of information and reduces uncertainties in investment and production issues as well. The international competitiveness of South Korea is largely based on the policy encouraging companies to focus on exports and technological development. The companies from this country join the global networks primarily not through FDI, but rather through imports of machines and components, inter-company agreements and licenses. Moreover, some larger groups have themselves become mul-tinational companies. The development of higher education in natural and computer sciences gained a central role for the creation of a do-mestic knowledge base to support exports.

242
Samsung, LG, KIA, and Hyundai enjoy the same broad recognition and popularity among consumers worldwide as Japanese, American, and Western European products. In addition, the most modern tech-niques are used in South Korea for the production of basic materials (one thinks of metallurgy.) At the time of the steel crisis of the 1970s, the largest steel plant in the country was built in Pohang, the Pohang Iron and Steel Company (POSCO), which produced materials of the high-est quality. Due to its partnership with the Japanese company Nippon Steel, POSCO became the foremost steel manufacturer in the world.
At the beginning of the 1970s, South Korea responded to the changes that were taking place across the world by modifying its economic strategy. The fluctuations in currency rates that came in the wake of the collapse of the Bretton Woods financial system had a negative ef-fect on account balances in South Korea too. Because of the oil crisis in 1973, inflation rose the world over, economies stagnated, and protec-tionist policies were established everywhere. South Korea responded to the various challenges by shifting its economy towards exports, thereby attempting to address increasingly dire imbalances in foreign trade. Changes were made in the export structure to favour high val-ue-added goods. The state strove to nurture various trade partnerships and increase agricultural exports. In the course of the transformation of the economy, the emphasis shifted from branches of industry that demanded a large labour force to branches of industry that required significant capital. The primary role was given to chemical and heavy industry. The large investments in the new branches of industry (in-cluding the construction of ships, the iron and steel industries, auto-mobile manufacturing, production of machinery, and the petrochemi-cal industry) were made largely through implementing financial and tax incentives. The government supported developments in heavy industry and the chemical industry with low interest rate loans. The efforts paid off. In the space of nine years chemical and heavy indus-try products came to play a considerably more prominent role in the export market, growing from 13 per cent of exports overall to 39 per cent. The emergence of the new branches of industry in South Korea created a greater need for skilled labour as well, which contributed to an increase in wages. In the meantime, light industry in South Ko-rea gradually lost its competitive edge, putting those who had invested capital and labour in light industry in a difficult position.

243
Thanks to the calculated adaptation of its flexible economy, South Korea was able to maintain the pace of economic growth it had attained in the 1960s. Average yearly growth in the period between 1970 and 1979 hov-ered around 9%, and between 1976 and 1978 it even reached 11.2%. Ex-ports grew annually by 40% on average, and by 1979 had reached 15 bil-lion dollars in total value. The per capita GDP grew from 249 USD in 1970 to 1.636 USD in 1979. But the transformation had negative consequences as well. Growth in capital led to lasting high inflation, which went as high as 18%. Strong state intervention distorted prices and created competitive imbalances. Wages grew more rapidly than labour productivity, and this had a negative effect on competitiveness. These tendencies compelled the government to devise a strategy for economic development that allowed for continued growth but also created some measure of stability.
At the beginning of the 1980s, because of the global oil crisis and the domestic political crisis caused by the assassination of president Park Chung-Hee, the South Korean economy again found itself confronted with significant challenges. For the first time since the launch of the vari-ous five-year programs, economic growth came to a halt, and soon indi-cators began to show negative values. Inflation shot up to 28 per cent, and the current account balance also indicated a dire trend. Any enterprise that had additional capacity had to accept tasks allotted by the govern-ment, and numerous mergers took place. The Chaebols bought up many smaller enterprises that found themselves unable to cope with the new circumstances, thereby acquiring a larger share of economic power. In the 1970s and 1980s these conglomerates, which were essentially based on family enterprises, acquired a leading role in the South Korean economy.
Commercial banks were privatized at the beginning of the 1980s, and by 1982, there was almost no difference whatsoever between the inter-est rates of state banks and private banks. The strict monetary and fiscal policy, the fall in the price of oil, and low international interest rates helped stabilize the South Korean economy. Restrictions on the inflow of foreign investment capital were relaxed. Inflation again be-came single-digit and the average yearly growth of the GNP hovered around 10% in the 1980s. Since 1986, the trade balance has been posi-tive and savings accounts among citizens have gradually risen reach-ing 37.6% of the GDP in 1989.

244
At the beginning of the 1990s, Korean enterprises had to address new challenges. New competitors had emerged in the domestic and international marketplace in the form of the enterprises of a second wave of newly industrialising countries. Furthermore, the World Trade Organisation exerted influence on the country by pressur-ing it to open its economy, in particular the agricultural sector and financial services sector, which until then had been strongly protect-ed. Korea strove to become an integral part of the global economy, liberalising its international financial transactions, actively taking part in the World Trade Organisation Uruguay Round [extended ne-gotiations regarding international trade in which 123 countries took part], and becoming a member of the Asia-Pacific Economic Coopera-tion (APEC). In 1996, South Korea became part of the OECD as well. The stabilisation of political relations with China in 1992 constituted a significant breakthrough, and the two countries resumed diplomatic ties. This gave new momentum to the already existing economic co-operation between the two countries, and gave South Korea greater prestige in the international arena. Today China is South Korea’s most important trade partner. In 2004, the Chinese share of Korea’s exports was 19.6%, while imports from China were only 13.2%.
Growth in Korea’s trade volume
Source: Korea International Trade Association, http://www.kita.org/
245
The figure below illustrates the growth in Korea’s trade volume from the 1950s to the present day.
Deliberate promotion of the sciences and scholarships played an in-dispensable role in economic development, first and foremost with the transformation of the institutional system for research and develop-ment. Ever since the period of industrialization, South Korea placed considerable emphasis on the reform of the educational system and scientific institutions. In order to achieve this, it was necessary both to transform the system of funding for the existing institutions and scientific institutions and to form modern institutions (for example ministries and universities). The institutions created their own plans for growth and development, in which the development of research infrastructure was given the primary role, and they themselves were responsible for monitoring the implementation of these plans. New research institutions came into being alongside the existing scholarly and scientific research programs. The Korea Institute of Science and Technology, a state institution, directed several research institutions, each of which had its own specialty and focused on the technologi-cal development of a different branch of industry. These included ship construction, electronics, telecommunications, engineering, chemical industry etc. In addition, while various plans were being implemented, the government always kept a watchful eye on the results.
Education was given a prominent role in the process of growth, as were research and development and the expansion and improvement of the related institutional systems. The creation of a layer of skilled workers was an indispensable precondition of success in the leading industries that helped sustain the economy. In the initial stages, the developmental states focused on the creation of the necessary human resources component of technology, while later, having crossed this threshold, they placed greater emphasis on research.
As in the case of Japan, in South Korea with every passing year in-creasingly large sums were spent on the purchase of licences, but pro-portionally these sums were decreasing in comparison with the bil-lions of dollars invested in innovation. The economic strategy adopted by the country thus could be characterized as a transition from growth led by investment to growth led by innovation. Venture capital played a significant role in the funding for research.

246
The American practice of supporting cooperation between industry and research universities was broadly adopted in order to facilitate the social and practical application of the sciences. Universities cre-ated private enterprises, and were thereby able to turn the results of research to practical use. The transition to a strategy driven by inno-vation took form in the growth of government sources for research and development. Furthermore, larger sums were devoted to the de-velopment of technological infrastructures, investment in necessary equipment for universities and laboratories, and the educational insti-tutional infrastructure.
Malaysia is an example for the second wave of newly industrialized countries, along with Thailand, Indonesia, and the Philippines. Devel-opment of these countries began in the early 1980s; they have followed the development path of the Asian tigers, with a two-decade-long de-lay. Their size, their population are much larger and their natural re-sources are more abundant.
In the mid-1960s, when Malaysia became independent and set off down the road towards economic development, it was beset with polit-ical tensions, which were due primarily to the fact that, like Hungary, Malaysia is located at a geographical crossroads where numerous reli-gions, ethnicities, and ideologies have met and at times collided over the past several centuries. Moreover, as in the case of Hungary, these tensions created considerable obstacles that the state had to address in the first years of its newly won independence.
The Malaysian peninsula and the Western islands of the Indonesian archipelago have traditionally functioned as a natural stopping point for Indian merchants travelling East and Chinese merchants travel-ling West, where they were able to harbour their boats and wait for the monsoon winds to shift. The Malaysian peninsula stretches from North to South, and anyone seeking to sail from India to China or from China to India must travel its length, a voyage made difficult by the fact that the monsoon winds blow from North to South in the winter and South to North in the summer. The first inhabitants of the peninsula were the so-called proto-Malays, peoples related to the Aus-tralian aborigines. Since the third century AD, various other peoples have arrived from the North, and together with the proto-Malays they now constitute the Malay people. Chinese and Indian merchants and
247
seafarers settled in the peninsula alongside the proto-Malays before the third century, creating an ethnic and religious diversity that is still very much part of the country’s culture today. From the perspective of religion, Hinduism and Buddhism were the first to spread, and in the 15th century, Indian merchants began to bring Islam to the peninsula, an influence that spread to the islands of Indonesia as well.
Also beginning in the 15th century European powers gradually brought the Malaysian peninsula and the Indonesian archipelago into their spheres of influence. In the 19th century the territory, we know today as Malaysia came under British control and took a path of dra-matic economic development. The British launched ambitious pro-jects involving the construction of railways and pewter mines, which brought throngs of Chinese labourers to the previously sparsely inhab-ited peninsula. During the period of British rule, many Indians also arrived in Malaysia, working in part in the British civil service and in part as merchants and entrepreneurs. The Indians were primarily Hindus, though there were also Muslims among them. The Chinese immigrants to the peninsula preserved their religious practices, and remained quite separate in this regard from the other inhabitants of the country. Some of the Chinese workers soon found a place in the world of trade and commerce and, along with the Indians, gradually began to dominate economic life (Khoi, 1971).
In World War II the British suffered a quick and humiliating de-feat at the hands of the Japanese in Malaysia, and were only able to reassert their rule on the peninsula following Japanese defeats in the Pacific sphere of war. World War II had two important consequences for Malaysia. First, the British, and thereby the West in general, suf-fered a significant loss of prestige, and second, the Chinese minority ignited a Maoist uprising, using weapons that had either come into the hands of guerrillas during the war or been left behind by Japanese forces. The British were able to suppress the uprising, but only with considerable effort before the country obtained its independence, and the ethnic and political tensions posed a continuous threat to stability and the consolidated order.
The history of Malaysia’s independence is long and complex, not simply because of the role played by the Maoist uprising, but also be-cause of the fact that it was never entirely clear which territories would become part of the country. In 1963 Singapore joined the state forma-

248
tion, which at the time was referred to as the Federation of Malaya, as did three Sultanates from the island of Borneo, but Singapore, which is inhabited primarily by Chinese, quickly separated from the Federa-tion in 1965.
Thus, following independence, Malaysia had to address numerous challenges arising from its ethnic, religious and political diversity:
– The country was relatively small, with a population of barely 10 million. Furthermore, the population lived in two territories separated by the sea; the more densely populated Southern stretch of the Ma-laysian peninsula on the one hand and the more sparsely populated Northern part of the island of Borneo on the other, which is covered with jungle and virgin forests.
– The economy of the country was underdeveloped, dominat-ed primarily by caoutchouc and pewter production.
– 60% of the country’s population was either Malay or belonged to one of the native tribes, while 30% was Chinese and 10% was Indian.
– The Malay communities were the least developed economically, while the Chinese and to a lesser extent Indian populations controlled industry and trade. Furthermore, in the wake of the uprisings led by the Chinese, which had lasted over a decade, ethnic tensions were fierce.
– From the perspective of foreign policy, Malaysia constituted a stark contrast with the countries immediately surrounding it, not to mention China.
– Singapore, with a 95% Chinese population, was not willing to accept Malaysian rule and after two years declared its independence from Malaysia. Relations between the two countries continued to be rife with tension.
Given these economic, ethnic, and political circumstances, it was perhaps hardly surprising that in the early 1960s very few people thought Malaysia had a bright future. The situation was exacerbated by the fact that the pewter mines and caoutchouc plantations, which were in the hands of the British, were seized by the government, and their owners quickly fled the country, taking their expertise with them.
Thus following independence Malaysia found itself in circumstanc-es that were less than enviable, to put it mildly. Nonetheless, Malaysia has been able to maintain political stability and peace, and the coun-try’s economic growth has become something of an example to be fol-

249
lowed, a success illustrated clearly by the fact that between 1980 and 2010 the difference in per capita income between Malaysia and the de-veloped world has dropped.
Regarding economic development, since independence the Malay-sian governments have had two constant and fundamental priorities. They sought to strengthen the role of the Malay majority in the eco-nomic life of the country and to implement economic policies that would help Malaysia join the countries of the developed world.
The government used numerous tools to nurture economic growth among the Malay communities of the country, from investments in education to financial support for Malay entrepreneurs. It even went so far as to require Malays to be included in management and lead-ing positions in businesses. The “DasarEkonomiBaru”, or New Eco-nomic Policy was adopted immediately following independence, and while in principle it reached its end in 1990 some elements remain in effect to this day. This policy is credited with having brought about a tremendous shift in the economic prosperity of the Malay. In 1970, the Malays controlled only some 2.4% of the country’s capital, but by 2004, this figure had risen to 18.7%. The dominance of the Chinese in the economic life of the country has declined, but according to some estimates, 70% of the country’s capital is in the hands of this minority, which constitutes less than one third of the population.
Malaysia’s real triumph lies in the successes it has achieved in the growth of its national economy. By implementing carefully deliberated economic policies centred on state planning and control, the govern-ment has managed to make Malaysia the 29th wealthiest country in the world in absolute terms and the 41st from the perspective of per capita wealth. Malaysia’s economic growth has been particularly rapid over the past decades. Its average yearly per capita GDP growth between 1957 and 2005 was 6.5%. The country has become one of the leading producers of semiconductors and devices related to communications and informatics, and Kuala Lumpur is today one of the financial cen-tres of the region. Economic growth was undoubtedly furthered by the fact that the country has significant natural resources, from pewter to oil, but one should note that, unlike many other oil producing coun-tries, Malaysia does not squander the profits from the sale of its natural resources on luxuries, but rather invests them back into economic de-velopment as part of a deliberate government policy.

250
In the first decades of this period of economic growth, the govern-ment pursued industrialisation to replace imports, protecting domes-tic industry with high customs duties and giving financial support to local enterprises. Following the successes of these decades, in the 1970s government leaders sought to reorient the economy around emerging sectors, so the country opened itself to foreign investment. This move was cautious, however, and initially foreign buyers were only allowed to purchase assets owned by members of the minorities. The govern-ment also strove to ensure that Malays would play an increasingly large role in economic life.
The Malaysian state played a significant role in promoting economic development by ensuring partial state ownership as well. Alongside banks that were owned by the state (such as Bank Negara), at the end of the 1960s the Malaysian Industrial Development Authority was cre-ated, which functioned as a state owned joint venture company. In the 1970s Petronas, the Malaysian oil and gas company was also created as a business, wherein the largest shareholder was the state, and to this day, the state retains this status. In the meantime, Petronas has be-come one of the seven largest oil companies in the world, and because of the substantial amount of foreign investment it enjoys; it is often mentioned as the Malaysian multinational. Similarly, the PROTON automobile manufacturer was also founded by the state in the 1980s. Due to the efforts of the government to protect local enterprises, PRO-TON commands about 60% of the domestic market. The company has not only preserved its independence from foreign businesses, but also in 1990 even acquired the English Lotus production and development unit and the Italian MV Augusta motorcycle manufacturer, as well as the Swedish Husquarna and the Italian Cagiva brands, both of which had been owned by MV Augusta. Following PROTON’s successes, the domestic transportation sector also grew significantly, which made it possible to found the second privately owned Malaysian automo-bile manufacturer, Perodu Cot. The company was created using local private capital and capital owned by the Japanese minority. Over the course of the past several years, state intervention in the Malaysian economy has slowly diminished, and foreign investors can invest in the country with a greater degree of freedom, though in the case of strategic enterprises the government continues to guard jealously its status as majority shareholder.
251
Malaysia overcame the 1997 crisis on its own, without the help of the IMF, actually proving that there are other possible answers to eco-nomic problems beyond those of the IMF and mainstream economics. The government was set to sustain the value of the national currency, the ringitt, and in 1998, they fixed the exchange rate relative to the dollar. At the same time government controls of the domestic capital and foreign exchange markets were introduced, capital patriation was allowed again only after one year.
Contrary to expectations, this did not lead to a loss of confidence and even the investors’ interest has not waned, but in 1999 it already started to show an increasing trend. Parallel with the independent eco-nomic aspirations of politics, the leadership of the country gradually opened its economy to the key actors of the world market, and inte-grated into the global world order. (Artner et al, 2002)
.. Scope and structure of the third wave of globalization
Developing countries are usually characterized by importing of for-eign direct investment for a long period, and they start to export cap-ital only later and to a lesser extent, short of capital imports. South Korea has been an exception in this respect. Although from the 1990s onwards, South Korean capital imports slightly increased, the coun-try’s FDI exports exceeded by far the value of imports. South Korea’s economic development rather relied on international borrowing.
Although the Korean government began to liberalize the rules on for-eign investments from the 1980s, the authorization of foreign invest-ment has still been subject to a long and bureaucratic process. Foreign investments were adversely affected by the relatively high wages and land prices, and the protectionist measures of the government. The ma-jority of investments were realized by the establishment of joint ven-tures, which were fifty percent foreign owned and fifty percent Korean. Since the government has provided considerable support to the coun-try’s leading corporate empires, the Chaebols, therefore the competi-tiveness of foreign companies in Korea was in doubt. Therefore, foreign enterprises preferred license agreements instead of direct investments.

252
From the 1990s, South Korean capital exports increased rapidly, which meant the expansion of the Chaebols. South Korean mammoth companies invested primarily in Southeast Asia, the Middle East, North America and the EU Member States. The investments mainly targeted the manufacturing sector, particularly machines, televisions, computer parts, home appliances and motor manufacturing.
Due to the crisis of the late 1990s, not only imports but also invest-ment policy was liberalized, which resulted in an increase in foreign investments. Foreign companies were allowed to invest in new areas, and the registration of 100% foreign-owned companies was author-ized. Liberalization of the Korean equity and corporate bond market also took place, and licensing foreign investments was rendered easier. In addition, industrial parks were established for foreign investors, and in some areas, such as electronics and information technology, favour-able tax conditions were also granted.
Since 1970, investments of foreign capital have played an ever-larger role in the Malaysian economy, but this has not been abrupt. Rather, the country’s economy was opened gradually to foreign investors. For some time the government set “performance requirements” for foreign investors, specifying the size of the labour force they would have to employ and the percentage of their production they would be allowed to export, and even obliging them to use local suppliers and subcon-tractors (Wade, 1991).
Foreign, mostly Japanese and American capital investment played an important role in Malaysia’s economic development from the eight-ies onwards. The Malaysian economy recieved a total of $ 39.1 billion foreign direct investment between 1980 and the 1997 crisis. Yet – like in other South East Asian countries – instead of foreign direct invest-ments, speculative portfolio investments dominated capital inflow in the form of bonds and shares purchases, which played a decisive role in bringing down the nation’s economy into a crisis in the 1990s. (Mody, A.: Industrial Policy after the East Asian crisis: from „outward orienta-tion” to New Internet Capabilities. The World Bank. Policy Research Working Paper, No. 2112, 1999, p. 28)
Foreign investments were directed primarily towards exports in Malaysia to defend the domestic economy; this is significant simply because the high protective tariffs played an important role in the pro-tection of domestic industry until the end of the 1980s, and the system

253
was only dismantled gradually. If foreign investors had been allowed to bring their businesses to Malaysia without any restrictions or checks, the protective tariffs would have become ineffective and the multina-tionals would have easily been able to squeeze local competitors out of the domestic marketplace. For this reason, temporary regulations were introduced that linked the authorised proportion of foreign in-vestment to the percentage of production made for export. The higher the percentage of production for export had been, the higher the per-mitted proportion of foreign ownership would be. In Malaysia one of the important tools in this structuring of foreign investment towards export was the so-called “manufacturing industry export zones” sys-tem, within which the foreign businesses functioned in what was in practice a customs free zone, thereby not posing a threat to the local markets while creating jobs and bringing technology and expertise into the country. The purpose of this system was to protect domestic businesses of the local market from competition and price wars with foreign companies.
A long-term industrial development plan was set up in 1984, which involved the private sector with a much larger role in the development of the manufacturing industry. In the period between 1986 and 1995, the economic policy measures for a more effective and more competi-tive manufacturing industry operation were defined. In doing so, pref-erence was given to the sectors using domestic raw materials, like the processing industries and the electronics industry, instead of the heavy industry. State intervention was reduced, foreign investment was en-couraged, which was to be diverted into exporting sectors. To that end, industrial and commercial free zones were established, where foreign investors enjoyed duty-free positions, and they received tax benefits for export activities. The Industrial Coordination Act of 1985 made it possible for companies in Malaysia to be in proportionally larger foreign ownership. a new investment law was also adopted in 1985, and it has greatly facilitated the Court registration of companies, and reduced the administrative requirements for authorisation of foreign ownership. In order to facilitate the privatization of state-owned enter-prises and banks, a general privatization plan was developed in 1987. Parallel to this, the progressive liberalization of trade and the foreign exchange system continued, which was mainly aimed at stimulating exports. (Simon, 2001, 47)

254
Malaysia was a popular destination for its relatively low wages, sound macro-economic indicators, export successes, more and more favorable regulatory framework for foreign investors and its political stability. It later proved to be important, since several TNCs settled at this time, some of which later, in the second half of the 1990s rein-vested a part of their profits, somewhat compensating for the waning new investments.
Foreign direct investments in Malaysia was intended to increase ex-ports. The tools of this policy were the creation of a favourable environ-ment for investment, export supporting policies and infrastructure, and trainable workforce. These strategic elements were emphasised not to attract FDI specifically, but more generally to increase exports and modernisation in general. Directing foreign companies toward tech-nology and knowledge intensity was entrusted to market forces previ-ously. Thus, no great emphasis was placed on domestic training and raising the level of technology. Domestic firms have developed largely in isolation from export-oriented foreign companies. Later, in the mid-1990s Malaysia recognized that China’s low wages and large internal market could not be competed. There was a shift from cheap labour and the application of massive export-based incentives to a policy rely-ing on higher value added industries and growing local supplier ratio, in order to maintain the ability to attract capital.

255
These data show that FDI inflow has affected South Korea and Ma-laysia in different ways – reflecting their different approaches to FDI inflow. Since Malaysia started to incite FDI inflow already in the 70s and 80s, the 1997 crisis has resulted in a major drop of FDI inflow here. In South Korea however, where FDI inflow was discouraged, FDI inflow has started after the crisis of 1997, as South Korean firms were obliged to sell their parts to foreign investors – as it has happened with the Daewoo car company.
It is interesting to note that today FDI inflows in these two countries are quite similar – but the two economies are completely different, as South Korea has become one of the leading innovator in manufactur-ing industry, and Malaysia is constantly struggling to start its econom-ic development.
These differences also reflected in the development of the per capita GDP at PPP, which was quite similar until the middle of the 80s, but afterwards Malaysia has started to fall back.
Ruchir Sharma has underlined that although South Korea could re-new its economy after the crisis, in Malaysia this was less successful. (Sharma, 2012)
In Korea, the factors contributing to this success were the following:
– Nationalism – Relatively large local market

256
– Disciplined and trained local labour force.– In Malaysia, these factors were not present as clearly as in Korea. – Nationalism in Malaysia is rather weakening the coherence of the
country as there are at least three different nationalities (Malays, Chinese and Indians) in the country
– Local market is not as big as in Korea,– Moreover, the labour force is not as disciplined and trained as in
Korea, what is particularly true for the non-Chinese population.
.. Effects of the third wave of globalisation
The rise of the countries of the Far East offers an unambiguous sign that the structure and development of the new global economy are forming according to a new set of rules. These countries have clearly learned more quickly those rules and they have been more able to adapt than Western countries, which had become industrialized earlier, not to mention the countries of Eastern Europe. The comparatively rapid de-velopment of these countries has questioned the conventional assump-tions of neo-classical economics regarding theories of growth. The de-velopmental state played an active and decisive role in this success, in the emergence of these countries as globally competitive economies.
In the period from 1961 to 1998 in the Malaysian economy as a whole, the increase of productivity performance was two-thirds of South Ko-rea’s achievement. This indicator in the manufacturing sector only made up a quarter of the South Korean value. However, compared to South Korea, the number of employees were rising by 1.2 times faster, while in the manufacturing sector this factor was 1.4. The employment rate in terms of the total population increased from 32.6 percent to 40.2 percent between 1960 and 1998. During this period, the share of agriculture in this number of employed persons dropped from 65 per-cent to 18.8 percent, but in the manufacturing industry, it increased from 3.8 percent to 22.2 percent. The share of agriculture in GDP de-creased from 34.3% to 12.3%, while the share of the processing indus-try grew from 27.3% to 8.6%. (Simon, 2001)
The two countries’ modernisation strategy aimed at rapid economic growth and catching up with developed countries in the world. To this

257
end, a financial system was established to be able to mobilize domestic savings to ensure high investment rates. The active economic policy of the government put the main emphasis on export orientation, which in Malaysia was based on attracting FDI and through this, on encourag-ing technology transfer. Unlike South Korea, Malaysia did not create a major independent research and development base, and the state had a decisive role in the increase in skilled labour. (György Simon Jr., Új tigrisek”: Malajzia és Thaiföld [„New Tigers” Malaysia and Thailand.] in: Külgazdaság [Foreign trade], XLV. Vol., 2001. May.)The main drawback of investment attraction based on low wages and benefits is usually that these function as industrial transplants and re-sult little knowledge and technology flowing into the host economy. Malaysia, however in this case also serves as a positive example, be-cause some firms in the export development zones were able to deepen their local connections. Large multinational electronics companies ap-plied Malaysian suppliers.
Malaysia put an emphasis on the participation of domestic private and public companies in the repositories of foreign investors, whereas they secured the acquisition of know-how by domestic workers. In addition, technology transfer was further aided by licensing and patent agree-ments. (András Laczko: Délkelet-ázsiai reformkísérletek [Reform ef-forts in Southeast Asia]. No. 4. 5-8. P., 1997)
Another crucial point is that there are hardly any examples for the shift from the low value-added labor-intensive assembly to high-er value-added activities. Export-oriented multinational companies deployed simple, labour-intensive assembly activities in Malaysia as a first step, taking advantage of the cheap, disciplined, English-speak-ing, but only low-skilled workers, the adequate infrastructure and the significant discounts. The places of production were isolated in ex-port development zones. As wages began to rise, and technology has changed, the government has put pressure on foreign companies in order to increase the domestic added value, and as a result they have invested significantly in their staff training. The government also be-gan to develope an increased number of university vocational training what also manifested in the rising number of students sent abroad. However, Malaysia has had much less technicians and engineers, than South Korea has.

258
The export promotion policy of Malaysia in itself represented a ma-jor attraction for foreign direct investments. For long, merely cheap local labour, export opportunities, the (economic) political stability had been enough to attract FDI. Neither wage increases, nor the need to hold foreign companies, nor maintaining the ability to attract capi-tal can be imagined without a conscious strategy and suitable govern-mental policies tailored for the needs of foreign investors and those of the host country, targeting industry, product, host country and tech-nological development in the strong international competition for for-eign direct investments and exports. (Artner et alii, 2002)
A central element of the modernisation strategy both in Malaysia, and in South Korea was an active trade policy, shifting gradually from import substitution to an export encouraging economic policy. To this end, various selective government interventions were implemented. Export orientation of the manufacturing sector played a particularly prominent role. Thus economic growth is closely linked to the increase in trade openness. In Malaysia, becoming one of the world’s most open economies the extent of trade openness even exceeded the total vol-ume of GDP in 1990. At the same time, due to the rapid economic and social transformation, Malaysian foreign trade went through major structural changes. Between 1970 and 1995, the combined weight of food and agricultural commodities in exports and imports dropped to a quarter. Meanwhile, the share of manufactured goods in exports increased by 11.5 times, but in imports it grew only by 1.5 times. The biggest part of trade was related to industrialized countries, primarily with the U.S., as well as with Japan, playing a traditionally important role in the region.
The ratio of net exports to GDP (at current prices,%)
Year Malaysia South Korea
1965 79,04 24,65
1970 73,81 37,92
1975 79,08 64,39
1980 96,10 75,48
1985 86,31 67,86

259
1990 128,78 62,48
1995 161,70 61,88
Source: Simon, 2001.
Selective industrial policies were given significant emphasis in these countries, as was the defence of domestic agriculture. In the interest of promoting development, financial policy and trade policy were sub-ordinated to industrial policy. Initially, foreign currency reserves were very tight because of the closed capital account, but the branches of industry that enjoyed state support were able to obtain funds at fa-vourable terms. However, as far as the policy regarding property is concerned, the principle of private property prevailed, though in the interest of securing long term advantages the state played a proprietary role in the financial markets as well.
In hope of promoting growth, the governments emphasized the ac-cumulation of capital, since in order to make investments in the future it was necessary to set aside savings. The state gave unusual stimulus for both investments and savings. Paired with methodical policies pro-moting development, general frugality ensured remarkably high levels of investment. Revenues from exports were used as new investments. The state motivated investment was in part by offering low interest rates and in part by involving itself in the private sphere and by instill-ing confidence in the promise of a more prosperous future. Two of the guarantees of this prosperous future were the series of repeatedly em-phasized protectionist steps and the assurance that the enterprises that enjoyed state support would have access to the export market.
As in the case of other successful states of the Far East, in South Korea and later in Malaysia, strivings were made to industrialize at a pace that corresponded to the life cycles of the various products. It was essential, in the case of products with large value added, that they have comparative advantage. While at the outset of the process of in-dustrialisation, enterprises producing textiles and clothing for export had played a decisive role, later emphasis shifted to the chemical indus-try, followed by the increasing prominence of steel industry, automo-bile industry, and electronics. It is important to underscore that these countries have created their comparative advantages themselves with deliberate industrial and educational policies, not simply ny adjusting
260
their production to their own natural resources, but creating and nur-turing human resources. The governments gave a very prominent role to the development of human resources and raising the level of educa-tion. By the 1960s, educational indicators in the country had surpassed the averages in countries at a comparable stage of development. One should add that in the case of South Korea the government only began to encourage direct foreign investment in the 1970s, by which time the domestic economy based on the Chaebols rested on solid ground.
Today South Korea is the fifteenth largest economy in the world and the fourth largest economy in Asia. The country had to travel a long road in order to reach its current position of prominence, but today it is the fifth most important producer of automobiles and the foremost producer of ships and steel structures. Furthermore, it is a significant player in the market for consumer electronics and replacement parts. The rise in the country’s GDP (figure 1) clearly illustrates its dramatic economic growth.
The secret to economic success lies in the close cooperation between the state and private enterprise. Consequently, South Korea has emerged as one of the fastest growing economies over the course of the past dec-ades. In addition, in 2009, South Korea enjoyed a trade surplus of 41 billion USD. This rapid economic rise, which began in the 1960s, is re-ferred to as the “Miracle on the Han River”, and it has been compared to the rapid economic growth of West Germany following World War II, the so-called “Miracle on the Rhine”. In both countries, macro-economic stability was an important pre-condition of the development of a competitive economy. Until the 1990s, indebtedness was uncharacteristic of the developmental states of Asia, which kept inflation down and pinned their currency rates to the US dollar.
For a while, the governments did not have to confront opposition among the citizenry. Economic growth and the continuously ris-ing living standards gave the dictatorship of the narrow ruling elite a kind of authority. In Malaysia, the compromise between the Malay, Chinese, and Indian elites represents a masterpiece of shrewd politi-cal prescience that ensured the foundations of long-term economic development. The leaders of the two countries were always cautious
261
to share the benefits of economic growth with the population. This is why in Asia explicit social inequalities, like those for instance in Latin America cannot be found. While there are fourfold or even fivefold differences in incomes in South Korea, in Latin America these differ-ences reach a factor of 28. This tendency is strengthened in Asia by the characteristic practice of life-long employment, whereby the com-pany gives employment ensures balances in income. By placing the responsibility for social benefits on the private sphere, the state is able to create further sources for development. Besides all these factors, the educational strategy has also played a role in reducing social inequali-ties, as have the endevaours to draw the so-called “Bumiputera”, the Malay people, into economic life.
V. Conclusions
Globalisation – as it was seen earlier – appeared in several subsequent major waves, what have been followed by longer or shorter globalisa-tion ebbs. It happened after the Great Discoveries and after the 19th century globalisation. It is not surprising therefore, that the 20th cen-tury globalisation, that lasted for 25-30 years, turns into an ebb ques-tioning previous globalisation dynamics, even if it does not stop the process completely.
Are we now facing new globalisation ebb? In 2008, it seemed, that countries would be able to reach their previous levels after a moderate-ly grave recession, and would be able to continue to realise an increase in foreign trade and investment greatly exceeding GDP growth. This however has not happened and today it seems: „The globalisation index of KOF Swiss Economic Institute shows a clear break for economic glo-balisation in 2009: The bursting of the dot com bubble and the events of 9/11 merely slowed down the pace of globalisation; the latest eco-nomic and financial crisis has, however, created a severe setback for the globalisation process” (see KOF, 2012).
It is however not a novelty that politicians, sociologists and econo-mists expect an end to globalisation – but it is yet unclear, whether it has arrived in 2013, or this one is just another temporary stopping, like the one caused by the events in the very first years of the 21st century.
Another question can be, if globalisation is “good” or “bad”, leading only to increasing differences in incomes of various countries and the poverty of those at the bottom. The answer probably would be neither of them.
Much depends on the countries, where the processes of globalisa-tion are examined, which means globalisation is highly dependent on cultural aspects. In some places, it speeds up development, as it hap-pened in South Korea or in China at turn of the 21st century. Never-theless, even within one country, the opinions of economists vary on

263
a wide scale. For example in Hungary before the first years of the 21st century foreign investment and globalisation were treated obviously as a phenomena facilitating social and economic development, but this approach changed fundamentally after 2007-08, and many started to argue that foreign investment in Hungary resulted a distorted eco-nomic structure and low level assembly activities. Such opinion was first formulated among others by László Árva (Árva 1999), and sub-sequently the same conclusion was reached by Zoltán Pogátsa (2013).
To analyse global economic events is completely different today. a few years ago it was supposed that is impossible in the usual way, even when it was widely supposed, that:
globalisation is the peak of human development;the history of globalisation was a series of waves and ebbs, but in the
future waves are going to take over; in globalisation, every country have the same opportunities to uti-
lise foreign investments, and if not, it is only caused by the incompe-tence of its leaders.
Today however it is not that obvious. It is visible today that the 2008 crisis has been a lasting one, and it will not be followed by a fast up-turn, at least not in Europe.
Ruchir Sharma is possibly correct, when he states that the develop-ment of the countries is primarily dependent on their value system, and such characteristics are hard to change. Globalisation in Europe affected most adversely the Southern peripheral (Portugal, Greece, Spain and Italy) countries, and those states, which had an increasing budgetary deficit even before the crisis hit, like Hungary.
Contrary to this, globalisation has slowed down in Latin America earlier, and those countries started to protect themselves from the ad-verse effects of globalisation. Some countries in Asia – South Korea for example – may even benefit from the recent events, while this is not that obvious for many other countries.
In summary, it can be uphold that globalisation is a process gaining much speed at end of the 20th, early 21st century covering the econo-my, the society, the culture and the politics, and has major impacts on the interrelation of regions.
Nevertheless, it is also true that globalisation cannot be assessed only by the level of integration of a country. Globalisation or trans-national indices clearly show that there are some countries, which

264
are more integrated into the global economies, than other ones of the same size or sometimes even bigger. Korea or Japan is less integrated into globalisation than for example Germany or the United Kingdom, but it only means that the Far Eastern culture reacts differently than the European one.
Similarly, there are countries where foreign direct investment has accelerated technology transfer, while it has not happen in other coun-tries. As the future is yet unknown, we have to close this volume by drawing attention to the many possible outcomes of the economic cri-sis started in 2008, and also that today it cannot be known, whether humanity moves ahead toward a growing or a reducing globalisation.
BIBLIOGRAPHY:
Amundsen, F.: Miracle on the Han River. 2008.http://fionaamundsen.com/fiona- amundsen-miracle-on-the-han-riv-
er.phpArtner Annamária – Bassa Zoltán – Hernádi András – Mészáros Klára
– Székely-Doby András: Távol-keleti gazdaságok pozitív és negatív fejlődési tapasztalatai: tanulságok Magyarország számára. MTA Vi-lággazdasági Kutatóintézet. Műhelytanulmányok, 37. szám, 2002. február
Árva, László: Előzésben, a gyorsan iparosodó dél-kelet-ázsiai országok sikereinek és ritka kudarcainak okai [Overtaking. The causes of the successes and of the rare failures of the rapidly industrialising coun-tries of South-East Asia]. Közgazdasági és Jogi Könyvkiadó, 1990, pp. 69–137.
Árva, László (1999): Globalizáció és gazdasági növekedés: Kérdőjelek és felkiáltójelek (Publikálva: Növekedés és globalizáció, Kairosz Könyvkiadó/Növekedéskutató 1999)
Árva, László – Schlett András: Kína – Jobb a másolat, mint az eredeti [China – The copy is better than the original]. Magyar Nemzet, 11 June 2011, p. 6.
Bassa, Zoltán (2011): a fejlesztő állam és a pénzügyi szektor modern-izációja. In: Csáki György: a látható kéz. a fejlesztő állam a glo-balizációban. Bp. Napvilág Kiadó.
Berger, Suzanne: Made in Monde. Les nouvelles frontières de l’économie mondiale. Seuil, Paris, 2006.

265
Bod, Péter Ákos: a vállalkozó állam a mai tőkés gazdaságban [The En-trepreneurial State in Today’s Capitalist Economy]. Közgazdasági és Jogi Könyvkiadó, Budapest, 1987.
Botos, Katalin: Európa kettős szorításban [Europe under double pres-sure]. Pénzügyi Szemle, 2008/1, pp. 42–52.
Funston, John: “Malaysia: Developmental State Challenged”, in: Gov-ernment and Politics in Southeast Asia, 2001.
IMD world Competitiveness Yearbook, 2006, 2011.http://www.imd.org/research /publications/wcy/index.cfmITD Hungary http://orszaginfo.itdhungary.com/?p=tarsadalmi_gazdasagi_helyzet
&c=kr#gazdasagKhoi, Le Than: L’Économie de l’Asie du Sud-Est. PUF, Paris, 1971.KOF (2012): “Press release March 16th, 2012”. Korea International Trade Association http://www.kita.org/Kőrösi, István: “Hanyatló állam – torz piac? Az állam és a piac kapcso-
lata a 21. századi Europában” [Declining State – Distorted Market? The relations of the state and of the market in 21st century Europe], in: Verseny és versenyképesség [Competition and competitiveness]. Budapest, PPKE, 2008, pp. 21–34.
Laczkó András (1997): Délkelet-ázsiai reformkísérletek. Gazdaság és statisztika. 4. sz. 5-8. o. 1997
“Malaysia”. US State Department, 14 July 2010. http://www.state.gov/r/pa/ei/bgn/2777.htm. Retrieved 14 September 2010.
Mody, A. Industrial Policy after the East Asian crisis: from „outward orientation” to new internal capabilities. The World Bank. Policy Research Working Paper, No. 2112. 1999. 28.
OECD (1999): Foreign Direct Investment and Recovery in Southeast Asia. Paris.
Pogátsa, Z. (2013): Rosszabbul élünk, mint 20 éve? http://mandiner.hu/cikk/20130211_pogatsa_zoltan_rosszabbul_
elunk_mint_20_eve.Rodrik, Dani: “The ‘Paradoxes’ of the Successful State”, in: European
Economic Review, April 1997, Vol. 41, No. 3–5, pp. 411–442.Sharma, Ruchir (2012): Breakout Nations. Penguin Books. Sharma, Ruchir (2012b): Broken BRICs. Why the Rest Stopped Rising?
Foreign Affairs, 2012. DecemberSimon, György (2001): „Új tigrisek”: Malajzia és Thaiföld. Külgaz-
daság, XLV. Évf. 2001. május.

266
Smith, Stephen C.: Case Studies in Economic Development. Washing-ton State University Press, 2003.
Temporal, Paul: Asian Brands. John Wiley & Sons, Singapore, 2006.UNCTAD: World Investment Reports, 1991–2010. Various issues.
Wade, Robert: Governing the Market. Princeton University Press, 1991.Wade, Robert: “State intervention and outward looking development”,
in: White, Gordon: Developmental States in East Asia. New York, 1988.
Walden, Bello (2005): Deglobalisation: Ideas for a New world economy, Zed Books.
Wonik, Kim: “Rethinking Colonialism and the Origins of the Devel-opmental State in East Asia”, in: Journal of contemporary Asia, Vol. 39, no. 3, August 2009, pp. 332–399.


Published by Kalligram Publishers, Bratislava 2013. First edition. Pages 268. Cover design Tibor Hrapka. Graphic layout and print preparation by Studio GB, Dunajská Streda. Printed by OOK-Press Kft., Veszprém.