kleuraspecten van led toestellen - kaho / laboratorium voor lichttechnologie
TRANSCRIPT

Kleuraspecten van LED toestellen
Richard Vanraes Peter Hanselaer Laboratorium voor Lichttechnologie, Gent KAHO Sint-Lieven KU Leuven
• Light&Lighting Laboratory • Colorimetry in a nutshell • Colorimetry of LEDs • RGB or phosphor white? • Impact of junction temperature? • Impact of viewing angle? • Impact of operating time? • What about colour rendering ?
2
Outline

3
Light&Lighting Laboratory: the team

New Light Sources
Lighting Optical design
Appearance
Measurement Facilities
4
Light&Lighting Laboratory: topics

5
Light&Lighting Laboratory: activities
Industrial consultancy • 3 consortia • >70 companies • Bilateral projects • Projects with non-profit organisations • Measurements • Courses • Lectures
PhD research items • LEDs and general lighting • OLED • remote phosphor LEDs • lighting in the operating room • colour rendering • gloss perception • colour appearance • ray tracing • scattering and fluorescence • spectral response solar cells

PhD Research
Industrial Consultancy
Education Society
Combination of research and consultancy

7
Light&Lighting Laboratory: measurement facilities
Spectrometers/ CCD detectors

Near field goniometers 8
Light&Lighting Laboratory: measurement facilities
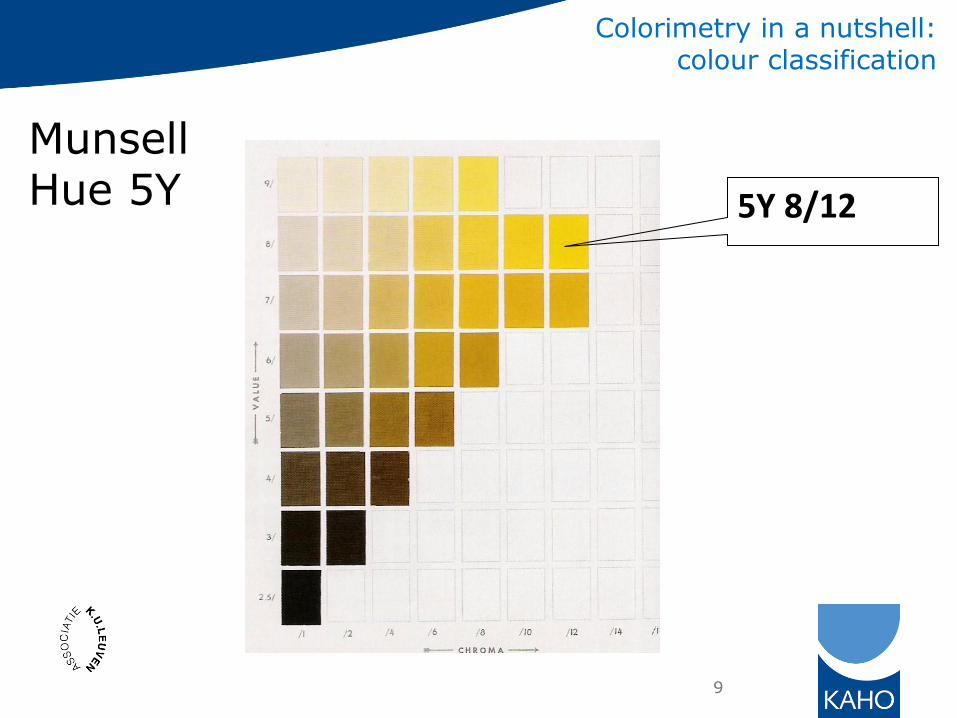
Munsell Hue 5Y 5Y 8/12
9
Colorimetry in a nutshell: colour classification

10
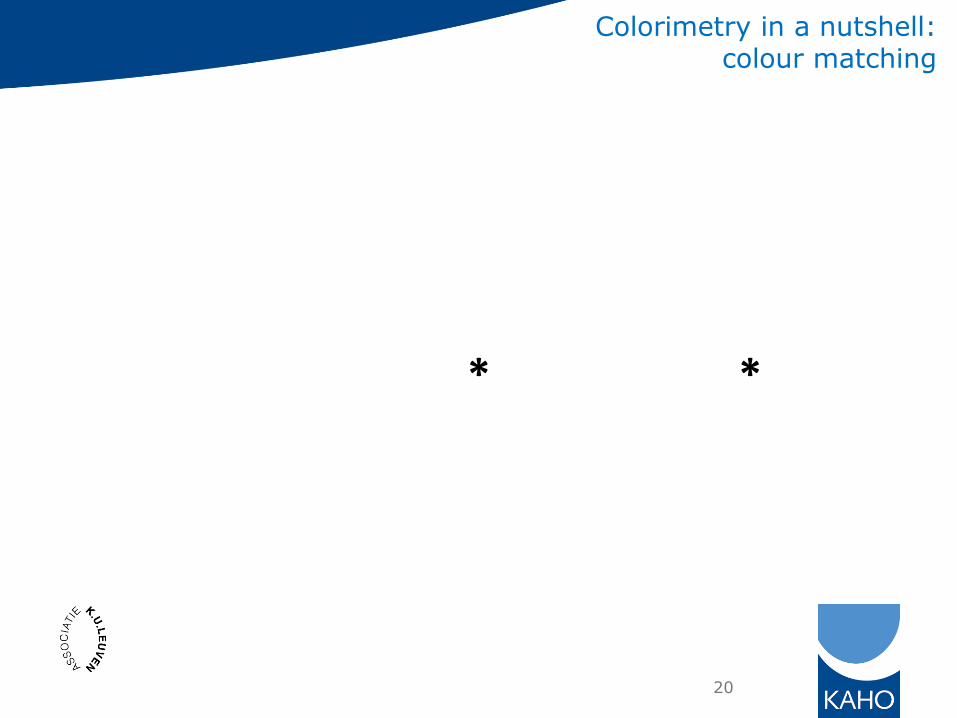
Colorimetry in a nutshell: colour matching
. . .K A B C
K A B C
L A L B
CA
L C L
B
Test colour
with luminance K
K
L
Three primary sources

Trichromatic values Kleurcomponenten
X,Y,Z
11
x 0.706 x 0.863x 0.863
Colorimetry in a nutshell: trichromatic values
Primaries

Ignoring brightness, only two numbers are needed: colour coordinates (x,y)
(Kleurcoördinaten)
Xx
X Y Z
Yy
X Y Z
12
Colorimetry in a nutshell: colour coordinates

Characteristics
• Spectrum locus
• Additive mixing
• Purity, saturation
• Colour gamut
• Primary colours
13
Colorimetry in a nutshell: chromaticity diagram

14
Colorimetry in a nutshell: correlated colour temperature
The correlated colour temperature is the
temperature of a Planckian radiator having
the chromaticity nearest the chromaticity
associated with the given spectral distribution
on a diagram where the (CIE1931 standard
observer based) u, v coordinates of the
Planckian locus and the test stimulus are
depicted.

Black Body Locus
15
EN 12464
• CCT<3300 K :
“warm white”
• 3300 K< CCT< 5300 K:
“neutral white”
• CCT>5300K:
“cool daylight”
Colorimetry in a nutshell: correlated colour temperature

16
Colorimetry in a nutshell: colour rendering
The colour rendering index CRI of a light
source is a measure of the shift in
chromaticity of a set of objects when
they are lighted by the source as
compared to be lighted by a reference
source of comparable colour
temperature.

Testlamp Testsamples (8 of 14)
Standardlamp <colour differences>
Colour coordinates
Colour coordinates
17
Colorimetry in a nutshell: colour rendering

18
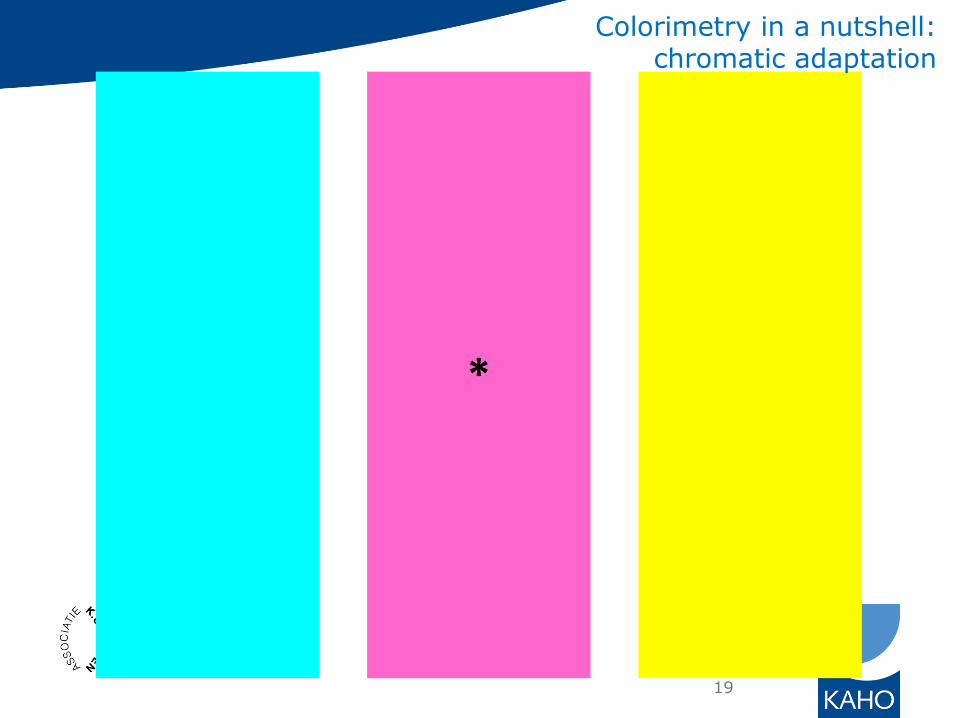
Colorimetry in a nutshell: chromatic adaptation
• The visual system is able to partially or
completely disaccount for the colour of the
illuminant such that the white of the illuminant
is always perceived as “white” (complete
adaptation)
• This is accomplished by changing the
sensitivities of the red, green and blue visual
channel.
*
19
Colorimetry in a nutshell: chromatic adaptation
* *
20
Colorimetry in a nutshell: colour matching

1240( ) . .
( )g
cE E eV h f h
nm
1. Peak wavelength is determined by bandgap Eg
2. Number of photons: drive current and recombination probability
Band gap Eg
E
1240( )
( )g
nmE eV
Band gap Eg
E
1240( )
( )g
nmE eV
Band gap Eg
E
Band gap Eg
E
1240( )
( )g
nmE eV
21
0
300
600
900
1200
1500
350 400 450 500 550 600 650 700 750
Golflengte (nm)
Sp
ectr
ale
str
alin
gsin
ten
sit
eit
(m
W/s
r.n
m)
LED1
Colorimetry of LEDs: spectrum

CIE chromaticity
High purity colours
Wide colour gamut possible
No direct generation of white light
22
Colorimetry of LEDs: chromaticity
23
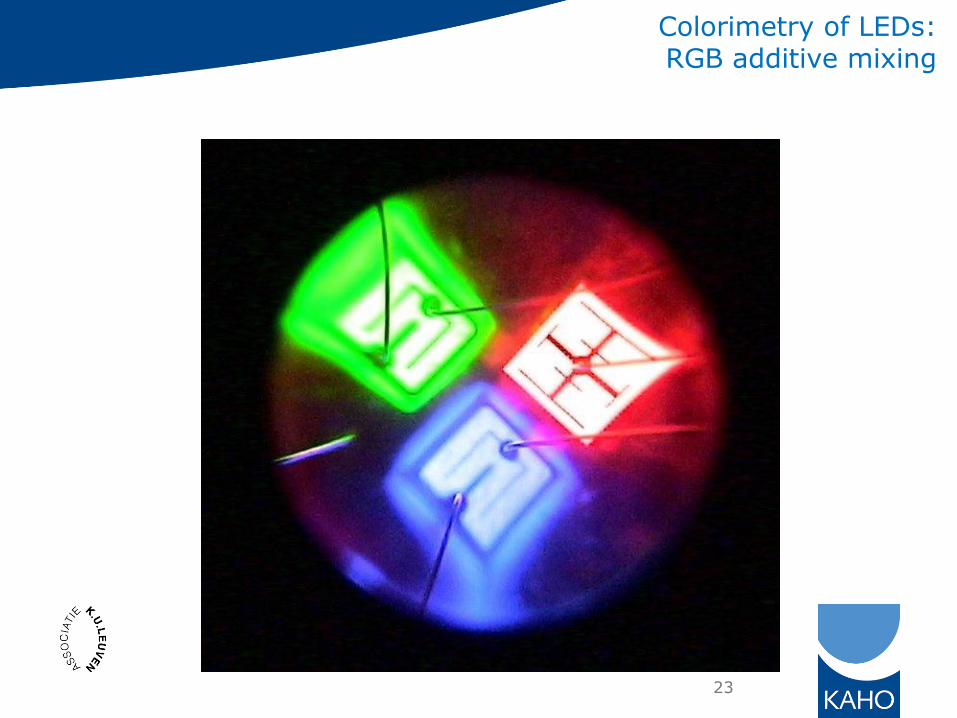
Colorimetry of LEDs: RGB additive mixing

24
Colorimetry of LEDs: Phosphor White LEDs

25
Colorimetry of LEDs: Phosphor White LEDs

LEDs from 3 manufacturers
• 1 phosphor-white package (350 mA)
• 1 red-green-blue package
Comparison of consumed power for same
• luminous flux
• colour coordinates
• heat sink
with PW as reference
26
RGB or Phosphor White? Experiment

0
0,2
0,4
0,6
0,8
1
1,2
1,4
1,6
1,8
Cree Lumileds SSC
P (
W)
PW
R
G
B
M1 M2 M3
27
MFR flux (lm) CIE (x,y) P (W) PW
eff. (lm/W) PW
P (W) RGB
eff. (lm/W) RGB
M1 84.1 (0.31, 0.33) 1.16 72.5 2.44 34.5
M2 45.9 (0.32, 0.33) 1.06 43.3 2.50 18.4
M3 77.6 (0.30, 0.32) 1.11 69.9 2.61 29.7
RGB or Phosphor White? Results

Decrease of the bandgap: increase of wavelength
Decrease of recombination rate: decrease of flux
Band gap Eg
E
1240( )
( )g
nmE eV
Band gap Eg
E
1240( )
( )g
nmE eV
Band gap Eg
E
Band gap Eg
E
1240( )
( )g
nmE eV
28
Impact of junction temperature? Spectrum

- 55 E-555 E-5- 0.0019- 0.0520.14Yellow
- 23 E-542 E-5- 0.0040- 0.0160.11Green
- 90 E-690 E-6- 0.0012- 0.0580.19Red
y
(1/°C)
x
(1/°C)
U
(V/°C)
I
(cd/°C)
piek
(nm/°C)
- 55 E-555 E-5- 0.0019- 0.0520.14Yellow
- 23 E-542 E-5- 0.0040- 0.0160.11Green
- 90 E-690 E-6- 0.0012- 0.0580.19Red
y
(1/°C)
x
(1/°C)
U
(V/°C)
I
(cd/°C)
piek
(nm/°C)
29
Impact of junction temperature? Chromaticity

30
Impact of junction temperature? Active cooling

LuxeonIII U(junction T) for series 1 (used)
y = -0.0026x + 2.4443
R2 = 0.999
1.90
1.95
2.00
2.05
2.10
2.15
2.20
2.25
2.30
2.35
2.40
2.45
20 30 40 50 60 70 80 90 100 110
temperature (°C)
U (
V)
1: 10 µA
1: 100 µA
2: 10 µA
2: 100 µA
lnf m
nkU T I a T b
e
31
Impact of junction temperature? Forward voltage

32
Impact of junction temperature? Determination

With and without heat sink
Different ambient temperature
33
Impact of junction temperature Self heating
Luminous flux is dependent on heat sink, position of heat sink, . . .

I(0°)
I (85°)
flux
34
Impact of viewing angle? Chromaticity

35
Impact of viewing angle? Spectrum
Negligible impact when using remote phosphor LEDs

36
Impact of operating time? Chromaticity
Degradation of the phosphor Experiments

CRI Verschil in %
September 2010
Januari 2011
April 2011
Januari tov september
April tov september
Lamp 1 90 89 89 -1% -1%
Lamp 2 72 73 73 1% 1%
Lamp 3 76 78 80 3% 5%
Lamp 4 69 70 69 1% 0%
Lamp 5 76 78 79 3% 4%
Lamp 6 65 66 65 1% 1%
Lamp 7 71 71 71 0% 0%
Lamp 8 77 77 77 0% 0%
Lamp 9 88 88 88 0% 0%
Lamp 10 78 77 80 -1% 3%
Lamp 11 65 65 65 0% 0%
Lamp 12 73 72 73 -1% 0%
gemiddelde 75 76 76 0% 1%
mediaan 76 77 77 1% 1%
37
CCT [K] Verschil in %
September 2010
Januari 2011
April 2011
Januari tov september
April tov september
Lamp 1 4186 4066 4075 -3% -3%
Lamp 2 6876 6637 6818 -3% -1%
Lamp 3 3709 3653 3701 -2% 0%
Lamp 4 4016 3874 3834 -4% -5%
Lamp 5 4207 4077 4128 -3% -2%
Lamp 6 3194 3167 3194 -1% 0%
Lamp 7 3307 3153 3175 -5% -4%
Lamp 8 3853 3717 3743 -4% -3%
Lamp 9 3365 3307 3326 -2% -1%
Lamp 10 3678 3470 3670 -6% 0%
Lamp 11 4733 4586 4625 -3% -2%
Lamp 12 5329 5037 5104 -5% -4%
IEC PAS 62717: CRI after 6000 h: maximum -5 CCT after 6000 h: within 1 class (100 K)
Impact of operating time? CCT and CRI

Ra=50 Ra=60 Ra=70 Ra=85 Ra=100 Ra=83 Reference Illuminant
38
Large colour differences towards reference low quality !
What about colour rendering? Problem

The more similar a light source renders the familiar object colours to their memory colours,
the better the colour quality.
39
What about colour rendering? Memory colours

Colour appearance rating of real familiar objects
40
The closer the test illuminant reaches the memory colour of 10 objects, the higher the MCRI
What about colour rendering? Determination of Memory colours

• Aspects of colour quality investigated
– Preference/attractiveness (appreciation) – Naturalness
• Thirteen colour quality metrics (CIE TC 1-69)
• Combining results of 9 psychophysical studies
Correlation between 13 metric predictions and all the visual data is calculated.
[email protected] 41 41
What about colour rendering? Experimental validation

GAI_Ra for naturalness: ravg = 0.85
Memory metric for preference/attractiveness: ravg = 0.88
42
What about colour rendering? Experimental validation

[email protected] 43 43
Xb Xg Xr Xw X
Yb Yg Yr Yw Y
Zb Zg Zr Zw Z
.
.
xiXi Yi
yi
ziZi Yi
yi
What about colour rendering? Optimizing LED clusters
Optimum MCRI ánd efficacy

Visual experiment with 2700K setting:
• Sa optimized LED lamp scored significantly better (p<0.05) than the incandescent source for attractiveness, preference and memory.
• No significant differences for naturalness and vividness !
MEAN/MEDIAN Attractiveness Preference Naturalness Vividness Memory
Sa optimized LED 7.8 / 8.0 7.9 / 8.0 7.2 /8.0 7.4 /8.0 7.9 /8.0
RGB LED cluster 6.0 / 6.0 5.6 / 6.0 4.2 / 4.5 6.3 / 7.0 4.8 / 5.0
Incandescent lamp 5.8 / 6.0 6.0 / 6.0 6.9 / 7.0 6.2 / 6.5 6.5 / 6.0
44
What about colour rendering? Visual performance
www.lichttechnologie.be: daar brandt de lamp . . .