klabin s.a. - api.mziq.com
TRANSCRIPT
(A free translation of the original in Portuguese)
KLABIN S.A.
All amounts in thousands of Reais
Klabin S.A. Quarterly Information (ITR) at September 30, 2021 and report on review of quarterly information
(A free translation of the original in Portuguese)
KLABIN S.A.
All amounts in thousands of Reais
Officers’ statement on the Quarterly Information We, as Officers of KLABIN S.A., a corporation headquartered in the city of São Paulo, State of São Paulo, at 3600 Brigadeiro Faria Lima Avenue, 3rd, 4th and 5th floors, Itaim Bibi, Zip Code 04538-132, Brazil, enrolled in the National Corporate Taxpayers’ Registry (CNPJ) under No. 89.637.490/0001-45, declare that we have reviewed, discussed and agreed with the set of quarterly information, dated August 10, 2021, related to the quarterly information for the period ended September 30, 2021. São Paulo, October 26, 2021. Cristiano Cardoso Teixeira Chief Executive Officer Marcos Paulo Conde Ivo Chief Financial Officer and Investor Relations Officer Flavio Deganutti Officer Francisco Cezar Razzolini Officer

(A free translation of the original in Portuguese)
KLABIN S.A.
All amounts in thousands of Reais
Officers’ statement on the independent auditor’s report We, as Officers of KLABIN S.A., a corporation headquartered in the city of São Paulo, State of São Paulo, at 3600 Brigadeiro Faria Lima Avenue, 3rd, 4th and 5th floors, Itaim Bibi, Zip Code 04538-132, Brazil, enrolled in the National Corporate Taxpayers’ Registry (CNPJ) under No. 89.637.490/0001-45, declare that we have reviewed, discussed and agreed with the opinions expressed in the independent auditor’s report dated August 10, 2021, related to the quarterly information for the period ended September 30, 2021. São Paulo, October 26, 2021. Cristiano Cardoso Teixeira Chief Executive Officer Marcos Paulo Conde Ivo Chief Financial Officer and Investor Relations Officer Flavio Deganutti Officer Francisco Cezar Razzolini Officer
A free translation from Portuguese into English of Independent Auditor’s Review Report on Individual and Consolidated Interim Financial Information prepared in Brazilian currency in accordance with accounting practices adopted in Brazil and Accounting Pronouncement NBC TG 21 (R4) and IAS 34 - Interim Financial Reporting, issued by the International Accounting Standards Board (IASB) and specific CVM rules.
Independent auditor’s review report on quarterly information To the Shareholders, Board of Directors and Officers of
Klabin S.A. São Paulo - SP Introduction We have reviewed the accompanying individual and consolidated interim financial information, contained in the Quarterly Information Form (ITR) of Klabin S.A. (the “Company”), for the quarter ended September 30, 2021 comprising the statement of financial position as at September 30, 2021 and the related statements of profit or loss and of comprehensive income for the three and nine-month periods then ended and the statements of changes in equity and of cash flows for the nine-month period then ended, including the explanatory notes. Management is responsible for preparation of the individual and consolidated interim financial information in accordance with accounting pronouncement NBC TG 21 (R4) and IAS 34 - Interim Financial Reporting, issued by the International Accounting Standards Board (IASB), as well as for the fair presentation of this financial information in conformity with the rules issued by the Brazilian Securities and Exchange Commission (CVM) applicable to the preparation of the Quarterly Information Form (ITR). Our responsibility is to express a conclusion on this interim financial information based on our review. Scope of review We conducted our review in accordance with Brazilian and international standards on review engagements (NBC TR 2410 and ISRE 2410 - Review of Interim Financial Information Performed by the Independent Auditor of the Entity, respectively). A review of interim financial information consists of making inquiries, primarily of persons responsible for financial and accounting matters, and applying analytical and other review procedures. A review is substantially less in scope than an audit conducted in accordance with auditing standards and, consequently, does not enable us to obtain assurance that we would become aware of all significant matters that might be identified in an audit. Accordingly, we do not express an audit opinion. Conclusion on the individual and consolidated interim financial information Based on our review, nothing has come to our attention that causes us to believe that the accompanying individual and consolidated interim financial information included in the quarterly information referred to above was not prepared, in all material respects, in accordance with NBC TG 21 (R4) and IAS 34 applicable to the preparation of Quarterly Information Form (ITR), and presented consistently with the rules issued by the Brazilian Securities and Exchange Commission (CVM).
Other matters Statements of value added The abovementioned quarterly information includes the individual and consolidated statements of value added (SVA) for the nine-month period ended September 30, 2021, prepared under Company’s Management responsibility and presented as supplementary information by IAS 34. These statements have been subject to review procedures performed together with the review of the quarterly information with the objective to conclude whether they are reconciled to the interim financial information and the accounting records, as applicable, and if its format and content are in accordance with the criteria set forth by NBC TG 09 - Statement of Value Added. Based on our review, nothing has come to our attention that causes us to believe that they were not prepared, in all material respects, in accordance with the criteria defined in referred to Standard and consistently with the overall individual and consolidated interim financial information. São Paulo, October 26, 2021 ERNST & YOUNG Auditores Independentes S.S. CRC-2SP034519/O-6 Rita de C. S. Freitas Accountant CRC-1SP214160/O-5
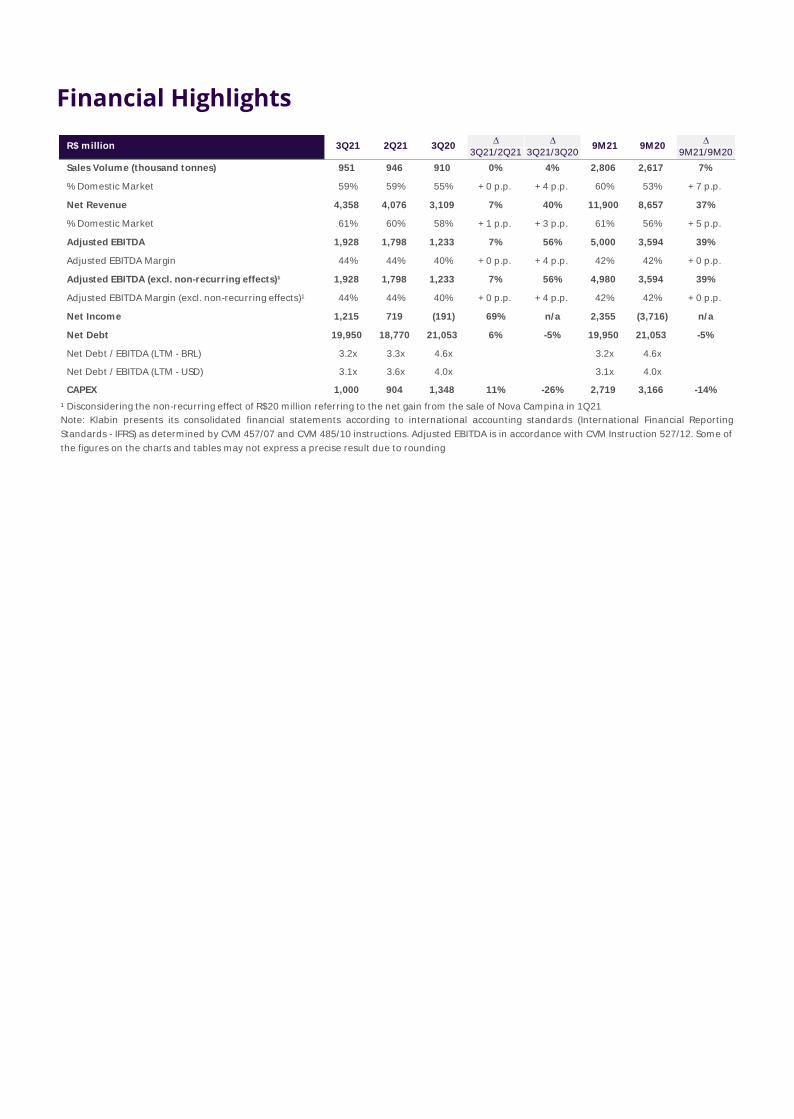
Financial Highlights
∆ ∆ ∆
3Q21/2Q21 3Q21/3Q20 9M21/9M20
Sales Volume (thousand tonnes) 951 946 910 0% 4% 2,806 2,617 7%
% Domestic Market 59% 59% 55% + 0 p.p. + 4 p.p. 60% 53% + 7 p.p.
Net Revenue 4,358 4,076 3,109 7% 40% 11,900 8,657 37%
% Domestic Market 61% 60% 58% + 1 p.p. + 3 p.p. 61% 56% + 5 p.p.
Adjusted EBITDA 1,928 1,798 1,233 7% 56% 5,000 3,594 39%
Adjusted EBITDA Margin 44% 44% 40% + 0 p.p. + 4 p.p. 42% 42% + 0 p.p.
Adjusted EBITDA (excl. non-recurring effects)¹ 1,928 1,798 1,233 7% 56% 4,980 3,594 39%
Adjusted EBITDA Margin (excl. non-recurring effects)¹ 44% 44% 40% + 0 p.p. + 4 p.p. 42% 42% + 0 p.p.
Net Income 1,215 719 (191) 69% n/ a 2,355 (3,716) n/ a
Net Debt 19,950 18,770 21,053 6% -5% 19,950 21,053 -5%
Net Debt / EBITDA (LTM - BRL) 3.2x 3.3x 4.6x 3.2x 4.6x
Net Debt / EBITDA (LTM - USD) 3.1x 3.6x 4.0x 3.1x 4.0x
CAPEX 1,000 904 1,348 11% -26% 2,719 3,166 -14%
Note: Klabin presents its consolidated financial statements according to international accounting standards (International Financial Report ing
Standards - IFRS) as determined by CVM 457/07 and CVM 485/10 instructions. Adjusted EBITDA is in accordance with CVM Instruction 527/12. Some of
the figures on the charts and tables may not express a precise result due to rounding
9M21 9M20R$ million 3Q21 2Q21 3Q20
¹ Disconsidering the non-recurring effect of R$20 million referring to the net gain from the sale of Nova Campina in 1Q21
Quarterly Message
Strong demand for Klabin’s products in both international and domestic markets continued in the
third quarter. These favorable market conditions combined with the Company’s commercial flexibility
and solid operational performance boosted results in the period.
In the pulp market, the balance between supply and demand remained in equilibrium during the
quarter in the light of sharp differences in consumption between geographies. Demand weakened in
China but remained strong in Europe, USA and Latin America while supply continued to be affected
by logistical constraints. Set against this scenario, Klabin proved the benefits of its flexibility in the
sales mix between regions and of its diversified pulp portfolio (short fiber, long fiber and fluff), with
price differentials remaining considerable throughout the period. As a result, the Pulp Business’s
EBITDA was a record in the quarter at R$ 1.042 billion.
In the paper for packaging segment, demand for kraftliner continued intense. In the USA, the largest
producer and exporter of this product, robust domestic consumption remained the key factor in the
reduction of export volume, 34% down for the period between January and July 2021 compared to
the same period in the preceding year. With this, the average FOEX Europe price for kraftliner was
US$ 883/t in 3Q21, 30% greater than the average for 3Q20 and 9% above the preceding quarter.
Set against this positive market background, Klabin has just increased its kraftliner production
capacity. During the quarter, the Company took a further important step forward in the
implementation of its growth strategy with the startup of the first paper machine (“PM27”) of the
Puma II Project, the largest investment in Klabin’s history, as announced in the Material Fact published
on August 30, 2021. With a productive capacity of 450 thousand tons annually, PM27 begins
production of Eukaliner®, the first kraftliner in the world made exclusively from eucalyptus fiber.
Still in the paper for packaging segment, the accelerated tendency towards replacing single-use
plastic with sustainable packaging continues to drive demand for coated board. Brazilian Tree
Industry data (IBÁ) shows sales to the Brazilian market growing by approximately 21% year-on-year
for the period from January to August 2021. In this context and parallel to the startup of PM27, work
on the construction of the second paper machine (“PM28”) in the Puma II Project has already begun.
With a productive capacity of 460 thousand tons of coated board every year, PM28 startup is
scheduled for the second quarter of 2023, continuing the Company's ongoing expansion plans.
In the packaging market, Empapel reported a decline of 2.5% in preliminary data for shipment
volumes of corrugated boxes in the third quarter of 2021 compared to the same period of the
previous year. Even with this reduction, volumes still represent the second best result for the
historical series in the period. For the year to the end of the third quarter 2021, shipment volumes
increased 7.3% in relation to the same period in 2020. In the light of this scenario and the effect of
price increases on revenue, the corrugated boxes segment reported robust growth both on an annual
and also quarterly basis.
Still in the packaging business, sales in the industrial bags segment have been driven by increased
cement output in Brazil, the latter accumulating a price increase of 9.7% in the period between

January and September 2021 compared to the same period in 2020 and based on preliminary
National Cement Industry Union (SNIC) data. In addition, consumption of industrial bags for new uses
with greater value added continues at a fast pace.
Increased sales volume together with price readjustments across all the businesses produced strong
revenue growth in the third quarter, amounting to R$ 4.358 billion, 40% more than the same period
in the preceding year or 29% when excluding revenue from
assets acquired from IP. This result combined with the
Company’s cost discipline lifted the Adjusted EBITDA for the
quarter to R$ 1.928 billion, 56% up on 3Q20. The higher Adjusted
EBITDA and efficient capital allocation helped drive cash
generation in the period and consequently, creation of
shareholder value, measured by ROIC, of about 20% over the last
12 months.
The third quarter also saw the roll out of the Container Rail Terminal operation in the state of Paraná
and planned to provide additional capacity for handling the Company’s new expansion cycle as well
as optimizing the current paper products operation. The terminal brings both an increase in
productivity as well as lesser environmental impact with the distribution of products by rail reducing
both traffic on the highways as well as CO2 emissions.
The Company also became a signatory to the Business and LGBTI+ Rights Forum, assuming ten
commitments for promoting respect diversity in the LGBTI+ community. This initiative is aligned to
the Klabin 2030 Agenda’s KODS - Klabin’s Sustainable Development Goals.
The operational results for recent quarters have shown the benefits of Klabin’s integrated, diversified
and flexible business model and the consistent generation of value for all stakeholders. Throughout
its history, Klabin has transformed sustainability in its essence and will continue growing, committed
to the construction of a sustainable future for all.
ROIC reached 19.8%
and FCF Yield 15.0%
in the last twelve
months
Operating and Economic-Financial Performance
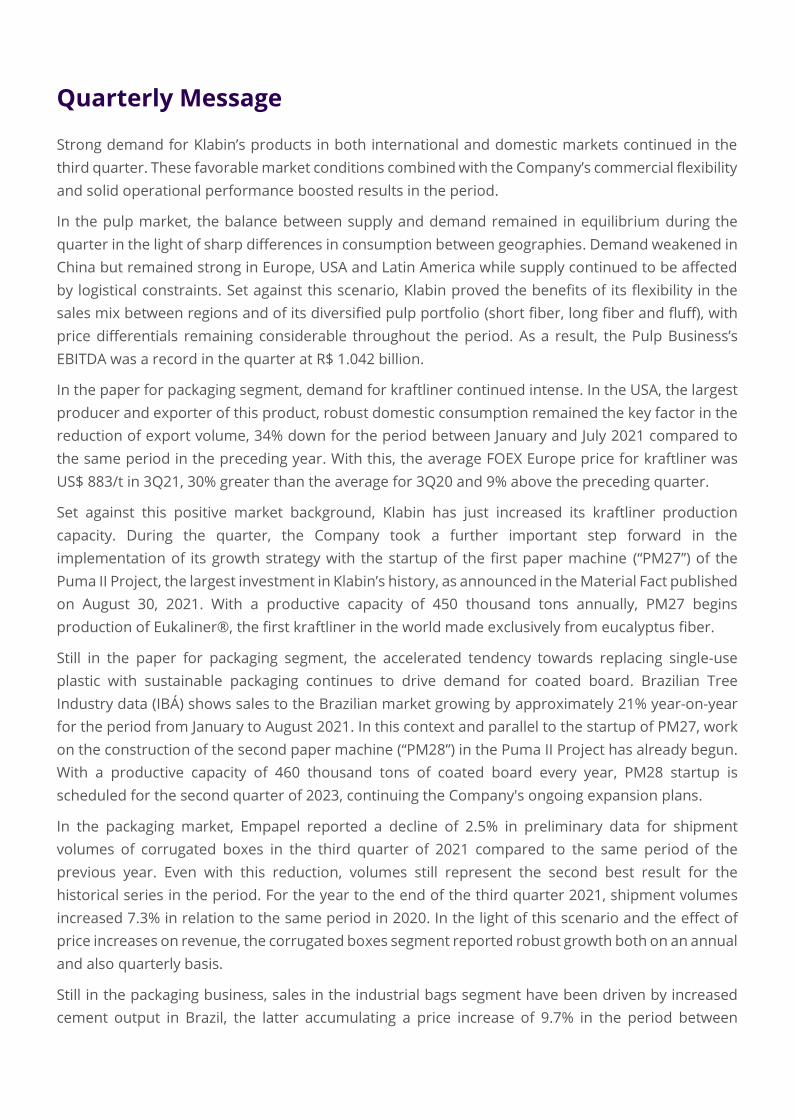
Pulp and Paper Production
In the third quarter 2021, pulp production volume remained stable at a high level on both an annual
and quarterly basis. Project for debottlenecking together with productivity gains have enabled the
Puma Unit to operate above its nominal capacity.
Paper production in 3Q21 was 14% higher than for the same period in 2020. The increase is a
reflection largely of the acquisition of two recycled paper units acquired from International Paper.
The startup of the first machine in the Puma II Project on August 30, 2021 with the production of 17
thousand tons of Eukaliner® already produced in this quarter, also contributed to output.
Maintenance Stoppages
As scheduled, during the third quarter, there was a general maintenance stoppage at the Otacílio
Costa Unit at a cost of approximately R$ 22 million. The Company has thus completed all its
programmed stoppages for 2021 as shown below.
∆ ∆ ∆
3Q21/2Q21 3Q21/3Q20 9M21/9M20
Pulp 413 416 415 -1% 0% 1,242 1,224 2%
Short Fiber 296 298 319 -1% -7% 889 900 -1%
Long Fiber/Fluff 117 118 96 -1% 22% 353 323 9%
Paper 555 549 488 1% 14% 1,606 1,494 8%
Kraft liner 266 259 258 2% 3% 779 768 1%
Coated Boards 190 189 165 1% 16% 530 534 -1%
Recycled 99 101 65 -3% 51% 298 191 56%
Total Production Volume 968 966 903 0% 7% 2,848 2,717 5%
9M203Q21 2Q21 3Q20Volume (k tons) 9M21
Manufacturing Plant
Ortigueira (PR) - Puma I
Monte Alegre (PR) MA
Correia Pinto (SC)
Otacílio Costa (SC) OC
Legend:
Nov Dec
Executed
Maintenance Stoppage Schedule 2021
Jan Feb Mar Apr May Jun Jul Aug Sep Oct
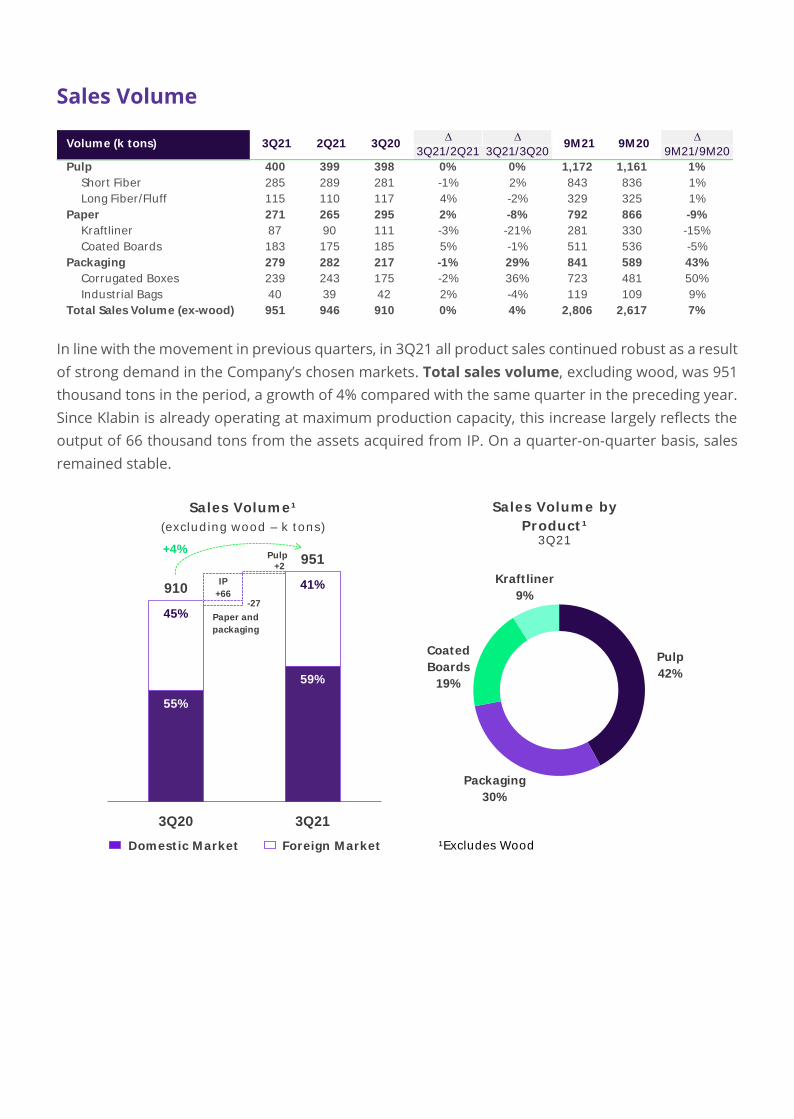
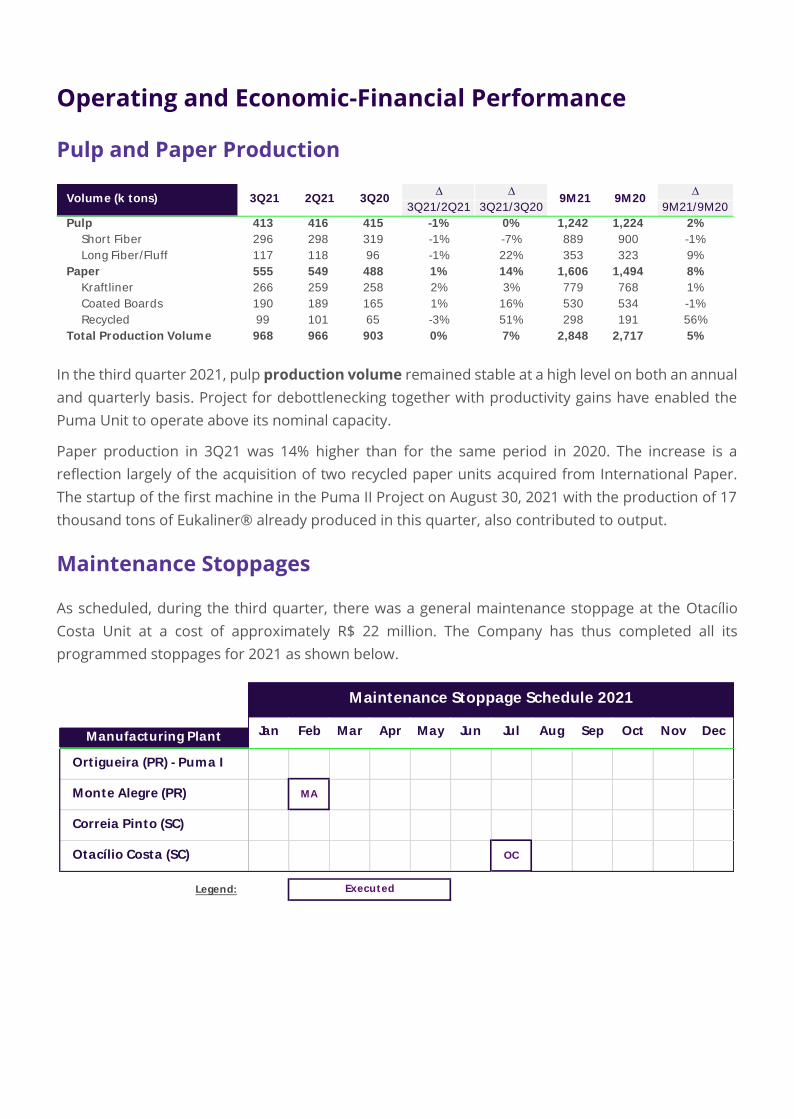
Sales Volume
In line with the movement in previous quarters, in 3Q21 all product sales continued robust as a result
of strong demand in the Company’s chosen markets. Total sales volume, excluding wood, was 951
thousand tons in the period, a growth of 4% compared with the same quarter in the preceding year.
Since Klabin is already operating at maximum production capacity, this increase largely reflects the
output of 66 thousand tons from the assets acquired from IP. On a quarter-on-quarter basis, sales
remained stable.
∆ ∆ ∆
3Q21/2Q21 3Q21/3Q20 9M21/9M20
Pulp 400 399 398 0% 0% 1,172 1,161 1%
Short Fiber 285 289 281 -1% 2% 843 836 1%
Long Fiber/Fluff 115 110 117 4% -2% 329 325 1%
Paper 271 265 295 2% -8% 792 866 -9%
Kraft liner 87 90 111 -3% -21% 281 330 -15%
Coated Boards 183 175 185 5% -1% 511 536 -5%
Packaging 279 282 217 -1% 29% 841 589 43%
Corrugated Boxes 239 243 175 -2% 36% 723 481 50%
Industrial Bags 40 39 42 2% -4% 119 109 9%
Total Sales Volume (ex-wood) 951 946 910 0% 4% 2,806 2,617 7%
9M21 9M20Volume (k tons) 3Q21 2Q21 3Q20
Pulp
42%
Packaging
30%
Coated
Boards
19%
Kraft liner
9%
¹Excludes Wood
Sales Volum e by
Product ¹3Q21
55%
59%
45%
41%910
951
3Q20 3Q21
Sales Volum e¹
(exclud ing wood – k t ons)
Domest ic M arket Foreign M arket
+4%Pulp
Paper and
packaging
-27
IP
+66
+2
Foreign Exchange
Net Revenue
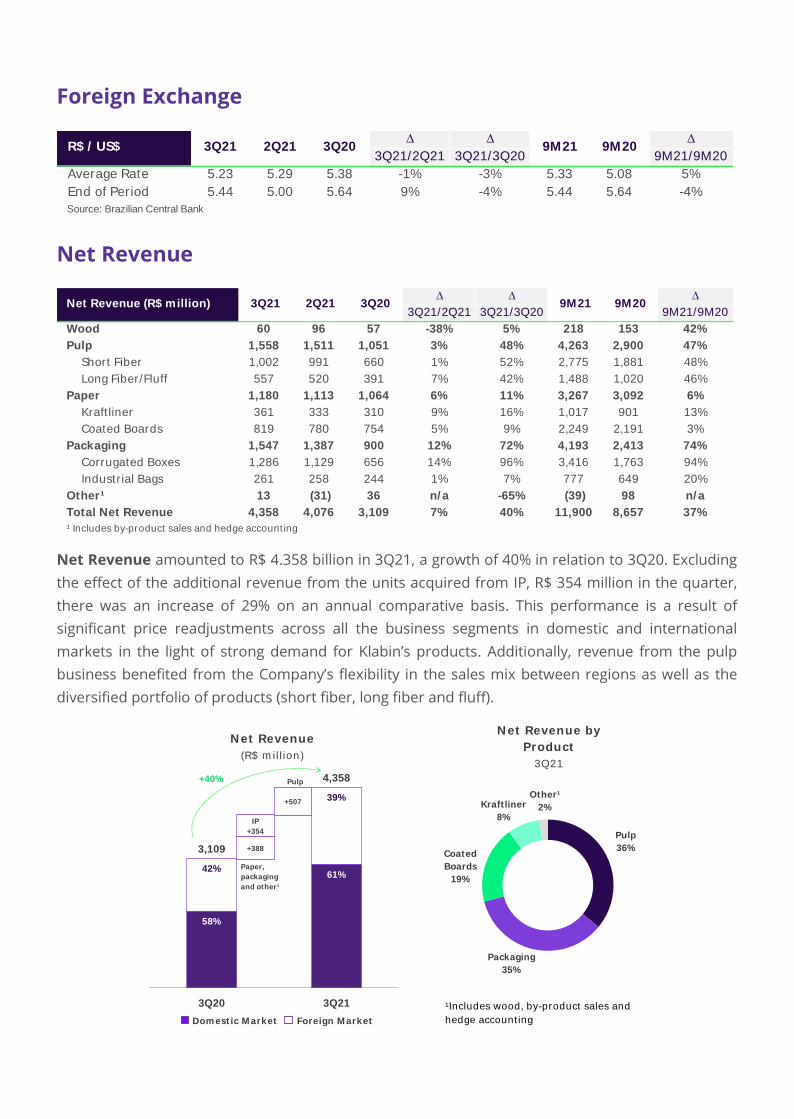
Net Revenue amounted to R$ 4.358 billion in 3Q21, a growth of 40% in relation to 3Q20. Excluding
the effect of the additional revenue from the units acquired from IP, R$ 354 million in the quarter,
there was an increase of 29% on an annual comparative basis. This performance is a result of
significant price readjustments across all the business segments in domestic and international
markets in the light of strong demand for Klabin’s products. Additionally, revenue from the pulp
business benefited from the Company’s flexibility in the sales mix between regions as well as the
diversified portfolio of products (short fiber, long fiber and fluff).
∆ ∆ ∆
3Q21/2Q21 3Q21/3Q20 9M21/9M20
Average Rate 5.23 5.29 5.38 -1% -3% 5.33 5.08 5%
End of Period 5.44 5.00 5.64 9% -4% 5.44 5.64 -4%
Source: Brazilian Central Bank
9M21 9M20R$ / US$ 3Q21 2Q21 3Q20
∆ ∆ ∆
3Q21/2Q21 3Q21/3Q20 9M21/9M20
Wood 60 96 57 -38% 5% 218 153 42%
Pulp 1,558 1,511 1,051 3% 48% 4,263 2,900 47%
Short Fiber 1,002 991 660 1% 52% 2,775 1,881 48%
Long Fiber/Fluff 557 520 391 7% 42% 1,488 1,020 46%
Paper 1,180 1,113 1,064 6% 11% 3,267 3,092 6%
Kraft liner 361 333 310 9% 16% 1,017 901 13%
Coated Boards 819 780 754 5% 9% 2,249 2,191 3%
Packaging 1,547 1,387 900 12% 72% 4,193 2,413 74%
Corrugated Boxes 1,286 1,129 656 14% 96% 3,416 1,763 94%
Industrial Bags 261 258 244 1% 7% 777 649 20%
Other¹ 13 (31) 36 n/ a -65% (39) 98 n/ a
Total Net Revenue 4,358 4,076 3,109 7% 40% 11,900 8,657 37%
¹ Includes by-product sales and hedge accounting
Net Revenue (R$ million) 3Q21 2Q21 3Q20 9M21 9M20
N et Revenue by
Product
3Q21
58%
61%42%
39%
3,109
4,358
3Q20 3Q21
Pulp
36%
Packaging
35%
Coated
Boards
19%
Kraft liner
8%
Other¹
2%
N et Revenue
(R$ m il l ion)
Domest ic M arket Foreign M arket
¹Includes wood, by-product sales and
hedge account ing
Paper,
packaging
and other¹
IP
+354
+507
Pulp
+388
+40%
Operational Costs and Expenses
Pulp Cash Cost
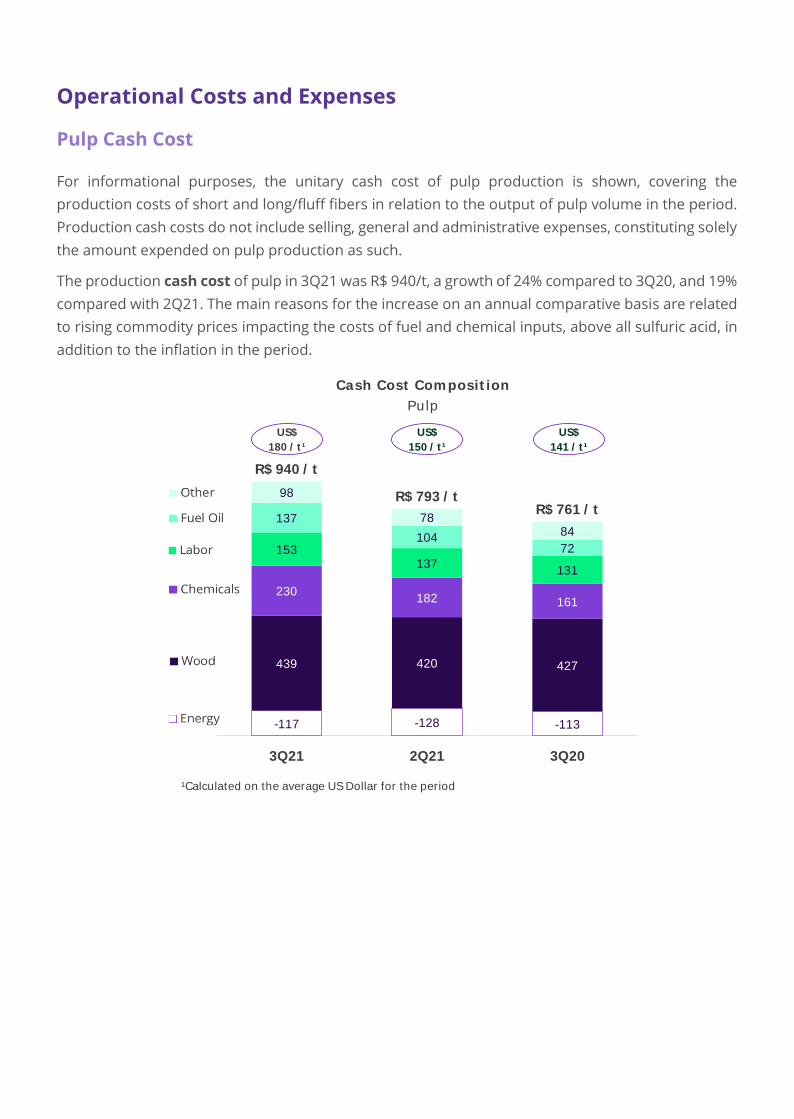
For informational purposes, the unitary cash cost of pulp production is shown, covering the
production costs of short and long/fluff fibers in relation to the output of pulp volume in the period.
Production cash costs do not include selling, general and administrative expenses, constituting solely
the amount expended on pulp production as such.
The production cash cost of pulp in 3Q21 was R$ 940/t, a growth of 24% compared to 3Q20, and 19%
compared with 2Q21. The main reasons for the increase on an annual comparative basis are related
to rising commodity prices impacting the costs of fuel and chemical inputs, above all sulfuric acid, in
addition to the inflation in the period.
¹Calculated on the average US Dollar for the period
-117 -128 -113
439 420 427
230182 161
153137
131
137
10472
98
7884
R$ 940 / t
R$ 793 / tR$ 761 / t
3Q21 2Q21 3Q20
Cash Cost Com posit ion
Pulp
US$
180 / t ¹
US$
150 / t ¹
US$
141 / t ¹
Total Cash Cost
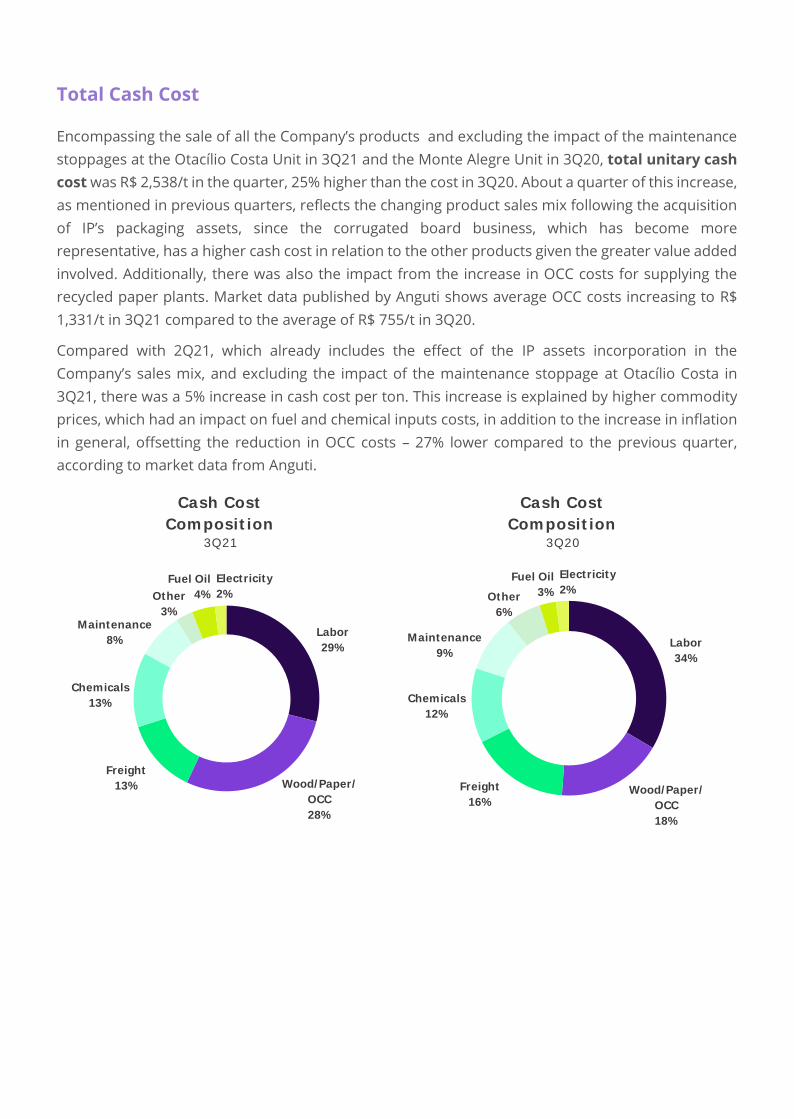
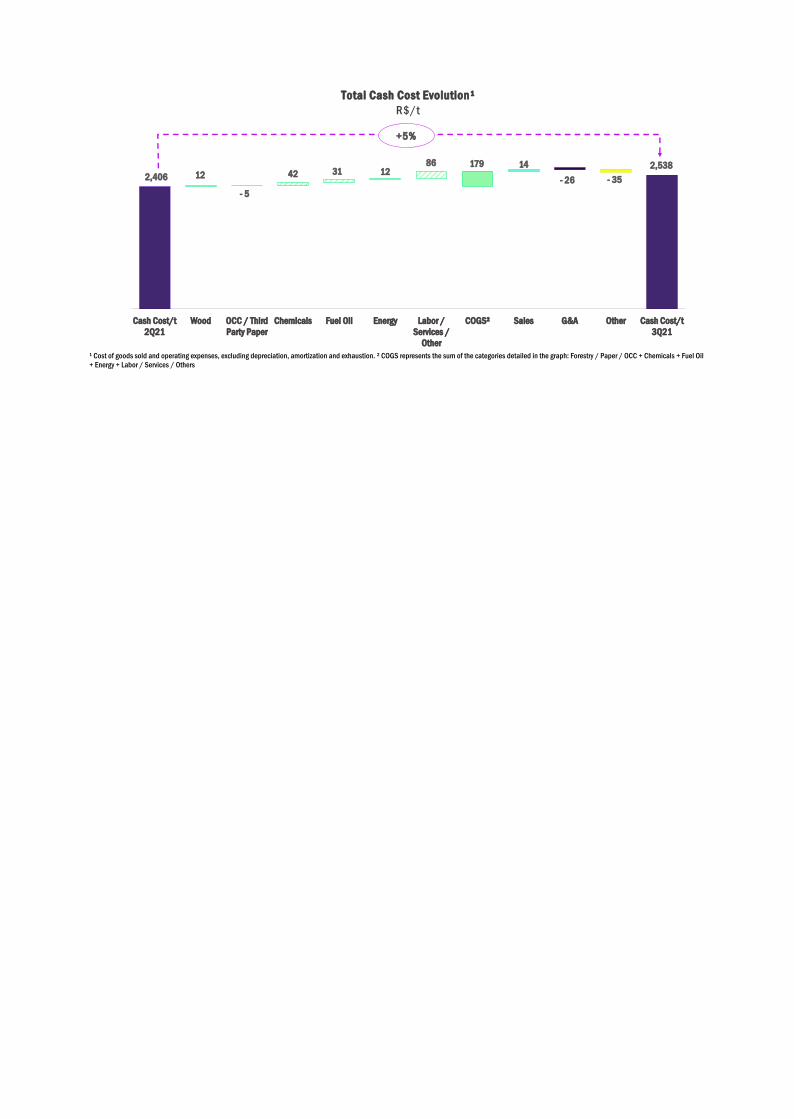
Encompassing the sale of all the Company’s products and excluding the impact of the maintenance
stoppages at the Otacílio Costa Unit in 3Q21 and the Monte Alegre Unit in 3Q20, total unitary cash
cost was R$ 2,538/t in the quarter, 25% higher than the cost in 3Q20. About a quarter of this increase,
as mentioned in previous quarters, reflects the changing product sales mix following the acquisition
of IP’s packaging assets, since the corrugated board business, which has become more
representative, has a higher cash cost in relation to the other products given the greater value added
involved. Additionally, there was also the impact from the increase in OCC costs for supplying the
recycled paper plants. Market data published by Anguti shows average OCC costs increasing to R$
1,331/t in 3Q21 compared to the average of R$ 755/t in 3Q20.
Compared with 2Q21, which already includes the effect of the IP assets incorporation in the
Company’s sales mix, and excluding the impact of the maintenance stoppage at Otacílio Costa in
3Q21, there was a 5% increase in cash cost per ton. This increase is explained by higher commodity
prices, which had an impact on fuel and chemical inputs costs, in addition to the increase in inflation
in general, offsetting the reduction in OCC costs – 27% lower compared to the previous quarter,
according to market data from Anguti.
Labor
29%
Wood/Paper/
OCC
28%
Freight
13%
Chemicals
13%
Maintenance
8%
Other
3%
Fuel Oil
4%
Electricity
2%
Labor
34%
Wood/Paper/
OCC
18%
Freight
16%
Chemicals
12%
Maintenance
9%
Other
6%
Fuel Oil
3%
Electricity
2%
Cash Cost
Com posit ion3Q21
Cash Cost
Com posit ion3Q20
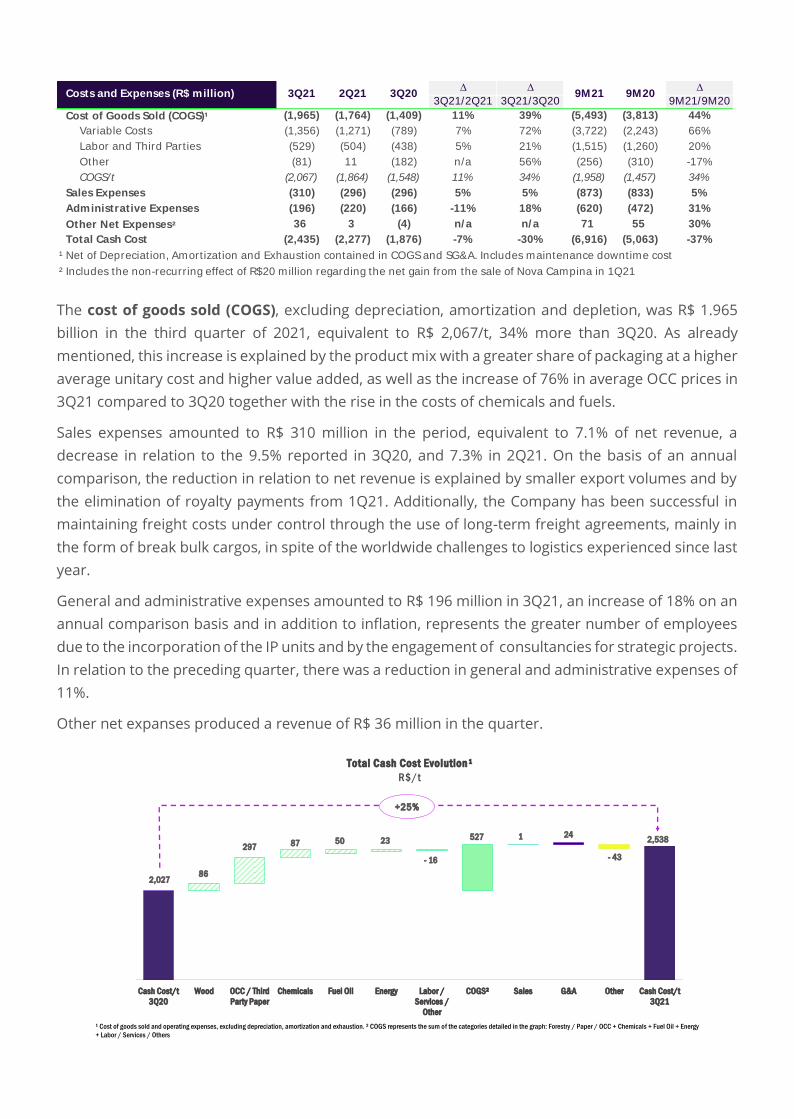
The cost of goods sold (COGS), excluding depreciation, amortization and depletion, was R$ 1.965
billion in the third quarter of 2021, equivalent to R$ 2,067/t, 34% more than 3Q20. As already
mentioned, this increase is explained by the product mix with a greater share of packaging at a higher
average unitary cost and higher value added, as well as the increase of 76% in average OCC prices in
3Q21 compared to 3Q20 together with the rise in the costs of chemicals and fuels.
Sales expenses amounted to R$ 310 million in the period, equivalent to 7.1% of net revenue, a
decrease in relation to the 9.5% reported in 3Q20, and 7.3% in 2Q21. On the basis of an annual
comparison, the reduction in relation to net revenue is explained by smaller export volumes and by
the elimination of royalty payments from 1Q21. Additionally, the Company has been successful in
maintaining freight costs under control through the use of long-term freight agreements, mainly in
the form of break bulk cargos, in spite of the worldwide challenges to logistics experienced since last
year.
General and administrative expenses amounted to R$ 196 million in 3Q21, an increase of 18% on an
annual comparison basis and in addition to inflation, represents the greater number of employees
due to the incorporation of the IP units and by the engagement of consultancies for strategic projects.
In relation to the preceding quarter, there was a reduction in general and administrative expenses of
11%.
Other net expanses produced a revenue of R$ 36 million in the quarter.
∆ ∆ ∆
3Q21/2Q21 3Q21/3Q20 9M21/9M20
Cost of Goods Sold (COGS)¹ (1,965) (1,764) (1,409) 11% 39% (5,493) (3,813) 44%
Variable Costs (1,356) (1,271) (789) 7% 72% (3,722) (2,243) 66%
Labor and Third Part ies (529) (504) (438) 5% 21% (1,515) (1,260) 20%
Other (81) 11 (182) n/a 56% (256) (310) -17%
COGS/t (2,067) (1,864) (1,548) 11% 34% (1,958) (1,457) 34%
Sales Expenses (310) (296) (296) 5% 5% (873) (833) 5%
Administrative Expenses (196) (220) (166) -11% 18% (620) (472) 31%
Other Net Expenses² 36 3 (4) n/ a n/ a 71 55 30%
Total Cash Cost (2,435) (2,277) (1,876) -7% -30% (6,916) (5,063) -37%
¹ Net of Depreciation, Amortization and Exhaustion contained in COGS and SG&A. Includes maintenance downtime cost
² Includes the non-recurring effect of R$20 million regarding the net gain from the sale of Nova Campina in 1Q21
Costs and Expenses (R$ million) 3Q21 2Q21 3Q20 9M21 9M20
2,02786
297 87 50 23
- 16
527 1 24
- 43
2,538
1000
1200
1400
1600
1800
2000
2200
2400
2600
2800
Cash Cost/t
3Q20
Wood OCC / Third
Party Paper
Chemicals Fuel Oil Energy Labor /
Services /
Other
COGS² Sales G&A Other Cash Cost/t
3Q21
Total Cash Cost Evolution¹
R$/t
¹ Cost of goods sold and operating expenses, excluding depreciation, amortization and exhaustion. ² COGS represents the sum of the categories detailed in the graph: Forestry / Paper / OCC + Chemicals + Fuel Oil + Energy
+ Labor / Services / Others
+25%
2,406 12
- 5
42 31 1286 179 14
- 26 - 35
2,538
1000
1200
1400
1600
1800
2000
2200
2400
2600
2800
Cash Cost/t
2Q21
Wood OCC / Third
Party Paper
Chemicals Fuel Oil Energy Labor /
Services /
Other
COGS² Sales G&A Other Cash Cost/t
3Q21
Total Cash Cost Evolution¹
R$/t
¹ Cost of goods sold and operating expenses, excluding depreciation, amortization and exhaustion. ² COGS represents the sum of the categories detailed in the graph: Forestry / Paper / OCC + Chemicals + Fuel Oil
+ Energy + Labor / Services / Others
+5%
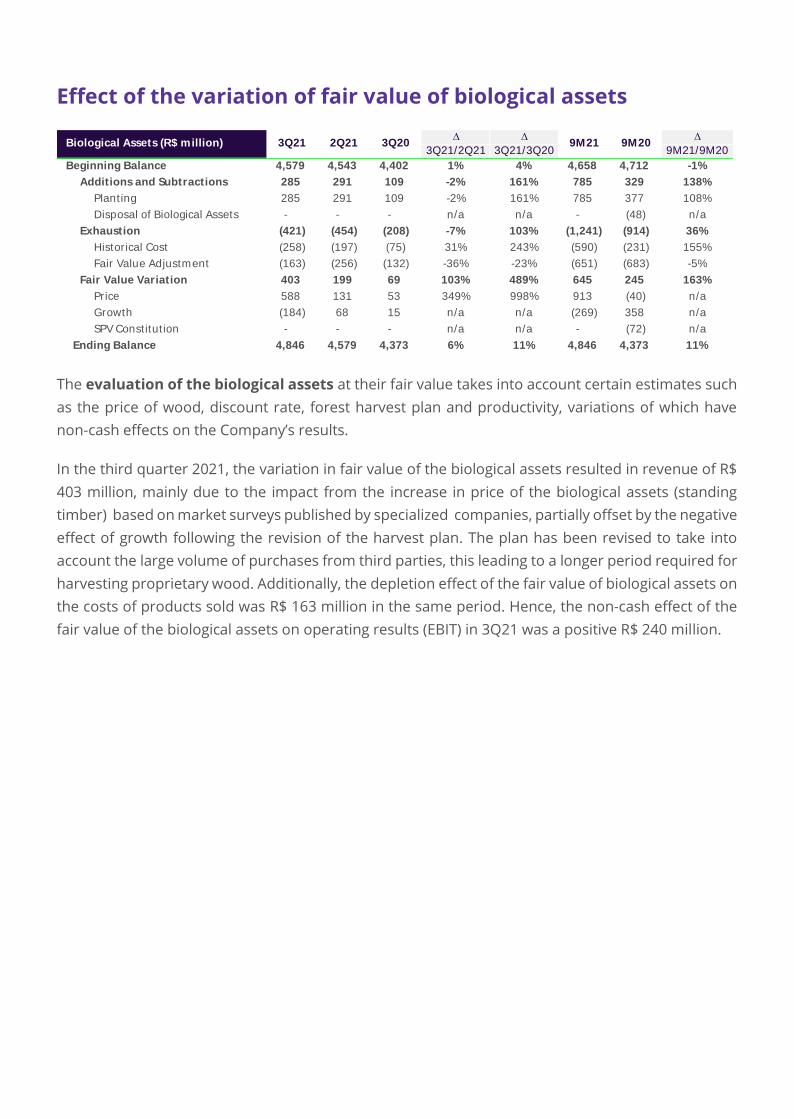
Effect of the variation of fair value of biological assets
The evaluation of the biological assets at their fair value takes into account certain estimates such
as the price of wood, discount rate, forest harvest plan and productivity, variations of which have
non-cash effects on the Company’s results.
In the third quarter 2021, the variation in fair value of the biological assets resulted in revenue of R$
403 million, mainly due to the impact from the increase in price of the biological assets (standing
timber) based on market surveys published by specialized companies, partially offset by the negative
effect of growth following the revision of the harvest plan. The plan has been revised to take into
account the large volume of purchases from third parties, this leading to a longer period required for
harvesting proprietary wood. Additionally, the depletion effect of the fair value of biological assets on
the costs of products sold was R$ 163 million in the same period. Hence, the non-cash effect of the
fair value of the biological assets on operating results (EBIT) in 3Q21 was a positive R$ 240 million.
∆ ∆ ∆
3Q21/2Q21 3Q21/3Q20 9M21/9M20
Beginning Balance 4,579 4,543 4,402 1% 4% 4,658 4,712 -1%
Additions and Subtractions 285 291 109 -2% 161% 785 329 138%
Planting 285 291 109 -2% 161% 785 377 108%
Disposal of Biological Assets - - - n/a n/a - (48) n/a
Exhaustion (421) (454) (208) -7% 103% (1,241) (914) 36%
Historical Cost (258) (197) (75) 31% 243% (590) (231) 155%
Fair Value Adjustment (163) (256) (132) -36% -23% (651) (683) -5%
Fair Value Variation 403 199 69 103% 489% 645 245 163%
Price 588 131 53 349% 998% 913 (40) n/a
Growth (184) 68 15 n/a n/a (269) 358 n/a
SPV Constitut ion - - - n/a n/a - (72) n/a
Ending Balance 4,846 4,579 4,373 6% 11% 4,846 4,373 11%
9M20Biological Assets (R$ million) 3Q21 2Q21 3Q20 9M21
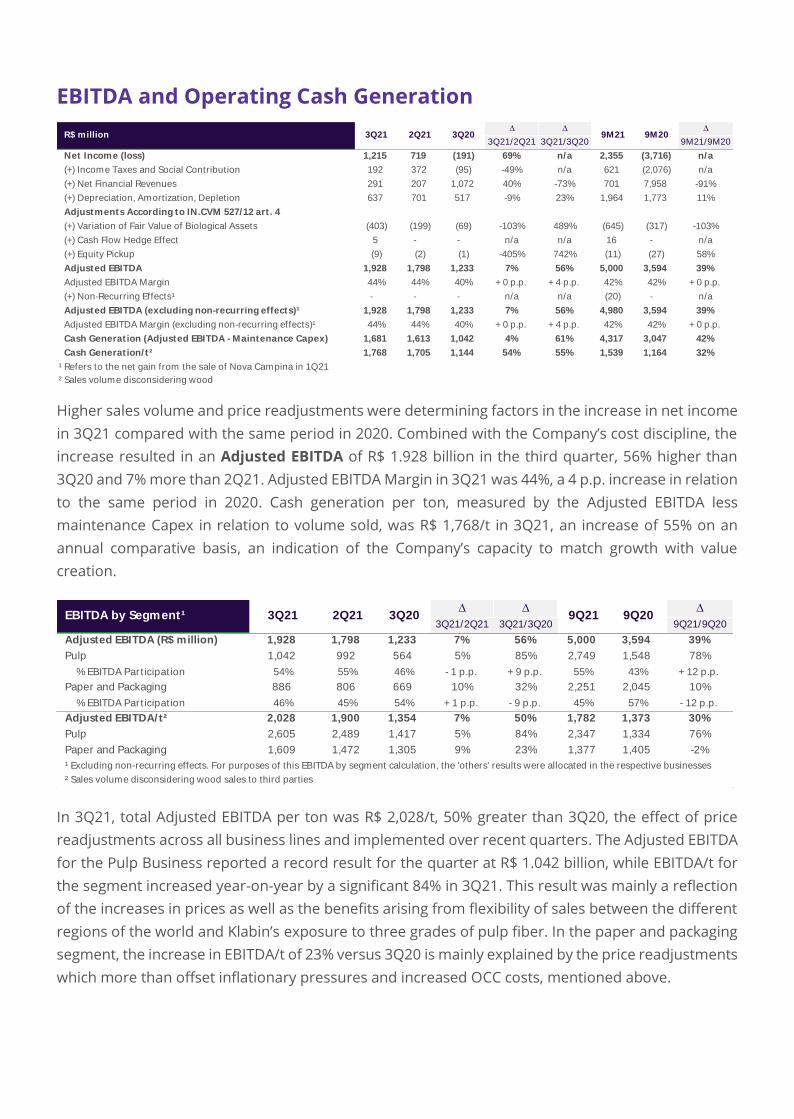
EBITDA and Operating Cash Generation
Higher sales volume and price readjustments were determining factors in the increase in net income
in 3Q21 compared with the same period in 2020. Combined with the Company’s cost discipline, the
increase resulted in an Adjusted EBITDA of R$ 1.928 billion in the third quarter, 56% higher than
3Q20 and 7% more than 2Q21. Adjusted EBITDA Margin in 3Q21 was 44%, a 4 p.p. increase in relation
to the same period in 2020. Cash generation per ton, measured by the Adjusted EBITDA less
maintenance Capex in relation to volume sold, was R$ 1,768/t in 3Q21, an increase of 55% on an
annual comparative basis, an indication of the Company’s capacity to match growth with value
creation.
In 3Q21, total Adjusted EBITDA per ton was R$ 2,028/t, 50% greater than 3Q20, the effect of price
readjustments across all business lines and implemented over recent quarters. The Adjusted EBITDA
for the Pulp Business reported a record result for the quarter at R$ 1.042 billion, while EBITDA/t for
the segment increased year-on-year by a significant 84% in 3Q21. This result was mainly a reflection
of the increases in prices as well as the benefits arising from flexibility of sales between the different
regions of the world and Klabin’s exposure to three grades of pulp fiber. In the paper and packaging
segment, the increase in EBITDA/t of 23% versus 3Q20 is mainly explained by the price readjustments
which more than offset inflationary pressures and increased OCC costs, mentioned above.
∆ ∆ ∆
3Q21/2Q21 3Q21/3Q20 9M21/9M20
Net Income (loss) 1,215 719 (191) 69% n/a 2,355 (3,716) n/a
(+) Income Taxes and Social Contribution 192 372 (95) -49% n/a 621 (2,076) n/a
(+) Net Financial Revenues 291 207 1,072 40% -73% 701 7,958 -91%
(+) Depreciation, Amortization, Depletion 637 701 517 -9% 23% 1,964 1,773 11%
Adjustments According to IN.CVM 527/12 art . 4
(+) Variation of Fair Value of Biological Assets (403) (199) (69) -103% 489% (645) (317) -103%
(+) Cash Flow Hedge Effect 5 - - n/a n/a 16 - n/a
(+) Equity Pickup (9) (2) (1) -405% 742% (11) (27) 58%
Adjusted EBITDA 1,928 1,798 1,233 7% 56% 5,000 3,594 39%
Adjusted EBITDA Margin 44% 44% 40% + 0 p.p. + 4 p.p. 42% 42% + 0 p.p.
(+) Non-Recurring Effects¹ - - - n/a n/a (20) - n/a
Adjusted EBITDA (excluding non-recurring effects)¹ 1,928 1,798 1,233 7% 56% 4,980 3,594 39%
Adjusted EBITDA Margin (excluding non-recurring effects)¹ 44% 44% 40% + 0 p.p. + 4 p.p. 42% 42% + 0 p.p.
Cash Generat ion (Adjusted EBITDA - Maintenance Capex) 1,681 1,613 1,042 4% 61% 4,317 3,047 42%
Cash Generat ion/ t ² 1,768 1,705 1,144 54% 55% 1,539 1,164 32%
² Sales volume disconsidering wood
¹ Refers to the net gain from the sale of Nova Campina in 1Q21
9M21 9M20R$ million 3Q21 2Q21 3Q20
∆ ∆ ∆
3Q21/2Q21 3Q21/3Q20 9Q21/9Q20
Adjusted EBITDA (R$ million) 1,928 1,798 1,233 7% 56% 5,000 3,594 39%
Pulp 1,042 992 564 5% 85% 2,749 1,548 78%
% EBITDA Part icipat ion 54% 55% 46% - 1 p.p. + 9 p.p. 55% 43% + 12 p.p.
Paper and Packaging 886 806 669 10% 32% 2,251 2,045 10%
% EBITDA Part icipat ion 46% 45% 54% + 1 p.p. - 9 p.p. 45% 57% - 12 p.p.
Adjusted EBITDA/ t² 2,028 1,900 1,354 7% 50% 1,782 1,373 30%
Pulp 2,605 2,489 1,417 5% 84% 2,347 1,334 76%
Paper and Packaging 1,609 1,472 1,305 9% 23% 1,377 1,405 -2%
¹ Excluding non-recurring effects. For purposes of this EBITDA by segment calculation, the 'others' results were allocated in the respective businesses
² Sales volume disconsidering wood sales to third parties
9Q20EBITDA by Segment¹ 3Q21 2Q21 3Q20 9Q21
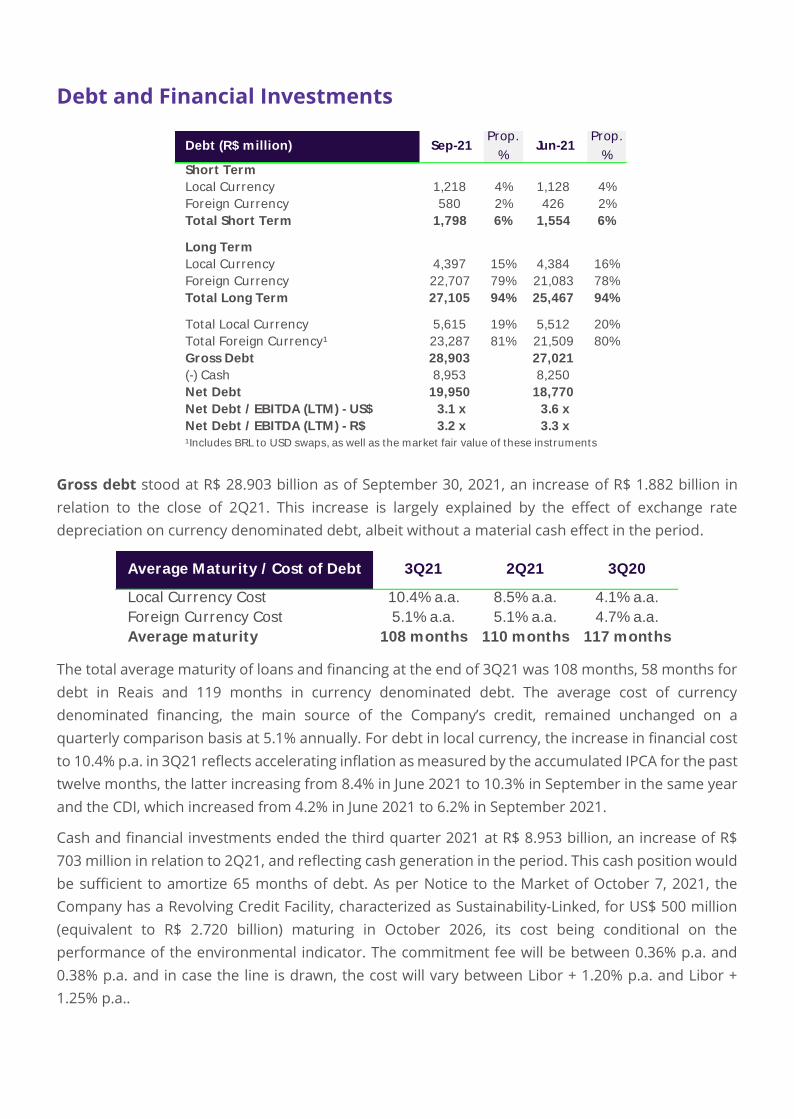
Debt and Financial Investments
Gross debt stood at R$ 28.903 billion as of September 30, 2021, an increase of R$ 1.882 billion in
relation to the close of 2Q21. This increase is largely explained by the effect of exchange rate
depreciation on currency denominated debt, albeit without a material cash effect in the period.
The total average maturity of loans and financing at the end of 3Q21 was 108 months, 58 months for
debt in Reais and 119 months in currency denominated debt. The average cost of currency
denominated financing, the main source of the Company’s credit, remained unchanged on a
quarterly comparison basis at 5.1% annually. For debt in local currency, the increase in financial cost
to 10.4% p.a. in 3Q21 reflects accelerating inflation as measured by the accumulated IPCA for the past
twelve months, the latter increasing from 8.4% in June 2021 to 10.3% in September in the same year
and the CDI, which increased from 4.2% in June 2021 to 6.2% in September 2021.
Cash and financial investments ended the third quarter 2021 at R$ 8.953 billion, an increase of R$
703 million in relation to 2Q21, and reflecting cash generation in the period. This cash position would
be sufficient to amortize 65 months of debt. As per Notice to the Market of October 7, 2021, the
Company has a Revolving Credit Facility, characterized as Sustainability-Linked, for US$ 500 million
(equivalent to R$ 2.720 billion) maturing in October 2026, its cost being conditional on the
performance of the environmental indicator. The commitment fee will be between 0.36% p.a. and
0.38% p.a. and in case the line is drawn, the cost will vary between Libor + 1.20% p.a. and Libor +
1.25% p.a..
Debt (R$ million) Sep-21Prop.
%Jun-21
Prop.
%Short Term
Local Currency 1,218 4% 1,128 4%
Foreign Currency 580 2% 426 2%
Total Short Term 1,798 6% 1,554 6%
Long Term
Local Currency 4,397 15% 4,384 16%
Foreign Currency 22,707 79% 21,083 78%
Total Long Term 27,105 94% 25,467 94%
Total Local Currency 5,615 19% 5,512 20%
Total Foreign Currency¹ 23,287 81% 21,509 80%
Gross Debt 28,903 27,021
(-) Cash 8,953 8,250
Net Debt 19,950 18,770
Net Debt / EBITDA (LTM) - US$ 3.1 x 3.6 x
Net Debt / EBITDA (LTM) - R$ 3.2 x 3.3 x
¹Includes BRL to USD swaps, as well as the market fair value of these instruments
Average Maturity / Cost of Debt 3Q21 2Q21 3Q20
Local Currency Cost 10.4% a.a. 8.5% a.a. 4.1% a.a.
Foreign Currency Cost 5.1% a.a. 5.1% a.a. 4.7% a.a.
Average maturity 108 months 110 months 117 months
Klabin also has financing earmarked to the execution of the Puma II Project, contracted, and partially
drawn for the following amounts: (i) BID Invest, IFC and JICA, US$ 700 million; (ii) Finnvera, US$ 178
million; (iii) BNDES, R$ 2 billion. These credit lines may be drawn either in full or partially, according
to the progress of the construction schedule of the Puma II Project and/or Company's cash
requirements.
Consolidated net debt as of September 30, 2021 amounted to R$ 19.950 billion, an increase of R$
1,179 billion compared to the net amount at the close of 2Q20 and largely due to the negative impact
of exchange variation on US$ denominated debt – with no material cash effect during the period -
although partially offset by cash generation.
Financial leverage measured by the Net Debt/Adjusted EBITDA ratio in US$ - which best reflects
Klabin’s financial leverage - continued a deleveraging trajectory, begun in the previous quarter and
terminating in 3Q21 at 3.1 times compared with 3.6 times in 2Q21, this being implemented in parallel
with the ongoing Puma II investment cycle. The positive performance is related to increased cash
generation and to the accumulated Adjusted EBITDA over the past twelve months, maintaining
leverage within the parameters established in the Company’s Financial Debt Policy.
Hedge Accounting
From January 2021, Klabin implemented the cash flow hedge accounting method. This practice, in
line with the Company’s risk management and strategy, seeks to demonstrate the equalization of the
effects of foreign exchange variation in the income statement as they are effectively realized with
their cash effect.
Debts in US$ are designated as instruments of protection of the highly probable future revenues in
US$ and the effects of the currency variation on these debts are recorded under shareholders’ equity
in the “Valuation adjustments to shareholders’ equity” line. With the realization of revenues in US$
linked to the designated debts for hedge accounting purposes, so the respective accumulated
amounts of currency variation are recorded in the income statements under “Net Revenue”.
At the end of 3Q21, the currency variation of debt designated for hedge accounting totaled a net
negative effect of R$ 560 million in the “Valuation adjustments to shareholders’ equity” in the
shareholders’ equity. This amount related to the positive balance of R$ 865 million in the financial
result less the R$ 16 million realization of the hedge reserve plus R$ 288 million in Income Tax and
Social Contribution.
In 3Q21, revenue was realized in the amount of US$ 18 million linked to the settlement of loans and
financing, designated as a hedge instrument. This revenue generated an accumulated foreign
exchange expense of R$ 5 million, excluded from the Adjusted EBITDA to better show the Company’s
cash generation.
The implementation of hedge accounting is exclusively of an accounting nature and does not
impact the Company’s cash generation and Adjusted EBITDA.
For more information, please see the financial statements for the period.
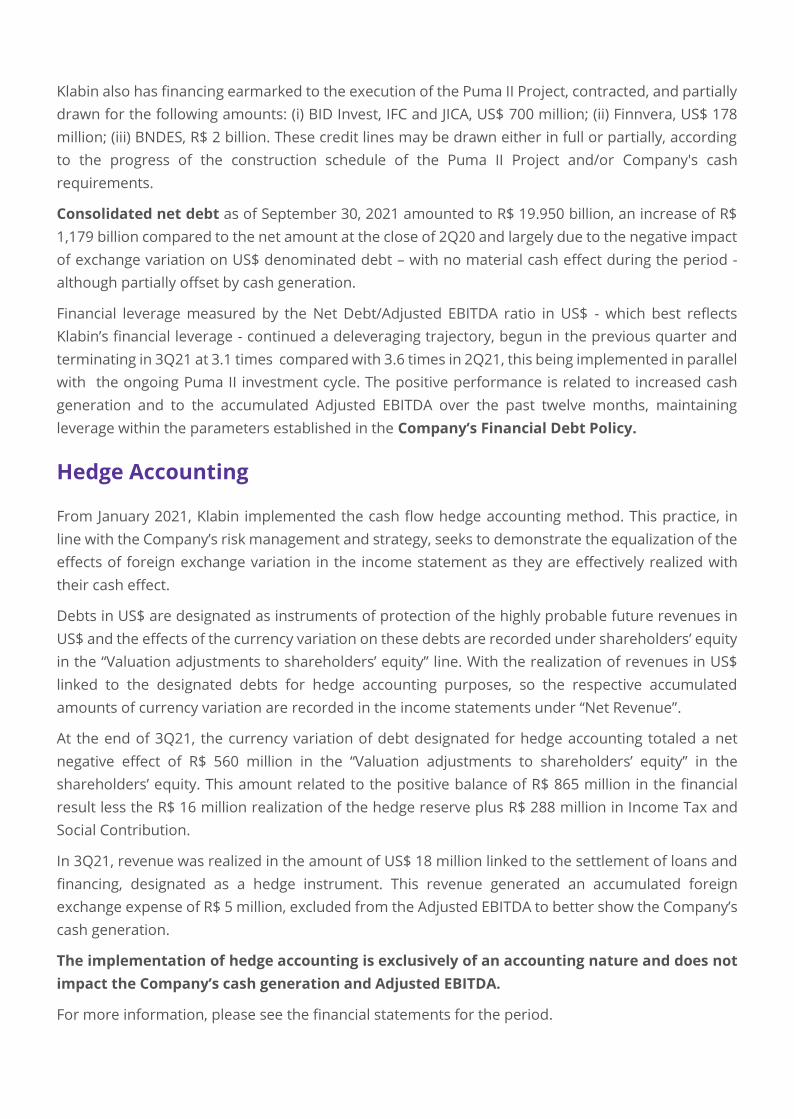
Financial Result¹
In 3Q21, financial expenses excluding hedge accounting and swap effects amounted to R$ 310
million, 18% lower than the preceding quarter and in line with the same period in 2020. Financial
revenues totaled R$ 83 million in the quarter, an increase of R$ 11 million in relation to 2Q21 and R$
20 million compared with 3Q20, both a reflection of the increase in the CDI.
The closing FX rate for the quarter was R$ 5.44/US$, 9% above the rate at the end of 2Q21, thus
generating the negative result in the net foreign exchange variation line of R$ 1.199 billion due to
the impact on US$ denominated debt and R$ 430 million in the marking-to-market of interest rate
swaps. These swaps are linked to loans and financing contracted in Reais and through these
derivative instruments, have an effect similar to a liability contracted in US$.
As mentioned in the preceding section, the Company has adopted the hedge accounting
methodology, with a positive pre-Income Tax/Social Contribution effect of R$ 1.566 billion in 3Q21, a
reflection of the appreciation in the Real against the US$ on the marking of currency denominated
debt. This amount ceases to be booked to the income statement through an offsetting amount to
stockholders equity in the “Valuation adjustments to shareholders’ equity” line. Important to note
that the currency variation on US$ denominated debt, the marking-to-market of the swaps as well as
the partial compensation according to the hedge accounting methodology – amounting to negative
R$ 63 million in 3Q21 - had no cash effect in the period.
∆ ∆ ∆
3Q21/2Q21 3Q21/3Q20 9M21/9M20
Financial Expenses (310) (379) (316) -18% -2% (1,159) (1,142) 1%
Financial Revenues 83 72 63 15% 30% 184 296 -38%
Subtotal (228) (307) (252) -26% -10% (975) (846) 15%
Net Foreign Exchange Variat ion (1,199) 1,845 (535) n/a 124% (509) (4,646) -89%
Derivative Instruments (SWAP) (430) 684 (285) n/a 51% (81) (2,466) -97%
Hedge Accounting Effect 1,566 (2,429) - n/a n/a 865 - n/a
Subtotal (63) 100 (819) n/ a -92% 274 (7,112) n/ a
Financial Result (291) (207) (1,072) 40% -73% (701) (7,958) -91%
¹ Pro-forma numbers. For more details, please access the Company's Financial Statements
9M21 9M20R$ million 3Q21 2Q21 3Q20
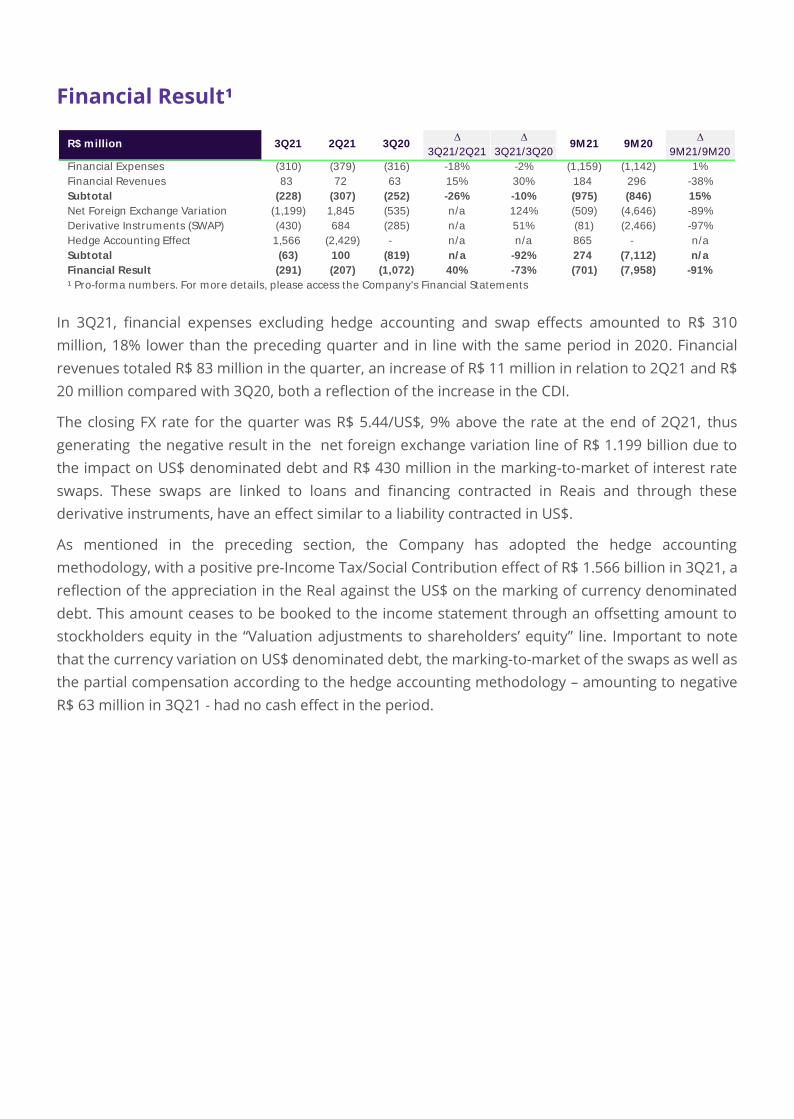
Investments
In 3Q21, Klabin invested R$ 1.0 billion in its operations and expansion. Of the total amount invested,
R$ 134 million were allocated to forestry operations and R$ 113 million to the operational continuity
of the plants. The total of these two amounts, R$ 247 million, represents the investments in the
operational maintenance of the Company. On an annual comparison basis, the largest investments
reflect principally the impact of accelerating inflation on services and inputs during the period. A
further R$ 130 million were invested in special projects and expansions, among which those projects
approved at the end of June 2021.
As these are investments from a cash point of view, the amounts do not consider investments related
to the forestry activities of the subsidiaries through Special Purpose Corporations (SPC’s), executed
via the injection of forestry assets already existing in Klabin’s balance sheet.
Regarding the Puma II Project investments, to the present, R$ 7.136 billion has been invested, of
which R$ 5.316 billion up to 2020 and R$ 1.820 billion in the first nine months of 2021. As already
commented, the startup of the Project's first machine took place during the third quarter 2021 and
the startup of the second machine is scheduled for the second quarter of 2023. Remaining
investments required to conclude the project will be financed out of the Company’s cash position and
from the generation of cash from current business activity. Complementary funding can be obtained
by drawing against credit lines already in place with the ECA’s, BNDES, BID Invest, IFC and JICA, with
no requirements for additional financing.
∆ ∆ ∆
3Q21/2Q21 3Q21/3Q20 9M21/9M20
Forestry 134 70 88 90% 52% 271 206 31%
Operational Continuity 113 115 104 -1% 9% 413 340 21%
Maintenance Capex 247 185 191 33% 29% 683 546 25%
Special Projects and Growth 130 18 15 607% 743% 216 43 407%
Puma II Project 623 700 1,141 -11% -45% 1,820 2,577 -29%
Total 1,000 904 1,348 11% -26% 2,719 3,166 -14%
9M21 9M20R$ million 3Q21 2Q21 3Q20
¹ Init ial gross capex of R$9.1 bi (2019) updated to 2021 prices by exchange rate variat ion and inflat ion added to
incremental capex of R$2.6 bi due to the change in PM 28 to coated board
² Considers the end of period R$/US$ rate
1.3
5.3
7.1
12.9¹ 12.9¹ 12.9¹
2019 2020 9M21
Expended To be Expended
Gross Pum a II Capex
Budgeted vs Expended
(R$ b i l l ion )
0.51.0 1.0
3.0
0.4 0.41.3
FINNVERA
0.5 0.5 4.4
IDB
INVEST/ IFC/ JICA
8.7² 8.7² 8.7²
2019 2020 9M21
Withdrawn To be Withdrawn
Pum a II Financing
Funded vs Withdr awn
(R$ b i l l ion )
BNDES
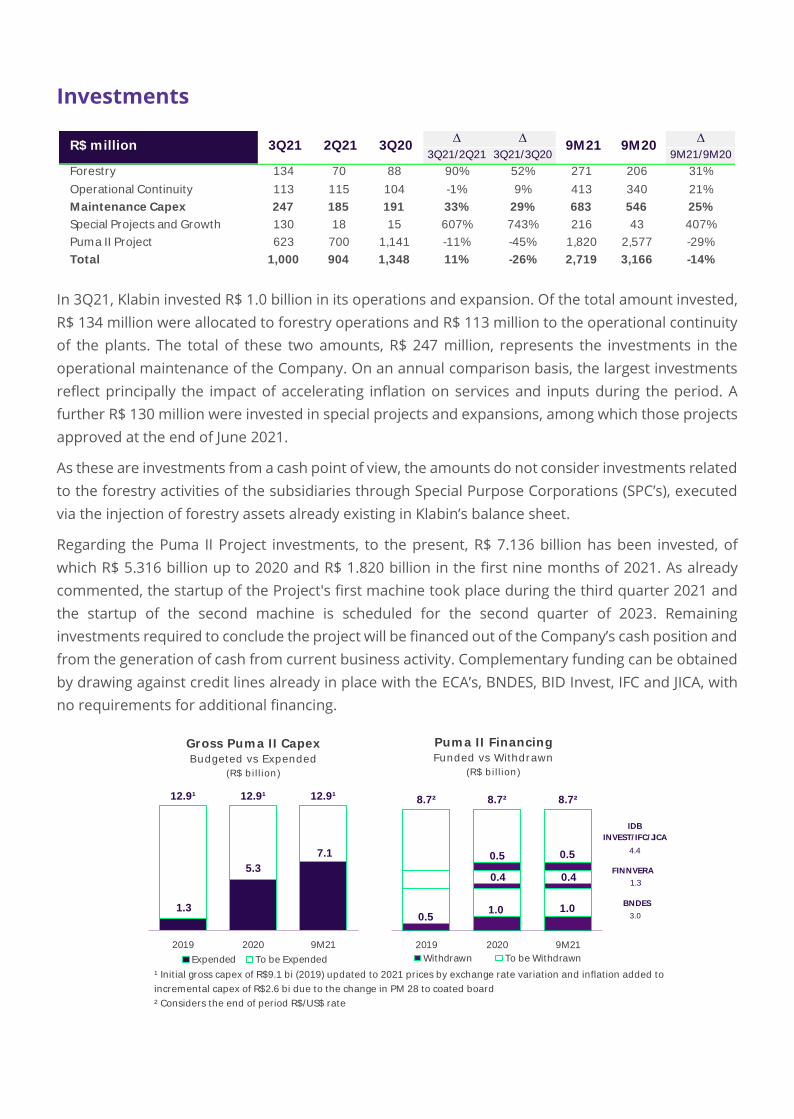
Free Cash Flow
The Adjusted Free Cash Flow for the third quarter 2021 was driven by the increase in Adjusted EBITDA
as well as the reduction in working capital, largely the result of monetization of tax credits, and a
larger outstanding balance to suppliers.
In the ‘Interest Paid/Received’ line, the amount in 3Q21 was less than compared to 2Q21 due to the
interest on bonds maturing in 2029 and 2049 and settled in the preceding quarter.
The ‘Others’ line reported higher expenses in 3Q21 when compared to 2Q21 and 3Q20. This line
incorporates the booking of dividends paid by companies controlled by Klabin, SCPs/SPEs, whose
main objective is the exploitation of forestry activities with efficient use of capital.
Excluding discretionary factors and growth projects, the Adjusted Free Cash Flow for the last twelve
months amounted to R$ 4.366 billion, equivalent to a Free Cash Flow Yield of 15.0%.
LTM LTM
3Q21 3Q20
Adjusted EBITDA 1,928 1,798 1,233 6,313 4,558
(-) Capex¹ (1,000) (904) (1,348) (4,727) (4,017)
(-) Interest Paid/Received (134) (391) (179) (1,383) (1,256)
(-) Income Tax (203) (71) (2) (316) (9)
(+/-) Working Capital Variat ion 206 328 915 928 1,568
(-) Dividends & IOC - - - - (517)
(+/-) Others (86) 3 (19) (249) (48)
Free Cash Flow 712 763 600 566 279
Dividends & IOC - - - - 517
Puma II Project 623 700 1,141 3,288 3,130
Special Projects and Growth 130 18 15 512 52
Adjusted Free Cash Flow² 1,465 1,481 1,757 4,366 3,978
Adjusted FCF Yield³ 15.0% 18.7%
² Excluding dividends and expansion projects
¹ Capex under cash accrual method does not consider investments into SPVs (Special Purpose Vehicles)
³ Yield - Adjusted FCF per share (excluding treasury stock) divided by the average price of the Units in the LTM (Last Twelve
Months)
R$ million 3Q21 2Q21 3Q20
ROIC - Return on Invested Capital
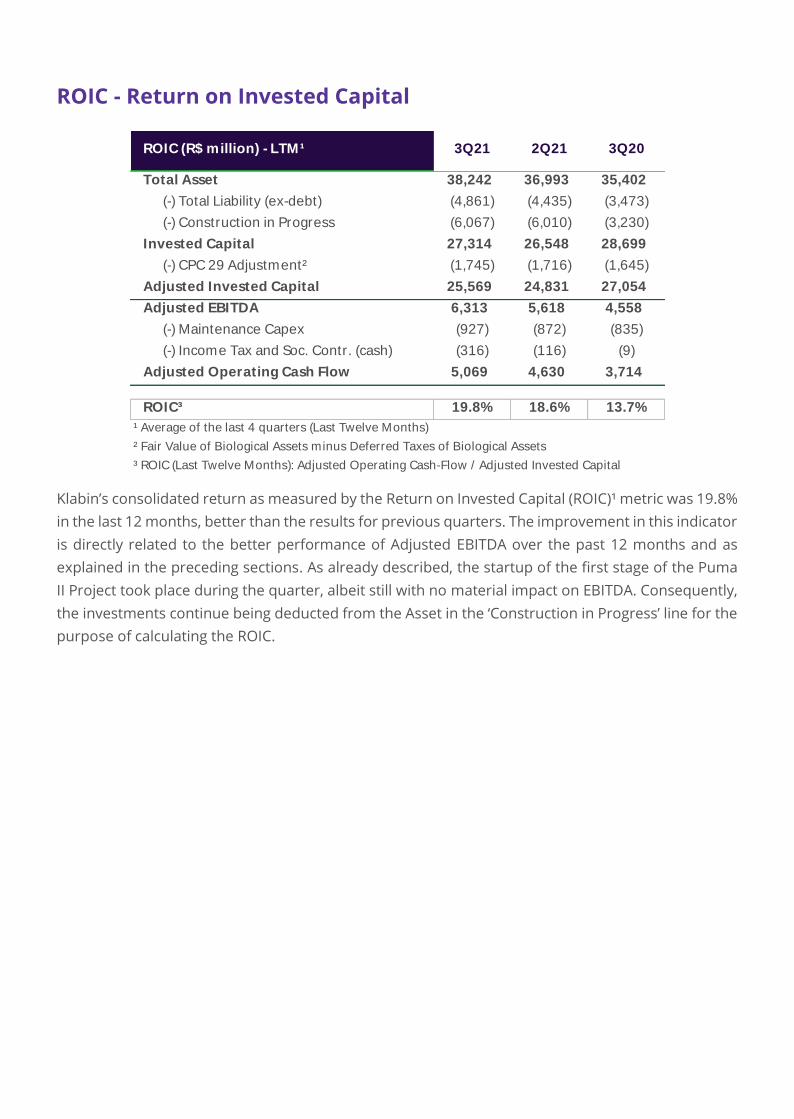
Klabin’s consolidated return as measured by the Return on Invested Capital (ROIC)¹ metric was 19.8%
in the last 12 months, better than the results for previous quarters. The improvement in this indicator
is directly related to the better performance of Adjusted EBITDA over the past 12 months and as
explained in the preceding sections. As already described, the startup of the first stage of the Puma
II Project took place during the quarter, albeit still with no material impact on EBITDA. Consequently,
the investments continue being deducted from the Asset in the ‘Construction in Progress’ line for the
purpose of calculating the ROIC.
Total Asset 38,242 36,993 35,402
(-) Total Liability (ex-debt) (4,861) (4,435) (3,473)
(-) Construction in Progress (6,067) (6,010) (3,230)
Invested Capital 27,314 26,548 28,699
(-) CPC 29 Adjustment² (1,745) (1,716) (1,645)
Adjusted Invested Capital 25,569 24,831 27,054
Adjusted EBITDA 6,313 5,618 4,558
(-) Maintenance Capex (927) (872) (835)
(-) Income Tax and Soc. Contr. (cash) (316) (116) (9)
Adjusted Operating Cash Flow 5,069 4,630 3,714
ROIC³ 19.8% 18.6% 13.7%
¹ Average of the last 4 quarters (Last Twelve Months)
² Fair Value of Biological Assets minus Deferred Taxes of Biological Assets
³ ROIC (Last Twelve Months): Adjusted Operating Cash-Flow / Adjusted Invested Capital
ROIC (R$ million) - LTM¹ 3Q21 2Q21 3Q20
Business Performance
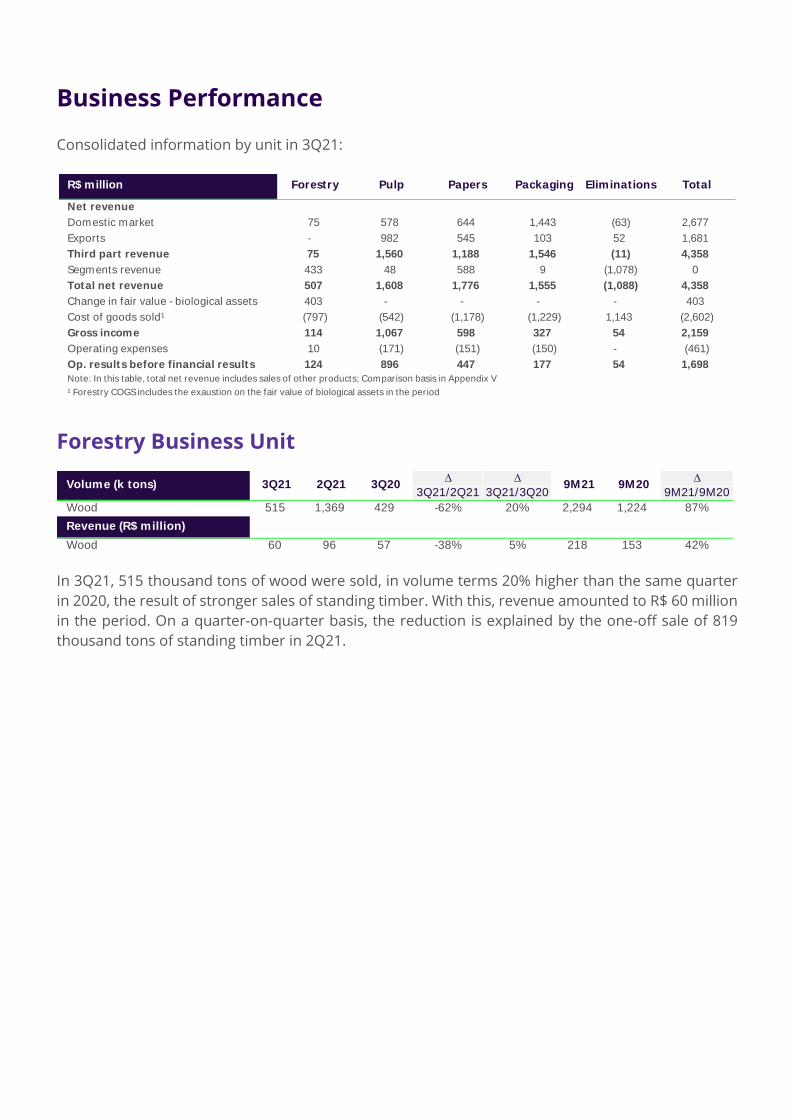
Consolidated information by unit in 3Q21:
Forestry Business Unit
In 3Q21, 515 thousand tons of wood were sold, in volume terms 20% higher than the same quarter
in 2020, the result of stronger sales of standing timber. With this, revenue amounted to R$ 60 million
in the period. On a quarter-on-quarter basis, the reduction is explained by the one-off sale of 819
thousand tons of standing timber in 2Q21.
Net revenue
Domestic market 75 578 644 1,443 (63) 2,677
Exports - 982 545 103 52 1,681
Third part revenue 75 1,560 1,188 1,546 (11) 4,358
Segments revenue 433 48 588 9 (1,078) 0
Total net revenue 507 1,608 1,776 1,555 (1,088) 4,358
Change in fair value - biological assets 403 - - - - 403
Cost of goods sold¹ (797) (542) (1,178) (1,229) 1,143 (2,602)
Gross income 114 1,067 598 327 54 2,159
Operating expenses 10 (171) (151) (150) - (461)
Op. results before financial results 124 896 447 177 54 1,698
Note: In this table, total net revenue includes sales of other products; Comparison basis in Appendix V
¹ Forestry COGS includes the exaustion on the fair value of biological assets in the period
R$ million Forestry Papers PackagingPulp TotalEliminations
∆ ∆ ∆
3Q21/2Q21 3Q21/3Q20 9M21/9M20
Wood 515 1,369 429 -62% 20% 2,294 1,224 87%
Revenue (R$ million)
Wood 60 96 57 -38% 5% 218 153 42%
3Q202Q21 9M21 9M203Q21Volume (k tons)
Pulp Business Unit
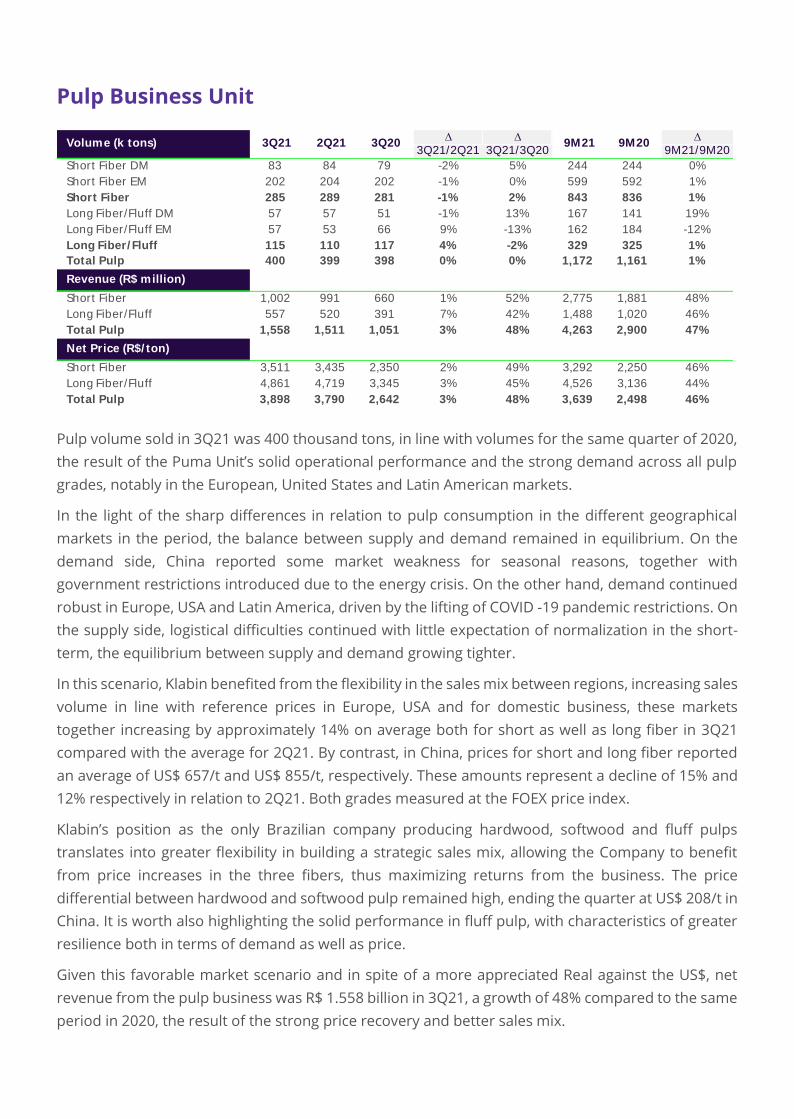
Pulp volume sold in 3Q21 was 400 thousand tons, in line with volumes for the same quarter of 2020,
the result of the Puma Unit’s solid operational performance and the strong demand across all pulp
grades, notably in the European, United States and Latin American markets.
In the light of the sharp differences in relation to pulp consumption in the different geographical
markets in the period, the balance between supply and demand remained in equilibrium. On the
demand side, China reported some market weakness for seasonal reasons, together with
government restrictions introduced due to the energy crisis. On the other hand, demand continued
robust in Europe, USA and Latin America, driven by the lifting of COVID -19 pandemic restrictions. On
the supply side, logistical difficulties continued with little expectation of normalization in the short-
term, the equilibrium between supply and demand growing tighter.
In this scenario, Klabin benefited from the flexibility in the sales mix between regions, increasing sales
volume in line with reference prices in Europe, USA and for domestic business, these markets
together increasing by approximately 14% on average both for short as well as long fiber in 3Q21
compared with the average for 2Q21. By contrast, in China, prices for short and long fiber reported
an average of US$ 657/t and US$ 855/t, respectively. These amounts represent a decline of 15% and
12% respectively in relation to 2Q21. Both grades measured at the FOEX price index.
Klabin’s position as the only Brazilian company producing hardwood, softwood and fluff pulps
translates into greater flexibility in building a strategic sales mix, allowing the Company to benefit
from price increases in the three fibers, thus maximizing returns from the business. The price
differential between hardwood and softwood pulp remained high, ending the quarter at US$ 208/t in
China. It is worth also highlighting the solid performance in fluff pulp, with characteristics of greater
resilience both in terms of demand as well as price.
Given this favorable market scenario and in spite of a more appreciated Real against the US$, net
revenue from the pulp business was R$ 1.558 billion in 3Q21, a growth of 48% compared to the same
period in 2020, the result of the strong price recovery and better sales mix.
∆ ∆ ∆3Q21/2Q21 3Q21/3Q20 9M21/9M20
Short Fiber DM 83 84 79 -2% 5% 244 244 0%
Short Fiber EM 202 204 202 -1% 0% 599 592 1%
Short Fiber 285 289 281 -1% 2% 843 836 1%
Long Fiber/Fluff DM 57 57 51 -1% 13% 167 141 19%
Long Fiber/Fluff EM 57 53 66 9% -13% 162 184 -12%
Long Fiber/ Fluff 115 110 117 4% -2% 329 325 1%
Total Pulp 400 399 398 0% 0% 1,172 1,161 1%
Revenue (R$ million)
Short Fiber 1,002 991 660 1% 52% 2,775 1,881 48%
Long Fiber/Fluff 557 520 391 7% 42% 1,488 1,020 46%
Total Pulp 1,558 1,511 1,051 3% 48% 4,263 2,900 47%
Net Price (R$/ ton)
Short Fiber 3,511 3,435 2,350 2% 49% 3,292 2,250 46%
Long Fiber/Fluff 4,861 4,719 3,345 3% 45% 4,526 3,136 44%
Total Pulp 3,898 3,790 2,642 3% 48% 3,639 2,498 46%
Volume (k tons) 3Q21 2Q21 3Q20 9M21 9M20
Paper Business Unit
Kraftliner
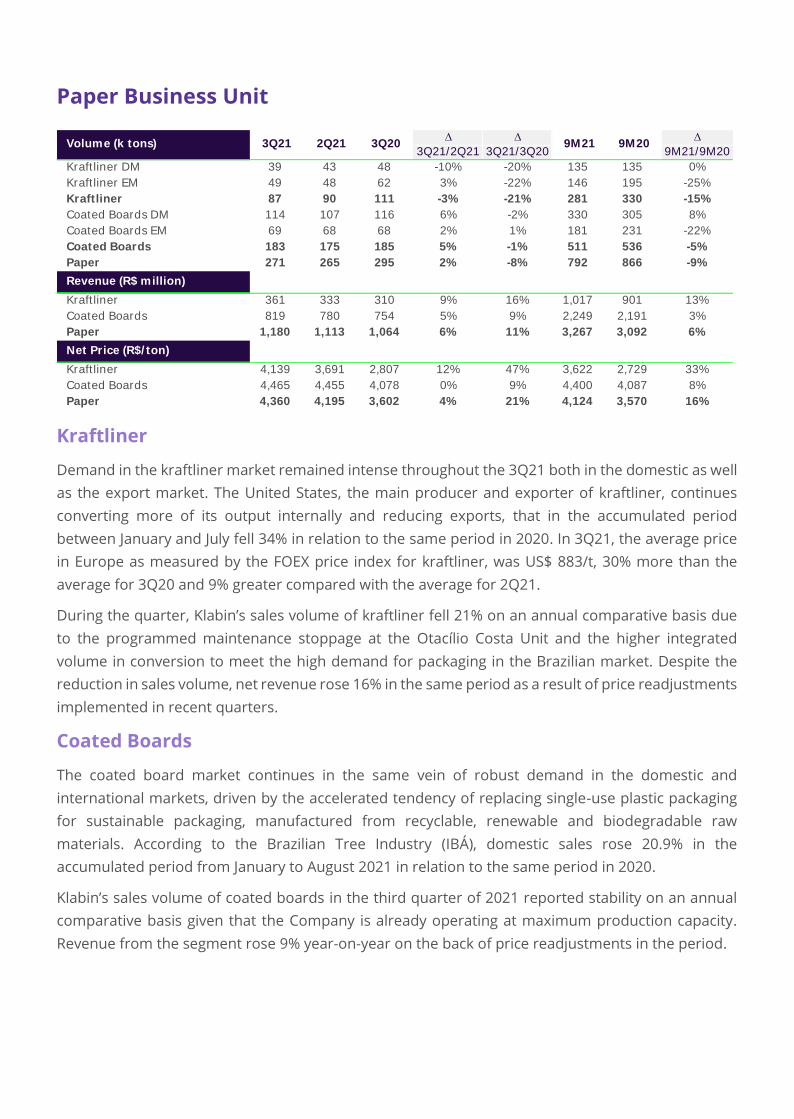
Demand in the kraftliner market remained intense throughout the 3Q21 both in the domestic as well
as the export market. The United States, the main producer and exporter of kraftliner, continues
converting more of its output internally and reducing exports, that in the accumulated period
between January and July fell 34% in relation to the same period in 2020. In 3Q21, the average price
in Europe as measured by the FOEX price index for kraftliner, was US$ 883/t, 30% more than the
average for 3Q20 and 9% greater compared with the average for 2Q21.
During the quarter, Klabin’s sales volume of kraftliner fell 21% on an annual comparative basis due
to the programmed maintenance stoppage at the Otacílio Costa Unit and the higher integrated
volume in conversion to meet the high demand for packaging in the Brazilian market. Despite the
reduction in sales volume, net revenue rose 16% in the same period as a result of price readjustments
implemented in recent quarters.
Coated Boards
The coated board market continues in the same vein of robust demand in the domestic and
international markets, driven by the accelerated tendency of replacing single-use plastic packaging
for sustainable packaging, manufactured from recyclable, renewable and biodegradable raw
materials. According to the Brazilian Tree Industry (IBÁ), domestic sales rose 20.9% in the
accumulated period from January to August 2021 in relation to the same period in 2020.
Klabin’s sales volume of coated boards in the third quarter of 2021 reported stability on an annual
comparative basis given that the Company is already operating at maximum production capacity.
Revenue from the segment rose 9% year-on-year on the back of price readjustments in the period.
∆ ∆ ∆
3Q21/2Q21 3Q21/3Q20 9M21/9M20
Kraft liner DM 39 43 48 -10% -20% 135 135 0%
Kraft liner EM 49 48 62 3% -22% 146 195 -25%
Kraftliner 87 90 111 -3% -21% 281 330 -15%
Coated Boards DM 114 107 116 6% -2% 330 305 8%
Coated Boards EM 69 68 68 2% 1% 181 231 -22%
Coated Boards 183 175 185 5% -1% 511 536 -5%
Paper 271 265 295 2% -8% 792 866 -9%
Revenue (R$ million)
Kraft liner 361 333 310 9% 16% 1,017 901 13%
Coated Boards 819 780 754 5% 9% 2,249 2,191 3%
Paper 1,180 1,113 1,064 6% 11% 3,267 3,092 6%
Net Price (R$/ ton)
Kraft liner 4,139 3,691 2,807 12% 47% 3,622 2,729 33%
Coated Boards 4,465 4,455 4,078 0% 9% 4,400 4,087 8%
Paper 4,360 4,195 3,602 4% 21% 4,124 3,570 16%
2Q21 3Q20Volume (k tons) 3Q21 9M21 9M20
Packaging Business Unit
Corrugated Boxes
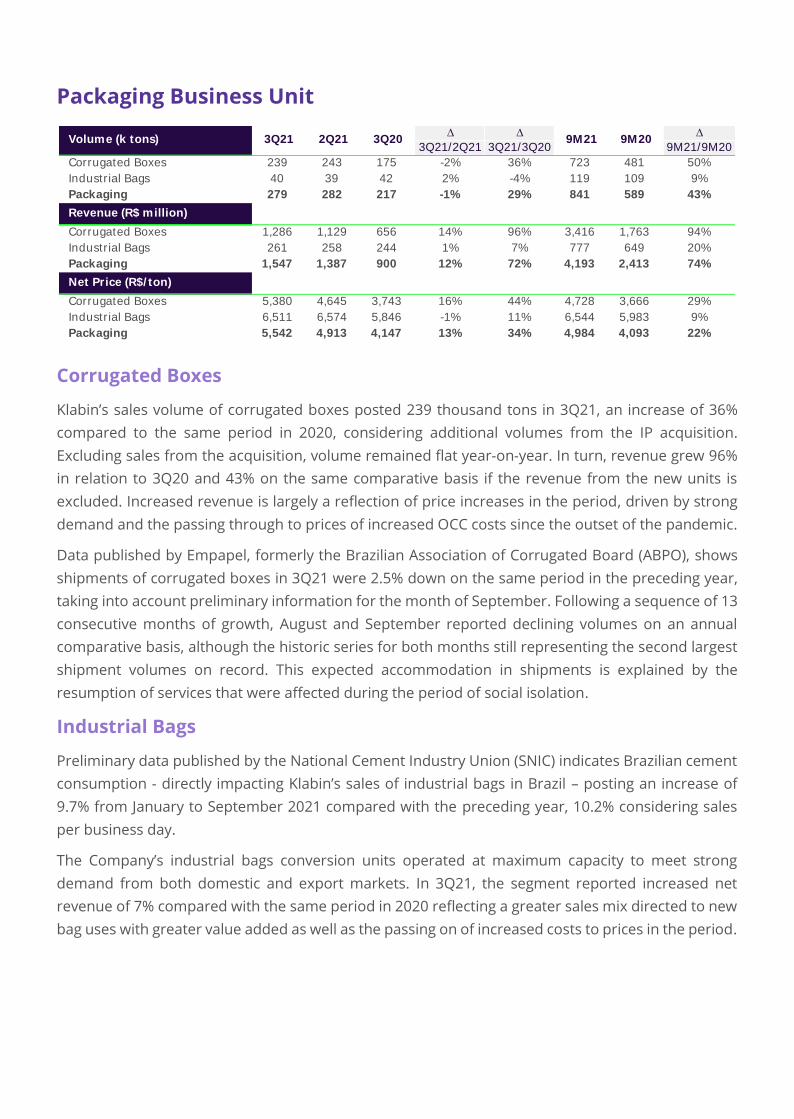
Klabin’s sales volume of corrugated boxes posted 239 thousand tons in 3Q21, an increase of 36%
compared to the same period in 2020, considering additional volumes from the IP acquisition.
Excluding sales from the acquisition, volume remained flat year-on-year. In turn, revenue grew 96%
in relation to 3Q20 and 43% on the same comparative basis if the revenue from the new units is
excluded. Increased revenue is largely a reflection of price increases in the period, driven by strong
demand and the passing through to prices of increased OCC costs since the outset of the pandemic.
Data published by Empapel, formerly the Brazilian Association of Corrugated Board (ABPO), shows
shipments of corrugated boxes in 3Q21 were 2.5% down on the same period in the preceding year,
taking into account preliminary information for the month of September. Following a sequence of 13
consecutive months of growth, August and September reported declining volumes on an annual
comparative basis, although the historic series for both months still representing the second largest
shipment volumes on record. This expected accommodation in shipments is explained by the
resumption of services that were affected during the period of social isolation.
Industrial Bags
Preliminary data published by the National Cement Industry Union (SNIC) indicates Brazilian cement
consumption - directly impacting Klabin’s sales of industrial bags in Brazil – posting an increase of
9.7% from January to September 2021 compared with the preceding year, 10.2% considering sales
per business day.
The Company’s industrial bags conversion units operated at maximum capacity to meet strong
demand from both domestic and export markets. In 3Q21, the segment reported increased net
revenue of 7% compared with the same period in 2020 reflecting a greater sales mix directed to new
bag uses with greater value added as well as the passing on of increased costs to prices in the period.
∆ ∆ ∆
3Q21/2Q21 3Q21/3Q20 9M21/9M20
Corrugated Boxes 239 243 175 -2% 36% 723 481 50%
Industrial Bags 40 39 42 2% -4% 119 109 9%
Packaging 279 282 217 -1% 29% 841 589 43%
Revenue (R$ million)
Corrugated Boxes 1,286 1,129 656 14% 96% 3,416 1,763 94%
Industrial Bags 261 258 244 1% 7% 777 649 20%
Packaging 1,547 1,387 900 12% 72% 4,193 2,413 74%
Net Price (R$/ ton)
Corrugated Boxes 5,380 4,645 3,743 16% 44% 4,728 3,666 29%
Industrial Bags 6,511 6,574 5,846 -1% 11% 6,544 5,983 9%
Packaging 5,542 4,913 4,147 13% 34% 4,984 4,093 22%
3Q20Volume (k tons) 3Q21 2Q21 9M21 9M20
Capital Markets
Equity Income
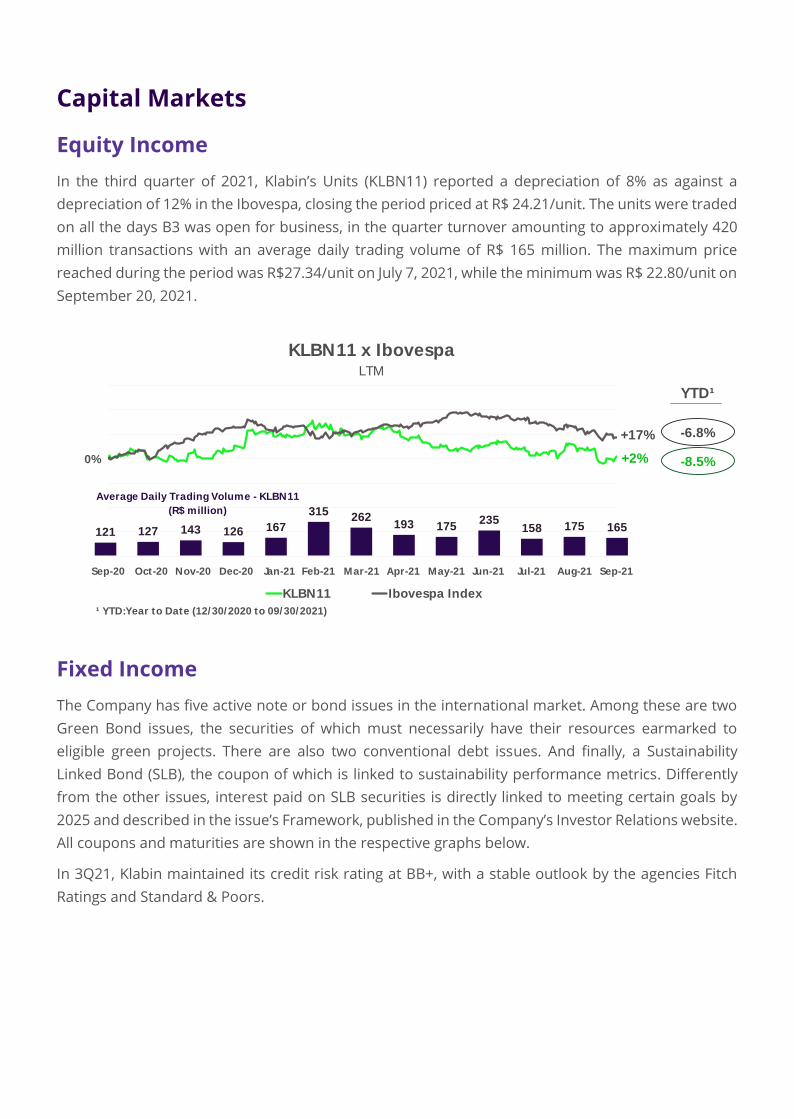
In the third quarter of 2021, Klabin’s Units (KLBN11) reported a depreciation of 8% as against a
depreciation of 12% in the Ibovespa, closing the period priced at R$ 24.21/unit. The units were traded
on all the days B3 was open for business, in the quarter turnover amounting to approximately 420
million transactions with an average daily trading volume of R$ 165 million. The maximum price
reached during the period was R$27.34/unit on July 7, 2021, while the minimum was R$ 22.80/unit on
September 20, 2021.
Fixed Income
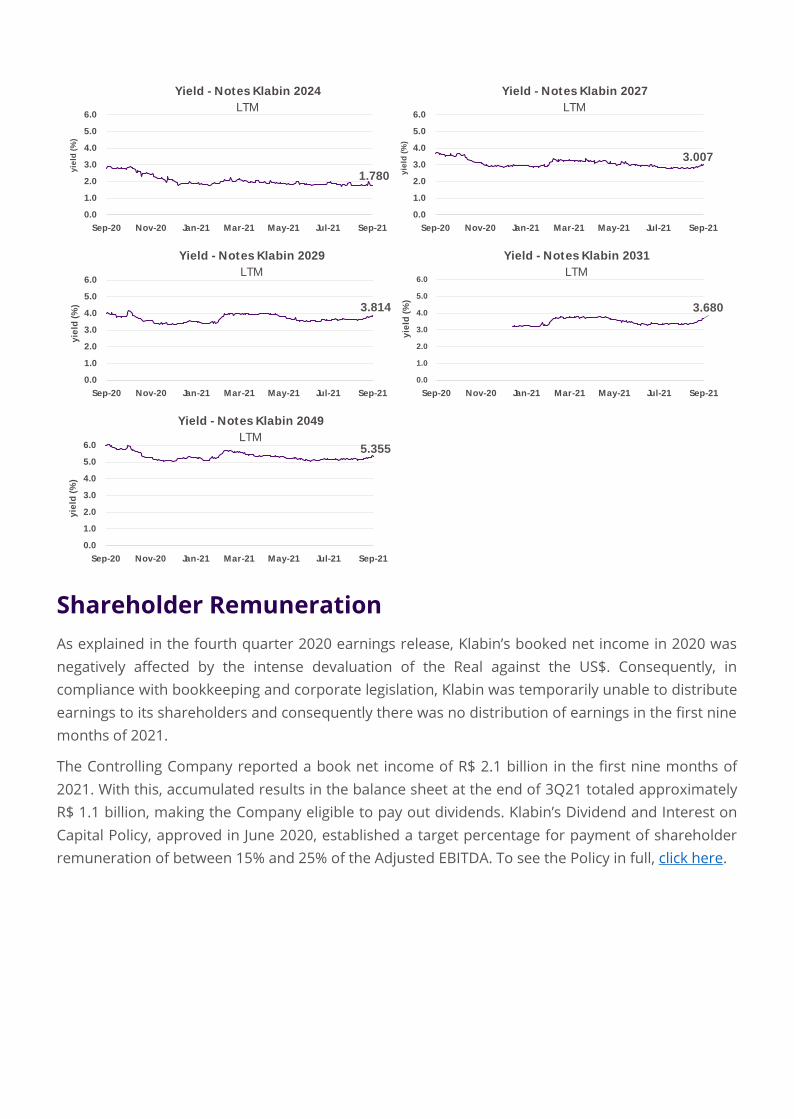
The Company has five active note or bond issues in the international market. Among these are two
Green Bond issues, the securities of which must necessarily have their resources earmarked to
eligible green projects. There are also two conventional debt issues. And finally, a Sustainability
Linked Bond (SLB), the coupon of which is linked to sustainability performance metrics. Differently
from the other issues, interest paid on SLB securities is directly linked to meeting certain goals by
2025 and described in the issue’s Framework, published in the Company’s Investor Relations website.
All coupons and maturities are shown in the respective graphs below.
In 3Q21, Klabin maintained its credit risk rating at BB+, with a stable outlook by the agencies Fitch
Ratings and Standard & Poors.
Sep-20 Oct-20 Nov-20 Dec-20 Jan-21 Feb-21 Mar-21 Apr-21 May-21 Jun-21 Jul-21 Aug-21 Sep-21
KLBN11 x IbovespaLTM
KLBN11 Ibovespa Index
+17%
+2%0%
¹ YTD:Year to Date (12/30/2020 to 09/30/2021)
121 127 143 126 167
315262
193 175235
158 175 165
Average Daily Trading Volume - KLBN11
(R$ million)
-8.5%
YTD¹
-6.8%
Shareholder Remuneration
As explained in the fourth quarter 2020 earnings release, Klabin’s booked net income in 2020 was
negatively affected by the intense devaluation of the Real against the US$. Consequently, in
compliance with bookkeeping and corporate legislation, Klabin was temporarily unable to distribute
earnings to its shareholders and consequently there was no distribution of earnings in the first nine
months of 2021.
The Controlling Company reported a book net income of R$ 2.1 billion in the first nine months of
2021. With this, accumulated results in the balance sheet at the end of 3Q21 totaled approximately
R$ 1.1 billion, making the Company eligible to pay out dividends. Klabin’s Dividend and Interest on
Capital Policy, approved in June 2020, established a target percentage for payment of shareholder
remuneration of between 15% and 25% of the Adjusted EBITDA. To see the Policy in full, click here.
3.814
0.0
1.0
2.0
3.0
4.0
5.0
6.0
Sep-20 Nov-20 Jan-21 Mar-21 May-21 Jul-21 Sep-21
yie
ld (
%)
Yield - Notes Klabin 2029
LTM
3.007
0.0
1.0
2.0
3.0
4.0
5.0
6.0
Sep-20 Nov-20 Jan-21 Mar-21 May-21 Jul-21 Sep-21
yie
ld (
%)
Yield - Notes Klabin 2027
LTM
3.680
0.0
1.0
2.0
3.0
4.0
5.0
6.0
Sep-20 Nov-20 Jan-21 Mar-21 May-21 Jul-21 Sep-21
yie
ld (
%)
Yield - Notes Klabin 2031
LTM
1.780
0.0
1.0
2.0
3.0
4.0
5.0
6.0
Sep-20 Nov-20 Jan-21 Mar-21 May-21 Jul-21 Sep-21
yie
ld (
%)
Yield - Notes Klabin 2024
LTM
5.355
0.0
1.0
2.0
3.0
4.0
5.0
6.0
Sep-20 Nov-20 Jan-21 Mar-21 May-21 Jul-21 Sep-21
yie
ld (
%)
Yield - Notes Klabin 2049
LTM

Subsequent Events
Revolving Credit Facility Agreement
Pursuant to the Notice to the Market published on October 7, 2021, the Company contracted a
Revolving Credit Facility worth US$ 500 million, characterized as Sustainability-Linked. The cost of this
facility is conditional on the annual performance of the environmental indicator relative to the
increased reutilization of solid industrial waste. To access the Notice, please click here.
Green Bonds Report
On October 20, 2021, according to the Notice the Market released, Klabin published its annual Green
Bonds Report. In this report, Klabin accounts for the use of resources raised under the Green Bonds
in the period from July 2020 and June 2021. To access the Report, please click here.
(A free translation of the original in Portuguese)
KLABIN S.A.
All amounts in thousands of Reais
Klabin S.A.
Quarterly Information (ITR) at September 30, 2021
(A free translation of the original in Portuguese)
KLABIN S.A.
All amounts in thousands of Reais
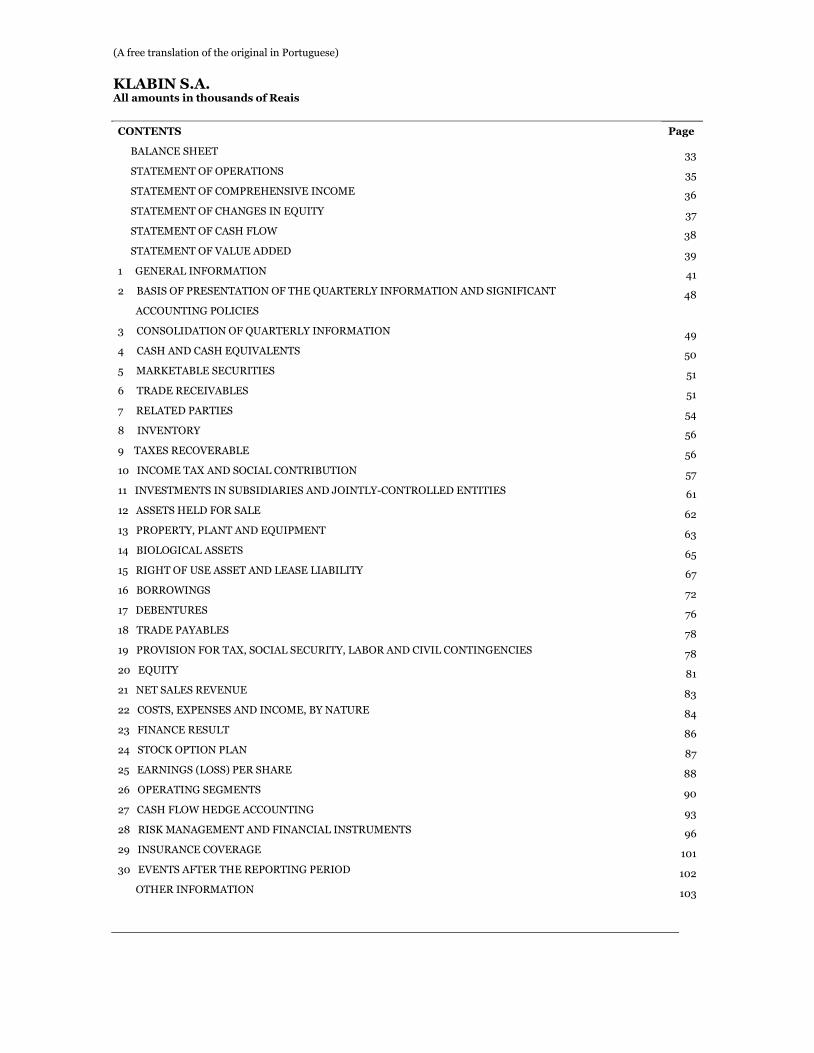
CONTENTS Page
BALANCE SHEET 33
STATEMENT OF OPERATIONS 35
STATEMENT OF COMPREHENSIVE INCOME 36
STATEMENT OF CHANGES IN EQUITY 37
STATEMENT OF CASH FLOW 38
STATEMENT OF VALUE ADDED 39
1 GENERAL INFORMATION 41
2 BASIS OF PRESENTATION OF THE QUARTERLY INFORMATION AND SIGNIFICANT 48
ACCOUNTING POLICIES
3 CONSOLIDATION OF QUARTERLY INFORMATION 49
4 CASH AND CASH EQUIVALENTS 50
5 MARKETABLE SECURITIES 51
6 TRADE RECEIVABLES 51
7 RELATED PARTIES 54
8 INVENTORY 56
9 TAXES RECOVERABLE 56
10 INCOME TAX AND SOCIAL CONTRIBUTION 57
11 INVESTMENTS IN SUBSIDIARIES AND JOINTLY-CONTROLLED ENTITIES 61
12 ASSETS HELD FOR SALE 62
13 PROPERTY, PLANT AND EQUIPMENT 63
14 BIOLOGICAL ASSETS 65
15 RIGHT OF USE ASSET AND LEASE LIABILITY 67
16 BORROWINGS 72
17 DEBENTURES 76
18 TRADE PAYABLES 78
19 PROVISION FOR TAX, SOCIAL SECURITY, LABOR AND CIVIL CONTINGENCIES 78
20 EQUITY 81
21 NET SALES REVENUE 83
22 COSTS, EXPENSES AND INCOME, BY NATURE 84
23 FINANCE RESULT 86
24 STOCK OPTION PLAN 87
25 EARNINGS (LOSS) PER SHARE 88
26 OPERATING SEGMENTS 90
27 CASH FLOW HEDGE ACCOUNTING 93
28 RISK MANAGEMENT AND FINANCIAL INSTRUMENTS 96
29 INSURANCE COVERAGE 101
30 EVENTS AFTER THE REPORTING PERIOD 102
OTHER INFORMATION 103
(A free translation of the original in Portuguese)
KLABIN S.A.
All amounts in thousands of Reais
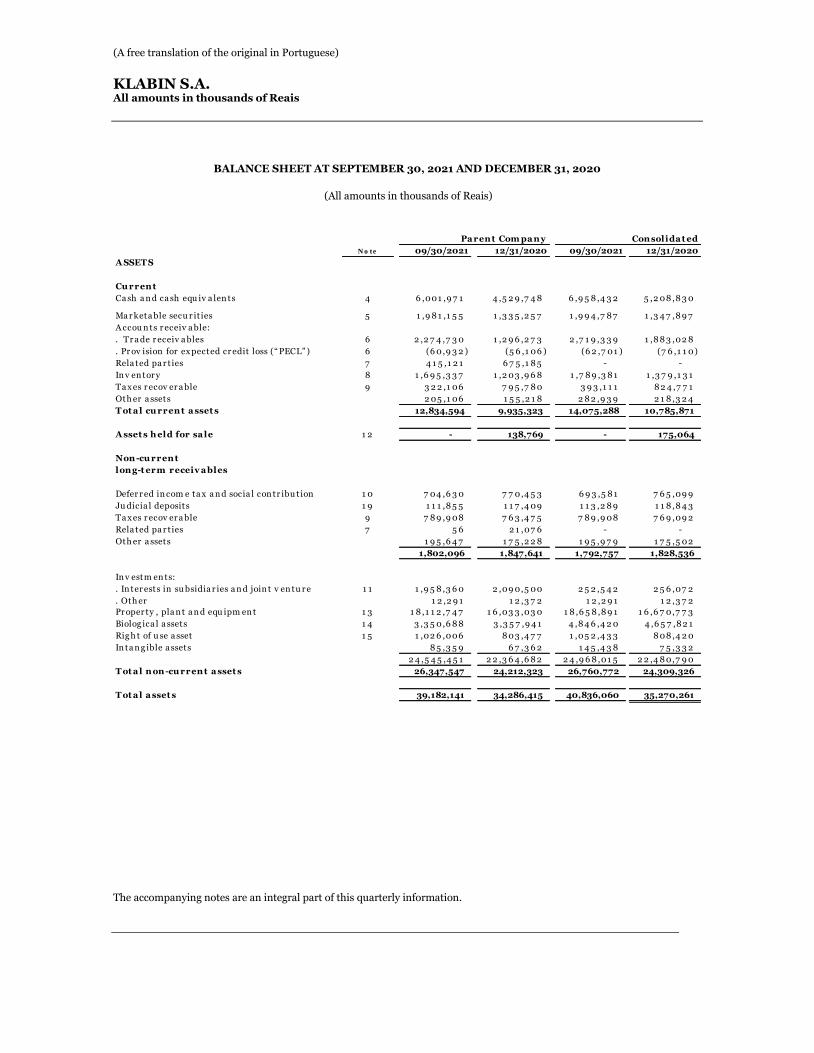
BALANCE SHEET AT SEPTEMBER 30, 2021 AND DECEMBER 31, 2020
(All amounts in thousands of Reais)
The accompanying notes are an integral part of this quarterly information.
N o te 09/30/2021 12/31/2020 09/30/2021 12/31/2020
A SSET S
Cu rrent
Ca sh a n d ca sh equ iv a len ts 4 6 ,001 ,9 7 1 4 ,5 2 9 ,7 4 8 6 ,9 5 8 ,4 3 2 5 ,2 08 ,8 3 0
Ma r keta ble secu r it ies 5 1 ,9 8 1 ,1 5 5 1 ,3 3 5 ,2 5 7 1 ,9 9 4 ,7 8 7 1 ,3 4 7 ,8 9 7
A ccou n ts r eceiv a ble:
. Tr a de r eceiv a bles 6 2 ,2 7 4 ,7 3 0 1 ,2 9 6 ,2 7 3 2 ,7 1 9 ,3 3 9 1 ,8 8 3 ,02 8
. Pr ov ision for ex pected cr edit loss (“ PECL” ) 6 (6 0,9 3 2 ) (5 6 ,1 06 ) (6 2 ,7 01 ) (7 6 ,1 1 0)
Rela ted pa r t ies 7 4 1 5 ,1 2 1 6 7 5 ,1 8 5 - -
In v en tor y 8 1 ,6 9 5 ,3 3 7 1 ,2 03 ,9 6 8 1 ,7 8 9 ,3 8 1 1 ,3 7 9 ,1 3 1
Ta x es r ecov er a ble 9 3 2 2 ,1 06 7 9 5 ,7 8 0 3 9 3 ,1 1 1 8 2 4 ,7 7 1
Oth er a ssets 2 05 ,1 06 1 5 5 ,2 1 8 2 8 2 ,9 3 9 2 1 8 ,3 2 4
T ot a l cu rrent a sset s 12,834,594 9,935,323 14,075,288 10,785,871
A sset s h eld for sa le 1 2 - 138,769 - 175,064
Non-cu rrent
long-t erm receiv a bles
Defer r ed in com e ta x a n d socia l con tr ibu tion 1 0 7 04 ,6 3 0 7 7 0,4 5 3 6 9 3 ,5 8 1 7 6 5 ,09 9
Ju dicia l deposits 1 9 1 1 1 ,8 5 5 1 1 7 ,4 09 1 1 3 ,2 8 9 1 1 8 ,8 4 3
Ta x es r ecov er a ble 9 7 8 9 ,9 08 7 6 3 ,4 7 5 7 8 9 ,9 08 7 6 9 ,09 2
Rela ted pa r t ies 7 5 6 2 1 ,07 6 - -
Oth er a ssets 1 9 5 ,6 4 7 1 7 5 ,2 2 8 1 9 5 ,9 7 9 1 7 5 ,5 02
1,802,096 1,847,641 1,792,757 1,828,536
In v estm en ts:
. In ter ests in su bsidia r ies a n d join t v en tu r e 1 1 1 ,9 5 8 ,3 6 0 2 ,09 0,5 00 2 5 2 ,5 4 2 2 5 6 ,07 2
. Oth er 1 2 ,2 9 1 1 2 ,3 7 2 1 2 ,2 9 1 1 2 ,3 7 2
Pr oper ty , pla n t a n d equ ipm en t 1 3 1 8 ,1 1 2 ,7 4 7 1 6 ,03 3 ,03 0 1 8 ,6 5 8 ,8 9 1 1 6 ,6 7 0,7 7 3
Biolog ica l a ssets 1 4 3 ,3 5 0,6 8 8 3 ,3 5 7 ,9 4 1 4 ,8 4 6 ,4 2 0 4 ,6 5 7 ,8 2 1
Rig h t of u se a sset 1 5 1 ,02 6 ,006 8 03 ,4 7 7 1 ,05 2 ,4 3 3 8 08 ,4 2 0
In ta n g ible a ssets 8 5 ,3 5 9 6 7 ,3 6 2 1 4 5 ,4 3 8 7 5 ,3 3 2
2 4 ,5 4 5 ,4 5 1 2 2 ,3 6 4 ,6 8 2 2 4 ,9 6 8 ,01 5 2 2 ,4 8 0,7 9 0
T ot a l non-cu rrent a sset s 26,347,547 24,212,323 26,760,772 24,309,326
T ot a l a sset s 39,182,141 34,286,415 40,836,060 35,270,261
Pa rent Com pa ny Consolida t ed
(A free translation of the original in Portuguese)
KLABIN S.A.
All amounts in thousands of Reais
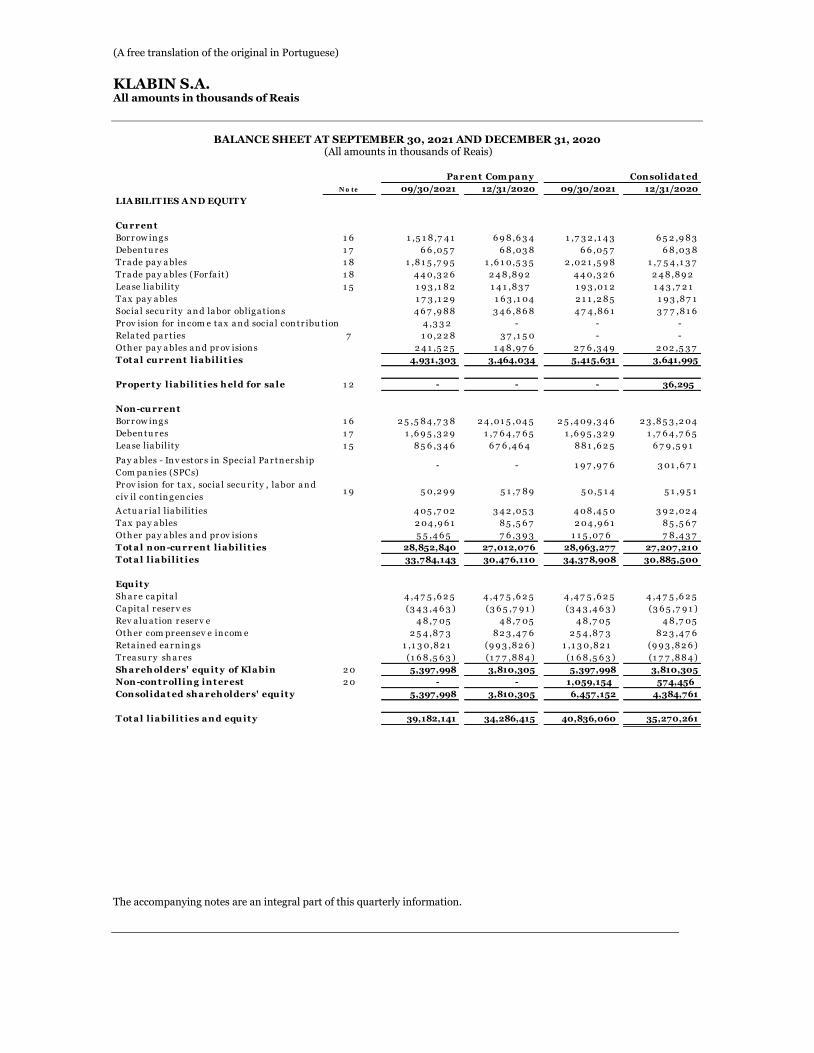
BALANCE SHEET AT SEPTEMBER 30, 2021 AND DECEMBER 31, 2020
(All amounts in thousands of Reais)
The accompanying notes are an integral part of this quarterly information.
N o te 09/30/2021 12/31/2020 09/30/2021 12/31/2020
LIA BILIT IES A ND EQUIT Y
Cu rrent
Bor r ow in g s 1 6 1 ,5 1 8 ,7 4 1 6 9 8 ,6 3 4 1 ,7 3 2 ,1 4 3 6 5 2 ,9 8 3
Deben tu r es 1 7 6 6 ,05 7 6 8 ,03 8 6 6 ,05 7 6 8 ,03 8
Tr a de pa y a bles 1 8 1 ,8 1 5 ,7 9 5 1 ,6 1 0,5 3 5 2 ,02 1 ,5 9 8 1 ,7 5 4 ,1 3 7
Tr a de pa y a bles (For fa it) 1 8 4 4 0,3 2 6 2 4 8 ,8 9 2 4 4 0,3 2 6 2 4 8 ,8 9 2
Lea se lia bility 1 5 1 9 3 ,1 8 2 1 4 1 ,8 3 7 1 9 3 ,01 2 1 4 3 ,7 2 1
Ta x pa y a bles 1 7 3 ,1 2 9 1 6 3 ,1 04 2 1 1 ,2 8 5 1 9 3 ,8 7 1
Socia l secu r ity a n d la bor oblig a t ion s 4 6 7 ,9 8 8 3 4 6 ,8 6 8 4 7 4 ,8 6 1 3 7 7 ,8 1 6
Pr ov ision for in com e ta x a n d socia l con tr ibu t ion 4 ,3 3 2 - - -
Rela ted pa r t ies 7 1 0,2 2 8 3 7 ,1 5 0 - -
Oth er pa y a bles a n d pr ov ision s 2 4 1 ,5 2 5 1 4 8 ,9 7 6 2 7 6 ,3 4 9 2 02 ,5 3 7
T ot a l cu rren t l ia bilit ies 4,931,303 3,464,034 5,415,631 3,641,995
Propert y l ia bilit ies h eld for sa le 1 2 - - - 36,295
Non -cu rrent
Bor r ow in g s 1 6 2 5 ,5 8 4 ,7 3 8 2 4 ,01 5 ,04 5 2 5 ,4 09 ,3 4 6 2 3 ,8 5 3 ,2 04
Deben tu r es 1 7 1 ,6 9 5 ,3 2 9 1 ,7 6 4 ,7 6 5 1 ,6 9 5 ,3 2 9 1 ,7 6 4 ,7 6 5
Lea se lia bility 1 5 8 5 6 ,3 4 6 6 7 6 ,4 6 4 8 8 1 ,6 2 5 6 7 9 ,5 9 1
Pa y a bles - In v estor s in Specia l Pa r tn er sh ip
Com pa n ies (SPCs)- - 1 9 7 ,9 7 6 3 01 ,6 7 1
A ctu a r ia l lia bilit ies 4 05 ,7 02 3 4 2 ,05 3 4 08 ,4 5 0 3 9 2 ,02 4
Ta x pa y a bles 2 04 ,9 6 1 8 5 ,5 6 7 2 04 ,9 6 1 8 5 ,5 6 7
Oth er pa y a bles a n d pr ov ision s 5 5 ,4 6 5 7 6 ,3 9 3 1 1 5 ,07 6 7 8 ,4 3 7
T ot a l non -cu rrent l ia bilit ies 28,852,840 27,012,076 28,963,277 27,207,210
T ot a l l ia bilit ies 33,784,143 30,476,110 34,378,908 30,885,500
Equ it y
Sh a r e ca pita l 4 ,4 7 5 ,6 2 5 4 ,4 7 5 ,6 2 5 4 ,4 7 5 ,6 2 5 4 ,4 7 5 ,6 2 5
Ca pita l r eser v es (3 4 3 ,4 6 3 ) (3 6 5 ,7 9 1 ) (3 4 3 ,4 6 3 ) (3 6 5 ,7 9 1 )
Rev a lu a t ion r eser v e 4 8 ,7 05 4 8 ,7 05 4 8 ,7 05 4 8 ,7 05
Oth er com pr een sev e in com e 2 5 4 ,8 7 3 8 2 3 ,4 7 6 2 5 4 ,8 7 3 8 2 3 ,4 7 6
Reta in ed ea r n in g s 1 ,1 3 0,8 2 1 (9 9 3 ,8 2 6 ) 1 ,1 3 0,8 2 1 (9 9 3 ,8 2 6 )
Tr ea su r y sh a r es (1 6 8 ,5 6 3 ) (1 7 7 ,8 8 4 ) (1 6 8 ,5 6 3 ) (1 7 7 ,8 8 4 )
Sh a reh olders' equ it y of Kla bin 2 0 5,397,998 3,810,305 5,397,998 3,810,305
Non -con t rolling in t erest 2 0 - - 1,059,154 574,456
Con solida t ed sh a reh olders' equ it y 5,397,998 3,810,305 6,457,152 4,384,761
T ot a l l ia bilit ies a nd equ it y 39,182,141 34,286,415 40,836,060 35,270,261
Pa rent Com pa ny Con solida t ed
Pr ov ision for ta x , socia l secu r ity , la bor a n d
civ il con t in g en cies5 1 ,9 5 15 0,5 1 45 1 ,7 8 95 0,2 9 91 9
(A free translation of the original in Portuguese)
KLABIN S.A.
All amounts in thousands of Reais
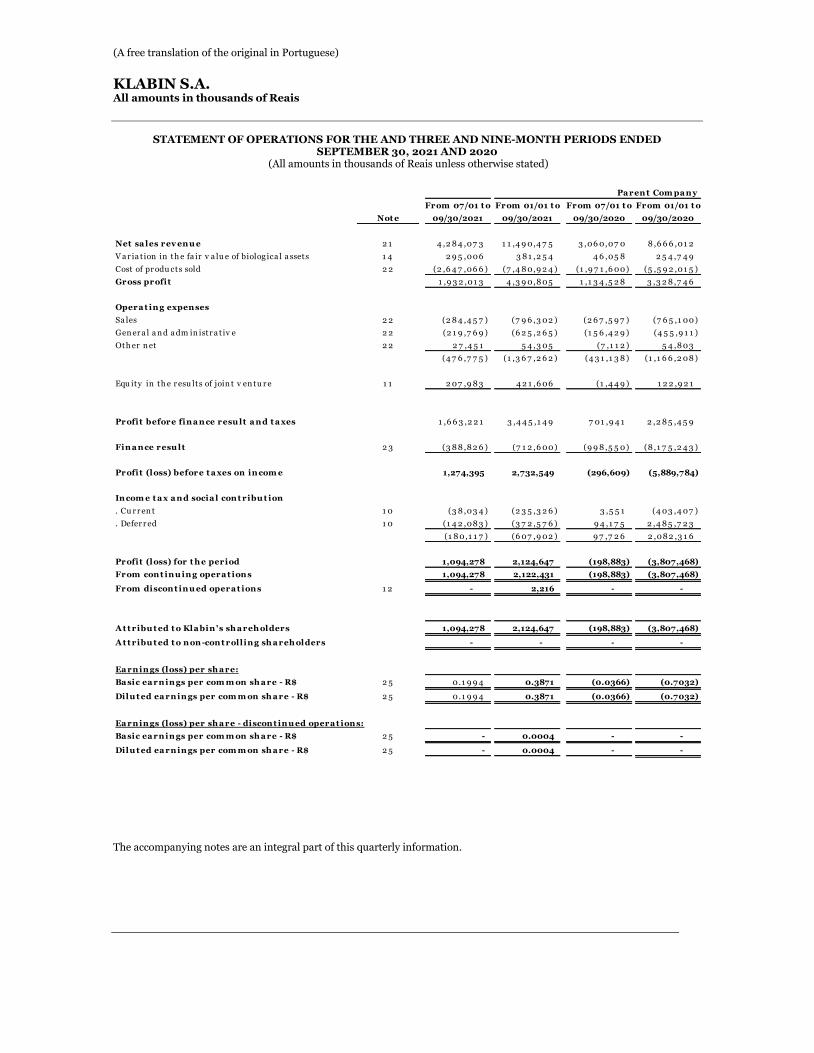
STATEMENT OF OPERATIONS FOR THE AND THREE AND NINE-MONTH PERIODS ENDED
SEPTEMBER 30, 2021 AND 2020 (All amounts in thousands of Reais unless otherwise stated)
The accompanying notes are an integral part of this quarterly information.
From 07/01 t o From 01/01 t o From 07/01 t o From 01/01 t o
Not e 09/30/2021 09/30/2021 09/30/2020 09/30/2020
Net sa les rev enu e 2 1 4 ,2 8 4 ,07 3 1 1 ,4 9 0,4 7 5 3 ,06 0,07 0 8 ,6 6 6 ,01 2
V a r ia t ion in th e fa ir v a lu e of biolog ica l a ssets 1 4 2 9 5 ,006 3 8 1 ,2 5 4 4 6 ,05 8 2 5 4 ,7 4 9
Cost of pr odu cts sold 2 2 (2 ,6 4 7 ,06 6 ) (7 ,4 8 0,9 2 4 ) (1 ,9 7 1 ,6 00) (5 ,5 9 2 ,01 5 )
Gross profit 1 ,9 3 2 ,01 3 4 ,3 9 0,8 05 1 ,1 3 4 ,5 2 8 3 ,3 2 8 ,7 4 6
Opera t ing expenses
Sa les 2 2 (2 8 4 ,4 5 7 ) (7 9 6 ,3 02 ) (2 6 7 ,5 9 7 ) (7 6 5 ,1 00)
Gen er a l a n d a dm in istr a t iv e 2 2 (2 1 9 ,7 6 9 ) (6 2 5 ,2 6 5 ) (1 5 6 ,4 2 9 ) (4 5 5 ,9 1 1 )
Oth er n et 2 2 2 7 ,4 5 1 5 4 ,3 05 (7 ,1 1 2 ) 5 4 ,8 03
(4 7 6 ,7 7 5 ) (1 ,3 6 7 ,2 6 2 ) (4 3 1 ,1 3 8 ) (1 ,1 6 6 ,2 08 )
Equ ity in th e r esu lts of join t v en tu r e 1 1 2 07 ,9 8 3 4 2 1 ,6 06 (1 ,4 4 9 ) 1 2 2 ,9 2 1
Profit before fina nce resu lt a nd t a xes 1 ,6 6 3 ,2 2 1 3 ,4 4 5 ,1 4 9 7 01 ,9 4 1 2 ,2 8 5 ,4 5 9
Fina nce resu lt 2 3 (3 8 8 ,8 2 6 ) (7 1 2 ,6 00) (9 9 8 ,5 5 0) (8 ,1 7 5 ,2 4 3 )
Profit (loss) before t a xes on incom e 1,274,395 2,732,549 (296,609) (5,889,784)
Incom e t a x a nd socia l con t ribu t ion
. Cu r r en t 1 0 (3 8 ,03 4 ) (2 3 5 ,3 2 6 ) 3 ,5 5 1 (4 03 ,4 07 )
. Defer r ed 1 0 (1 4 2 ,08 3 ) (3 7 2 ,5 7 6 ) 9 4 ,1 7 5 2 ,4 8 5 ,7 2 3
(1 8 0,1 1 7 ) (6 07 ,9 02 ) 9 7 ,7 2 6 2 ,08 2 ,3 1 6
Profit (loss) for t h e period 1,094,278 2,124,647 (198,883) (3,807,468)
From con t inu in g opera t ion s 1,094,278 2,122,431 (198,883) (3,807,468)
From discon t inu ed opera t ion s 1 2 - 2,216 - -
A t t ribu t ed t o Kla bin 's sh a reh olders 1,094,278 2,124,647 (198,883) (3,807,468)
A t t ribu t ed t o n on -con t rollin g sh a reh olders - - - -
Ea rn ings (loss) per sh a re:
Ba sic ea rnings per com m on sh a re - R$ 2 5 0.1 9 9 4 0.3871 (0.0366) (0.7032)
Dilu t ed ea rnings per com m on sh a re - R$ 2 5 0.1 9 9 4 0.3871 (0.0366) (0.7032)
Ea rn ings (loss) per sh a re - discon t inu ed opera t ion s:
Ba sic ea rnings per com m on sh a re - R$ 2 5 - 0.0004 - -
Dilu t ed ea rnings per com m on sh a re - R$ 2 5 - 0.0004 - -
Pa rent Com pa ny
(A free translation of the original in Portuguese)
KLABIN S.A.
All amounts in thousands of Reais
The accompanying notes are an integral part of this quarterly information.
From 07/01 t o From 01/01 t o From 07/01 t o From 01/01 t o
Not e 09/30/2021 09/30/2021 09/30/2020 09/30/2020
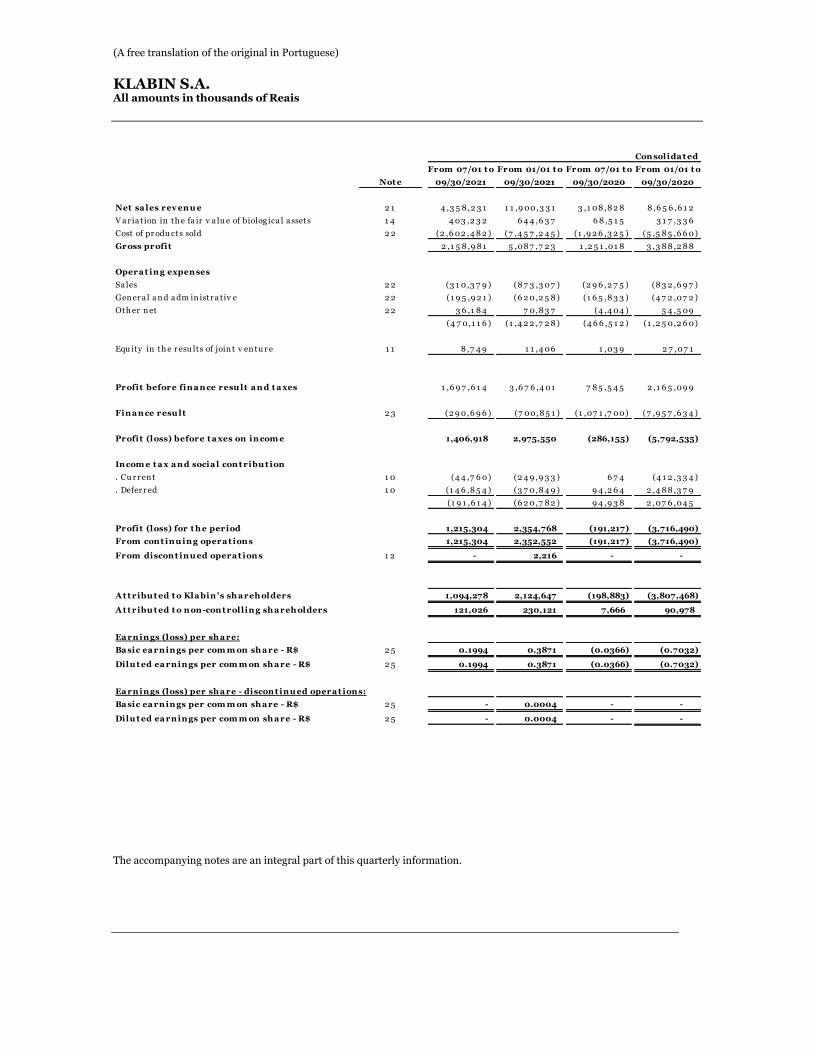
Net sa les rev enu e 2 1 4 ,3 5 8 ,2 3 1 1 1 ,9 00,3 3 1 3 ,1 08 ,8 2 8 8 ,6 5 6 ,6 1 2
V a r ia t ion in th e fa ir v a lu e of biolog ica l a ssets 1 4 4 03 ,2 3 2 6 4 4 ,6 3 7 6 8 ,5 1 5 3 1 7 ,3 3 6
Cost of pr odu cts sold 2 2 (2 ,6 02 ,4 8 2 ) (7 ,4 5 7 ,2 4 5 ) (1 ,9 2 6 ,3 2 5 ) (5 ,5 8 5 ,6 6 0)
Gross profit 2 ,1 5 8 ,9 8 1 5 ,08 7 ,7 2 3 1 ,2 5 1 ,01 8 3 ,3 8 8 ,2 8 8
Opera t ing expenses
Sa les 2 2 (3 1 0,3 7 9 ) (8 7 3 ,3 07 ) (2 9 6 ,2 7 5 ) (8 3 2 ,6 9 7 )
Gen er a l a n d a dm in istr a t iv e 2 2 (1 9 5 ,9 2 1 ) (6 2 0,2 5 8 ) (1 6 5 ,8 3 3 ) (4 7 2 ,07 2 )
Oth er n et 2 2 3 6 ,1 8 4 7 0,8 3 7 (4 ,4 04 ) 5 4 ,5 09
(4 7 0,1 1 6 ) (1 ,4 2 2 ,7 2 8 ) (4 6 6 ,5 1 2 ) (1 ,2 5 0,2 6 0)
Equ ity in th e r esu lts of join t v en tu r e 1 1 8 ,7 4 9 1 1 ,4 06 1 ,03 9 2 7 ,07 1
Profit before fina nce resu lt a nd t a xes 1 ,6 9 7 ,6 1 4 3 ,6 7 6 ,4 01 7 8 5 ,5 4 5 2 ,1 6 5 ,09 9
Fina nce resu lt 2 3 (2 9 0,6 9 6 ) (7 00,8 5 1 ) (1 ,07 1 ,7 00) (7 ,9 5 7 ,6 3 4 )
Profit (loss) before t a xes on incom e 1,406,918 2,975,550 (286,155) (5,792,535)
Incom e t a x a nd socia l con t ribu t ion
. Cu r r en t 1 0 (4 4 ,7 6 0) (2 4 9 ,9 3 3 ) 6 7 4 (4 1 2 ,3 3 4 )
. Defer r ed 1 0 (1 4 6 ,8 5 4 ) (3 7 0,8 4 9 ) 9 4 ,2 6 4 2 ,4 8 8 ,3 7 9
(1 9 1 ,6 1 4 ) (6 2 0,7 8 2 ) 9 4 ,9 3 8 2 ,07 6 ,04 5
Profit (loss) for t h e period 1,215,304 2,354,768 (191,217) (3,716,490)
From con t inu ing opera t ion s 1,215,304 2,352,552 (191,217) (3,716,490)
From discon t inu ed opera t ion s 1 2 - 2,216 - -
A t t ribu t ed t o Kla bin's sh a reh olders 1,094,278 2,124,647 (198,883) (3,807,468)
A t t ribu t ed t o non -con t rolling sh a reh olders 121,026 230,121 7,666 90,978
Ea rnings (loss) per sh a re:
Ba sic ea rnings per com m on sh a re - R$ 2 5 0.1994 0.3871 (0.0366) (0.7032)
Dilu t ed ea rnings per com m on sh a re - R$ 2 5 0.1994 0.3871 (0.0366) (0.7032)
Ea rnings (loss) per sh a re - discon t inu ed opera t ion s:
Ba sic ea rnings per com m on sh a re - R$ 2 5 - 0.0004 - -
Dilu t ed ea rnings per com m on sh a re - R$ 2 5 - 0.0004 - -
Con solida t ed
(A free translation of the original in Portuguese)
KLABIN S.A.
All amounts in thousands of Reais
STATEMENT OF COMPREHENSIVE INCOME (LOSS) FOR THE AND THREE AND NINE-MONTH PERIODS ENDED SEPTEMBER 30, 2021 AND 2020
(All amounts in thousands of Reais)
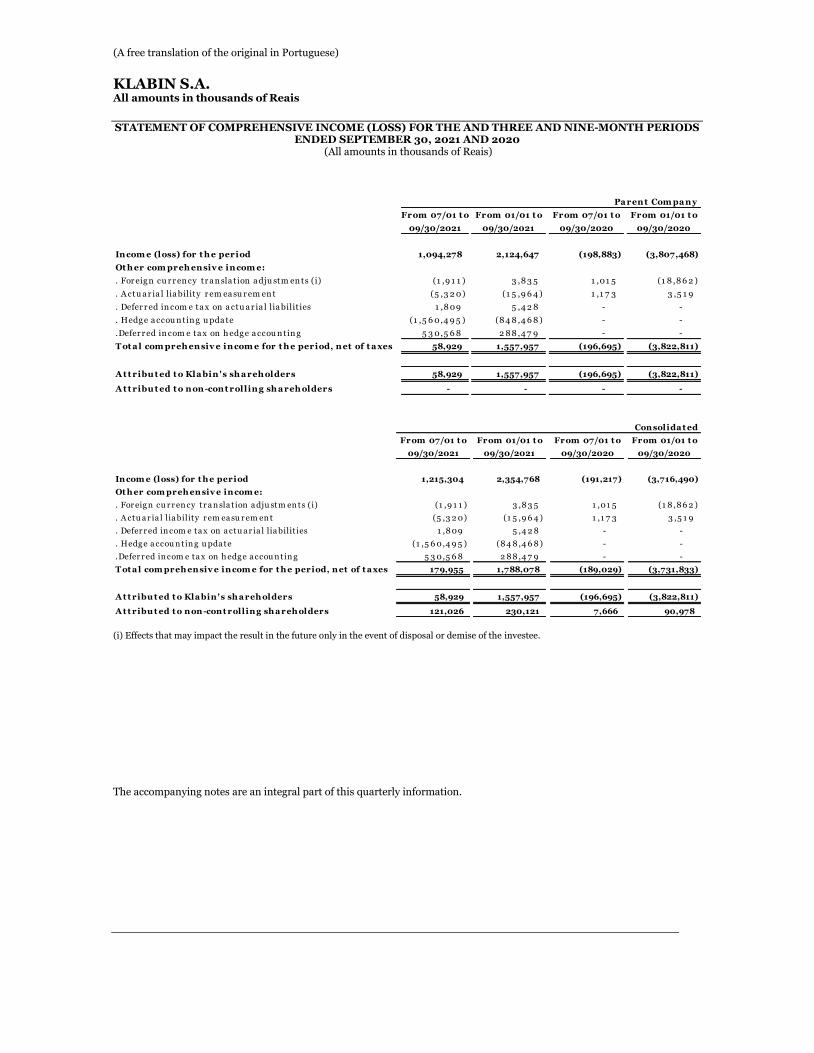
(i) Effects that may impact the result in the future only in the event of disposal or demise of the investee.
The accompanying notes are an integral part of this quarterly information.
From 07/01 t o From 01/01 t o From 07/01 t o From 01/01 t o
09/30/2021 09/30/2021 09/30/2020 09/30/2020
Incom e (loss) for t h e period 1,094,278 2,124,647 (198,883) (3,807,468)
Ot h er com preh ensiv e incom e:
. For eig n cu r r en cy tr a n sla t ion a dju stm en ts (i) (1 ,9 1 1 ) 3 ,8 3 5 1 ,01 5 (1 8 ,8 6 2 )
. A ctu a r ia l lia bility r em ea su r em en t (5 ,3 2 0) (1 5 ,9 6 4 ) 1 ,1 7 3 3 ,5 1 9
. Defer r ed in com e ta x on a ctu a r ia l lia bilit ies 1 ,8 09 5 ,4 2 8 - -
. Hedg e a ccou n tin g u pda te (1 ,5 6 0,4 9 5 ) (8 4 8 ,4 6 8 ) - -
.Defer r ed in com e ta x on h edg e a ccou n tin g 5 3 0,5 6 8 2 8 8 ,4 7 9 - -
T ot a l com preh ensiv e incom e for t h e period, net of t a xes 58,929 1,557,957 (196,695) (3,822,811)
A t t ribu t ed t o Kla bin's sh a reh olders 58,929 1,557,957 (196,695) (3,822,811)
A t t ribu t ed t o non-cont rolling sh a reh olders - - - -
Pa rent Com pa ny
From 07/01 t o From 01/01 t o From 07/01 t o From 01/01 t o
09/30/2021 09/30/2021 09/30/2020 09/30/2020
Incom e (loss) for t h e period 1,215,304 2,354,768 (191,217) (3,716,490)
Ot h er com preh ensiv e incom e:
. For eig n cu r r en cy tr a n sla t ion a dju stm en ts (i) (1 ,9 1 1 ) 3 ,8 3 5 1 ,01 5 (1 8 ,8 6 2 )
. A ctu a r ia l lia bility r em ea su r em en t (5 ,3 2 0) (1 5 ,9 6 4 ) 1 ,1 7 3 3 ,5 1 9
. Defer r ed in com e ta x on a ctu a r ia l lia bilit ies 1 ,8 09 5 ,4 2 8 - -
. Hedg e a ccou n tin g u pda te (1 ,5 6 0,4 9 5 ) (8 4 8 ,4 6 8 ) - -
.Defer r ed in com e ta x on h edg e a ccou n tin g 5 3 0,5 6 8 2 8 8 ,4 7 9 - -
T ot a l com preh ensiv e incom e for t h e period, net of t a xes 179,955 1,788,078 (189,029) (3,731,833)
A t t ribu t ed t o Kla bin's sh a reh olders 58,929 1,557,957 (196,695) (3,822,811)
A t t ribu t ed t o non-cont rolling sh a reh olders 121,026 230,121 7,666 90,978
Consolida t ed
(A free translation of the original in Portuguese)
KLABIN S.A.
All amounts in thousands of Reais
STATEMENT OF CHANGES IN EQUITY FOR THE NINE-MONTH PERIODS ENDED SEPTEMBER 30, 2021 AND 2020 (All amounts in thousands of Reais)
The accompanying notes are an integral part of this quarterly information.
Rev a lu a t ion
reserv e
In v estm en ts Ot h er com preh ensiv e Sh a reh older’s Consolida t ed
Sh a re Ca pit a l Ow n Ta x Biolog ica l a n d w or kin g incom e v a lu e T rea su ry Ret a ined equ it y Non-cont rolling sh a reh older’s
ca pit a l reserv es a ssets Leg a l in cen tiv es a ssets ca pita l a dju st m ent s sh a res ea rnings from Kla bin int erest equ it y
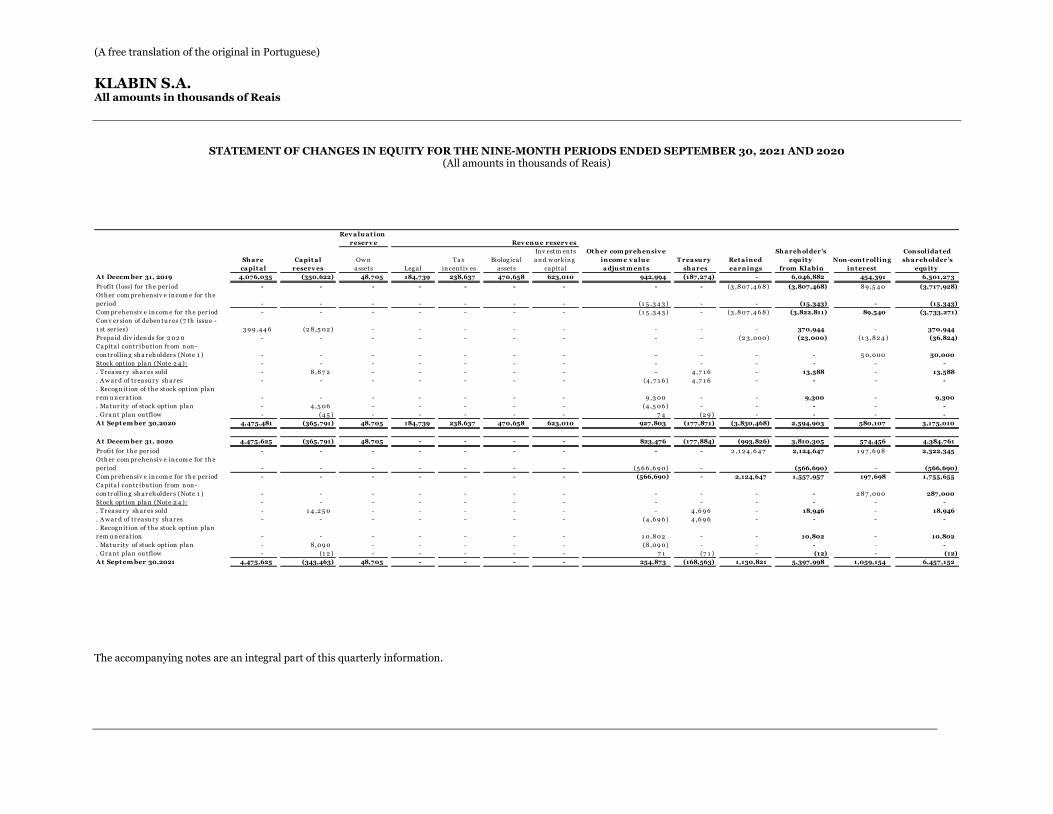
A t Decem ber 31, 2019 4,076,035 (350,622) 48,705 184,739 238,637 470,658 623,010 942,994 (187,274) - 6,046,882 454,391 6,501,273
Pr ofit (loss) for th e per iod - - - - - - - - - (3 ,8 07 ,4 6 8 ) (3,807,468) 8 9 ,5 4 0 (3,717,928)
Oth er com pr eh en siv e in com e for th e
per iod - - - - - - - (1 5 ,3 4 3 ) - - (15,343) - (15,343)
Com pr eh en siv e in com e for th e per iod - - - - - - - (1 5 ,3 4 3 ) - (3 ,8 07 ,4 6 8 ) (3,822,811) 89,540 (3,733,271)
Con v er sion of deben tu r es (7 th issu e -
1 st ser ies) 3 9 9 ,4 4 6 (2 8 ,5 02 ) - - - - - - - - 370,944 - 370,944
Pr epa id div iden ds for 2 02 0 - - - - - - - - - (2 3 ,000) (23,000) (1 3 ,8 2 4 ) (36,824)
Ca pita l con tr ibu tion fr om n on -
con tr ollin g sh a r eh older s (Note 1 ) - - - - - - - - - - - 5 0,000 50,000
Stock option pla n (Note 2 4 ): - - - - - - - - - - - - -
. Tr ea su r y sh a r es sold - 8 ,8 7 2 - - - - - - 4 ,7 1 6 - 13,588 - 13,588
. A w a r d of tr ea su r y sh a r es - - - - - - - (4 ,7 1 6 ) 4 ,7 1 6 - - - -
. Recog n it ion of th e stock option pla n
r em u n er a t ion - - - - - - - 9 ,3 00 - - 9,300 - 9,300
. Ma tu r ity of stock option pla n - 4 ,5 06 - - - - - (4 ,5 06 ) - - - - -
. Gr a n t pla n ou tflow - (4 5 ) - - - - - 7 4 (2 9 ) - - - -
A t Sept em ber 30,2020 4,475,481 (365,791) 48,705 184,739 238,637 470,658 623,010 927,803 (177,871) (3,830,468) 2,594,903 580,107 3,175,010
A t Decem ber 31, 2020 4,475,625 (365,791) 48,705 - - - - 823,476 (177,884) (993,826) 3,810,305 574,456 4,384,761
Pr ofit for th e per iod - - - - - - - - - 2 ,1 2 4 ,6 4 7 2,124,647 1 9 7 ,6 9 8 2,322,345
Oth er com pr eh en siv e in com e for th e
per iod - - - - - - - (5 6 6 ,6 9 0) - (566,690) - (566,690)
Com pr eh en siv e in com e for th e per iod - - - - - - - (566,690) - 2,124,647 1,557,957 197,698 1,755,655
Ca pita l con tr ibu tion fr om n on -
con tr ollin g sh a r eh older s (Note 1 ) - - - - - - - - - - - 2 8 7 ,000 287,000
Stock option pla n (Note 2 4 ): - - - - - - - - - - - - -
. Tr ea su r y sh a r es sold - 1 4 ,2 5 0 - - - - - - 4 ,6 9 6 - 18,946 - 18,946
. A w a r d of tr ea su r y sh a r es - - - - - - - (4 ,6 9 6 ) 4 ,6 9 6 - - - -
. Recog n it ion of th e stock option pla n
r em u n er a t ion - - - - - - - 1 0,8 02 - - 10,802 - 10,802
. Ma tu r ity of stock option pla n - 8 ,09 0 - - - - - (8 ,09 0) - - - - -
. Gr a n t pla n ou tflow - (1 2 ) - - - - - 7 1 (7 1 ) - (12) - (12)
A t Sept em ber 30,2021 4,475,625 (343,463) 48,705 - - - - 254,873 (168,563) 1,130,821 5,397,998 1,059,154 6,457,152
Rev enu e reserv es
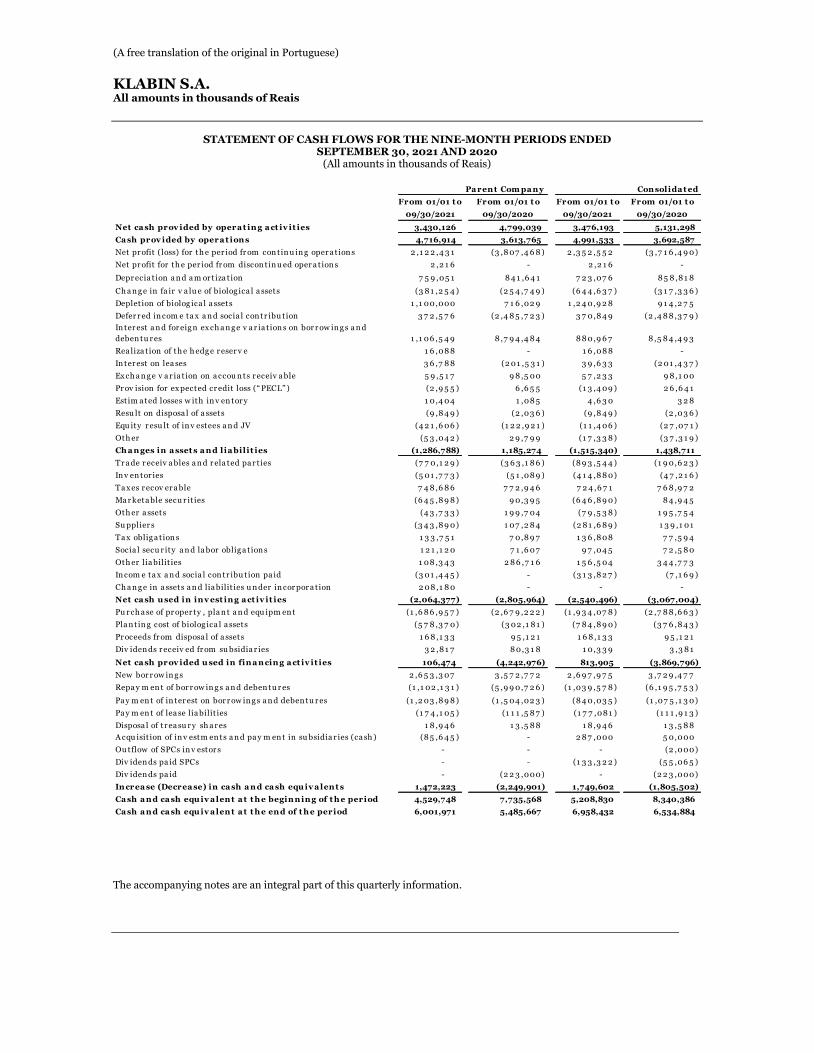
(A free translation of the original in Portuguese)
KLABIN S.A.
All amounts in thousands of Reais
STATEMENT OF CASH FLOWS FOR THE NINE-MONTH PERIODS ENDED
SEPTEMBER 30, 2021 AND 2020 (All amounts in thousands of Reais)
The accompanying notes are an integral part of this quarterly information.
From 01/01 t o From 01/01 t o From 01/01 t o From 01/01 t o
09/30/2021 09/30/2020 09/30/2021 09/30/2020
Net ca sh prov ided by opera t ing a ct iv it ies 3,430,126 4,799,039 3,476,193 5,131,298
Ca sh prov ided by opera t ion s 4,716,914 3,613,765 4,991,533 3,692,587
Net pr ofit (loss) for th e per iod fr om con tin u in g oper a t ion s 2 ,1 2 2 ,4 3 1 (3 ,8 07 ,4 6 8 ) 2 ,3 5 2 ,5 5 2 (3 ,7 1 6 ,4 9 0)
Net pr ofit for th e per iod fr om discon tin u ed oper a t ion s 2 ,2 1 6 - 2 ,2 1 6 -
Depr ecia t ion a n d a m or t iza t ion 7 5 9 ,05 1 8 4 1 ,6 4 1 7 2 3 ,07 6 8 5 8 ,8 1 8
Ch a n g e in fa ir v a lu e of biolog ica l a ssets (3 8 1 ,2 5 4 ) (2 5 4 ,7 4 9 ) (6 4 4 ,6 3 7 ) (3 1 7 ,3 3 6 )
Deplet ion of biolog ica l a ssets 1 ,1 00,000 7 1 6 ,02 9 1 ,2 4 0,9 2 8 9 1 4 ,2 7 5
Defer r ed in com e ta x a n d socia l con tr ibu t ion 3 7 2 ,5 7 6 (2 ,4 8 5 ,7 2 3 ) 3 7 0,8 4 9 (2 ,4 8 8 ,3 7 9 )
In ter est a n d for eig n ex ch a n g e v a r ia t ion s on bor r ow in g s a n d
deben tu r es 1 ,1 06 ,5 4 9 8 ,7 9 4 ,4 8 4 8 8 0,9 6 7 8 ,5 8 4 ,4 9 3
Rea liza t ion of th e h edg e r eser v e 1 6 ,08 8 - 1 6 ,08 8 -
In ter est on lea ses 3 6 ,7 8 8 (2 01 ,5 3 1 ) 3 9 ,6 3 3 (2 01 ,4 3 7 )
Ex ch a n g e v a r ia t ion on a ccou n ts r eceiv a ble 5 9 ,5 1 7 9 8 ,5 00 5 7 ,2 3 3 9 8 ,1 00
Pr ov ision for ex pected cr edit loss (“ PECL” ) (2 ,9 5 5 ) 6 ,6 5 5 (1 3 ,4 09 ) 2 6 ,6 4 1
Est im a ted losses w ith in v en tor y 1 0,4 04 1 ,08 5 4 ,6 3 0 3 2 8
Resu lt on disposa l of a ssets (9 ,8 4 9 ) (2 ,03 6 ) (9 ,8 4 9 ) (2 ,03 6 )
Equ ity r esu lt of in v estees a n d JV (4 2 1 ,6 06 ) (1 2 2 ,9 2 1 ) (1 1 ,4 06 ) (2 7 ,07 1 )
Oth er (5 3 ,04 2 ) 2 9 ,7 9 9 (1 7 ,3 3 8 ) (3 7 ,3 1 9 )
Ch a n ges in a sset s a n d lia bilit ies (1,286,788) 1,185,274 (1,515,340) 1,438,711
Tr a de r eceiv a bles a n d r ela ted pa r t ies (7 7 0,1 2 9 ) (3 6 3 ,1 8 6 ) (8 9 3 ,5 4 4 ) (1 9 0,6 2 3 )
In v en tor ies (5 01 ,7 7 3 ) (5 1 ,08 9 ) (4 1 4 ,8 8 0) (4 7 ,2 1 6 )
Ta x es r ecov er a ble 7 4 8 ,6 8 6 7 7 2 ,9 4 6 7 2 4 ,6 7 1 7 6 8 ,9 7 2
Ma r keta ble secu r it ies (6 4 5 ,8 9 8 ) 9 0,3 9 5 (6 4 6 ,8 9 0) 8 4 ,9 4 5
Oth er a ssets (4 3 ,7 3 3 ) 1 9 9 ,7 04 (7 9 ,5 3 8 ) 1 9 5 ,7 5 4
Su pplier s (3 4 3 ,8 9 0) 1 07 ,2 8 4 (2 8 1 ,6 8 9 ) 1 3 9 ,1 01
Ta x oblig a t ion s 1 3 3 ,7 5 1 7 0,8 9 7 1 3 6 ,8 08 7 7 ,5 9 4
Socia l secu r ity a n d la bor oblig a t ion s 1 2 1 ,1 2 0 7 1 ,6 07 9 7 ,04 5 7 2 ,5 8 0
Oth er lia bilit ies 1 08 ,3 4 3 2 8 6 ,7 1 6 1 5 6 ,5 04 3 4 4 ,7 7 3
In com e ta x a n d socia l con tr ibu t ion pa id (3 01 ,4 4 5 ) - (3 1 3 ,8 2 7 ) (7 ,1 6 9 )
Ch a n g e in a ssets a n d lia bilit ies u n der in cor por a t ion 2 08 ,1 8 0 - - -
Net ca sh u sed in inv est ing a ct iv it ies (2,064,377) (2,805,964) (2,540,496) (3,067,004)
Pu r ch a se of pr oper ty , pla n t a n d equ ipm en t (1 ,6 8 6 ,9 5 7 ) (2 ,6 7 9 ,2 2 2 ) (1 ,9 3 4 ,07 8 ) (2 ,7 8 8 ,6 6 3 )
Pla n t in g cost of biolog ica l a ssets (5 7 8 ,3 7 0) (3 02 ,1 8 1 ) (7 8 4 ,8 9 0) (3 7 6 ,8 4 3 )
Pr oceeds fr om disposa l of a ssets 1 6 8 ,1 3 3 9 5 ,1 2 1 1 6 8 ,1 3 3 9 5 ,1 2 1
Div iden ds r eceiv ed fr om su bsidia r ies 3 2 ,8 1 7 8 0,3 1 8 1 0 ,3 3 9 3 ,3 8 1
Net ca sh prov ided u sed in fina ncing a ct iv it ies 106,474 (4,242,976) 813,905 (3,869,796)
New bor r ow in g s 2 ,6 5 3 ,3 07 3 ,5 7 2 ,7 7 2 2 ,6 9 7 ,9 7 5 3 ,7 2 9 ,4 7 7
Repa y m en t of bor r ow in g s a n d deben tu r es (1 ,1 02 ,1 3 1 ) (5 ,9 9 0,7 2 6 ) (1 ,03 9 ,5 7 8 ) (6 ,1 9 5 ,7 5 3 )
Pa y m en t of in ter est on bor r ow in g s a n d deben tu r es (1 ,2 03 ,8 9 8 ) (1 ,5 04 ,02 3 ) (8 4 0,03 5 ) (1 ,07 5 ,1 3 0)
Pa y m en t of lea se lia bilit ies (1 7 4 ,1 05 ) (1 1 1 ,5 8 7 ) (1 7 7 ,08 1 ) (1 1 1 ,9 1 3 )
Disposa l of tr ea su r y sh a r es 1 8 ,9 4 6 1 3 ,5 8 8 1 8 ,9 4 6 1 3 ,5 8 8
A cqu isit ion of in v estm en ts a n d pa y m en t in su bsidia r ies (ca sh ) (8 5 ,6 4 5 ) - 2 8 7 ,000 5 0,000
Ou tflow of SPCs in v estor s - - - (2 ,000)
Div iden ds pa id SPCs - - (1 3 3 ,3 2 2 ) (5 5 ,06 5 )
Div iden ds pa id - (2 2 3 ,000) - (2 2 3 ,000)
Increa se (Decrea se) in ca sh a nd ca sh equ iv a lent s 1,472,223 (2,249,901) 1,749,602 (1,805,502)
Ca sh a nd ca sh equ iv a lent a t t h e beginning of t h e period 4,529,748 7,735,568 5,208,830 8,340,386
Ca sh a nd ca sh equ iv a lent a t t h e end of t h e period 6,001,971 5,485,667 6,958,432 6,534,884
Pa rent Com pa n y Con solida t ed
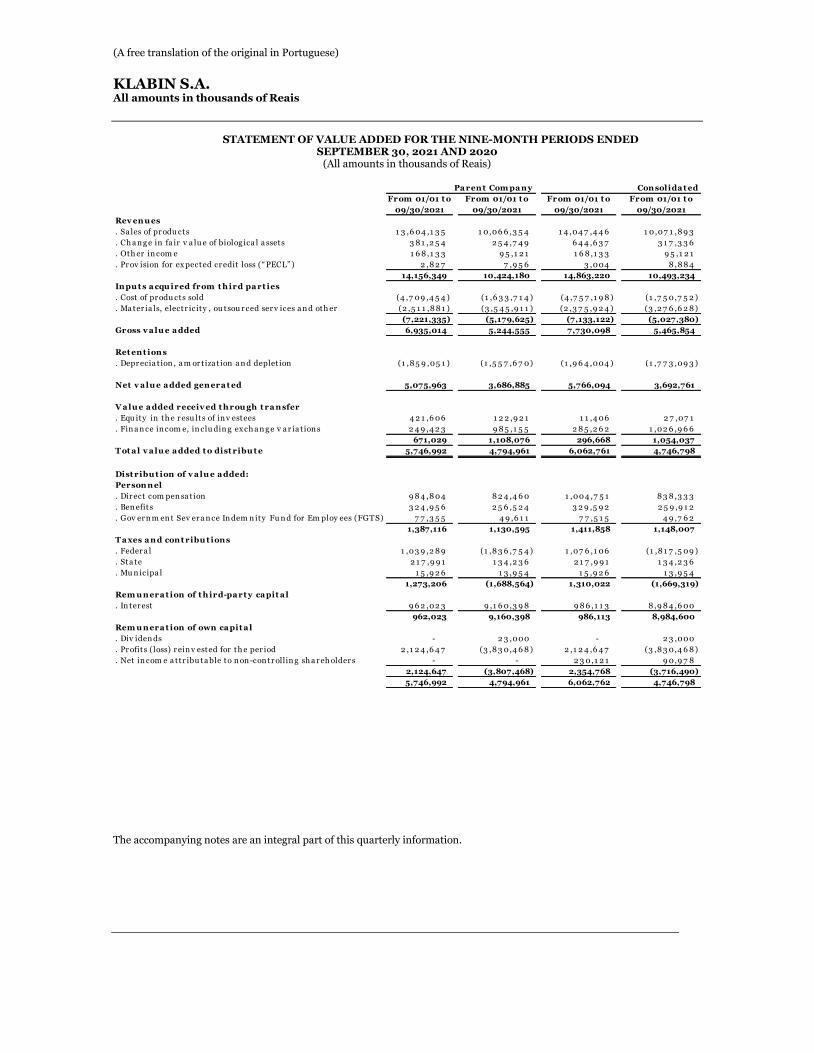
(A free translation of the original in Portuguese)
KLABIN S.A.
All amounts in thousands of Reais
STATEMENT OF VALUE ADDED FOR THE NINE-MONTH PERIODS ENDED
SEPTEMBER 30, 2021 AND 2020 (All amounts in thousands of Reais)
The accompanying notes are an integral part of this quarterly information.
From 01/01 t o From 01/01 t o From 01/01 t o From 01/01 t o
09/30/2021 09/30/2021 09/30/2021 09/30/2021
Rev enu es
. Sa les of pr odu cts 1 3 ,6 04 ,1 3 5 1 0,06 6 ,3 5 4 1 4 ,04 7 ,4 4 6 1 0 ,07 1 ,8 9 3
. Ch a n g e in fa ir v a lu e of biolog ica l a ssets 3 8 1 ,2 5 4 2 5 4 ,7 4 9 6 4 4 ,6 3 7 3 1 7 ,3 3 6
. Oth er in com e 1 6 8 ,1 3 3 9 5 ,1 2 1 1 6 8 ,1 3 3 9 5 ,1 2 1
. Pr ov ision for ex pected cr edit loss (“ PECL” ) 2 ,8 2 7 7 ,9 5 6 3 ,004 8 ,8 8 4
14,156,349 10,424,180 14,863,220 10,493,234
Inpu t s a cqu ired from t h ird pa rt ies
. Cost of pr odu cts sold (4 ,7 09 ,4 5 4 ) (1 ,6 3 3 ,7 1 4 ) (4 ,7 5 7 ,1 9 8 ) (1 ,7 5 0,7 5 2 )
. Ma ter ia ls, electr icity , ou tsou r ced ser v ices a n d oth er (2 ,5 1 1 ,8 8 1 ) (3 ,5 4 5 ,9 1 1 ) (2 ,3 7 5 ,9 2 4 ) (3 ,2 7 6 ,6 2 8 )
(7,221,335) (5,179,625) (7,133,122) (5,027,380)
Gross v a lu e a dded 6,935,014 5,244,555 7,730,098 5,465,854
Ret ent ion s
. Depr ecia t ion , a m or t iza t ion a n d deplet ion (1 ,8 5 9 ,05 1 ) (1 ,5 5 7 ,6 7 0) (1 ,9 6 4 ,004 ) (1 ,7 7 3 ,09 3 )
Net v a lu e a dded gen era t ed 5,075,963 3,686,885 5,766,094 3,692,761
V a lu e a dded receiv ed t h rou gh t ra n sfer
. Equ ity in th e r esu lts of in v estees 4 2 1 ,6 06 1 2 2 ,9 2 1 1 1 ,4 06 2 7 ,07 1
. Fin a n ce in com e, in clu din g ex ch a n g e v a r ia t ion s 2 4 9 ,4 2 3 9 8 5 ,1 5 5 2 8 5 ,2 6 2 1 ,02 6 ,9 6 6
671,029 1,108,076 296,668 1,054,037
T ot a l v a lu e a dded t o dist ribu t e 5,746,992 4,794,961 6,062,761 4,746,798
Dist ribu t ion of v a lu e a dded:
Person nel
. Dir ect com pen sa t ion 9 8 4 ,8 04 8 2 4 ,4 6 0 1 ,004 ,7 5 1 8 3 8 ,3 3 3
. Ben efits 3 2 4 ,9 5 6 2 5 6 ,5 2 4 3 2 9 ,5 9 2 2 5 9 ,9 1 2
. Gov er n m en t Sev er a n ce In dem n ity Fu n d for Em ploy ees (FGTS) 7 7 ,3 5 5 4 9 ,6 1 1 7 7 ,5 1 5 4 9 ,7 6 2
1,387,116 1,130,595 1,411,858 1,148,007
T a xes a nd con t ribu t ion s
. Feder a l 1 ,03 9 ,2 8 9 (1 ,8 3 6 ,7 5 4 ) 1 ,07 6 ,1 06 (1 ,8 1 7 ,5 09 )
. Sta te 2 1 7 ,9 9 1 1 3 4 ,2 3 6 2 1 7 ,9 9 1 1 3 4 ,2 3 6
. Mu n icipa l 1 5 ,9 2 6 1 3 ,9 5 4 1 5 ,9 2 6 1 3 ,9 5 4
1,273,206 (1,688,564) 1,310,022 (1,669,319)
Rem u nera t ion of t h ird-pa rt y ca pit a l
. In ter est 9 6 2 ,02 3 9 ,1 6 0,3 9 8 9 8 6 ,1 1 3 8 ,9 8 4 ,6 00
962,023 9,160,398 986,113 8,984,600
Rem u nera t ion of own ca pit a l
. Div iden ds - 2 3 ,000 - 2 3 ,000
. Pr ofits (loss) r ein v ested for th e per iod 2 ,1 2 4 ,6 4 7 (3 ,8 3 0,4 6 8 ) 2 ,1 2 4 ,6 4 7 (3 ,8 3 0,4 6 8 )
. Net in com e a ttr ibu ta ble to n on -con tr ollin g sh a r eh older s - - 2 3 0,1 2 1 9 0,9 7 8
2,124,647 (3,807,468) 2,354,768 (3,716,490)
5,746,992 4,794,961 6,062,762 4,746,798
Pa rent Com pa ny Con solida t ed
(A free translation of the original in Portuguese)
KLABIN S.A.
All amounts in thousands of Reais
Notes to the quarterly information (Presented in thousands of Reais unless otherwise stated) 1 GENERAL INFORMATION
Klabin S.A. (the "Company") and its subsidiaries operate in segments of paper and pulp industry supplying domestic and foreign markets, with wood, packaging paper, paper sacks, corrugated cardboard boxes and pulp. Their operations are fully integrated, from forestry activities to the production of the final products. Klabin S.A. is a publicly held corporation whose shares and certificates of deposit of shares (Units) are traded under the code KLBN11, on the São Paulo Commodities, Futures and Stock Exchange – B3. The Company is domiciled in Brazil and headquartered in São Paulo. The Company also has ownership interests in other companies (Notes 3 and 11) whose operational activities relate to the Company's business purposes. 1.1 Declaration of conformity
The issuance of this quarterly information of Klabin S.A. and its subsidiaries was authorized by the Chief Financial Officer on October 26, 2021. Management evaluated the Company's and its subsidiaries' ability to continue its operation being convinced that it has the necessary resources and capacity to develop its business in the future on a continuous basis, with no knowledge of uncertainties or material probabilities that could generate significant doubts regarding its continuity. Management affirms that all relevant information specific to the quarterly information, and only them, is being disclosed and that corresponds to those used by it in its management. Certain accounts of these 2020 financial statements presented here have been reclassified to allow their comparison with the financial statements as of September 31, 2021. The reclassifications mentioned are part of the group of non-current liabilities and, therefore, did not impact net working capital or other statements financial indexes of the Company. 1.2 Expansion project - Puma II As disclosed in the Material Fact to the market on April 16, 2019 and May 05, 2021, the capacity expansion project in the packaging paper segment called Puma II Project, was approved, covering the construction of two paper machines, with pulp production, located at Klabin's industrial unit in the city of Ortigueira (PR) (“Puma Unit”). The installation of the Puma II Project is divided into two stages: (i) As communicated to the market through a material fact, the first stage of the Project was completed and production began on August 30, 2021, contemplating the construction of a main fiber line for the production of unbleached pulp integrated with a kraftliner and white kraftliner paper machine with a capacity of 450 thousand tons p.a., which will be marketed under the Eukaliner brand, the world's first kraftliner paper produced with 100% eucalyptus fibers. (ii) The second stage includes the construction of a complementary fiber line integrated with a paperboard machine with a capacity of 460 thousand tons p.a. and expansion of some support structures. The startup of the second machine is scheduled for the second quarter of 2023.
(A free translation of the original in Portuguese)
KLABIN S.A.
All amounts in thousands of Reais
The gross investment budgeted for the construction of the Puma II Project is R$ 12,9 billion, subject to exchange rate fluctuations and adjustments resulting from inflation, being R$ 7,1 billion disbursed up to September 30, 2021 and the remainder by 2023. Approximately R$ 1,2 billion of gross investment refers to recoverable taxes. The Project's investments will be financed by the Company's cash position and cash generation from in the operation, which may be complemented by the withdrawal of financing already contracted and not yet withdrawn. 1.3 Constitution of Pinus Taeda Florestal S.A. On January 21, 2020, the necessary agreements were signed for association with a Timber Investment Management Organization (“TIMO”) for the incorporation of a Special Purpose Company (“SPC”), whose main stated purpose is the exploration of forestry activity in the center-south of the State of Paraná, allowing access to new lands to increase its forest base. The Company's contribution to the build-up of the SPC's assets was through the contribution of approximately 9 thousand hectares of planted forests, in the amount of R$ 72,000, with a 26% interest in the SPC. TIMO, in turn, contributed with approximately 11 thousand hectares of forests and 7 thousand hectares of land assets. The rights and obligations of the Company and TIMO were regulated by means of a shareholders' agreement signed between the parties. Considering the SPC's shared control structure, it is classified as a jointly controlled entity (joint venture), being recorded under the equity method in the individual and consolidated quarterly information of the Company. The Company has the right of first refusal in the purchase of process wood produced by SPC, among other typical rights granted to shareholders of a company of this nature. 1.4 Conversion of 7th issue debentures (1st series) According to the notice to shareholders published on June 15, 2020, the 1st series of debentures of the 7th issue matured, in which 27,739,244 debentures were converted into shares of the Company, in accordance with the terms of clause VI of the private deed instrument of the 7th private issuance of simple debentures, combined with a bonus dated April 22, 2014 by decision of the debenture holders. 27,739,244 “Units” were issued, comprising 27,739,244 common shares and 110,956,976 preferred shares, totaling a capital increase in the Company of R$ 399,446. As a result of this resolution, the Company's subscribed and paid-in capital increased from R$ 4,076,035 to R$ 4,475,481, divided into 5,548,498,060 shares, all nominative and with no nominal amount, with 2,012,333,899 common shares and 3,536,164,161 preferred shares. 1.5 Acquisition of International Paper do Brazil’s assets On October 14, 2020, the conditions for the acquisition of the packaging paper and corrugated cardboard business located in Brazil by International Paper do Brasil (“IP”) were concluded and all legal agreements and approvals were signed, with the disbursement of the first installment of R$ 280,000 on this date, with R$ 50,000 remaining to be paid after one year, subject to certain contractual conditions, totaling R$ 330,000 for the acquisition, in addition to reimbursing IP for the working capital received in excess at that acquisition date in the amount of R$ 56,000 in the first quarter of 2021. The Company used its own funds for payment.
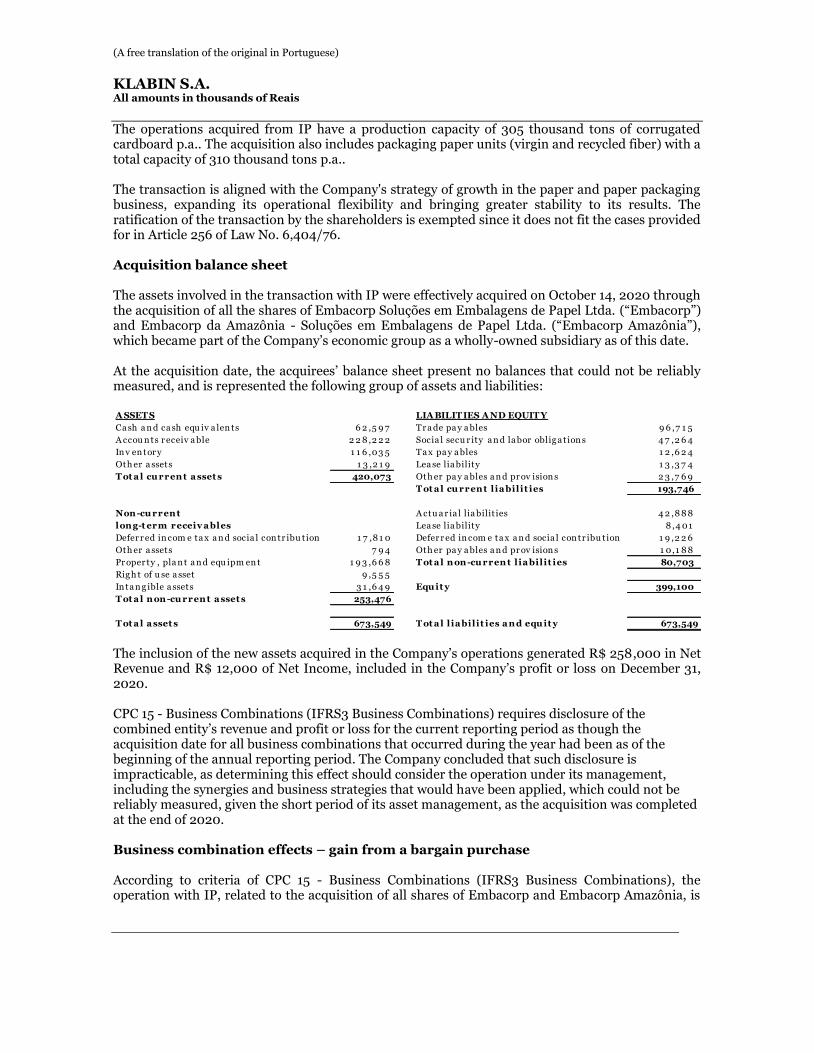
(A free translation of the original in Portuguese)
KLABIN S.A.
All amounts in thousands of Reais
The operations acquired from IP have a production capacity of 305 thousand tons of corrugated cardboard p.a.. The acquisition also includes packaging paper units (virgin and recycled fiber) with a total capacity of 310 thousand tons p.a.. The transaction is aligned with the Company's strategy of growth in the paper and paper packaging business, expanding its operational flexibility and bringing greater stability to its results. The ratification of the transaction by the shareholders is exempted since it does not fit the cases provided for in Article 256 of Law No. 6,404/76. Acquisition balance sheet The assets involved in the transaction with IP were effectively acquired on October 14, 2020 through the acquisition of all the shares of Embacorp Soluções em Embalagens de Papel Ltda. (“Embacorp”) and Embacorp da Amazônia - Soluções em Embalagens de Papel Ltda. (“Embacorp Amazônia”), which became part of the Company’s economic group as a wholly-owned subsidiary as of this date. At the acquisition date, the acquirees’ balance sheet present no balances that could not be reliably measured, and is represented the following group of assets and liabilities:
The inclusion of the new assets acquired in the Company’s operations generated R$ 258,000 in Net Revenue and R$ 12,000 of Net Income, included in the Company’s profit or loss on December 31, 2020. CPC 15 - Business Combinations (IFRS3 Business Combinations) requires disclosure of the combined entity’s revenue and profit or loss for the current reporting period as though the acquisition date for all business combinations that occurred during the year had been as of the beginning of the annual reporting period. The Company concluded that such disclosure is impracticable, as determining this effect should consider the operation under its management, including the synergies and business strategies that would have been applied, which could not be reliably measured, given the short period of its asset management, as the acquisition was completed at the end of 2020. Business combination effects – gain from a bargain purchase According to criteria of CPC 15 - Business Combinations (IFRS3 Business Combinations), the operation with IP, related to the acquisition of all shares of Embacorp and Embacorp Amazônia, is
Ca sh a n d ca sh equ iv a len ts 6 2 ,5 9 7 Tr a de pa y a bles 9 6 ,7 1 5
A ccou n ts r eceiv a ble 2 2 8 ,2 2 2 Socia l secu r ity a n d la bor oblig a t ion s 4 7 ,2 6 4
In v en tor y 1 1 6 ,03 5 Ta x pa y a bles 1 2 ,6 2 4
Oth er a ssets 1 3 ,2 1 9 Lea se lia bility 1 3 ,3 7 4
T ot a l cu rrent a sset s 420,073 Oth er pa y a bles a n d pr ov ision s 2 3 ,7 6 9
T ot a l cu rrent l ia bilit ies 193,746
Non-cu rrent A ctu a r ia l lia bilit ies 4 2 ,8 8 8
long-t erm receiv a bles Lea se lia bility 8 ,4 01
Defer r ed in com e ta x a n d socia l con tr ibu tion 1 7 ,8 1 0 Defer r ed in com e ta x a n d socia l con tr ibu tion 1 9 ,2 2 6
Oth er a ssets 7 9 4 Oth er pa y a bles a n d pr ov ision s 1 0,1 8 8
Pr oper ty , pla n t a n d equ ipm en t 1 9 3 ,6 6 8 T ot a l non-cu rrent l ia bilit ies 80,703
Rig h t of u se a sset 9 ,5 5 5
In ta n g ible a ssets 3 1 ,6 4 9 Equ it y 399,100
T ot a l non-cu rrent a sset s 253,476
T ot a l a sset s 673,549 T ot a l l ia bilit ies a nd equ it y 673,549
A SSET S LIA BILIT IES A ND EQUIT Y

(A free translation of the original in Portuguese)
KLABIN S.A.
All amounts in thousands of Reais
characterized as a business combination. Therefore, the fair value of assets and liabilities acquired is to be measured using the purchase price allocation process (“PPA” - Purchase Price Allocation). At the end of 2020, the Company hired specialists to evaluate the assets and liabilities of Embacorp and Embacorp Amazônia, in which there was a net effect of an bargain purchase in the acquisition of assets from IP of R$ 206,061 allocated in the Company's results, in the "Other net" line. The gain was the result of R$ 11,101 of net assets acquired above the purchase price, the valuation at market value of fixed assets R$ 215,959 above the book values of the acquisition balance sheet and the reduction of intangible assets whose valuation at value of market was below book values by (R$ 20,999). The fair value of the adjusted assets above was determined through an analysis obtained in comparison with similar property, plant and equipment items in the market, considering their best use. The appraisal of intangible assets presented a loss, due to the decrease in customer portfolio recorded in the initial acquisition balance. Embacorp’s corporate reorganization On December 28, 2020, Embacorp's corporate reorganization was approved, with a partial spin-off of the net assets acquired from IP, excluding the net assets related to the assets and liabilities of the Nova Campina (SP) branch. The spun-off portion of R$ 467,396 was transferred to Riohold Holdings S.A., a wholly-owned subsidiary of the Company. On that date, Embacorp started to have in its balance sheet only the assets and liabilities related to the Nova Campina (SP) unit. The operation is aligned with the Administration's strategy of integrating the assets acquired from IP. The merger into the parent company referring to assets transferred to Riohold Holdings S.A. took place on January 4, 2021, see details in note 1.11. On January 29, 2021, the sale of Embacorp was completed, see details in note 12. 1.6 Constitution of Aroeira Reflorestadora S.A. On September 9, 2020, the Company incorporated the privately-held entity - Aroeira Reflorestadora S.A, a Special Purpose Entity (SPC), with the main purpose of exploring forestry activity in the state of Santa Catarina - SC. On January 26, 2021, the necessary agreements were signed for association with a Timber Investment Management Organization (“TIMO”). The Company will contribute to the formation of the entity's equity by providing approximately 9.7 thousand hectares of planted forests, while TIMO will contribute up to R$ 500,000 in cash, a portion of which at the closing of the operation and the remaining portion in up to 3 years. Until September 30, 2021, an investment of R$ 53,657 was made by Klabin S.A. and R$ 187,000 by TIMO. The funds contributed to the SPE will be used for acquisitions and leases of approximately 19,500 hectares of effective planting, as well as reforestation expenses, substantially from Pinus, in these areas. Klabin will have the preemptive right to purchase the wood produced by the SPE, among other typical rights granted to controlling shareholders of an entity of this nature. This association will allow the Company to expand its forest massif in the state of Santa Catarina with capital efficiency. This expansion aims at supplying the current factories in the region as well as making future expansion projects viable. Klabin holds 51% of the voting capital and 18% of the total capital of the entity, while TIMO holds the remaining capital and may elect Board of Directors’ members and participate in certain decisions of the entity with the right to vote, including in situations that require a qualified forum.
(A free translation of the original in Portuguese)
KLABIN S.A.
All amounts in thousands of Reais
Klabin S.A. may exercise preemptive rights in the purchase of the entity's shares belonging to TIMO, an option to be exercised between 2031 and 2041. On June 29, 2021, Aroeira acquired land and forests in the amount of R$ 124,000. 1.7 Constitution of Kla Holding S.A. On November 12, 2020, the company Kla Holdings S.A. (“Kla Holdings”) was created in order to facilitate the future acquisition of interests in other companies, aligned with the Company's growth strategy. 1.8 Acquisition of brands involved in royalties and merger of Sogemar On November 26, 2020, the Special General Meeting approved the merger of SOGEMAR - Sociedade Geral de Marcas (“Sogemar”), owner of the brands involved in the royalties contract. As a result of the merger, Klabin becomes the owner of the brands owned by Sogemar, with the consequent extinction on this date of the respective license agreement and payment of royalties related to such brands. Given the merger, Sogemar’s units of interest were replaced by the issue of 69,394,696 (sixty-nine million, three hundred and ninety-four thousand, six hundred and ninety-six) new common shares of the Company, all registered and without par value, to Sogemar partners, with a R$ 144 increase in the Company’s capital stock. After the transaction was approved, the Company’s capital increased from R$ 4,475,481 to R$ 4,475,625, comprising 5,617,892,756 shares, of which 2,081,728,595 are common shares and 3,536,164,161 are preferred shares. 1.9 Closing of Special Partnership Company CG Forest The merger of Special Partnership Company CG Forest (“SPC CG Forest”) took place on December 9, 2020, as determined by its partners after the closing of the partnership’s operations. In the settlement of assets, R$ 25,000 was paid to the investing partners related to their interest in the partnership, whereas the Company merged the remaining net assets comprising R$ 70,944 in cash and cash equivalents and R$ 39,660 in working capital. 1.10 Closure of subsidiaries At the end of 2020, the Company closed the activities of its foreign subsidiaries Klabin Limited, Klabin Trade and Klabin Overseas, and of its national subsidiary Celucat. Their operations were terminated as they were not in operation and no operational use was expected. 1.11 Merger of Riohold Papel e Celulose S.A On January 4, 2021, the Special General Meeting approved the merger of Riohold Papel e Celulose S.A. (“Riohold”). The merger did not result in a capital increase or issuance of new shares since the entire capital of Riohold was already held by the Company. The merger is part of management's strategy to integrate the assets acquired from Internacional Paper do Brasil Ltda.
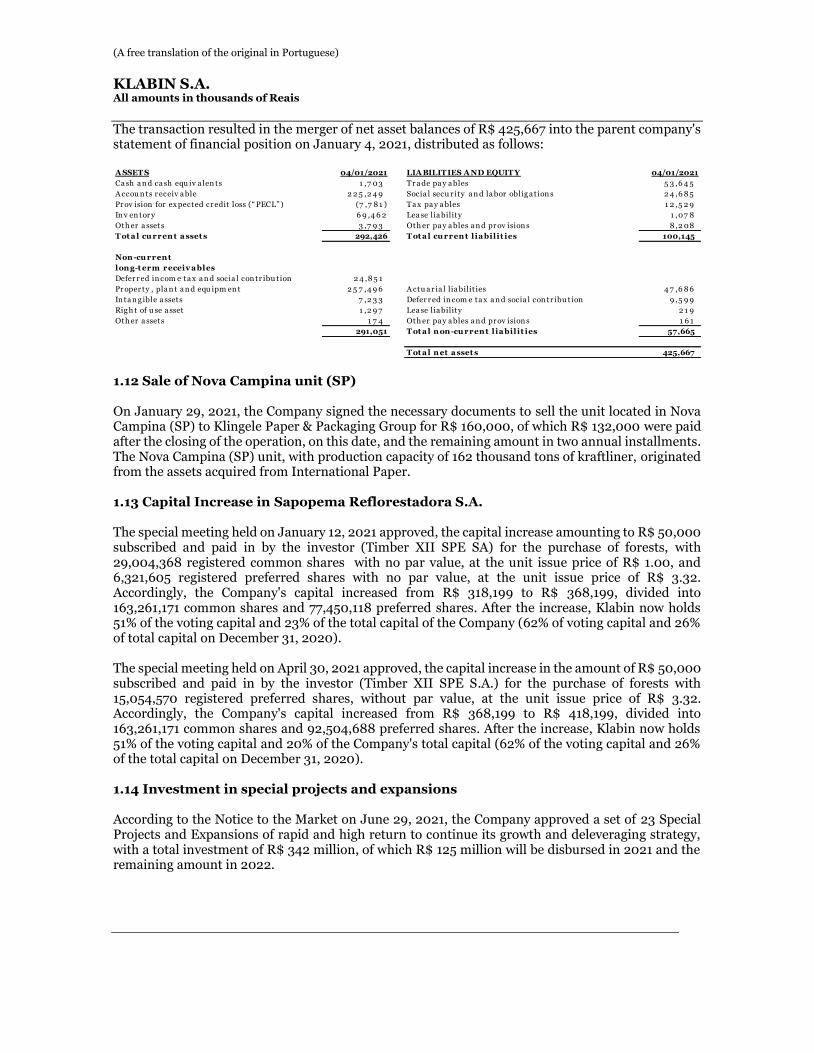
(A free translation of the original in Portuguese)
KLABIN S.A.
All amounts in thousands of Reais
The transaction resulted in the merger of net asset balances of R$ 425,667 into the parent company's statement of financial position on January 4, 2021, distributed as follows:
1.12 Sale of Nova Campina unit (SP) On January 29, 2021, the Company signed the necessary documents to sell the unit located in Nova Campina (SP) to Klingele Paper & Packaging Group for R$ 160,000, of which R$ 132,000 were paid after the closing of the operation, on this date, and the remaining amount in two annual installments. The Nova Campina (SP) unit, with production capacity of 162 thousand tons of kraftliner, originated from the assets acquired from International Paper. 1.13 Capital Increase in Sapopema Reflorestadora S.A. The special meeting held on January 12, 2021 approved, the capital increase amounting to R$ 50,000 subscribed and paid in by the investor (Timber XII SPE SA) for the purchase of forests, with 29,004,368 registered common shares with no par value, at the unit issue price of R$ 1.00, and 6,321,605 registered preferred shares with no par value, at the unit issue price of R$ 3.32. Accordingly, the Company's capital increased from R$ 318,199 to R$ 368,199, divided into 163,261,171 common shares and 77,450,118 preferred shares. After the increase, Klabin now holds 51% of the voting capital and 23% of the total capital of the Company (62% of voting capital and 26% of total capital on December 31, 2020). The special meeting held on April 30, 2021 approved, the capital increase in the amount of R$ 50,000 subscribed and paid in by the investor (Timber XII SPE S.A.) for the purchase of forests with 15,054,570 registered preferred shares, without par value, at the unit issue price of R$ 3.32. Accordingly, the Company's capital increased from R$ 368,199 to R$ 418,199, divided into 163,261,171 common shares and 92,504,688 preferred shares. After the increase, Klabin now holds 51% of the voting capital and 20% of the Company's total capital (62% of the voting capital and 26% of the total capital on December 31, 2020). 1.14 Investment in special projects and expansions According to the Notice to the Market on June 29, 2021, the Company approved a set of 23 Special Projects and Expansions of rapid and high return to continue its growth and deleveraging strategy, with a total investment of R$ 342 million, of which R$ 125 million will be disbursed in 2021 and the remaining amount in 2022.
A SSET S 04/01/2021 LIA BILIT IES A ND EQUIT Y 04/01/2021
Ca sh a n d ca sh equ iv a len ts 1 ,7 03 Tr a de pa y a bles 5 3 ,6 4 5
A ccou n ts r eceiv a ble 2 2 5 ,2 4 9 Socia l secu r ity a n d la bor oblig a t ion s 2 4 ,6 8 5
Pr ov ision for ex pected cr edit loss (“ PECL” ) (7 ,7 8 1 ) Ta x pa y a bles 1 2 ,5 2 9
In v en tor y 6 9 ,4 6 2 Lea se lia bility 1 ,07 8
Oth er a ssets 3 ,7 9 3 Oth er pa y a bles a n d pr ov ision s 8 ,2 08
T ot a l cu rrent a sset s 292,426 T ot a l cu rrent l ia bilit ies 100,145
Non-cu rrent
long-t erm receiv a bles
Defer r ed in com e ta x a n d socia l con tr ibu tion 2 4 ,8 5 1
Pr oper ty , pla n t a n d equ ipm en t 2 5 7 ,4 9 6 A ctu a r ia l lia bilit ies 4 7 ,6 8 6
In ta n g ible a ssets 7 ,2 3 3 Defer r ed in com e ta x a n d socia l con tr ibu tion 9 ,5 9 9
Rig h t of u se a sset 1 ,2 9 7 Lea se lia bility 2 1 9
Oth er a ssets 1 7 4 Oth er pa y a bles a n d pr ov ision s 1 6 1
291,051 T ot a l non-cu rrent l ia bilit ies 57,665
T ot a l net a sset s 425,667
(A free translation of the original in Portuguese)
KLABIN S.A.
All amounts in thousands of Reais
Most of the investments, totaling R$ 251 million, will be used to increase the capacity for converting paper into packaging, with two new printers to be installed at the Betim (MG) and Goiana (PE) units and a new line of bags for miscellaneous hazardous materials at the unit in Lages (SC). The other projects are distributed across all of Klabin's operating segments and are substantially focused on cost optimization. 1.15 Construction of the Port of Paranaguá As communicated to the market on August 13, 2019, in an auction held at B3's São Paulo’s stock exchange, Klabin S.A. won the tender for the warehouse in the Port of Paranaguá to carry out unloading, loading and storage activities involving general cargo, especially paper and pulp. The Company's purpose in the Port of Paranaguá is due to this port being key to the Company’s export volume, targeting both current and projected considering the new paper machines of the Puma II Project. It will guarantee operations in the long-term, allowing direct rail connection of the manufacturing operations to the Terminal in the primary zone, with high loading efficiency and berthing preference. The lease guarantees access to an area of 27,530 m2 for a period of 25 years, subject to extension for another 45 years; R$144 million is expected to be allocated to the construction of the warehouse, and the start of operations is scheduled for the second half of 2022. On October 31, 2019, the wholly-owned subsidiary “Klabin Paranaguá SPE S.A..” headquartered in the municipality of Paranaguá – PR, was organized with subscribed and paid-in capital of R$ 20 million divided into 20,000 registered shares with no par value, and on May 10, 2021, an Advance for Future Capital Increase was approved by Klabin SA in the amount of R$80 million, which should occur within up to 120 days after the end of fiscal year 2021, in order to make the planned investments possible. 1.16 Closing of Special Partnership Companiy Monte Alegre On September 24, 2021, the Special Partnership Company Monte Alegre (“SPC Monte Alegre”) was merged by determination of its partners, after closing this company's operations. In the assets settlement, there was payment of R$50,000 to the investing partners relating to the interest they held in the company, R$1,100 in dividends, and R$3,100 in additional dividends, while the Company absorbed the remaining net assets, comprising R$119,773 in cash and cash equivalents, R$186,780 in biological assets, and R$69,685 in other liabilities. 1.17 Impacts of COVID-19 The Company is actively working on preventive measures to help control the spread of Coronavirus (COVID-19), reinforcing hygiene protocols, spreading information on the topic through its internal communication channels and following the guidelines of the World Health Organization (WHO), maintaining virtual internal events, and restricting travel, adopting flexible work routines to avoid crowding through electronic means of communication, among other initiatives. To date, management has not identified any significant impacts on Company operations, maintaining its forecasts of production, sales, and shipment of products, which are part of the supply chain of essential items for the population, related to the food segment, cleaning and personal and hospital hygiene products, whose market boomed in order to meet current demands. In relation to Puma II project, additional expenses of R$ 159,000 were required so as to cover delays and schedule
(A free translation of the original in Portuguese)
KLABIN S.A.
All amounts in thousands of Reais
adjustments , which were absorbed by the project's contingent budget, without changing its overall budget. Regarding financial market volatility, including the effects of the devaluation of Brazilian currency against the US dollar, the Company has a robust cash position and an extended debt profile. Additionally, in spite of the foreign exchange effects recorded in “Finance Income (Costs)” in referred to quarterly information, according to the analysis of the currency risk exposure mentioned in Note 28, this effect is not material on the Company's cash since it is substantially linked to loans and long-term foreign currency financing, will be offset against projected cash flow from export revenue, and exceed, or approximate, the payment flow of the respective liabilities. Additionally, the Company implemented a cash flow hedge accounting program as of January 4, 2021, reducing the volatilities caused by the recording of unrealized exchange variations in the result (see note 27), bringing the result closer to the Company’s cash flow generation. In view of the current scenario, and in line with the requirements of the Brazilian Securities and Exchange Commission (“CVM”), Company management analyzed any impacts due to an increase in expected losses or a significant change in the risks to which the Company is exposed (Note 28) based on the estimates, judgments and assumptions that could affect the recoverability of Company assets and measurement of the provisions presented in referred to quarterly information. This review considered the subsequent events that occurred up to the date of issue of this quarterly information and no significant impacts were identified that should be reflected in the quarterly information for the three and nine-month periods ended September 30, 2021. 2 BASIS OF PRESENTATION OF THE QUARTERLY INFORMATION AND
SIGNIFICANT ACCOUNTING PRACTICES
2.1 Basis of presentation of the quarterly information The Company presents the individual and consolidated Quarterly Information in accordance with NBC TG 21 (R4) - Interim Statement, issued by the CFC - Conselho Federal de Contabilidade and IAS 34 - Interim Financial Report, issued by the IASB - International Accounting Standards Board, applicable the preparation of the Quarterly Information - ITR, and presented in a manner consistent with the rules established by CVM - Comissão de Valores Mobiliários. The Quarterly Information was prepared considering the historical cost as a basis of value, which, in the case of financial assets measured at fair value through profit or loss, other financial assets and liabilities and biological assets are adjusted to reflect the measurement at fair value. 2.2 Summary of significant accounting practices adopted and statement of compliance
The accounting practices adopted by the Company and its subsidiaries in the preparation of this Quarterly Information for the three and nine-month periods ended September 30, 2021 are consistent with those applied in the preparation of the last Annual Financial Statements as of December 31, 2020 and described in Note 2, except for the application of hedge accounting adopted as from January 4, 2021, whose accounting practice is described below. This Quarterly Information should be read in conjunction with those Annual Financial Statements disclosed on February 10, 2021. The quarterly information for the three and nine-month periods ended September 30, 2021 contains all information that is relevant for obtaining an understanding of the Company's financial position in the period.
(A free translation of the original in Portuguese)
KLABIN S.A.
All amounts in thousands of Reais
a) Hedge accounting / cash flow hedge
Based on CPC 48 - Financial Instruments / IFRS 9 - Financial Instruments, as from January 2021, the Company adopted the cash flow hedge accounting for highly probable future transactions, designating as hedging instruments its debts raised and/or converted by SWAP instruments into US dollars (USD) to protect its revenues in USD (hedged items), both nominally denominated in USD. This practice is aligned with the risk strategy adopted by management, which seeks to demonstrate the equalization between the effects of exchange rate variations in the statement of financial position to the extent that they are effectively realized and their cash effect. The SWAPs agreed by the Company are considered “matched” transactions, directly linked to specific financing transactions, and result in the conversion of a specific loan and financing in domestic currency into a foreign currency transaction. Accordingly, the underlying risk involved in the SWAP is identical to the item protected in its hedge accounting program, therefore, such operations are included in hedging instruments. The Company designates in its hedge program the spot element of the exchange rate involved in the financial instruments designated in the hedge. Changes in fair value of the future element of foreign exchange contracts (forward points) involved in SWAP operations included in the hedge are also recognized in equity under “Equity valuation adjustments”, however in a separate book account comprising the cost of the hedge. The effects of exchange variation (fair value) of the financial instruments designated in the hedge (loans, financing and swaps) are recorded in equity, under “Equity valuation adjustments”, net of deferred income and social contribution taxes. To the extent that the respective revenue in USD designated in the hedge accounting program is generated, the respective exchange variation accumulated in “Equity valuation adjustments” will be matched against the hedged item in P&L, under “Net sales revenue”. The Company evaluates the effectiveness of its hedge program through effectiveness tests using the criteria established in referred to accounting pronouncements, comparing changes in fair value of the hedging instrument with changes in fair value of the hedged item in relation to the hedged risk. If the hedging relationship is not effective within the limits established in relation to the desired protection, the ineffective portion of the effects of exchange rate variations on loans and financing are reclassified to the statement of profit or loss under "Finance income/(costs)". Changes in the hedge accounting program are recognized in the calculation of comprehensive income for the period. 3 CONSOLIDATED QUARTERLY INFORMATION
The subsidiaries are fully consolidated from the date of acquisition of the control, and continue to be consolidated until the date when this control ceases to exist, except the subsidiaries that have joint control (joint venture) with other entities, which are evaluated by the equity accounting method both in the individual and consolidated quarterly information. The quarterly information of the subsidiaries are prepared for the same reporting periods as those of the parent company, using accounting policies that are consistent with the policies adopted by the parent company. For the consolidation, the following criteria are adopted: (i) elimination of investments in subsidiaries, as well as the results of equity investments and (ii) elimination of profits
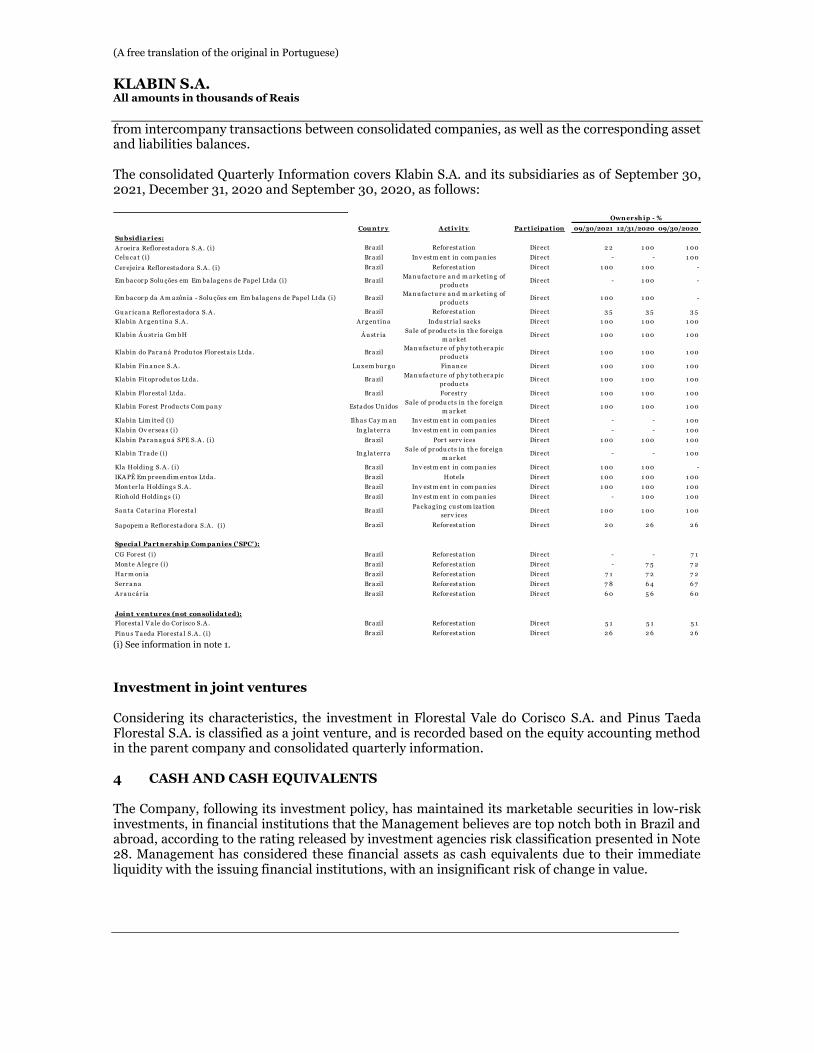
(A free translation of the original in Portuguese)
KLABIN S.A.
All amounts in thousands of Reais
from intercompany transactions between consolidated companies, as well as the corresponding asset and liabilities balances. The consolidated Quarterly Information covers Klabin S.A. and its subsidiaries as of September 30, 2021, December 31, 2020 and September 30, 2020, as follows:
(i) See information in note 1.
Investment in joint ventures
Considering its characteristics, the investment in Florestal Vale do Corisco S.A. and Pinus Taeda Florestal S.A. is classified as a joint venture, and is recorded based on the equity accounting method in the parent company and consolidated quarterly information. 4 CASH AND CASH EQUIVALENTS
The Company, following its investment policy, has maintained its marketable securities in low-risk investments, in financial institutions that the Management believes are top notch both in Brazil and abroad, according to the rating released by investment agencies risk classification presented in Note 28. Management has considered these financial assets as cash equivalents due to their immediate liquidity with the issuing financial institutions, with an insignificant risk of change in value.
Cou nt ry A ct iv it y Pa rt icipa t ion 09/30/2021 12/31/2020 09/30/2020
Su bsidia ries:
A r oeir a Reflor esta dor a S.A . (i) Br a zil Refor esta t ion Dir ect 2 2 1 00 1 00
Celu ca t (i) Br a zil In v estm en t in com pa n ies Dir ect - - 1 00
Cer ejeir a Reflor esta dor a S.A . (i) Br a zil Refor esta t ion Dir ect 1 00 1 00 -
Em ba cor p Solu ções em Em ba la g en s de Pa pel Ltda (i) Br a zilMa n u fa ctu r e a n d m a r ket in g of
pr odu ctsDir ect - 1 00 -
Em ba cor p da A m a zôn ia - Solu ções em Em ba la g en s de Pa pel Ltda (i) Br a zilMa n u fa ctu r e a n d m a r ket in g of
pr odu ctsDir ect 1 00 1 00 -
Gu a r ica n a Reflor esta dor a S.A . Br a zil Refor esta t ion Dir ect 3 5 3 5 3 5
Kla bin A r g en tin a S.A . A r g en tin a In du str ia l sa cks Dir ect 1 00 1 00 1 00
Kla bin Á u str ia Gm bH Á u str iaSa le of pr odu cts in th e for eig n
m a r ketDir ect 1 00 1 00 1 00
Kla bin do Pa r a n á Pr odu tos Flor esta is Ltda . Br a zilMa n u fa ctu r e of ph y toth er a pic
pr odu ctsDir ect 1 00 1 00 1 00
Kla bin Fin a n ce S.A . Lu x em bu r g o Fin a n ce Dir ect 1 00 1 00 1 00
Kla bin Fitopr odu tos Ltda . Br a zilMa n u fa ctu r e of ph y toth er a pic
pr odu ctsDir ect 1 00 1 00 1 00
Kla bin Flor esta l Ltda . Br a zil For estr y Dir ect 1 00 1 00 1 00
Kla bin For est Pr odu cts Com pa n y Esta dos Un idosSa le of pr odu cts in th e for eig n
m a r ketDir ect 1 00 1 00 1 00
Kla bin Lim ited (i) Ilh a s Ca y m a n In v estm en t in com pa n ies Dir ect - - 1 00
Kla bin Ov er sea s (i) In g la ter r a In v estm en t in com pa n ies Dir ect - - 1 00
Kla bin Pa r a n a g u á SPE S.A . (i) Br a zil Por t ser v ices Dir ect 1 00 1 00 1 00
Kla bin Tr a de (i) In g la ter r aSa le of pr odu cts in th e for eig n
m a r ketDir ect - - 1 00
Kla Holdin g S.A . (i) Br a zil In v estm en t in com pa n ies Dir ect 1 00 1 00 -
IKA PÊ Em pr een dim en tos Ltda . Br a zil Hotels Dir ect 1 00 1 00 1 00
Mon ter la Holdin g s S.A . Br a zil In v estm en t in com pa n ies Dir ect 1 00 1 00 1 00
Rioh old Holdin g s (i) Br a zil In v estm en t in com pa n ies Dir ect - 1 00 1 00
Sa n ta Ca ta r in a Flor esta l Br a zilPa cka g in g cu stom iza t ion
ser v icesDir ect 1 00 1 00 1 00
Sa popem a Reflor esta dor a S.A . (i) Br a zil Refor esta t ion Dir ect 2 0 2 6 2 6
CG For est (i) Br a zil Refor esta t ion Dir ect - - 7 1
Mon te A leg r e (i) Br a zil Refor esta t ion Dir ect - 7 5 7 2
Ha r m on ia Br a zil Refor esta t ion Dir ect 7 1 7 2 7 2
Ser r a n a Br a zil Refor esta t ion Dir ect 7 8 6 4 6 7
A r a u cá r ia Br a zil Refor esta t ion Dir ect 6 0 5 6 6 0
Flor esta l V a le do Cor isco S.A . Br a zil Refor esta t ion Dir ect 5 1 5 1 5 1
Pin u s Ta eda Flor esta l S.A . (i) Br a zil Refor esta t ion Dir ect 2 6 2 6 2 6
Specia l Pa rt nersh ip Com pa nies ('SPC'):
Join t v ent u res (not con solida t ed):
Ownersh ip - %
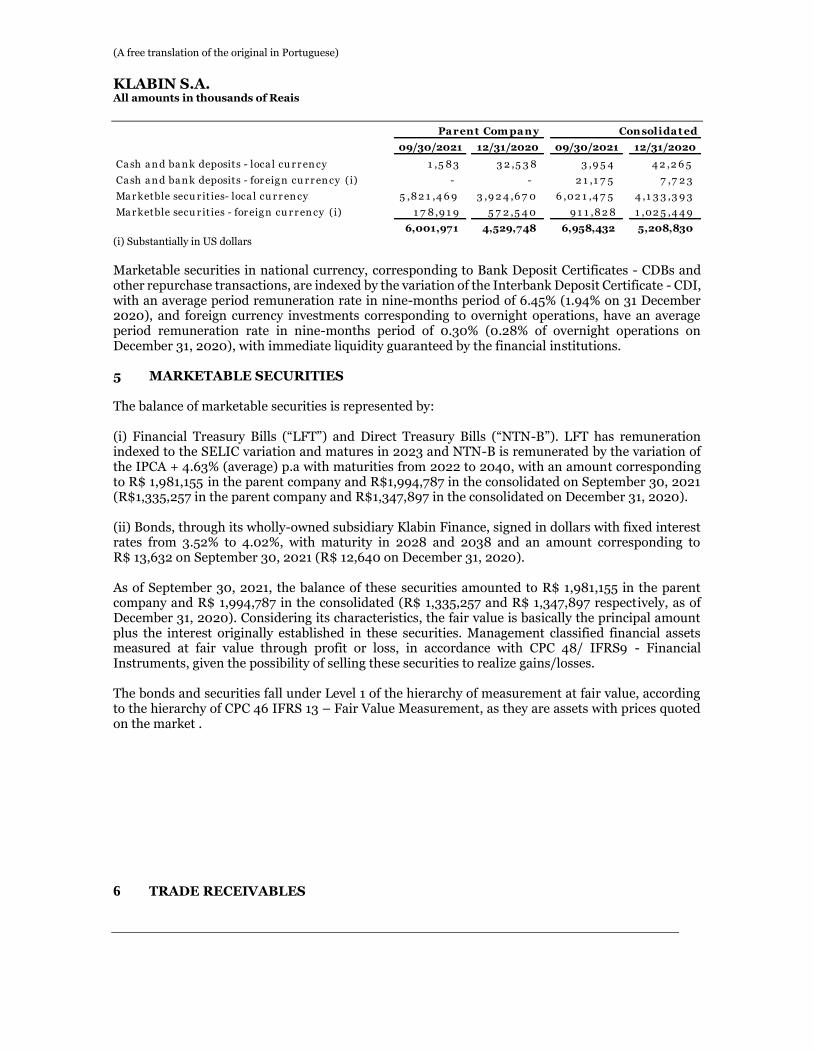
(A free translation of the original in Portuguese)
KLABIN S.A.
All amounts in thousands of Reais
(i) Substantially in US dollars
Marketable securities in national currency, corresponding to Bank Deposit Certificates - CDBs and other repurchase transactions, are indexed by the variation of the Interbank Deposit Certificate - CDI, with an average period remuneration rate in nine-months period of 6.45% (1.94% on 31 December 2020), and foreign currency investments corresponding to overnight operations, have an average period remuneration rate in nine-months period of 0.30% (0.28% of overnight operations on December 31, 2020), with immediate liquidity guaranteed by the financial institutions. 5 MARKETABLE SECURITIES The balance of marketable securities is represented by: (i) Financial Treasury Bills (“LFT”) and Direct Treasury Bills (“NTN-B”). LFT has remuneration indexed to the SELIC variation and matures in 2023 and NTN-B is remunerated by the variation of the IPCA + 4.63% (average) p.a with maturities from 2022 to 2040, with an amount corresponding to R$ 1,981,155 in the parent company and R$1,994,787 in the consolidated on September 30, 2021 (R$1,335,257 in the parent company and R$1,347,897 in the consolidated on December 31, 2020). (ii) Bonds, through its wholly-owned subsidiary Klabin Finance, signed in dollars with fixed interest rates from 3.52% to 4.02%, with maturity in 2028 and 2038 and an amount corresponding to R$ 13,632 on September 30, 2021 (R$ 12,640 on December 31, 2020). As of September 30, 2021, the balance of these securities amounted to R$ 1,981,155 in the parent company and R$ 1,994,787 in the consolidated (R$ 1,335,257 and R$ 1,347,897 respectively, as of December 31, 2020). Considering its characteristics, the fair value is basically the principal amount plus the interest originally established in these securities. Management classified financial assets measured at fair value through profit or loss, in accordance with CPC 48/ IFRS9 - Financial Instruments, given the possibility of selling these securities to realize gains/losses. The bonds and securities fall under Level 1 of the hierarchy of measurement at fair value, according to the hierarchy of CPC 46 IFRS 13 – Fair Value Measurement, as they are assets with prices quoted on the market .
6 TRADE RECEIVABLES
09/30/2021 12/31/2020 09/30/2021 12/31/2020
Ca sh a n d ba n k deposits - loca l cu r r en cy 1 ,5 8 3 3 2 ,5 3 8 3 ,9 5 4 4 2 ,2 6 5
Ca sh a n d ba n k deposits - for eig n cu r r en cy (i) - - 2 1 ,1 7 5 7 ,7 2 3
Ma r ketble secu r it ies- loca l cu r r en cy 5 ,8 2 1 ,4 6 9 3 ,9 2 4 ,6 7 0 6 ,02 1 ,4 7 5 4 ,1 3 3 ,3 9 3
Ma r ketble secu r it ies - for eig n cu r r en cy (i) 1 7 8 ,9 1 9 5 7 2 ,5 4 0 9 1 1 ,8 2 8 1 ,02 5 ,4 4 9
6,001,971 4,529,748 6,958,432 5,208,830
Parent Com pany Consolidat ed
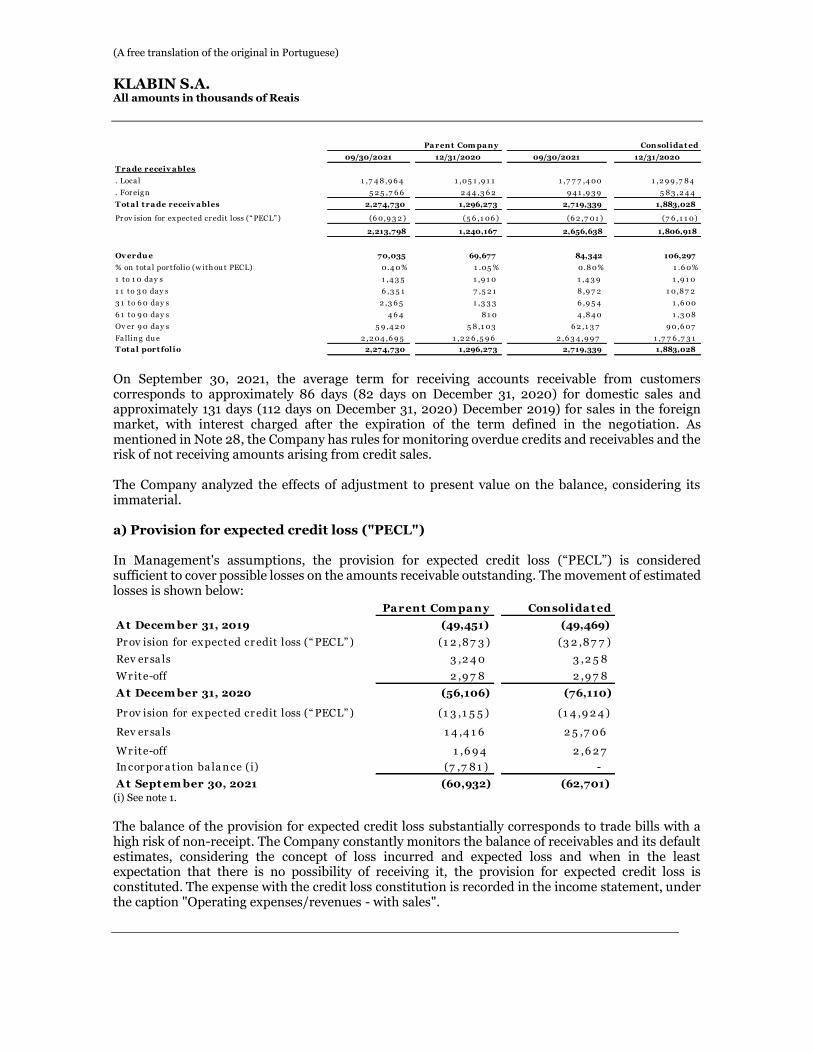
(A free translation of the original in Portuguese)
KLABIN S.A.
All amounts in thousands of Reais
On September 30, 2021, the average term for receiving accounts receivable from customers corresponds to approximately 86 days (82 days on December 31, 2020) for domestic sales and approximately 131 days (112 days on December 31, 2020) December 2019) for sales in the foreign market, with interest charged after the expiration of the term defined in the negotiation. As mentioned in Note 28, the Company has rules for monitoring overdue credits and receivables and the risk of not receiving amounts arising from credit sales. The Company analyzed the effects of adjustment to present value on the balance, considering its immaterial. a) Provision for expected credit loss ("PECL") In Management's assumptions, the provision for expected credit loss (“PECL”) is considered sufficient to cover possible losses on the amounts receivable outstanding. The movement of estimated losses is shown below:
(i) See note 1.
The balance of the provision for expected credit loss substantially corresponds to trade bills with a high risk of non-receipt. The Company constantly monitors the balance of receivables and its default estimates, considering the concept of loss incurred and expected loss and when in the least expectation that there is no possibility of receiving it, the provision for expected credit loss is constituted. The expense with the credit loss constitution is recorded in the income statement, under the caption "Operating expenses/revenues - with sales".
09/30/2021 12/31/2020 09/30/2021 12/31/2020
T ra de receiv a bles
. Loca l 1 ,7 4 8 ,9 6 4 1 ,05 1 ,9 1 1 1 ,7 7 7 ,4 00 1 ,2 9 9 ,7 8 4
. For eig n 5 2 5 ,7 6 6 2 4 4 ,3 6 2 9 4 1 ,9 3 9 5 8 3 ,2 4 4
T ot a l t ra de receiv a bles 2,274,730 1,296,273 2,719,339 1,883,028
Pr ov ision for ex pected cr edit loss (“ PECL” ) (6 0,9 3 2 ) (5 6 ,1 06 ) (6 2 ,7 01 ) (7 6 ,1 1 0)
2,213,798 1,240,167 2,656,638 1,806,918
Ov erdu e 70,035 69,677 84,342 106,297
% on tota l por tfolio (w ith ou t PECL) 0.4 0% 1 .05 % 0.8 0% 1 .6 0%
1 to 1 0 da y s 1 ,4 3 5 1 ,9 1 0 1 ,4 3 9 1 ,9 1 0
1 1 to 3 0 da y s 6 ,3 5 1 7 ,5 2 1 8 ,9 7 2 1 0,8 7 2
3 1 to 6 0 da y s 2 ,3 6 5 1 ,3 3 3 6 ,9 5 4 1 ,6 00
6 1 to 9 0 da y s 4 6 4 8 1 0 4 ,8 4 0 1 ,3 08
Ov er 9 0 da y s 5 9 ,4 2 0 5 8 ,1 03 6 2 ,1 3 7 9 0,6 07
Fa llin g du e 2 ,2 04 ,6 9 5 1 ,2 2 6 ,5 9 6 2 ,6 3 4 ,9 9 7 1 ,7 7 6 ,7 3 1
T ot a l port folio 2,274,730 1,296,273 2,719,339 1,883,028
Pa rent Com pa ny Consolida t ed
Parent Com pany Consolidat ed
A t Decem ber 31, 2019 (49,451) (49,469)
Pr ov ision for ex pected cr edit loss (“ PECL” ) (1 2 ,8 7 3 ) (3 2 ,8 7 7 )
Rev er sa ls 3 ,2 4 0 3 ,2 5 8
Wr ite-off 2 ,9 7 8 2 ,9 7 8
A t Decem ber 31, 2020 (56,106) (76,110)
Pr ov ision for ex pected cr edit loss (“ PECL” ) (1 3 ,1 5 5 ) (1 4 ,9 2 4 )
Rev er sa ls 1 4 ,4 1 6 2 5 ,7 06
Wr ite-off 1 ,6 9 4 2 ,6 2 7
In cor por a tion ba la n ce (i) (7 ,7 8 1 ) -
A t Sept em ber 30, 2021 (60,932) (62,701)
(A free translation of the original in Portuguese)
KLABIN S.A.
All amounts in thousands of Reais
The Company maintains an insurance policy for receivables in the domestic and foreign markets for all business units, except for wood customers of the Forestry unit, in addition to certain customers who do not meet specific risk requirements, such as continuity and liquidity, analyzed by the insurer to be incorporated into the insurance policy. The current insurance policy expires in October 2021.
b) Receivables discount operations
In the nine-month period ended September 30, 2021, receivables discount operations with no right of return were carried out with specific customers in the amount of R$ 1,284,765 in the parent company and R$ 2,717,181 in the consolidated (R$ 1,234,195 in the parent company and R$ 2,773,151 in the consolidated at December 31, 2020), for which all risks and benefits associated with the assets were transferred to the counterparty, so that the receivables anticipated with third parties were derecognized from the quarterly information The financial cost charged by the bank in the transaction is recorded in the income statement in the "Discounts and rebates" line (Note 21).

(A free translation of the original in Portuguese)
KLABIN S.A.
All amounts in thousands of Reais
7 RELATED PARTIES
a) Balances and transactions with related parties
(i) Balance receivable from product sales operations carried out at prices and terms (average of 180 days) under the conditions established between the parties;
(ii) Purchase of wood made at prices and terms (45 days) under the conditions established between the parties. It considers SPCs described in note 3;
(iii) Guarantee commission paid semiannually, calculated based on the 7th issue debenture contracts.
(iv) Supply of seedlings, seeds and services at prices and terms in the commercial conditions established between the parties;
(v) Advances on future capital subscriptions.
(vi) Bonds (notes) described in note 16
Kla bin Kla bin Specia l Pa r tn er sh ip Kla bin Kla bin For est
A r g en tin a Fin a n ce Com pa n ies A u str ia
Pr odu cts
Com pa n y Oth er s T ot a l T ot a l T ot a l
(i) (vi) (ii) e (iv) (i) (vi) (i)
T y pe of rela t ionsh ip Subs idiary Subs idiary Subs idiary Subs idiary Subs idiary
Ba la nces
Cu r r en t a ssets 1 5 8 ,4 2 5 - 1 4 ,2 3 1 1 9 8 ,05 6 3 7 ,3 2 0 7 ,08 9 415,121 675,185 928,677
Non -cu r r en t a ssets 3 2 - - - - 2 4 56 21,076 20,753
Cu r r en t lia bilit ies 5 2 1 2 1 ,3 5 9 1 0,1 7 4 4 2 ,1 7 8 3 4 (5 1 4 ) 73,752 273,364 76,559
Non -cu r r en t lia bilit ies - 3 ,6 3 0,7 9 9 - 1 0,7 2 9 ,2 1 7 - 1 14,360,017 12,793,815 14,592,389
T ra nsa ct ions
Sa les r ev en u e 6 3 ,9 3 6 - 4 2 ,4 05 2 ,7 07 ,6 8 2 5 5 ,3 4 1 7 0,4 6 2 2,939,826 - 2,801,304
Pu r ch a ses - - (1 6 7 ,3 9 6 ) - - (1 1 8 ,09 0) (285,485) - (122,234)
In ter est ex pen ses on fin a n cin g - (1 4 8 ,3 6 5 ) - (5 5 4 ,2 6 6 ) - - (702,632) - (839,460)
Gu a r a n tee com m ission - ex pen ses - - - - - (4 8 2 ) (482) - (2,318)
Roy a lty ex pen ses - - - - - - - - (50,293)
(i) (iii) (iv) e (v)
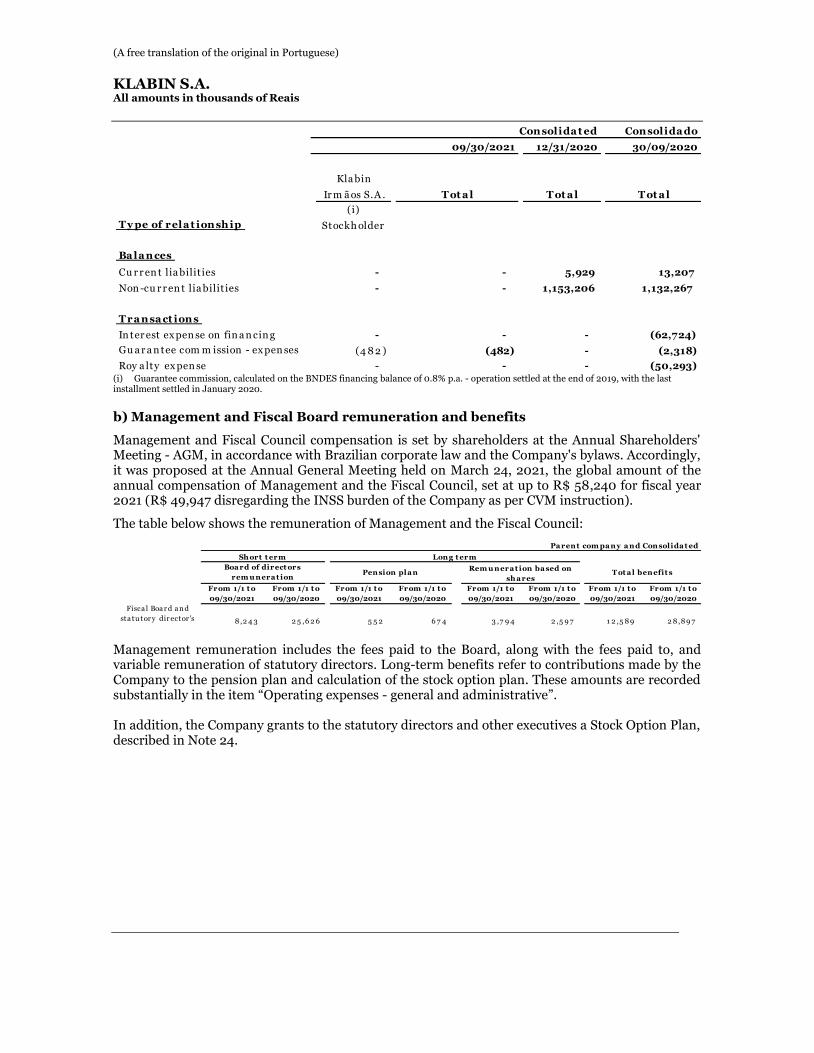
(A free translation of the original in Portuguese)
KLABIN S.A.
All amounts in thousands of Reais
(i) Guarantee commission, calculated on the BNDES financing balance of 0.8% p.a. - operation settled at the end of 2019, with the last installment settled in January 2020.
b) Management and Fiscal Board remuneration and benefits
Management and Fiscal Council compensation is set by shareholders at the Annual Shareholders' Meeting - AGM, in accordance with Brazilian corporate law and the Company's bylaws. Accordingly, it was proposed at the Annual General Meeting held on March 24, 2021, the global amount of the annual compensation of Management and the Fiscal Council, set at up to R$ 58,240 for fiscal year 2021 (R$ 49,947 disregarding the INSS burden of the Company as per CVM instruction).
The table below shows the remuneration of Management and the Fiscal Council:
Management remuneration includes the fees paid to the Board, along with the fees paid to, and variable remuneration of statutory directors. Long-term benefits refer to contributions made by the Company to the pension plan and calculation of the stock option plan. These amounts are recorded substantially in the item “Operating expenses - general and administrative”. In addition, the Company grants to the statutory directors and other executives a Stock Option Plan, described in Note 24.
Consolida t ed Consolida do
09/30/2021 12/31/2020 30/09/2020
Kla bin
Ir m ã os S.A . T ot a l T ot a l T ot a l
(i)
T y pe of rela t ionsh ip Stockh older
Ba la nces
Cu r r en t lia bilit ies - - 5,929 13,207
Non -cu r r en t lia bilit ies - - 1,153,206 1,132,267
T ra nsa ct ions
In ter est ex pen se on fin a n cin g - - - (62,724)
Gu a r a n tee com m ission - ex pen ses (4 8 2 ) (482) - (2,318)
Roy a lty ex pen se - - - (50,293)
From 1/1 t o
09/30/2021
From 1/1 t o
09/30/2020
From 1/1 t o
09/30/2021
From 1/1 t o
09/30/2020
From 1/1 t o
09/30/2021
From 1/1 t o
09/30/2020
From 1/1 t o
09/30/2021
From 1/1 t o
09/30/2020
Fisca l Boa r d a n d
sta tu tor y dir ector 's 8 ,2 4 3 2 5 ,6 2 6 5 5 2 6 7 4 3 ,7 9 4 2 ,5 9 7 1 2 ,5 8 9 2 8 ,8 9 7
Parent com pany and Consolidat ed
Sh ort t erm Long t erm
Board of direct ors
rem u nerat ionTot al benefit sPension plan
Rem u nerat ion based on
sh ares
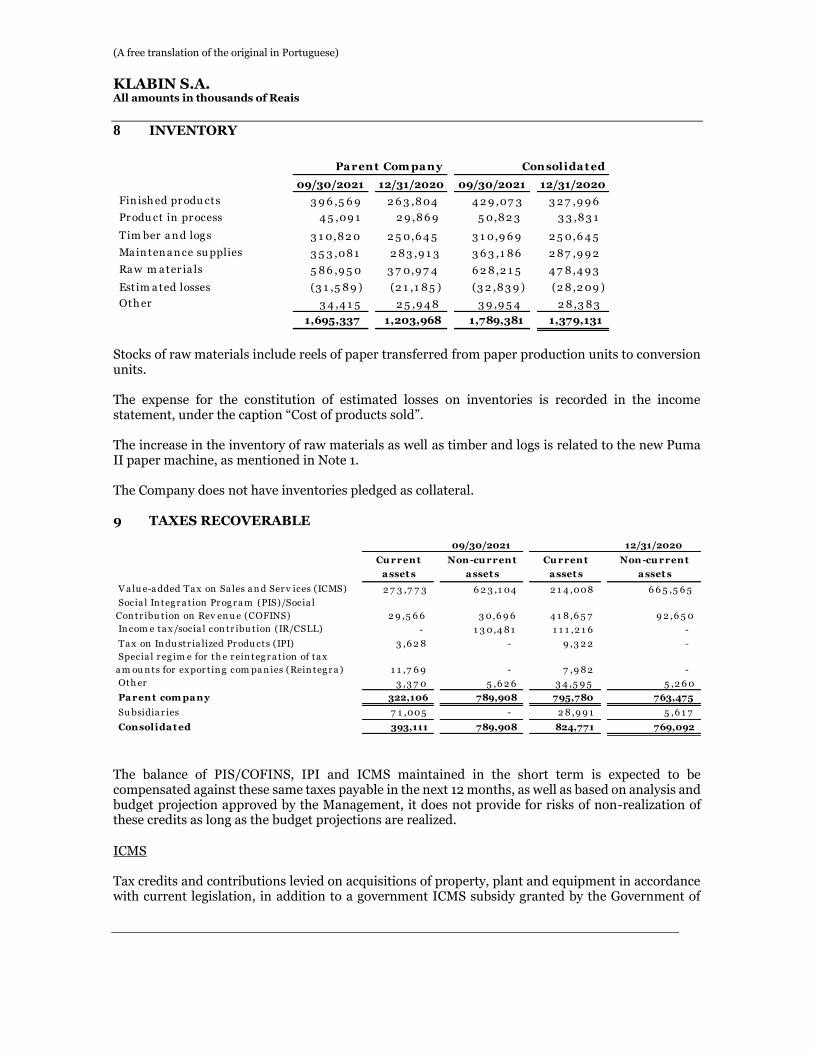
(A free translation of the original in Portuguese)
KLABIN S.A.
All amounts in thousands of Reais
8 INVENTORY
Stocks of raw materials include reels of paper transferred from paper production units to conversion units. The expense for the constitution of estimated losses on inventories is recorded in the income statement, under the caption “Cost of products sold”. The increase in the inventory of raw materials as well as timber and logs is related to the new Puma II paper machine, as mentioned in Note 1. The Company does not have inventories pledged as collateral.
9 TAXES RECOVERABLE
The balance of PIS/COFINS, IPI and ICMS maintained in the short term is expected to be compensated against these same taxes payable in the next 12 months, as well as based on analysis and budget projection approved by the Management, it does not provide for risks of non-realization of these credits as long as the budget projections are realized.
ICMS Tax credits and contributions levied on acquisitions of property, plant and equipment in accordance with current legislation, in addition to a government ICMS subsidy granted by the Government of
09/30/2021 12/31/2020 09/30/2021 12/31/2020
Fin ish ed pr odu cts 3 9 6 ,5 6 9 2 6 3 ,8 04 4 2 9 ,07 3 3 2 7 ,9 9 6
Pr odu ct in pr ocess 4 5 ,09 1 2 9 ,8 6 9 5 0,8 2 3 3 3 ,8 3 1
Tim ber a n d log s 3 1 0,8 2 0 2 5 0,6 4 5 3 1 0,9 6 9 2 5 0,6 4 5
Ma in ten a n ce su pplies 3 5 3 ,08 1 2 8 3 ,9 1 3 3 6 3 ,1 8 6 2 8 7 ,9 9 2
Ra w m a ter ia ls 5 8 6 ,9 5 0 3 7 0,9 7 4 6 2 8 ,2 1 5 4 7 8 ,4 9 3
Est im a ted losses (3 1 ,5 8 9 ) (2 1 ,1 8 5 ) (3 2 ,8 3 9 ) (2 8 ,2 09 )
Oth er 3 4 ,4 1 5 2 5 ,9 4 8 3 9 ,9 5 4 2 8 ,3 8 3
1,695,337 1,203,968 1,789,381 1,379,131
Parent Com pany Consolidat ed
09/30/2021 12/31/2020
Cu rrent Non-cu rrent Cu rrent Non-cu rrent
a sset s a sset s a sset s a sset s
V a lu e-a dded Ta x on Sa les a n d Ser v ices (ICMS) 2 7 3 ,7 7 3 6 2 3 ,1 04 2 1 4 ,008 6 6 5 ,5 6 5
Socia l In teg r a t ion Pr og r a m (PIS)/Socia l
Con tr ibu tion on Rev en u e (COFINS) 2 9 ,5 6 6 3 0,6 9 6 4 1 8 ,6 5 7 9 2 ,6 5 0
In com e ta x /socia l con tr ibu tion (IR/CSLL) - 1 3 0,4 8 1 1 1 1 ,2 1 6 -
Ta x on In du str ia lized Pr odu cts (IPI) 3 ,6 2 8 - 9 ,3 2 2 -
Specia l r eg im e for th e r ein teg r a t ion of ta x
a m ou n ts for ex por t in g com pa n ies (Rein teg r a ) 1 1 ,7 6 9 - 7 ,9 8 2 -
Oth er 3 ,3 7 0 5 ,6 2 6 3 4 ,5 9 5 5 ,2 6 0
Pa rent com pa ny 322,106 789,908 795,780 763,475
Su bsidia r ies 7 1 ,005 - 2 8 ,9 9 1 5 ,6 1 7
Consolida t ed 393,111 789,908 824,771 769,092
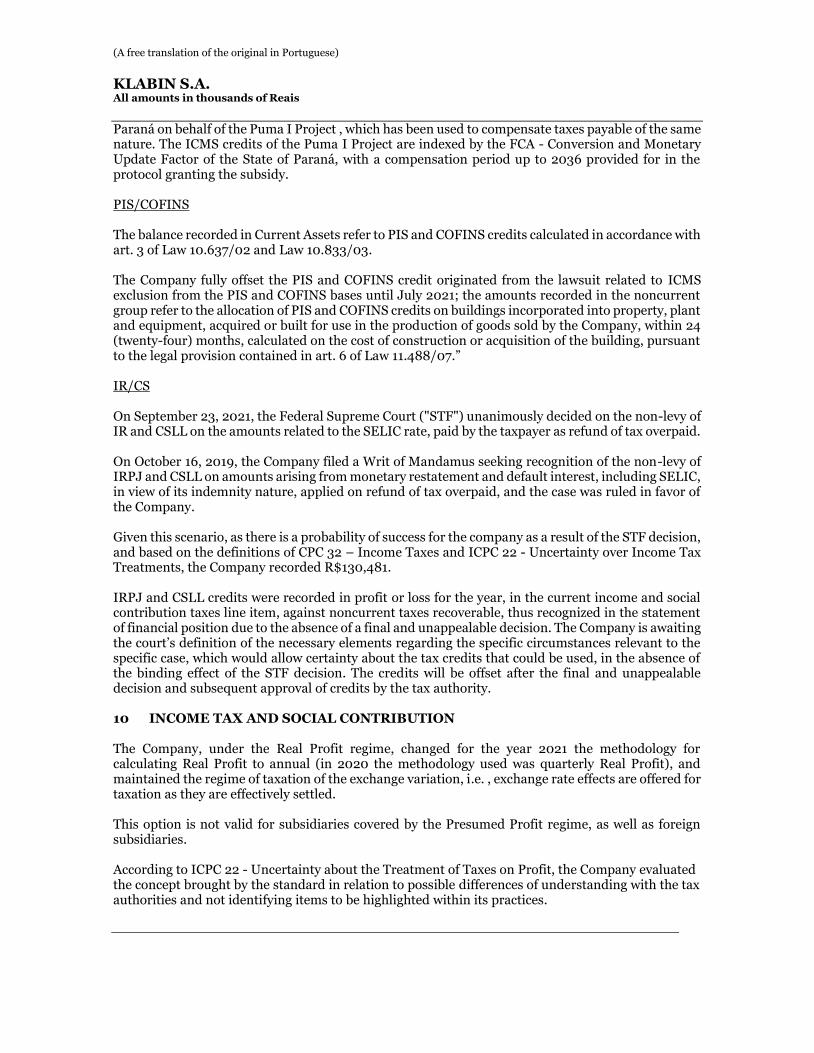
(A free translation of the original in Portuguese)
KLABIN S.A.
All amounts in thousands of Reais
Paraná on behalf of the Puma I Project , which has been used to compensate taxes payable of the same nature. The ICMS credits of the Puma I Project are indexed by the FCA - Conversion and Monetary Update Factor of the State of Paraná, with a compensation period up to 2036 provided for in the protocol granting the subsidy. PIS/COFINS The balance recorded in Current Assets refer to PIS and COFINS credits calculated in accordance with art. 3 of Law 10.637/02 and Law 10.833/03. The Company fully offset the PIS and COFINS credit originated from the lawsuit related to ICMS exclusion from the PIS and COFINS bases until July 2021; the amounts recorded in the noncurrent group refer to the allocation of PIS and COFINS credits on buildings incorporated into property, plant and equipment, acquired or built for use in the production of goods sold by the Company, within 24 (twenty-four) months, calculated on the cost of construction or acquisition of the building, pursuant to the legal provision contained in art. 6 of Law 11.488/07.” IR/CS On September 23, 2021, the Federal Supreme Court ("STF") unanimously decided on the non-levy of IR and CSLL on the amounts related to the SELIC rate, paid by the taxpayer as refund of tax overpaid. On October 16, 2019, the Company filed a Writ of Mandamus seeking recognition of the non-levy of IRPJ and CSLL on amounts arising from monetary restatement and default interest, including SELIC, in view of its indemnity nature, applied on refund of tax overpaid, and the case was ruled in favor of the Company. Given this scenario, as there is a probability of success for the company as a result of the STF decision, and based on the definitions of CPC 32 – Income Taxes and ICPC 22 - Uncertainty over Income Tax Treatments, the Company recorded R$130,481. IRPJ and CSLL credits were recorded in profit or loss for the year, in the current income and social contribution taxes line item, against noncurrent taxes recoverable, thus recognized in the statement of financial position due to the absence of a final and unappealable decision. The Company is awaiting the court’s definition of the necessary elements regarding the specific circumstances relevant to the specific case, which would allow certainty about the tax credits that could be used, in the absence of the binding effect of the STF decision. The credits will be offset after the final and unappealable decision and subsequent approval of credits by the tax authority. 10 INCOME TAX AND SOCIAL CONTRIBUTION
The Company, under the Real Profit regime, changed for the year 2021 the methodology for calculating Real Profit to annual (in 2020 the methodology used was quarterly Real Profit), and maintained the regime of taxation of the exchange variation, i.e. , exchange rate effects are offered for taxation as they are effectively settled. This option is not valid for subsidiaries covered by the Presumed Profit regime, as well as foreign subsidiaries. According to ICPC 22 - Uncertainty about the Treatment of Taxes on Profit, the Company evaluated the concept brought by the standard in relation to possible differences of understanding with the tax authorities and not identifying items to be highlighted within its practices.
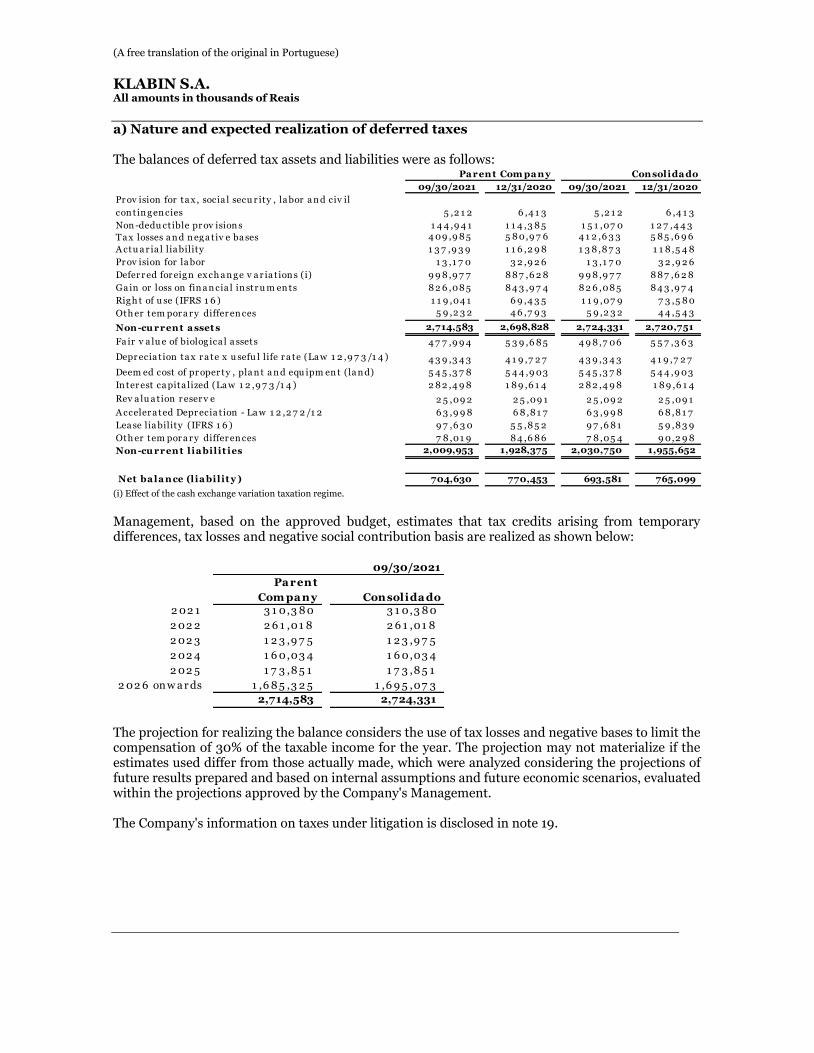
(A free translation of the original in Portuguese)
KLABIN S.A.
All amounts in thousands of Reais
a) Nature and expected realization of deferred taxes
The balances of deferred tax assets and liabilities were as follows:
(i) Effect of the cash exchange variation taxation regime.
Management, based on the approved budget, estimates that tax credits arising from temporary differences, tax losses and negative social contribution basis are realized as shown below:
The projection for realizing the balance considers the use of tax losses and negative bases to limit the compensation of 30% of the taxable income for the year. The projection may not materialize if the estimates used differ from those actually made, which were analyzed considering the projections of future results prepared and based on internal assumptions and future economic scenarios, evaluated within the projections approved by the Company's Management. The Company's information on taxes under litigation is disclosed in note 19.
09/30/2021 12/31/2020 09/30/2021 12/31/2020
Pr ov ision for ta x , socia l secu r ity , la bor a n d civ il
con tin g en cies 5 ,2 1 2 6 ,4 1 3 5 ,2 1 2 6 ,4 1 3
Non -dedu ctible pr ov ision s 1 4 4 ,9 4 1 1 1 4 ,3 8 5 1 5 1 ,07 0 1 2 7 ,4 4 3
Ta x losses a n d n eg a tiv e ba ses 4 09 ,9 8 5 5 8 0,9 7 6 4 1 2 ,6 3 3 5 8 5 ,6 9 6
A ctu a r ia l lia bility 1 3 7 ,9 3 9 1 1 6 ,2 9 8 1 3 8 ,8 7 3 1 1 8 ,5 4 8
Pr ov ision for la bor 1 3 ,1 7 0 3 2 ,9 2 6 1 3 ,1 7 0 3 2 ,9 2 6
Defer r ed for eig n ex ch a n g e v a r ia t ion s (i) 9 9 8 ,9 7 7 8 8 7 ,6 2 8 9 9 8 ,9 7 7 8 8 7 ,6 2 8
Ga in or loss on fin a n cia l in str u m en ts 8 2 6 ,08 5 8 4 3 ,9 7 4 8 2 6 ,08 5 8 4 3 ,9 7 4
Rig h t of u se (IFRS 1 6 ) 1 1 9 ,04 1 6 9 ,4 3 5 1 1 9 ,07 9 7 3 ,5 8 0
Oth er tem por a r y differ en ces 5 9 ,2 3 2 4 6 ,7 9 3 5 9 ,2 3 2 4 4 ,5 4 3
Non-cu rrent a sset s 2,714,583 2,698,828 2,724,331 2,720,751
Fa ir v a lu e of biolog ica l a ssets 4 7 7 ,9 9 4 5 3 9 ,6 8 5 4 9 8 ,7 06 5 5 7 ,3 6 3
Depr ecia t ion ta x r a te x u sefu l life r a te (La w 1 2 ,9 7 3 /1 4 ) 4 3 9 ,3 4 3 4 1 9 ,7 2 7 4 3 9 ,3 4 3 4 1 9 ,7 2 7
Deem ed cost of pr oper ty , pla n t a n d equ ipm en t (la n d) 5 4 5 ,3 7 8 5 4 4 ,9 03 5 4 5 ,3 7 8 5 4 4 ,9 03
In ter est ca pita lized (La w 1 2 ,9 7 3 /1 4 ) 2 8 2 ,4 9 8 1 8 9 ,6 1 4 2 8 2 ,4 9 8 1 8 9 ,6 1 4
Rev a lu a t ion r eser v e 2 5 ,09 2 2 5 ,09 1 2 5 ,09 2 2 5 ,09 1
A cceler a ted Depr ecia t ion - La w 1 2 ,2 7 2 /1 2 6 3 ,9 9 8 6 8 ,8 1 7 6 3 ,9 9 8 6 8 ,8 1 7
Lea se lia bility (IFRS 1 6 ) 9 7 ,6 3 0 5 5 ,8 5 2 9 7 ,6 8 1 5 9 ,8 3 9
Oth er tem por a r y differ en ces 7 8 ,01 9 8 4 ,6 8 6 7 8 ,05 4 9 0,2 9 8
Non-cu rrent l ia bilit ies 2,009,953 1,928,375 2,030,750 1,955,652
Net ba la nce (lia bilit y ) 704,630 770,453 693,581 765,099
Pa rent Com pa ny Consolida do
Pa rent
Com pa ny Consolida do2 02 1 3 1 0,3 8 0 3 1 0,3 8 0
2 02 2 2 6 1 ,01 8 2 6 1 ,01 8
2 02 3 1 2 3 ,9 7 5 1 2 3 ,9 7 5
2 02 4 1 6 0,03 4 1 6 0,03 4
2 02 5 1 7 3 ,8 5 1 1 7 3 ,8 5 1
2 02 6 on w a r ds 1 ,6 8 5 ,3 2 5 1 ,6 9 5 ,07 3
2,714,583 2,724,331
09/30/2021
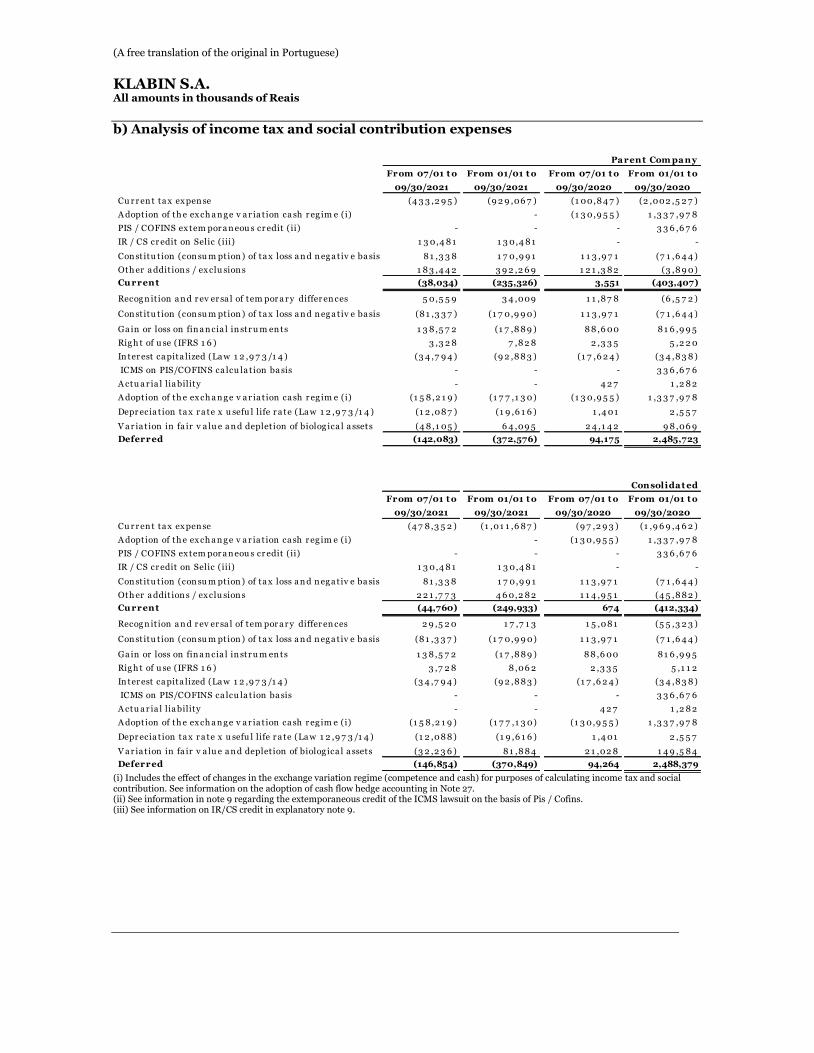
(A free translation of the original in Portuguese)
KLABIN S.A.
All amounts in thousands of Reais
b) Analysis of income tax and social contribution expenses
(i) Includes the effect of changes in the exchange variation regime (competence and cash) for purposes of calculating income tax and social contribution. See information on the adoption of cash flow hedge accounting in Note 27. (ii) See information in note 9 regarding the extemporaneous credit of the ICMS lawsuit on the basis of Pis / Cofins. (iii) See information on IR/CS credit in explanatory note 9.
From 07/01 t o From 01/01 t o From 07/01 t o From 01/01 t o
09/30/2021 09/30/2021 09/30/2020 09/30/2020
Cu r r en t ta x ex pen se (4 3 3 ,2 9 5 ) (9 2 9 ,06 7 ) (1 00,8 4 7 ) (2 ,002 ,5 2 7 )
A doption of th e ex ch a n g e v a r ia t ion ca sh r eg im e (i) - (1 3 0,9 5 5 ) 1 ,3 3 7 ,9 7 8
PIS / COFINS ex tem por a n eou s cr edit (ii) - - - 3 3 6 ,6 7 6
IR / CS cr edit on Selic (iii) 1 3 0,4 8 1 1 3 0,4 8 1 - -
Con st itu t ion (con su m ption ) of ta x loss a n d n eg a tiv e ba sis 8 1 ,3 3 8 1 7 0,9 9 1 1 1 3 ,9 7 1 (7 1 ,6 4 4 )
Oth er a ddit ion s / ex clu sion s 1 8 3 ,4 4 2 3 9 2 ,2 6 9 1 2 1 ,3 8 2 (3 ,8 9 0)
Cu rrent (38,034) (235,326) 3,551 (403,407)
Recog n it ion a n d r ev er sa l of tem por a r y differ en ces 5 0,5 5 9 3 4 ,009 1 1 ,8 7 8 (6 ,5 7 2 )
Con st itu t ion (con su m ption ) of ta x loss a n d n eg a tiv e ba sis (8 1 ,3 3 7 ) (1 7 0,9 9 0) 1 1 3 ,9 7 1 (7 1 ,6 4 4 )
Ga in or loss on fin a n cia l in str u m en ts 1 3 8 ,5 7 2 (1 7 ,8 8 9 ) 8 8 ,6 00 8 1 6 ,9 9 5
Rig h t of u se (IFRS 1 6 ) 3 ,3 2 8 7 ,8 2 8 2 ,3 3 5 5 ,2 2 0
In ter est ca pita lized (La w 1 2 ,9 7 3 /1 4 ) (3 4 ,7 9 4 ) (9 2 ,8 8 3 ) (1 7 ,6 2 4 ) (3 4 ,8 3 8 )
ICMS on PIS/COFINS ca lcu la t ion ba sis - - - 3 3 6 ,6 7 6
A ctu a r ia l lia bility - - 4 2 7 1 ,2 8 2
A doption of th e ex ch a n g e v a r ia t ion ca sh r eg im e (i) (1 5 8 ,2 1 9 ) (1 7 7 ,1 3 0) (1 3 0,9 5 5 ) 1 ,3 3 7 ,9 7 8
Depr ecia t ion ta x r a te x u sefu l life r a te (La w 1 2 ,9 7 3 /1 4 ) (1 2 ,08 7 ) (1 9 ,6 1 6 ) 1 ,4 01 2 ,5 5 7
V a r ia t ion in fa ir v a lu e a n d deplet ion of biolog ica l a ssets (4 8 ,1 05 ) 6 4 ,09 5 2 4 ,1 4 2 9 8 ,06 9
Deferred (142,083) (372,576) 94,175 2,485,723
Pa rent Com pa ny
From 07/01 t o From 01/01 t o From 07/01 t o From 01/01 t o
09/30/2021 09/30/2021 09/30/2020 09/30/2020
Cu r r en t ta x ex pen se (4 7 8 ,3 5 2 ) (1 ,01 1 ,6 8 7 ) (9 7 ,2 9 3 ) (1 ,9 6 9 ,4 6 2 )
A doption of th e ex ch a n g e v a r ia t ion ca sh r eg im e (i) - (1 3 0,9 5 5 ) 1 ,3 3 7 ,9 7 8
PIS / COFINS ex tem por a n eou s cr edit (ii) - - - 3 3 6 ,6 7 6
IR / CS cr edit on Selic (iii) 1 3 0,4 8 1 1 3 0,4 8 1 - -
Con st itu t ion (con su m ption ) of ta x loss a n d n eg a tiv e ba sis 8 1 ,3 3 8 1 7 0,9 9 1 1 1 3 ,9 7 1 (7 1 ,6 4 4 )
Oth er a ddit ion s / ex clu sion s 2 2 1 ,7 7 3 4 6 0,2 8 2 1 1 4 ,9 5 1 (4 5 ,8 8 2 )
Cu rrent (44,760) (249,933) 674 (412,334)
Recog n it ion a n d r ev er sa l of tem por a r y differ en ces 2 9 ,5 2 0 1 7 ,7 1 3 1 5 ,08 1 (5 5 ,3 2 3 )
Con st itu t ion (con su m ption ) of ta x loss a n d n eg a tiv e ba sis (8 1 ,3 3 7 ) (1 7 0,9 9 0) 1 1 3 ,9 7 1 (7 1 ,6 4 4 )
Ga in or loss on fin a n cia l in str u m en ts 1 3 8 ,5 7 2 (1 7 ,8 8 9 ) 8 8 ,6 00 8 1 6 ,9 9 5
Rig h t of u se (IFRS 1 6 ) 3 ,7 2 8 8 ,06 2 2 ,3 3 5 5 ,1 1 2
In ter est ca pita lized (La w 1 2 ,9 7 3 /1 4 ) (3 4 ,7 9 4 ) (9 2 ,8 8 3 ) (1 7 ,6 2 4 ) (3 4 ,8 3 8 )
ICMS on PIS/COFINS ca lcu la t ion ba sis - - - 3 3 6 ,6 7 6
A ctu a r ia l lia bility - - 4 2 7 1 ,2 8 2
A doption of th e ex ch a n g e v a r ia t ion ca sh r eg im e (i) (1 5 8 ,2 1 9 ) (1 7 7 ,1 3 0) (1 3 0,9 5 5 ) 1 ,3 3 7 ,9 7 8
Depr ecia t ion ta x r a te x u sefu l life r a te (La w 1 2 ,9 7 3 /1 4 ) (1 2 ,08 8 ) (1 9 ,6 1 6 ) 1 ,4 01 2 ,5 5 7
V a r ia t ion in fa ir v a lu e a n d deplet ion of biolog ica l a ssets (3 2 ,2 3 6 ) 8 1 ,8 8 4 2 1 ,02 8 1 4 9 ,5 8 4
Deferred (146,854) (370,849) 94,264 2,488,379
Consolida t ed
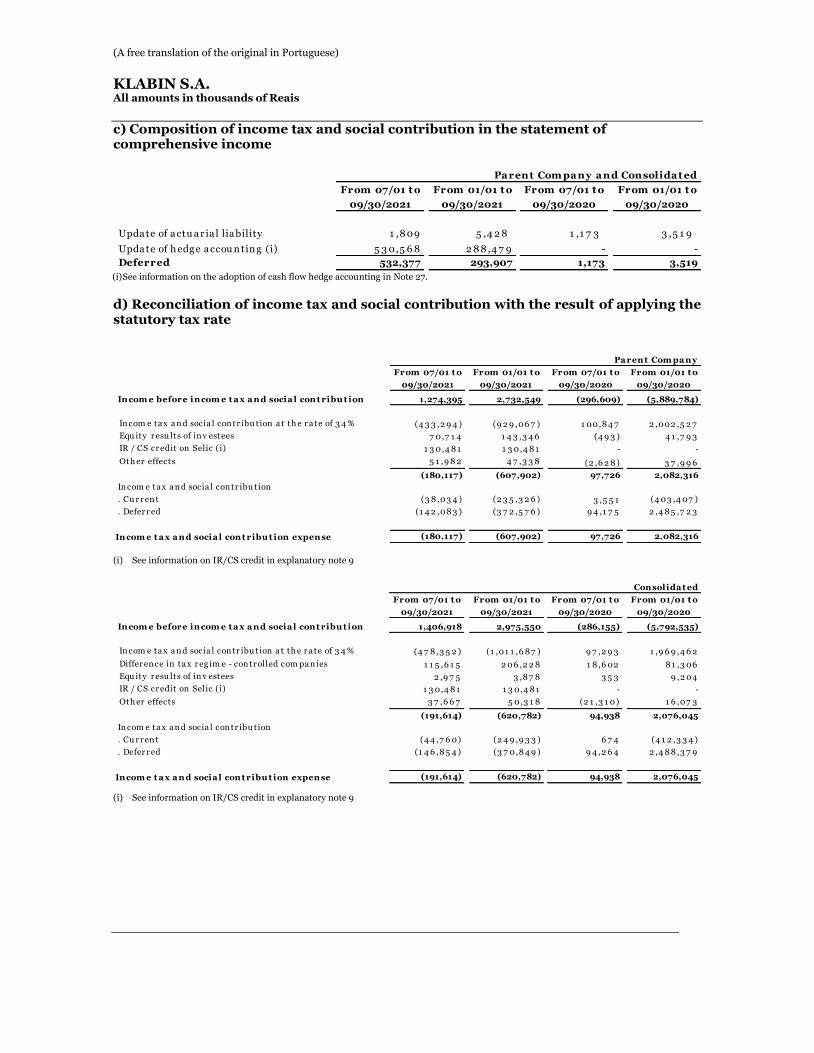
(A free translation of the original in Portuguese)
KLABIN S.A.
All amounts in thousands of Reais
c) Composition of income tax and social contribution in the statement of comprehensive income
(i) See information on the adoption of cash flow hedge accounting in Note 27.
d) Reconciliation of income tax and social contribution with the result of applying the statutory tax rate
(i) See information on IR/CS credit in explanatory note 9
(i) See information on IR/CS credit in explanatory note 9
From 07/01 t o From 01/01 t o From 07/01 t o From 01/01 t o
09/30/2021 09/30/2021 09/30/2020 09/30/2020
Upda te of a ctu a r ia l lia bility 1 ,8 09 5 ,4 2 8 1 ,1 7 3 3 ,5 1 9
Upda te of h edg e a ccou n tin g (i) 5 3 0,5 6 8 2 8 8 ,4 7 9 - -
Deferred 532,377 293,907 1,173 3,519
Parent Com pany and Consolidat ed
From 07/01 t o From 01/01 t o From 07/01 t o From 01/01 t o
09/30/2021 09/30/2021 09/30/2020 09/30/2020
Incom e before incom e t a x a nd socia l cont ribu t ion 1,274,395 2,732,549 (296,609) (5,889,784)
In com e ta x a n d socia l con tr ibu tion a t th e r a te of 3 4 % (4 3 3 ,2 9 4 ) (9 2 9 ,06 7 ) 1 00,8 4 7 2 ,002 ,5 2 7
Equ ity r esu lts of in v estees 7 0,7 1 4 1 4 3 ,3 4 6 (4 9 3 ) 4 1 ,7 9 3
IR / CS cr edit on Selic (i) 1 3 0,4 8 1 1 3 0,4 8 1 - -
Oth er effects 5 1 ,9 8 2 4 7 ,3 3 8 (2 ,6 2 8 ) 3 7 ,9 9 6
(180,117) (607,902) 97,726 2,082,316
In com e ta x a n d socia l con tr ibu tion
. Cu r r en t (3 8 ,03 4 ) (2 3 5 ,3 2 6 ) 3 ,5 5 1 (4 03 ,4 07 )
. Defer r ed (1 4 2 ,08 3 ) (3 7 2 ,5 7 6 ) 9 4 ,1 7 5 2 ,4 8 5 ,7 2 3
Incom e t a x a nd socia l cont ribu t ion expense (180,117) (607,902) 97,726 2,082,316
Pa rent Com pa ny
From 07/01 t o From 01/01 t o From 07/01 t o From 01/01 t o
09/30/2021 09/30/2021 09/30/2020 09/30/2020
Incom e before incom e t a x a nd socia l cont ribu t ion 1,406,918 2,975,550 (286,155) (5,792,535)
In com e ta x a n d socia l con tr ibu tion a t th e r a te of 3 4 % (4 7 8 ,3 5 2 ) (1 ,01 1 ,6 8 7 ) 9 7 ,2 9 3 1 ,9 6 9 ,4 6 2
Differ en ce in ta x r eg im e - con tr olled com pa n ies 1 1 5 ,6 1 5 2 06 ,2 2 8 1 8 ,6 02 8 1 ,3 06
Equ ity r esu lts of in v estees 2 ,9 7 5 3 ,8 7 8 3 5 3 9 ,2 04
IR / CS cr edit on Selic (i) 1 3 0,4 8 1 1 3 0,4 8 1 - -
Oth er effects 3 7 ,6 6 7 5 0,3 1 8 (2 1 ,3 1 0) 1 6 ,07 3
(191,614) (620,782) 94,938 2,076,045
In com e ta x a n d socia l con tr ibu tion
. Cu r r en t (4 4 ,7 6 0) (2 4 9 ,9 3 3 ) 6 7 4 (4 1 2 ,3 3 4 )
. Defer r ed (1 4 6 ,8 5 4 ) (3 7 0,8 4 9 ) 9 4 ,2 6 4 2 ,4 8 8 ,3 7 9
Incom e t a x a nd socia l cont ribu t ion expense (191,614) (620,782) 94,938 2,076,045
Consolida t ed
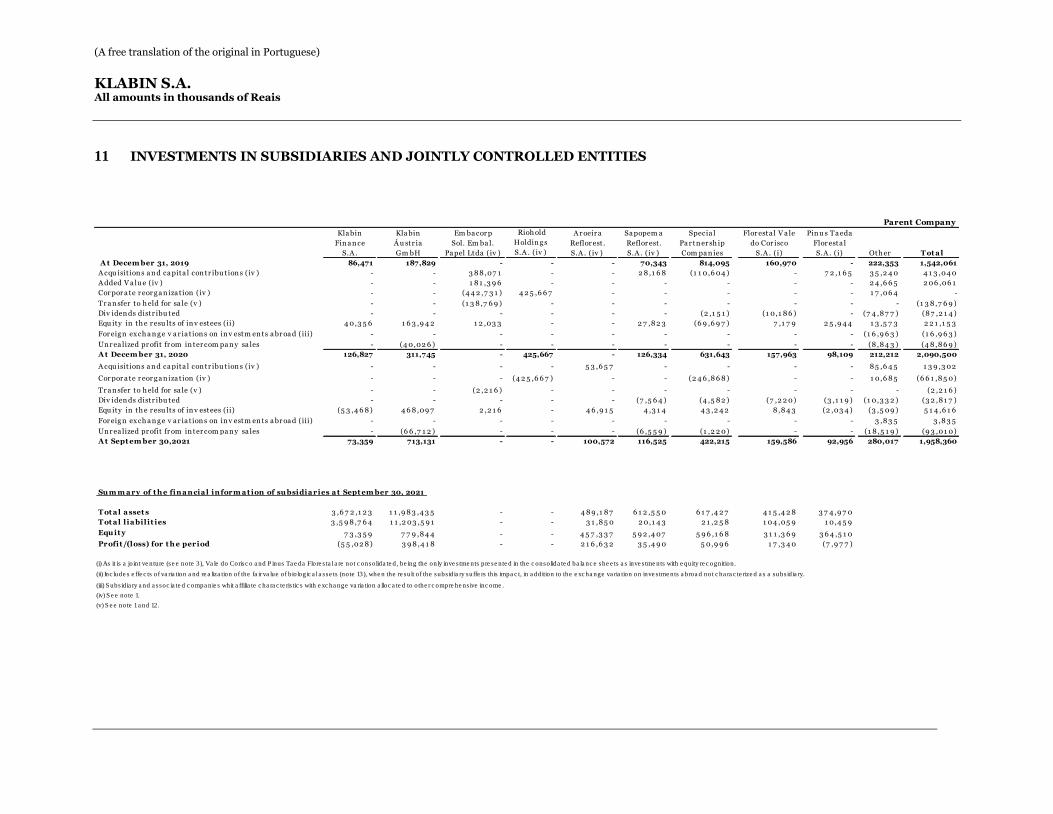
(A free translation of the original in Portuguese)
KLABIN S.A.
All amounts in thousands of Reais
11 INVESTMENTS IN SUBSIDIARIES AND JOINTLY CONTROLLED ENTITIES
Kla bin Kla bin Em ba cor p A r oeir a Sa popem a Specia l Flor esta l V a le Pin u s Ta eda
Fin a n ce Á u str ia Sol. Em ba l. Pa r tn er sh ip do Cor isco Flor esta l
S.A . Gm bH Pa pel Ltda (iv ) Com pa n ies S.A . (i) S.A . (i) Oth er T ot a l
A t Decem ber 31, 2019 86,471 187,829 - - - 70,343 814,095 160,970 - 222,353 1,542,061
A cqu isit ion s a n d ca pita l con tr ibu tion s (iv ) - - 3 8 8 ,07 1 - - 2 8 ,1 6 8 (1 1 0,6 04 ) - 7 2 ,1 6 5 3 5 ,2 4 0 4 1 3 ,04 0
A dded V a lu e (iv ) - - 1 8 1 ,3 9 6 - - - - - - 2 4 ,6 6 5 2 06 ,06 1
Cor por a te r eor g a n iza t ion (iv ) - - (4 4 2 ,7 3 1 ) 4 2 5 ,6 6 7 - - - - - 1 7 ,06 4 -
Tr a n sfer to h eld for sa le (v ) - - (1 3 8 ,7 6 9 ) - - - - - - - (1 3 8 ,7 6 9 )
Div iden ds distr ibu ted - - - - - - (2 ,1 5 1 ) (1 0,1 8 6 ) - (7 4 ,8 7 7 ) (8 7 ,2 1 4 )
Equ ity in th e r esu lts of in v estees (ii) 4 0,3 5 6 1 6 3 ,9 4 2 1 2 ,03 3 - - 2 7 ,8 2 3 (6 9 ,6 9 7 ) 7 ,1 7 9 2 5 ,9 4 4 1 3 ,5 7 3 2 2 1 ,1 5 3
For eig n ex ch a n g e v a r ia t ion s on in v estm en ts a br oa d (iii) - - - - - - - - - (1 6 ,9 6 3 ) (1 6 ,9 6 3 )
Un r ea lized pr ofit fr om in ter com pa n y sa les - (4 0,02 6 ) - - - - - - - (8 ,8 4 3 ) (4 8 ,8 6 9 )
A t Decem ber 31, 2020 126,827 311,745 - 425,667 - 126,334 631,643 157,963 98,109 212,212 2,090,500
A cqu isit ion s a n d ca pita l con tr ibu tion s (iv ) - - - - 5 3 ,6 5 7 - - - - 8 5 ,6 4 5 1 3 9 ,3 02
Cor por a te r eor g a n iza t ion (iv ) - - - (4 2 5 ,6 6 7 ) - - (2 4 6 ,8 6 8 ) - - 1 0,6 8 5 (6 6 1 ,8 5 0)
Tr a n sfer to h eld for sa le (v ) - - (2 ,2 1 6 ) - - - - - - - (2 ,2 1 6 )
Div iden ds distr ibu ted - - - - - (7 ,5 6 4 ) (4 ,5 8 2 ) (7 ,2 2 0) (3 ,1 1 9 ) (1 0,3 3 2 ) (3 2 ,8 1 7 )
Equ ity in th e r esu lts of in v estees (ii) (5 3 ,4 6 8 ) 4 6 8 ,09 7 2 ,2 1 6 - 4 6 ,9 1 5 4 ,3 1 4 4 3 ,2 4 2 8 ,8 4 3 (2 ,03 4 ) (3 ,5 09 ) 5 1 4 ,6 1 6
For eig n ex ch a n g e v a r ia t ion s on in v estm en ts a br oa d (iii) - - - - - - - - - 3 ,8 3 5 3 ,8 3 5
Un r ea lized pr ofit fr om in ter com pa n y sa les - (6 6 ,7 1 2 ) - - - (6 ,5 5 9 ) (1 ,2 2 0) - - (1 8 ,5 1 9 ) (9 3 ,01 0)
A t Sept em ber 30,2021 73,359 713,131 - - 100,572 116,525 422,215 159,586 92,956 280,017 1,958,360
T ot a l a sset s 3 ,6 7 2 ,1 2 3 1 1 ,9 8 3 ,4 3 5 - - 4 8 9 ,1 8 7 6 1 2 ,5 5 0 6 1 7 ,4 2 7 4 1 5 ,4 2 8 3 7 4 ,9 7 0
T ot a l l ia bilit ies 3 ,5 9 8 ,7 6 4 1 1 ,2 03 ,5 9 1 - - 3 1 ,8 5 0 2 0,1 4 3 2 1 ,2 5 8 1 04 ,05 9 1 0,4 5 9
Equ it y 7 3 ,3 5 9 7 7 9 ,8 4 4 - - 4 5 7 ,3 3 7 5 9 2 ,4 07 5 9 6 ,1 6 8 3 1 1 ,3 6 9 3 6 4 ,5 1 0
Profit /(loss) for t h e period (5 5 ,02 8 ) 3 9 8 ,4 1 8 - - 2 1 6 ,6 3 2 3 5 ,4 9 0 5 0,9 9 6 1 7 ,3 4 0 (7 ,9 7 7 )
Parent Company
(iv) S e e note 1.
(v) S e e note 1 a nd 12.
(iii) S ubs idia ry a nd a ssoc ia te d c ompa nie s whit a ffilia te c ha ra c te ris tic s with e xc ha nge va ria tion a lloc a te d to othe r c ompre he ns ive inc ome .
Reflor est .
S.A . (iv )
(i) As it is a joint ve nture (se e note 3), Va le do Corisc o a nd P inus Ta e da Flore s ta l a re not c onsolida te d, be ing the only inve s tme nts pre se nte d in the c onsolida te d ba la nc e she e ts a s inve s tme nts with e quity re c ognition.
Su m m a ry of t h e fina ncia l inform a t ion of su bsidia ries a t Sept em ber 30, 2021
(ii) Inc lude s e ffe c ts of va ria tion a nd re a liza tion of the fa ir va lue of biologic a l a sse ts (note 13), whe n the re sult of the subs idia ry suffe rs this impa c t, in a ddition to the e xc ha nge va ria tion on inve s tme nts a broa d not c ha ra c te rize d a s a subs idia ry.
Rioh old
Holdin g s
S.A . (iv )
Reflor est .
S.A . (iv )
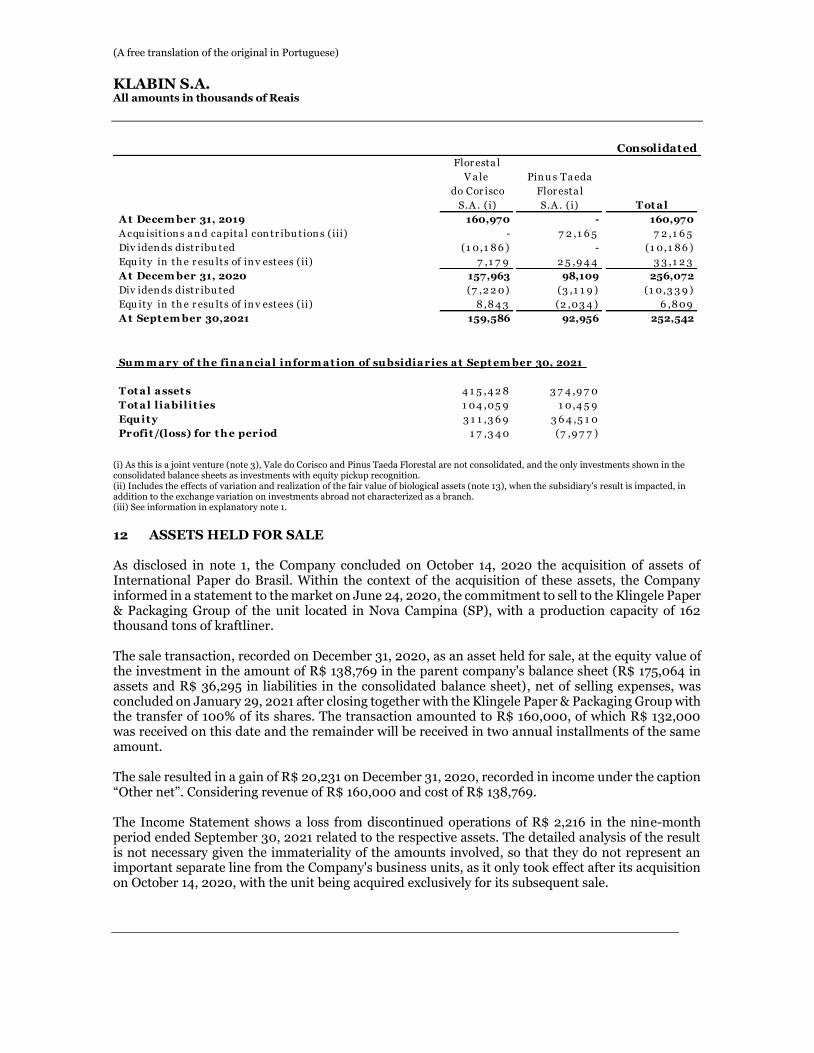
(A free translation of the original in Portuguese)
KLABIN S.A.
All amounts in thousands of Reais
(i) As this is a joint venture (note 3), Vale do Corisco and Pinus Taeda Florestal are not consolidated, and the only investments shown in the consolidated balance sheets as investments with equity pickup recognition. (ii) Includes the effects of variation and realization of the fair value of biological assets (note 13), when the subsidiary's result is impacted, in addition to the exchange variation on investments abroad not characterized as a branch. (iii) See information in explanatory note 1. 12 ASSETS HELD FOR SALE
As disclosed in note 1, the Company concluded on October 14, 2020 the acquisition of assets of International Paper do Brasil. Within the context of the acquisition of these assets, the Company informed in a statement to the market on June 24, 2020, the commitment to sell to the Klingele Paper & Packaging Group of the unit located in Nova Campina (SP), with a production capacity of 162 thousand tons of kraftliner. The sale transaction, recorded on December 31, 2020, as an asset held for sale, at the equity value of the investment in the amount of R$ 138,769 in the parent company's balance sheet (R$ 175,064 in assets and R$ 36,295 in liabilities in the consolidated balance sheet), net of selling expenses, was concluded on January 29, 2021 after closing together with the Klingele Paper & Packaging Group with the transfer of 100% of its shares. The transaction amounted to R$ 160,000, of which R$ 132,000 was received on this date and the remainder will be received in two annual installments of the same amount. The sale resulted in a gain of R$ 20,231 on December 31, 2020, recorded in income under the caption “Other net”. Considering revenue of R$ 160,000 and cost of R$ 138,769. The Income Statement shows a loss from discontinued operations of R$ 2,216 in the nine-month period ended September 30, 2021 related to the respective assets. The detailed analysis of the result is not necessary given the immateriality of the amounts involved, so that they do not represent an important separate line from the Company's business units, as it only took effect after its acquisition on October 14, 2020, with the unit being acquired exclusively for its subsequent sale.
Flor esta l
V a le Pin u s Ta eda
do Cor isco Flor esta l
S.A . (i) S.A . (i) T ot a l
A t Decem ber 31, 2019 160,970 - 160,970
A cqu isit ion s a n d ca pita l con tr ibu tion s (iii) - 7 2 ,1 6 5 7 2 ,1 6 5
Div iden ds distr ibu ted (1 0,1 8 6 ) - (1 0,1 8 6 )
Equ ity in th e r esu lts of in v estees (ii) 7 ,1 7 9 2 5 ,9 4 4 3 3 ,1 2 3
A t Decem ber 31, 2020 157,963 98,109 256,072
Div iden ds distr ibu ted (7 ,2 2 0) (3 ,1 1 9 ) (1 0,3 3 9 )
Equ ity in th e r esu lts of in v estees (ii) 8 ,8 4 3 (2 ,03 4 ) 6 ,8 09
A t Sept em ber 30,2021 159,586 92,956 252,542
T ot a l a sset s 4 1 5 ,4 2 8 3 7 4 ,9 7 0
T ot a l l ia bilit ies 1 04 ,05 9 1 0,4 5 9
Equ it y 3 1 1 ,3 6 9 3 6 4 ,5 1 0
Profit /(loss) for t h e period 1 7 ,3 4 0 (7 ,9 7 7 )
Su m m a ry of t h e fina ncia l inform a t ion of su bsidia ries a t Sept em ber 30, 2021
Consolidated
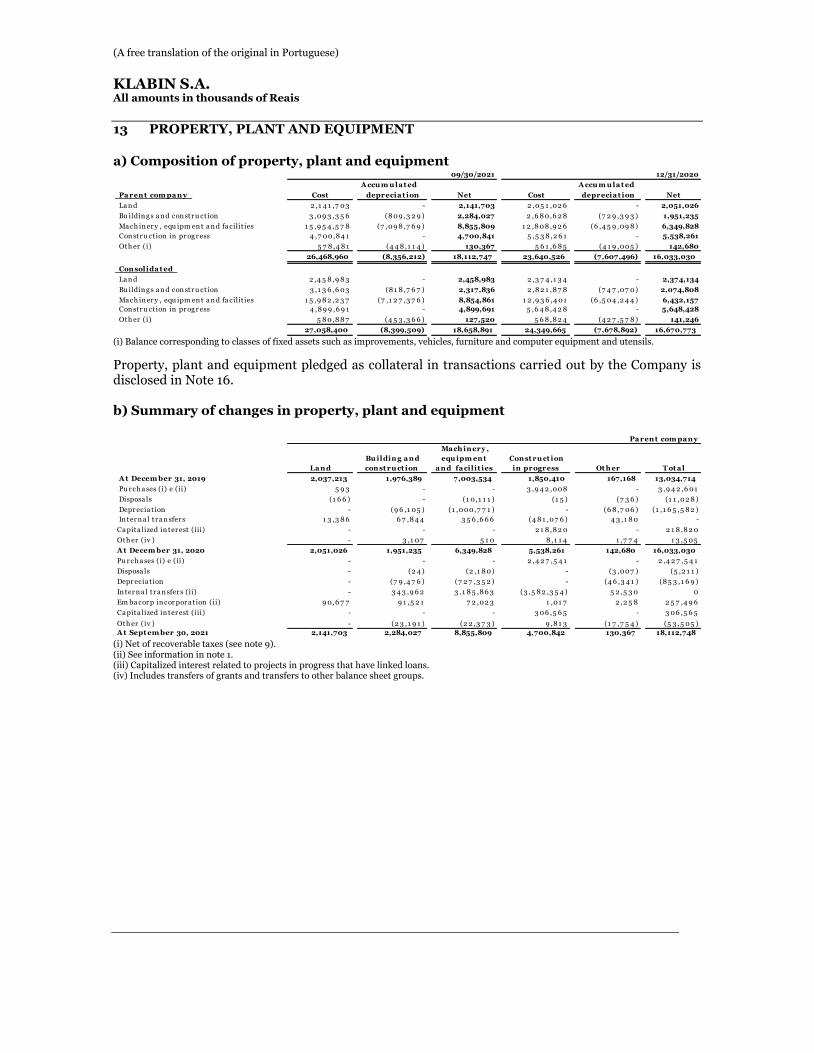
(A free translation of the original in Portuguese)
KLABIN S.A.
All amounts in thousands of Reais
13 PROPERTY, PLANT AND EQUIPMENT
a) Composition of property, plant and equipment
(i) Balance corresponding to classes of fixed assets such as improvements, vehicles, furniture and computer equipment and utensils.
Property, plant and equipment pledged as collateral in transactions carried out by the Company is disclosed in Note 16.
b) Summary of changes in property, plant and equipment
(i) Net of recoverable taxes (see note 9). (ii) See information in note 1. (iii) Capitalized interest related to projects in progress that have linked loans. (iv) Includes transfers of grants and transfers to other balance sheet groups.
09/30/2021 12/31/2020
A ccu m u la t ed A ccu m u la t ed
Pa rent com pa ny Cost deprecia t ion Net Cost deprecia t ion Net
La n d 2 ,1 4 1 ,7 03 - 2,141,703 2 ,05 1 ,02 6 - 2,051,026
Bu ildin g s a n d con str u ct ion 3 ,09 3 ,3 5 6 (8 09 ,3 2 9 ) 2,284,027 2 ,6 8 0,6 2 8 (7 2 9 ,3 9 3 ) 1,951,235
Ma ch in er y , equ ipm en t a n d fa cilit ies 1 5 ,9 5 4 ,5 7 8 (7 ,09 8 ,7 6 9 ) 8,855,809 1 2 ,8 08 ,9 2 6 (6 ,4 5 9 ,09 8 ) 6,349,828
Con str u ct ion in pr og r ess 4 ,7 00,8 4 1 - 4,700,841 5 ,5 3 8 ,2 6 1 - 5,538,261
Oth er (i) 5 7 8 ,4 8 1 (4 4 8 ,1 1 4 ) 130,367 5 6 1 ,6 8 5 (4 1 9 ,005 ) 142,680
26,468,960 (8,356,212) 18,112,747 23,640,526 (7,607,496) 16,033,030
Consolida t ed
La n d 2 ,4 5 8 ,9 8 3 - 2,458,983 2 ,3 7 4 ,1 3 4 - 2,374,134
Bu ildin g s a n d con str u ct ion 3 ,1 3 6 ,6 03 (8 1 8 ,7 6 7 ) 2,317,836 2 ,8 2 1 ,8 7 8 (7 4 7 ,07 0) 2,074,808
Ma ch in er y , equ ipm en t a n d fa cilit ies 1 5 ,9 8 2 ,2 3 7 (7 ,1 2 7 ,3 7 6 ) 8,854,861 1 2 ,9 3 6 ,4 01 (6 ,5 04 ,2 4 4 ) 6,432,157
Con str u ct ion in pr og r ess 4 ,8 9 9 ,6 9 1 - 4,899,691 5 ,6 4 8 ,4 2 8 - 5,648,428
Oth er (i) 5 8 0,8 8 7 (4 5 3 ,3 6 6 ) 127,520 5 6 8 ,8 2 4 (4 2 7 ,5 7 8 ) 141,246
27,058,400 (8,399,509) 18,658,891 24,349,665 (7,678,892) 16,670,773
La nd
Bu ilding a nd
const ru ct ion
Ma ch inery ,
equ ipm ent
a nd fa cilit ies
Const ru ct ion
in progress Ot h er T ot a l
A t Decem ber 31, 2019 2,037,213 1,976,389 7,003,534 1,850,410 167,168 13,034,714
Pu r ch a ses (i) e (ii) 5 9 3 - - 3 ,9 4 2 ,008 - 3 ,9 4 2 ,6 01
Disposa ls (1 6 6 ) - (1 0,1 1 1 ) (1 5 ) (7 3 6 ) (1 1 ,02 8 )
Depr ecia t ion - (9 6 ,1 05 ) (1 ,000,7 7 1 ) - (6 8 ,7 06 ) (1 ,1 6 5 ,5 8 2 )
In ter n a l tr a n sfer s 1 3 ,3 8 6 6 7 ,8 4 4 3 5 6 ,6 6 6 (4 8 1 ,07 6 ) 4 3 ,1 8 0 -
Ca pita lized in ter est (iii) - - - 2 1 8 ,8 2 0 - 2 1 8 ,8 2 0
Oth er (iv ) - 3 ,1 07 5 1 0 8 ,1 1 4 1 ,7 7 4 1 3 ,5 05
A t Decem ber 31, 2020 2,051,026 1,951,235 6,349,828 5,538,261 142,680 16,033,030
Pu r ch a ses (i) e (ii) - - - 2 ,4 2 7 ,5 4 1 - 2 ,4 2 7 ,5 4 1
Disposa ls - (2 4 ) (2 ,1 8 0) - (3 ,007 ) (5 ,2 1 1 )
Depr ecia t ion - (7 9 ,4 7 6 ) (7 2 7 ,3 5 2 ) - (4 6 ,3 4 1 ) (8 5 3 ,1 6 9 )
In ter n a l tr a n sfer s (ii) - 3 4 3 ,9 6 2 3 ,1 8 5 ,8 6 3 (3 ,5 8 2 ,3 5 4 ) 5 2 ,5 3 0 0
Em ba cor p in cor por a t ion (ii) 9 0,6 7 7 9 1 ,5 2 1 7 2 ,02 3 1 ,01 7 2 ,2 5 8 2 5 7 ,4 9 6
Ca pita lized in ter est (iii) - - - 3 06 ,5 6 5 - 3 06 ,5 6 5
Oth er (iv ) - (2 3 ,1 9 1 ) (2 2 ,3 7 3 ) 9 ,8 1 3 (1 7 ,7 5 4 ) (5 3 ,5 05 )
A t Sept em ber 30, 2021 2,141,703 2,284,027 8,855,809 4,700,842 130,367 18,112,748
Pa rent com pa ny
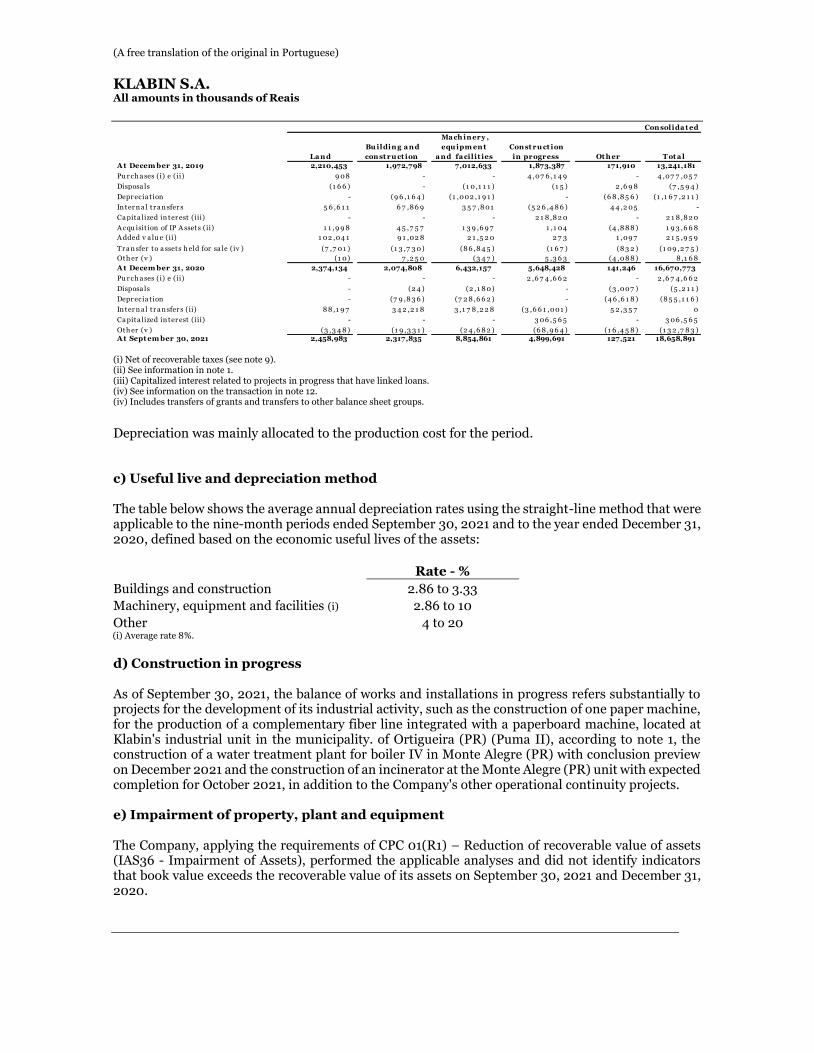
(A free translation of the original in Portuguese)
KLABIN S.A.
All amounts in thousands of Reais
(i) Net of recoverable taxes (see note 9). (ii) See information in note 1. (iii) Capitalized interest related to projects in progress that have linked loans. (iv) See information on the transaction in note 12. (iv) Includes transfers of grants and transfers to other balance sheet groups.
Depreciation was mainly allocated to the production cost for the period. c) Useful live and depreciation method
The table below shows the average annual depreciation rates using the straight-line method that were applicable to the nine-month periods ended September 30, 2021 and to the year ended December 31, 2020, defined based on the economic useful lives of the assets:
Rate - %
Buildings and construction 2.86 to 3.33
Machinery, equipment and facilities (i) 2.86 to 10
Other 4 to 20 (i) Average rate 8%.
d) Construction in progress
As of September 30, 2021, the balance of works and installations in progress refers substantially to projects for the development of its industrial activity, such as the construction of one paper machine, for the production of a complementary fiber line integrated with a paperboard machine, located at Klabin's industrial unit in the municipality. of Ortigueira (PR) (Puma II), according to note 1, the construction of a water treatment plant for boiler IV in Monte Alegre (PR) with conclusion preview on December 2021 and the construction of an incinerator at the Monte Alegre (PR) unit with expected completion for October 2021, in addition to the Company's other operational continuity projects. e) Impairment of property, plant and equipment
The Company, applying the requirements of CPC 01(R1) – Reduction of recoverable value of assets (IAS36 - Impairment of Assets), performed the applicable analyses and did not identify indicators that book value exceeds the recoverable value of its assets on September 30, 2021 and December 31, 2020.
La nd
Bu ilding a nd
const ru ct ion
Ma ch inery ,
equ ipm ent
a nd fa cilit ies
Const ru ct ion
in progress Ot h er T ot a l
A t Decem ber 31, 2019 2,210,453 1,972,798 7,012,633 1,873,387 171,910 13,241,181
Pu r ch a ses (i) e (ii) 9 08 - - 4 ,07 6 ,1 4 9 - 4 ,07 7 ,05 7
Disposa ls (1 6 6 ) - (1 0,1 1 1 ) (1 5 ) 2 ,6 9 8 (7 ,5 9 4 )
Depr ecia t ion - (9 6 ,1 6 4 ) (1 ,002 ,1 9 1 ) - (6 8 ,8 5 6 ) (1 ,1 6 7 ,2 1 1 )
In ter n a l tr a n sfer s 5 6 ,6 1 1 6 7 ,8 6 9 3 5 7 ,8 01 (5 2 6 ,4 8 6 ) 4 4 ,2 05 -
Ca pita lized in ter est (iii) - - - 2 1 8 ,8 2 0 - 2 1 8 ,8 2 0
A cqu isit ion of IP A ssets (ii) 1 1 ,9 9 8 4 5 ,7 5 7 1 3 9 ,6 9 7 1 ,1 04 (4 ,8 8 8 ) 1 9 3 ,6 6 8
A dded v a lu e (ii) 1 02 ,04 1 9 1 ,02 8 2 1 ,5 2 0 2 7 3 1 ,09 7 2 1 5 ,9 5 9
Tr a n sfer to a ssets h eld for sa le (iv ) (7 ,7 01 ) (1 3 ,7 3 0) (8 6 ,8 4 5 ) (1 6 7 ) (8 3 2 ) (1 09 ,2 7 5 )
Oth er (v ) (1 0) 7 ,2 5 0 (3 4 7 ) 5 ,3 6 3 (4 ,08 8 ) 8 ,1 6 8
A t Decem ber 31, 2020 2,374,134 2,074,808 6,432,157 5,648,428 141,246 16,670,773
Pu r ch a ses (i) e (ii) - - - 2 ,6 7 4 ,6 6 2 - 2 ,6 7 4 ,6 6 2
Disposa ls - (2 4 ) (2 ,1 8 0) - (3 ,007 ) (5 ,2 1 1 )
Depr ecia t ion - (7 9 ,8 3 6 ) (7 2 8 ,6 6 2 ) - (4 6 ,6 1 8 ) (8 5 5 ,1 1 6 )
In ter n a l tr a n sfer s (ii) 8 8 ,1 9 7 3 4 2 ,2 1 8 3 ,1 7 8 ,2 2 8 (3 ,6 6 1 ,001 ) 5 2 ,3 5 7 0
Ca pita lized in ter est (iii) - - - 3 06 ,5 6 5 - 3 06 ,5 6 5
Oth er (v ) (3 ,3 4 8 ) (1 9 ,3 3 1 ) (2 4 ,6 8 2 ) (6 8 ,9 6 4 ) (1 6 ,4 5 8 ) (1 3 2 ,7 8 3 ) A t Sept em ber 30, 2021 2,458,983 2,317,835 8,854,861 4,899,691 127,521 18,658,891
Consolida t ed
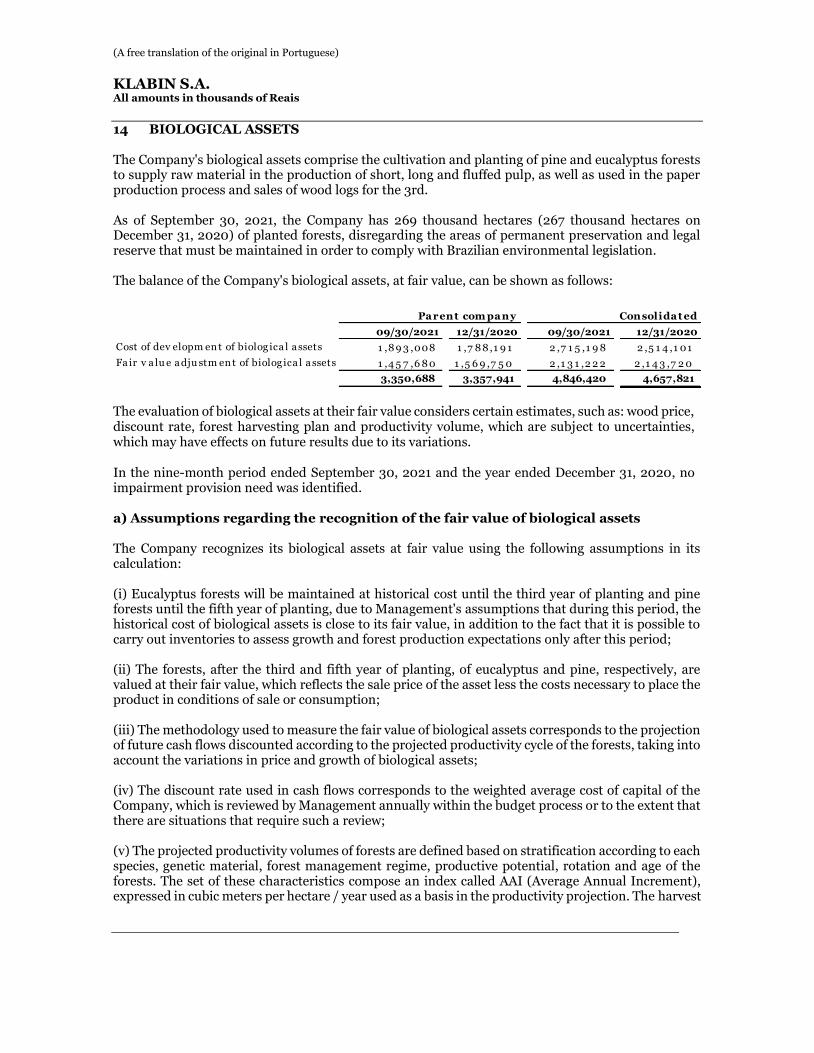
(A free translation of the original in Portuguese)
KLABIN S.A.
All amounts in thousands of Reais
14 BIOLOGICAL ASSETS
The Company's biological assets comprise the cultivation and planting of pine and eucalyptus forests to supply raw material in the production of short, long and fluffed pulp, as well as used in the paper production process and sales of wood logs for the 3rd. As of September 30, 2021, the Company has 269 thousand hectares (267 thousand hectares on December 31, 2020) of planted forests, disregarding the areas of permanent preservation and legal reserve that must be maintained in order to comply with Brazilian environmental legislation. The balance of the Company's biological assets, at fair value, can be shown as follows:
The evaluation of biological assets at their fair value considers certain estimates, such as: wood price, discount rate, forest harvesting plan and productivity volume, which are subject to uncertainties, which may have effects on future results due to its variations. In the nine-month period ended September 30, 2021 and the year ended December 31, 2020, no impairment provision need was identified.
a) Assumptions regarding the recognition of the fair value of biological assets The Company recognizes its biological assets at fair value using the following assumptions in its calculation: (i) Eucalyptus forests will be maintained at historical cost until the third year of planting and pine forests until the fifth year of planting, due to Management's assumptions that during this period, the historical cost of biological assets is close to its fair value, in addition to the fact that it is possible to carry out inventories to assess growth and forest production expectations only after this period; (ii) The forests, after the third and fifth year of planting, of eucalyptus and pine, respectively, are valued at their fair value, which reflects the sale price of the asset less the costs necessary to place the product in conditions of sale or consumption; (iii) The methodology used to measure the fair value of biological assets corresponds to the projection of future cash flows discounted according to the projected productivity cycle of the forests, taking into account the variations in price and growth of biological assets; (iv) The discount rate used in cash flows corresponds to the weighted average cost of capital of the Company, which is reviewed by Management annually within the budget process or to the extent that there are situations that require such a review; (v) The projected productivity volumes of forests are defined based on stratification according to each species, genetic material, forest management regime, productive potential, rotation and age of the forests. The set of these characteristics compose an index called AAI (Average Annual Increment), expressed in cubic meters per hectare / year used as a basis in the productivity projection. The harvest
09/30/2021 12/31/2020 09/30/2021 12/31/2020
Cost of dev elopm en t of biolog ica l a ssets 1 ,8 9 3 ,008 1 ,7 8 8 ,1 9 1 2 ,7 1 5 ,1 9 8 2 ,5 1 4 ,1 01
Fa ir v a lu e a dju stm en t of biolog ica l a ssets 1 ,4 5 7 ,6 8 0 1 ,5 6 9 ,7 5 0 2 ,1 3 1 ,2 2 2 2 ,1 4 3 ,7 2 0
3,350,688 3,357,941 4,846,420 4,657,821
Parent com pany Consolidat ed
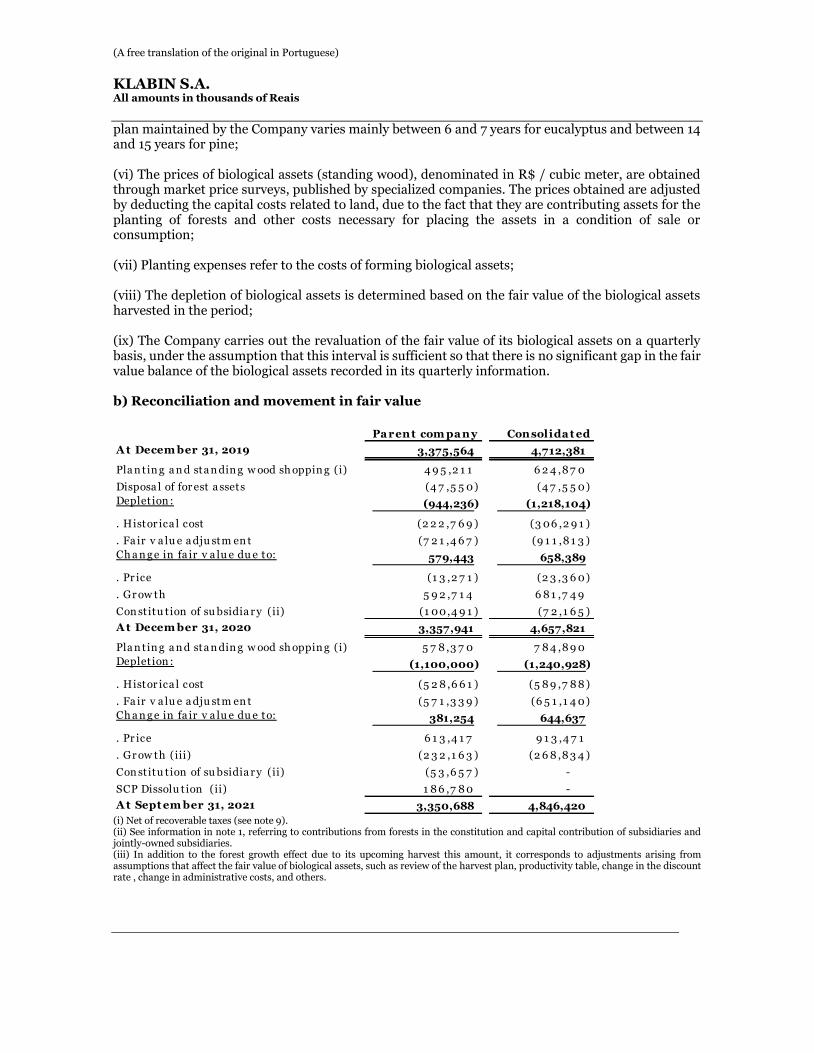
(A free translation of the original in Portuguese)
KLABIN S.A.
All amounts in thousands of Reais
plan maintained by the Company varies mainly between 6 and 7 years for eucalyptus and between 14 and 15 years for pine; (vi) The prices of biological assets (standing wood), denominated in R$ / cubic meter, are obtained through market price surveys, published by specialized companies. The prices obtained are adjusted by deducting the capital costs related to land, due to the fact that they are contributing assets for the planting of forests and other costs necessary for placing the assets in a condition of sale or consumption; (vii) Planting expenses refer to the costs of forming biological assets; (viii) The depletion of biological assets is determined based on the fair value of the biological assets harvested in the period; (ix) The Company carries out the revaluation of the fair value of its biological assets on a quarterly basis, under the assumption that this interval is sufficient so that there is no significant gap in the fair value balance of the biological assets recorded in its quarterly information. b) Reconciliation and movement in fair value
(i) Net of recoverable taxes (see note 9). (ii) See information in note 1, referring to contributions from forests in the constitution and capital contribution of subsidiaries and jointly-owned subsidiaries. (iii) In addition to the forest growth effect due to its upcoming harvest this amount, it corresponds to adjustments arising from assumptions that affect the fair value of biological assets, such as review of the harvest plan, productivity table, change in the discount rate , change in administrative costs, and others.
Pa ren t com pa n y Consolida t ed
A t Decem ber 31, 2019 3,375,564 4,712,381
Pla n tin g a n d sta n din g w ood sh oppin g (i) 4 9 5 ,2 1 1 6 2 4 ,8 7 0
Disposa l of for est a ssets (4 7 ,5 5 0) (4 7 ,5 5 0)
Deplet ion : (944,236) (1,218,104)
. Histor ica l cost (2 2 2 ,7 6 9 ) (3 06 ,2 9 1 )
. Fa ir v a lu e a dju stm en t (7 2 1 ,4 6 7 ) (9 1 1 ,8 1 3 )
Ch a n g e in fa ir v a lu e du e to: 579,443 658,389
. Pr ice (1 3 ,2 7 1 ) (2 3 ,3 6 0)
. Gr ow th 5 9 2 ,7 1 4 6 8 1 ,7 4 9
Con st itu t ion of su bsidia r y (ii) (1 00,4 9 1 ) (7 2 ,1 6 5 )
A t Decem ber 31, 2020 3,357,941 4,657,821
Pla n tin g a n d sta n din g w ood sh oppin g (i) 5 7 8 ,3 7 0 7 8 4 ,8 9 0
Deplet ion : (1,100,000) (1,240,928)
. Histor ica l cost (5 2 8 ,6 6 1 ) (5 8 9 ,7 8 8 )
. Fa ir v a lu e a dju stm en t (5 7 1 ,3 3 9 ) (6 5 1 ,1 4 0)
Ch a n g e in fa ir v a lu e du e to: 381,254 644,637
. Pr ice 6 1 3 ,4 1 7 9 1 3 ,4 7 1
. Gr ow th (iii) (2 3 2 ,1 6 3 ) (2 6 8 ,8 3 4 )
Con st itu t ion of su bsidia r y (ii) (5 3 ,6 5 7 ) -
SCP Dissolu t ion (ii) 1 8 6 ,7 8 0 -
A t Sept em ber 31, 2021 3,350,688 4,846,420
(A free translation of the original in Portuguese)
KLABIN S.A.
All amounts in thousands of Reais
The depletion of biological assets for nine-month period ended September 30, 2021 and the year ended December 31, 2020 was substantially allocated to production cost, after allocation to inventories through harvesting and using them in the production process or sale to third parties. c) Sensitivity analysis According to the hierarchy of CPC 46 (equivalent to IFRS 13) - Fair Value Measurements, the calculation of biological assets falls under Level 3, due to their complexity and calculation structure. Among the assumptions used in the calculation, the sensitivity to prices used in the valuation and the discount rate used in the discounted cash flow stand out. Prices refer to those practiced in the regions where the Company is located, whereas the discount rate corresponds to the average cost of capital, taking into account the basic interest rate (Selic) and inflation levels. Significant increases (decreases) in the prices used in the valuation would result in an increase (decrease) in the measurement of the fair value of biological assets. The weighted average price used in the valuation of the asset on September 30, 2021 was equivalent to R$ 69/m3 (R$ 66/m3 on December 31, 2020). Regarding the discount rate, the significant effects of an increase (decrease) in the rate used to measure the fair value of biological assets would result in a decrease (increase) in the measured values. On September 30, 2021, the Company used the weighted average cost of capital of 4.48% in constant currency for the parent company and 5.34% for the subsidiaries (4.48% and 5.34% for the parent and subsidiaries on 31 December 2020). 15 RIGHT OF USE ASSET AND LEASE LIABILITY a) Accounting policy and assumptions for recognition The right to use the assets and the liabilities for the leases are recognized at the future value of the installments assumed in the contract, brought to the net present value. The right to use the assets is amortized on a straight-line basis over the term of the contract in the income statement of the periods in the line that is related to its nature ("Cost of products sold" / "Administrative expenses" / "Selling expenses"), as well as financial expenses, corresponding to the amortization of the adjustment to the net present value of the contracts, is allocated to the “Financial result”. Depreciation of the right-of-use asset is calculated using the straight-line method in accordance with the remaining term of each contract. The Company recognizes its right of use and lease liabilities considering the following assumptions: (i) Operations with contracts signed for more than 12 months fall within the scope of the standard. The Company evaluated the aspects of renewal in its methodology and because it did not identify aspects of renewal, it chose not to consider contract renewals, given that the assets involved in its operation are not indispensable for the conduct of its business, and may be replaced at the end the contract for new assets acquired or for operations other than those agreed upon. (ii) Contracts that involve the use of low-value underlying assets. (iii) Only transactions involving specific assets defined in the contract or for exclusive use over the period of the contract are considered.
(A free translation of the original in Portuguese)
KLABIN S.A.
All amounts in thousands of Reais
(iv) Inclusion of recoverable taxes in the definition of the assumed installments of the contracts in which it is applicable. (v) The methodology used to calculate the net present value of the contracts corresponds to the cash flow of the assumed installments discounted at the discount rate defined for the asset class. (vi) The discount rate for the three- and nine-month periods ended September 30, 2021 was based on the risk-free interest rates observed in the Brazilian market and adjusted to the reality of the Company. The rates for 2021 were updated, compared to the previous quarter. The rates for the lease of forest lands and administrative properties and commercial warehouses are 6.49% p.a. for contracts with maturity of up to 5 years, 7.13% with maturity from 6 to 10 years, 7.57% with maturity from 11 to 15 years, 8.19% with maturity from 16 to 20 years and 8.62% with maturity over 20 years, in addition to 6.36% for operations involving machinery and equipment. The real rates (net of inflation) were obtained from the financing of assets of these classes through researches with the banks that serve the Company. (vii) Remeasurement to reflect any revaluation or modifications to the lease will be made on the one-year anniversary month of each contract (reset), in which the Company will assess the need for readjustments in monthly and annual payments and, if applicable, readjustments will be realized in assets against lease liabilities. (viii) The Company analyzed the effects related to contingencies and impairment risks within the operations that fall within the scope of the standard and did not identify any impacts. The Company's leasing operations in effect on September 30, 2021 do not have any restriction clauses that impose the maintenance of financial ratios, as well as no variable payment clauses, or residual value guarantee clauses payment and purchase options at the end of the contracts. The Company evaluated on September 30, 2021 and there were no impacts related to the separation of components in the lease agreements, as well as there are no impacts on the initial direct costs linked to the contracts in the measurement of the asset.
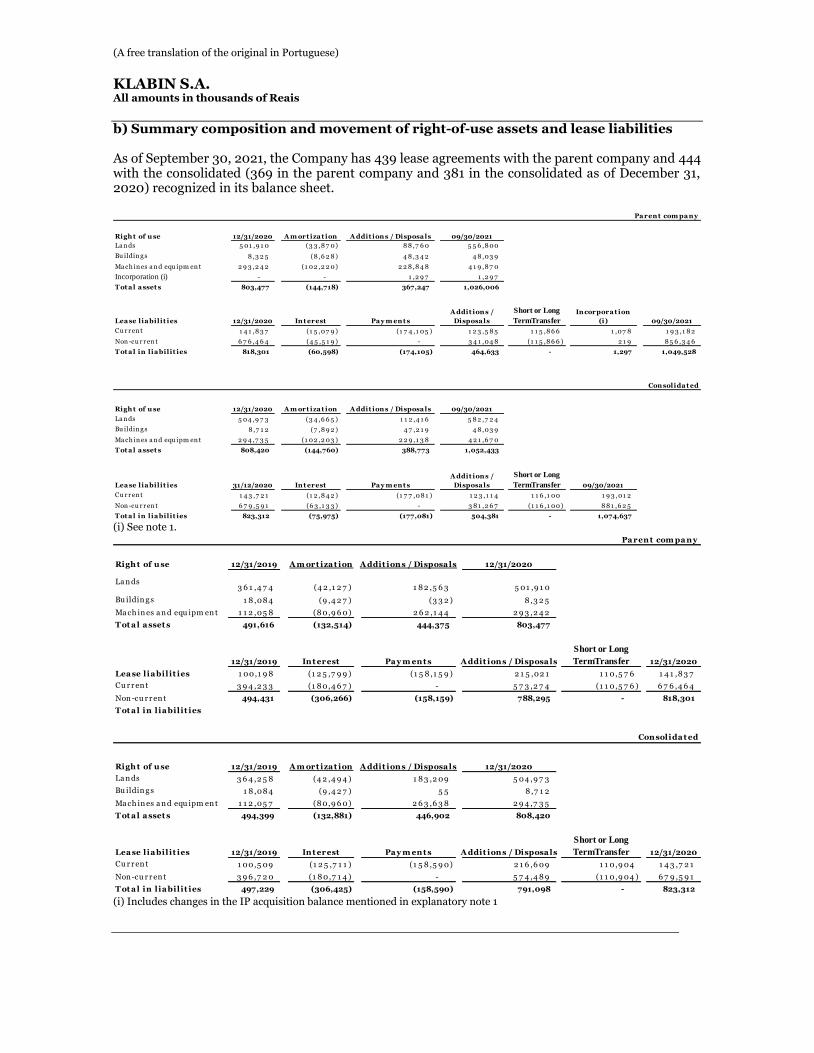
(A free translation of the original in Portuguese)
KLABIN S.A.
All amounts in thousands of Reais
b) Summary composition and movement of right-of-use assets and lease liabilities As of September 30, 2021, the Company has 439 lease agreements with the parent company and 444 with the consolidated (369 in the parent company and 381 in the consolidated as of December 31, 2020) recognized in its balance sheet.
(i) See note 1.
(i) Includes changes in the IP acquisition balance mentioned in explanatory note 1
Righ t of u se 12/31/2020 A m ort iza t ion A ddit ions / Disposa ls 09/30/2021
La n ds 5 01 ,9 1 0 (3 3 ,8 7 0) 8 8 ,7 6 0 5 5 6 ,8 00
Bu ildin g s 8 ,3 2 5 (8 ,6 2 8 ) 4 8 ,3 4 2 4 8 ,03 9
Ma ch in es a n d equ ipm en t 2 9 3 ,2 4 2 (1 02 ,2 2 0) 2 2 8 ,8 4 8 4 1 9 ,8 7 0
Incorporation (i) - - 1 ,2 9 7 1 ,2 9 7
T ot a l a sset s 803,477 (144,718) 367,247 1,026,006
Lea se lia bilit ies 12/31/2020 Int erest Pa y m ent s
A ddit ions /
Disposa ls
Short or Long
TermTransfer
Incorpora t ion
(i) 09/30/2021
Cu r r en t 1 4 1 ,8 3 7 (1 5 ,07 9 ) (1 7 4 ,1 05 ) 1 2 3 ,5 8 5 1 1 5 ,8 6 6 1 ,07 8 1 9 3 ,1 8 2
Non -cu r r en t 6 7 6 ,4 6 4 (4 5 ,5 1 9 ) - 3 4 1 ,04 8 (1 1 5 ,8 6 6 ) 2 1 9 8 5 6 ,3 4 6
T ot a l in l ia bilit ies 818,301 (60,598) (174,105) 464,633 - 1,297 1,049,528
Righ t of u se 12/31/2020 A m ort iza t ion A ddit ions / Disposa ls 09/30/2021
La n ds 5 04 ,9 7 3 (3 4 ,6 6 5 ) 1 1 2 ,4 1 6 5 8 2 ,7 2 4
Bu ildin g s 8 ,7 1 2 (7 ,8 9 2 ) 4 7 ,2 1 9 4 8 ,03 9
Ma ch in es a n d equ ipm en t 2 9 4 ,7 3 5 (1 02 ,2 03 ) 2 2 9 ,1 3 8 4 2 1 ,6 7 0
T ot a l a sset s 808,420 (144,760) 388,773 1,052,433
Lea se lia bilit ies 31/12/2020 Int erest Pa y m ent s
A ddit ions /
Disposa ls
Short or Long
TermTransfer 09/30/2021
Cu r r en t 1 4 3 ,7 2 1 (1 2 ,8 4 2 ) (1 7 7 ,08 1 ) 1 2 3 ,1 1 4 1 1 6 ,1 00 1 9 3 ,01 2
Non -cu r r en t 6 7 9 ,5 9 1 (6 3 ,1 3 3 ) - 3 8 1 ,2 6 7 (1 1 6 ,1 00) 8 8 1 ,6 2 5
T ot a l in l ia bilit ies 823,312 (75,975) (177,081) 504,381 - 1,074,637
Consolida t ed
Pa rent com pa ny
Righ t of u se 12/31/2019 A m ort iza t ion A ddit ions / Disposa ls 12/31/2020
La n ds3 6 1 ,4 7 4 (4 2 ,1 2 7 ) 1 8 2 ,5 6 3 5 01 ,9 1 0
Bu ildin g s 1 8 ,08 4 (9 ,4 2 7 ) (3 3 2 ) 8 ,3 2 5
Ma ch in es a n d equ ipm en t 1 1 2 ,05 8 (8 0,9 6 0) 2 6 2 ,1 4 4 2 9 3 ,2 4 2
T ot a l a sset s 491,616 (132,514) 444,375 803,477
12/31/2019 Int erest Pa y m ent s A ddit ions / Disposa ls
Short or Long
TermTransfer 12/31/2020
Lea se lia bilit ies 1 00,1 9 8 (1 2 5 ,7 9 9 ) (1 5 8 ,1 5 9 ) 2 1 5 ,02 1 1 1 0,5 7 6 1 4 1 ,8 3 7
Cu r r en t 3 9 4 ,2 3 3 (1 8 0,4 6 7 ) - 5 7 3 ,2 7 4 (1 1 0,5 7 6 ) 6 7 6 ,4 6 4
Non -cu r r en t 494,431 (306,266) (158,159) 788,295 - 818,301
T ot a l in l ia bilit ies
Righ t of u se 12/31/2019 A m ort iza t ion A ddit ions / Disposa ls 12/31/2020
La n ds 3 6 4 ,2 5 8 (4 2 ,4 9 4 ) 1 8 3 ,2 09 5 04 ,9 7 3
Bu ildin g s 1 8 ,08 4 (9 ,4 2 7 ) 5 5 8 ,7 1 2
Ma ch in es a n d equ ipm en t 1 1 2 ,05 7 (8 0,9 6 0) 2 6 3 ,6 3 8 2 9 4 ,7 3 5
T ot a l a sset s 494,399 (132,881) 446,902 808,420
Lea se lia bilit ies 12/31/2019 Int erest Pa y m ent s A ddit ions / Disposa ls
Short or Long
TermTransfer 12/31/2020
Cu r r en t 1 00,5 09 (1 2 5 ,7 1 1 ) (1 5 8 ,5 9 0) 2 1 6 ,6 09 1 1 0,9 04 1 4 3 ,7 2 1
Non -cu r r en t 3 9 6 ,7 2 0 (1 8 0,7 1 4 ) - 5 7 4 ,4 8 9 (1 1 0,9 04 ) 6 7 9 ,5 9 1
T ot a l in l ia bilit ies 497,229 (306,425) (158,590) 791,098 - 823,312
Consolida t ed
Pa rent com pa ny
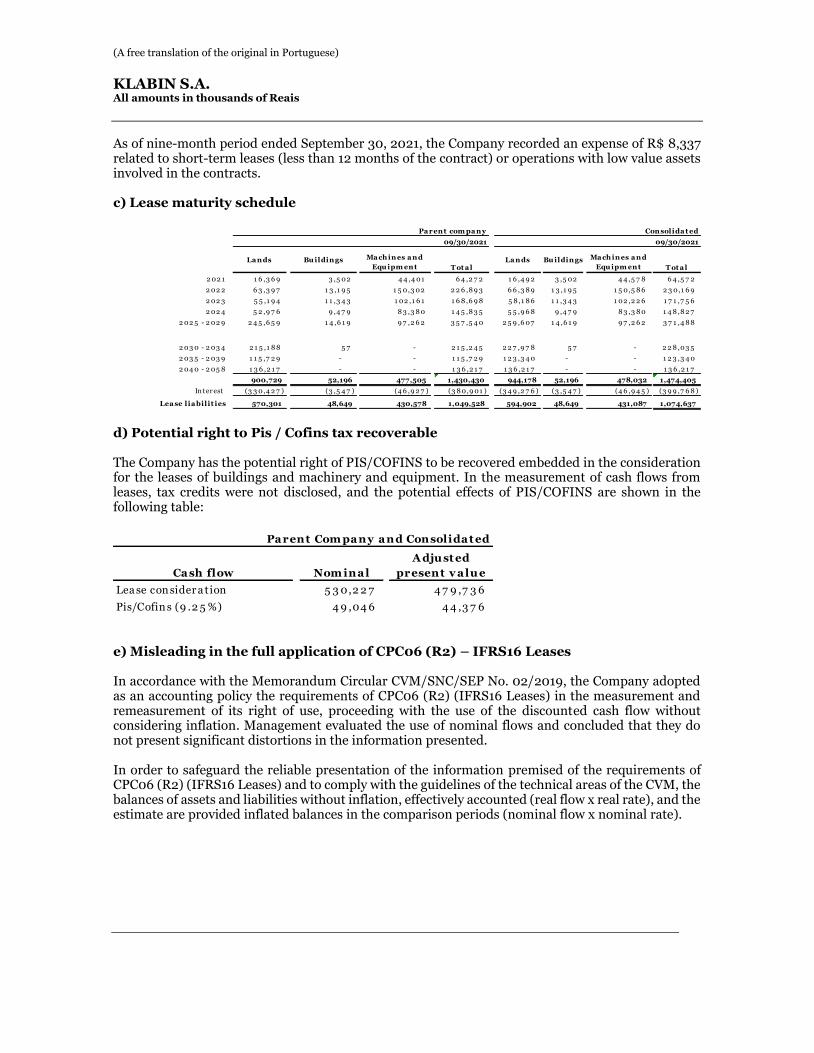
(A free translation of the original in Portuguese)
KLABIN S.A.
All amounts in thousands of Reais
As of nine-month period ended September 30, 2021, the Company recorded an expense of R$ 8,337 related to short-term leases (less than 12 months of the contract) or operations with low value assets involved in the contracts. c) Lease maturity schedule
d) Potential right to Pis / Cofins tax recoverable The Company has the potential right of PIS/COFINS to be recovered embedded in the consideration for the leases of buildings and machinery and equipment. In the measurement of cash flows from leases, tax credits were not disclosed, and the potential effects of PIS/COFINS are shown in the following table:
e) Misleading in the full application of CPC06 (R2) – IFRS16 Leases In accordance with the Memorandum Circular CVM/SNC/SEP No. 02/2019, the Company adopted as an accounting policy the requirements of CPC06 (R2) (IFRS16 Leases) in the measurement and remeasurement of its right of use, proceeding with the use of the discounted cash flow without considering inflation. Management evaluated the use of nominal flows and concluded that they do not present significant distortions in the information presented. In order to safeguard the reliable presentation of the information premised of the requirements of CPC06 (R2) (IFRS16 Leases) and to comply with the guidelines of the technical areas of the CVM, the balances of assets and liabilities without inflation, effectively accounted (real flow x real rate), and the estimate are provided inflated balances in the comparison periods (nominal flow x nominal rate).
La nds Bu ildings Ma ch ines a nd
Equ ipm ent T ot a lLa nds Bu ildings Ma ch ines a nd
Equ ipm ent T ot a l
2 02 1 1 6 ,3 6 9 3 ,5 02 4 4 ,4 01 6 4 ,2 7 2 1 6 ,4 9 2 3 ,5 02 4 4 ,5 7 8 6 4 ,5 7 2
2 02 2 6 3 ,3 9 7 1 3 ,1 9 5 1 5 0,3 02 2 2 6 ,8 9 3 6 6 ,3 8 9 1 3 ,1 9 5 1 5 0,5 8 6 2 3 0,1 6 9
2 02 3 5 5 ,1 9 4 1 1 ,3 4 3 1 02 ,1 6 1 1 6 8 ,6 9 8 5 8 ,1 8 6 1 1 ,3 4 3 1 02 ,2 2 6 1 7 1 ,7 5 6
2 02 4 5 2 ,9 7 6 9 ,4 7 9 8 3 ,3 8 0 1 4 5 ,8 3 5 5 5 ,9 6 8 9 ,4 7 9 8 3 ,3 8 0 1 4 8 ,8 2 7
2 02 5 - 2 02 9 2 4 5 ,6 5 9 1 4 ,6 1 9 9 7 ,2 6 2 3 5 7 ,5 4 0 2 5 9 ,6 07 1 4 ,6 1 9 9 7 ,2 6 2 3 7 1 ,4 8 8
2 03 0 - 2 03 4 2 1 5 ,1 8 8 5 7 - 2 1 5 ,2 4 5 2 2 7 ,9 7 8 5 7 - 2 2 8 ,03 5
2 03 5 - 2 03 9 1 1 5 ,7 2 9 - - 1 1 5 ,7 2 9 1 2 3 ,3 4 0 - - 1 2 3 ,3 4 0
2 04 0 - 2 05 8 1 3 6 ,2 1 7 - - 1 3 6 ,2 1 7 1 3 6 ,2 1 7 - - 1 3 6 ,2 1 7
900,729 52,196 477,505 1,430,430 944,178 52,196 478,032 1,474,405
In ter est (3 3 0,4 2 7 ) (3 ,5 4 7 ) (4 6 ,9 2 7 ) (3 8 0,9 01 ) (3 4 9 ,2 7 6 ) (3 ,5 4 7 ) (4 6 ,9 4 5 ) (3 9 9 ,7 6 8 )
Lea se lia bilit ies 570,301 48,649 430,578 1,049,528 594,902 48,649 431,087 1,074,637
Pa rent com pa ny Consolida t ed
09/30/2021 09/30/2021
Parent Com pany and Consolidat ed
Cash flow Nom inal
A dju st ed
present v alu e
Lea se con sider a tion 5 3 0,2 2 7 4 7 9 ,7 3 6
Pis/Cofin s (9 .2 5 %) 4 9 ,04 6 4 4 ,3 7 6
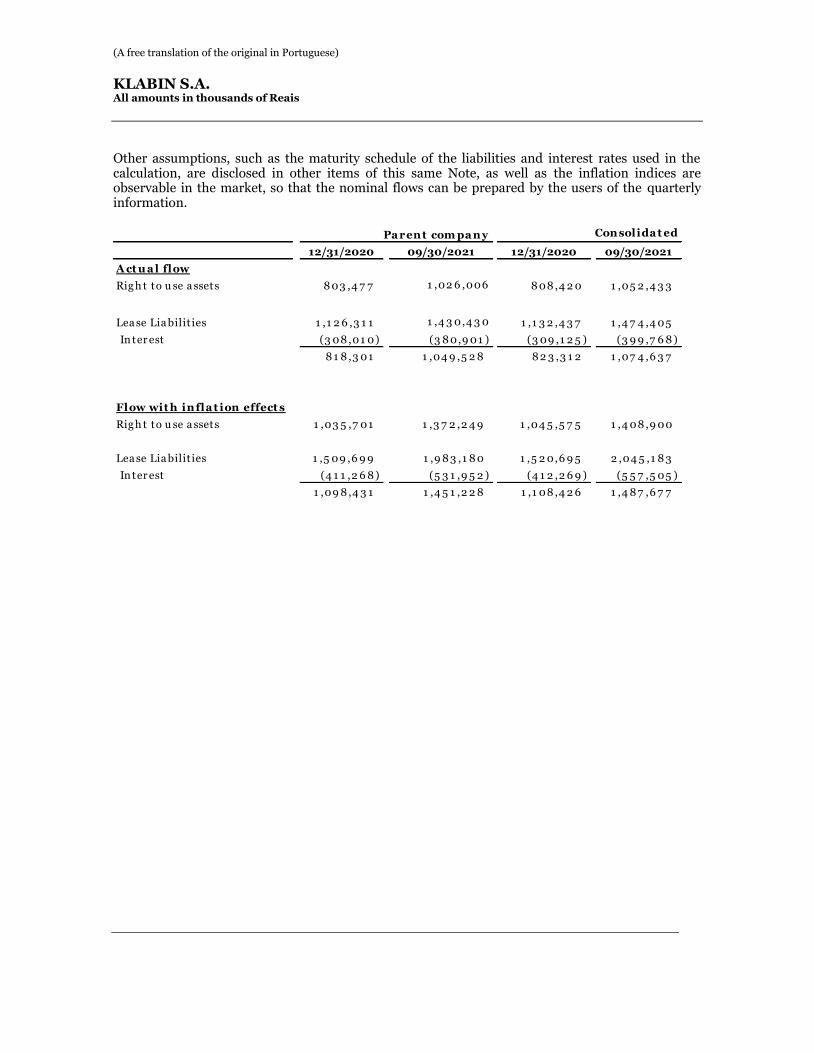
(A free translation of the original in Portuguese)
KLABIN S.A.
All amounts in thousands of Reais
Other assumptions, such as the maturity schedule of the liabilities and interest rates used in the calculation, are disclosed in other items of this same Note, as well as the inflation indices are observable in the market, so that the nominal flows can be prepared by the users of the quarterly information.
12/31/2020 09/30/2021 12/31/2020 09/30/2021
A ct u a l flow
Rig h t to u se a ssets 8 03 ,4 7 7 1 ,02 6 ,006 8 08 ,4 2 0 1 ,05 2 ,4 3 3
Lea se Lia bilit ies 1 ,1 2 6 ,3 1 1 1 ,4 3 0,4 3 0 1 ,1 3 2 ,4 3 7 1 ,4 7 4 ,4 05
In ter est (3 08 ,01 0) (3 8 0,9 01 ) (3 09 ,1 2 5 ) (3 9 9 ,7 6 8 )
8 1 8 ,3 01 1 ,04 9 ,5 2 8 8 2 3 ,3 1 2 1 ,07 4 ,6 3 7
Flow wit h infla t ion effect s
Rig h t to u se a ssets 1 ,03 5 ,7 01 1 ,3 7 2 ,2 4 9 1 ,04 5 ,5 7 5 1 ,4 08 ,9 00
Lea se Lia bilit ies 1 ,5 09 ,6 9 9 1 ,9 8 3 ,1 8 0 1 ,5 2 0,6 9 5 2 ,04 5 ,1 8 3
In ter est (4 1 1 ,2 6 8 ) (5 3 1 ,9 5 2 ) (4 1 2 ,2 6 9 ) (5 5 7 ,5 05 )
1 ,09 8 ,4 3 1 1 ,4 5 1 ,2 2 8 1 ,1 08 ,4 2 6 1 ,4 8 7 ,6 7 7
Consolida t edPa rent com pa ny
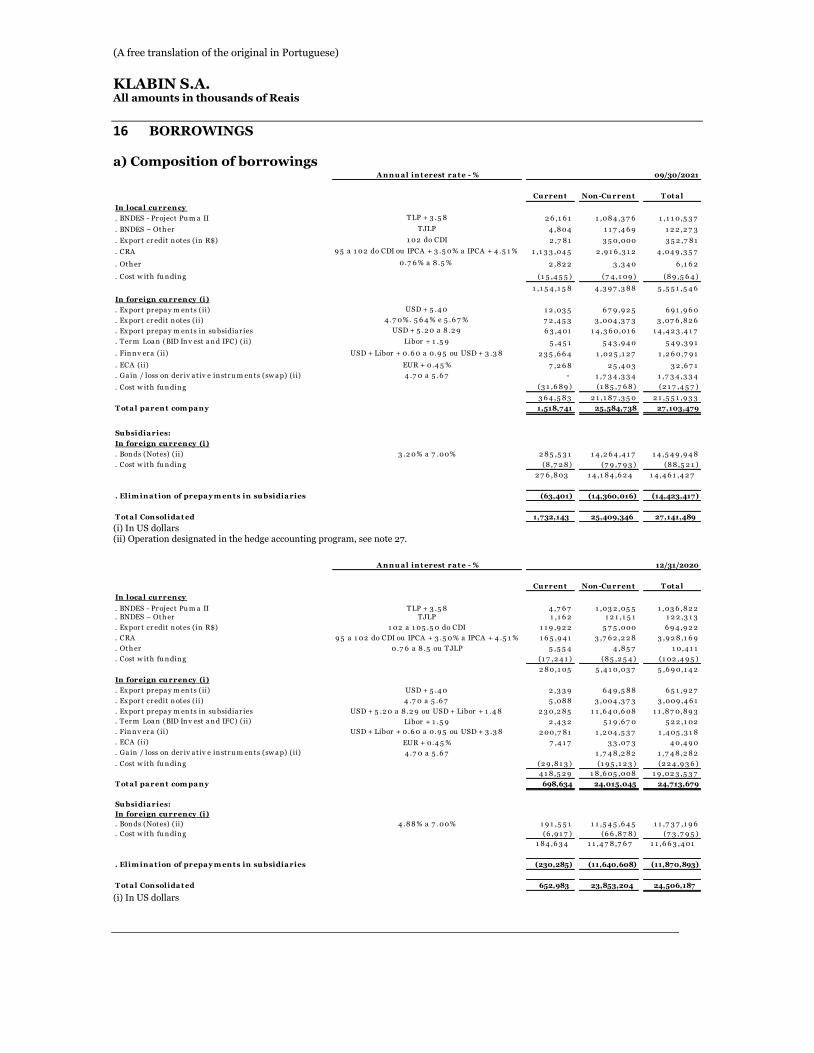
(A free translation of the original in Portuguese)
KLABIN S.A.
All amounts in thousands of Reais
16 BORROWINGS
a) Composition of borrowings
(i) In US dollars (ii) Operation designated in the hedge accounting program, see note 27.
(i) In US dollars
A nnu a l int erest ra t e - % 09/30/2021
Cu rrent Non-Cu rrent T ot a l
In loca l cu rrency
. BNDES - Pr oject Pu m a II TLP + 3 .5 8 2 6 ,1 6 1 1 ,08 4 ,3 7 6 1 ,1 1 0,5 3 7
. BNDES – Oth er TJLP 4 ,8 04 1 1 7 ,4 6 9 1 2 2 ,2 7 3
. Ex por t cr edit n otes (in R$) 1 02 do CDI 2 ,7 8 1 3 5 0,000 3 5 2 ,7 8 1
. CRA 9 5 a 1 02 do CDI ou IPCA + 3 .5 0% a IPCA + 4 .5 1 % 1 ,1 3 3 ,04 5 2 ,9 1 6 ,3 1 2 4 ,04 9 ,3 5 7
. Oth er 0.7 6 % a 8 .5 % 2 ,8 2 2 3 ,3 4 0 6 ,1 6 2
. Cost w ith fu n din g (1 5 ,4 5 5 ) (7 4 ,1 09 ) (8 9 ,5 6 4 )
1 ,1 5 4 ,1 5 8 4 ,3 9 7 ,3 8 8 5 ,5 5 1 ,5 4 6
In foreign cu rrency (i)
. Ex por t pr epa y m en ts (ii) USD + 5 .4 0 1 2 ,03 5 6 7 9 ,9 2 5 6 9 1 ,9 6 0
. Ex por t cr edit n otes (ii) 4 .7 0%. 5 6 4 % e 5 .6 7 % 7 2 ,4 5 3 3 ,004 ,3 7 3 3 ,07 6 ,8 2 6
. Ex por t pr epa y m en ts in su bsidia r ies USD + 5 .2 0 a 8 .2 9 6 3 ,4 01 1 4 ,3 6 0,01 6 1 4 ,4 2 3 ,4 1 7
. Ter m Loa n (BID In v est a n d IFC) (ii) Libor + 1 .5 9 5 ,4 5 1 5 4 3 ,9 4 0 5 4 9 ,3 9 1
. Fin n v er a (ii) USD + Libor + 0.6 0 a 0.9 5 ou USD + 3 .3 8 2 3 5 ,6 6 4 1 ,02 5 ,1 2 7 1 ,2 6 0,7 9 1
. ECA (ii) EUR + 0.4 5 % 7 ,2 6 8 2 5 ,4 03 3 2 ,6 7 1
. Ga in / loss on der iv a t iv e in str u m en ts (sw a p) (ii) 4 .7 0 a 5 .6 7 - 1 ,7 3 4 ,3 3 4 1 ,7 3 4 ,3 3 4
. Cost w ith fu n din g (3 1 ,6 8 9 ) (1 8 5 ,7 6 8 ) (2 1 7 ,4 5 7 )
3 6 4 ,5 8 3 2 1 ,1 8 7 ,3 5 0 2 1 ,5 5 1 ,9 3 3
T ot a l pa rent com pa ny 1,518,741 25,584,738 27,103,479
Su bsidia ries:
In foreign cu rrency (i)
. Bon ds (Notes) (ii) 3 .2 0% a 7 .00% 2 8 5 ,5 3 1 1 4 ,2 6 4 ,4 1 7 1 4 ,5 4 9 ,9 4 8
. Cost w ith fu n din g (8 ,7 2 8 ) (7 9 ,7 9 3 ) (8 8 ,5 2 1 )
2 7 6 ,8 03 1 4 ,1 8 4 ,6 2 4 1 4 ,4 6 1 ,4 2 7
. Elim ina t ion of prepa y m ent s in su bsidia ries (63,401) (14,360,016) (14,423,417)
T ot a l Consolida t ed 1,732,143 25,409,346 27,141,489
A nnu a l int erest ra t e - % 12/31/2020
Cu rrent Non-Cu rrent T ot a l
In loca l cu rrency
. BNDES - Pr oject Pu m a II TLP + 3 .5 8 4 ,7 6 7 1 ,03 2 ,05 5 1 ,03 6 ,8 2 2
. BNDES – Oth er TJLP 1 ,1 6 2 1 2 1 ,1 5 1 1 2 2 ,3 1 3
. Ex por t cr edit n otes (in R$) 1 02 a 1 05 .5 0 do CDI 1 1 9 ,9 2 2 5 7 5 ,000 6 9 4 ,9 2 2
. CRA 9 5 a 1 02 do CDI ou IPCA + 3 .5 0% a IPCA + 4 .5 1 % 1 6 5 ,9 4 1 3 ,7 6 2 ,2 2 8 3 ,9 2 8 ,1 6 9
. Oth er 0.7 6 a 8 .5 ou TJLP 5 ,5 5 4 4 ,8 5 7 1 0,4 1 1
. Cost w ith fu n din g (1 7 ,2 4 1 ) (8 5 ,2 5 4 ) (1 02 ,4 9 5 )
2 8 0,1 05 5 ,4 1 0,03 7 5 ,6 9 0,1 4 2
In foreign cu rrency (i)
. Ex por t pr epa y m en ts (ii) USD + 5 .4 0 2 ,3 3 9 6 4 9 ,5 8 8 6 5 1 ,9 2 7
. Ex por t cr edit n otes (ii) 4 .7 0 a 5 .6 7 5 ,08 8 3 ,004 ,3 7 3 3 ,009 ,4 6 1
. Ex por t pr epa y m en ts in su bsidia r ies USD + 5 .2 0 a 8 .2 9 ou USD + Libor + 1 .4 8 2 3 0,2 8 5 1 1 ,6 4 0,6 08 1 1 ,8 7 0,8 9 3
. Ter m Loa n (BID In v est a n d IFC) (ii) Libor + 1 .5 9 2 ,4 3 2 5 1 9 ,6 7 0 5 2 2 ,1 02
. Fin n v er a (ii) USD + Libor + 0.6 0 a 0.9 5 ou USD + 3 .3 8 2 00,7 8 1 1 ,2 04 ,5 3 7 1 ,4 05 ,3 1 8
. ECA (ii) EUR + 0.4 5 % 7 ,4 1 7 3 3 ,07 3 4 0,4 9 0
. Ga in / loss on der iv a t iv e in str u m en ts (sw a p) (ii) 4 .7 0 a 5 .6 7 1 ,7 4 8 ,2 8 2 1 ,7 4 8 ,2 8 2
. Cost w ith fu n din g (2 9 ,8 1 3 ) (1 9 5 ,1 2 3 ) (2 2 4 ,9 3 6 )
4 1 8 ,5 2 9 1 8 ,6 05 ,008 1 9 ,02 3 ,5 3 7
T ot a l pa rent com pa ny 698,634 24,015,045 24,713,679
Su bsidia ries:
In foreign cu rrency (i)
. Bon ds (Notes) (ii) 4 .8 8 % a 7 .00% 1 9 1 ,5 5 1 1 1 ,5 4 5 ,6 4 5 1 1 ,7 3 7 ,1 9 6
. Cost w ith fu n din g (6 ,9 1 7 ) (6 6 ,8 7 8 ) (7 3 ,7 9 5 )
1 8 4 ,6 3 4 1 1 ,4 7 8 ,7 6 7 1 1 ,6 6 3 ,4 01
. Elim ina t ion of prepa y m ent s in su bsidia ries (230,285) (11,640,608) (11,870,893)
T ot a l Consolida t ed 652,983 23,853,204 24,506,187
(A free translation of the original in Portuguese)
KLABIN S.A.
All amounts in thousands of Reais
National Bank for Economic and Social Development (BNDES)
The Company has contracts with the BNDES whose purpose was to finance industrial and forest development projects, social projects and paper segment, called Puma II Project, with settlement scheduled for 2039. The amortization of the financing is carried out monthly with the interest. Export prepayments and export credit notes
Prepayments and export credit notes (in R$ and USD) were raised for the purpose of managing working capital and developing the Company's operations. The contracts are expected to be settled by April 2029. Bonds (Notes)
The Company, through its wholly-owned subsidiaries Klabin Finance SA and Klabin Austria GmbH, issued debt securities (Notes) in the international market with listing on the Luxembourg Stock Exchange (Euro MTF) and on the Singapore Stock Exchange (SGX) with a Senior issue type Unsecured Notes 144A/Reg S. (i) In July 2014, the fundraising of USD 500 million was completed, with a 10-year term and maturity in 2024, with a coupon of 5.25% paid semi-annually, with the purpose of financing the activities of the Company and its subsidiaries within the normal course of business and serving the respective corporate purposes. In April 2019 and January 2021, respectively a USD 228.5 million and USD 98 million, repurchase was carried out, aligned with the Company's debt management strategy. (ii) In September 2017, the Company issued Green Bonds in the amount of USD 500 million, with a 10 year term due in 2027, with a semiannual coupon of 4.88%. The resource is destined to reforestation activities, restoration of native forests, investments in renewable energy, efficient logistics using rail transport, recycling of solid waste and development of eco-efficient products, among other sustainability practices. During 2020, a USD 9.5 million repurchase was carried out, aligned with the Company's debt management strategy. (iii) In March 2019, the fundraising of USD 500 million was completed with a 10 year term and maturity in 2029 and a coupon of 5.75% p.a. and USD 500 million in Green Bonds with a 30-year term and maturity in 2049, with coupon of 7% p.a., with the purpose of prepaying or refinancing the debts of the Company and its subsidiaries, as well as to reinforce cash. During 2020, a USD 18.5 million repurchase was carried out aligned with the Company's debt management strategy. (iv) In July 2019, the Bonds maturing in 2029 were reopened and an additional funding of USD 250 million of nominal value was concluded, with a coupon of 5.75% and yield of 4.90% p.a., with the aim of purpose of the prepayment or refinancing of debts of the Company and its subsidiaries, as well as cash reinforcement. (v) In January 2020, Green Bonds maturing in 2049 were reopened and the additional funding of USD 200 million of nominal value was concluded, with a coupon of 7.00% and yield of 6.10% p.a., aim to the purpose the financing or refinancing, in whole or in part, of costs and / or investments in eligible “Green Projects”. (vi) In January 2021, the raising of USD 500 million in Sustainability Linked Bonds (SLB) with maturity in 2031 and a coupon of 3.20% p.a. was completed, with the objective of early repurchase of the Bond maturing in 2024 and the achievement of the Company's general objectives.
(A free translation of the original in Portuguese)
KLABIN S.A.
All amounts in thousands of Reais
Finnvera (Finland Export Credit Agency) As part of the funding necessary for the execution of the Puma I, the Company entered into a contract to raise funds, to be used to finance the assets acquired from the Puma Project. The amount of the commitment is up to USD 460 million, maturing in 2026, divided into two tranches, the first of which is up to USD 414 million with interest of 3.4% p.a. and the second tranche of up to USD 46 million with interest of Libor 6M + 1% p.a., with two disbursements in 2015 totaling USD 325.7 million and a final disbursement of USD 38.6 million was released in the fourth quarter of 2016, totaling USD 364.3 million. The amount raised in USD was lower than initially expected due to the support of imports being in Euro and the appreciation of the dollar against the Euro in the period. USD 67 million were raised for the Puma II Project bearing semiannual Libor 6M + 0.55% p.a. and maturing in 2031. Term Loan (BID Invest and IFC)
As part of the funding needed to carry out the Puma II Project, USD 100 million was raised, divided into two tranches, the first was USD 48 million with interest of Libor 6M + 1.45% p.a. maturing in 2026, and the second tranche of USD 52 million with interest of Libor 6M + 1.75% maturing in 2029. CRA – Agribusiness Receivables Certificates The Company issued simple debentures that support the issuance of Certificates of Agribusiness Receivables (“CRA”), being: (i) CRA I - issued by “Eco Securitizadora de Direitos Creditórios do Agronegócio S.A” in March 2017 in the amount of R$ 845.9 million, with a term of 5 years and semiannual interest of 95% of the CDI. (ii) CRA II - issued by “Eco Securitizadora de Direitos Creditórios do Agronegócio S.A” in December 2017 in the amount of R$ 600 million, with a 6-year term and semiannual interest of 97.5% of the CDI. (iii) CRA III - issued by Ápice Securitizadora S.A in September 2018 in the amount of R$ 350 million, with a 6-year term and semiannual interest of 102% of the CDI. (iv) CRA IV - issued by VERT Companhia Securitizadora in April 2019 in the amount of R$ 1 billion divided into two series. The first series in the total amount of R$ 200 million, with a 7-year maturity and semiannual interest of 98% of the CDI. The second series in the total amount of R$ 800 million, with a 10-year maturity and semiannual interest corresponding to the internal rate of return of the IPCA Treasury. (v) CRA V - issued by VERT Companhia Securitizadora in July 2019 in the amount of R$ 966 million with a 10-year term and interest at IPCA + 3.5% p.a.. Derivative instruments (swap) - gain/loss In December 2018, the Company obtained a new R$ 1,879 million export credit note from Bank Bradesco with maturity in 2026 and interest of 114% of the CDI, without collateral and without covenant, linked together with two foreign exchange and interest rate swaps, but in USD and interest of 5.6%, with the same credit note maturity, and no instrument can be settled separately.
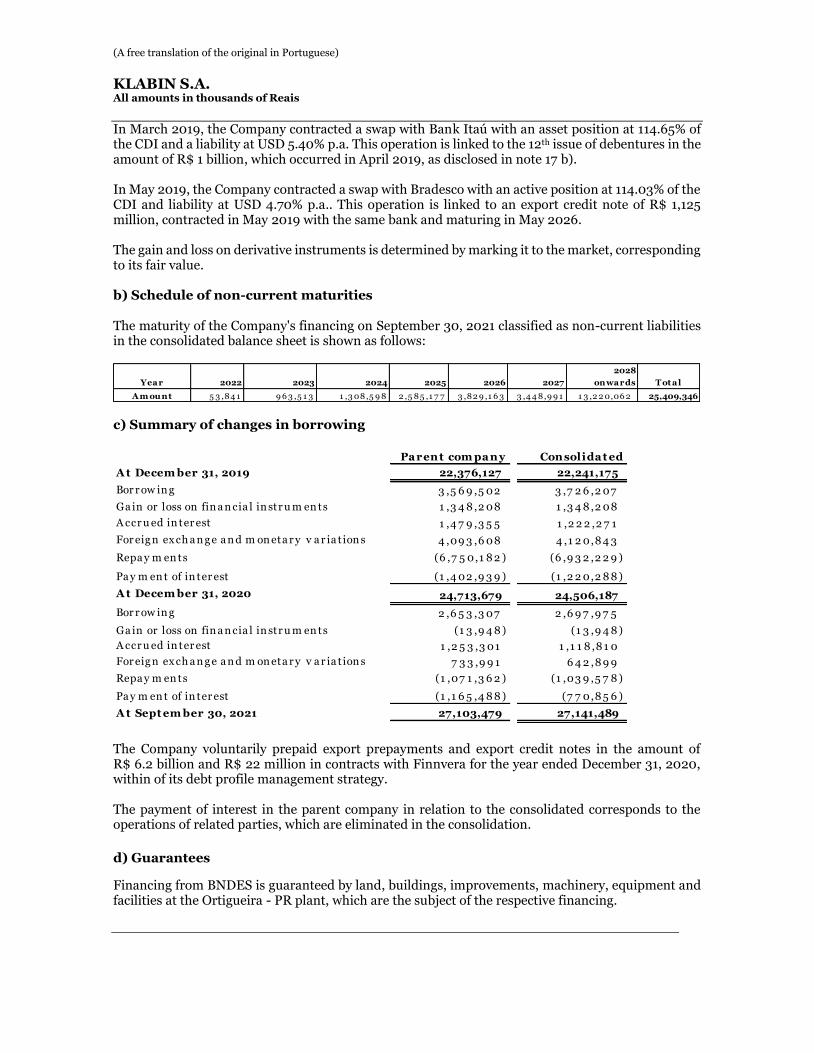
(A free translation of the original in Portuguese)
KLABIN S.A.
All amounts in thousands of Reais
In March 2019, the Company contracted a swap with Bank Itaú with an asset position at 114.65% of the CDI and a liability at USD 5.40% p.a. This operation is linked to the 12th issue of debentures in the amount of R$ 1 billion, which occurred in April 2019, as disclosed in note 17 b). In May 2019, the Company contracted a swap with Bradesco with an active position at 114.03% of the CDI and liability at USD 4.70% p.a.. This operation is linked to an export credit note of R$ 1,125 million, contracted in May 2019 with the same bank and maturing in May 2026. The gain and loss on derivative instruments is determined by marking it to the market, corresponding to its fair value. b) Schedule of non-current maturities
The maturity of the Company's financing on September 30, 2021 classified as non-current liabilities in the consolidated balance sheet is shown as follows:
c) Summary of changes in borrowing
The Company voluntarily prepaid export prepayments and export credit notes in the amount of R$ 6.2 billion and R$ 22 million in contracts with Finnvera for the year ended December 31, 2020, within of its debt profile management strategy. The payment of interest in the parent company in relation to the consolidated corresponds to the operations of related parties, which are eliminated in the consolidation.
d) Guarantees
Financing from BNDES is guaranteed by land, buildings, improvements, machinery, equipment and facilities at the Ortigueira - PR plant, which are the subject of the respective financing.
2028
Year 2022 2023 2024 2025 2026 2027 onwards Tot al
A m ount 5 3 ,84 1 9 6 3 ,5 1 3 1 ,3 08,5 9 8 2 ,5 85 ,1 7 7 3 ,82 9 ,1 6 3 3 ,4 4 8,9 9 1 1 3 ,2 2 0,06 2 25,409,346
Pa ren t com pa n y Consolida t ed
A t Decem ber 31, 2019 22,376,127 22,241,175
Bor r ow in g 3 ,5 6 9 ,5 02 3 ,7 2 6 ,2 07
Ga in or loss on fin a n cia l in str u m en ts 1 ,3 4 8 ,2 08 1 ,3 4 8 ,2 08
A ccr u ed in ter est 1 ,4 7 9 ,3 5 5 1 ,2 2 2 ,2 7 1
For eig n ex ch a n g e a n d m on eta r y v a r ia t ion s 4 ,09 3 ,6 08 4 ,1 2 0,8 4 3
Repa y m en ts (6 ,7 5 0,1 8 2 ) (6 ,9 3 2 ,2 2 9 )
Pa y m en t of in ter est (1 ,4 02 ,9 3 9 ) (1 ,2 2 0,2 8 8 )
A t Decem ber 31, 2020 24,713,679 24,506,187
Bor r ow in g 2 ,6 5 3 ,3 07 2 ,6 9 7 ,9 7 5
Ga in or loss on fin a n cia l in str u m en ts (1 3 ,9 4 8 ) (1 3 ,9 4 8 )
A ccr u ed in ter est 1 ,2 5 3 ,3 01 1 ,1 1 8 ,8 1 0
For eig n ex ch a n g e a n d m on eta r y v a r ia t ion s 7 3 3 ,9 9 1 6 4 2 ,8 9 9
Repa y m en ts (1 ,07 1 ,3 6 2 ) (1 ,03 9 ,5 7 8 )
Pa y m en t of in ter est (1 ,1 6 5 ,4 8 8 ) (7 7 0,8 5 6 )
A t Sept em ber 30, 2021 27,103,479 27,141,489
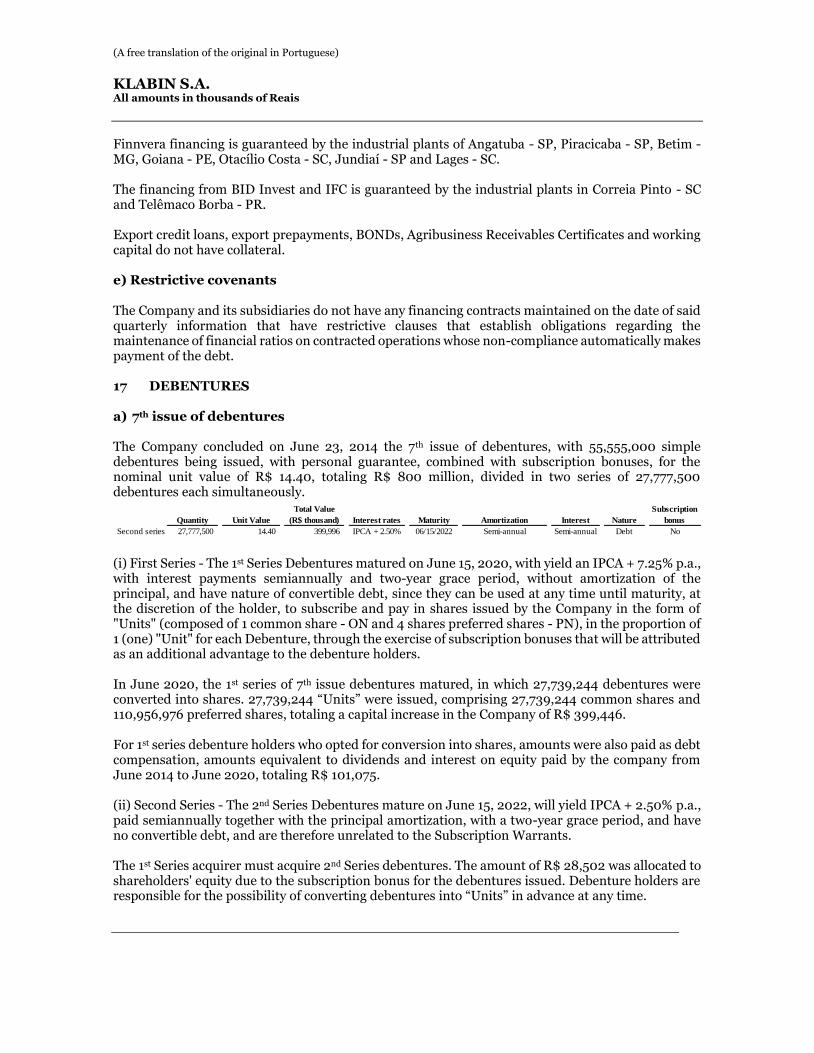
(A free translation of the original in Portuguese)
KLABIN S.A.
All amounts in thousands of Reais
Finnvera financing is guaranteed by the industrial plants of Angatuba - SP, Piracicaba - SP, Betim - MG, Goiana - PE, Otacílio Costa - SC, Jundiaí - SP and Lages - SC. The financing from BID Invest and IFC is guaranteed by the industrial plants in Correia Pinto - SC and Telêmaco Borba - PR. Export credit loans, export prepayments, BONDs, Agribusiness Receivables Certificates and working capital do not have collateral. e) Restrictive covenants
The Company and its subsidiaries do not have any financing contracts maintained on the date of said quarterly information that have restrictive clauses that establish obligations regarding the maintenance of financial ratios on contracted operations whose non-compliance automatically makes payment of the debt. 17 DEBENTURES a) 7th issue of debentures The Company concluded on June 23, 2014 the 7th issue of debentures, with 55,555,000 simple debentures being issued, with personal guarantee, combined with subscription bonuses, for the nominal unit value of R$ 14.40, totaling R$ 800 million, divided in two series of 27,777,500 debentures each simultaneously.
(i) First Series - The 1st Series Debentures matured on June 15, 2020, with yield an IPCA + 7.25% p.a., with interest payments semiannually and two-year grace period, without amortization of the principal, and have nature of convertible debt, since they can be used at any time until maturity, at the discretion of the holder, to subscribe and pay in shares issued by the Company in the form of "Units" (composed of 1 common share - ON and 4 shares preferred shares - PN), in the proportion of 1 (one) "Unit" for each Debenture, through the exercise of subscription bonuses that will be attributed as an additional advantage to the debenture holders. In June 2020, the 1st series of 7th issue debentures matured, in which 27,739,244 debentures were converted into shares. 27,739,244 “Units” were issued, comprising 27,739,244 common shares and 110,956,976 preferred shares, totaling a capital increase in the Company of R$ 399,446. For 1st series debenture holders who opted for conversion into shares, amounts were also paid as debt compensation, amounts equivalent to dividends and interest on equity paid by the company from June 2014 to June 2020, totaling R$ 101,075. (ii) Second Series - The 2nd Series Debentures mature on June 15, 2022, will yield IPCA + 2.50% p.a., paid semiannually together with the principal amortization, with a two-year grace period, and have no convertible debt, and are therefore unrelated to the Subscription Warrants. The 1st Series acquirer must acquire 2nd Series debentures. The amount of R$ 28,502 was allocated to shareholders' equity due to the subscription bonus for the debentures issued. Debenture holders are responsible for the possibility of converting debentures into “Units” in advance at any time.
Quantity Interest rates Maturity Amortization Interest Nature
Second series 27,777,500 14.40 399,996 IPCA + 2.50% 06/15/2022 Semi-annual Semi-annual Debt No
Subscription
bonusUnit Value
Total Value
(R$ thousand)
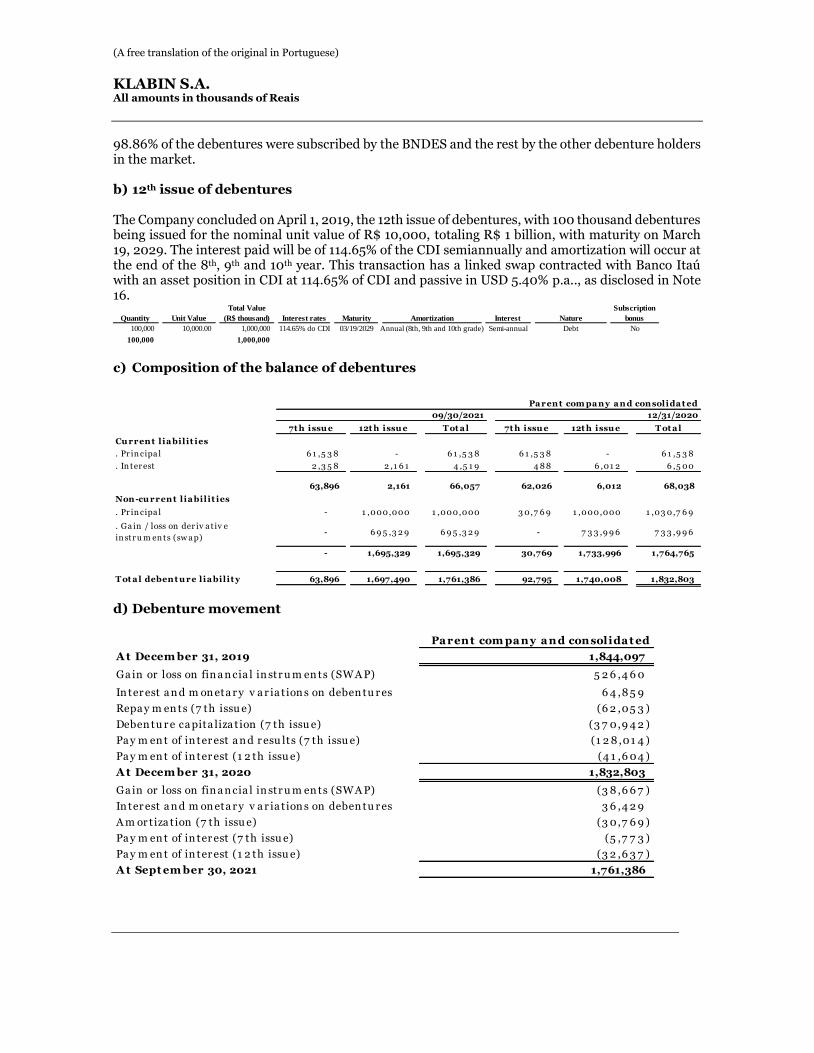
(A free translation of the original in Portuguese)
KLABIN S.A.
All amounts in thousands of Reais
98.86% of the debentures were subscribed by the BNDES and the rest by the other debenture holders in the market. b) 12th issue of debentures
The Company concluded on April 1, 2019, the 12th issue of debentures, with 100 thousand debentures being issued for the nominal unit value of R$ 10,000, totaling R$ 1 billion, with maturity on March 19, 2029. The interest paid will be of 114.65% of the CDI semiannually and amortization will occur at the end of the 8th, 9th and 10th year. This transaction has a linked swap contracted with Banco Itaú with an asset position in CDI at 114.65% of CDI and passive in USD 5.40% p.a.., as disclosed in Note 16.
c) Composition of the balance of debentures
d) Debenture movement
Quantity Interest rates Maturity Amortization Interest Nature
12th issue 100,000 10,000.00 1,000,000 114.65% do CDI 03/19/2029 Annual (8th, 9th and 10th grade) Semi-annual Debt No
100,000 1,000,000
Subscription
bonusUnit Value
Total Value
(R$ thousand)
7t h issu e 12t h issu e T ot a l 7t h issu e 12t h issu e T ot a l
Cu rrent l ia bilit ies
. Pr in cipa l 6 1 ,5 3 8 - 6 1 ,5 3 8 6 1 ,5 3 8 - 6 1 ,5 3 8
. In ter est 2 ,3 5 8 2 ,1 6 1 4 ,5 1 9 4 8 8 6 ,01 2 6 ,5 00
63,896 2,161 66,057 62,026 6,012 68,038
Non-cu rrent l ia bilit ies
. Pr in cipa l - 1 ,000,000 1 ,000,000 3 0,7 6 9 1 ,000,000 1 ,03 0,7 6 9
. Ga in / loss on der iv a t iv e
in str u m en ts (sw a p)- 6 9 5 ,3 2 9 6 9 5 ,3 2 9 - 7 3 3 ,9 9 6 7 3 3 ,9 9 6
- 1,695,329 1,695,329 30,769 1,733,996 1,764,765
T ot a l debent u re lia bilit y 63,896 1,697,490 1,761,386 92,795 1,740,008 1,832,803
09/30/2021
Pa rent com pa ny a nd consolida t ed
12/31/2020
Pa ren t com pa n y a n d consolida t ed
A t Decem ber 31, 2019 1,844,097
Ga in or loss on fin a n cia l in str u m en ts (SWA P) 5 2 6 ,4 6 0
In ter est a n d m on eta r y v a r ia t ion s on deben tu r es 6 4 ,8 5 9
Repa y m en ts (7 th issu e) (6 2 ,05 3 )
Deben tu r e ca pita liza t ion (7 th issu e) (3 7 0,9 4 2 )
Pa y m en t of in ter est a n d r esu lts (7 th issu e) (1 2 8 ,01 4 )
Pa y m en t of in ter est (1 2 th issu e) (4 1 ,6 04 )
A t Decem ber 31, 2020 1,832,803
Ga in or loss on fin a n cia l in str u m en ts (SWA P) (3 8 ,6 6 7 )
In ter est a n d m on eta r y v a r ia t ion s on deben tu r es 3 6 ,4 2 9
A m or tiza t ion (7 th issu e) (3 0,7 6 9 )
Pa y m en t of in ter est (7 th issu e) (5 ,7 7 3 )
Pa y m en t of in ter est (1 2 th issu e) (3 2 ,6 3 7 )
A t Sept em ber 30, 2021 1,761,386
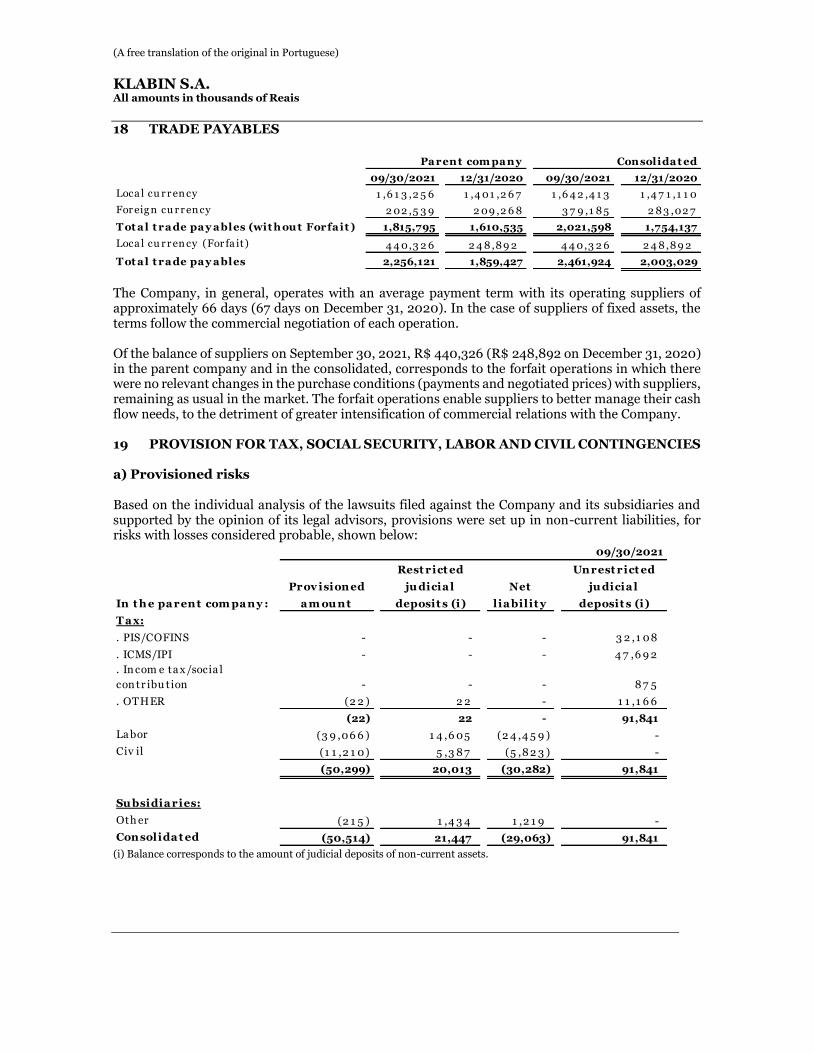
(A free translation of the original in Portuguese)
KLABIN S.A.
All amounts in thousands of Reais
18 TRADE PAYABLES
The Company, in general, operates with an average payment term with its operating suppliers of approximately 66 days (67 days on December 31, 2020). In the case of suppliers of fixed assets, the terms follow the commercial negotiation of each operation. Of the balance of suppliers on September 30, 2021, R$ 440,326 (R$ 248,892 on December 31, 2020) in the parent company and in the consolidated, corresponds to the forfait operations in which there were no relevant changes in the purchase conditions (payments and negotiated prices) with suppliers, remaining as usual in the market. The forfait operations enable suppliers to better manage their cash flow needs, to the detriment of greater intensification of commercial relations with the Company. 19 PROVISION FOR TAX, SOCIAL SECURITY, LABOR AND CIVIL CONTINGENCIES
a) Provisioned risks
Based on the individual analysis of the lawsuits filed against the Company and its subsidiaries and supported by the opinion of its legal advisors, provisions were set up in non-current liabilities, for risks with losses considered probable, shown below:
(i) Balance corresponds to the amount of judicial deposits of non-current assets.
09/30/2021 12/31/2020 09/30/2021 12/31/2020
Loca l cu r r en cy 1 ,6 1 3 ,2 5 6 1 ,4 01 ,2 6 7 1 ,6 4 2 ,4 1 3 1 ,4 7 1 ,1 1 0
For eig n cu r r en cy 2 02 ,5 3 9 2 09 ,2 6 8 3 7 9 ,1 8 5 2 8 3 ,02 7
Tot al t rade pay ables (wit h ou t Forfait ) 1,815,795 1,610,535 2,021,598 1,754,137
Loca l cu r r en cy (For fa it) 4 4 0,3 2 6 2 4 8 ,8 9 2 4 4 0,3 2 6 2 4 8 ,8 9 2
Tot al t rade pay ables 2,256,121 1,859,427 2,461,924 2,003,029
Parent com pany Consolidat ed
09/30/2021
Rest rict ed Unrest rict ed
Prov isioned ju dicia l Net ju dicia l
In t h e pa rent com pa ny : a m ou nt deposit s (i) lia bilit y deposit s (i)
T a x:
. PIS/COFINS - - - 3 2 ,1 08
. ICMS/IPI - - - 4 7 ,6 9 2
. In com e ta x /socia l
con tr ibu tion - - - 8 7 5
. OTHER (2 2 ) 2 2 - 1 1 ,1 6 6
(22) 22 - 91,841
La bor (3 9 ,06 6 ) 1 4 ,6 05 (2 4 ,4 5 9 ) -
Civ il (1 1 ,2 1 0) 5 ,3 8 7 (5 ,8 2 3 ) -
(50,299) 20,013 (30,282) 91,841
Su bsidia ries:
Oth er (2 1 5 ) 1 ,4 3 4 1 ,2 1 9 -
Consolida t ed (50,514) 21,447 (29,063) 91,841
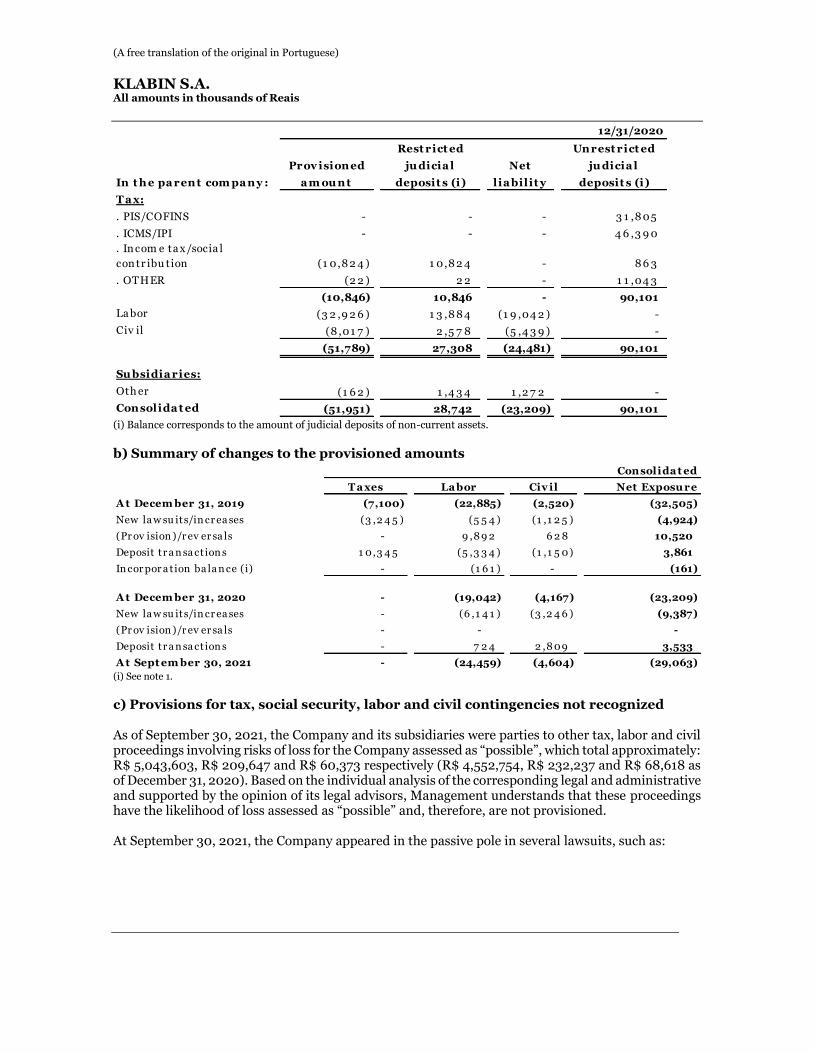
(A free translation of the original in Portuguese)
KLABIN S.A.
All amounts in thousands of Reais
(i) Balance corresponds to the amount of judicial deposits of non-current assets.
b) Summary of changes to the provisioned amounts
(i) See note 1.
c) Provisions for tax, social security, labor and civil contingencies not recognized
As of September 30, 2021, the Company and its subsidiaries were parties to other tax, labor and civil proceedings involving risks of loss for the Company assessed as “possible”, which total approximately: R$ 5,043,603, R$ 209,647 and R$ 60,373 respectively (R$ 4,552,754, R$ 232,237 and R$ 68,618 as of December 31, 2020). Based on the individual analysis of the corresponding legal and administrative and supported by the opinion of its legal advisors, Management understands that these proceedings have the likelihood of loss assessed as “possible” and, therefore, are not provisioned. At September 30, 2021, the Company appeared in the passive pole in several lawsuits, such as:
12/31/2020
Rest rict ed Unrest rict ed
Prov isioned ju dicia l Net ju dicia l
In t h e pa rent com pa ny : a m ou nt deposit s (i) lia bilit y deposit s (i)
T a x:
. PIS/COFINS - - - 3 1 ,8 05
. ICMS/IPI - - - 4 6 ,3 9 0
. In com e ta x /socia l
con tr ibu tion (1 0,8 2 4 ) 1 0,8 2 4 - 8 6 3
. OTHER (2 2 ) 2 2 - 1 1 ,04 3
(10,846) 10,846 - 90,101
La bor (3 2 ,9 2 6 ) 1 3 ,8 8 4 (1 9 ,04 2 ) -
Civ il (8 ,01 7 ) 2 ,5 7 8 (5 ,4 3 9 ) -
(51,789) 27,308 (24,481) 90,101
Su bsidia ries:
Oth er (1 6 2 ) 1 ,4 3 4 1 ,2 7 2 -
Consolida t ed (51,951) 28,742 (23,209) 90,101
Consolida t ed
T a xes La bor Civ il Net Exposu re
A t Decem ber 31, 2019 (7,100) (22,885) (2,520) (32,505)
New la w su its/in cr ea ses (3 ,2 4 5 ) (5 5 4 ) (1 ,1 2 5 ) (4,924)
(Pr ov ision )/r ev er sa ls - 9 ,8 9 2 6 2 8 10,520
Deposit tr a n sa ct ion s 1 0,3 4 5 (5 ,3 3 4 ) (1 ,1 5 0) 3,861
In cor por a t ion ba la n ce (i) - (1 6 1 ) - (161)
A t Decem ber 31, 2020 - (19,042) (4,167) (23,209)
New la w su its/in cr ea ses - (6 ,1 4 1 ) (3 ,2 4 6 ) (9,387)
(Pr ov ision )/r ev er sa ls - - -
Deposit tr a n sa ct ion s - 7 2 4 2 ,8 09 3,533
A t Sept em ber 30, 2021 - (24,459) (4,604) (29,063)
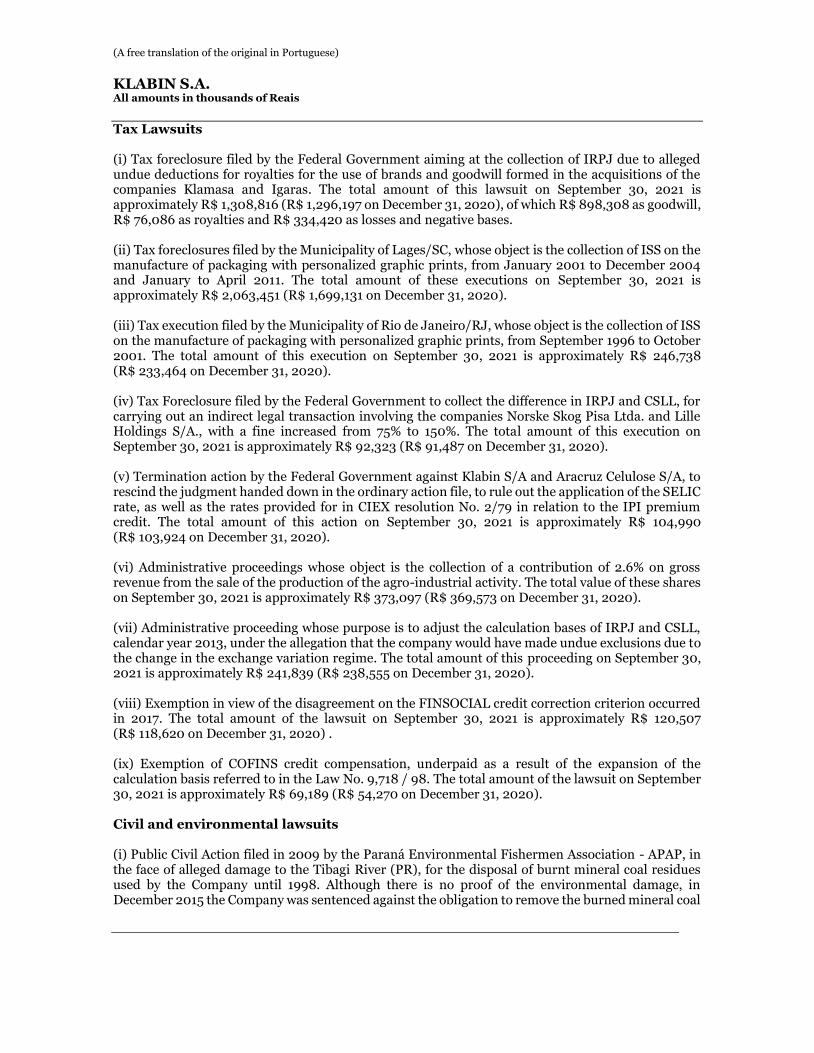
(A free translation of the original in Portuguese)
KLABIN S.A.
All amounts in thousands of Reais
Tax Lawsuits (i) Tax foreclosure filed by the Federal Government aiming at the collection of IRPJ due to alleged undue deductions for royalties for the use of brands and goodwill formed in the acquisitions of the companies Klamasa and Igaras. The total amount of this lawsuit on September 30, 2021 is approximately R$ 1,308,816 (R$ 1,296,197 on December 31, 2020), of which R$ 898,308 as goodwill, R$ 76,086 as royalties and R$ 334,420 as losses and negative bases. (ii) Tax foreclosures filed by the Municipality of Lages/SC, whose object is the collection of ISS on the manufacture of packaging with personalized graphic prints, from January 2001 to December 2004 and January to April 2011. The total amount of these executions on September 30, 2021 is approximately R$ 2,063,451 (R$ 1,699,131 on December 31, 2020). (iii) Tax execution filed by the Municipality of Rio de Janeiro/RJ, whose object is the collection of ISS on the manufacture of packaging with personalized graphic prints, from September 1996 to October 2001. The total amount of this execution on September 30, 2021 is approximately R$ 246,738 (R$ 233,464 on December 31, 2020). (iv) Tax Foreclosure filed by the Federal Government to collect the difference in IRPJ and CSLL, for carrying out an indirect legal transaction involving the companies Norske Skog Pisa Ltda. and Lille Holdings S/A., with a fine increased from 75% to 150%. The total amount of this execution on September 30, 2021 is approximately R$ 92,323 (R$ 91,487 on December 31, 2020). (v) Termination action by the Federal Government against Klabin S/A and Aracruz Celulose S/A, to rescind the judgment handed down in the ordinary action file, to rule out the application of the SELIC rate, as well as the rates provided for in CIEX resolution No. 2/79 in relation to the IPI premium credit. The total amount of this action on September 30, 2021 is approximately R$ 104,990 (R$ 103,924 on December 31, 2020). (vi) Administrative proceedings whose object is the collection of a contribution of 2.6% on gross revenue from the sale of the production of the agro-industrial activity. The total value of these shares on September 30, 2021 is approximately R$ 373,097 (R$ 369,573 on December 31, 2020). (vii) Administrative proceeding whose purpose is to adjust the calculation bases of IRPJ and CSLL, calendar year 2013, under the allegation that the company would have made undue exclusions due to the change in the exchange variation regime. The total amount of this proceeding on September 30, 2021 is approximately R$ 241,839 (R$ 238,555 on December 31, 2020). (viii) Exemption in view of the disagreement on the FINSOCIAL credit correction criterion occurred in 2017. The total amount of the lawsuit on September 30, 2021 is approximately R$ 120,507 (R$ 118,620 on December 31, 2020) . (ix) Exemption of COFINS credit compensation, underpaid as a result of the expansion of the calculation basis referred to in the Law No. 9,718 / 98. The total amount of the lawsuit on September 30, 2021 is approximately R$ 69,189 (R$ 54,270 on December 31, 2020). Civil and environmental lawsuits (i) Public Civil Action filed in 2009 by the Paraná Environmental Fishermen Association - APAP, in the face of alleged damage to the Tibagi River (PR), for the disposal of burnt mineral coal residues used by the Company until 1998. Although there is no proof of the environmental damage, in December 2015 the Company was sentenced against the obligation to remove the burned mineral coal
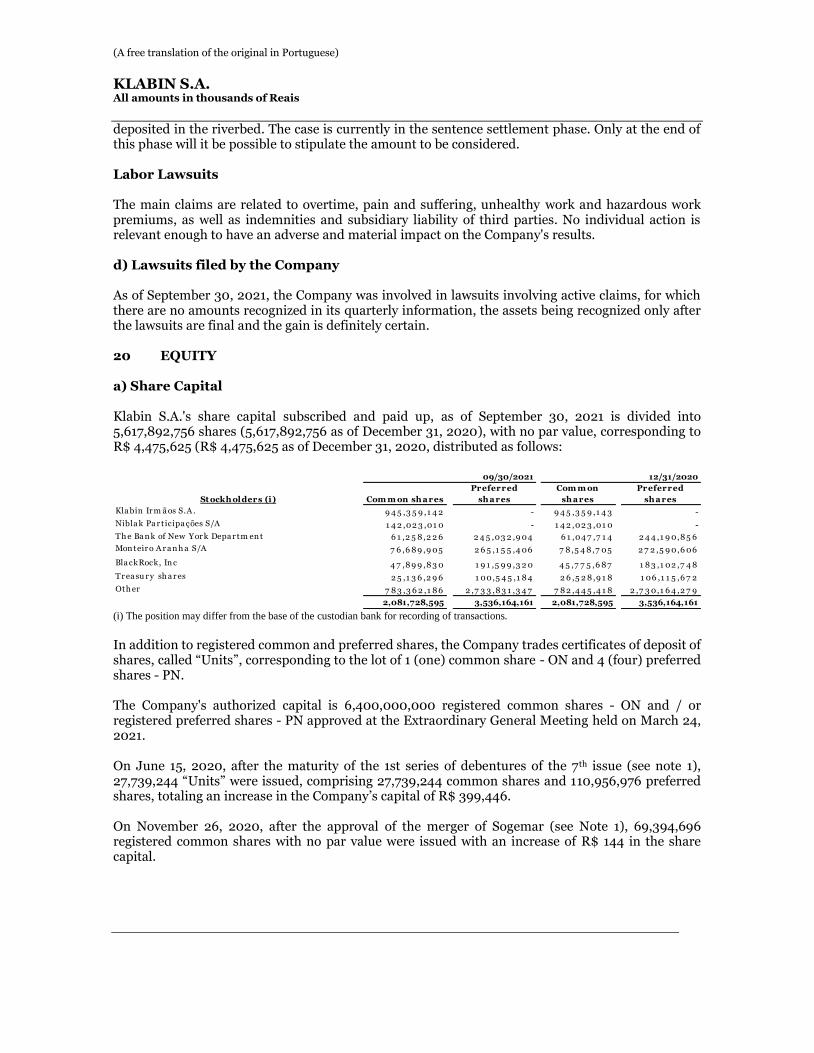
(A free translation of the original in Portuguese)
KLABIN S.A.
All amounts in thousands of Reais
deposited in the riverbed. The case is currently in the sentence settlement phase. Only at the end of this phase will it be possible to stipulate the amount to be considered. Labor Lawsuits The main claims are related to overtime, pain and suffering, unhealthy work and hazardous work premiums, as well as indemnities and subsidiary liability of third parties. No individual action is relevant enough to have an adverse and material impact on the Company's results. d) Lawsuits filed by the Company As of September 30, 2021, the Company was involved in lawsuits involving active claims, for which there are no amounts recognized in its quarterly information, the assets being recognized only after the lawsuits are final and the gain is definitely certain. 20 EQUITY
a) Share Capital Klabin S.A.'s share capital subscribed and paid up, as of September 30, 2021 is divided into 5,617,892,756 shares (5,617,892,756 as of December 31, 2020), with no par value, corresponding to R$ 4,475,625 (R$ 4,475,625 as of December 31, 2020, distributed as follows:
(i) The position may differ from the base of the custodian bank for recording of transactions.
In addition to registered common and preferred shares, the Company trades certificates of deposit of shares, called “Units”, corresponding to the lot of 1 (one) common share - ON and 4 (four) preferred shares - PN. The Company's authorized capital is 6,400,000,000 registered common shares - ON and / or registered preferred shares - PN approved at the Extraordinary General Meeting held on March 24, 2021. On June 15, 2020, after the maturity of the 1st series of debentures of the 7th issue (see note 1), 27,739,244 “Units” were issued, comprising 27,739,244 common shares and 110,956,976 preferred shares, totaling an increase in the Company’s capital of R$ 399,446. On November 26, 2020, after the approval of the merger of Sogemar (see Note 1), 69,394,696 registered common shares with no par value were issued with an increase of R$ 144 in the share capital.
09/30/2021 12/31/2020
St ockh olders (i) Com m on sh ares
Preferred
sh ares
Com m on
sh ares
Preferred
sh ares
Kla bin Ir m ã os S.A . 9 4 5 ,3 5 9 ,1 4 2 - 9 4 5 ,3 5 9 ,1 4 3 -
Nibla k Pa r t icipa ções S/A 1 4 2 ,02 3 ,01 0 - 1 4 2 ,02 3 ,01 0 -
Th e Ba n k of New Yor k Depa r tm en t 6 1 ,2 5 8 ,2 2 6 2 4 5 ,03 2 ,9 04 6 1 ,04 7 ,7 1 4 2 4 4 ,1 9 0,8 5 6
Mon teir o A r a n h a S/A 7 6 ,6 8 9 ,9 05 2 6 5 ,1 5 5 ,4 06 7 8 ,5 4 8 ,7 05 2 7 2 ,5 9 0,6 06
Bla ckRock, In c 4 7 ,8 9 9 ,8 3 0 1 9 1 ,5 9 9 ,3 2 0 4 5 ,7 7 5 ,6 8 7 1 8 3 ,1 02 ,7 4 8
Tr ea su r y sh a r es 2 5 ,1 3 6 ,2 9 6 1 00,5 4 5 ,1 8 4 2 6 ,5 2 8 ,9 1 8 1 06 ,1 1 5 ,6 7 2
Oth er 7 8 3 ,3 6 2 ,1 8 6 2 ,7 3 3 ,8 3 1 ,3 4 7 7 8 2 ,4 4 5 ,4 1 8 2 ,7 3 0,1 6 4 ,2 7 9
2,081,728,595 3,536,164,161 2,081,728,595 3,536,164,161
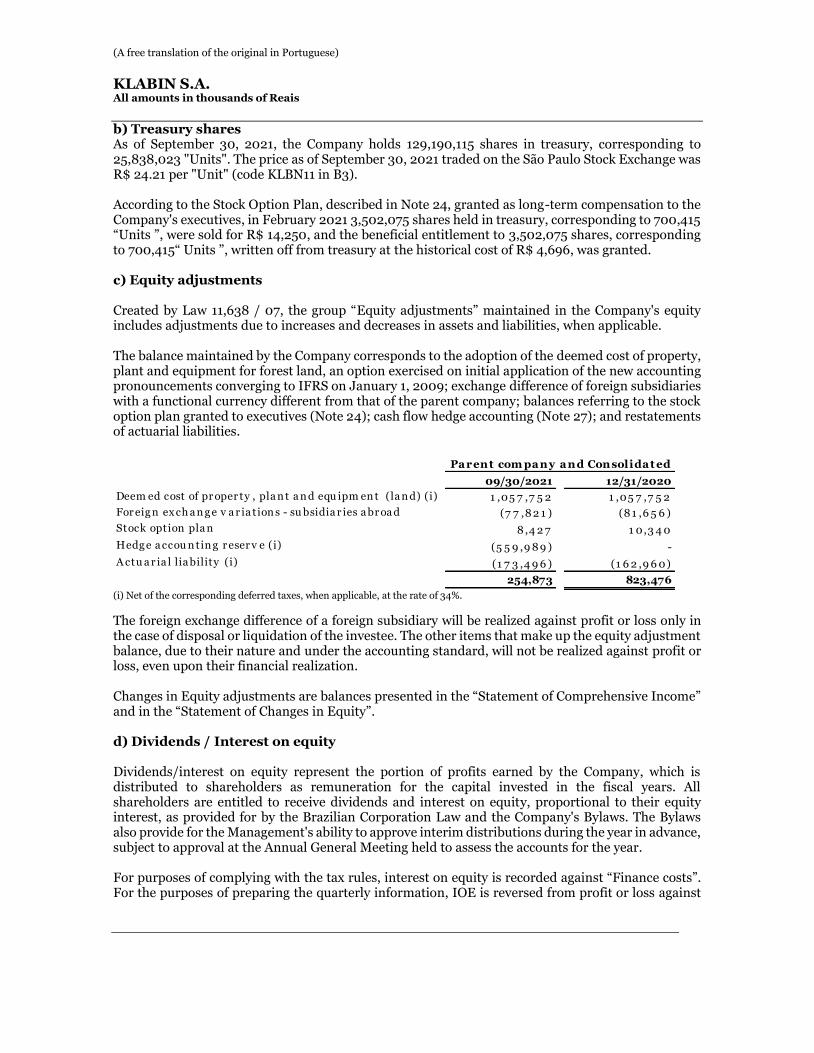
(A free translation of the original in Portuguese)
KLABIN S.A.
All amounts in thousands of Reais
b) Treasury shares As of September 30, 2021, the Company holds 129,190,115 shares in treasury, corresponding to 25,838,023 "Units". The price as of September 30, 2021 traded on the São Paulo Stock Exchange was R$ 24.21 per "Unit" (code KLBN11 in B3). According to the Stock Option Plan, described in Note 24, granted as long-term compensation to the Company's executives, in February 2021 3,502,075 shares held in treasury, corresponding to 700,415 “Units ”, were sold for R$ 14,250, and the beneficial entitlement to 3,502,075 shares, corresponding to 700,415“ Units ”, written off from treasury at the historical cost of R$ 4,696, was granted. c) Equity adjustments Created by Law 11,638 / 07, the group “Equity adjustments” maintained in the Company's equity includes adjustments due to increases and decreases in assets and liabilities, when applicable. The balance maintained by the Company corresponds to the adoption of the deemed cost of property, plant and equipment for forest land, an option exercised on initial application of the new accounting pronouncements converging to IFRS on January 1, 2009; exchange difference of foreign subsidiaries with a functional currency different from that of the parent company; balances referring to the stock option plan granted to executives (Note 24); cash flow hedge accounting (Note 27); and restatements of actuarial liabilities.
(i) Net of the corresponding deferred taxes, when applicable, at the rate of 34%.
The foreign exchange difference of a foreign subsidiary will be realized against profit or loss only in the case of disposal or liquidation of the investee. The other items that make up the equity adjustment balance, due to their nature and under the accounting standard, will not be realized against profit or loss, even upon their financial realization. Changes in Equity adjustments are balances presented in the “Statement of Comprehensive Income” and in the “Statement of Changes in Equity”. d) Dividends / Interest on equity Dividends/interest on equity represent the portion of profits earned by the Company, which is distributed to shareholders as remuneration for the capital invested in the fiscal years. All shareholders are entitled to receive dividends and interest on equity, proportional to their equity interest, as provided for by the Brazilian Corporation Law and the Company's Bylaws. The Bylaws also provide for the Management's ability to approve interim distributions during the year in advance, subject to approval at the Annual General Meeting held to assess the accounts for the year. For purposes of complying with the tax rules, interest on equity is recorded against “Finance costs”. For the purposes of preparing the quarterly information, IOE is reversed from profit or loss against
09/30/2021 12/31/2020
Deem ed cost of pr oper ty , pla n t a n d equ ipm en t (la n d) (i) 1 ,05 7 ,7 5 2 1 ,05 7 ,7 5 2
For eig n ex ch a n g e v a r ia t ion s - su bsidia r ies a br oa d (7 7 ,8 2 1 ) (8 1 ,6 5 6 )
Stock option pla n 8 ,4 2 7 1 0,3 4 0
Hedg e a ccou n tin g r eser v e (i) (5 5 9 ,9 8 9 ) -
A ctu a r ia l lia bility (i) (1 7 3 ,4 9 6 ) (1 6 2 ,9 6 0)
254,873 823,476
Parent com pany and Consolidat ed
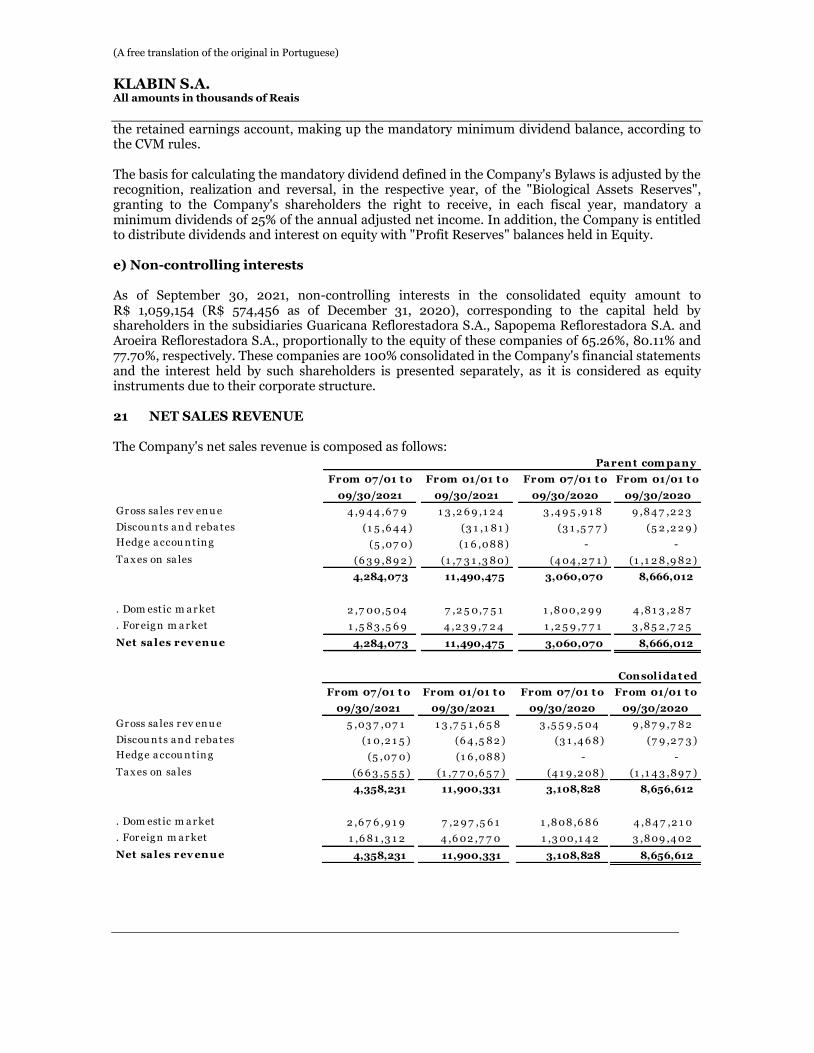
(A free translation of the original in Portuguese)
KLABIN S.A.
All amounts in thousands of Reais
the retained earnings account, making up the mandatory minimum dividend balance, according to the CVM rules. The basis for calculating the mandatory dividend defined in the Company's Bylaws is adjusted by the recognition, realization and reversal, in the respective year, of the "Biological Assets Reserves", granting to the Company's shareholders the right to receive, in each fiscal year, mandatory a minimum dividends of 25% of the annual adjusted net income. In addition, the Company is entitled to distribute dividends and interest on equity with "Profit Reserves" balances held in Equity. e) Non-controlling interests As of September 30, 2021, non-controlling interests in the consolidated equity amount to R$ 1,059,154 (R$ 574,456 as of December 31, 2020), corresponding to the capital held by shareholders in the subsidiaries Guaricana Reflorestadora S.A., Sapopema Reflorestadora S.A. and Aroeira Reflorestadora S.A., proportionally to the equity of these companies of 65.26%, 80.11% and 77.70%, respectively. These companies are 100% consolidated in the Company's financial statements and the interest held by such shareholders is presented separately, as it is considered as equity instruments due to their corporate structure. 21 NET SALES REVENUE
The Company's net sales revenue is composed as follows:
From 07/01 t o From 01/01 t o From 07/01 t o From 01/01 t o
09/30/2021 09/30/2021 09/30/2020 09/30/2020
Gr oss sa les r ev en u e 4 ,9 4 4 ,6 7 9 1 3 ,2 6 9 ,1 2 4 3 ,4 9 5 ,9 1 8 9 ,8 4 7 ,2 2 3
Discou n ts a n d r eba tes (1 5 ,6 4 4 ) (3 1 ,1 8 1 ) (3 1 ,5 7 7 ) (5 2 ,2 2 9 )
Hedg e a ccou n tin g (5 ,07 0) (1 6 ,08 8 ) - -
Ta x es on sa les (6 3 9 ,8 9 2 ) (1 ,7 3 1 ,3 8 0) (4 04 ,2 7 1 ) (1 ,1 2 8 ,9 8 2 )
4,284,073 11,490,475 3,060,070 8,666,012
. Dom estic m a r ket 2 ,7 00,5 04 7 ,2 5 0,7 5 1 1 ,8 00,2 9 9 4 ,8 1 3 ,2 8 7
. For eig n m a r ket 1 ,5 8 3 ,5 6 9 4 ,2 3 9 ,7 2 4 1 ,2 5 9 ,7 7 1 3 ,8 5 2 ,7 2 5
Net sales rev enu e 4,284,073 11,490,475 3,060,070 8,666,012
Parent com pany
From 07/01 t o From 01/01 t o From 07/01 t o From 01/01 t o
09/30/2021 09/30/2021 09/30/2020 09/30/2020
Gr oss sa les r ev en u e 5 ,03 7 ,07 1 1 3 ,7 5 1 ,6 5 8 3 ,5 5 9 ,5 04 9 ,8 7 9 ,7 8 2
Discou n ts a n d r eba tes (1 0,2 1 5 ) (6 4 ,5 8 2 ) (3 1 ,4 6 8 ) (7 9 ,2 7 3 )
Hedg e a ccou n tin g (5 ,07 0) (1 6 ,08 8 ) - -
Ta x es on sa les (6 6 3 ,5 5 5 ) (1 ,7 7 0,6 5 7 ) (4 1 9 ,2 08 ) (1 ,1 4 3 ,8 9 7 )
4,358,231 11,900,331 3,108,828 8,656,612
. Dom estic m a r ket 2 ,6 7 6 ,9 1 9 7 ,2 9 7 ,5 6 1 1 ,8 08 ,6 8 6 4 ,8 4 7 ,2 1 0
. For eig n m a r ket 1 ,6 8 1 ,3 1 2 4 ,6 02 ,7 7 0 1 ,3 00,1 4 2 3 ,8 09 ,4 02
Net sales rev enu e 4,358,231 11,900,331 3,108,828 8,656,612
Consolidat ed
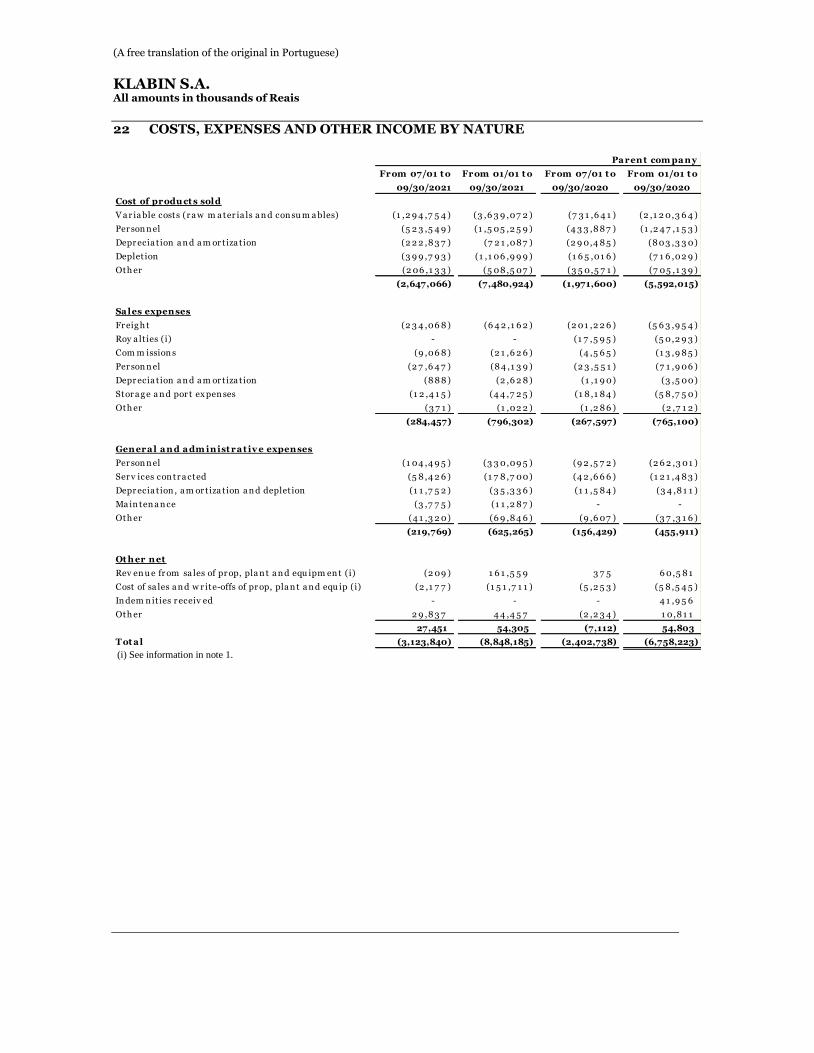
(A free translation of the original in Portuguese)
KLABIN S.A.
All amounts in thousands of Reais
22 COSTS, EXPENSES AND OTHER INCOME BY NATURE
(i) See information in note 1.
From 07/01 t o From 01/01 t o From 07/01 t o From 01/01 t o
09/30/2021 09/30/2021 09/30/2020 09/30/2020
Cost of produ ct s sold
V a r ia ble costs (r a w m a ter ia ls a n d con su m a bles) (1 ,2 9 4 ,7 5 4 ) (3 ,6 3 9 ,07 2 ) (7 3 1 ,6 4 1 ) (2 ,1 2 0,3 6 4 )
Per son n el (5 2 3 ,5 4 9 ) (1 ,5 05 ,2 5 9 ) (4 3 3 ,8 8 7 ) (1 ,2 4 7 ,1 5 3 )
Depr ecia t ion a n d a m or tiza t ion (2 2 2 ,8 3 7 ) (7 2 1 ,08 7 ) (2 9 0,4 8 5 ) (8 03 ,3 3 0)
Deplet ion (3 9 9 ,7 9 3 ) (1 ,1 06 ,9 9 9 ) (1 6 5 ,01 6 ) (7 1 6 ,02 9 )
Oth er (2 06 ,1 3 3 ) (5 08 ,5 07 ) (3 5 0,5 7 1 ) (7 05 ,1 3 9 )
(2,647,066) (7,480,924) (1,971,600) (5,592,015)
Sa les expenses
Fr eig h t (2 3 4 ,06 8 ) (6 4 2 ,1 6 2 ) (2 01 ,2 2 6 ) (5 6 3 ,9 5 4 )
Roy a lt ies (i) - - (1 7 ,5 9 5 ) (5 0,2 9 3 )
Com m ission s (9 ,06 8 ) (2 1 ,6 2 6 ) (4 ,5 6 5 ) (1 3 ,9 8 5 )
Per son n el (2 7 ,6 4 7 ) (8 4 ,1 3 9 ) (2 3 ,5 5 1 ) (7 1 ,9 06 )
Depr ecia t ion a n d a m or tiza t ion (8 8 8 ) (2 ,6 2 8 ) (1 ,1 9 0) (3 ,5 00)
Stor a g e a n d por t ex pen ses (1 2 ,4 1 5 ) (4 4 ,7 2 5 ) (1 8 ,1 8 4 ) (5 8 ,7 5 0)
Oth er (3 7 1 ) (1 ,02 2 ) (1 ,2 8 6 ) (2 ,7 1 2 )
(284,457) (796,302) (267,597) (765,100)
Genera l a nd a dm inist ra t iv e expenses
Per son n el (1 04 ,4 9 5 ) (3 3 0,09 5 ) (9 2 ,5 7 2 ) (2 6 2 ,3 01 )
Ser v ices con tr a cted (5 8 ,4 2 6 ) (1 7 8 ,7 00) (4 2 ,6 6 6 ) (1 2 1 ,4 8 3 )
Depr ecia t ion , a m or tiza t ion a n d deplet ion (1 1 ,7 5 2 ) (3 5 ,3 3 6 ) (1 1 ,5 8 4 ) (3 4 ,8 1 1 )
Ma in ten a n ce (3 ,7 7 5 ) (1 1 ,2 8 7 ) - -
Oth er (4 1 ,3 2 0) (6 9 ,8 4 6 ) (9 ,6 07 ) (3 7 ,3 1 6 )
(219,769) (625,265) (156,429) (455,911)
Ot h er net
Rev en u e fr om sa les of pr op, pla n t a n d equ ipm en t (i) (2 09 ) 1 6 1 ,5 5 9 3 7 5 6 0,5 8 1
Cost of sa les a n d w r ite-offs of pr op, pla n t a n d equ ip (i) (2 ,1 7 7 ) (1 5 1 ,7 1 1 ) (5 ,2 5 3 ) (5 8 ,5 4 5 )
In dem n it ies r eceiv ed - - - 4 1 ,9 5 6
Oth er 2 9 ,8 3 7 4 4 ,4 5 7 (2 ,2 3 4 ) 1 0,8 1 1
27,451 54,305 (7,112) 54,803
T ot a l (3,123,840) (8,848,185) (2,402,738) (6,758,223)
Pa rent com pa ny
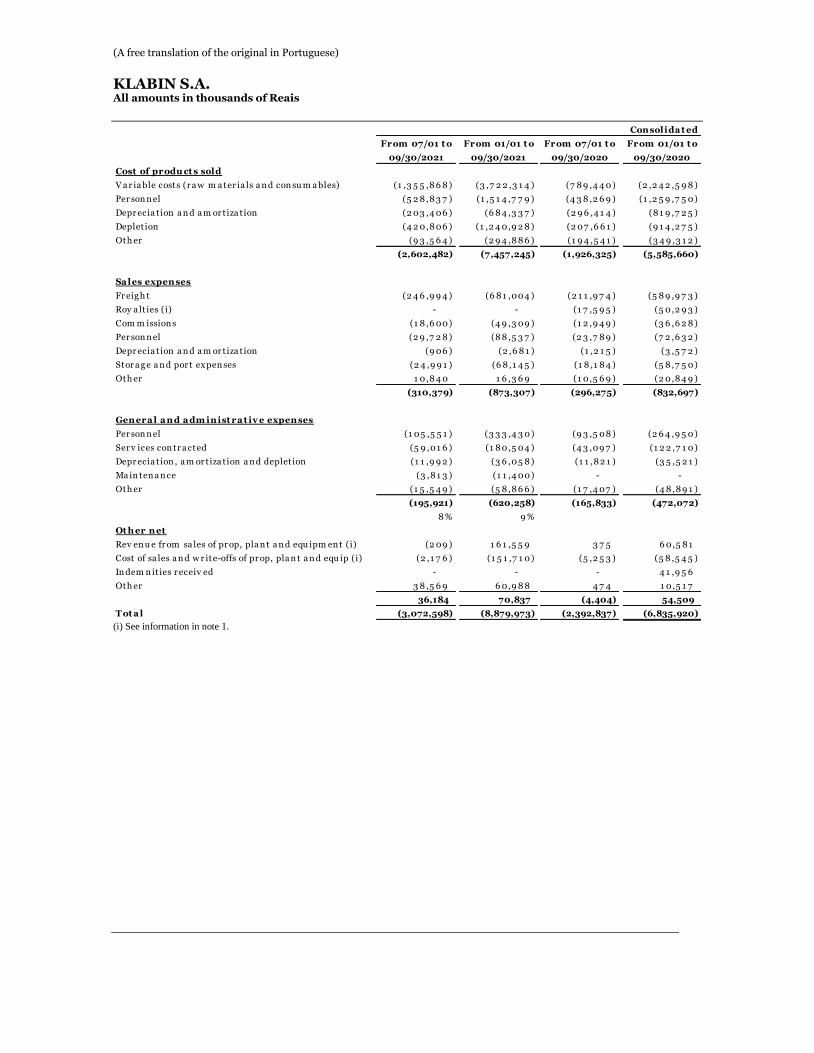
(A free translation of the original in Portuguese)
KLABIN S.A.
All amounts in thousands of Reais
(i) See information in note 1.
From 07/01 t o From 01/01 t o From 07/01 t o From 01/01 t o
09/30/2021 09/30/2021 09/30/2020 09/30/2020
Cost of produ ct s sold
V a r ia ble costs (r a w m a ter ia ls a n d con su m a bles) (1 ,3 5 5 ,8 6 8 ) (3 ,7 2 2 ,3 1 4 ) (7 8 9 ,4 4 0) (2 ,2 4 2 ,5 9 8 )
Per son n el (5 2 8 ,8 3 7 ) (1 ,5 1 4 ,7 7 9 ) (4 3 8 ,2 6 9 ) (1 ,2 5 9 ,7 5 0)
Depr ecia t ion a n d a m or tiza t ion (2 03 ,4 06 ) (6 8 4 ,3 3 7 ) (2 9 6 ,4 1 4 ) (8 1 9 ,7 2 5 )
Deplet ion (4 2 0,8 06 ) (1 ,2 4 0,9 2 8 ) (2 07 ,6 6 1 ) (9 1 4 ,2 7 5 )
Oth er (9 3 ,5 6 4 ) (2 9 4 ,8 8 6 ) (1 9 4 ,5 4 1 ) (3 4 9 ,3 1 2 )
(2,602,482) (7,457,245) (1,926,325) (5,585,660)
Sa les expenses
Fr eig h t (2 4 6 ,9 9 4 ) (6 8 1 ,004 ) (2 1 1 ,9 7 4 ) (5 8 9 ,9 7 3 )
Roy a lt ies (i) - - (1 7 ,5 9 5 ) (5 0,2 9 3 )
Com m ission s (1 8 ,6 00) (4 9 ,3 09 ) (1 2 ,9 4 9 ) (3 6 ,6 2 8 )
Per son n el (2 9 ,7 2 8 ) (8 8 ,5 3 7 ) (2 3 ,7 8 9 ) (7 2 ,6 3 2 )
Depr ecia t ion a n d a m or tiza t ion (9 06 ) (2 ,6 8 1 ) (1 ,2 1 5 ) (3 ,5 7 2 )
Stor a g e a n d por t ex pen ses (2 4 ,9 9 1 ) (6 8 ,1 4 5 ) (1 8 ,1 8 4 ) (5 8 ,7 5 0)
Oth er 1 0,8 4 0 1 6 ,3 6 9 (1 0,5 6 9 ) (2 0,8 4 9 )
(310,379) (873,307) (296,275) (832,697)
Genera l a nd a dm inist ra t iv e expenses
Per son n el (1 05 ,5 5 1 ) (3 3 3 ,4 3 0) (9 3 ,5 08 ) (2 6 4 ,9 5 0)
Ser v ices con tr a cted (5 9 ,01 6 ) (1 8 0,5 04 ) (4 3 ,09 7 ) (1 2 2 ,7 1 0)
Depr ecia t ion , a m or tiza t ion a n d deplet ion (1 1 ,9 9 2 ) (3 6 ,05 8 ) (1 1 ,8 2 1 ) (3 5 ,5 2 1 )
Ma in ten a n ce (3 ,8 1 3 ) (1 1 ,4 00) - -
Oth er (1 5 ,5 4 9 ) (5 8 ,8 6 6 ) (1 7 ,4 07 ) (4 8 ,8 9 1 )
(195,921) (620,258) (165,833) (472,072)
8 % 9 %
Ot h er net
Rev en u e fr om sa les of pr op, pla n t a n d equ ipm en t (i) (2 09 ) 1 6 1 ,5 5 9 3 7 5 6 0,5 8 1
Cost of sa les a n d w r ite-offs of pr op, pla n t a n d equ ip (i) (2 ,1 7 6 ) (1 5 1 ,7 1 0) (5 ,2 5 3 ) (5 8 ,5 4 5 )
In dem n it ies r eceiv ed - - - 4 1 ,9 5 6
Oth er 3 8 ,5 6 9 6 0,9 8 8 4 7 4 1 0,5 1 7
36,184 70,837 (4,404) 54,509
T ot a l (3,072,598) (8,879,973) (2,392,837) (6,835,920)
Consolida t ed
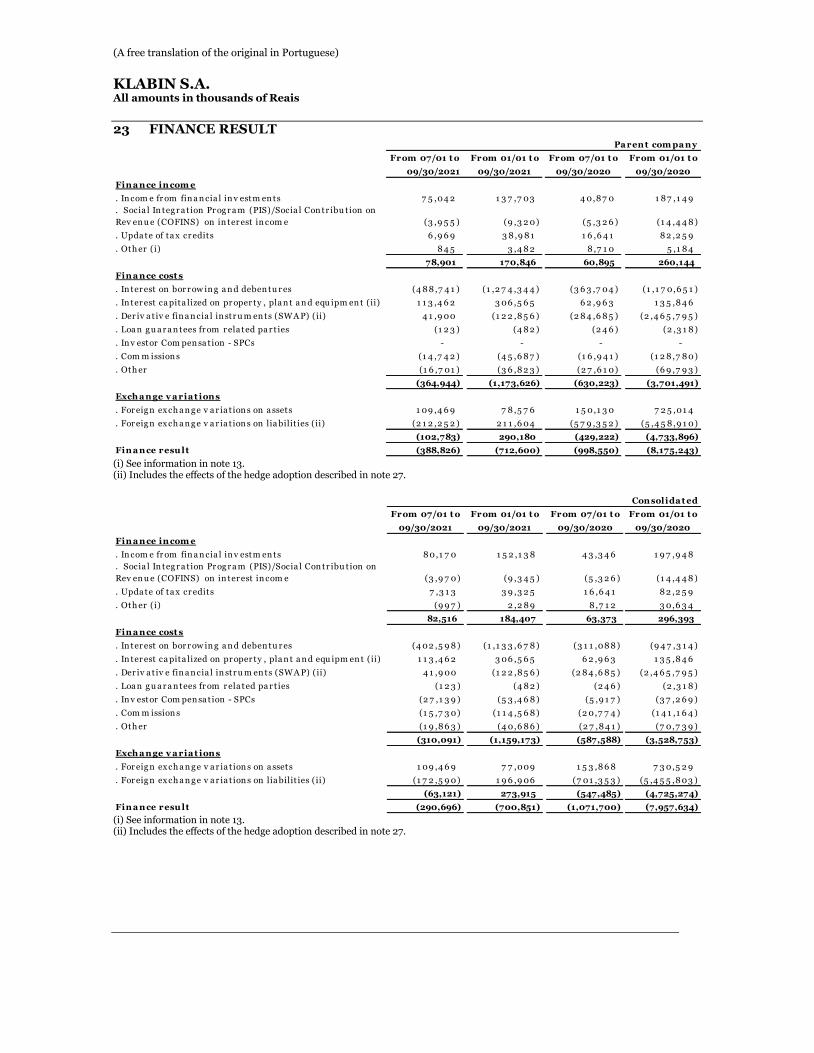
(A free translation of the original in Portuguese)
KLABIN S.A.
All amounts in thousands of Reais
23 FINANCE RESULT
(i) See information in note 13. (ii) Includes the effects of the hedge adoption described in note 27.
(i) See information in note 13. (ii) Includes the effects of the hedge adoption described in note 27.
From 07/01 t o From 01/01 t o From 07/01 t o From 01/01 t o
09/30/2021 09/30/2021 09/30/2020 09/30/2020
Fina nce incom e
. In com e fr om fin a n cia l in v estm en ts 7 5 ,04 2 1 3 7 ,7 03 4 0,8 7 0 1 8 7 ,1 4 9
. Socia l In teg r a t ion Pr og r a m (PIS)/Socia l Con tr ibu tion on
Rev en u e (COFINS) on in ter est in com e (3 ,9 5 5 ) (9 ,3 2 0) (5 ,3 2 6 ) (1 4 ,4 4 8 )
. Upda te of ta x cr edits 6 ,9 6 9 3 8 ,9 8 1 1 6 ,6 4 1 8 2 ,2 5 9
. Oth er (i) 8 4 5 3 ,4 8 2 8 ,7 1 0 5 ,1 8 4
78,901 170,846 60,895 260,144
Fina nce cost s
. In ter est on bor r ow in g a n d deben tu r es (4 8 8 ,7 4 1 ) (1 ,2 7 4 ,3 4 4 ) (3 6 3 ,7 04 ) (1 ,1 7 0,6 5 1 )
. In ter est ca pita lized on pr oper ty , pla n t a n d equ ipm en t (ii) 1 1 3 ,4 6 2 3 06 ,5 6 5 6 2 ,9 6 3 1 3 5 ,8 4 6
. Der iv a t iv e fin a n cia l in str u m en ts (SWA P) (ii) 4 1 ,9 00 (1 2 2 ,8 5 6 ) (2 8 4 ,6 8 5 ) (2 ,4 6 5 ,7 9 5 )
. Loa n g u a r a n tees fr om r ela ted pa r t ies (1 2 3 ) (4 8 2 ) (2 4 6 ) (2 ,3 1 8 )
. In v estor Com pen sa tion - SPCs - - - -
. Com m ission s (1 4 ,7 4 2 ) (4 5 ,6 8 7 ) (1 6 ,9 4 1 ) (1 2 8 ,7 8 0)
. Oth er (1 6 ,7 01 ) (3 6 ,8 2 3 ) (2 7 ,6 1 0) (6 9 ,7 9 3 )
(364,944) (1,173,626) (630,223) (3,701,491)
Exch a nge v a ria t ions
. For eig n ex ch a n g e v a r ia t ion s on a ssets 1 09 ,4 6 9 7 8 ,5 7 6 1 5 0,1 3 0 7 2 5 ,01 4
. For eig n ex ch a n g e v a r ia t ion s on lia bilit ies (ii) (2 1 2 ,2 5 2 ) 2 1 1 ,6 04 (5 7 9 ,3 5 2 ) (5 ,4 5 8 ,9 1 0)
(102,783) 290,180 (429,222) (4,733,896)
Fina nce resu lt (388,826) (712,600) (998,550) (8,175,243)
Pa rent com pa ny
From 07/01 t o From 01/01 t o From 07/01 t o From 01/01 t o
09/30/2021 09/30/2021 09/30/2020 09/30/2020
Fina nce incom e
. In com e fr om fin a n cia l in v estm en ts 8 0,1 7 0 1 5 2 ,1 3 8 4 3 ,3 4 6 1 9 7 ,9 4 8
. Socia l In teg r a t ion Pr og r a m (PIS)/Socia l Con tr ibu tion on
Rev en u e (COFINS) on in ter est in com e (3 ,9 7 0) (9 ,3 4 5 ) (5 ,3 2 6 ) (1 4 ,4 4 8 )
. Upda te of ta x cr edits 7 ,3 1 3 3 9 ,3 2 5 1 6 ,6 4 1 8 2 ,2 5 9
. Oth er (i) (9 9 7 ) 2 ,2 8 9 8 ,7 1 2 3 0,6 3 4
82,516 184,407 63,373 296,393
Fina nce cost s
. In ter est on bor r ow in g a n d deben tu r es (4 02 ,5 9 8 ) (1 ,1 3 3 ,6 7 8 ) (3 1 1 ,08 8 ) (9 4 7 ,3 1 4 )
. In ter est ca pita lized on pr oper ty , pla n t a n d equ ipm en t (ii) 1 1 3 ,4 6 2 3 06 ,5 6 5 6 2 ,9 6 3 1 3 5 ,8 4 6
. Der iv a t iv e fin a n cia l in str u m en ts (SWA P) (ii) 4 1 ,9 00 (1 2 2 ,8 5 6 ) (2 8 4 ,6 8 5 ) (2 ,4 6 5 ,7 9 5 )
. Loa n g u a r a n tees fr om r ela ted pa r t ies (1 2 3 ) (4 8 2 ) (2 4 6 ) (2 ,3 1 8 )
. In v estor Com pen sa tion - SPCs (2 7 ,1 3 9 ) (5 3 ,4 6 8 ) (5 ,9 1 7 ) (3 7 ,2 6 9 )
. Com m ission s (1 5 ,7 3 0) (1 1 4 ,5 6 8 ) (2 0,7 7 4 ) (1 4 1 ,1 6 4 )
. Oth er (1 9 ,8 6 3 ) (4 0,6 8 6 ) (2 7 ,8 4 1 ) (7 0,7 3 9 )
(310,091) (1,159,173) (587,588) (3,528,753)
Exch a nge v a ria t ions
. For eig n ex ch a n g e v a r ia t ion s on a ssets 1 09 ,4 6 9 7 7 ,009 1 5 3 ,8 6 8 7 3 0,5 2 9
. For eig n ex ch a n g e v a r ia t ion s on lia bilit ies (ii) (1 7 2 ,5 9 0) 1 9 6 ,9 06 (7 01 ,3 5 3 ) (5 ,4 5 5 ,8 03 )
(63,121) 273,915 (547,485) (4,725,274)
Fina nce resu lt (290,696) (700,851) (1,071,700) (7,957,634)
Consolida t ed
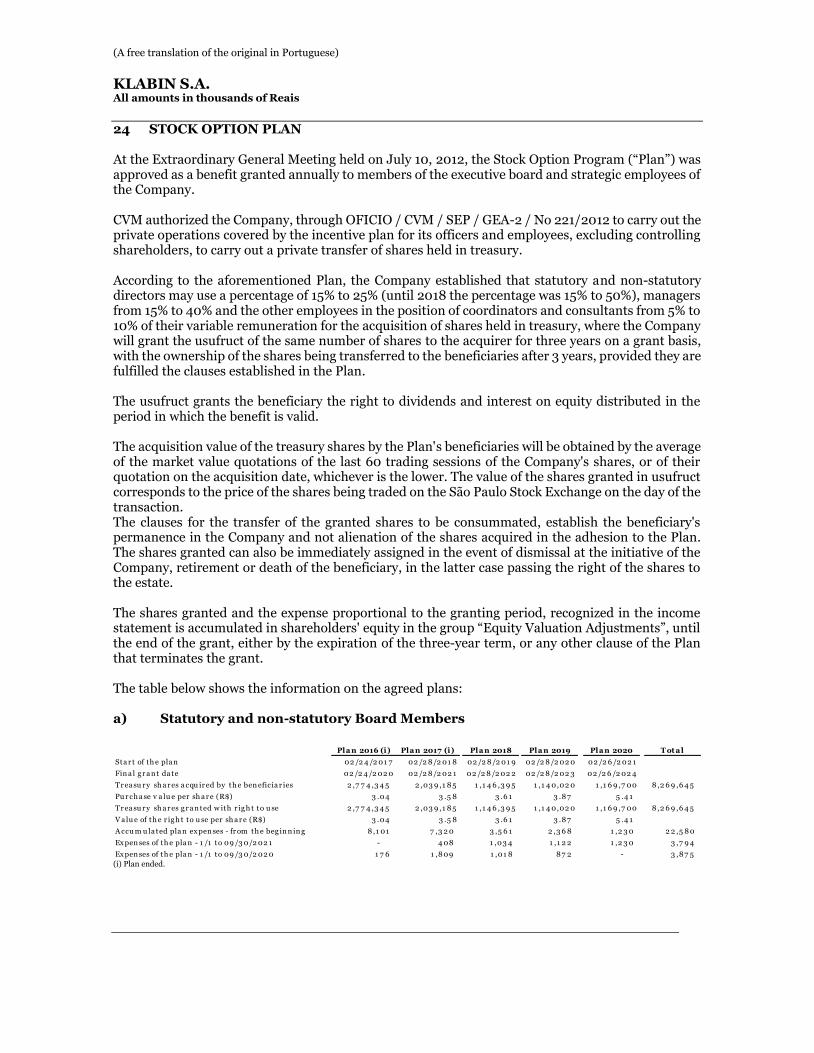
(A free translation of the original in Portuguese)
KLABIN S.A.
All amounts in thousands of Reais
24 STOCK OPTION PLAN
At the Extraordinary General Meeting held on July 10, 2012, the Stock Option Program (“Plan”) was approved as a benefit granted annually to members of the executive board and strategic employees of the Company. CVM authorized the Company, through OFICIO / CVM / SEP / GEA-2 / No 221/2012 to carry out the private operations covered by the incentive plan for its officers and employees, excluding controlling shareholders, to carry out a private transfer of shares held in treasury. According to the aforementioned Plan, the Company established that statutory and non-statutory directors may use a percentage of 15% to 25% (until 2018 the percentage was 15% to 50%), managers from 15% to 40% and the other employees in the position of coordinators and consultants from 5% to 10% of their variable remuneration for the acquisition of shares held in treasury, where the Company will grant the usufruct of the same number of shares to the acquirer for three years on a grant basis, with the ownership of the shares being transferred to the beneficiaries after 3 years, provided they are fulfilled the clauses established in the Plan. The usufruct grants the beneficiary the right to dividends and interest on equity distributed in the period in which the benefit is valid. The acquisition value of the treasury shares by the Plan's beneficiaries will be obtained by the average of the market value quotations of the last 60 trading sessions of the Company's shares, or of their quotation on the acquisition date, whichever is the lower. The value of the shares granted in usufruct corresponds to the price of the shares being traded on the São Paulo Stock Exchange on the day of the transaction. The clauses for the transfer of the granted shares to be consummated, establish the beneficiary's permanence in the Company and not alienation of the shares acquired in the adhesion to the Plan. The shares granted can also be immediately assigned in the event of dismissal at the initiative of the Company, retirement or death of the beneficiary, in the latter case passing the right of the shares to the estate. The shares granted and the expense proportional to the granting period, recognized in the income statement is accumulated in shareholders' equity in the group “Equity Valuation Adjustments”, until the end of the grant, either by the expiration of the three-year term, or any other clause of the Plan that terminates the grant. The table below shows the information on the agreed plans: a) Statutory and non-statutory Board Members
(i) Plan ended.
Plan 2016 (i) Plan 2017 (i) Plan 2018 Plan 2019 Plan 2020 T ot al
Sta r t of th e pla n 02 /2 4 /2 01 7 02 /2 8 /2 01 8 02 /2 8 /2 01 9 02 /2 8 /2 02 0 02 /2 6 /2 02 1
Fin a l g r a n t da te 02 /2 4 /2 02 0 02 /2 8 /2 02 1 02 /2 8 /2 02 2 02 /2 8 /2 02 3 02 /2 6 /2 02 4
Tr ea su r y sh a r es a cqu ir ed by th e ben eficia r ies 2 ,7 7 4 ,3 4 5 2 ,03 9 ,1 8 5 1 ,1 4 6 ,3 9 5 1 ,1 4 0,02 0 1 ,1 6 9 ,7 00 8 ,2 6 9 ,6 4 5
Pu r ch a se v a lu e per sh a r e (R$) 3 .04 3 .5 8 3 .6 1 3 .8 7 5 .4 1
Tr ea su r y sh a r es g r a n ted w ith r ig h t to u se 2 ,7 7 4 ,3 4 5 2 ,03 9 ,1 8 5 1 ,1 4 6 ,3 9 5 1 ,1 4 0,02 0 1 ,1 6 9 ,7 00 8 ,2 6 9 ,6 4 5
V a lu e of th e r ig h t to u se per sh a r e (R$) 3 .04 3 .5 8 3 .6 1 3 .8 7 5 .4 1
A ccu m u la ted pla n ex pen ses - fr om th e beg in n in g 8 ,1 01 7 ,3 2 0 3 ,5 6 1 2 ,3 6 8 1 ,2 3 0 2 2 ,5 8 0
Ex pen ses of th e pla n - 1 /1 to 09 /3 0/2 02 1 - 4 08 1 ,03 4 1 ,1 2 2 1 ,2 3 0 3 ,7 9 4
Ex pen ses of th e pla n - 1 /1 to 09 /3 0/2 02 0 1 7 6 1 ,8 09 1 ,01 8 8 7 2 - 3 ,8 7 5
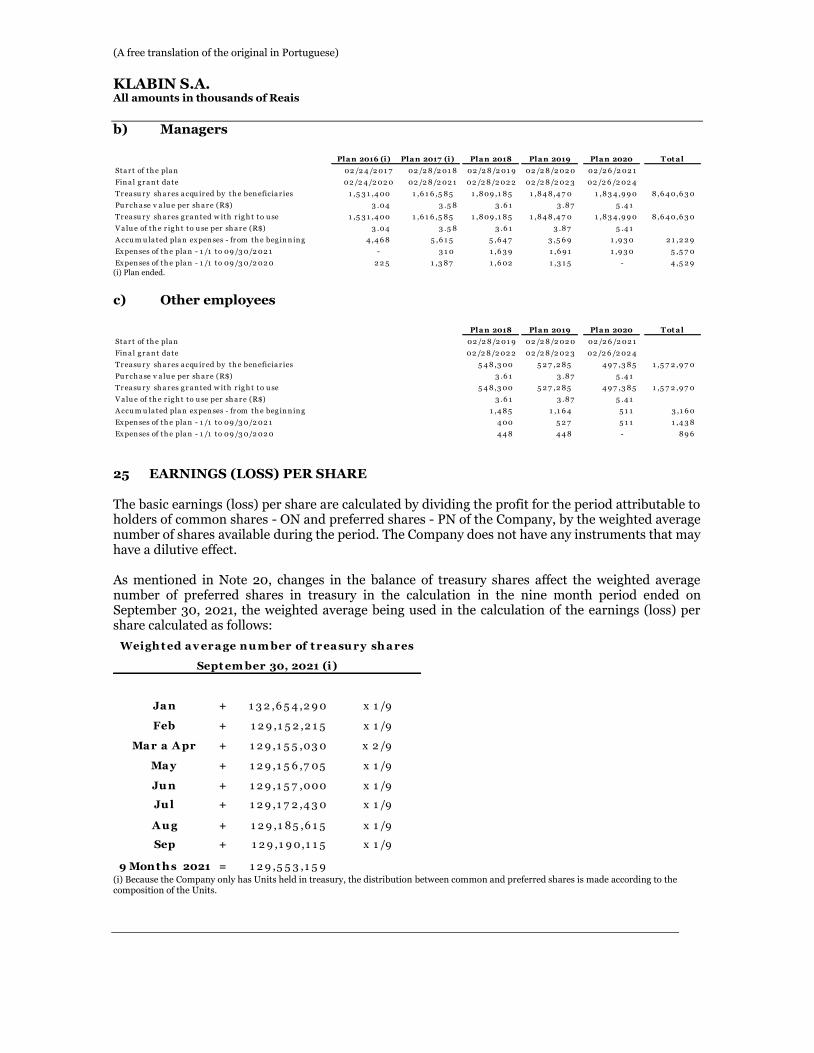
(A free translation of the original in Portuguese)
KLABIN S.A.
All amounts in thousands of Reais
b) Managers
(i) Plan ended.
c) Other employees
25 EARNINGS (LOSS) PER SHARE
The basic earnings (loss) per share are calculated by dividing the profit for the period attributable to holders of common shares - ON and preferred shares - PN of the Company, by the weighted average number of shares available during the period. The Company does not have any instruments that may have a dilutive effect. As mentioned in Note 20, changes in the balance of treasury shares affect the weighted average number of preferred shares in treasury in the calculation in the nine month period ended on September 30, 2021, the weighted average being used in the calculation of the earnings (loss) per share calculated as follows:
(i) Because the Company only has Units held in treasury, the distribution between common and preferred shares is made according to the composition of the Units.
Plan 2016 (i) Plan 2017 (i) Plan 2018 Plan 2019 Plan 2020 T ot al
Sta r t of th e pla n 02 /2 4 /2 01 7 02 /2 8 /2 01 8 02 /2 8 /2 01 9 02 /2 8 /2 02 0 02 /2 6 /2 02 1
Fin a l g r a n t da te 02 /2 4 /2 02 0 02 /2 8 /2 02 1 02 /2 8 /2 02 2 02 /2 8 /2 02 3 02 /2 6 /2 02 4
Tr ea su r y sh a r es a cqu ir ed by th e ben eficia r ies 1 ,5 3 1 ,4 00 1 ,6 1 6 ,5 8 5 1 ,8 09 ,1 8 5 1 ,8 4 8 ,4 7 0 1 ,8 3 4 ,9 9 0 8 ,6 4 0,6 3 0
Pu r ch a se v a lu e per sh a r e (R$) 3 .04 3 .5 8 3 .6 1 3 .8 7 5 .4 1
Tr ea su r y sh a r es g r a n ted w ith r ig h t to u se 1 ,5 3 1 ,4 00 1 ,6 1 6 ,5 8 5 1 ,8 09 ,1 8 5 1 ,8 4 8 ,4 7 0 1 ,8 3 4 ,9 9 0 8 ,6 4 0,6 3 0
V a lu e of th e r ig h t to u se per sh a r e (R$) 3 .04 3 .5 8 3 .6 1 3 .8 7 5 .4 1
A ccu m u la ted pla n ex pen ses - fr om th e beg in n in g 4 ,4 6 8 5 ,6 1 5 5 ,6 4 7 3 ,5 6 9 1 ,9 3 0 2 1 ,2 2 9
Ex pen ses of th e pla n - 1 /1 to 09 /3 0/2 02 1 - 3 1 0 1 ,6 3 9 1 ,6 9 1 1 ,9 3 0 5 ,5 7 0
Ex pen ses of th e pla n - 1 /1 to 09 /3 0/2 02 0 2 2 5 1 ,3 8 7 1 ,6 02 1 ,3 1 5 - 4 ,5 2 9
Plan 2018 Plan 2019 Plan 2020 T ot al
Sta r t of th e pla n 02 /2 8 /2 01 9 02 /2 8 /2 02 0 02 /2 6 /2 02 1
Fin a l g r a n t da te 02 /2 8 /2 02 2 02 /2 8 /2 02 3 02 /2 6 /2 02 4
Tr ea su r y sh a r es a cqu ir ed by th e ben eficia r ies 5 4 8 ,3 00 5 2 7 ,2 8 5 4 9 7 ,3 8 5 1 ,5 7 2 ,9 7 0
Pu r ch a se v a lu e per sh a r e (R$) 3 .6 1 3 .8 7 5 .4 1
Tr ea su r y sh a r es g r a n ted w ith r ig h t to u se 5 4 8 ,3 00 5 2 7 ,2 8 5 4 9 7 ,3 8 5 1 ,5 7 2 ,9 7 0
V a lu e of th e r ig h t to u se per sh a r e (R$) 3 .6 1 3 .8 7 5 .4 1
A ccu m u la ted pla n ex pen ses - fr om th e beg in n in g 1 ,4 8 5 1 ,1 6 4 5 1 1 3 ,1 6 0
Ex pen ses of th e pla n - 1 /1 to 09 /3 0/2 02 1 4 00 5 2 7 5 1 1 1 ,4 3 8
Ex pen ses of th e pla n - 1 /1 to 09 /3 0/2 02 0 4 4 8 4 4 8 - 8 9 6
Ja n + 1 3 2 ,6 5 4 ,2 9 0 x 1 /9
Feb + 1 2 9 ,1 5 2 ,2 1 5 x 1 /9
Ma r a A pr + 1 2 9 ,1 5 5 ,03 0 x 2 /9
Ma y + 1 2 9 ,1 5 6 ,7 05 x 1 /9
Ju n + 1 2 9 ,1 5 7 ,000 x 1 /9
Ju l + 1 2 9 ,1 7 2 ,4 3 0 x 1 /9
A u g + 1 2 9 ,1 8 5 ,6 1 5 x 1 /9
Sep + 1 2 9 ,1 9 0,1 1 5 x 1 /9
9 Mon t h s 2021 = 1 2 9 ,5 5 3 ,1 5 9
Weigh t ed a v era ge n u m ber of t rea su ry sh a res
Sept em ber 30, 2021 (i)
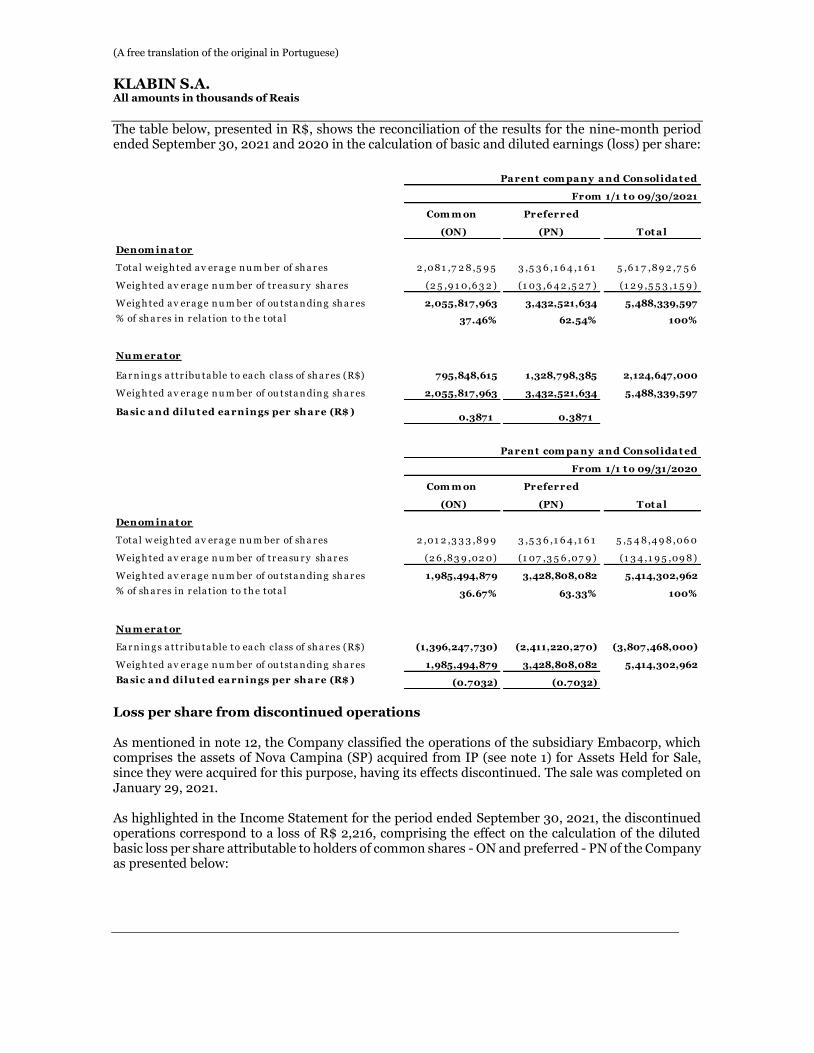
(A free translation of the original in Portuguese)
KLABIN S.A.
All amounts in thousands of Reais
The table below, presented in R$, shows the reconciliation of the results for the nine-month period ended September 30, 2021 and 2020 in the calculation of basic and diluted earnings (loss) per share:
Loss per share from discontinued operations As mentioned in note 12, the Company classified the operations of the subsidiary Embacorp, which comprises the assets of Nova Campina (SP) acquired from IP (see note 1) for Assets Held for Sale, since they were acquired for this purpose, having its effects discontinued. The sale was completed on January 29, 2021. As highlighted in the Income Statement for the period ended September 30, 2021, the discontinued operations correspond to a loss of R$ 2,216, comprising the effect on the calculation of the diluted basic loss per share attributable to holders of common shares - ON and preferred - PN of the Company as presented below:
Com m on Preferred
(ON) (PN)
Denom ina t or
Tota l w eig h ted a v er a g e n u m ber of sh a r es 2 ,08 1 ,7 2 8 ,5 9 5 3 ,5 3 6 ,1 6 4 ,1 6 1 5 ,6 1 7 ,8 9 2 ,7 5 6
Weig h ted a v er a g e n u m ber of tr ea su r y sh a r es (2 5 ,9 1 0,6 3 2 ) (1 03 ,6 4 2 ,5 2 7 ) (1 2 9 ,5 5 3 ,1 5 9 )
Weig h ted a v er a g e n u m ber of ou tsta n din g sh a r es 2,055,817,963 3,432,521,634 5,488,339,597
% of sh a r es in r ela t ion to th e tota l 37.46% 62.54% 100%
Nu m era t or
Ea r n in g s a ttr ibu ta ble to ea ch cla ss of sh a r es (R$) 795,848,615 1,328,798,385 2,124,647,000
Weig h ted a v er a g e n u m ber of ou tsta n din g sh a r es 2,055,817,963 3,432,521,634 5,488,339,597
Ba sic a nd dilu t ed ea rnings per sh a re (R$ )0.3871 0.3871
From 1/1 t o 09/30/2021
T ot a l
Pa rent com pa ny a nd Consolida t ed
Com m on Preferred
(ON) (PN)
Denom ina t or
Tota l w eig h ted a v er a g e n u m ber of sh a r es 2 ,01 2 ,3 3 3 ,8 9 9 3 ,5 3 6 ,1 6 4 ,1 6 1 5 ,5 4 8 ,4 9 8 ,06 0
Weig h ted a v er a g e n u m ber of tr ea su r y sh a r es (2 6 ,8 3 9 ,02 0) (1 07 ,3 5 6 ,07 9 ) (1 3 4 ,1 9 5 ,09 8 )
Weig h ted a v er a g e n u m ber of ou tsta n din g sh a r es 1,985,494,879 3,428,808,082 5,414,302,962
% of sh a r es in r ela t ion to th e tota l 36.67% 63.33% 100%
Nu m era t or
Ea r n in g s a ttr ibu ta ble to ea ch cla ss of sh a r es (R$) (1,396,247,730) (2,411,220,270) (3,807,468,000)
Weig h ted a v er a g e n u m ber of ou tsta n din g sh a r es 1,985,494,879 3,428,808,082 5,414,302,962
Ba sic a nd dilu t ed ea rnings per sh a re (R$ ) (0.7032) (0.7032)
From 1/1 t o 09/31/2020
Pa rent com pa ny a nd Consolida t ed
T ot a l
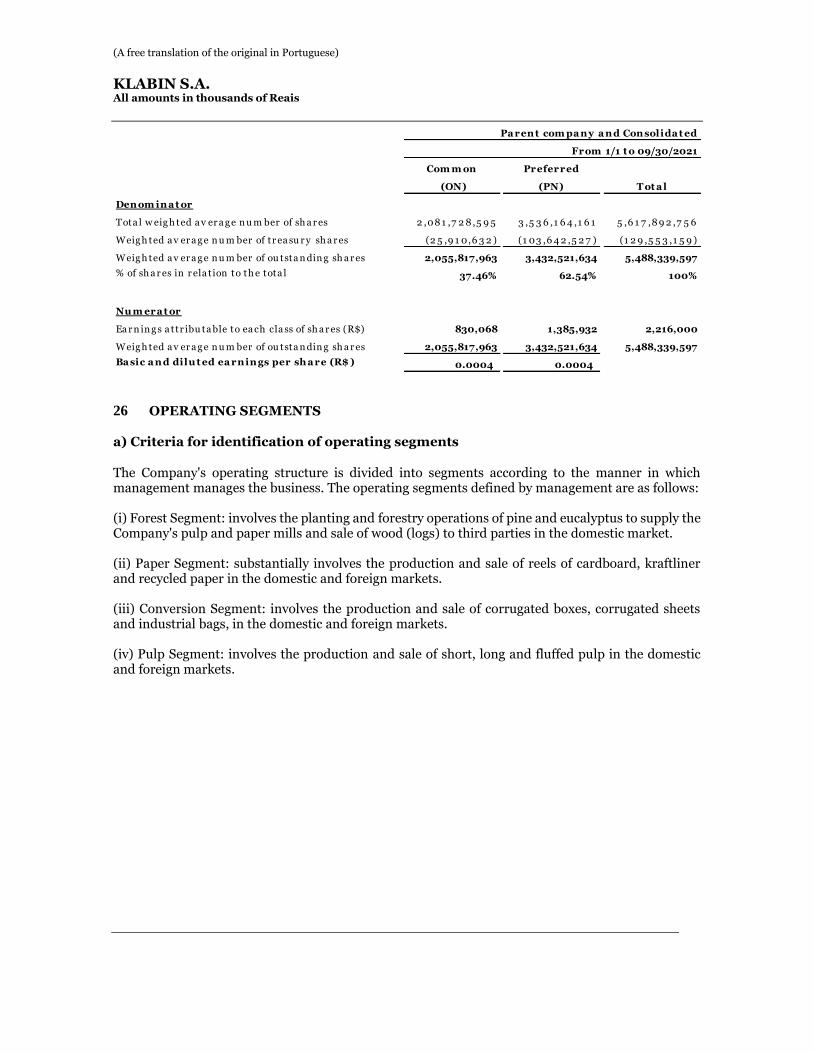
(A free translation of the original in Portuguese)
KLABIN S.A.
All amounts in thousands of Reais
26 OPERATING SEGMENTS
a) Criteria for identification of operating segments
The Company's operating structure is divided into segments according to the manner in which management manages the business. The operating segments defined by management are as follows: (i) Forest Segment: involves the planting and forestry operations of pine and eucalyptus to supply the Company's pulp and paper mills and sale of wood (logs) to third parties in the domestic market. (ii) Paper Segment: substantially involves the production and sale of reels of cardboard, kraftliner and recycled paper in the domestic and foreign markets. (iii) Conversion Segment: involves the production and sale of corrugated boxes, corrugated sheets and industrial bags, in the domestic and foreign markets. (iv) Pulp Segment: involves the production and sale of short, long and fluffed pulp in the domestic and foreign markets.
Com m on Preferred
(ON) (PN)
Denom ina t or
Tota l w eig h ted a v er a g e n u m ber of sh a r es 2 ,08 1 ,7 2 8 ,5 9 5 3 ,5 3 6 ,1 6 4 ,1 6 1 5 ,6 1 7 ,8 9 2 ,7 5 6
Weig h ted a v er a g e n u m ber of tr ea su r y sh a r es (2 5 ,9 1 0,6 3 2 ) (1 03 ,6 4 2 ,5 2 7 ) (1 2 9 ,5 5 3 ,1 5 9 )
Weig h ted a v er a g e n u m ber of ou tsta n din g sh a r es 2,055,817,963 3,432,521,634 5,488,339,597
% of sh a r es in r ela t ion to th e tota l 37.46% 62.54% 100%
Nu m era t or
Ea r n in g s a ttr ibu ta ble to ea ch cla ss of sh a r es (R$) 830,068 1,385,932 2,216,000
Weig h ted a v er a g e n u m ber of ou tsta n din g sh a r es 2,055,817,963 3,432,521,634 5,488,339,597
Ba sic a nd dilu t ed ea rnings per sh a re (R$ ) 0.0004 0.0004
Pa rent com pa ny a nd Consolida t ed
From 1/1 t o 09/30/2021
T ot a l
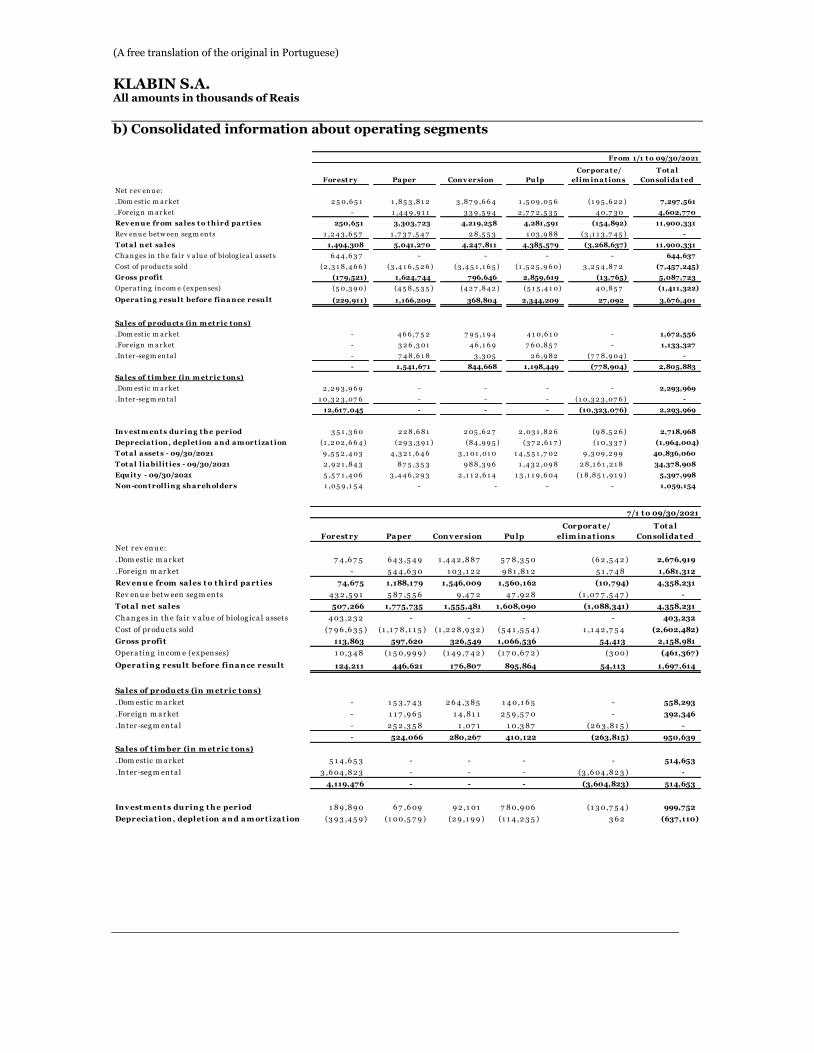
(A free translation of the original in Portuguese)
KLABIN S.A.
All amounts in thousands of Reais
b) Consolidated information about operating segments
Forest ry Pa per Conv ersion Pu lp
Net r ev en u e:
.Dom estic m a r ket 2 5 0,6 5 1 1 ,8 5 3 ,8 1 2 3 ,8 7 9 ,6 6 4 1 ,5 09 ,05 6 (1 9 5 ,6 2 2 ) 7,297,561
.For eig n m a r ket - 1 ,4 4 9 ,9 1 1 3 3 9 ,5 9 4 2 ,7 7 2 ,5 3 5 4 0,7 3 0 4,602,770
Rev enu e from sa les t o t h ird pa rt ies 250,651 3,303,723 4,219,258 4,281,591 (154,892) 11,900,331
Rev en u e betw een seg m en ts 1 ,2 4 3 ,6 5 7 1 ,7 3 7 ,5 4 7 2 8 ,5 5 3 1 03 ,9 8 8 (3 ,1 1 3 ,7 4 5 ) -
T ot a l net sa les 1,494,308 5,041,270 4,247,811 4,385,579 (3,268,637) 11,900,331
Ch a n g es in th e fa ir v a lu e of biolog ica l a ssets 6 4 4 ,6 3 7 - - - - 644,637
Cost of pr odu cts sold (2 ,3 1 8 ,4 6 6 ) (3 ,4 1 6 ,5 2 6 ) (3 ,4 5 1 ,1 6 5 ) (1 ,5 2 5 ,9 6 0) 3 ,2 5 4 ,8 7 2 (7,457,245)
Gross profit (179,521) 1,624,744 796,646 2,859,619 (13,765) 5,087,723
Oper a tin g in com e (ex pen ses) (5 0,3 9 0) (4 5 8 ,5 3 5 ) (4 2 7 ,8 4 2 ) (5 1 5 ,4 1 0) 4 0,8 5 7 (1,411,322)
Opera t ing resu lt before fina nce resu lt (229,911) 1,166,209 368,804 2,344,209 27,092 3,676,401
Sa les of produ ct s (in m et ric t ons)
.Dom estic m a r ket - 4 6 6 ,7 5 2 7 9 5 ,1 9 4 4 1 0,6 1 0 - 1,672,556
.For eig n m a r ket - 3 2 6 ,3 01 4 6 ,1 6 9 7 6 0,8 5 7 - 1,133,327
.In ter -seg m en ta l - 7 4 8 ,6 1 8 3 ,3 05 2 6 ,9 8 2 (7 7 8 ,9 04 ) -
- 1,541,671 844,668 1,198,449 (778,904) 2,805,883
Sa les of t im ber (in m et ric t ons)
.Dom estic m a r ket 2 ,2 9 3 ,9 6 9 - - - - 2,293,969
.In ter -seg m en ta l 1 0,3 2 3 ,07 6 - - - (1 0,3 2 3 ,07 6 ) -
12,617,045 - - - (10,323,076) 2,293,969
Inv est m ent s du ring t h e period 3 5 1 ,3 6 0 2 2 8 ,6 8 1 2 05 ,6 2 7 2 ,03 1 ,8 2 6 (9 8 ,5 2 6 ) 2,718,968
Deprecia t ion, deplet ion a nd a m ort iza t ion (1 ,2 02 ,6 6 4 ) (2 9 3 ,3 9 1 ) (8 4 ,9 9 5 ) (3 7 2 ,6 1 7 ) (1 0,3 3 7 ) (1,964,004)
T ot a l a sset s - 09/30/2021 9 ,5 5 2 ,4 03 4 ,3 2 1 ,6 4 6 3 ,1 01 ,01 0 1 4 ,5 5 1 ,7 02 9 ,3 09 ,2 9 9 40,836,060
T ot a l l ia bilit ies - 09/30/2021 2 ,9 2 1 ,8 4 3 8 7 5 ,3 5 3 9 8 8 ,3 9 6 1 ,4 3 2 ,09 8 2 8 ,1 6 1 ,2 1 8 34,378,908
Equ it y - 09/30/2021 5 ,5 7 1 ,4 06 3 ,4 4 6 ,2 9 3 2 ,1 1 2 ,6 1 4 1 3 ,1 1 9 ,6 04 (1 8 ,8 5 1 ,9 1 9 ) 5,397,998
Non-cont rolling sh a reh olders 1 ,05 9 ,1 5 4 - - - - 1,059,154
From 1/1 t o 09/30/2021
Corpora t e/
elim ina t ions
T ot a l
Consolida t ed
Forest ry Pa per Conv ersion Pu lp
Net r ev en u e:
.Dom estic m a r ket 7 4 ,6 7 5 6 4 3 ,5 4 9 1 ,4 4 2 ,8 8 7 5 7 8 ,3 5 0 (6 2 ,5 4 2 ) 2,676,919
.For eig n m a r ket - 5 4 4 ,6 3 0 1 03 ,1 2 2 9 8 1 ,8 1 2 5 1 ,7 4 8 1,681,312
Rev enu e from sa les t o t h ird pa rt ies 74,675 1,188,179 1,546,009 1,560,162 (10,794) 4,358,231
Rev en u e betw een seg m en ts 4 3 2 ,5 9 1 5 8 7 ,5 5 6 9 ,4 7 2 4 7 ,9 2 8 (1 ,07 7 ,5 4 7 ) -
T ot a l net sa les 507,266 1,775,735 1,555,481 1,608,090 (1,088,341) 4,358,231
Ch a n g es in th e fa ir v a lu e of biolog ica l a ssets 4 03 ,2 3 2 - - - - 403,232
Cost of pr odu cts sold (7 9 6 ,6 3 5 ) (1 ,1 7 8 ,1 1 5 ) (1 ,2 2 8 ,9 3 2 ) (5 4 1 ,5 5 4 ) 1 ,1 4 2 ,7 5 4 (2,602,482)
Gross profit 113,863 597,620 326,549 1,066,536 54,413 2,158,981
Oper a tin g in com e (ex pen ses) 1 0,3 4 8 (1 5 0,9 9 9 ) (1 4 9 ,7 4 2 ) (1 7 0,6 7 2 ) (3 00) (461,367)
Opera t ing resu lt before fina nce resu lt 124,211 446,621 176,807 895,864 54,113 1,697,614
Sa les of produ ct s (in m et ric t ons)
.Dom estic m a r ket - 1 5 3 ,7 4 3 2 6 4 ,3 8 5 1 4 0,1 6 5 - 558,293
.For eig n m a r ket - 1 1 7 ,9 6 5 1 4 ,8 1 1 2 5 9 ,5 7 0 - 392,346
.In ter -seg m en ta l - 2 5 2 ,3 5 8 1 ,07 1 1 0,3 8 7 (2 6 3 ,8 1 5 ) -
- 524,066 280,267 410,122 (263,815) 950,639
Sa les of t im ber (in m et ric t ons)
.Dom estic m a r ket 5 1 4 ,6 5 3 - - - - 514,653
.In ter -seg m en ta l 3 ,6 04 ,8 2 3 - - - (3 ,6 04 ,8 2 3 ) -
4,119,476 - - - (3,604,823) 514,653
Inv est m ent s du ring t h e period 1 8 9 ,8 9 0 6 7 ,6 09 9 2 ,1 01 7 8 0,9 06 (1 3 0,7 5 4 ) 999,752
Deprecia t ion, deplet ion a nd a m ort iza t ion (3 9 3 ,4 5 9 ) (1 00,5 7 9 ) (2 9 ,1 9 9 ) (1 1 4 ,2 3 5 ) 3 6 2 (637,110)
7/1 t o 09/30/2021
Corpora t e/
elim ina t ions
T ot a l
Consolida t ed
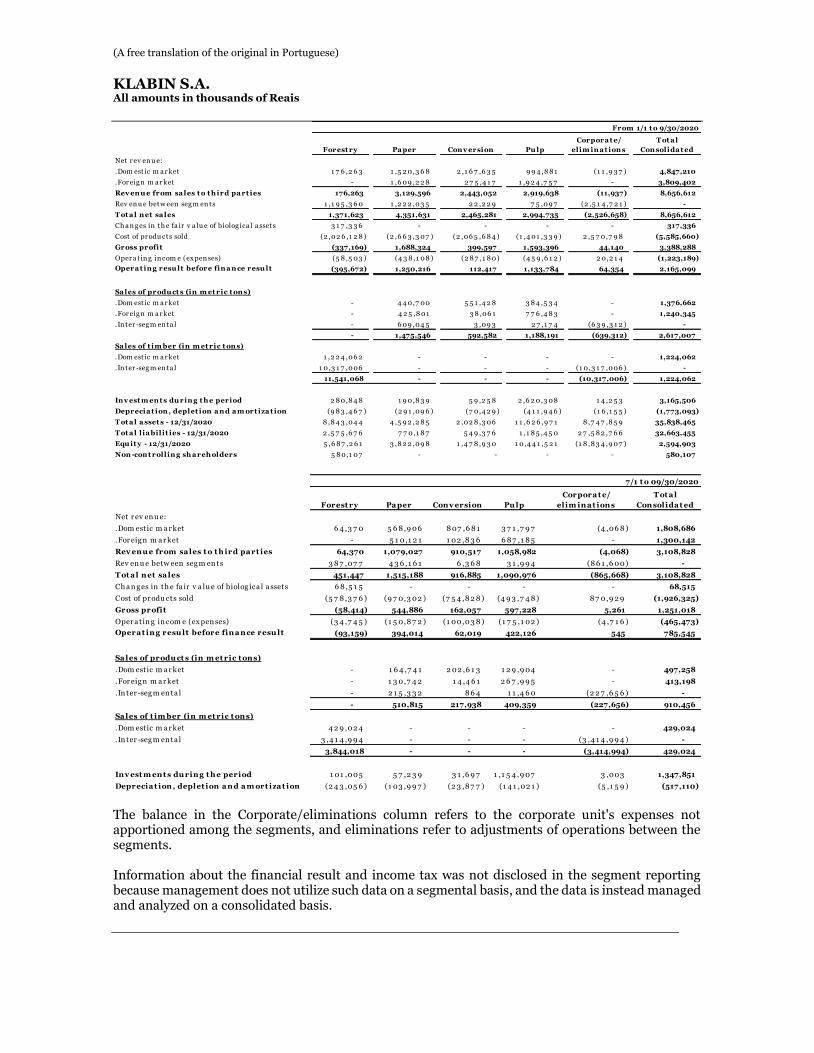
(A free translation of the original in Portuguese)
KLABIN S.A.
All amounts in thousands of Reais
The balance in the Corporate/eliminations column refers to the corporate unit's expenses not apportioned among the segments, and eliminations refer to adjustments of operations between the segments. Information about the financial result and income tax was not disclosed in the segment reporting because management does not utilize such data on a segmental basis, and the data is instead managed and analyzed on a consolidated basis.
Forest ry Pa per Conv ersion Pu lp
Net r ev en u e:
.Dom estic m a r ket 1 7 6 ,2 6 3 1 ,5 2 0,3 6 8 2 ,1 6 7 ,6 3 5 9 9 4 ,8 8 1 (1 1 ,9 3 7 ) 4,847,210
.For eig n m a r ket - 1 ,6 09 ,2 2 8 2 7 5 ,4 1 7 1 ,9 2 4 ,7 5 7 - 3,809,402
Rev enu e from sa les t o t h ird pa rt ies 176,263 3,129,596 2,443,052 2,919,638 (11,937) 8,656,612
Rev en u e betw een seg m en ts 1 ,1 9 5 ,3 6 0 1 ,2 2 2 ,03 5 2 2 ,2 2 9 7 5 ,09 7 (2 ,5 1 4 ,7 2 1 ) -
T ot a l net sa les 1,371,623 4,351,631 2,465,281 2,994,735 (2,526,658) 8,656,612
Ch a n g es in th e fa ir v a lu e of biolog ica l a ssets 3 1 7 ,3 3 6 - - - - 317,336
Cost of pr odu cts sold (2 ,02 6 ,1 2 8 ) (2 ,6 6 3 ,3 07 ) (2 ,06 5 ,6 8 4 ) (1 ,4 01 ,3 3 9 ) 2 ,5 7 0,7 9 8 (5,585,660)
Gross profit (337,169) 1,688,324 399,597 1,593,396 44,140 3,388,288
Oper a tin g in com e (ex pen ses) (5 8 ,5 03 ) (4 3 8 ,1 08 ) (2 8 7 ,1 8 0) (4 5 9 ,6 1 2 ) 2 0,2 1 4 (1,223,189)
Opera t ing resu lt before fina nce resu lt (395,672) 1,250,216 112,417 1,133,784 64,354 2,165,099
Sa les of produ ct s (in m et ric t ons)
.Dom estic m a r ket - 4 4 0,7 00 5 5 1 ,4 2 8 3 8 4 ,5 3 4 - 1,376,662
.For eig n m a r ket - 4 2 5 ,8 01 3 8 ,06 1 7 7 6 ,4 8 3 - 1,240,345
.In ter -seg m en ta l - 6 09 ,04 5 3 ,09 3 2 7 ,1 7 4 (6 3 9 ,3 1 2 ) -
- 1,475,546 592,582 1,188,191 (639,312) 2,617,007
Sa les of t im ber (in m et ric t ons)
.Dom estic m a r ket 1 ,2 2 4 ,06 2 - - - - 1,224,062
.In ter -seg m en ta l 1 0,3 1 7 ,006 - - - (1 0,3 1 7 ,006 ) -
11,541,068 - - - (10,317,006) 1,224,062
Inv est m ent s du ring t h e period 2 8 0,8 4 8 1 9 0,8 3 9 5 9 ,2 5 8 2 ,6 2 0,3 08 1 4 ,2 5 3 3,165,506
Deprecia t ion, deplet ion a nd a m ort iza t ion (9 8 3 ,4 6 7 ) (2 9 1 ,09 6 ) (7 0,4 2 9 ) (4 1 1 ,9 4 6 ) (1 6 ,1 5 5 ) (1,773,093)
T ot a l a sset s - 12/31/2020 8 ,8 4 3 ,04 4 4 ,5 9 2 ,2 8 5 2 ,02 8 ,3 06 1 1 ,6 2 6 ,9 7 1 8 ,7 4 7 ,8 5 9 35,838,465
T ot a l l ia bilit ies - 12/31/2020 2 ,5 7 5 ,6 7 6 7 7 0,1 8 7 5 4 9 ,3 7 6 1 ,1 8 5 ,4 5 0 2 7 ,5 8 2 ,7 6 6 32,663,455
Equ it y - 12/31/2020 5 ,6 8 7 ,2 6 1 3 ,8 2 2 ,09 8 1 ,4 7 8 ,9 3 0 1 0,4 4 1 ,5 2 1 (1 8 ,8 3 4 ,9 07 ) 2,594,903
Non-cont rolling sh a reh olders 5 8 0,1 07 - - - - 580,107
Corpora t e/
elim ina t ions
T ot a l
Consolida t ed
From 1/1 t o 9/30/2020
Forest ry Pa per Conv ersion Pu lp
Net r ev en u e:
.Dom estic m a r ket 6 4 ,3 7 0 5 6 8 ,9 06 8 07 ,6 8 1 3 7 1 ,7 9 7 (4 ,06 8 ) 1,808,686
.For eig n m a r ket - 5 1 0,1 2 1 1 02 ,8 3 6 6 8 7 ,1 8 5 - 1,300,142
Rev enu e from sa les t o t h ird pa rt ies 64,370 1,079,027 910,517 1,058,982 (4,068) 3,108,828
Rev en u e betw een seg m en ts 3 8 7 ,07 7 4 3 6 ,1 6 1 6 ,3 6 8 3 1 ,9 9 4 (8 6 1 ,6 00) -
T ot a l net sa les 451,447 1,515,188 916,885 1,090,976 (865,668) 3,108,828
Ch a n g es in th e fa ir v a lu e of biolog ica l a ssets 6 8 ,5 1 5 - - - - 68,515
Cost of pr odu cts sold (5 7 8 ,3 7 6 ) (9 7 0,3 02 ) (7 5 4 ,8 2 8 ) (4 9 3 ,7 4 8 ) 8 7 0,9 2 9 (1,926,325)
Gross profit (58,414) 544,886 162,057 597,228 5,261 1,251,018
Oper a tin g in com e (ex pen ses) (3 4 ,7 4 5 ) (1 5 0,8 7 2 ) (1 00,03 8 ) (1 7 5 ,1 02 ) (4 ,7 1 6 ) (465,473)
Opera t ing resu lt before fina nce resu lt (93,159) 394,014 62,019 422,126 545 785,545
Sa les of produ ct s (in m et ric t ons)
.Dom estic m a r ket - 1 6 4 ,7 4 1 2 02 ,6 1 3 1 2 9 ,9 04 - 497,258
.For eig n m a r ket - 1 3 0,7 4 2 1 4 ,4 6 1 2 6 7 ,9 9 5 - 413,198
.In ter -seg m en ta l - 2 1 5 ,3 3 2 8 6 4 1 1 ,4 6 0 (2 2 7 ,6 5 6 ) -
- 510,815 217,938 409,359 (227,656) 910,456
Sa les of t im ber (in m et ric t ons)
.Dom estic m a r ket 4 2 9 ,02 4 - - - - 429,024
.In ter -seg m en ta l 3 ,4 1 4 ,9 9 4 - - - (3 ,4 1 4 ,9 9 4 ) -
3,844,018 - - - (3,414,994) 429,024
Inv est m ent s du ring t h e period 1 01 ,005 5 7 ,2 3 9 3 1 ,6 9 7 1 ,1 5 4 ,9 07 3 ,003 1,347,851
Deprecia t ion, deplet ion a nd a m ort iza t ion (2 4 3 ,05 6 ) (1 03 ,9 9 7 ) (2 3 ,8 7 7 ) (1 4 1 ,02 1 ) (5 ,1 5 9 ) (517,110)
7/1 t o 09/30/2020
Corpora t e/
elim ina t ions
T ot a l
Consolida t ed
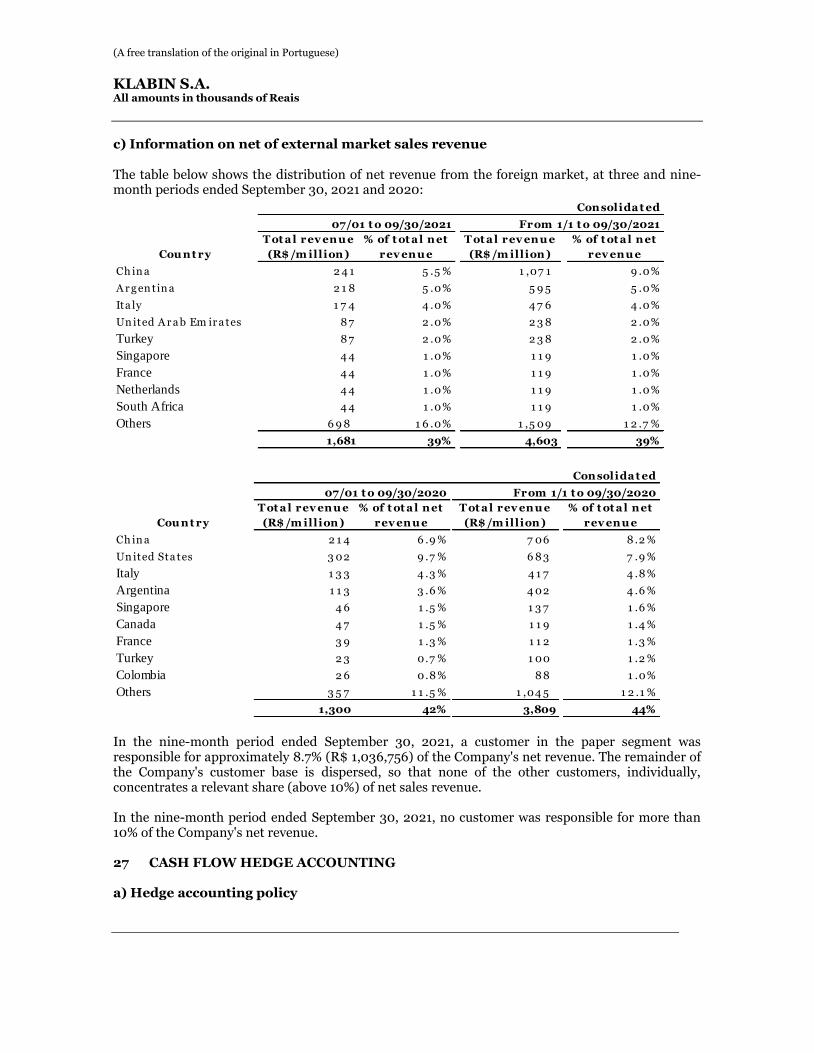
(A free translation of the original in Portuguese)
KLABIN S.A.
All amounts in thousands of Reais
c) Information on net of external market sales revenue
The table below shows the distribution of net revenue from the foreign market, at three and nine-month periods ended September 30, 2021 and 2020:
In the nine-month period ended September 30, 2021, a customer in the paper segment was responsible for approximately 8.7% (R$ 1,036,756) of the Company's net revenue. The remainder of the Company's customer base is dispersed, so that none of the other customers, individually, concentrates a relevant share (above 10%) of net sales revenue. In the nine-month period ended September 30, 2021, no customer was responsible for more than 10% of the Company's net revenue. 27 CASH FLOW HEDGE ACCOUNTING a) Hedge accounting policy
Cou nt ry
T ot a l rev enu e
(R$ /m illion)
% of t ot a l net
rev enu e
T ot a l rev enu e
(R$ /m illion)
% of t ot a l net
rev enu e
Ch in a 2 4 1 5 .5 % 1 ,07 1 9 .0%
A r g en tin a 2 1 8 5 .0% 5 9 5 5 .0%
Ita ly 1 7 4 4 .0% 4 7 6 4 .0%
Un ited A r a b Em ir a tes 8 7 2 .0% 2 3 8 2 .0%
Turkey 8 7 2 .0% 2 3 8 2 .0%
Singapore 4 4 1 .0% 1 1 9 1 .0%
France 4 4 1 .0% 1 1 9 1 .0%
Netherlands 4 4 1 .0% 1 1 9 1 .0%
South Africa 4 4 1 .0% 1 1 9 1 .0%
Others 6 9 8 1 6 .0% 1 ,5 09 1 2 .7 %
1,681 39% 4,603 39%
Consolida t ed
07/01 t o 09/30/2021 From 1/1 t o 09/30/2021
Cou nt ry
T ot a l rev enu e
(R$ /m illion)
% of t ot a l net
rev enu e
T ot a l rev enu e
(R$ /m illion)
% of t ot a l net
rev enu e
Ch in a 2 1 4 6 .9 % 7 06 8 .2 %
Un ited Sta tes 3 02 9 .7 % 6 8 3 7 .9 %
Italy 1 3 3 4 .3 % 4 1 7 4 .8 %
Argentina 1 1 3 3 .6 % 4 02 4 .6 %
Singapore 4 6 1 .5 % 1 3 7 1 .6 %
Canada 4 7 1 .5 % 1 1 9 1 .4 %
France 3 9 1 .3 % 1 1 2 1 .3 %
Turkey 2 3 0.7 % 1 00 1 .2 %
Colombia 2 6 0.8 % 8 8 1 .0%
Others 3 5 7 1 1 .5 % 1 ,04 5 1 2 .1 %
1,300 42% 3,809 44%
Consolida t ed
07/01 t o 09/30/2020 From 1/1 t o 09/30/2020
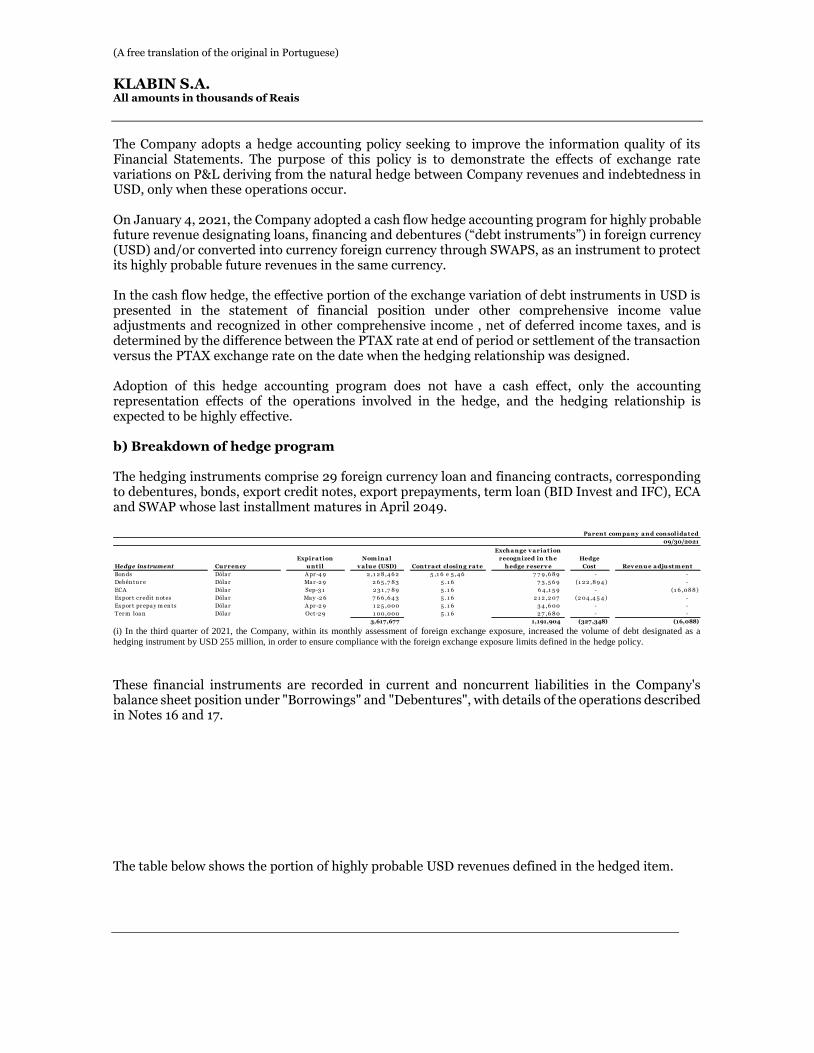
(A free translation of the original in Portuguese)
KLABIN S.A.
All amounts in thousands of Reais
The Company adopts a hedge accounting policy seeking to improve the information quality of its Financial Statements. The purpose of this policy is to demonstrate the effects of exchange rate variations on P&L deriving from the natural hedge between Company revenues and indebtedness in USD, only when these operations occur. On January 4, 2021, the Company adopted a cash flow hedge accounting program for highly probable future revenue designating loans, financing and debentures (“debt instruments”) in foreign currency (USD) and/or converted into currency foreign currency through SWAPS, as an instrument to protect its highly probable future revenues in the same currency. In the cash flow hedge, the effective portion of the exchange variation of debt instruments in USD is presented in the statement of financial position under other comprehensive income value adjustments and recognized in other comprehensive income , net of deferred income taxes, and is determined by the difference between the PTAX rate at end of period or settlement of the transaction versus the PTAX exchange rate on the date when the hedging relationship was designed. Adoption of this hedge accounting program does not have a cash effect, only the accounting representation effects of the operations involved in the hedge, and the hedging relationship is expected to be highly effective. b) Breakdown of hedge program The hedging instruments comprise 29 foreign currency loan and financing contracts, corresponding to debentures, bonds, export credit notes, export prepayments, term loan (BID Invest and IFC), ECA and SWAP whose last installment matures in April 2049.
(i) In the third quarter of 2021, the Company, within its monthly assessment of foreign exchange exposure, increased the volume of debt designated as a
hedging instrument by USD 255 million, in order to ensure compliance with the foreign exchange exposure limits defined in the hedge policy.
These financial instruments are recorded in current and noncurrent liabilities in the Company's balance sheet position under "Borrowings" and "Debentures", with details of the operations described in Notes 16 and 17. The table below shows the portion of highly probable USD revenues defined in the hedged item.
09/30/2021
Hedge instrument Cu rrency
Expirat ion
u nt il
Nom inal
v alu e (USD) Cont ract closing rat e
Exch ange v ariat ion
recognized in t h e
h edge reserv e
Hedge
Cost Rev enu e adju st m ent
Bon ds Dóla r A pr -4 9 2 ,1 2 8 ,4 6 2 5 ,1 6 e 5 ,4 6 7 7 9 ,6 8 9 - -
Debên tu r e Dóla r Ma r -2 9 2 6 5 ,7 8 3 5 .1 6 7 3 ,5 6 9 (1 2 2 ,8 9 4 ) -
ECA Dóla r Sep-3 1 2 3 1 ,7 8 9 5 .1 6 6 4 ,1 5 9 - (1 6 ,08 8 )
Ex por t cr edit n otes Dóla r Ma y -2 6 7 6 6 ,6 4 3 5 .1 6 2 1 2 ,2 07 (2 04 ,4 5 4 ) -
Ex por t pr epa y m en ts Dóla r A pr -2 9 1 2 5 ,000 5 .1 6 3 4 ,6 00 - -
Ter m loa n Dóla r Oct-2 9 1 00,000 5 .1 6 2 7 ,6 8 0 - -
3,617,677 1,191,904 (327,348) (16,088)
Parent com pany and consolidat ed
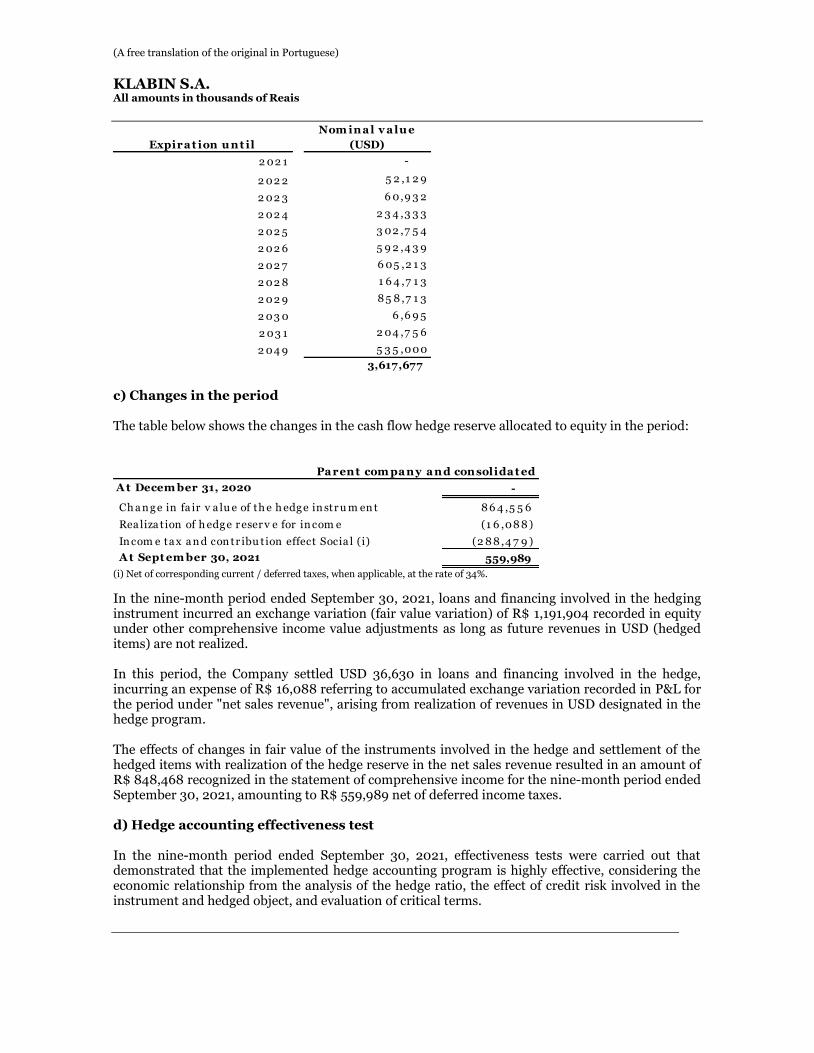
(A free translation of the original in Portuguese)
KLABIN S.A.
All amounts in thousands of Reais
c) Changes in the period The table below shows the changes in the cash flow hedge reserve allocated to equity in the period:
(i) Net of corresponding current / deferred taxes, when applicable, at the rate of 34%.
In the nine-month period ended September 30, 2021, loans and financing involved in the hedging instrument incurred an exchange variation (fair value variation) of R$ 1,191,904 recorded in equity under other comprehensive income value adjustments as long as future revenues in USD (hedged items) are not realized. In this period, the Company settled USD 36,630 in loans and financing involved in the hedge, incurring an expense of R$ 16,088 referring to accumulated exchange variation recorded in P&L for the period under "net sales revenue", arising from realization of revenues in USD designated in the hedge program. The effects of changes in fair value of the instruments involved in the hedge and settlement of the hedged items with realization of the hedge reserve in the net sales revenue resulted in an amount of R$ 848,468 recognized in the statement of comprehensive income for the nine-month period ended September 30, 2021, amounting to R$ 559,989 net of deferred income taxes. d) Hedge accounting effectiveness test In the nine-month period ended September 30, 2021, effectiveness tests were carried out that demonstrated that the implemented hedge accounting program is highly effective, considering the economic relationship from the analysis of the hedge ratio, the effect of credit risk involved in the instrument and hedged object, and evaluation of critical terms.
Expira t ion u n t il
Nom in a l v a lu e
(USD)
2 02 1 -
2 02 2 5 2 ,1 2 9
2 02 3 6 0,9 3 2
2 02 4 2 3 4 ,3 3 3
2 02 5 3 02 ,7 5 4
2 02 6 5 9 2 ,4 3 9
2 02 7 6 05 ,2 1 3
2 02 8 1 6 4 ,7 1 3
2 02 9 8 5 8 ,7 1 3
2 03 0 6 ,6 9 5
2 03 1 2 04 ,7 5 6
2 04 9 5 3 5 ,000
3,617,677
Parent com pany and consolidat ed
A t Decem ber 31, 2020 -
Ch a n g e in fa ir v a lu e of th e h edg e in str u m en t 8 6 4 ,5 5 6
Rea liza t ion of h edg e r eser v e for in com e (1 6 ,08 8 )
In com e ta x a n d con tr ibu tion effect Socia l (i) (2 8 8 ,4 7 9 )
A t Sept em ber 30, 2021 559,989
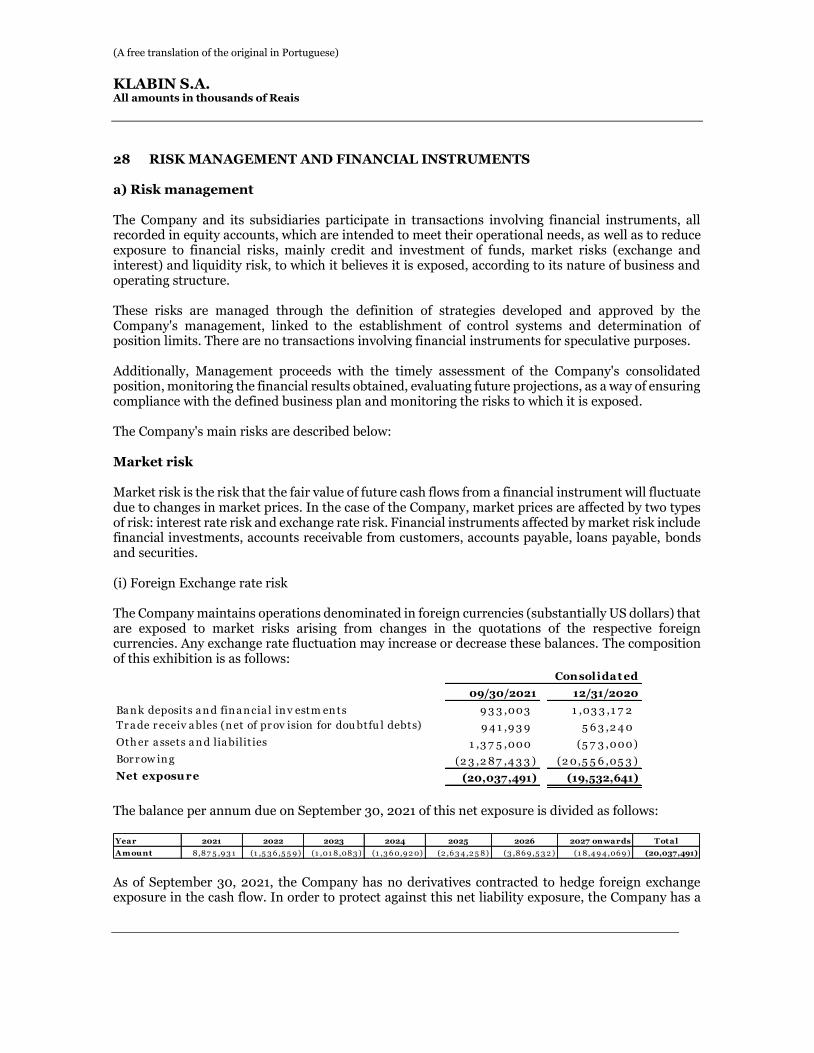
(A free translation of the original in Portuguese)
KLABIN S.A.
All amounts in thousands of Reais
28 RISK MANAGEMENT AND FINANCIAL INSTRUMENTS
a) Risk management The Company and its subsidiaries participate in transactions involving financial instruments, all recorded in equity accounts, which are intended to meet their operational needs, as well as to reduce exposure to financial risks, mainly credit and investment of funds, market risks (exchange and interest) and liquidity risk, to which it believes it is exposed, according to its nature of business and operating structure. These risks are managed through the definition of strategies developed and approved by the Company's management, linked to the establishment of control systems and determination of position limits. There are no transactions involving financial instruments for speculative purposes. Additionally, Management proceeds with the timely assessment of the Company's consolidated position, monitoring the financial results obtained, evaluating future projections, as a way of ensuring compliance with the defined business plan and monitoring the risks to which it is exposed. The Company's main risks are described below:
Market risk
Market risk is the risk that the fair value of future cash flows from a financial instrument will fluctuate due to changes in market prices. In the case of the Company, market prices are affected by two types of risk: interest rate risk and exchange rate risk. Financial instruments affected by market risk include financial investments, accounts receivable from customers, accounts payable, loans payable, bonds and securities. (i) Foreign Exchange rate risk The Company maintains operations denominated in foreign currencies (substantially US dollars) that are exposed to market risks arising from changes in the quotations of the respective foreign currencies. Any exchange rate fluctuation may increase or decrease these balances. The composition of this exhibition is as follows:
The balance per annum due on September 30, 2021 of this net exposure is divided as follows:
As of September 30, 2021, the Company has no derivatives contracted to hedge foreign exchange exposure in the cash flow. In order to protect against this net liability exposure, the Company has a
09/30/2021 12/31/2020
Ba n k deposits a n d fin a n cia l in v estm en ts 9 3 3 ,003 1 ,03 3 ,1 7 2
Tr a de r eceiv a bles (n et of pr ov ision for dou btfu l debts) 9 4 1 ,9 3 9 5 6 3 ,2 4 0
Oth er a ssets a n d lia bilit ies 1 ,3 7 5 ,000 (5 7 3 ,000)
Bor r ow in g (2 3 ,2 8 7 ,4 3 3 ) (2 0,5 5 6 ,05 3 )
Net exposu re (20,037,491) (19,532,641)
Consolidat ed
Year 2021 2022 2023 2024 2025 2026 2027 onwards Tot al
Am ount 8,87 5 ,9 3 1 (1 ,5 3 6 ,5 5 9 ) (1 ,01 8,083 ) (1 ,3 6 0,9 2 0) (2 ,6 3 4 ,2 5 8) (3 ,86 9 ,5 3 2 ) (1 8,4 9 4 ,06 9 ) (20,037,491)
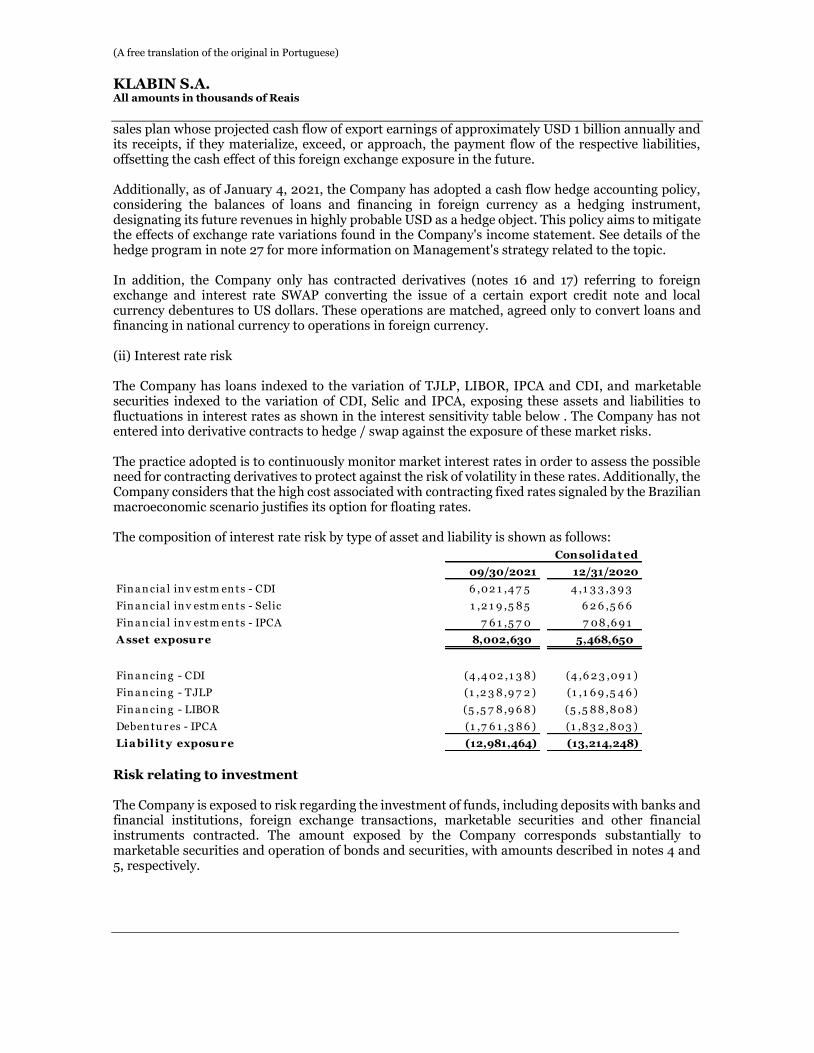
(A free translation of the original in Portuguese)
KLABIN S.A.
All amounts in thousands of Reais
sales plan whose projected cash flow of export earnings of approximately USD 1 billion annually and its receipts, if they materialize, exceed, or approach, the payment flow of the respective liabilities, offsetting the cash effect of this foreign exchange exposure in the future. Additionally, as of January 4, 2021, the Company has adopted a cash flow hedge accounting policy, considering the balances of loans and financing in foreign currency as a hedging instrument, designating its future revenues in highly probable USD as a hedge object. This policy aims to mitigate the effects of exchange rate variations found in the Company's income statement. See details of the hedge program in note 27 for more information on Management's strategy related to the topic. In addition, the Company only has contracted derivatives (notes 16 and 17) referring to foreign exchange and interest rate SWAP converting the issue of a certain export credit note and local currency debentures to US dollars. These operations are matched, agreed only to convert loans and financing in national currency to operations in foreign currency. (ii) Interest rate risk The Company has loans indexed to the variation of TJLP, LIBOR, IPCA and CDI, and marketable securities indexed to the variation of CDI, Selic and IPCA, exposing these assets and liabilities to fluctuations in interest rates as shown in the interest sensitivity table below . The Company has not entered into derivative contracts to hedge / swap against the exposure of these market risks. The practice adopted is to continuously monitor market interest rates in order to assess the possible need for contracting derivatives to protect against the risk of volatility in these rates. Additionally, the Company considers that the high cost associated with contracting fixed rates signaled by the Brazilian macroeconomic scenario justifies its option for floating rates. The composition of interest rate risk by type of asset and liability is shown as follows:
Risk relating to investment The Company is exposed to risk regarding the investment of funds, including deposits with banks and financial institutions, foreign exchange transactions, marketable securities and other financial instruments contracted. The amount exposed by the Company corresponds substantially to marketable securities and operation of bonds and securities, with amounts described in notes 4 and 5, respectively.
09/30/2021 12/31/2020
Fin a n cia l in v estm en ts - CDI 6 ,02 1 ,4 7 5 4 ,1 3 3 ,3 9 3
Fin a n cia l in v estm en ts - Selic 1 ,2 1 9 ,5 8 5 6 2 6 ,5 6 6
Fin a n cia l in v estm en ts - IPCA 7 6 1 ,5 7 0 7 08 ,6 9 1
A sset exposu re 8,002,630 5,468,650
Fin a n cin g - CDI (4 ,4 02 ,1 3 8 ) (4 ,6 2 3 ,09 1 )
Fin a n cin g - TJLP (1 ,2 3 8 ,9 7 2 ) (1 ,1 6 9 ,5 4 6 )
Fin a n cin g - LIBOR (5 ,5 7 8 ,9 6 8 ) (5 ,5 8 8 ,8 08 )
Deben tu r es - IPCA (1 ,7 6 1 ,3 8 6 ) (1 ,8 3 2 ,8 03 )
Liabilit y exposu re (12,981,464) (13,214,248)
Consolidat ed
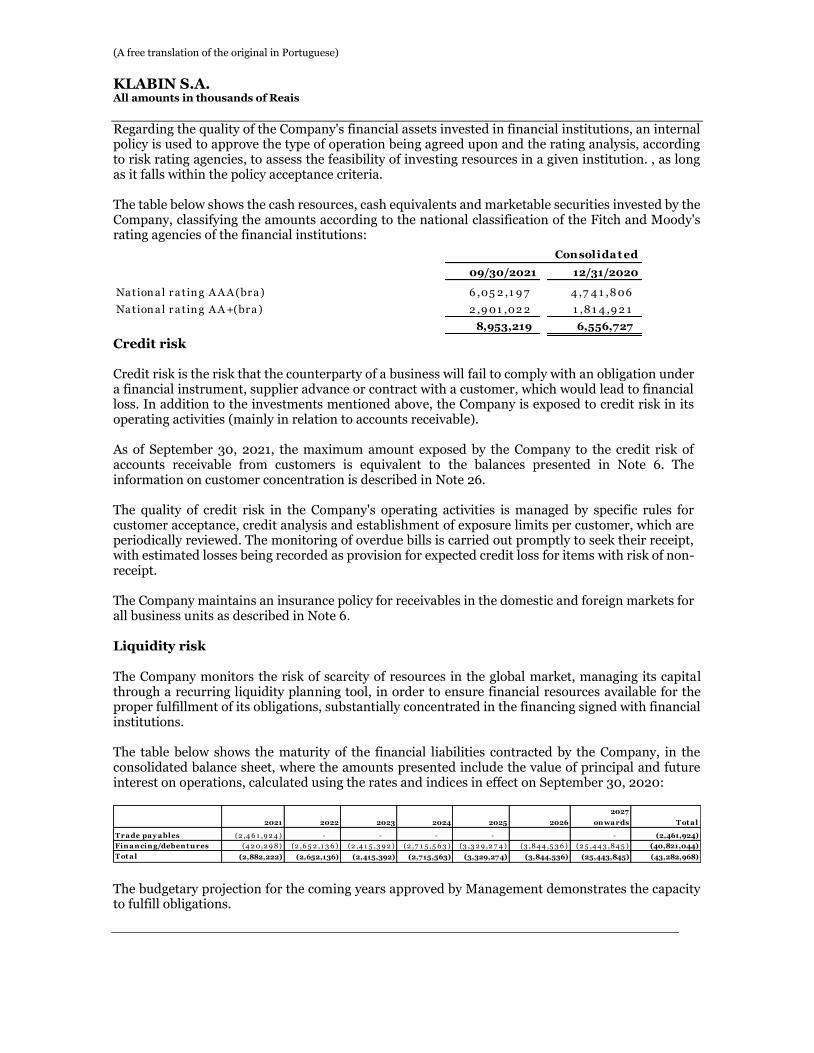
(A free translation of the original in Portuguese)
KLABIN S.A.
All amounts in thousands of Reais
Regarding the quality of the Company's financial assets invested in financial institutions, an internal policy is used to approve the type of operation being agreed upon and the rating analysis, according to risk rating agencies, to assess the feasibility of investing resources in a given institution. , as long as it falls within the policy acceptance criteria. The table below shows the cash resources, cash equivalents and marketable securities invested by the Company, classifying the amounts according to the national classification of the Fitch and Moody's rating agencies of the financial institutions:
Credit risk Credit risk is the risk that the counterparty of a business will fail to comply with an obligation under a financial instrument, supplier advance or contract with a customer, which would lead to financial loss. In addition to the investments mentioned above, the Company is exposed to credit risk in its operating activities (mainly in relation to accounts receivable). As of September 30, 2021, the maximum amount exposed by the Company to the credit risk of accounts receivable from customers is equivalent to the balances presented in Note 6. The information on customer concentration is described in Note 26. The quality of credit risk in the Company's operating activities is managed by specific rules for customer acceptance, credit analysis and establishment of exposure limits per customer, which are periodically reviewed. The monitoring of overdue bills is carried out promptly to seek their receipt, with estimated losses being recorded as provision for expected credit loss for items with risk of non-receipt. The Company maintains an insurance policy for receivables in the domestic and foreign markets for all business units as described in Note 6.
Liquidity risk
The Company monitors the risk of scarcity of resources in the global market, managing its capital through a recurring liquidity planning tool, in order to ensure financial resources available for the proper fulfillment of its obligations, substantially concentrated in the financing signed with financial institutions. The table below shows the maturity of the financial liabilities contracted by the Company, in the consolidated balance sheet, where the amounts presented include the value of principal and future interest on operations, calculated using the rates and indices in effect on September 30, 2020:
The budgetary projection for the coming years approved by Management demonstrates the capacity to fulfill obligations.
Consolidat ed
09/30/2021 12/31/2020
Na tion a l r a t in g A A A (br a ) 6 ,05 2 ,1 9 7 4 ,7 4 1 ,8 06
Na tion a l r a t in g A A +(br a ) 2 ,9 01 ,02 2 1 ,8 1 4 ,9 2 1
8,953,219 6,556,727
2027
2021 2022 2023 2024 2025 2026 onwards Tot al
Trade pay ables (2 ,4 6 1 ,9 2 4 ) - - - - - (2,461,924)
Financing/debent u res (4 2 0,2 9 8 ) (2 ,6 5 2 ,1 3 6 ) (2 ,4 1 5 ,3 9 2 ) (2 ,7 1 5 ,5 6 3 ) (3 ,3 2 9 ,2 7 4 ) (3 ,8 4 4 ,5 3 6 ) (2 5 ,4 4 3 ,8 4 5 ) (40,821,044)
Tot al (2,882,222) (2,652,136) (2,415,392) (2,715,563) (3,329,274) (3,844,536) (25,443,845) (43,282,968)
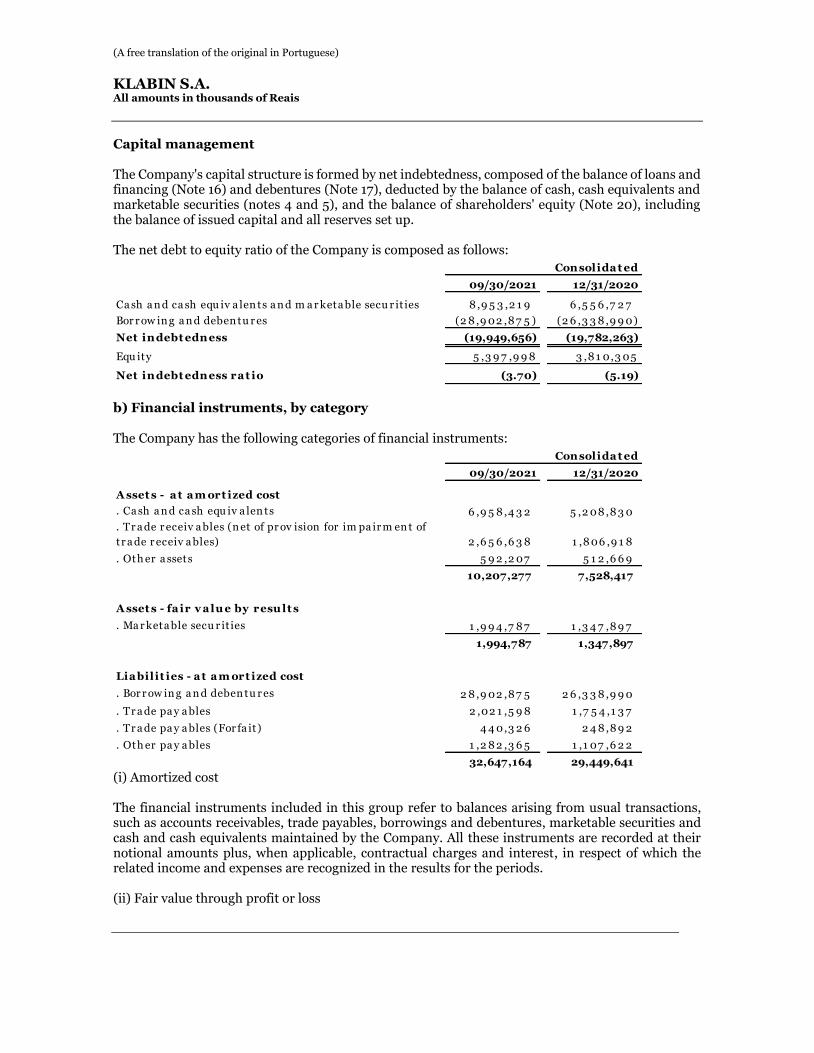
(A free translation of the original in Portuguese)
KLABIN S.A.
All amounts in thousands of Reais
Capital management The Company's capital structure is formed by net indebtedness, composed of the balance of loans and financing (Note 16) and debentures (Note 17), deducted by the balance of cash, cash equivalents and marketable securities (notes 4 and 5), and the balance of shareholders' equity (Note 20), including the balance of issued capital and all reserves set up. The net debt to equity ratio of the Company is composed as follows:
b) Financial instruments, by category
The Company has the following categories of financial instruments:
(i) Amortized cost The financial instruments included in this group refer to balances arising from usual transactions, such as accounts receivables, trade payables, borrowings and debentures, marketable securities and cash and cash equivalents maintained by the Company. All these instruments are recorded at their notional amounts plus, when applicable, contractual charges and interest, in respect of which the related income and expenses are recognized in the results for the periods. (ii) Fair value through profit or loss
09/30/2021 12/31/2020
Ca sh a n d ca sh equ iv a len ts a n d m a r keta ble secu r it ies 8 ,9 5 3 ,2 1 9 6 ,5 5 6 ,7 2 7
Bor r ow in g a n d deben tu r es (2 8 ,9 02 ,8 7 5 ) (2 6 ,3 3 8 ,9 9 0)
Net indebt edness (19,949,656) (19,782,263)
Equ ity 5 ,3 9 7 ,9 9 8 3 ,8 1 0,3 05
Net indebt edness rat io (3.70) (5.19)
Consolidat ed
Consolida t ed
09/30/2021 12/31/2020
A sset s - a t a m ort ized cost
. Ca sh a n d ca sh equ iv a len ts 6 ,9 5 8 ,4 3 2 5 ,2 08 ,8 3 0
. Tr a de r eceiv a bles (n et of pr ov ision for im pa ir m en t of
tr a de r eceiv a bles) 2 ,6 5 6 ,6 3 8 1 ,8 06 ,9 1 8
. Oth er a ssets 5 9 2 ,2 07 5 1 2 ,6 6 9
10,207,277 7,528,417
A sset s - fa ir v a lu e by resu lt s
. Ma r keta ble secu r it ies 1 ,9 9 4 ,7 8 7 1 ,3 4 7 ,8 9 7
1,994,787 1,347,897
Lia bilit ies - a t a m ort ized cost
. Bor r ow in g a n d deben tu r es 2 8 ,9 02 ,8 7 5 2 6 ,3 3 8 ,9 9 0
. Tr a de pa y a bles 2 ,02 1 ,5 9 8 1 ,7 5 4 ,1 3 7
. Tr a de pa y a bles (For fa it) 4 4 0,3 2 6 2 4 8 ,8 9 2
. Oth er pa y a bles 1 ,2 8 2 ,3 6 5 1 ,1 07 ,6 2 2
32,647,164 29,449,641
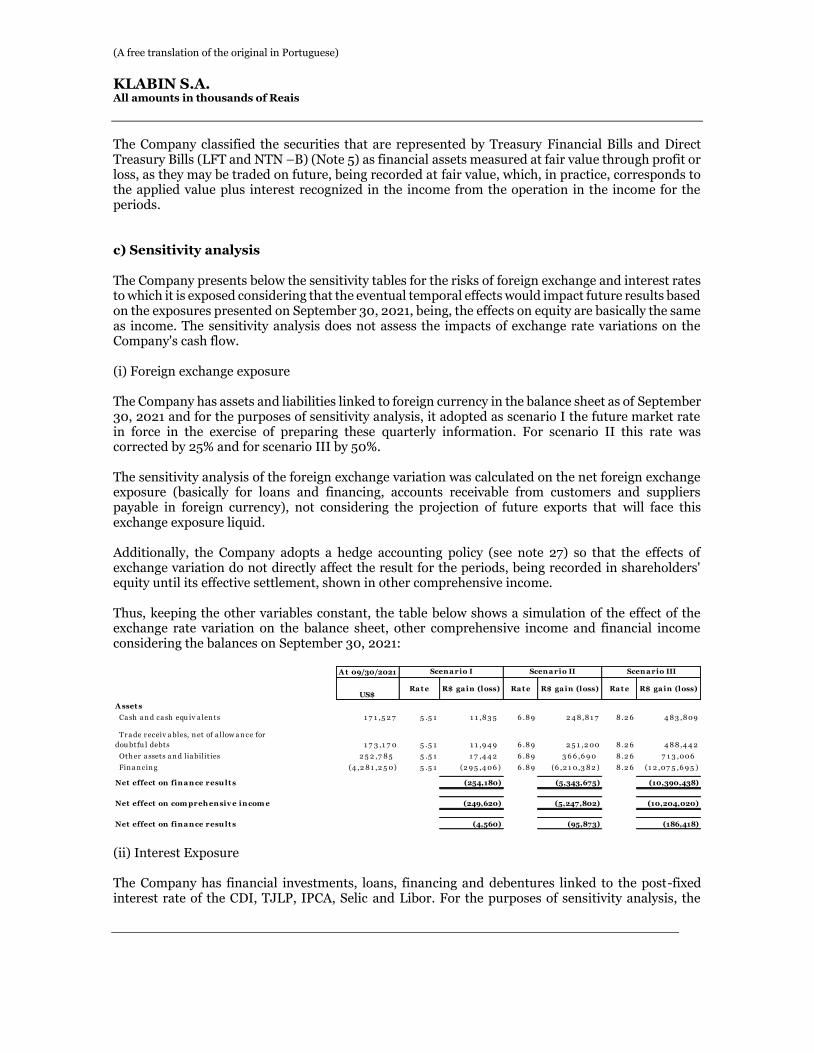
(A free translation of the original in Portuguese)
KLABIN S.A.
All amounts in thousands of Reais
The Company classified the securities that are represented by Treasury Financial Bills and Direct Treasury Bills (LFT and NTN –B) (Note 5) as financial assets measured at fair value through profit or loss, as they may be traded on future, being recorded at fair value, which, in practice, corresponds to the applied value plus interest recognized in the income from the operation in the income for the periods. c) Sensitivity analysis
The Company presents below the sensitivity tables for the risks of foreign exchange and interest rates to which it is exposed considering that the eventual temporal effects would impact future results based on the exposures presented on September 30, 2021, being, the effects on equity are basically the same as income. The sensitivity analysis does not assess the impacts of exchange rate variations on the Company's cash flow. (i) Foreign exchange exposure The Company has assets and liabilities linked to foreign currency in the balance sheet as of September 30, 2021 and for the purposes of sensitivity analysis, it adopted as scenario I the future market rate in force in the exercise of preparing these quarterly information. For scenario II this rate was corrected by 25% and for scenario III by 50%. The sensitivity analysis of the foreign exchange variation was calculated on the net foreign exchange exposure (basically for loans and financing, accounts receivable from customers and suppliers payable in foreign currency), not considering the projection of future exports that will face this exchange exposure liquid. Additionally, the Company adopts a hedge accounting policy (see note 27) so that the effects of exchange variation do not directly affect the result for the periods, being recorded in shareholders' equity until its effective settlement, shown in other comprehensive income. Thus, keeping the other variables constant, the table below shows a simulation of the effect of the exchange rate variation on the balance sheet, other comprehensive income and financial income considering the balances on September 30, 2021:
(ii) Interest Exposure The Company has financial investments, loans, financing and debentures linked to the post-fixed interest rate of the CDI, TJLP, IPCA, Selic and Libor. For the purposes of sensitivity analysis, the
A t 09/30/2021
US$Ra t e R$ ga in (loss) Ra t e R$ ga in (loss) Ra t e R$ ga in (loss)
A sset s
Ca sh a n d ca sh equ iv a len ts 1 7 1 ,5 2 7 5 .5 1 1 1 ,8 3 5 6 .8 9 2 4 8 ,8 1 7 8 .2 6 4 8 3 ,8 09
Tr a de r eceiv a bles, n et of a llow a n ce for
dou btfu l debts 1 7 3 ,1 7 0 5 .5 1 1 1 ,9 4 9 6 .8 9 2 5 1 ,2 00 8 .2 6 4 8 8 ,4 4 2
Oth er a ssets a n d lia bilit ies 2 5 2 ,7 8 5 5 .5 1 1 7 ,4 4 2 6 .8 9 3 6 6 ,6 9 0 8 .2 6 7 1 3 ,006
Fin a n cin g (4 ,2 8 1 ,2 5 0) 5 .5 1 (2 9 5 ,4 06 ) 6 .8 9 (6 ,2 1 0,3 8 2 ) 8 .2 6 (1 2 ,07 5 ,6 9 5 )
Net effect on fina nce resu lt s (254,180) (5,343,675) (10,390,438)
Net effect on com preh ensiv e incom e (249,620) (5,247,802) (10,204,020)
Net effect on fina nce resu lt s (4,560) (95,873) (186,418)
Scena rio I Scena rio II Scena rio III
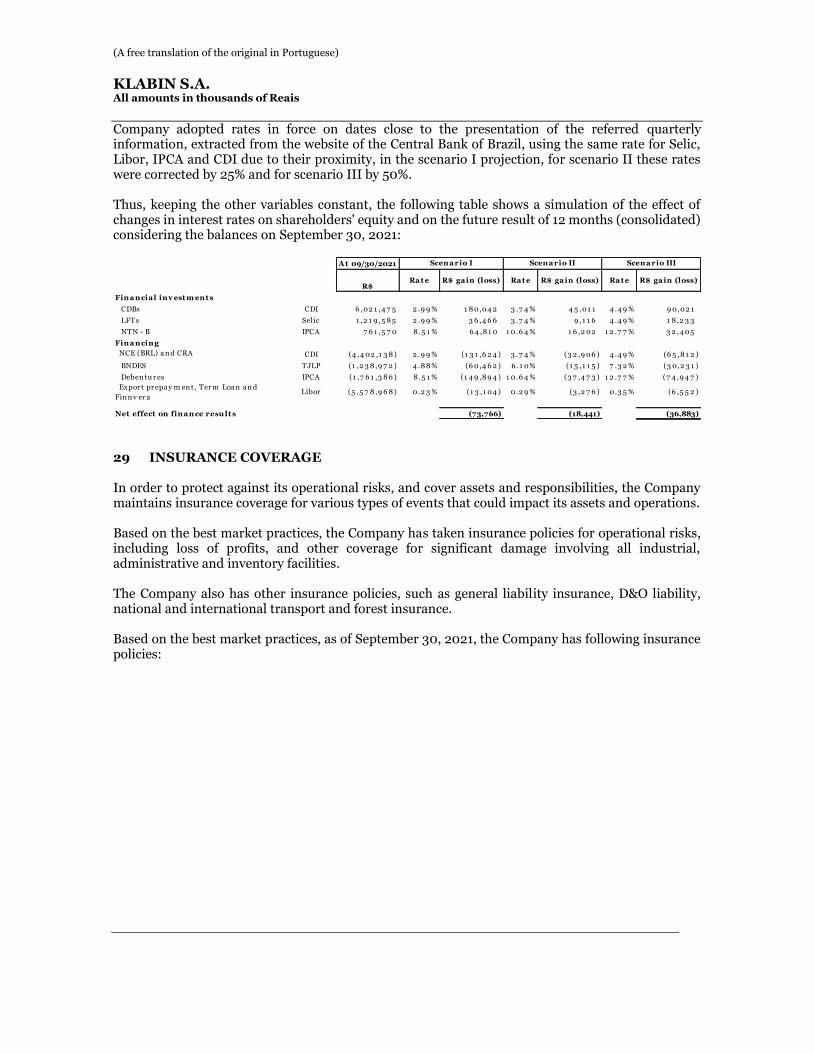
(A free translation of the original in Portuguese)
KLABIN S.A.
All amounts in thousands of Reais
Company adopted rates in force on dates close to the presentation of the referred quarterly information, extracted from the website of the Central Bank of Brazil, using the same rate for Selic, Libor, IPCA and CDI due to their proximity, in the scenario I projection, for scenario II these rates were corrected by 25% and for scenario III by 50%. Thus, keeping the other variables constant, the following table shows a simulation of the effect of changes in interest rates on shareholders' equity and on the future result of 12 months (consolidated) considering the balances on September 30, 2021:
29 INSURANCE COVERAGE
In order to protect against its operational risks, and cover assets and responsibilities, the Company maintains insurance coverage for various types of events that could impact its assets and operations. Based on the best market practices, the Company has taken insurance policies for operational risks, including loss of profits, and other coverage for significant damage involving all industrial, administrative and inventory facilities. The Company also has other insurance policies, such as general liability insurance, D&O liability, national and international transport and forest insurance. Based on the best market practices, as of September 30, 2021, the Company has following insurance policies:
A t 09/30/2021
R$Ra t e R$ ga in (loss) Ra t e R$ ga in (loss) Ra t e R$ ga in (loss)
Fina ncia l inv est m ent s
CDBs CDI 6 ,02 1 ,4 7 5 2 .9 9 % 1 8 0,04 2 3 .7 4 % 4 5 ,01 1 4 .4 9 % 9 0,02 1
LFTs Selic 1 ,2 1 9 ,5 8 5 2 .9 9 % 3 6 ,4 6 6 3 .7 4 % 9 ,1 1 6 4 .4 9 % 1 8 ,2 3 3
NTN - B IPCA 7 6 1 ,5 7 0 8 .5 1 % 6 4 ,8 1 0 1 0.6 4 % 1 6 ,2 02 1 2 .7 7 % 3 2 ,4 05
Fina ncing
NCE (BRL) a n d CRA CDI (4 ,4 02 ,1 3 8 ) 2 .9 9 % (1 3 1 ,6 2 4 ) 3 .7 4 % (3 2 ,9 06 ) 4 .4 9 % (6 5 ,8 1 2 )
BNDES TJLP (1 ,2 3 8 ,9 7 2 ) 4 .8 8 % (6 0,4 6 2 ) 6 .1 0% (1 5 ,1 1 5 ) 7 .3 2 % (3 0,2 3 1 )
Deben tu r es IPCA (1 ,7 6 1 ,3 8 6 ) 8 .5 1 % (1 4 9 ,8 9 4 ) 1 0.6 4 % (3 7 ,4 7 3 ) 1 2 .7 7 % (7 4 ,9 4 7 )
Ex por t pr epa y m en t, Ter m Loa n a n d
Fin n v er aLibor (5 ,5 7 8 ,9 6 8 ) 0 .2 3 % (1 3 ,1 04 ) 0 .2 9 % (3 ,2 7 6 ) 0 .3 5 % (6 ,5 5 2 )
Net effect on fina nce resu lt s (73,766) (18,441) (36,883)
Scena rio I Scena rio II Scena rio III
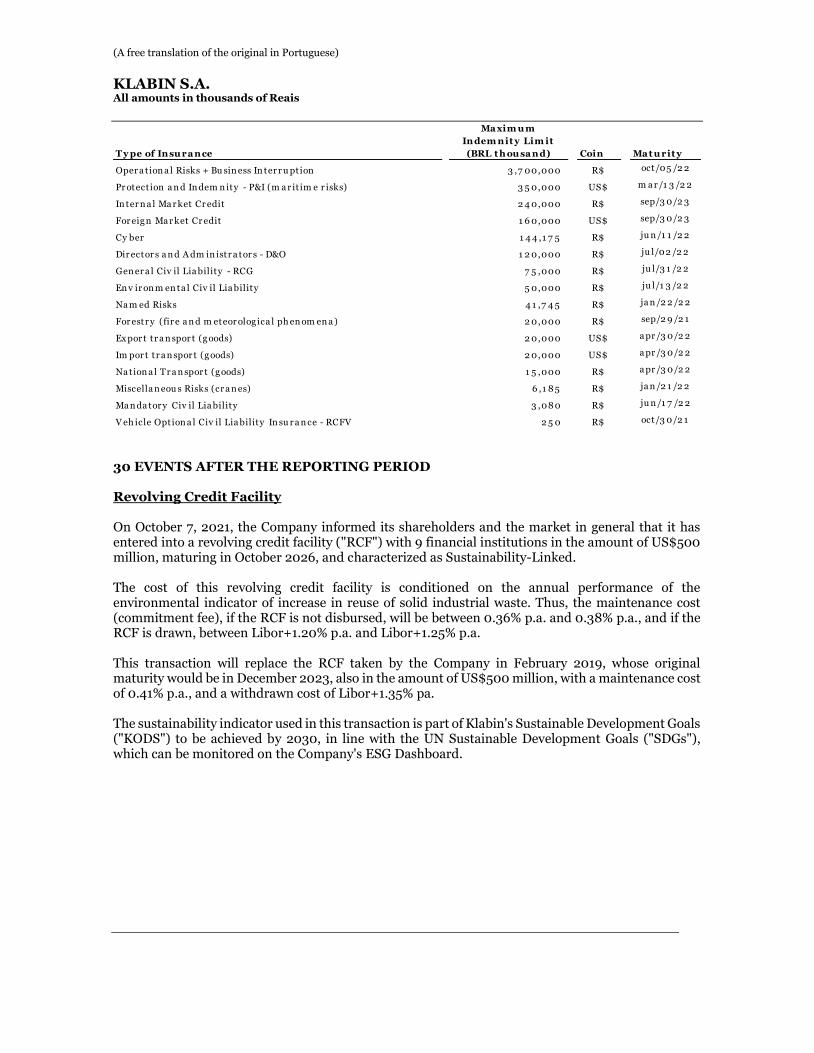
(A free translation of the original in Portuguese)
KLABIN S.A.
All amounts in thousands of Reais
30 EVENTS AFTER THE REPORTING PERIOD Revolving Credit Facility On October 7, 2021, the Company informed its shareholders and the market in general that it has entered into a revolving credit facility ("RCF") with 9 financial institutions in the amount of US$500 million, maturing in October 2026, and characterized as Sustainability-Linked. The cost of this revolving credit facility is conditioned on the annual performance of the environmental indicator of increase in reuse of solid industrial waste. Thus, the maintenance cost (commitment fee), if the RCF is not disbursed, will be between 0.36% p.a. and 0.38% p.a., and if the RCF is drawn, between Libor+1.20% p.a. and Libor+1.25% p.a. This transaction will replace the RCF taken by the Company in February 2019, whose original maturity would be in December 2023, also in the amount of US$500 million, with a maintenance cost of 0.41% p.a., and a withdrawn cost of Libor+1.35% pa. The sustainability indicator used in this transaction is part of Klabin's Sustainable Development Goals ("KODS") to be achieved by 2030, in line with the UN Sustainable Development Goals ("SDGs"), which can be monitored on the Company's ESG Dashboard.
T y pe of Insu ra nce
Ma xim u m
Indem nit y Lim it
(BRL t h ou sa nd) Coin Ma t u rit y
Oper a tion a l Risks + Bu sin ess In ter r u ption 3 ,7 00,000 R$ oct/05 /2 2
Pr otect ion a n d In dem n ity - P&I (m a r it im e r isks) 3 5 0,000 US$ m a r /1 3 /2 2
In ter n a l Ma r ket Cr edit 2 4 0,000 R$ sep/3 0/2 3
For eig n Ma r ket Cr edit 1 6 0,000 US$ sep/3 0/2 3
Cy ber 1 4 4 ,1 7 5 R$ ju n /1 1 /2 2
Dir ector s a n d A dm in istr a tor s - D&O 1 2 0,000 R$ ju l/02 /2 2
Gen er a l Civ il Lia bility - RCG 7 5 ,000 R$ ju l/3 1 /2 2
En v ir on m en ta l Civ il Lia bility 5 0,000 R$ ju l/1 3 /2 2
Na m ed Risks 4 1 ,7 4 5 R$ ja n /2 2 /2 2
For estr y (fir e a n d m eteor olog ica l ph en om en a ) 2 0,000 R$ sep/2 9 /2 1
Ex por t tr a n spor t (g oods) 2 0,000 US$ a pr /3 0/2 2
Im por t tr a n spor t (g oods) 2 0,000 US$ a pr /3 0/2 2
Na tion a l Tr a n spor t (g oods) 1 5 ,000 R$ a pr /3 0/2 2
Miscella n eou s Risks (cr a n es) 6 ,1 8 5 R$ ja n /2 1 /2 2
Ma n da tor y Civ il Lia bility 3 ,08 0 R$ ju n /1 7 /2 2
V eh icle Option a l Civ il Lia bility In su r a n ce - RCFV 2 5 0 R$ oct/3 0/2 1
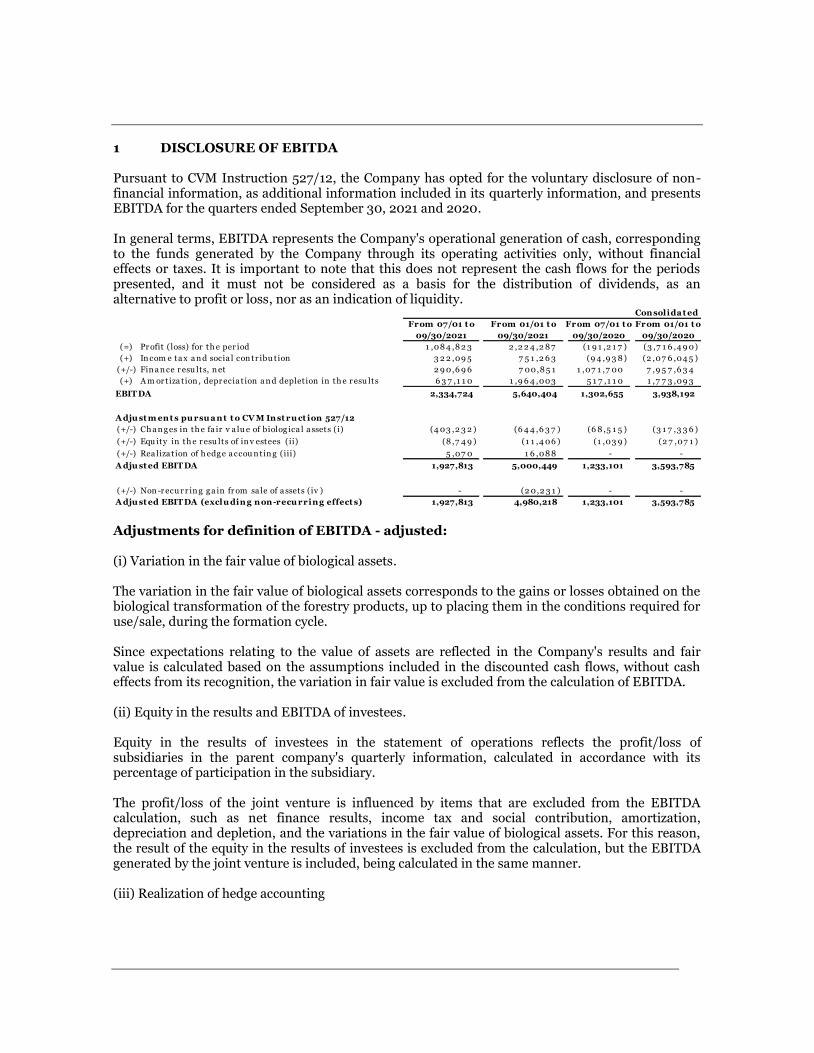
1 DISCLOSURE OF EBITDA
Pursuant to CVM Instruction 527/12, the Company has opted for the voluntary disclosure of non-financial information, as additional information included in its quarterly information, and presents EBITDA for the quarters ended September 30, 2021 and 2020. In general terms, EBITDA represents the Company's operational generation of cash, corresponding to the funds generated by the Company through its operating activities only, without financial effects or taxes. It is important to note that this does not represent the cash flows for the periods presented, and it must not be considered as a basis for the distribution of dividends, as an alternative to profit or loss, nor as an indication of liquidity.
Adjustments for definition of EBITDA - adjusted: (i) Variation in the fair value of biological assets. The variation in the fair value of biological assets corresponds to the gains or losses obtained on the biological transformation of the forestry products, up to placing them in the conditions required for use/sale, during the formation cycle. Since expectations relating to the value of assets are reflected in the Company's results and fair value is calculated based on the assumptions included in the discounted cash flows, without cash effects from its recognition, the variation in fair value is excluded from the calculation of EBITDA. (ii) Equity in the results and EBITDA of investees. Equity in the results of investees in the statement of operations reflects the profit/loss of subsidiaries in the parent company's quarterly information, calculated in accordance with its percentage of participation in the subsidiary. The profit/loss of the joint venture is influenced by items that are excluded from the EBITDA calculation, such as net finance results, income tax and social contribution, amortization, depreciation and depletion, and the variations in the fair value of biological assets. For this reason, the result of the equity in the results of investees is excluded from the calculation, but the EBITDA generated by the joint venture is included, being calculated in the same manner. (iii) Realization of hedge accounting
From 07/01 t o From 01/01 t o From 07/01 t o From 01/01 t o
09/30/2021 09/30/2021 09/30/2020 09/30/2020
(=) Pr ofit (loss) for th e per iod 1 ,08 4 ,8 2 3 2 ,2 2 4 ,2 8 7 (1 9 1 ,2 1 7 ) (3 ,7 1 6 ,4 9 0)
(+) In com e ta x a n d socia l con tr ibu tion 3 2 2 ,09 5 7 5 1 ,2 6 3 (9 4 ,9 3 8 ) (2 ,07 6 ,04 5 )
(+/-) Fin a n ce r esu lts, n et 2 9 0,6 9 6 7 00,8 5 1 1 ,07 1 ,7 00 7 ,9 5 7 ,6 3 4
(+) A m or tiza t ion , depr ecia t ion a n d deplet ion in th e r esu lts 6 3 7 ,1 1 0 1 ,9 6 4 ,003 5 1 7 ,1 1 0 1 ,7 7 3 ,09 3
EBIT DA 2,334,724 5,640,404 1,302,655 3,938,192
A dju st m ent s pu rsu a nt t o CV M Inst ru ct ion 527/12
(+/-) Ch a n g es in th e fa ir v a lu e of biolog ica l a ssets (i) (4 03 ,2 3 2 ) (6 4 4 ,6 3 7 ) (6 8 ,5 1 5 ) (3 1 7 ,3 3 6 )
(+/-) Equ ity in th e r esu lts of in v estees (ii) (8 ,7 4 9 ) (1 1 ,4 06 ) (1 ,03 9 ) (2 7 ,07 1 )
(+/-) Rea liza t ion of h edg e a ccou n tin g (iii) 5 ,07 0 1 6 ,08 8 - -
A dju st ed EBIT DA 1,927,813 5,000,449 1,233,101 3,593,785
(+/-) Non -r ecu r r in g g a in fr om sa le of a ssets (iv ) - (2 0,2 3 1 ) - -
A dju st ed EBIT DA (exclu ding non-recu rring effect s) 1,927,813 4,980,218 1,233,101 3,593,785
Consolida t ed

The Company adopts a hedge accounting policy, seeking as a strategy to minimize the effects of exchange variation of its hedge object, defined as certain foreign currency loan and financing operations, designating highly probable future export revenues, documenting the economic relationship between instrument and hedged, demonstrating that the changes in the cash flow of both of them effectively offset each other. The effects of exchange variation (fair value) of the financial instruments designated in the hedge (loans and financing), are recorded in equity, under the caption “Equity valuation adjustments”, net of applicable income taxes. Such amounts accumulated in shareholders' equity are realized in the income statement, under the caption “Net sales revenue”, to the extent that there is an actual disbursement of the designated loans and financing, with the generation of the respective export revenue designated in the hedge that against cash disbursed in foreign currency, with the exchange rate variation of the hedge instrument being recorded in the income statement. The amount recorded in net sales revenue is being added to EBITDA. (iv) Non-recurring gain on the sale of assets On January 29, 2021, the Company recorded the sale of the Nova Campina unit (see note 12), which resulted in a non-recurring gain of R$ 20,231 recorded in the income statement under “Other net”, considering the revenue from R$ 160,000 and cost of R$ 139,769. 2 COMPANY'S OWNERSHIP INTEREST, INCLUDING STOCKHOLDERS WITH MORE THAN 5% OF THE SHARES. DETAILED TO THE INDIVIDUAL LEVEL
a) Company's ownership interest
(*) Foreign stockholders. (**) Stockholder with less than 5% of the shares.
STOCKHOLDER COMMON % PREFERRED % T OT AL %
Klabin Irmãos S.A. 945,359,142 45.41 - - 945,359,142 16.83
Niblak Participações S.A. 142,023,010 6.82 - - 142,023,010 2.53
Monteiro Aranha S.A. 7 6,689,905 3.68 265,155,406 7 .50 341,845,311 6.08
BNY (*) 61,258,226 2.94 245,032,904 6.93 306,291,130 5.45
BLACKROCK 47 ,899,830 2.30 191,599,320 5.42 239,499,150 4.26
Treasury shares 25,136,296 1 .21 100,545,184 2.84 125,681,480 2.24
Others (**) 7 83,362,186 37 .63 2,7 33,831,347 7 7 .31 3,517 ,193,533 62.61
T OT AL 2,081,7 28,595 100 3,536,164,161 100 5,617 ,892,7 56 100
SHARES
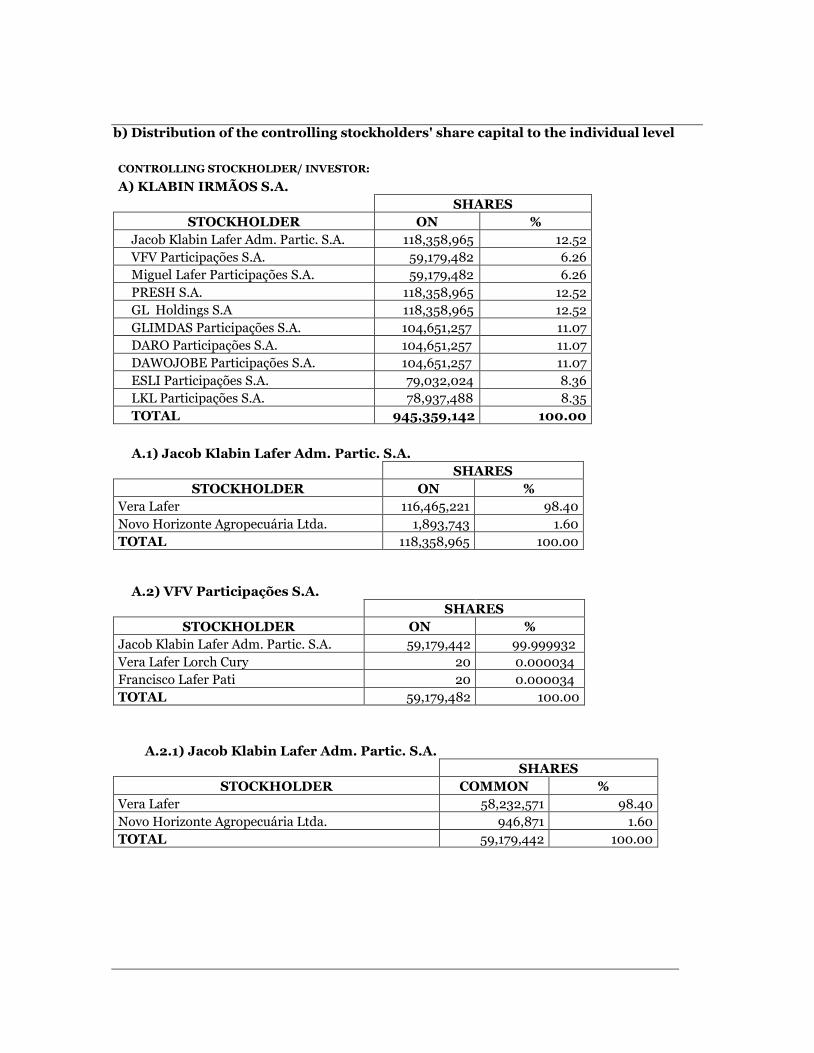
b) Distribution of the controlling stockholders' share capital to the individual level
CONTROLLING STOCKHOLDER/ INVESTOR:
A) KLABIN IRMÃOS S.A.
SHARES
STOCKHOLDER ON %
Jacob Klabin Lafer Adm. Partic. S.A. 118,358,965 12.52
VFV Participações S.A. 59,179,482 6.26
Miguel Lafer Participações S.A. 59,179,482 6.26
PRESH S.A. 118,358,965 12.52
GL Holdings S.A 118,358,965 12.52
GLIMDAS Participações S.A. 104,651,257 11.07
DARO Participações S.A. 104,651,257 11.07
DAWOJOBE Participações S.A. 104,651,257 11.07
ESLI Participações S.A. 79,032,024 8.36
LKL Participações S.A. 78,937,488 8.35
TOTAL 945,359,142 100.00
A.1) Jacob Klabin Lafer Adm. Partic. S.A. SHARES
STOCKHOLDER ON %
Vera Lafer 116,465,221 98.40
Novo Horizonte Agropecuária Ltda. 1,893,743 1.60
TOTAL 118,358,965 100.00
A.2) VFV Participações S.A.
SHARES
STOCKHOLDER ON %
Jacob Klabin Lafer Adm. Partic. S.A. 59,179,442 99.999932
Vera Lafer Lorch Cury 20 0.000034
Francisco Lafer Pati 20 0.000034
TOTAL 59,179,482 100.00
A.2.1) Jacob Klabin Lafer Adm. Partic. S.A. SHARES
STOCKHOLDER COMMON %
Vera Lafer 58,232,571 98.40
Novo Horizonte Agropecuária Ltda. 946,871 1.60
TOTAL 59,179,442 100.00
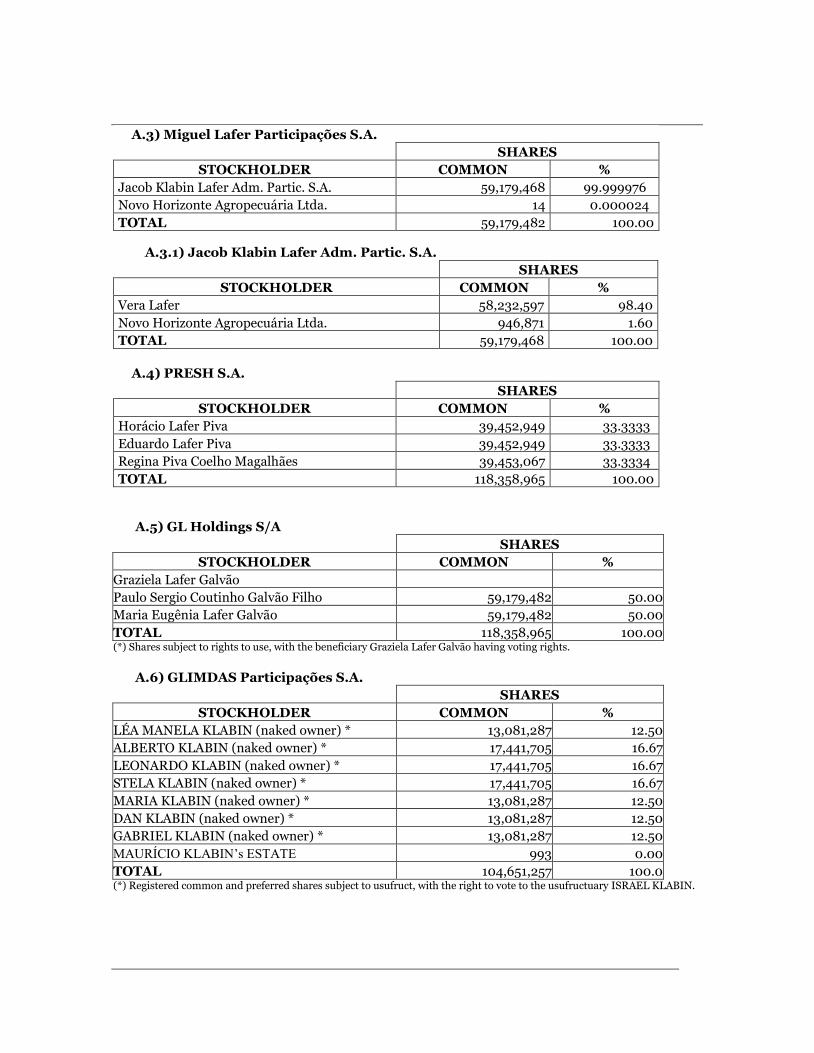
A.3) Miguel Lafer Participações S.A.
SHARES
STOCKHOLDER COMMON %
Jacob Klabin Lafer Adm. Partic. S.A. 59,179,468 99.999976
Novo Horizonte Agropecuária Ltda. 14 0.000024
TOTAL 59,179,482 100.00
A.3.1) Jacob Klabin Lafer Adm. Partic. S.A. SHARES
STOCKHOLDER COMMON %
Vera Lafer 58,232,597 98.40
Novo Horizonte Agropecuária Ltda. 946,871 1.60
TOTAL 59,179,468 100.00
A.4) PRESH S.A.
SHARES
STOCKHOLDER COMMON %
Horácio Lafer Piva 39,452,949 33.3333
Eduardo Lafer Piva 39,452,949 33.3333
Regina Piva Coelho Magalhães 39,453,067 33.3334
TOTAL 118,358,965 100.00
A.5) GL Holdings S/A
SHARES
STOCKHOLDER COMMON %
Graziela Lafer Galvão
Paulo Sergio Coutinho Galvão Filho 59,179,482 50.00
Maria Eugênia Lafer Galvão 59,179,482 50.00
TOTAL 118,358,965 100.00 (*) Shares subject to rights to use, with the beneficiary Graziela Lafer Galvão having voting rights.
A.6) GLIMDAS Participações S.A. SHARES
STOCKHOLDER COMMON %
LÉA MANELA KLABIN (naked owner) * 13,081,287 12.50
ALBERTO KLABIN (naked owner) * 17,441,705 16.67
LEONARDO KLABIN (naked owner) * 17,441,705 16.67
STELA KLABIN (naked owner) * 17,441,705 16.67
MARIA KLABIN (naked owner) * 13,081,287 12.50
DAN KLABIN (naked owner) * 13,081,287 12.50
GABRIEL KLABIN (naked owner) * 13,081,287 12.50
MAURÍCIO KLABIN’s ESTATE 993 0.00
TOTAL 104,651,257 100.0 (*) Registered common and preferred shares subject to usufruct, with the right to vote to the usufructuary ISRAEL KLABIN.
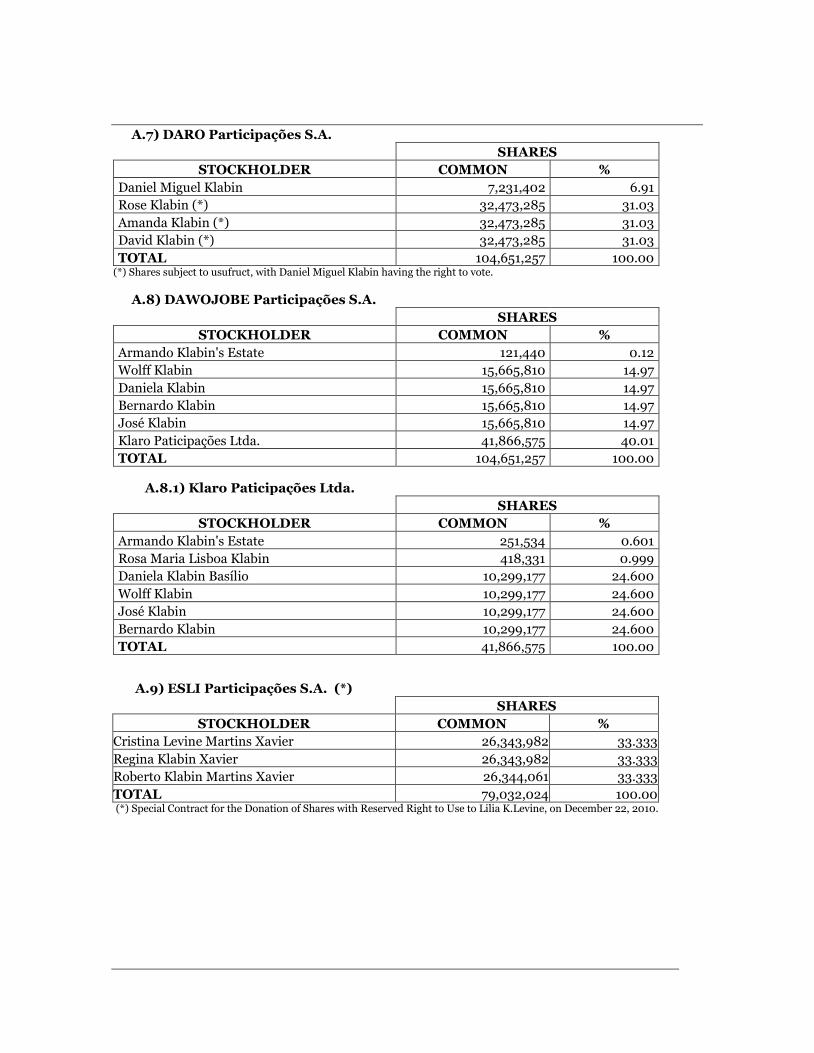
A.7) DARO Participações S.A. SHARES
STOCKHOLDER COMMON %
Daniel Miguel Klabin 7,231,402 6.91
Rose Klabin (*) 32,473,285 31.03
Amanda Klabin (*) 32,473,285 31.03
David Klabin (*) 32,473,285 31.03
TOTAL 104,651,257 100.00 (*) Shares subject to usufruct, with Daniel Miguel Klabin having the right to vote.
A.8) DAWOJOBE Participações S.A. SHARES
STOCKHOLDER COMMON %
Armando Klabin's Estate 121,440 0.12
Wolff Klabin 15,665,810 14.97
Daniela Klabin 15,665,810 14.97
Bernardo Klabin 15,665,810 14.97
José Klabin 15,665,810 14.97
Klaro Paticipações Ltda. 41,866,575 40.01
TOTAL 104,651,257 100.00
A.8.1) Klaro Paticipações Ltda. SHARES
STOCKHOLDER COMMON %
Armando Klabin's Estate 251,534 0.601
Rosa Maria Lisboa Klabin 418,331 0.999
Daniela Klabin Basílio 10,299,177 24.600
Wolff Klabin 10,299,177 24.600
José Klabin 10,299,177 24.600
Bernardo Klabin 10,299,177 24.600
TOTAL 41,866,575 100.00
A.9) ESLI Participações S.A. (*) SHARES
STOCKHOLDER COMMON %
Cristina Levine Martins Xavier 26,343,982 33.333
Regina Klabin Xavier 26,343,982 33.333
Roberto Klabin Martins Xavier 26,344,061 33.333
TOTAL 79,032,024 100.00 (*) Special Contract for the Donation of Shares with Reserved Right to Use to Lilia K.Levine, on December 22, 2010.
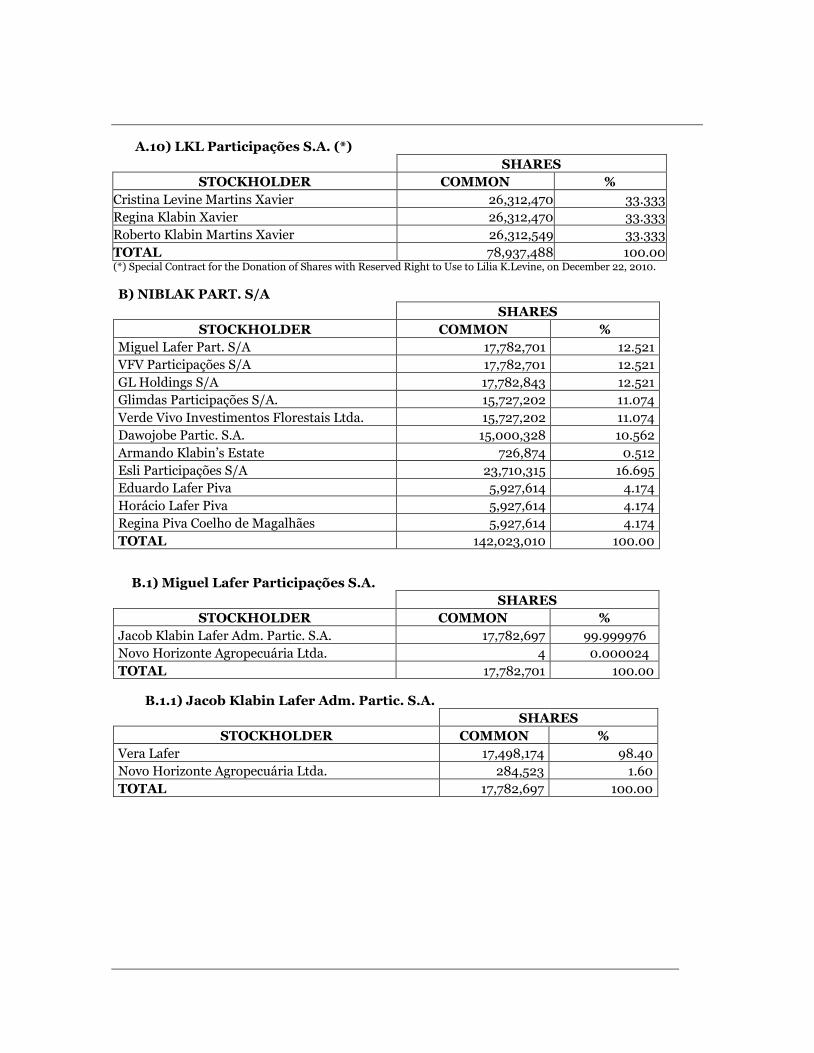
A.10) LKL Participações S.A. (*) SHARES
STOCKHOLDER COMMON %
Cristina Levine Martins Xavier 26,312,470 33.333
Regina Klabin Xavier 26,312,470 33.333
Roberto Klabin Martins Xavier 26,312,549 33.333
TOTAL 78,937,488 100.00 (*) Special Contract for the Donation of Shares with Reserved Right to Use to Lilia K.Levine, on December 22, 2010.
B) NIBLAK PART. S/A
SHARES
STOCKHOLDER COMMON %
Miguel Lafer Part. S/A 17,782,701 12.521
VFV Participações S/A 17,782,701 12.521
GL Holdings S/A 17,782,843 12.521
Glimdas Participações S/A. 15,727,202 11.074
Verde Vivo Investimentos Florestais Ltda. 15,727,202 11.074
Dawojobe Partic. S.A. 15,000,328 10.562
Armando Klabin’s Estate 726,874 0.512
Esli Participações S/A 23,710,315 16.695
Eduardo Lafer Piva 5,927,614 4.174
Horácio Lafer Piva 5,927,614 4.174
Regina Piva Coelho de Magalhães 5,927,614 4.174
TOTAL 142,023,010 100.00
B.1) Miguel Lafer Participações S.A.
SHARES
STOCKHOLDER COMMON %
Jacob Klabin Lafer Adm. Partic. S.A. 17,782,697 99.999976
Novo Horizonte Agropecuária Ltda. 4 0.000024
TOTAL 17,782,701 100.00
B.1.1) Jacob Klabin Lafer Adm. Partic. S.A. SHARES
STOCKHOLDER COMMON %
Vera Lafer 17,498,174 98.40
Novo Horizonte Agropecuária Ltda. 284,523 1.60
TOTAL 17,782,697 100.00

B.2) VFV Participações S.A.
SHARES
STOCKHOLDER COMMON %
Jacob Klabin Lafer Adm. Partic. S.A. 17,782,689 99.999932
Vera Lafer Lorch Cury 6 0.000034
Francisco Lafer Pati 6 0.000034
TOTAL 17,782,701 100.000000
B.2.1) Jacob Klabin Lafer Adm. Partic. S.A. SHARES
STOCKHOLDER COMMON %
Vera Lafer 17,498,166 98.40
Novo Horizonte Agropecuária Ltda. 284,523 1.60
TOTAL 17,782,689 100.00
B.3) GL Holdings S/A
SHARES
STOCKHOLDER COMMON %
Graziela Lafer Galvão
Paulo Sergio Coutinho Galvão Filho 8,891,422 50.00
Maria Eugênia Lafer Galvão 8,891,422 50.00
TOTAL 17,782,843 100.00 (*) Shares subject to rights to use, with the beneficiary Graziela Lafer Galvão having voting rights.
B.4) GLIMDAS Participações S.A. SHARES
STOCKHOLDER COMMON %
Léa Manela Klabin (naked owner) * 1,965,882 12.500
Alberto Klabin (naked owner) * 2,621,175 16.667
Leonardo Klabin (naked owner) * 2,621,175 16.667
Stela Klabin (naked owner) * 2,621,175 16.667
Maria Klabin (naked owner) * 1,965,882 12.500
Dan Klabin (naked owner) * 1,965,882 12.500
Gabriel Klabin (naked owner) * 1,965,882 12.500
Maurício Klabin's Estate 149 0.001
TOTAL 15,727,202 100.000 (*) Registered common and preferred shares subject to usufruct, with the right to vote to the usufructuary ISRAEL KLABIN.
B.5) Verde Vivo Investimentos Florestais Ltda. SHARES
STOCKHOLDER COMMON %
Amanda Klabin Tkacz 5,242,401 33.333
Rose Klabin 5,242,401 33.333
David Klabin 5,242,401 33.333
TOTAL 15,727,202 100.00
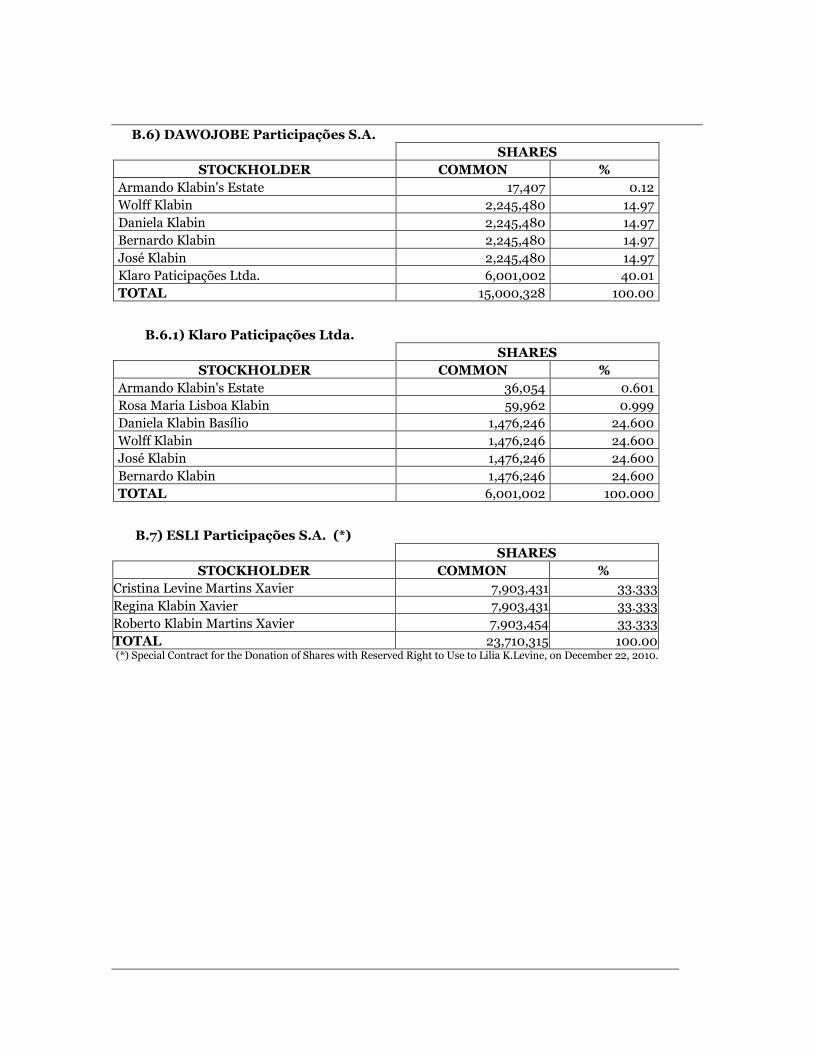
B.6) DAWOJOBE Participações S.A. SHARES
STOCKHOLDER COMMON %
Armando Klabin's Estate 17,407 0.12
Wolff Klabin 2,245,480 14.97
Daniela Klabin 2,245,480 14.97
Bernardo Klabin 2,245,480 14.97
José Klabin 2,245,480 14.97
Klaro Paticipações Ltda. 6,001,002 40.01
TOTAL 15,000,328 100.00
B.6.1) Klaro Paticipações Ltda. SHARES
STOCKHOLDER COMMON %
Armando Klabin's Estate 36,054 0.601
Rosa Maria Lisboa Klabin 59,962 0.999
Daniela Klabin Basílio 1,476,246 24.600
Wolff Klabin 1,476,246 24.600
José Klabin 1,476,246 24.600
Bernardo Klabin 1,476,246 24.600
TOTAL 6,001,002 100.000
B.7) ESLI Participações S.A. (*) SHARES
STOCKHOLDER COMMON %
Cristina Levine Martins Xavier 7,903,431 33.333
Regina Klabin Xavier 7,903,431 33.333
Roberto Klabin Martins Xavier 7,903,454 33.333
TOTAL 23,710,315 100.00 (*) Special Contract for the Donation of Shares with Reserved Right to Use to Lilia K.Levine, on December 22, 2010.

3 CHANGES IN THE OWNERSHIP STRUCTURE
4 NUMBER OF THE COMPANY'S SHARES DIRECTLY OR INDIRECTLY HELD BY CONTROLLING STOCKHOLDERS AND MEMBERS OF THE BOARD OF DIRECTORS, EXECUTIVE BOARD AND STATUTORY AUDIT BOARD AND NUMBER OF SHARES OUTSTANDING IN THE MARKET
At 09/30/2021
C ha ng e s
N um be r o f P urc ha s e / N e w C o rpo ra te N um be r o f C ha ng e
S TOC KHOLD ER Type s ha re s % S ubs c ript io n S a le Inv e s to rs Whitdra wa ls c ha ng e s * s ha re s % %
Sto ckho lders ON 1,242,343,937 61.74 52,658,728 -61,200 0 0 0 1,294,941,465 62.19 4.23
P N 361,471,823 10.22 7,372,000 -64,800 0 0 0 368,779,023 10.40 2.02
Members o f
Co uncil o f ON 45,225,862 2.25 23,020,062 -13,850,000 0 0 0 54,395,924 2.56 20.28
Management P N 176,881,524 5.00 59,400,005 -55,400,000 0 0 0 180,881,529 5.00 2.26
Members o f ON 1,363,649 0.07 235,450 -227,078 103,460 0 0 1,475,481 0.07 8.20
Bo ard o f Direc to rs P N 5,454,596 0.15 941,800 -908,312 413,840 0 0 5,901,924 0.17 8.20
Members o f ON 295,005 0.01 0 0 0 0 0 295,005 0.01 0.00
advice Supervis o r P N 1,180,000 0.03 25,000 0 0 0 0 1,205,000 0.03 2.12
Treas ury s hares ON 26,527,032 1.32 -1,390,736 0 0 0 0 25,136,296 1.21 -5.24
P N 106,108,128 3.00 -5,562,944 0 0 0 0 100,545,184 2.84 -5.24
Other s to ckho lders ON 696,578,414 34.62 -74,523,504 14,138,278 -103,460 0 69,394,696 705,484,424 33.95 1.28
P N 2,885,068,090 81.59 -62,175,861 56,373,112 -413,840 0 0 2,878,851,501 81.55 -0.22
To ta l ON 2 ,0 12 ,3 3 3 ,8 9 9 10 0 .0 0 0 0 0 0 6 9 ,3 9 4 ,6 9 6 2 ,0 8 1,7 2 8 ,5 9 5 10 0 .0 0 3.45
P N 3 ,5 3 6 ,16 4 ,16 1 10 0 .0 0 0 0 0 0 0 3 ,5 3 6 ,16 4 ,16 1 10 0 .0 0 0.00
0 9 / 3 0 / 2 0 2 10 9 / 3 0 / 2 0 2 0
SHA RES
ST OCKHOLDER COMMON % PREFERRED % T ot a l %
Stockholders 1 ,2 9 4 ,9 4 1 ,4 6 5 6 2 .2 1 3 6 8 ,7 7 9 ,02 3 1 0.4 3 1 ,6 6 3 ,7 2 0,4 8 8 2 9 .6 1
Members of the Board of Directors 5 4 ,3 9 5 ,9 2 4 2 .6 1 1 8 0,8 8 1 ,5 2 9 5 .1 2 2 3 5 ,2 7 7 ,4 5 3 4 .1 9
Members of the Executive Board 1 ,4 7 5 ,4 8 1 0.07 5 ,9 01 ,9 2 4 0.1 7 7 ,3 7 7 ,4 05 0.1 3
Members of the Statutory Audit Board 2 9 5 ,005 0.01 1 ,2 05 ,000 0.03 1 ,5 00,005 0.03
Treasury shares 2 5 ,1 3 6 ,2 9 6 1 .2 1 1 00,5 4 5 ,1 8 4 2 .8 4 1 2 5 ,6 8 1 ,4 8 0 2 .2 4
Other stockholders 7 05 ,4 8 4 ,4 2 4 3 3 .8 9 2 ,8 7 8 ,8 5 1 ,5 01 8 1 .4 1 3 ,5 8 4 ,3 3 5 ,9 2 5 6 3 .8 0
T ot a l 2,081,728,595 100.00 3,536,164,161 100.00 5,617,892,756 100.00
Nu m ber of sh a res ou t st a nding in t h e m a rket 705,484,424 33.89 2,878,851,501 81.41 3,584,335,925 63.80
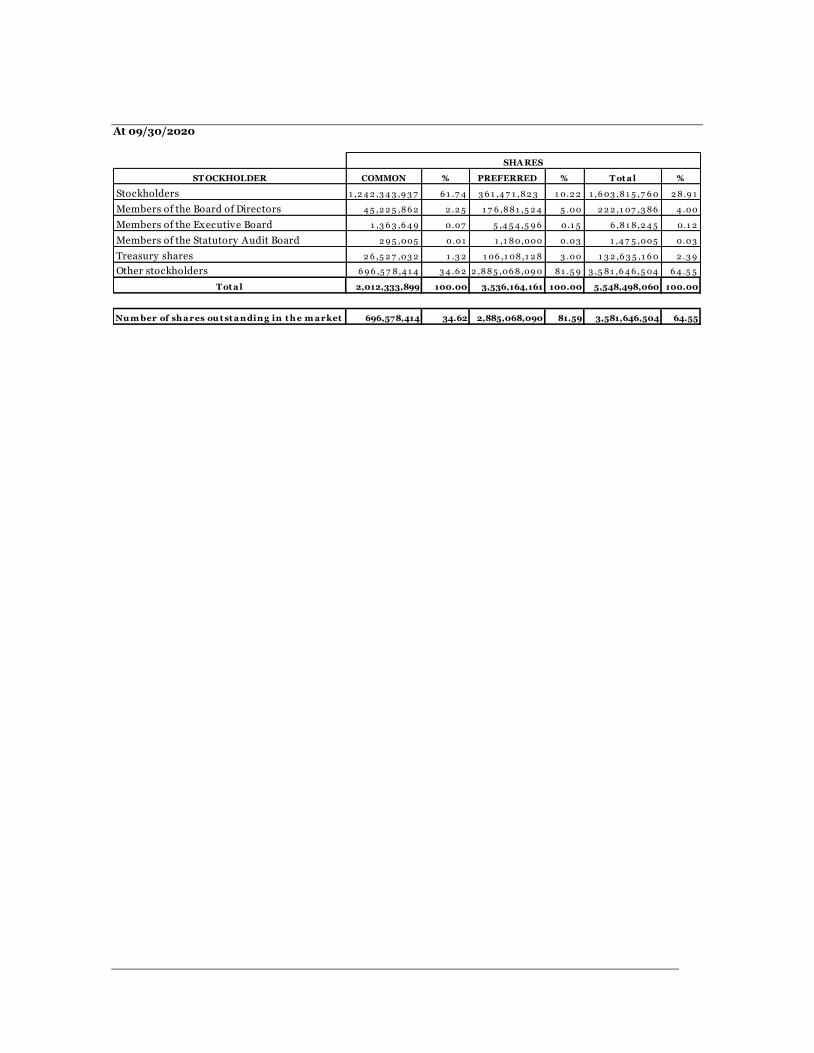
At 09/30/2020
SHA RES
ST OCKHOLDER COMMON % PREFERRED % T ot a l %
Stockholders 1 ,2 4 2 ,3 4 3 ,9 3 7 6 1 .7 4 3 6 1 ,4 7 1 ,8 2 3 1 0.2 2 1 ,6 03 ,8 1 5 ,7 6 0 2 8 .9 1
Members of the Board of Directors 4 5 ,2 2 5 ,8 6 2 2 .2 5 1 7 6 ,8 8 1 ,5 2 4 5 .00 2 2 2 ,1 07 ,3 8 6 4 .00
Members of the Executive Board 1 ,3 6 3 ,6 4 9 0.07 5 ,4 5 4 ,5 9 6 0.1 5 6 ,8 1 8 ,2 4 5 0.1 2
Members of the Statutory Audit Board 2 9 5 ,005 0.01 1 ,1 8 0,000 0.03 1 ,4 7 5 ,005 0.03
Treasury shares 2 6 ,5 2 7 ,03 2 1 .3 2 1 06 ,1 08 ,1 2 8 3 .00 1 3 2 ,6 3 5 ,1 6 0 2 .3 9
Other stockholders 6 9 6 ,5 7 8 ,4 1 4 3 4 .6 2 2 ,8 8 5 ,06 8 ,09 0 8 1 .5 9 3 ,5 8 1 ,6 4 6 ,5 04 6 4 .5 5
T ot a l 2,012,333,899 100.00 3,536,164,161 100.00 5,548,498,060 100.00
Nu m ber of sh a res ou t st a nding in t h e m a rket 696,578,414 34.62 2,885,068,090 81.59 3,581,646,504 64.55