kiti suomalainen - cpm lca database
TRANSCRIPT
Environmental life cycle assessment of a large-scalegrid-connected PV power plantCase study Moura 62 MW PV power plant
kit i suomalainen
Division of Environmental Systems AnalysisDepartment of Energy and Environmentchalmers univers ity of technologyGöteborg, Sweden 2006
chalmers univers ity of technologyse 412 96 Göteborg, SwedenPhone: + 46 - (0)31 772 10 00Web: www.chalmers.se
Environmental life cycle assessment of a large-scalegrid-connected PV power plantCase study Moura62 MW PV power plant
K ITI SUOMALAINEN
Division of Environmental Systems AnalysisDepartment of Energy and EnvironmentCHALMERS UNIVERSITY OF TECHNOLOGYGöteborg, Sweden 2006
Environmental life cycle assessment of a large-scale grid-connected PV power plant –Case study Moura62 MW PV power plant
Kiti Suomalainen
© Kiti Suomalainen, 2006.
ESA Report 2006:14ISSN 1404-8167
Environmental Systems AnalysisChalmers University of TechnologySE-412 96 GöteborgSwedenTelephone + 46 (0)31 772 1000
Abstract
An environmental life cycle assessment has been conducted for a 62 MW grid-connectedphotovoltaic installation to study the role of BOS components in the total environmentalload. Also the influence of the current electricity supply has been investigated. For analternative approach a net output approach has been used, where all electricity requirementsare supplied by the photovoltaic installation itself.
The components taken into account are monocrystalline silicon cells in frameless modules,steel support structures in concrete foundations, inverters, transformers, cables, transportsand construction of roads and buildings. For stationary inert products without intrinsicenergy requirements, such as cables, inverters, support sructures etc., only raw materialacquisition and processing are taken into account, since they are considered the most dom-inant stages in the life cycle.
The results confirm a minor environmental load from BOS components compared to themodule life cycle, showing approximately ten to twenty percent impact of the total. Un-certainties lie in the approximations for electronic devices as well as in the emissions fromsilicon processing.
Concerning the electricity supply, the results differ considerably depending on which sys-tem perspective is used. In the net output approach the impacts decrease with approxi-mately ninety percent from the traditional approach. Some increases are also shown intoxicity categories due to the increased module production needed for the enlargement ofthe installation.
Keywords: large-scale photovoltaic ground installation, life cycle assessment, BOS com-ponents, net output approach

Acknowledgements
This thesis work was done over a 6 months’ period of cooperation with Renatura Networks inLisbon, Portugal. I would like to thank Aníbal Lamy and Lídia Bergano for all their assistanceand advice.
WITEC, the European Association for Women in Science, Engineering and Technology, iskindly acknowledged for the financial aid that allowed me this Portuguese experience.
I would like to express my appreciation and gratitude to my examiner, Björn Sandén, for hissupport, guidance and critical feedback along the course of the thesis. Also Erik Alsema andManuel Collares Pereira are thanked for their assistance, as well as my colleague Linus Palm-blad for his feedback over the extent of the thesis and Francisco Freitas for his support andadvice.
In addition I express a specialobrigada for helping me achieve my goals to Carlos Torres. Andfinally akiitos goes to my parents for their support.
Göteborg, December 2005
Kiti Suomalainen
CONTENTS Chalmers University of Technology
Contents
1 Introduction 1
2 Goal and scope 3
3 Project description 43.1 Background . . . . . . . . . . . . . . . . . . . . . . . . . . . . . . . . . . . .43.2 Location . . . . . . . . . . . . . . . . . . . . . . . . . . . . . . . . . . . . . . 53.3 System specification . . . . . . . . . . . . . . . . . . . . . . . . . . . . . . .53.4 Construction details . . . . . . . . . . . . . . . . . . . . . . . . . . . . . . . .8
3.4.1 Land preparation . . . . . . . . . . . . . . . . . . . . . . . . . . . . .83.4.2 Improvement and construction of roads . . . . . . . . . . . . . . . . .93.4.3 Excavations for foundations and trenches . . . . . . . . . . . . . . . .93.4.4 Construction of buildings . . . . . . . . . . . . . . . . . . . . . . . . .93.4.5 Installation of the solar panels . . . . . . . . . . . . . . . . . . . . . .93.4.6 Exploitation and decommissioning . . . . . . . . . . . . . . . . . . . .9
4 Methods and data collection 114.1 Production of wafers . . . . . . . . . . . . . . . . . . . . . . . . . . . . . . .114.2 Production of cells and modules . . . . . . . . . . . . . . . . . . . . . . . . .134.3 Production of inverters . . . . . . . . . . . . . . . . . . . . . . . . . . . . . .144.4 Production of transformers . . . . . . . . . . . . . . . . . . . . . . . . . . . .144.5 Production of cables . . . . . . . . . . . . . . . . . . . . . . . . . . . . . . .154.6 Production of support structures . . . . . . . . . . . . . . . . . . . . . . . . .154.7 Construction of foundations . . . . . . . . . . . . . . . . . . . . . . . . . . .164.8 Construction of new roads and buildings . . . . . . . . . . . . . . . . . . . . .164.9 Electricity production . . . . . . . . . . . . . . . . . . . . . . . . . . . . . . .17
4.9.1 Case 1: Current electricity supply system . . . . . . . . . . . . . . . .174.9.2 Case 2: Net output approach . . . . . . . . . . . . . . . . . . . . . . .18
4.10 Inventory summary . . . . . . . . . . . . . . . . . . . . . . . . . . . . . . . .19
5 Energy input and output 205.1 Energy requirements . . . . . . . . . . . . . . . . . . . . . . . . . . . . . . .205.2 Energy output and energy pay back time . . . . . . . . . . . . . . . . . . . . .21
6 Impact Assessment 236.1 Impact categories definition and classification . . . . . . . . . . . . . . . . . .236.2 Characterisation methods and data reliability . . . . . . . . . . . . . . . . . . .236.3 Characterisation results . . . . . . . . . . . . . . . . . . . . . . . . . . . . . .24
6.3.1 Summary of characterisation . . . . . . . . . . . . . . . . . . . . . . .246.3.2 Depletion of abiotic resources . . . . . . . . . . . . . . . . . . . . . .266.3.3 Land use . . . . . . . . . . . . . . . . . . . . . . . . . . . . . . . . .276.3.4 Climate change . . . . . . . . . . . . . . . . . . . . . . . . . . . . . .286.3.5 Ozone depletion potential . . . . . . . . . . . . . . . . . . . . . . . .296.3.6 Human toxicity . . . . . . . . . . . . . . . . . . . . . . . . . . . . . .296.3.7 Ecotoxicity . . . . . . . . . . . . . . . . . . . . . . . . . . . . . . . .30
i
CONTENTS Chalmers University of Technology
6.3.8 Photochemical ozone creation potential . . . . . . . . . . . . . . . . .326.3.9 Acidification . . . . . . . . . . . . . . . . . . . . . . . . . . . . . . .336.3.10 Eutrophication . . . . . . . . . . . . . . . . . . . . . . . . . . . . . .34
6.4 Interpretation and sensitivity analysis . . . . . . . . . . . . . . . . . . . . . . .35
7 Discussion and conclusions 36
References 38
A Inventory results 41A.1 Production of wafers . . . . . . . . . . . . . . . . . . . . . . . . . . . . . . .41A.2 Production of cells and modules . . . . . . . . . . . . . . . . . . . . . . . . .42A.3 Production of inverters . . . . . . . . . . . . . . . . . . . . . . . . . . . . . .43A.4 Production of transformers . . . . . . . . . . . . . . . . . . . . . . . . . . . .44A.5 Production of cables . . . . . . . . . . . . . . . . . . . . . . . . . . . . . . .45A.6 Production of support structures . . . . . . . . . . . . . . . . . . . . . . . . .46A.7 Construction of foundations . . . . . . . . . . . . . . . . . . . . . . . . . . .47A.8 Transportation . . . . . . . . . . . . . . . . . . . . . . . . . . . . . . . . . . .48A.9 Construction of new roads . . . . . . . . . . . . . . . . . . . . . . . . . . . .48A.10 Electricity use . . . . . . . . . . . . . . . . . . . . . . . . . . . . . . . . . . .49
B Complete list of substances 50
ii
LIST OF TABLES Chalmers University of Technology
List of Figures
1 Flowchart . . . . . . . . . . . . . . . . . . . . . . . . . . . . . . . . . . . . . 32 Installation overview . . . . . . . . . . . . . . . . . . . . . . . . . . . . . . . 43 DC-system . . . . . . . . . . . . . . . . . . . . . . . . . . . . . . . . . . . . 64 AC-system . . . . . . . . . . . . . . . . . . . . . . . . . . . . . . . . . . . . 85 Wafer production . . . . . . . . . . . . . . . . . . . . . . . . . . . . . . . . .126 Support structure . . . . . . . . . . . . . . . . . . . . . . . . . . . . . . . . .157 Electricity mixes . . . . . . . . . . . . . . . . . . . . . . . . . . . . . . . . .178 Electricity use . . . . . . . . . . . . . . . . . . . . . . . . . . . . . . . . . . .189 Total energy requirements per m2 . . . . . . . . . . . . . . . . . . . . . . . . . 2110 Impact scores in all categories . . . . . . . . . . . . . . . . . . . . . . . . . .2411 Characterisation results, role of electricity mix . . . . . . . . . . . . . . . . . .2512 Characterisation results, comparison . . . . . . . . . . . . . . . . . . . . . . .2513 Abiotic depletion potential . . . . . . . . . . . . . . . . . . . . . . . . . . . .2714 Global warming potential . . . . . . . . . . . . . . . . . . . . . . . . . . . . .2815 Human toxicity potential . . . . . . . . . . . . . . . . . . . . . . . . . . . . .3016 Fresh water aquatic ecotoxicity potential . . . . . . . . . . . . . . . . . . . . .3017 Terrestrial ecotoxicity potential . . . . . . . . . . . . . . . . . . . . . . . . . .3118 Photochemical ozone creation potential with high background NOx . . . . . . 3219 Acidification potential . . . . . . . . . . . . . . . . . . . . . . . . . . . . . .3320 Eutrophication potential . . . . . . . . . . . . . . . . . . . . . . . . . . . . . .34
List of Tables
1 Inventory summary . . . . . . . . . . . . . . . . . . . . . . . . . . . . . . . .192 Total energy requirements, case 1 . . . . . . . . . . . . . . . . . . . . . . . . .203 Inventory results, silicon to wafers . . . . . . . . . . . . . . . . . . . . . . . .414 Inventory results, wafers to modules . . . . . . . . . . . . . . . . . . . . . . .425 Inventory results, inverters . . . . . . . . . . . . . . . . . . . . . . . . . . . .436 Inventory results, transformers . . . . . . . . . . . . . . . . . . . . . . . . . .447 Inventory results, cables . . . . . . . . . . . . . . . . . . . . . . . . . . . . . .458 Inventory results, support structures . . . . . . . . . . . . . . . . . . . . . . .469 Inventory results, foundations . . . . . . . . . . . . . . . . . . . . . . . . . . .4710 Inventory results, transports . . . . . . . . . . . . . . . . . . . . . . . . . . . .4811 Inventory results, roads . . . . . . . . . . . . . . . . . . . . . . . . . . . . . .4812 Inventory results, electricity use . . . . . . . . . . . . . . . . . . . . . . . . .4913 Complete inventory list: resources . . . . . . . . . . . . . . . . . . . . . . . .5014 Complete inventory list: emissions to air . . . . . . . . . . . . . . . . . . . . .5115 Complete inventory list: emissions to water . . . . . . . . . . . . . . . . . . .52
iii

1 INTRODUCTION Chalmers University of Technology
1 Introduction
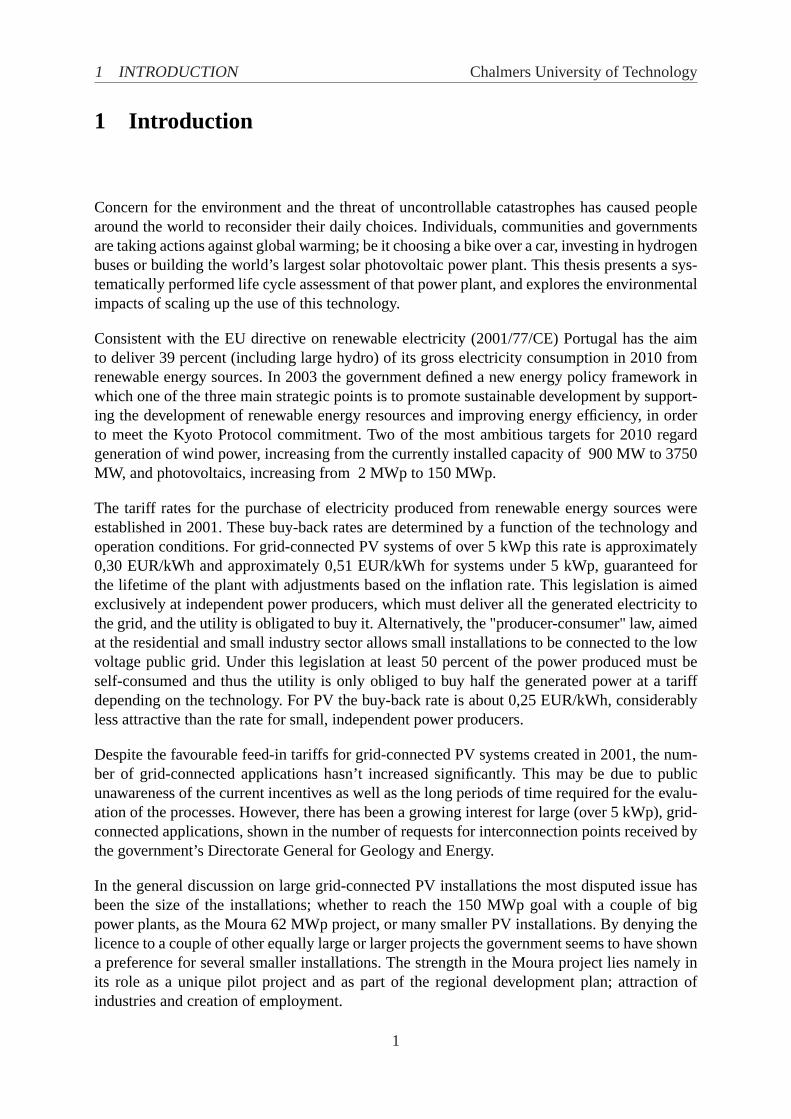
Concern for the environment and the threat of uncontrollable catastrophes has caused peoplearound the world to reconsider their daily choices. Individuals, communities and governmentsare taking actions against global warming; be it choosing a bike over a car, investing in hydrogenbuses or building the world’s largest solar photovoltaic power plant. This thesis presents a sys-tematically performed life cycle assessment of that power plant, and explores the environmentalimpacts of scaling up the use of this technology.
Consistent with the EU directive on renewable electricity (2001/77/CE) Portugal has the aimto deliver 39 percent (including large hydro) of its gross electricity consumption in 2010 fromrenewable energy sources. In 2003 the government defined a new energy policy framework inwhich one of the three main strategic points is to promote sustainable development by support-ing the development of renewable energy resources and improving energy efficiency, in orderto meet the Kyoto Protocol commitment. Two of the most ambitious targets for 2010 regardgeneration of wind power, increasing from the currently installed capacity of 900 MW to 3750MW, and photovoltaics, increasing from 2 MWp to 150 MWp.
The tariff rates for the purchase of electricity produced from renewable energy sources wereestablished in 2001. These buy-back rates are determined by a function of the technology andoperation conditions. For grid-connected PV systems of over 5 kWp this rate is approximately0,30 EUR/kWh and approximately 0,51 EUR/kWh for systems under 5 kWp, guaranteed forthe lifetime of the plant with adjustments based on the inflation rate. This legislation is aimedexclusively at independent power producers, which must deliver all the generated electricity tothe grid, and the utility is obligated to buy it. Alternatively, the "producer-consumer" law, aimedat the residential and small industry sector allows small installations to be connected to the lowvoltage public grid. Under this legislation at least 50 percent of the power produced must beself-consumed and thus the utility is only obliged to buy half the generated power at a tariffdepending on the technology. For PV the buy-back rate is about 0,25 EUR/kWh, considerablyless attractive than the rate for small, independent power producers.
Despite the favourable feed-in tariffs for grid-connected PV systems created in 2001, the num-ber of grid-connected applications hasn’t increased significantly. This may be due to publicunawareness of the current incentives as well as the long periods of time required for the evalu-ation of the processes. However, there has been a growing interest for large (over 5 kWp), grid-connected applications, shown in the number of requests for interconnection points received bythe government’s Directorate General for Geology and Energy.
In the general discussion on large grid-connected PV installations the most disputed issue hasbeen the size of the installations; whether to reach the 150 MWp goal with a couple of bigpower plants, as the Moura 62 MWp project, or many smaller PV installations. By denying thelicence to a couple of other equally large or larger projects the government seems to have showna preference for several smaller installations. The strength in the Moura project lies namely inits role as a unique pilot project and as part of the regional development plan; attraction ofindustries and creation of employment.
1
Chalmers University of Technology
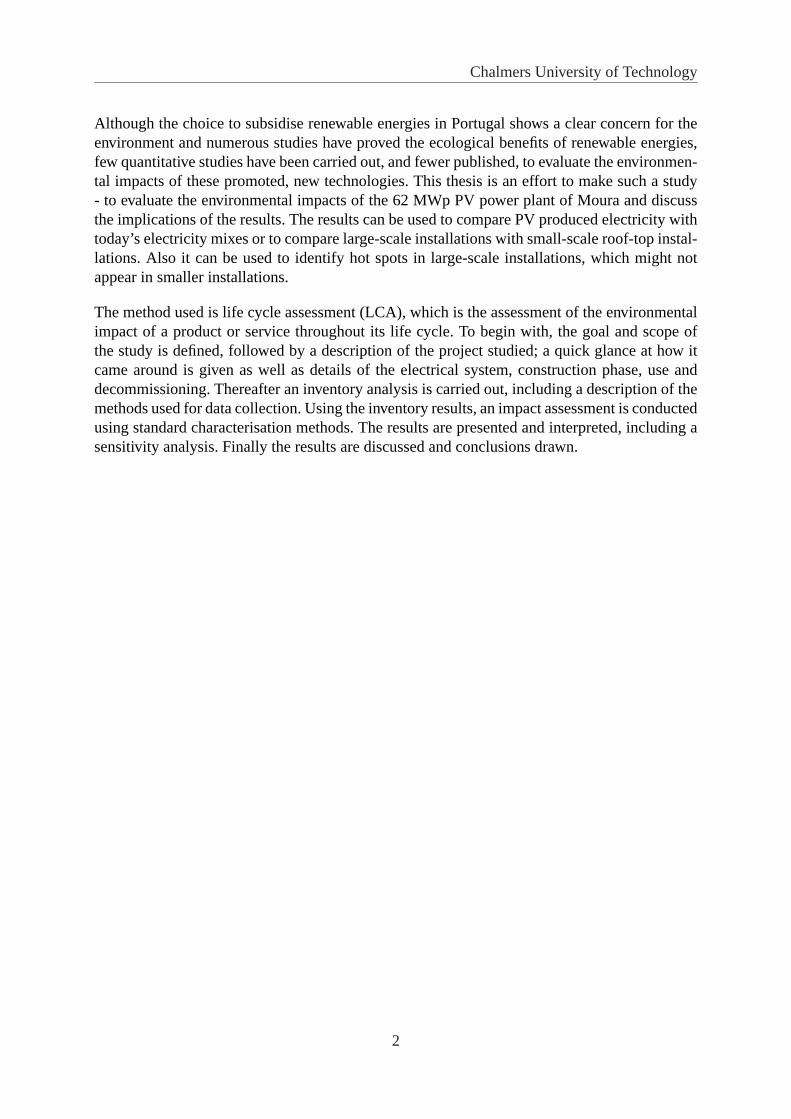
Although the choice to subsidise renewable energies in Portugal shows a clear concern for theenvironment and numerous studies have proved the ecological benefits of renewable energies,few quantitative studies have been carried out, and fewer published, to evaluate the environmen-tal impacts of these promoted, new technologies. This thesis is an effort to make such a study- to evaluate the environmental impacts of the 62 MWp PV power plant of Moura and discussthe implications of the results. The results can be used to compare PV produced electricity withtoday’s electricity mixes or to compare large-scale installations with small-scale roof-top instal-lations. Also it can be used to identify hot spots in large-scale installations, which might notappear in smaller installations.
The method used is life cycle assessment (LCA), which is the assessment of the environmentalimpact of a product or service throughout its life cycle. To begin with, the goal and scope ofthe study is defined, followed by a description of the project studied; a quick glance at how itcame around is given as well as details of the electrical system, construction phase, use anddecommissioning. Thereafter an inventory analysis is carried out, including a description of themethods used for data collection. Using the inventory results, an impact assessment is conductedusing standard characterisation methods. The results are presented and interpreted, including asensitivity analysis. Finally the results are discussed and conclusions drawn.
2
2 GOAL AND SCOPE Chalmers University of Technology
2 Goal and scope
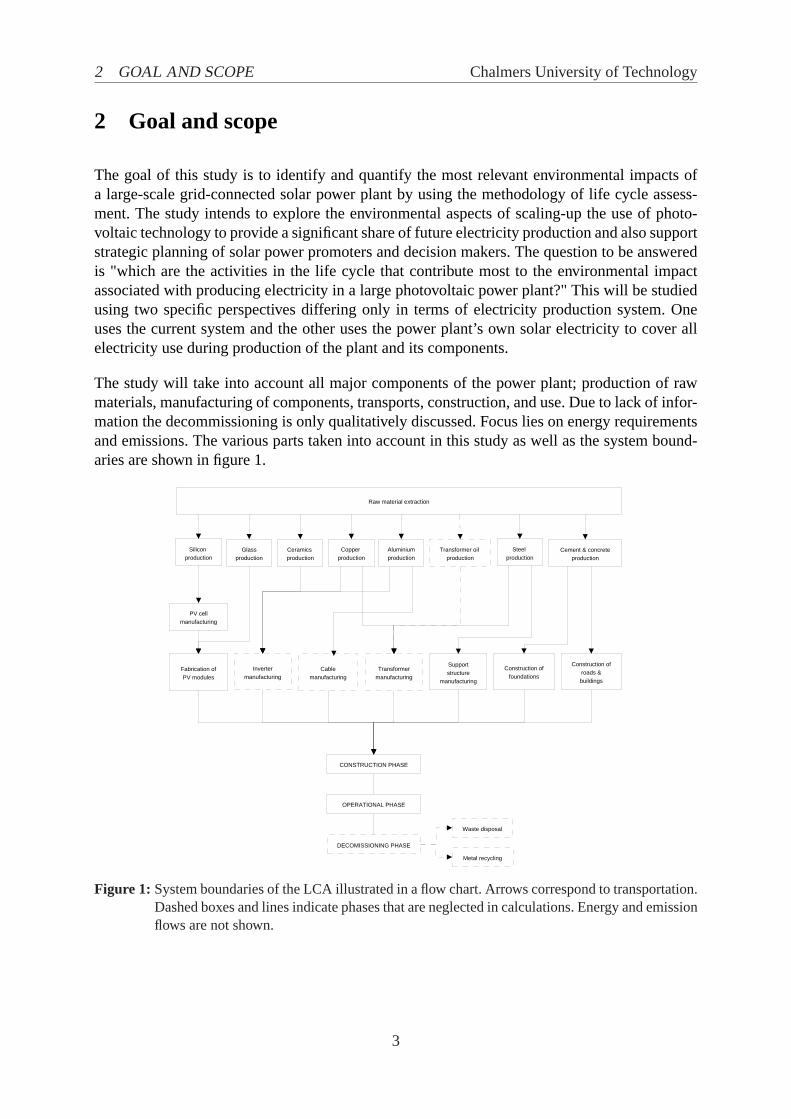
The goal of this study is to identify and quantify the most relevant environmental impacts ofa large-scale grid-connected solar power plant by using the methodology of life cycle assess-ment. The study intends to explore the environmental aspects of scaling-up the use of photo-voltaic technology to provide a significant share of future electricity production and also supportstrategic planning of solar power promoters and decision makers. The question to be answeredis "which are the activities in the life cycle that contribute most to the environmental impactassociated with producing electricity in a large photovoltaic power plant?" This will be studiedusing two specific perspectives differing only in terms of electricity production system. Oneuses the current system and the other uses the power plant’s own solar electricity to cover allelectricity use during production of the plant and its components.
The study will take into account all major components of the power plant; production of rawmaterials, manufacturing of components, transports, construction, and use. Due to lack of infor-mation the decommissioning is only qualitatively discussed. Focus lies on energy requirementsand emissions. The various parts taken into account in this study as well as the system bound-aries are shown in figure 1.
Raw material extraction
PV cellmanufacturing
Fabrication ofPV modules
Construction ofroads &buildings
Construction offoundations
Invertermanufacturing
Supportstructure
manufacturing
Copper production
Aluminiumproduction
Steel production
Cement & concreteproduction
Silicon production
Ceramics production
CONSTRUCTION PHASE
OPERATIONAL PHASE
DECOMISSIONING PHASE
Waste disposal
Metal recycling
Glassproduction
Cablemanufacturing
Transformermanufacturing
Transformer oil production
Figure 1: System boundaries of the LCA illustrated in a flow chart. Arrows correspond to transportation.Dashed boxes and lines indicate phases that are neglected in calculations. Energy and emissionflows are not shown.
3
Chalmers University of Technology
3 Project description
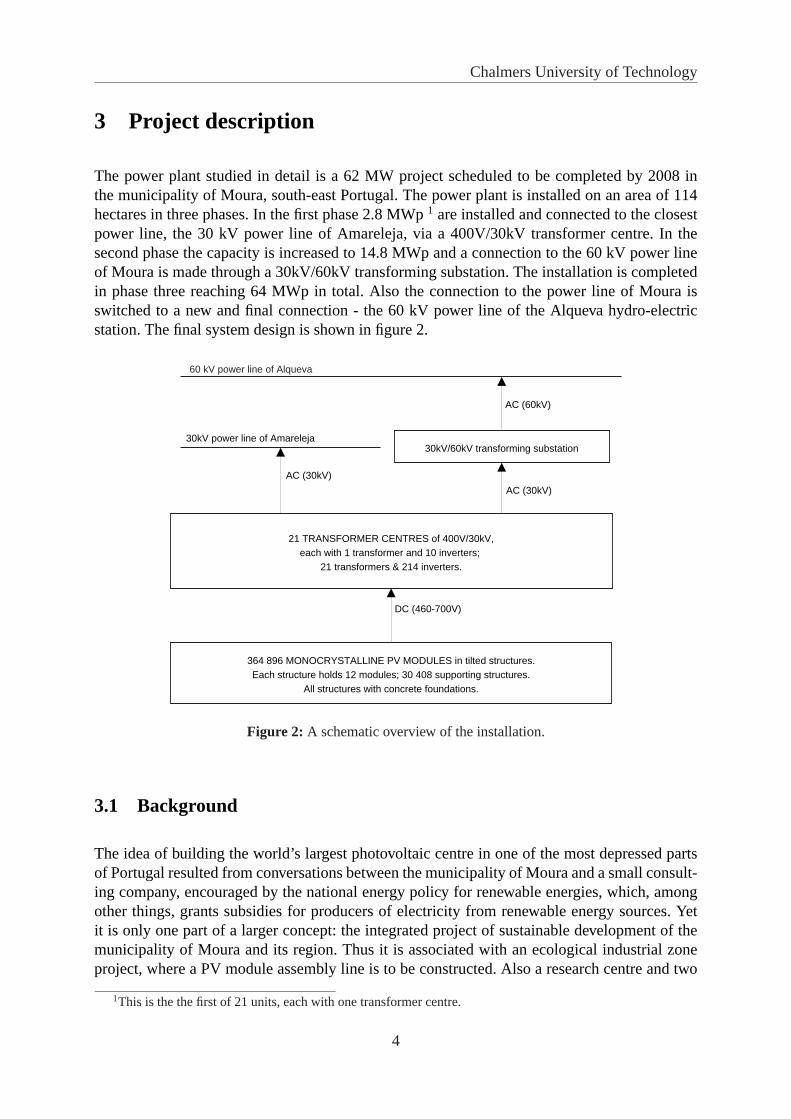
The power plant studied in detail is a 62 MW project scheduled to be completed by 2008 inthe municipality of Moura, south-east Portugal. The power plant is installed on an area of 114hectares in three phases. In the first phase 2.8 MWp1 are installed and connected to the closestpower line, the 30 kV power line of Amareleja, via a 400V/30kV transformer centre. In thesecond phase the capacity is increased to 14.8 MWp and a connection to the 60 kV power lineof Moura is made through a 30kV/60kV transforming substation. The installation is completedin phase three reaching 64 MWp in total. Also the connection to the power line of Moura isswitched to a new and final connection - the 60 kV power line of the Alqueva hydro-electricstation. The final system design is shown in figure 2.
60 kV power line of Alqueva
364 896 MONOCRYSTALLINE PV MODULES in tilted structures.Each structure holds 12 modules; 30 408 supporting structures.
All structures with concrete foundations.
21 TRANSFORMER CENTRES of 400V/30kV,each with 1 transformer and 10 inverters;
21 transformers & 214 inverters.
30kV/60kV transforming substation30kV power line of Amareleja
DC (460-700V)
AC (30kV)
AC (30kV)
AC (60kV)
Figure 2: A schematic overview of the installation.
3.1 Background
The idea of building the world’s largest photovoltaic centre in one of the most depressed partsof Portugal resulted from conversations between the municipality of Moura and a small consult-ing company, encouraged by the national energy policy for renewable energies, which, amongother things, grants subsidies for producers of electricity from renewable energy sources. Yetit is only one part of a larger concept: the integrated project of sustainable development of themunicipality of Moura and its region. Thus it is associated with an ecological industrial zoneproject, where a PV module assembly line is to be constructed. Also a research centre and two
1This is the the first of 21 units, each with one transformer centre.
4
3 PROJECT DESCRIPTION Chalmers University of Technology
projects of residential areas provided with solar energy are planned. A large hydro-electric cen-tre, the Alqueva dam, has already been constructed in 2000, used both for electricity productionand, maybe even more importantly for this region, irrigation.
The total cost of the power plant is estimated to be 250 million euros. Partners are thereforeneeded. The largest of them are an international consultancy company and a national bank, butsmaller investors are also taking part via stock exchange.
The project employs about 120 persons during construction phase and about 30 will be em-ployed for maintenance. However, the indirect employment may be a more important factor in aregion with high unemployment rates such as the Moura district. This is estimated to be aroundone thousand jobs, mainly in the PV module factory created to supply 90 percent of the modulesfor the installation, and thereafter nationwide or even for export.
3.2 Location
The power plant is built in Amareleja, a parish of the municipality of Moura (approximately17 000 habitants) in South-East Portugal. This region in general is characterised by a temperateclimate with typically mesothermic rainy winters and mediterranean hot, dry summers. How-ever, the interior areas often lack abundant rains during autumn and winter and suffer repeatedlyfrom agricultural crises. The annual average temperature is16 ◦C ranging between an average of9 ◦C in January and24 ◦C in July and August. Minimum and maximum temperatures, however,range between−7 ◦C and over40 ◦C over the year.
The main reasons for choosing this location are:
• availability of a suitable land-area close to habitation but without too much sloping orvegetation,
• prior approval of the city council of the municipality of Moura for the location of theproject,
• existence of potential for photovoltaic power production that confirms economic viabilityof the enterprise.
3.3 System specification
The photovoltaic power plant of Moura is a grid-connected62 MW installation utilising monocrys-talline silicon cells produced in Spain. However, only ten percent of the modules will be assem-bled in Spain; a new assembly line for modules is to be constructed in Moura during phase Iof the project where the remaining90% are to be assembled. The installation consists of thefollowing components:
5
3.3 System specification Chalmers University of Technology
• 1 monitoring and control system,
• 1 transforming substation, 30kV/60kV,
• 21 transforming centres, 400V/30kV,
• 207 inverters of 400kW,
• 30 408 support structures made of galvanised steel,
• 364 896 monocrystalline modules (12 modules per support structure),
• 20 000 m electric power cables,
• 34 000 m3 concrete.
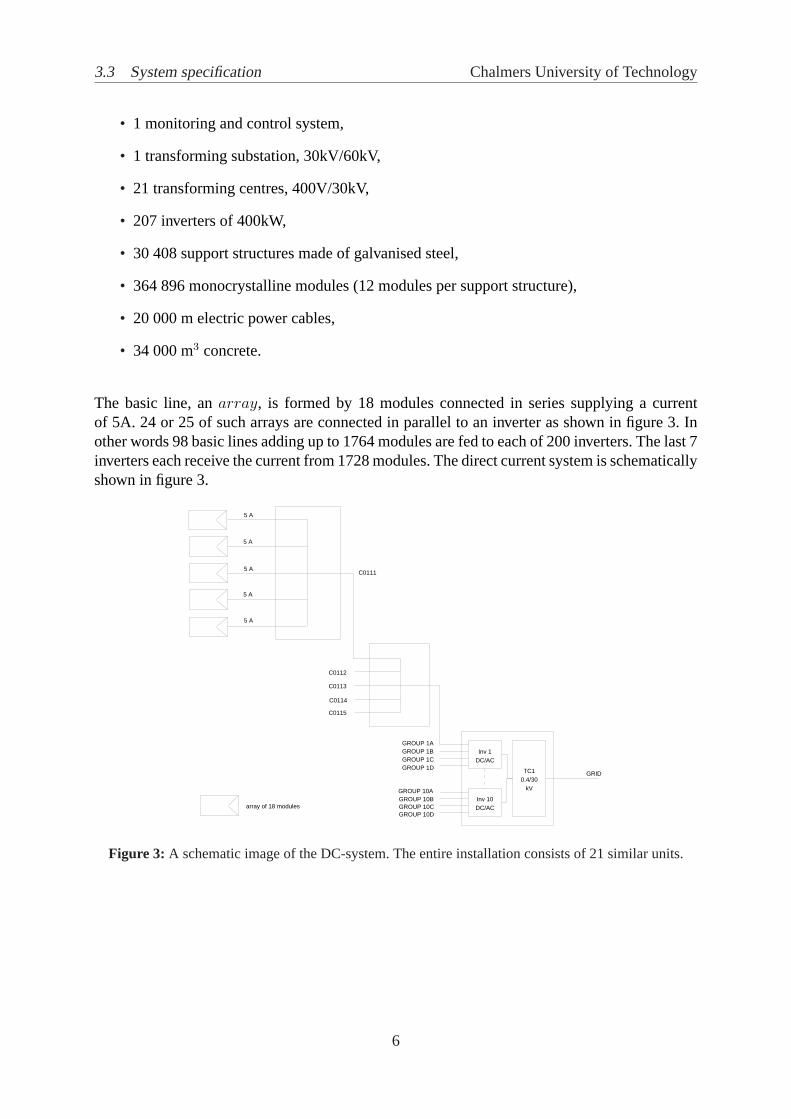
The basic line, anarray, is formed by 18 modules connected in series supplying a currentof 5A. 24 or 25 of such arrays are connected in parallel to an inverter as shown in figure 3. Inother words 98 basic lines adding up to 1764 modules are fed to each of 200 inverters. The last 7inverters each receive the current from 1728 modules. The direct current system is schematicallyshown in figure 3.
5 A
5 A
5 A
5 A
5 A
C0111
C0112
C0113
C0114
C0115
TC10.4/30
kV
Inv 1DC/AC
Inv 10DC/AC
GROUP 1A
GROUP 1DGROUP 1CGROUP 1B
GROUP 10DGROUP 10CGROUP 10BGROUP 10A
array of 18 modules
GRID
Figure 3: A schematic image of the DC-system. The entire installation consists of 21 similar units.
6
3 PROJECT DESCRIPTION Chalmers University of Technology
The AC system consists of 21 transformer centres (TC) with the following characteristics:
• TC1
– Input: 10 inverters of 400 kW each.
– Function: Direct connection to 30kV grid.
– Quantity: 1
• TC2 - TC20
– Input: 10 inverters of 400 kW each.
– Function: Interconnected to other TCs and finally to a transformer substation (TS)that functions as protection before the distribution grid and as a monitoring unit.
– Quantity: 19
• TC21
– Input: 7 inverters of 400 kW each.
– Function: Interconnected to other TCs and finally to the transformer substation.
– Quantity: 1
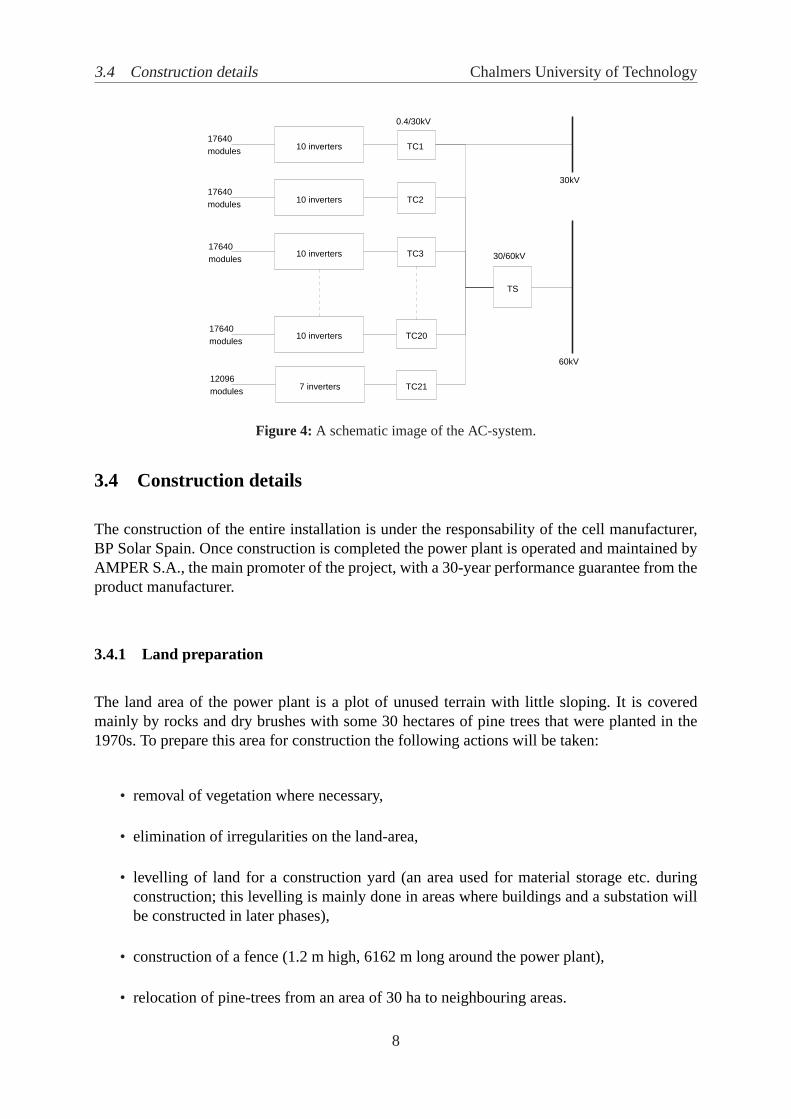
In phase I the first transformer centre is utilised. Thereafter the transformer centres 2 to 6 areconstructed in phase II. Finally in the largest expansion of the installation, in phase III, the re-maining transformer centres, 7 to 21, are installed. The TCs are connected internally by a 30 kVsubterranean power line; TC2–TC21 are connected to the 30kV/60kV transformer substationdistributing electricity to the 60kV power line of Alqueva, whereas TC1 remains connected tothe 30 kV line of Amareleja, as shown in figure 4.
7
3.4 Construction details Chalmers University of Technology
10 inverters
10 inverters
10 inverters
10 inverters
7 inverters
TC1
TC2
TC3
TC20
TC21
TS
17640modules
17640modules
17640modules
17640modules
12096modules
0.4/30kV
30/60kV
30kV
60kV
Figure 4: A schematic image of the AC-system.
3.4 Construction details
The construction of the entire installation is under the responsability of the cell manufacturer,BP Solar Spain. Once construction is completed the power plant is operated and maintained byAMPER S.A., the main promoter of the project, with a 30-year performance guarantee from theproduct manufacturer.
3.4.1 Land preparation
The land area of the power plant is a plot of unused terrain with little sloping. It is coveredmainly by rocks and dry brushes with some 30 hectares of pine trees that were planted in the1970s. To prepare this area for construction the following actions will be taken:
• removal of vegetation where necessary,
• elimination of irregularities on the land-area,
• levelling of land for a construction yard (an area used for material storage etc. duringconstruction; this levelling is mainly done in areas where buildings and a substation willbe constructed in later phases),
• construction of a fence (1.2 m high, 6162 m long around the power plant),
• relocation of pine-trees from an area of 30 ha to neighbouring areas.
8
3 PROJECT DESCRIPTION Chalmers University of Technology
3.4.2 Improvement and construction of roads
Roads to access the construction site will be improved and approximately 5 km of 8 meterswide new roads constructed on site. Also a drainage system will be constructed along the roads.
3.4.3 Excavations for foundations and trenches
Each structure of 12 modules needs foundations and each structure shares legs as well as thefoundation with the neighbouring structure. The foundations are made on site using a mobileconcrete mill. Assuming about1m3 soil is removed for each foundation a total of33000m3 willbe excavated for foundations. This soil will be either reused in construction or for leveling theland-area.
A total of 5641 m of trench will be excavated for cables; 5089 m, 299 m and 253 m with depthsof 50 cm, 80 cm and 100 cm respectively.
3.4.4 Construction of buildings
22 buildings will be constructed for the transformer centres. 20 of them will contain ten invert-ers and a transformer, whereas one will just have 7 inverters and a transformer. The last one willbe for the transformer substation. All buildings will be constructed from local building mate-rials; bricks and cement and have approximately the dimension4m(height) × 6m(width) ×16m(length) occupying an area of210m2 each.
3.4.5 Installation of the solar panels
The solar panels will be placed in lines with 8 meters in between. They will be secured inoptimal inclination as to capture the maximum solar radiation. Parts of the area levelled outtemporarily for construction and material storage may be used for buildings. The rest is plannedto be brought back to its original form and be covered with solar panels in later phases.
3.4.6 Exploitation and decommissioning
The power plant will in principle function autonomously requiring little maintenance. The mod-ules will be cleaned twice a year with stored rainwater. Also the inverters and transformers willneed regular maintenance. System check-ups will be carried out in randomly chosen parts ofthe installation in order to verify module efficiencies. The monitoring system will automaticallyalert of any anomaly in the function of the system and any malfunction can thus be accordinglyattended to. The estimated life-time of the power plant is 30 years according to manufacturerspecifications.
9

3.4 Construction details Chalmers University of Technology
What exactly will happen to the installation at the end of its official life time, when the contractwith the utility - as well as the subsidy scheme - ends, is still unclear. Possibly the power plantwill stay in place for a much longer time. Possibly the modules will eventually be recycled bythe manufacturer and replaced by new, more efficient modules. It is also possible that some ofthe replaced modules are sold further in second hand. One can assume, however, that at the endof the life cycle the installation will be dismantled, metals recycled and the rest landfilled.
10
4 METHODS AND DATA COLLECTION Chalmers University of Technology
4 Methods and data collection
Data is collected primarily from existing LCAs for raw material production, component manu-facturers - environmental reports or correspondence via email - and project managers. As oftensite-specific information is unavailable, national or European statistics are used and accordinglystated.
The most dominant life cycle stages for stationary inert products without intrinsic energy re-quirements during use - such as cables, inverters, support structures etc. - are raw materialacquisition and processing (Hanssen, 1998). Therefore the environmental load from the manu-facturing of balance of system components is neglected. This is also a systematic choice due tothe lack of reliable data for the manufacturing stages.
The environmental load from transportation is estimated from information from project man-agers on where components and material are ordered from, and data on energy requirementsand emissions is retrieved from the Network for Transport and the Environment (NMT 2002).
Fuel consumption in vehicles and corresponding emissions are included as well as energy re-quirements and emissions from production and distribution of fuel. The environmental impactof construction of vehicles, roads and other infrastructure related to transportation is not in-cluded. The data used is based on fuel of environmental class 1. This gives significantly loweremissions than standard fuel, environmental class 3. The unit is based on the assumption that onthe average 70 percent of the load capacity is used in long distance transports and 50 percent inregional distribution. This implies that for LCA purposes, empty return transports are alreadyaccounted for in transportation data (Baumann and Tillman 2004).
National transportion and distances less than or equal to 500 km are assumed to be carried outby a medium sized distribution truck for regional transport. International transportation longerthan 500 km is assumed to be done by a truck with semi-trailer suited for long distance transport.All trucks are assumed to be of Euro 2 category i.e. manufactured during 1996-2000. This isthe environmentally worse alternative thus avoiding too optimistic results. All distances areestimated by Michelin Route Planner, data retrieved in August 2005.
In case 1 electricity use is taken separately from all data and handled site specifically i.e. thecountry specific electricity mix is used according to where the electricity is consumed. In case2 no electricity mixes are used as all electricity is taken from the PV installation itself.
4.1 Production of wafers
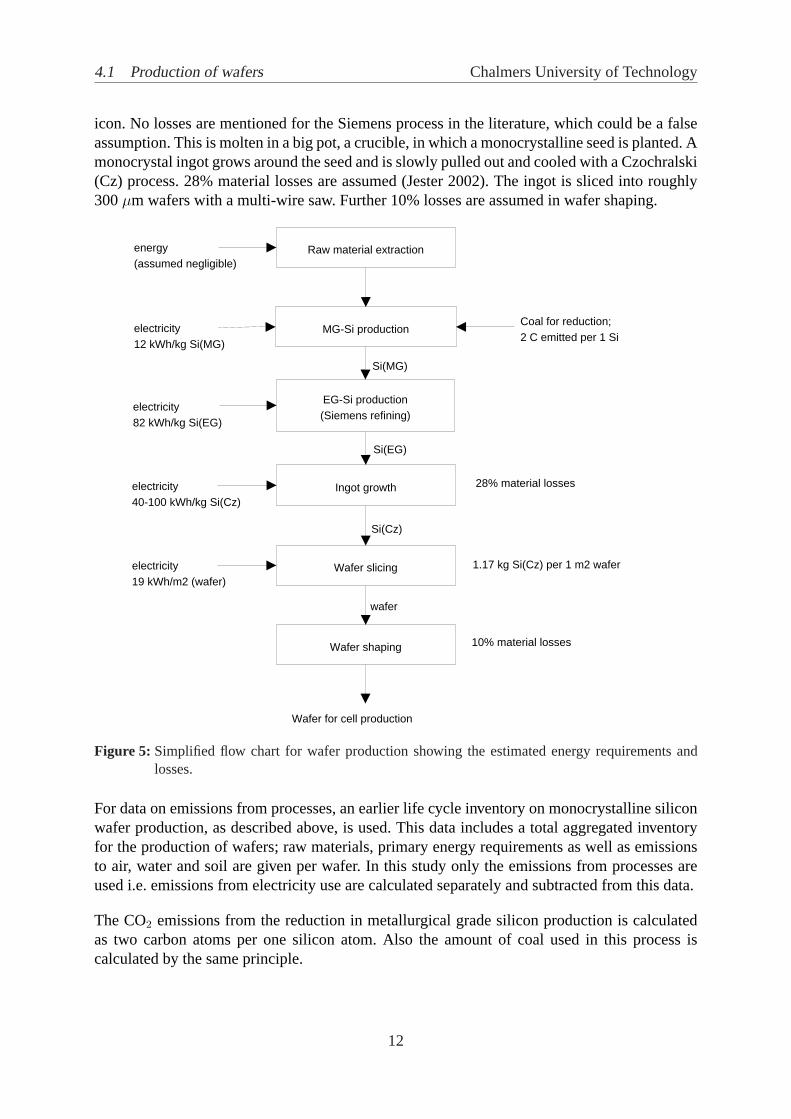
Figure 5 shows the principal steps in processing silicon to make wafers for cell production. Asquartz is a common substance on earth and easy to mine, energy use in raw material extractionis assumed small and neglected from calculations. Metallurgical grade silicon (MG-Si) is pro-duced from quartz (SiO2) in a large furnace. Coal is commonly used for reduction, a processthat emits CO2. MG-Si is converted to trichlorosilane (SiHCl3) by the "Siemens method", whichreacts with H2 in a large electric furnace producing electronic grade (EG-Si) polycrystalline sil-
11
4.1 Production of wafers Chalmers University of Technology
icon. No losses are mentioned for the Siemens process in the literature, which could be a falseassumption. This is molten in a big pot, a crucible, in which a monocrystalline seed is planted. Amonocrystal ingot grows around the seed and is slowly pulled out and cooled with a Czochralski(Cz) process. 28% material losses are assumed (Jester 2002). The ingot is sliced into roughly300µm wafers with a multi-wire saw. Further 10% losses are assumed in wafer shaping.
Wafer slicing
Raw material extraction
Wafer shaping
MG-Si production
Ingot growth
EG-Si production(Siemens refining)
Coal for reduction; 2 C emitted per 1 Si
energy(assumed negligible)
electricity12 kWh/kg Si(MG)
electricity82 kWh/kg Si(EG)
electricity40-100 kWh/kg Si(Cz)
electricity19 kWh/m2 (wafer)
Wafer for cell production
wafer
Si(Cz)
Si(MG)
Si(EG)
28% material losses
1.17 kg Si(Cz) per 1 m2 wafer
10% material losses
Figure 5: Simplified flow chart for wafer production showing the estimated energy requirements andlosses.
For data on emissions from processes, an earlier life cycle inventory on monocrystalline siliconwafer production, as described above, is used. This data includes a total aggregated inventoryfor the production of wafers; raw materials, primary energy requirements as well as emissionsto air, water and soil are given per wafer. In this study only the emissions from processes areused i.e. emissions from electricity use are calculated separately and subtracted from this data.
The CO2 emissions from the reduction in metallurgical grade silicon production is calculatedas two carbon atoms per one silicon atom. Also the amount of coal used in this process iscalculated by the same principle.
12
4 METHODS AND DATA COLLECTION Chalmers University of Technology
Energy data is retrieved from existing studies and shown in figure 5 for the various steps. Re-duction of SiO2 to MG-Si takes 12 kWhe/kgSiMG (Alsema 2003). For the Siemens process83 kWhe/kgSiEG is used (Alsema 2003). For ingot growth 40 kWhe/kgSiCz is assumed (Jester2002) and wafer slicing is assumed to require 19 kWhe/m2
wafer (Alsema 2003).
4.2 Production of cells and modules
Wafers are processed into solar cells by doping the surface, applying an anti-reflective coatingand printing contact strips that gather the power produced by the cells.
All photovoltaic cells are produced at BP Solar cell manufacturing plant in Madrid, Spain.However, only 10 percent of the modules (72 cells per module) are assembled at the manufac-turer module line in Madrid. The remaining 90 percent are to be assembled at a new modulemanufacturing plant in Moura, Portugal, in vicinity of the power plant.
As no data is yet available from the module line in Moura, all data concerning module produc-tion is retrieved from the manufacturer’s environmental report 2001, which gives quantitativeresults on emissions to air, industrial liquid effluent, hazardous and non-hazardous wastes, noiseand use of natural resources. Where units are given per MW the figures are simply multipliedwith 62 to get the corresponding figures for the 62 MW installation in study. Industrial liquideffluents are given per liter and are assumed to be related directly to water use, which in turnis given per MW. In order to quantify the emissions to air, which are given per m3 or as ppm(parts per million), in relation to MW , a standard recommended minimum ventilation volumeflow rate for factories of 5 l/s per person is used (HSE 2000). The total number of employees is396 working in three shifts. Also the production of 7.89 MW of modules per year (in 2001) isused to relate the emissions to the installation size.
Since the only natural resources given in the environmental report are electricity and water,some further assumptions have to be made. All modules have a glass cover which is assumedto be 4 mm thick and consist of ordinary float glass. Data, which includes energy use and someimpact potentials, is based on an LCA on window materials (Citherlet et al. 2000).
Ten percent of the modules, weighing 15.4 kg each, are transported from Madrid a distance of500 km. The rest 90 percent are assembled in Moura i.e. only the cells are transported fromMadrid. Their weight is estimated as the weight of the module minus the weight of the glasscovering, which seems a reasonable approximation for cells of frameless modules. This gives2.6 kg for a group of 72 cells.
According to project managers, approximately one in thirty modules in current PV projects inthe municipality supplied by the same module manufacturer have been replaced due to malfunc-tions. An equal rate is assumed for this installation. Thus a total of 377 059 modules is used incalculations, instead of 364 896.
13
4.3 Production of inverters Chalmers University of Technology
4.3 Production of inverters
As the only information available on the inverters to be used is their size (400kW), some generalestimations have to be made. The weight of each inverter is estimated to be 3000 kg assumingthe weight of inverters increases linearly by 7.5 kg per kW for large inverters (Molenbroek,2003). The inverters are assumed to have a life time of ten years, thus a factor three is used incalculations on the power plant, which is assumed to have a life time of 30 years. Inventorydata on material contents of a smaller inverter are used in same mass proportions. The materialstaken into account are copper, aluminium and ceramics, which account for 68 percent of totalmass. All materials all assumed to be produced in Germany relatively close to the manufacturingsite and no transports of raw materials from production site to the inverters’ manufacturing siteare taken in to account.
Data for copper and aluminium production is retrieved from corresponding LCAs (Sunér 1996).Data for ceramics production is retrieved from an LCA on ceramic tiles (Nicoletti et al. 2003),thus assuming that energy requirements and emissions are approximately equal for these twoapplications of ceramics.
The manufacturing of the inverters is not taken into account.
The inverters are assumed to be transported from Hamburg, Germany, by truck with semi-trailer,used for long distance transport.
4.4 Production of transformers
Similar reasoning is used for dealing with transformers as with inverters. To approximate theamounts of different materials in the transformers, an Environmental Product Declaration fromABB is used. The transformers are thus assumed to consist of steel (58.2 %), copper (12.9 %)and transformer oil (24.8 %) which together account for 96 percent of the total weight. Due tolack of data the production of transformer oil is neglected and comes in the calculations only inoil resource depletion . A life time of 15 years is assumed for the transformers.
The manufacturing of transformers is not taken into account.
The transformers are assumed to be produced in Porto, north of Portugal, and transported 530km to Amareleja. A medium sized truck common for regional transportation is used in calcula-tions.
14
4 METHODS AND DATA COLLECTION Chalmers University of Technology
4.5 Production of cables
Over 8300 kg of aluminium is used for electrical cabling. The manufacturing of cables is ne-glected due to lack of data. For aluminium production inventory data is used from an LCA ofaluminium production at a Norwegian aluminium plant. The aluminium is assumed to be pro-duced in Norway and transported 3000 km by sea to a cable manufacturer in Aveiro, in northernPortugal. Finally the cables are transported a distance of 470 km to Amareleja.
4.6 Production of support structures
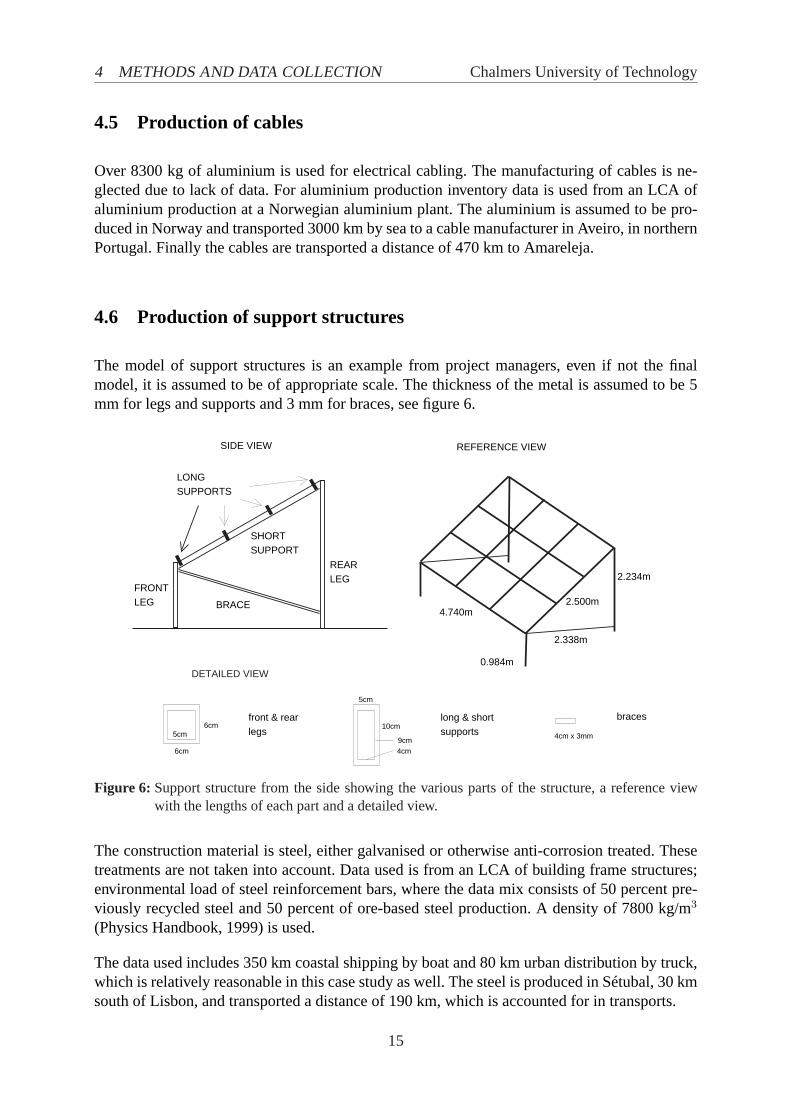
The model of support structures is an example from project managers, even if not the finalmodel, it is assumed to be of appropriate scale. The thickness of the metal is assumed to be 5mm for legs and supports and 3 mm for braces, see figure 6.
DETAILED VIEW
SIDE VIEW
BRACE
FRONTLEG
REARLEG
SHORTSUPPORT
LONGSUPPORTS
front & rearlegs
6cm
6cm5cm
braces
4cm x 3mm
long & shortsupports
10cm
5cm
4cm9cm
REFERENCE VIEW
2.234m
0.984m
2.338m
4.740m2.500m
Figure 6: Support structure from the side showing the various parts of the structure, a reference viewwith the lengths of each part and a detailed view.
The construction material is steel, either galvanised or otherwise anti-corrosion treated. Thesetreatments are not taken into account. Data used is from an LCA of building frame structures;environmental load of steel reinforcement bars, where the data mix consists of 50 percent pre-viously recycled steel and 50 percent of ore-based steel production. A density of 7800 kg/m3
(Physics Handbook, 1999) is used.
The data used includes 350 km coastal shipping by boat and 80 km urban distribution by truck,which is relatively reasonable in this case study as well. The steel is produced in Sétubal, 30 kmsouth of Lisbon, and transported a distance of 190 km, which is accounted for in transports.
15
4.7 Construction of foundations Chalmers University of Technology
4.7 Construction of foundations
For the construction of foundations approximately 33 000 m3 of soil has to be excavated andan estimated 34 000 m3 of concrete is used. Excavations are dealt with in section 4.9. In theproduction of concrete frames the main environmental impact is located in the production ofcement (T. Björklund, A-M Tillman, 1997). The concrete foundations are assumed to be ofsimilar concrete as "beam and column" concrete frames cast in situ. A general density of 2400kg/m3 is used.
The concrete is assumed to consist 30 percent of cement, which is transported from Sétubal,190 km from Amareleja. The main content is gravel or crushed rock, which is extracted locallyand not accounted for in transportation.
4.8 Construction of new roads and buildings
The new roads constructed within the power plant area are assumed to be of simple structuresince they have relatively little traffic, mainly used to access the modules and transformer cen-tres for maintenance.
Data is retrieved from an LCA on impacts of industrial by-products used in road construction(Mroueh et al. 2001). The roads constructed are assumed to be of crushed concrete in whichthe pavement thickness is reduced by using thicker layer of crushed concrete than in general.The roads are 8 m wide and consist of 80 mm asphalt pavement, a base course and a sub-baseof 200 mm crushed concrete each and a filter layer of 450 mm sand laid on an embankment of500 mm sand. The concrete is assumed to have a density of 2400 kg/m3. The data used includestransports of 10 km for asphalt and crushed concrete, 50 km for sand and 100 km for cementused for concrete production. These are probably somewhat lower values than what would berealistic for this case study.
The primary energy used in construction of the buildings is estimated to be 3 GJ/m2 buildingarea, which is an average for brick/concrete residential buildings (Nässen et al. 2005).
Also some heavy machines will be used during construction for excavations and other construc-tion work. This is neglected due to lack of information except for the construction of roads,where the use of machinery is included in the data used.
16
4 METHODS AND DATA COLLECTION Chalmers University of Technology
4.9 Electricity production
For a more comprehensive analysis the study has been made for two distinct system perspec-tives in relation to electricity production. In case 1 the case study is viewed in its actual state,with electricity use covered by the electricity mix of the corresponding country of componentproduction. In case 2, a net output approach (Jonasson, 2005), all electricity requirements overthe life cycle are taken from the electricity output of the installation itself.
4.9.1 Case 1: Current electricity supply system
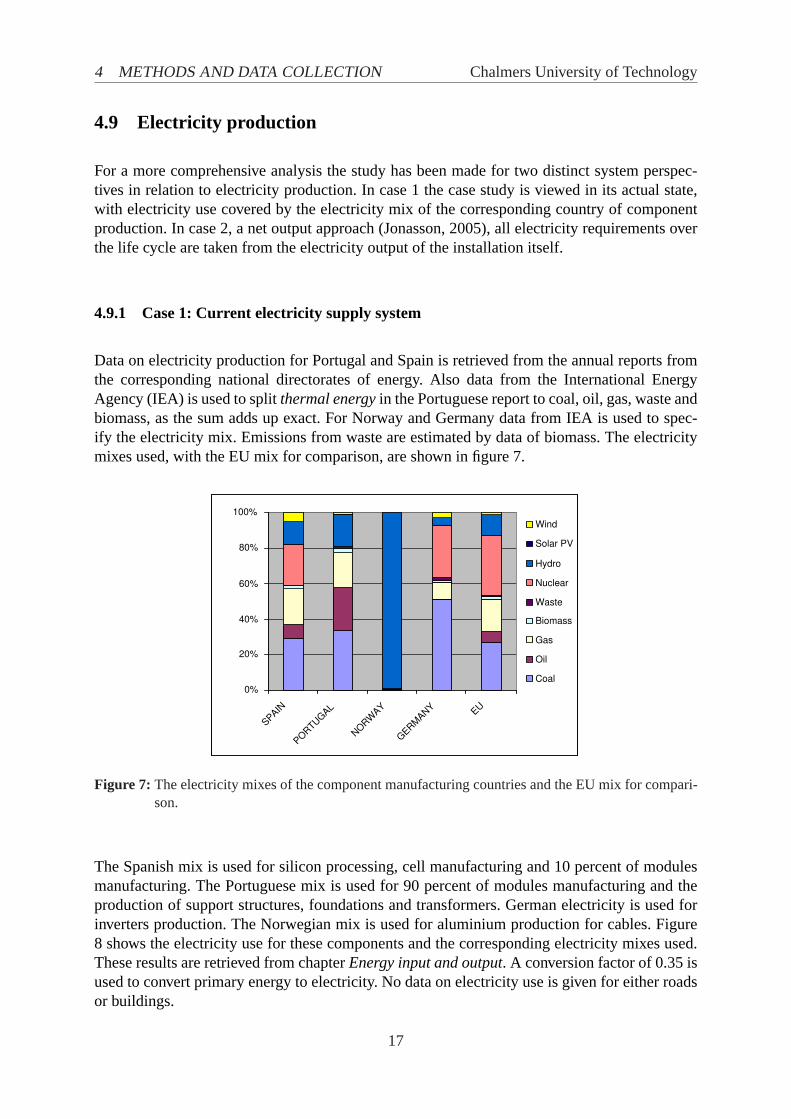
Data on electricity production for Portugal and Spain is retrieved from the annual reports fromthe corresponding national directorates of energy. Also data from the International EnergyAgency (IEA) is used to splitthermal energyin the Portuguese report to coal, oil, gas, waste andbiomass, as the sum adds up exact. For Norway and Germany data from IEA is used to spec-ify the electricity mix. Emissions from waste are estimated by data of biomass. The electricitymixes used, with the EU mix for comparison, are shown in figure 7.
0%
20%
40%
60%
80%
100%
SPAIN
PORTU
GAL
NORW
AY
GER
MAN
Y EU
Wind
Solar PV
Hydro
Nuclear
Waste
Biomass
Gas
Oil
Coal
Figure 7: The electricity mixes of the component manufacturing countries and the EU mix for compari-son.
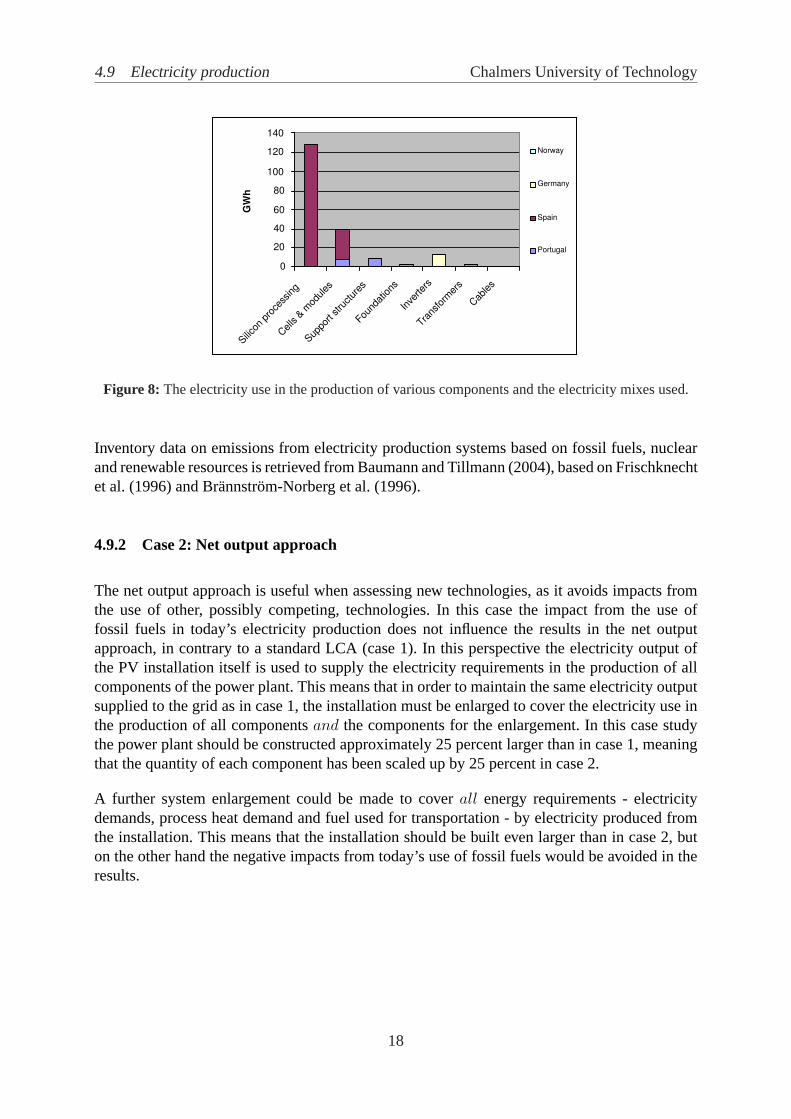
The Spanish mix is used for silicon processing, cell manufacturing and 10 percent of modulesmanufacturing. The Portuguese mix is used for 90 percent of modules manufacturing and theproduction of support structures, foundations and transformers. German electricity is used forinverters production. The Norwegian mix is used for aluminium production for cables. Figure8 shows the electricity use for these components and the corresponding electricity mixes used.These results are retrieved from chapterEnergy input and output. A conversion factor of 0.35 isused to convert primary energy to electricity. No data on electricity use is given for either roadsor buildings.
17
4.9 Electricity production Chalmers University of Technology
0
20
40
60
80
100
120
140
Silicon
pro
cess
ing
Cells &
mod
ules
Suppo
rt stru
ctur
es
Found
ations
Inve
rters
Trans
form
ers
Cab
les
GW
h
Norway
Germany
Spain
Portugal
Figure 8: The electricity use in the production of various components and the electricity mixes used.
Inventory data on emissions from electricity production systems based on fossil fuels, nuclearand renewable resources is retrieved from Baumann and Tillmann (2004), based on Frischknechtet al. (1996) and Brännström-Norberg et al. (1996).
4.9.2 Case 2: Net output approach
The net output approach is useful when assessing new technologies, as it avoids impacts fromthe use of other, possibly competing, technologies. In this case the impact from the use offossil fuels in today’s electricity production does not influence the results in the net outputapproach, in contrary to a standard LCA (case 1). In this perspective the electricity output ofthe PV installation itself is used to supply the electricity requirements in the production of allcomponents of the power plant. This means that in order to maintain the same electricity outputsupplied to the grid as in case 1, the installation must be enlarged to cover the electricity use inthe production of all componentsand the components for the enlargement. In this case studythe power plant should be constructed approximately 25 percent larger than in case 1, meaningthat the quantity of each component has been scaled up by 25 percent in case 2.
A further system enlargement could be made to coverall energy requirements - electricitydemands, process heat demand and fuel used for transportation - by electricity produced fromthe installation. This means that the installation should be built even larger than in case 2, buton the other hand the negative impacts from today’s use of fossil fuels would be avoided in theresults.
18
4 METHODS AND DATA COLLECTION Chalmers University of Technology
4.10 Inventory summary
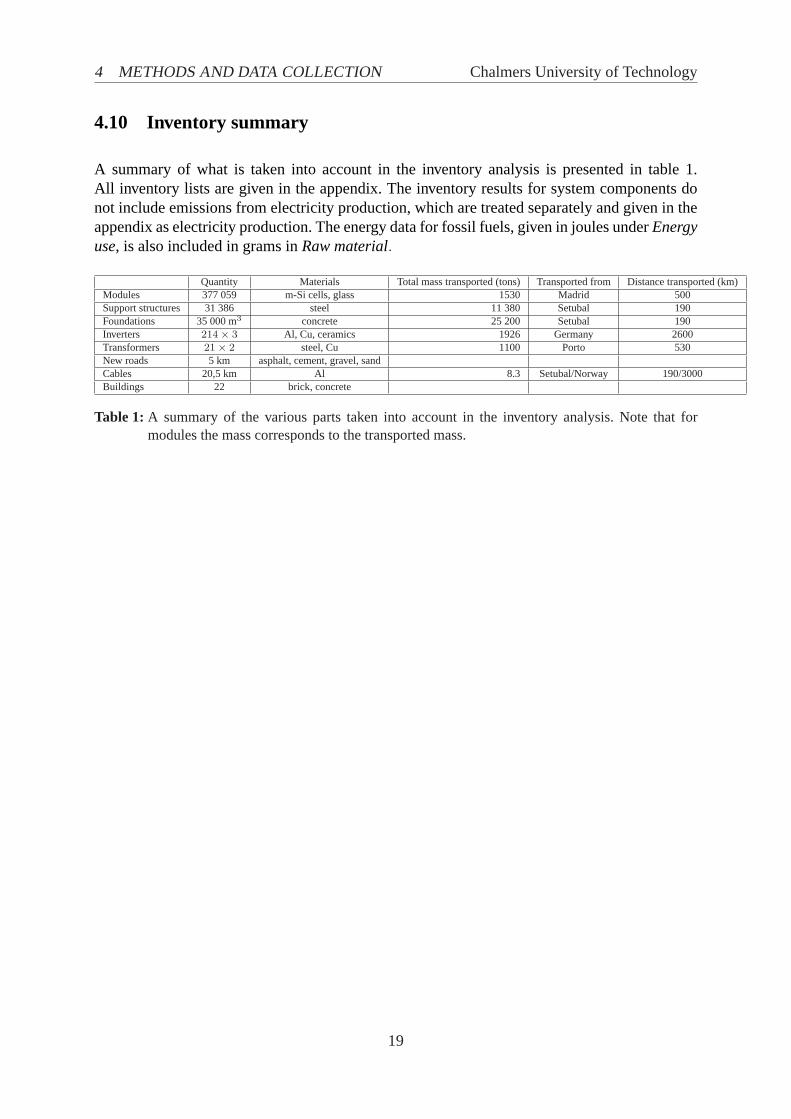
A summary of what is taken into account in the inventory analysis is presented in table 1.All inventory lists are given in the appendix. The inventory results for system components donot include emissions from electricity production, which are treated separately and given in theappendix as electricity production. The energy data for fossil fuels, given in joules underEnergyuse, is also included in grams inRaw material.
Quantity Materials Total mass transported (tons) Transported from Distance transported (km)Modules 377 059 m-Si cells, glass 1530 Madrid 500Support structures 31 386 steel 11 380 Setubal 190Foundations 35 000 m3 concrete 25 200 Setubal 190Inverters 214× 3 Al, Cu, ceramics 1926 Germany 2600Transformers 21× 2 steel, Cu 1100 Porto 530New roads 5 km asphalt, cement, gravel, sandCables 20,5 km Al 8.3 Setubal/Norway 190/3000Buildings 22 brick, concrete
Table 1: A summary of the various parts taken into account in the inventory analysis. Note that formodules the mass corresponds to the transported mass.
19
Chalmers University of Technology
5 Energy input and output
Although energy is accounted for in the inventories both in raw materials and emissions it ishere presented in energy units for a more comprehensive analysis.
5.1 Energy requirements
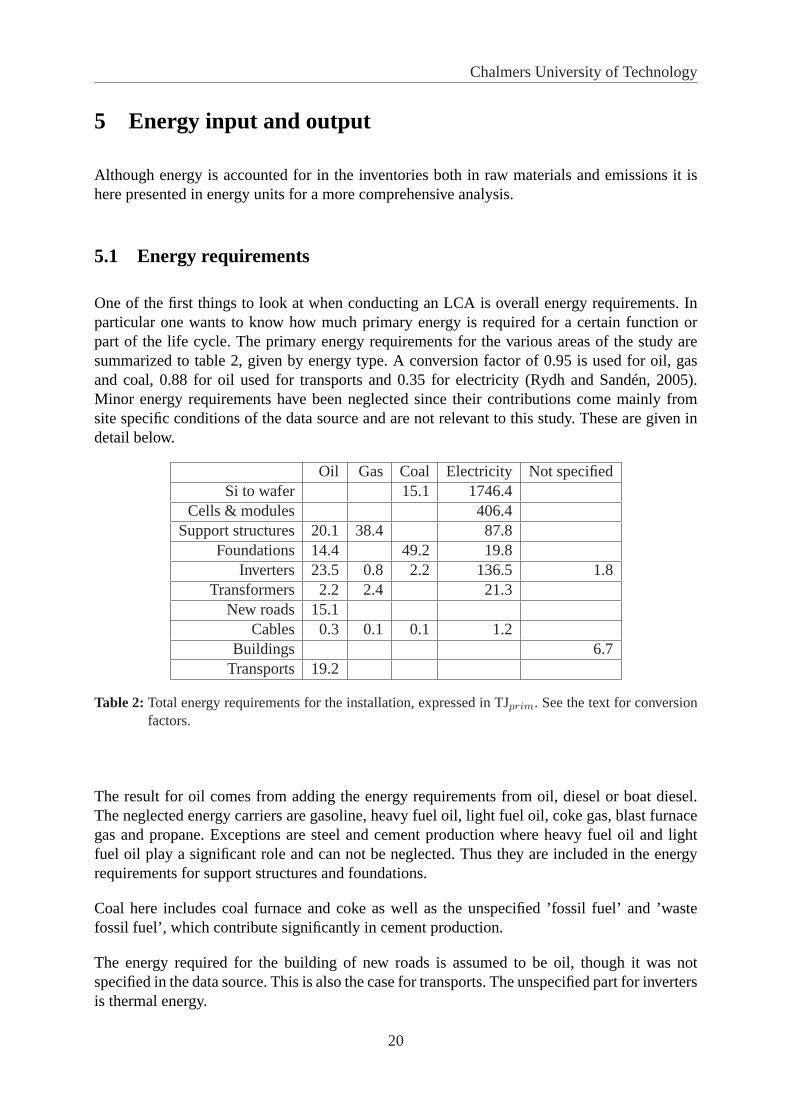
One of the first things to look at when conducting an LCA is overall energy requirements. Inparticular one wants to know how much primary energy is required for a certain function orpart of the life cycle. The primary energy requirements for the various areas of the study aresummarized to table 2, given by energy type. A conversion factor of 0.95 is used for oil, gasand coal, 0.88 for oil used for transports and 0.35 for electricity (Rydh and Sandén, 2005).Minor energy requirements have been neglected since their contributions come mainly fromsite specific conditions of the data source and are not relevant to this study. These are given indetail below.
Oil Gas Coal Electricity Not specifiedSi to wafer 15.1 1746.4
Cells & modules 406.4Support structures 20.1 38.4 87.8
Foundations 14.4 49.2 19.8Inverters 23.5 0.8 2.2 136.5 1.8
Transformers 2.2 2.4 21.3New roads 15.1
Cables 0.3 0.1 0.1 1.2Buildings 6.7
Transports 19.2
Table 2: Total energy requirements for the installation, expressed in TJprim. See the text for conversionfactors.
The result for oil comes from adding the energy requirements from oil, diesel or boat diesel.The neglected energy carriers are gasoline, heavy fuel oil, light fuel oil, coke gas, blast furnacegas and propane. Exceptions are steel and cement production where heavy fuel oil and lightfuel oil play a significant role and can not be neglected. Thus they are included in the energyrequirements for support structures and foundations.
Coal here includes coal furnace and coke as well as the unspecified ’fossil fuel’ and ’wastefossil fuel’, which contribute significantly in cement production.
The energy required for the building of new roads is assumed to be oil, though it was notspecified in the data source. This is also the case for transports. The unspecified part for invertersis thermal energy.
20
5 ENERGY INPUT AND OUTPUT Chalmers University of Technology
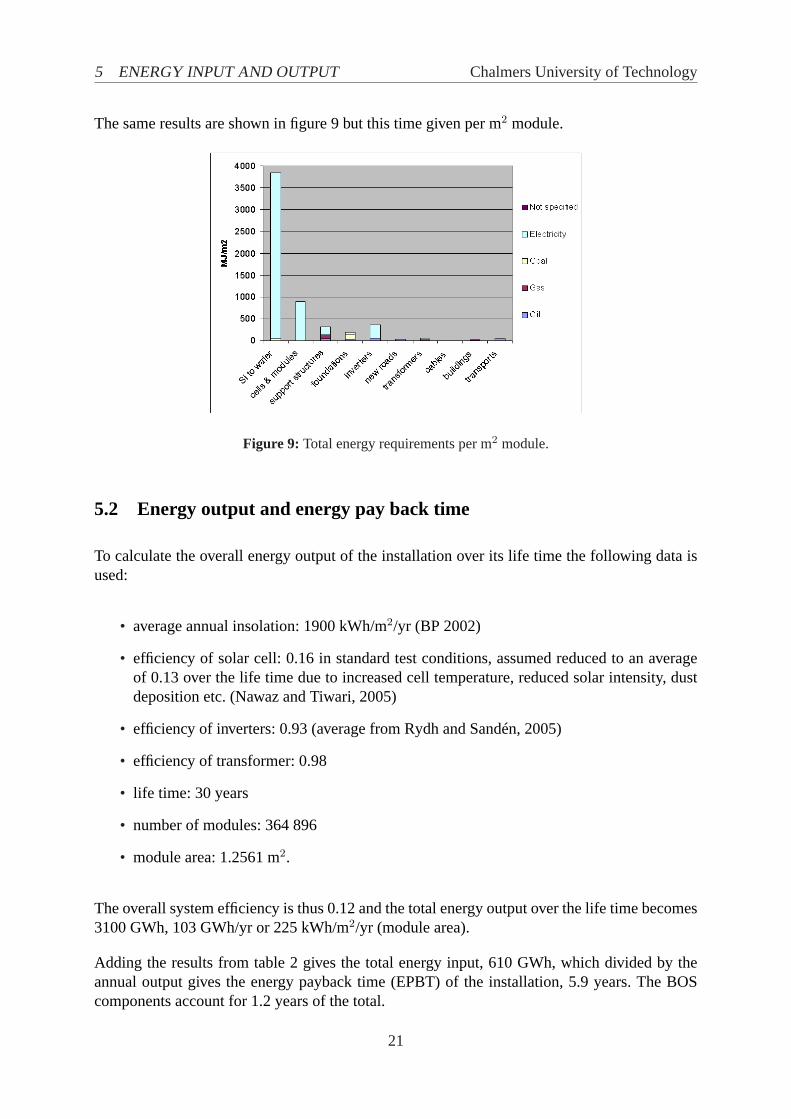
The same results are shown in figure 9 but this time given per m2 module.
Figure 9: Total energy requirements per m2 module.
5.2 Energy output and energy pay back time
To calculate the overall energy output of the installation over its life time the following data isused:
• average annual insolation: 1900 kWh/m2/yr (BP 2002)
• efficiency of solar cell: 0.16 in standard test conditions, assumed reduced to an averageof 0.13 over the life time due to increased cell temperature, reduced solar intensity, dustdeposition etc. (Nawaz and Tiwari, 2005)
• efficiency of inverters: 0.93 (average from Rydh and Sandén, 2005)
• efficiency of transformer: 0.98
• life time: 30 years
• number of modules: 364 896
• module area: 1.2561 m2.
The overall system efficiency is thus 0.12 and the total energy output over the life time becomes3100 GWh, 103 GWh/yr or 225 kWh/m2/yr (module area).
Adding the results from table 2 gives the total energy input, 610 GWh, which divided by theannual output gives the energy payback time (EPBT) of the installation, 5.9 years. The BOScomponents account for 1.2 years of the total.
21
5.2 Energy output and energy pay back time Chalmers University of Technology
Comparing EPBTs from other studies can be difficult due to different reference systems consid-ered, different system specifications and climatic conditions. The EPBT for this installation is10-13 years lower than some results for stand alone PV systems with BOS included (Nawaz andTiwari, 2005). The main reason for the difference is the battery system included in the study. Onthe other hand another study gives an EPBT of 6.74 years for a 2.7 kWp monocrystalline solarPV system (Kannan et al., 2005). Furthermore, significantly lower EPBTs can be expected inthe future with advanced silicon technologies (Alsema and Wild-Scholten, 2004), which givean EPBT of 1.2–2.8 years for grid-connected PV modules in South-Europe, whereas this casestudy is based on standard technologies. This indicates that the EPBT of BOS components ina PV system will account for a significant part in the total EPBT when more energy efficienttechnologies are used in cell production.
22
6 IMPACT ASSESSMENT Chalmers University of Technology
6 Impact Assessment
In an impact assessment the environmental loads quantified in an inventory analysis are "trans-lated" to impacts such as acidification or ozone depletion. This makes the results more compre-hensible and easier to communicate. In LCAs the fates of the pollutants are often not considereddue to long and/or complicated cause-effect chains. This is why global problems are better dealtwith than local impacts. This also means that what is described is thepotential impactratherthan an actual effect.
This study follows the guidelines of the Centre of Environmental Science at Leiden University(CML) which are based on ISO 14042 standard.
6.1 Impact categories definition and classification
The categories evaluated are depletion of abiotic resources, impact of land use, ecotoxicity(aquatic fresh water and terrestrial), human toxicity, climate change, stratospheric ozone deple-tion, photo-oxidant formation, acidification and eutrophication.
Before the substances are assigned to impact categories, the entire list is compared to CMLscharacterisation factors. The substances that do not have characterisation factors are eliminated,see "substances without characterisation factors" in the complete list of substances in the ap-pendix. The remaining substances are then classified to their corresponding impact categories.
6.2 Characterisation methods and data reliability
In a characterisation the environmental impacts are quantified in terms of a common unit foreach category resulting in a single score: anindicator result or a category indicator. Thewhole set of category indicators then gives theenvironmental profile of the LCA (CML2004).
A problem-oriented approach with the baseline characterisation method, recommended by CMLas the current best available practice for the impact category in question, is used throughout thecharacterisation.
Data retrieved from verified LCAs is in general considered reliable. One must remember, though,that the LCAs used for aluminium and copper production were made for Scandinavian produc-tion plants in 1996, which means that it is probably not site-specific (though the aluminiumproducer’s Portuguese distributor is indeed the largest company in its area in the country). Fora general starting point they can be considered sufficiently good sources. The LCAs for roadconstruction and ceramics production, however, only state the most relevant substances and in-terventions, which in a more detailed study could need a deeper investigation. The data used forsilicon production is detailed for a certain case study and does not represent this case in partic-ular and should be taken as approximative. Steel and concrete production data is also reliable
23
6.3 Characterisation results Chalmers University of Technology
in its source (a site specific study in Sweden), but adapted to different circumstances can givesome uncertainty in the results. All quantities are site specific and the results are thus valid foran installation of this size.
6.3 Characterisation results
To give an overview of the characterisation the chapter is begun with a summary of results. Moredetailed results for each category are then presented for further analysis. Also a short descriptionof each impact category is presented. Both perspectives, cases 1 and 2, are presented in parallelfor comparison.
6.3.1 Summary of characterisation
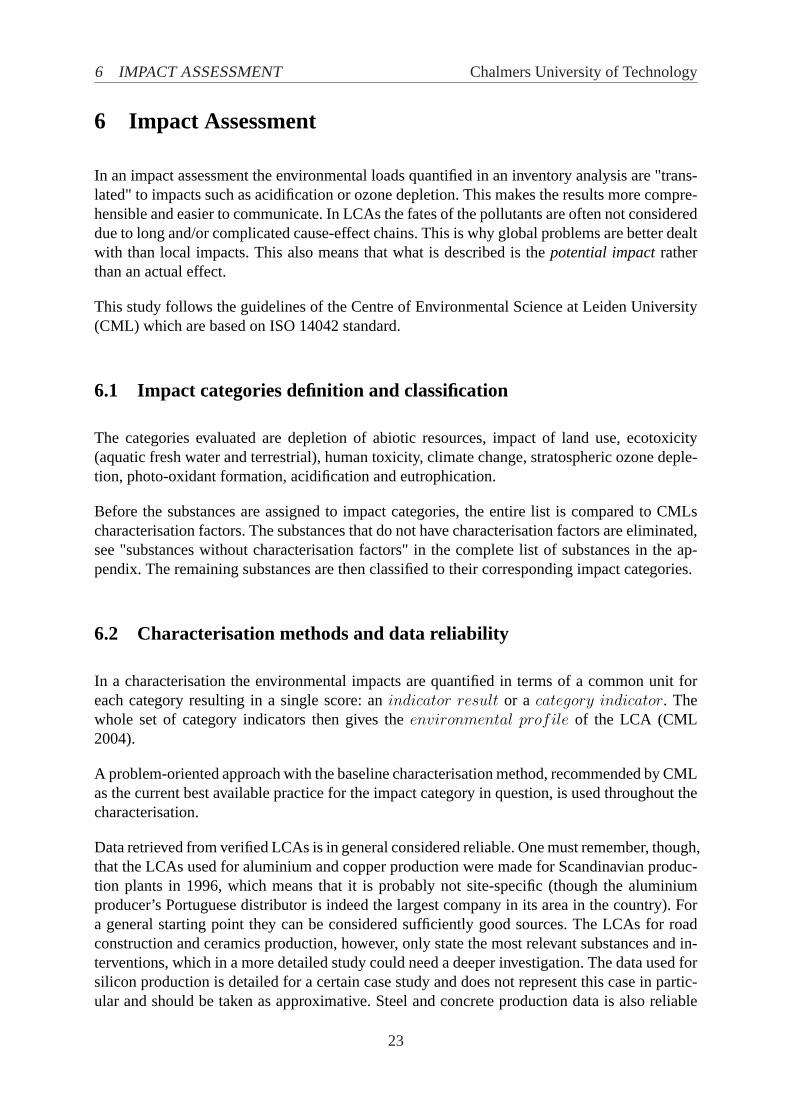
The results of the characterisation are gathered in figure 10. Silicon processing and cell andmodule manufacturing together account for the biggest part in all categories, as shown in fig-ure 10(a), whereas BOS components account for approximately 10–20 percent with contribu-tions mainly from support structures, foundations, inverters and transformers. Cables, roads andtransports have minor impact, although the impact from transports can be somewhat increasedif fuels of lower environmental classes are used.
0%
20%
40%
60%
80%
100%
Abiot
ic d
epletio
n
GW
P100
Hum
an T
ox
FAETP
TETP
POCP (h
igh
NOx)
Acidicica
tion
Eutro
ficat
ion
Transports
Roads
Cables
Transformers
Inverters
Foundations
Support structures
Cells & modules
Silicon processing
(a) Case 1: Impact scores for system componentswith current electricity system.
0%
20%
40%
60%
80%
100%
Abiot
ic d
epletio
n
GW
P100
Hum
an T
ox
FAETP
TETP
POC (h
igh
NOx)
Acidific
ation
Eutro
phicat
ion
Transports
Roads
Cables
Transformers
Inverters
Foundations
Support structures
Cells & modules
Silicon processing
(b) Case 2: Impact scores for system componentswith electricity taken from the installation itself.
Figure 10: Impact scores in all categories
In case 2 the biggest contribution in toxicity categories comes from silicon processing and cells& modules. With the emissions from conventional electricity production excluded, the use offossil fuels for process heat and the corresponding emissions causes support structures andfoundations to contribute most in abiotic resource depletion and global warming, as seen infigure 10(b). Inverters have a contribution of about 10 to 20 percent in five categories, whichcan, however, be underestimated due to the generalisations made in lack of more detailed dataon electronic components. This can also be the case for transformers which here have a rathersmall contribution. Transports and roads account for approximately 15 percent in eutrophicationdue to NOx emissions, but in other categories their impact loads are quite small, less than 10percent. The contribution from cables is virtually non-existent.
24
6 IMPACT ASSESSMENT Chalmers University of Technology
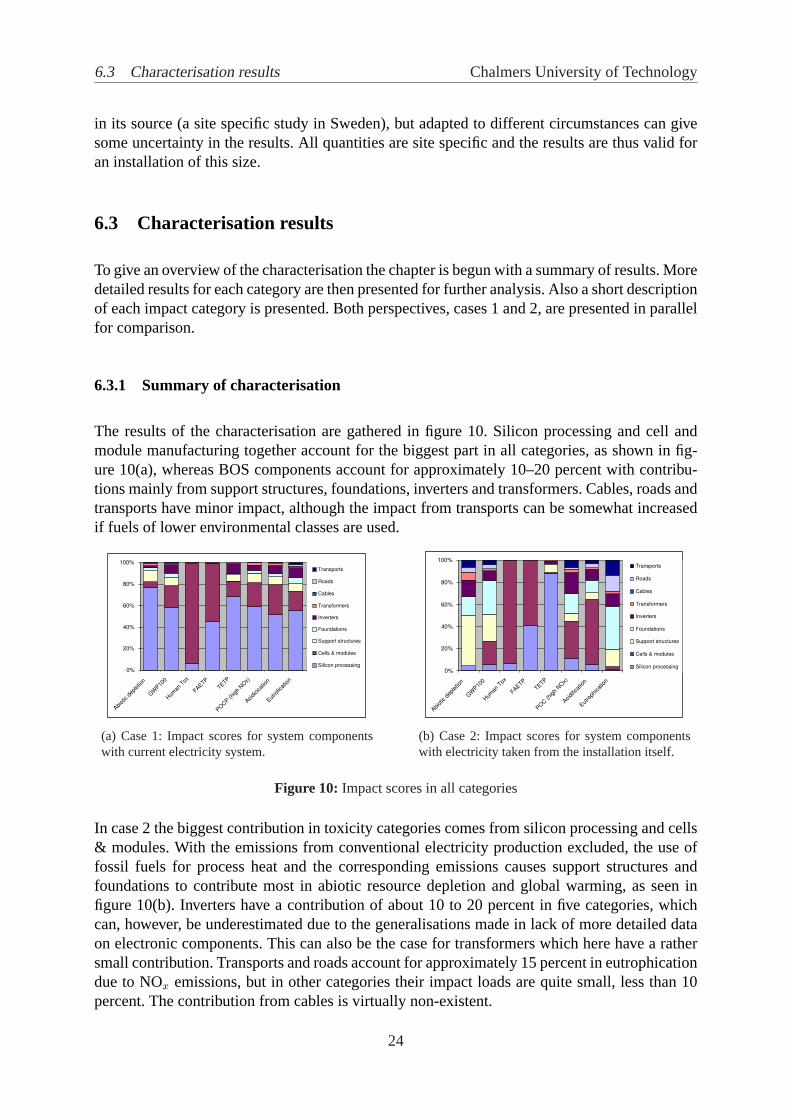
The role of the electricity mixes considered in case 1 is shown in figure 11 jointly for electricityuse in the production of all components. The emissions from electricity production dominate allcategories except human toxicity and fresh water aquatic ecotoxicity as these categories have todo with toxic emissions that are not so common in electricity production.
0%
20%
40%
60%
80%
100%
Abiot
ic d
epletio
n
GW
P100
Hum
an T
ox
FAETP
TETP
POC (h
igh
NOx)
Acidicica
tion
Eutro
ficat
ion
Electricity
Transports
Roads
Cables
Transformers
Inverters
Foundations
Support structures
Silicon processing
Cells & modules
Figure 11: Impact scores in case 1 with contribution from total electricity use separated from otherprocesses in components’ production.
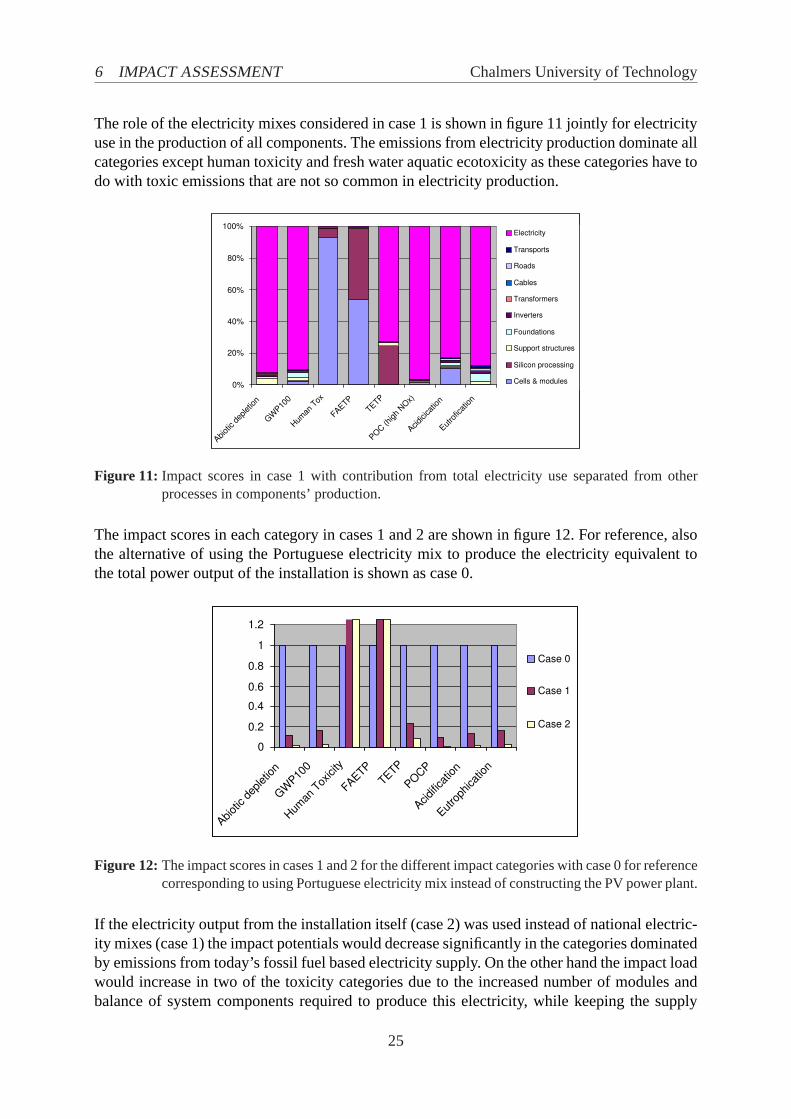
The impact scores in each category in cases 1 and 2 are shown in figure 12. For reference, alsothe alternative of using the Portuguese electricity mix to produce the electricity equivalent tothe total power output of the installation is shown as case 0.
0
0.2
0.4
0.6
0.8
1
1.2
Abiot
ic d
epletio
n
GW
P100
Hum
an T
oxicity
FAETP
TETP
POCP
Acidific
ation
Eutro
phicat
ion
Case 0
Case 1
Case 2
Figure 12: The impact scores in cases 1 and 2 for the different impact categories with case 0 for referencecorresponding to using Portuguese electricity mix instead of constructing the PV power plant.
If the electricity output from the installation itself (case 2) was used instead of national electric-ity mixes (case 1) the impact potentials would decrease significantly in the categories dominatedby emissions from today’s fossil fuel based electricity supply. On the other hand the impact loadwould increase in two of the toxicity categories due to the increased number of modules andbalance of system components required to produce this electricity, while keeping the supply
25
6.3 Characterisation results Chalmers University of Technology
to the grid constant. However, the environmental load decreases by approximately 90 percentor more in the categories of abiotic resource depletion, global warming, photochemical ozonecreation, acidification and eutrophication, in comparison to case 1. For terrestrial ecotoxicitythe load is decreased by approximately 65 percent. It is mainly the increased number of mod-ules needed in case 2 that increases the environmental loads for human toxicity and freshwateraquatic ecotoxicity by 26 and 14 percent respectively. The values that shoot out of the graph arefor human toxicity 23 and 29 in cases 1 and 2 respectively, and for fresh water aquatic ecotox-icity similarily 69 and 79. However, due to the data used for silicon processing these generalvalues are quite uncertain and closer investigation on the emissions is needed for more reliableresults.
6.3.2 Depletion of abiotic resources
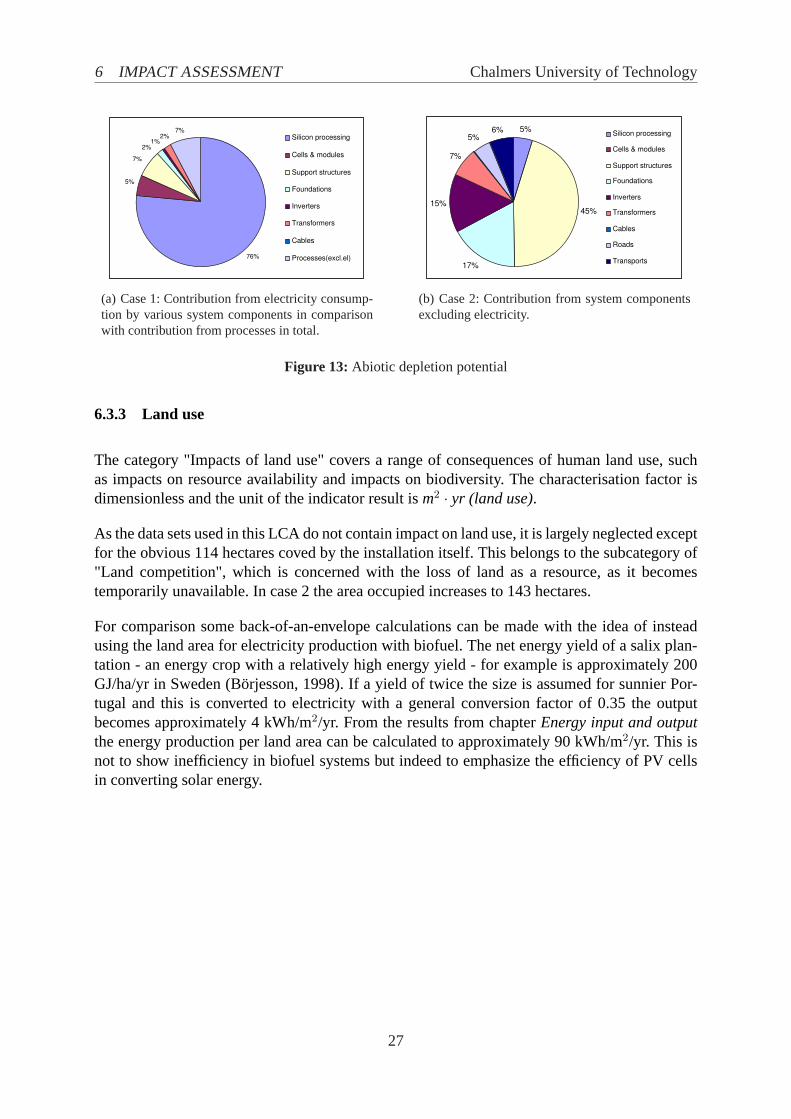
Abiotic resources are natural resources (including energy resources) that are regarded as non-living. The method used is based on ultimate reserves and extraction rates. The results are givenin kg antimony (Sb) equivalents.
The resources being most depleted by the existence of this installation are hard coal, naturalgas, crude oil, lignite, copper, bauxite and iron ore. The use of fossil fuel comes both from useas material and energy. The following values are used to convert energy values to correspondingmass: oil & fossil fuel 41 MJ/kg, oil (heavy fuel) 40,6 MJ/kg, oil (light fuel) 42,3 MJ/kg, diesel42,5 MJ/kg, coal 25,5 MJ/kg, coke 28,1 MJ/kg and gas & natural gas 34,8 MJ/m3 as used indata source (Sunér 1996).
Electricity production for the various components gives the largest contribution in case 1, 93percent, as shown in figure 13(a). This has to do with the use of fossil fuels in electricity pro-duction. Since silicon and cell & module production have the highest electricity demands theyalso account for over 80 percent of the abiotic resource depletion potential due to electricityconsumption.
In this case 2, where all electricity emissions are omitted and approximately 25 percent morematerials need to be produced, the largest contribution, 45 percent comes from support struc-tures, see figure 13(b). Foundations and inverters have an almost equal contribution of 17 and15 percent respectively. Also transformers, roads and silicon production have some contributionto abiotic resource depletion. For all components the contribution in this case comes from thedirect use of fossil fuels, either as an energy or material resource.
26
6 IMPACT ASSESSMENT Chalmers University of Technology
76%
5%
7%
7%
1% 2%
2% Silicon processing
Cells & modules
Support structures
Foundations
Inverters
Transformers
Cables
Processes(excl.el)
(a) Case 1: Contribution from electricity consump-tion by various system components in comparisonwith contribution from processes in total.
5%
45%
17%
15%
7%
5% 6% Silicon processing
Cells & modules
Support structures
Foundations
Inverters
Transformers
Cables
Roads
Transports
(b) Case 2: Contribution from system componentsexcluding electricity.
Figure 13: Abiotic depletion potential
6.3.3 Land use
The category "Impacts of land use" covers a range of consequences of human land use, suchas impacts on resource availability and impacts on biodiversity. The characterisation factor isdimensionless and the unit of the indicator result ism2 · yr (land use).
As the data sets used in this LCA do not contain impact on land use, it is largely neglected exceptfor the obvious 114 hectares coved by the installation itself. This belongs to the subcategory of"Land competition", which is concerned with the loss of land as a resource, as it becomestemporarily unavailable. In case 2 the area occupied increases to 143 hectares.
For comparison some back-of-an-envelope calculations can be made with the idea of insteadusing the land area for electricity production with biofuel. The net energy yield of a salix plan-tation - an energy crop with a relatively high energy yield - for example is approximately 200GJ/ha/yr in Sweden (Börjesson, 1998). If a yield of twice the size is assumed for sunnier Por-tugal and this is converted to electricity with a general conversion factor of 0.35 the outputbecomes approximately 4 kWh/m2/yr. From the results from chapterEnergy input and outputthe energy production per land area can be calculated to approximately 90 kWh/m2/yr. This isnot to show inefficiency in biofuel systems but indeed to emphasize the efficiency of PV cellsin converting solar energy.
27
6.3 Characterisation results Chalmers University of Technology
6.3.4 Climate change
Climate change is by CML defined as the impact of human emissions on the heat radiation ab-sorption of the atmosphere. This may have various impacts on ecosystem health, human healthand material welfare. Most of these emissions enhance radiative forcing, causing the tempera-ture of the earth’s surface to rise. The baseline used describes a global warming potential for a100-year time horizon (GWP100) for each greenhouse gas emission to the air. The GWPs aredeveloped by the UN Intergovernmental Panel on Climate Change (IPCC). The characterisationfactor is given inkg carbon dioxide equivalent per kg emission.
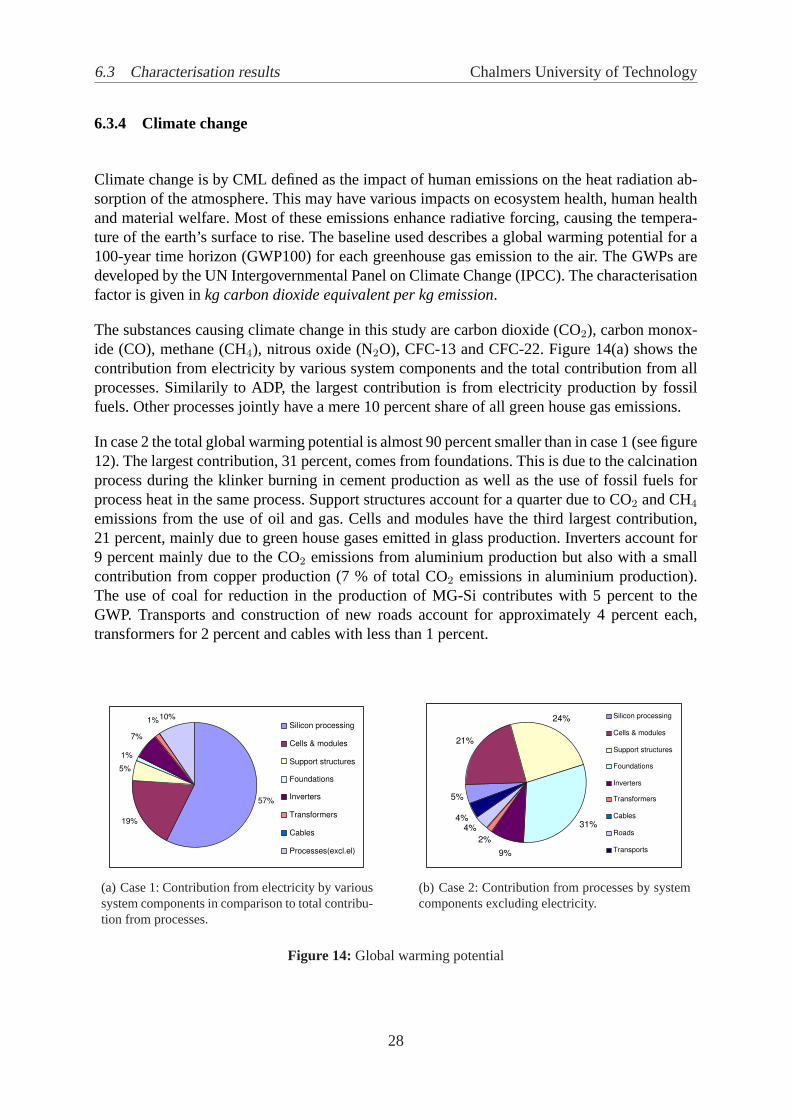
The substances causing climate change in this study are carbon dioxide (CO2), carbon monox-ide (CO), methane (CH4), nitrous oxide (N2O), CFC-13 and CFC-22. Figure 14(a) shows thecontribution from electricity by various system components and the total contribution from allprocesses. Similarily to ADP, the largest contribution is from electricity production by fossilfuels. Other processes jointly have a mere 10 percent share of all green house gas emissions.
In case 2 the total global warming potential is almost 90 percent smaller than in case 1 (see figure12). The largest contribution, 31 percent, comes from foundations. This is due to the calcinationprocess during the klinker burning in cement production as well as the use of fossil fuels forprocess heat in the same process. Support structures account for a quarter due to CO2 and CH4
emissions from the use of oil and gas. Cells and modules have the third largest contribution,21 percent, mainly due to green house gases emitted in glass production. Inverters account for9 percent mainly due to the CO2 emissions from aluminium production but also with a smallcontribution from copper production (7 % of total CO2 emissions in aluminium production).The use of coal for reduction in the production of MG-Si contributes with 5 percent to theGWP. Transports and construction of new roads account for approximately 4 percent each,transformers for 2 percent and cables with less than 1 percent.
57%
19%
5%
10%
7%
1%
1%
Silicon processing
Cells & modules
Support structures
Foundations
Inverters
Transformers
Cables
Processes(excl.el)
(a) Case 1: Contribution from electricity by varioussystem components in comparison to total contribu-tion from processes.
21%
5%
24%
31%
9%
4% 4%
2%
Silicon processing
Cells & modules
Support structures
Foundations
Inverters
Transformers
Cables
Roads
Transports
(b) Case 2: Contribution from processes by systemcomponents excluding electricity.
Figure 14: Global warming potential
28
6 IMPACT ASSESSMENT Chalmers University of Technology
6.3.5 Ozone depletion potential
Stratospheric ozone is destroyed by ultra violet radiation, visible light and certain substancesthat act as catalysts e.g. H, OH, Cl and Br. The increased concentration of such catalysts in-creases the rate of ozone destruction during their life time in the stratosphere (Baumann andTillman 2004). The ozone depletion potentials (ODPs) used in this LCA were developed bythe World Meteorological Organisation (WMO). The steady-state ODPs, which is the baselinemodel, are used for calculating the stratospheric ozone depletion potential from the emissionsover the life cycle of this power plant.
Ozone depleting substances, in this case mainly Halon 1301 and CFC-114, are emitted onlyfrom silicon processing giving the equal result of 100 percent contribution for both case 1 and2. The total ozone depletion potential is 31 kg CFC-11 equivalent during the installation lifecycle in case 1 and 25 percent larger, 39 kg CFC-11 equivalent, in case 2.
6.3.6 Human toxicity
This category deals with the impacts on human health of toxic substances released to the en-vironment. Characterisation factors are applied on emissions to air and water according to in-ventory results. The baseline model used here is developed at RIVM, describing fate, exposureand effect of toxic substances, adapted to LCA. The characterisation factor is a human toxicitypotential (HTP) defined for each toxic substance released to air, water and/or soil2, and is givenin kg 1,4-dichlorobenzene equivalent per kg emission.
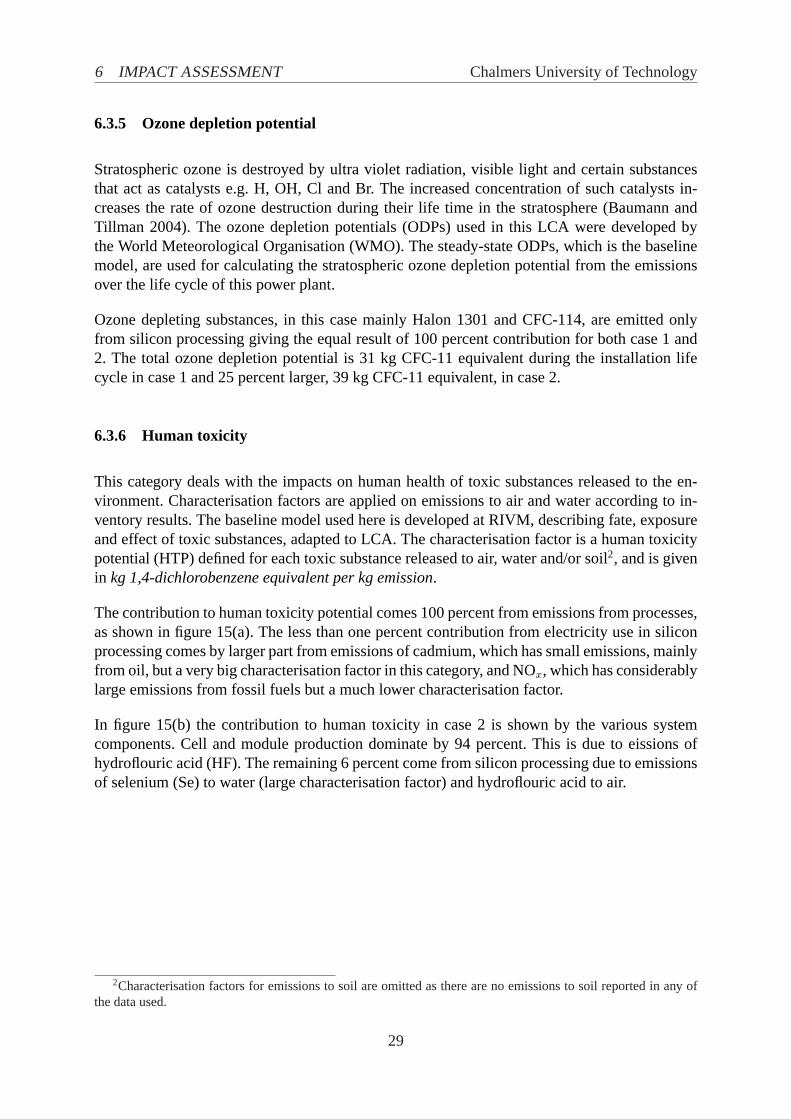
The contribution to human toxicity potential comes 100 percent from emissions from processes,as shown in figure 15(a). The less than one percent contribution from electricity use in siliconprocessing comes by larger part from emissions of cadmium, which has small emissions, mainlyfrom oil, but a very big characterisation factor in this category, and NOx, which has considerablylarge emissions from fossil fuels but a much lower characterisation factor.
In figure 15(b) the contribution to human toxicity in case 2 is shown by the various systemcomponents. Cell and module production dominate by 94 percent. This is due to eissions ofhydroflouric acid (HF). The remaining 6 percent come from silicon processing due to emissionsof selenium (Se) to water (large characterisation factor) and hydroflouric acid to air.
2Characterisation factors for emissions to soil are omitted as there are no emissions to soil reported in any ofthe data used.
29
6.3 Characterisation results Chalmers University of Technology
0%
100%
Silicon processing
Cells & modules
Support structures
Foundations
Inverters
Transformers
Cables
Processes(excl.el)
(a) Case 1: Contribution from electricity by varioussystem components in comparison to total contribu-tion from processes.
0%
6%
Silicon processing
Cells & modules
Support structures
Foundations
Inverters
Transformers
Cables
Roads
Transports
(b) Case 2: Contribution from processes by systemcomponents excluding electricity.
Figure 15: Human toxicity potential
6.3.7 Ecotoxicity
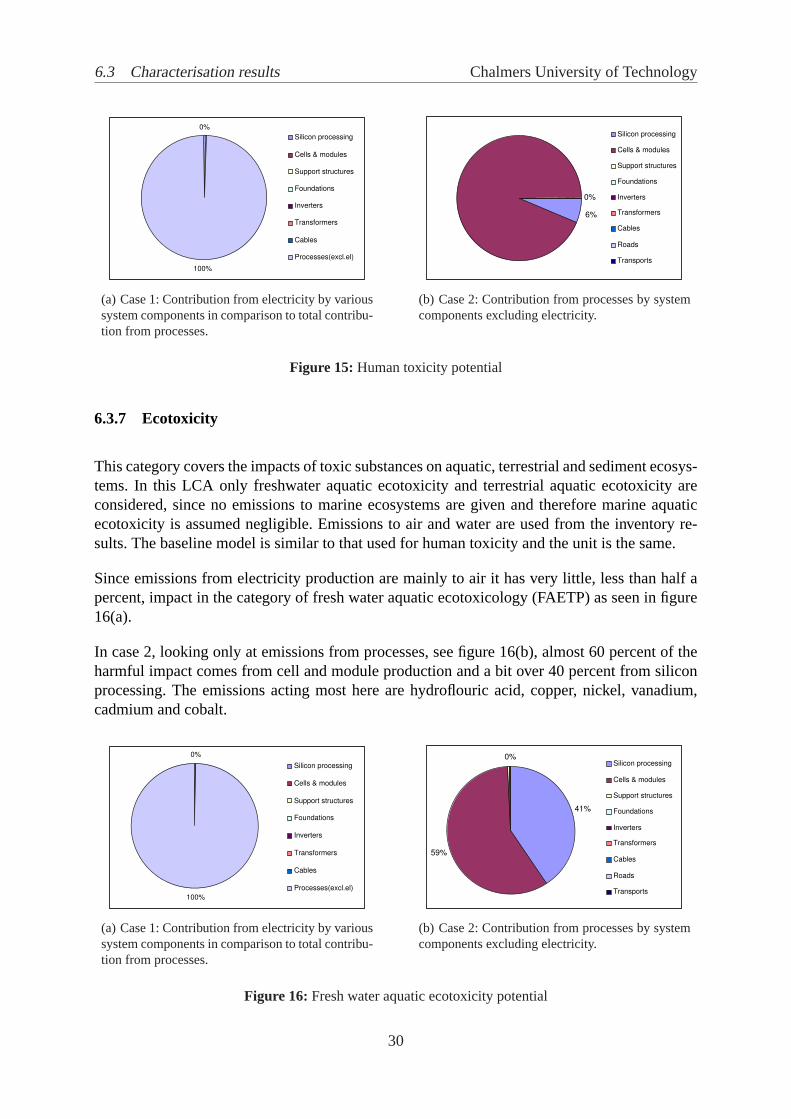
This category covers the impacts of toxic substances on aquatic, terrestrial and sediment ecosys-tems. In this LCA only freshwater aquatic ecotoxicity and terrestrial aquatic ecotoxicity areconsidered, since no emissions to marine ecosystems are given and therefore marine aquaticecotoxicity is assumed negligible. Emissions to air and water are used from the inventory re-sults. The baseline model is similar to that used for human toxicity and the unit is the same.
Since emissions from electricity production are mainly to air it has very little, less than half apercent, impact in the category of fresh water aquatic ecotoxicology (FAETP) as seen in figure16(a).
In case 2, looking only at emissions from processes, see figure 16(b), almost 60 percent of theharmful impact comes from cell and module production and a bit over 40 percent from siliconprocessing. The emissions acting most here are hydroflouric acid, copper, nickel, vanadium,cadmium and cobalt.
0%
100%
Silicon processing
Cells & modules
Support structures
Foundations
Inverters
Transformers
Cables
Processes(excl.el)
(a) Case 1: Contribution from electricity by varioussystem components in comparison to total contribu-tion from processes.
41%
59%
0% Silicon processing
Cells & modules
Support structures
Foundations
Inverters
Transformers
Cables
Roads
Transports
(b) Case 2: Contribution from processes by systemcomponents excluding electricity.
Figure 16: Fresh water aquatic ecotoxicity potential
30
6 IMPACT ASSESSMENT Chalmers University of Technology
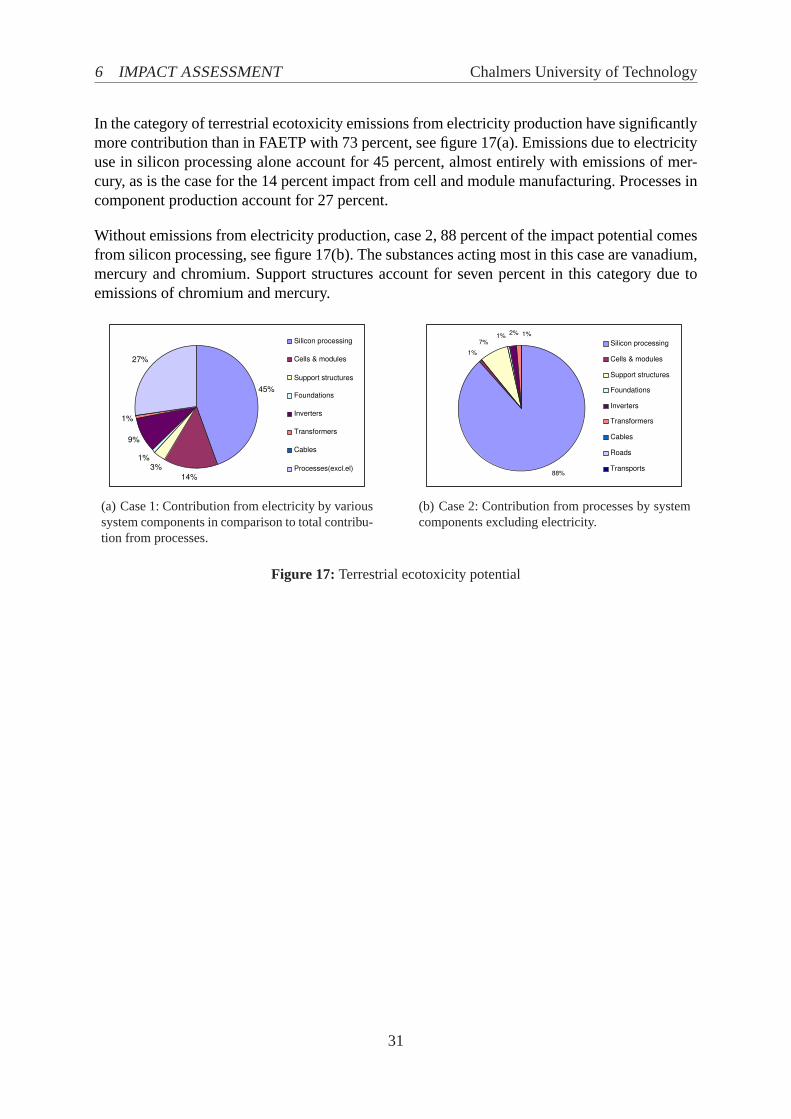
In the category of terrestrial ecotoxicity emissions from electricity production have significantlymore contribution than in FAETP with 73 percent, see figure 17(a). Emissions due to electricityuse in silicon processing alone account for 45 percent, almost entirely with emissions of mer-cury, as is the case for the 14 percent impact from cell and module manufacturing. Processes incomponent production account for 27 percent.
Without emissions from electricity production, case 2, 88 percent of the impact potential comesfrom silicon processing, see figure 17(b). The substances acting most in this case are vanadium,mercury and chromium. Support structures account for seven percent in this category due toemissions of chromium and mercury.
27%
45%
14%
3% 1%
9%
1%
Silicon processing
Cells & modules
Support structures
Foundations
Inverters
Transformers
Cables
Processes(excl.el)
(a) Case 1: Contribution from electricity by varioussystem components in comparison to total contribu-tion from processes.
1%
1% 7%
1% 2%
88%
Silicon processing
Cells & modules
Support structures
Foundations
Inverters
Transformers
Cables
Roads
Transports
(b) Case 2: Contribution from processes by systemcomponents excluding electricity.
Figure 17: Terrestrial ecotoxicity potential
31
6.3 Characterisation results Chalmers University of Technology
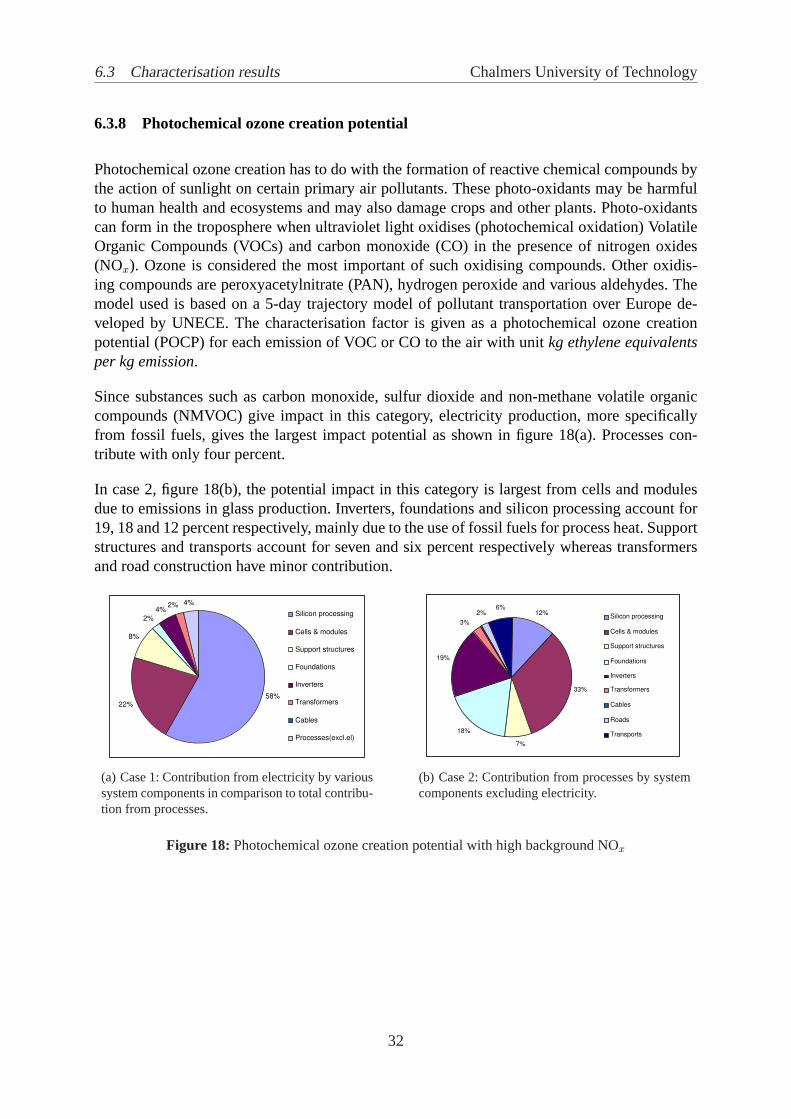
6.3.8 Photochemical ozone creation potential
Photochemical ozone creation has to do with the formation of reactive chemical compounds bythe action of sunlight on certain primary air pollutants. These photo-oxidants may be harmfulto human health and ecosystems and may also damage crops and other plants. Photo-oxidantscan form in the troposphere when ultraviolet light oxidises (photochemical oxidation) VolatileOrganic Compounds (VOCs) and carbon monoxide (CO) in the presence of nitrogen oxides(NOx). Ozone is considered the most important of such oxidising compounds. Other oxidis-ing compounds are peroxyacetylnitrate (PAN), hydrogen peroxide and various aldehydes. Themodel used is based on a 5-day trajectory model of pollutant transportation over Europe de-veloped by UNECE. The characterisation factor is given as a photochemical ozone creationpotential (POCP) for each emission of VOC or CO to the air with unitkg ethylene equivalentsper kg emission.
Since substances such as carbon monoxide, sulfur dioxide and non-methane volatile organiccompounds (NMVOC) give impact in this category, electricity production, more specificallyfrom fossil fuels, gives the largest impact potential as shown in figure 18(a). Processes con-tribute with only four percent.
In case 2, figure 18(b), the potential impact in this category is largest from cells and modulesdue to emissions in glass production. Inverters, foundations and silicon processing account for19, 18 and 12 percent respectively, mainly due to the use of fossil fuels for process heat. Supportstructures and transports account for seven and six percent respectively whereas transformersand road construction have minor contribution.
58% 22%
8%
2%
4% 2% 4%
Silicon processing
Cells & modules
Support structures
Foundations
Inverters
Transformers
Cables
Processes(excl.el)
(a) Case 1: Contribution from electricity by varioussystem components in comparison to total contribu-tion from processes.
12%
33%
7%
18%
19%
3%
2% 6%
Silicon processing
Cells & modules
Support structures
Foundations
Inverters
Transformers
Cables
Roads
Transports
(b) Case 2: Contribution from processes by systemcomponents excluding electricity.
Figure 18: Photochemical ozone creation potential with high background NOx
32
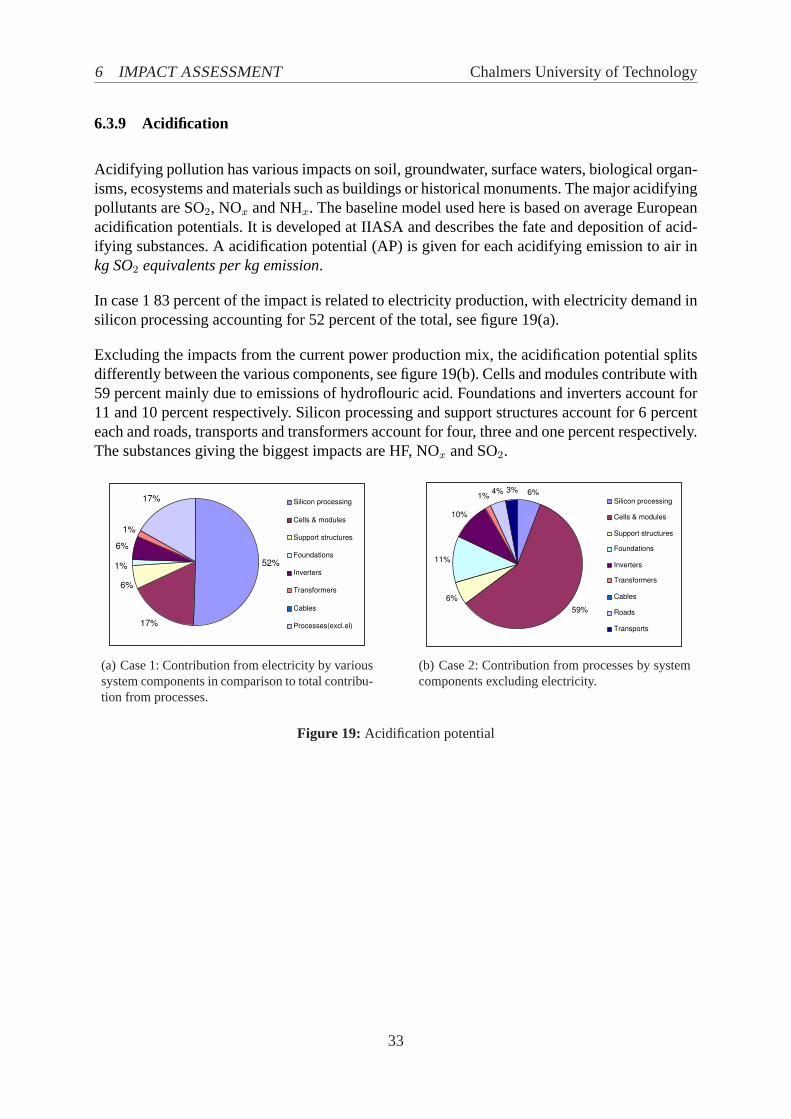
6 IMPACT ASSESSMENT Chalmers University of Technology
6.3.9 Acidification
Acidifying pollution has various impacts on soil, groundwater, surface waters, biological organ-isms, ecosystems and materials such as buildings or historical monuments. The major acidifyingpollutants are SO2, NOx and NHx. The baseline model used here is based on average Europeanacidification potentials. It is developed at IIASA and describes the fate and deposition of acid-ifying substances. A acidification potential (AP) is given for each acidifying emission to air inkg SO2 equivalents per kg emission.
In case 1 83 percent of the impact is related to electricity production, with electricity demand insilicon processing accounting for 52 percent of the total, see figure 19(a).
Excluding the impacts from the current power production mix, the acidification potential splitsdifferently between the various components, see figure 19(b). Cells and modules contribute with59 percent mainly due to emissions of hydroflouric acid. Foundations and inverters account for11 and 10 percent respectively. Silicon processing and support structures account for 6 percenteach and roads, transports and transformers account for four, three and one percent respectively.The substances giving the biggest impacts are HF, NOx and SO2.
52%
17%
1%
17%
6%
1%
6%
Silicon processing
Cells & modules
Support structures
Foundations
Inverters
Transformers
Cables
Processes(excl.el)
(a) Case 1: Contribution from electricity by varioussystem components in comparison to total contribu-tion from processes.
59%
6%
11%
10%
3% 4% 6% 1% Silicon processing
Cells & modules
Support structures
Foundations
Inverters
Transformers
Cables
Roads
Transports
(b) Case 2: Contribution from processes by systemcomponents excluding electricity.
Figure 19: Acidification potential
33
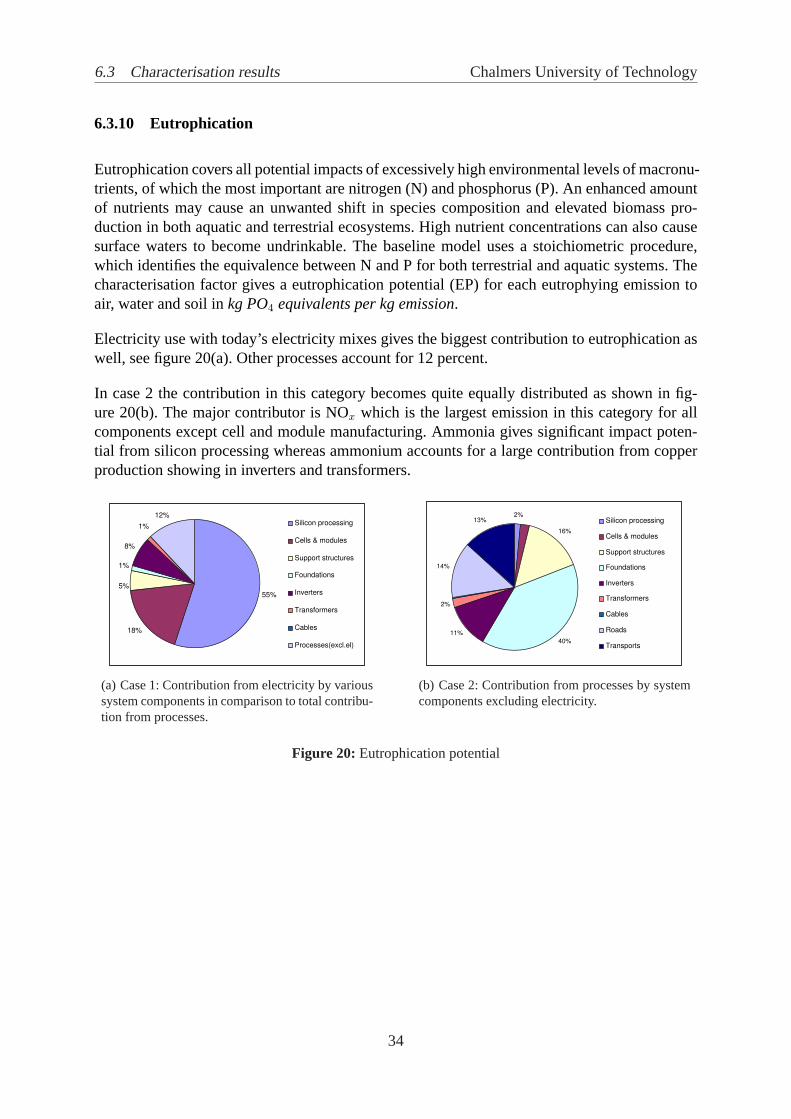
6.3 Characterisation results Chalmers University of Technology
6.3.10 Eutrophication
Eutrophication covers all potential impacts of excessively high environmental levels of macronu-trients, of which the most important are nitrogen (N) and phosphorus (P). An enhanced amountof nutrients may cause an unwanted shift in species composition and elevated biomass pro-duction in both aquatic and terrestrial ecosystems. High nutrient concentrations can also causesurface waters to become undrinkable. The baseline model uses a stoichiometric procedure,which identifies the equivalence between N and P for both terrestrial and aquatic systems. Thecharacterisation factor gives a eutrophication potential (EP) for each eutrophying emission toair, water and soil inkg PO4 equivalents per kg emission.
Electricity use with today’s electricity mixes gives the biggest contribution to eutrophication aswell, see figure 20(a). Other processes account for 12 percent.
In case 2 the contribution in this category becomes quite equally distributed as shown in fig-ure 20(b). The major contributor is NOx which is the largest emission in this category for allcomponents except cell and module manufacturing. Ammonia gives significant impact poten-tial from silicon processing whereas ammonium accounts for a large contribution from copperproduction showing in inverters and transformers.
55%
18%
12%
5%
1%
1%
8%
Silicon processing
Cells & modules
Support structures
Foundations
Inverters
Transformers
Cables
Processes(excl.el)
(a) Case 1: Contribution from electricity by varioussystem components in comparison to total contribu-tion from processes.
2%
16%
40%
11%
2%
14%
13% Silicon processing
Cells & modules
Support structures
Foundations
Inverters
Transformers
Cables
Roads
Transports
(b) Case 2: Contribution from processes by systemcomponents excluding electricity.
Figure 20: Eutrophication potential
34
6 IMPACT ASSESSMENT Chalmers University of Technology
6.4 Interpretation and sensitivity analysis
The characterisation results give an idea both of the role of BOS components and today’s elec-tricity mix on the environmental load of a PV installation. Since the electricity mixes of Portu-gal, Spain and Germany are quite similar to the average mix in the European Union, see figure7, - with the exception of Portugal having no nuclear power - the results are quite representativeon a European level. Although the Norwegian mix is drastically different, the influence on theresults is small, as less than a hundredth of a percent of total electricity use was consumed inNorway. Indeed if all components were produced in Norway the results would be quite different.
Also the relation of the BOS components’ environmental load to that from module productionis shown giving similar results in most categories.
Case 2 shows more clearly the contribution from the manufacturing processes. One can go evenfurther to a case 3, and assume all energy demands in the life cycle of this installation to betaken from its own energy output. Thus emissions from the inherent processes in productionsuch as the calcination process in klinker burning or the reduction in silicon purification, bothreleasing significant amounts of CO2, or the release of toxic substances in the module life cycle,become more visible.
The characterisation results also can be used to identify so called hot spots, areas of improve-ment. As the silicon processing has large contributions especially in toxicity categories it can beidentified as the most important area of improvement. It is also one of the most plausible areasof improvement, since PV technologies are still relatively new on the market and further techno-logical advances can be expected to reduce energy requirement and toxic emissions. Howeverthe emissions from silicon processing are retrieved from an LCA for a specific case that doesnot necessarily give reliable results to generalise and should only be taken as showing direction.
All other data is from verified sources or published articles and no significant errors are ex-pected. However, the results may be in some cases underestimated due to lack of sufficient dataon production processes. This can indeed be the case for inverters and transformers for whichproduction processes are highly simplified as few LCAs have been published for these products.Results from a previous study (Alsema, 2003) show that the electronics proxy and the printerboard in fact have the largest contribution to the environmental load of an inverter. The samecan be the case for transformers as well.
In regard to energy output results it should be noted that the calculations are approximative andassumptions on BOS components’ efficiencies are rough estimates making the results sensitiveto changes.
35
Chalmers University of Technology
7 Discussion and conclusions
The study gives a general result of the role of various components of a ground PV installationover its life cycle. Looking at the results from the energy analysis and case 1 it can be seen thatthe BOS components give a small contribution in comparison to the life cycle of the modules.The dominance from silicon processing and cell and module manufacturing can be explainedby the high energy requirements which in this case are provided by fossil fuels. These impactscould thus be decreased by using a cell with lower energy requirements. However, cells withlower energy requirements in general come with lower efficiencies, meaning that a bigger instal-lation should be built to have the same energy output, which in turn increases the impact fromBOS components. For example if amorphous silicon thin film modules were used instead, withan energy requirement of approximately 1200 MJ/m2 for a frameless module and a conversionefficiency of 0.07 (Alsema, 2000), the EPBT is decreased to 5.4 years, where BOS componentsmake up 2.4 years. In fact if the energy requirements for cell manufacturing go to zero, the cellsstill need an efficiency of 0.03 for the system to have the same EPBT as the installation studiedhere, i.e. to supply the energy required in the production of the BOS components.
The comparison of cases 1 and 2 clearly shows the difference in environmental load from con-ventional electricity production and PV electricity. The impact potential in several categoriessinks by 90 percent or more when using PV electricity to produce the components. This indi-cates that in a conventional LCA, where the existing electricity mixes are used, a large part ofthe total environmental load of the installation actually comes from a source that the new tech-nology is supposed to replace. Thus, traditional LCA methodology can be misleading if usedfor strategic planning.
Since the largest environmental load of the PV installation lies within the life cycle of the mod-ule production itself, this is also where the most important areas for improvement can be found.Energy efficiency in silicon processing and cell manufacturing, while not compromising toomuch on the cell’s conversion efficiency, are essential to lower EPBTs and decrease energyrelated impacts. The use and release of toxic substances could also be an area to improve, es-pecially as the impacts become more significant as energy requirements decrease. However, theresults presented here rely on one specific case and only reveal the problem. Further investi-gation is needed on toxic emissions to find out their actual significance in the environmentalprofile of PV systems.
To further improve the impact profile of a PV installation environmental advancements in theproduction processes of components that are not directed solely to PV applications, such ascement, steel and metal production, may become relevant. Also as the environmental load fromsilicon processing and cell and module manufacturing decreases, electronic components suchas inverters and transformers may become the areas of significant environmental impact.
The results presented here can also be used to make a comparison with roof-top PV systems.As roof-top systems generally need no concrete foundations, a smaller amount of energy isrequired. Also less material is needed for support structures, if not completely abandoned in fu-ture solutions. Looking at the results from case 1, these savings decrease the environmental loadin most categories by approximately 3–5 percent. Exceptions are in abiotic resource depletion
36
7 DISCUSSION AND CONCLUSIONS Chalmers University of Technology
potential, acidification and eutrophication where approximately 11–15 percent of the impactcould be avoided. No new roads are needed either for roof-top installations, though the envi-ronmental impact from new roads does not appear significant in the results presented here. Forroof-integrated modules the BOS energy requirements are around 700 MJ/m2 (Alsema, 2000)whereas the results here give around 900 MJ/m2, just 200 MJ/m2 higher.
Although roof-top installations appear to have some environmental advantage over field instal-lations, the implementation of small systems to a large public can be too slow a process in orderto reach national and Kyoto targets on time. Therefore the role of (successful) large-scale in-stallations in raising public awareness and interest can be all the more important and, at leastfor the time being, overweigh the advantages of roof-top installations.
It can be concluded that a large part of the environmental impact of the PV installation in thisstudy is related to the energy requirements in the life cycle of the module. The BOS componentshave a smaller contribution that can, however, become more significant as energy requirementsfor cell production decreases. Also accounting for electricity production with today’s electricitymixes instead of PV electricity gives a more negative environmental profile to the PV systemthan is inherent to the installation itself. However, more detailed studies are required for reliableresults on the toxic emissions in the module life cycle.
37
REFERENCES Chalmers University of Technology
References
Alsema, E. A., 2003. Duurzaamheid van fotovoltaïsche systemen op basis van gea-vanceerde silicium technologie, Rapport vervaardigd voor het Utrecht Centrum voorEnergieonderzoek (UCE), NWS-E-2003-17, Universiteit Utrecht, Utrecht.
Alsema, E. A., Nieuwlaar, E., 2000. Energy viability of photovoltaic systems,En-ergy Policy28.
Alsema, E. A., Wild-Scholten, M. J. de, 2004. Environmental life cycle assessmentof advanced silicon solar cell technologies, Presented at the 19th European PhotovoltaicSolar Energy Conference, 7-11 June, Paris.
Baumann, H., Tillmann, A-M., 2004.Hitch Hiker’s Guide to LCA, Studentlitteratur, Lund.
Björklund, T., Tillman, A-M., 1997. LCA of Building Frame Structures, EnvironmentalImpact over the Life Cycle of Wooden and Concrete Frames, Technical environmentalplanning report 1997:2, Chalmers University of Technology, Göteborg.
BP Solar Spain, 2002. BP Solar Spain, Environmental Report 2001, BP Solar, Madrid.
Börjesson, P., 1998. Biomass in a Sustainable Energy System, Department of Envi-ronmental and Energy Systems Studies, Doctoral Dissertation, Lund University, Lund,Sweden.
Citherlet, S., Guglielmo, F. Di, Gay, J-B., 2000. Window and advanced glazingsystems life cycle assessment,Energy and Buildings32.
CML 2004: Life cycle assessment, An operational guide to the ISO standards. Centre ofEnvironmental Science - Leiden University (CML), Leiden, 2004.
Correio da Manhã, 2004. Interview with José Pós-de-Mina, president of AMPERCentral Solar (project promoter) 04.03.2004., Correio da Manhã, Lisbon.
Directorate General for Geology and Energy, Produção/Consumo de Energia Eléc-trica 1994-2003, Portugal, 2004. Retrieved in October 2005 from www.dgge.pt.
Directorate General for Geology and Energy, Renovaveis - Estatisticas rapidas,Agosto-Setembro 2005, Portugal, 2005. Retrieved in October 2005 from www.dgge.pt.
Ferrarese, D., Alaggio, M., 2003. Environmental product declaration, Large Distri-bution Transformer 10 MVA., ABB TD S.p.A., Unità operativa Transformatori diDistribuzione, Monselice (Padova), Italy. www.abb.com, data retrieved in November2005.
38
REFERENCES Chalmers University of Technology
Hanssen, O. J., 1998. Environmental impacts of product systems in a life cycle perspec-tive: a survey of five product types based on life cycle assessment studies,Journal ofCleaner Production 6.
Health & Safety Executive (HSE), 2000. General ventilation in the workplace, Guidancefor employers. HSE Books.
International Energy Agency (IEA), www.iea.org, 2002.
Jonasson, K., 2005. Environmental Assessment of Emerging Technologies, TheCase of Alternative Transport Fuels, PhD Thesis, Department of Environmental SystemsAnalysis, Report 2005:14, Chalmers University of Technology, Göteborg, Sweden.
Jungbluth N., 2003. Photovoltaik. In: Sachbilanzen von Energiesystemen: Grund-lagen für den ökologischen Vergleich von Energiesystemen und den Einbezug vonEnergiesystemen in Ökobilanzen für die Schweiz (Ed. Dones R.), Paul Scherrer InstitutVilligen, Swiss Centre for Life Cycle Inventories, Dübendorf, CH retrieved from:www.ecoinvent.ch.
Kannan, R., Leong, K. C., Osman, R., Ho, H. K., Tso, C. P., 2005. Life cycle as-sessment study of solar PV systems: An example of a 2.7 kWp distributed solar PVsystem in Singapore,Solar Energy, article in press.
Lamy, A., Bergano, L., 2002. Study of the Environmental Impacts of the Photo-voltaic Centre of Moura, Renatura Networks, Lisbon.
Michelin Route Planner, data retrieved in October-November, 2005. www.michelin.com
Molenbroek, E. C., 2003. BOS-componenten analyse ten behoeve van ’PV-duurzaam’,Ecofys rapport E21308, Utrecht Centrum voor Energieonderzoek, Utrecht.
Mroueh, U-M., Eskola, P., Laine-Ylijoki, J., 2001. Life-cycle impacts of the indus-trial by-products in road and earth construction,Waste Management21.
Nawaz, I., Tiwari, G. N., 2005. Embodied energy analysis of photovoltaic (PV)system based on macro and micro-level,Energy Policy, article in press.
Nicoletti, G. M., Notarnicola, B., Tassielli, G., 2002. Comparative Life Cycle As-sessment of flooring materials: ceramic versus marble tiles,Journal of cleaner production10.
Rydh, C. J., Sandén, B., 2005. Energy analysis of batteries in photovoltaic systems.Part I: Performance and energy requirements,Energy Conversion and Management46.
39
REFERENCES Chalmers University of Technology
Rydh, C. J., Sandén, B., 2005. Energy analysis of batteries in photovoltaic systems.Part II: Energy return factors and overall battery efficiencies,Energy Conversion andManagement46.
Sassetti Paes, P., 2003. Portugal: Photovoltaic technology status and prospects, Lebelec -EDP group, www.oja-services.nl/iea-pvps/ar03/prt.htm.
Secretaría General de Energía, 2004. La Energía en España 2004, Dirección Gen-eral de Política Energética y Minas, Ministerio de Industria, Turismo y Comercio,Madrid. Retrieved in October 2005 from www.mityc.es/energia/.
Sunér, M., 1996. Life Cycle Assessment of Aluminium, Copper and Steel, M.ScThesis, Technical environmental planning report 1996:6, Chalmers University of Tech-nology, Göteborg.
40
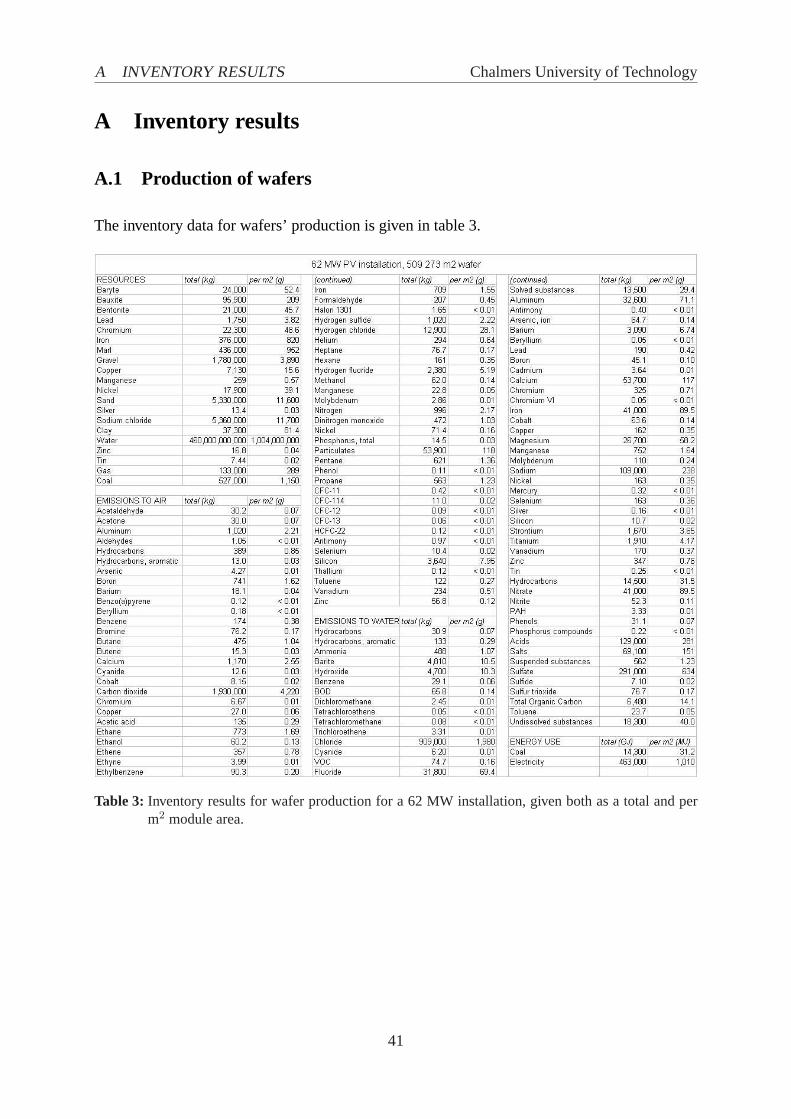
A INVENTORY RESULTS Chalmers University of Technology
A Inventory results
A.1 Production of wafers
The inventory data for wafers’ production is given in table 3.
Table 3: Inventory results for wafer production for a 62 MW installation, given both as a total and perm2 module area.
41
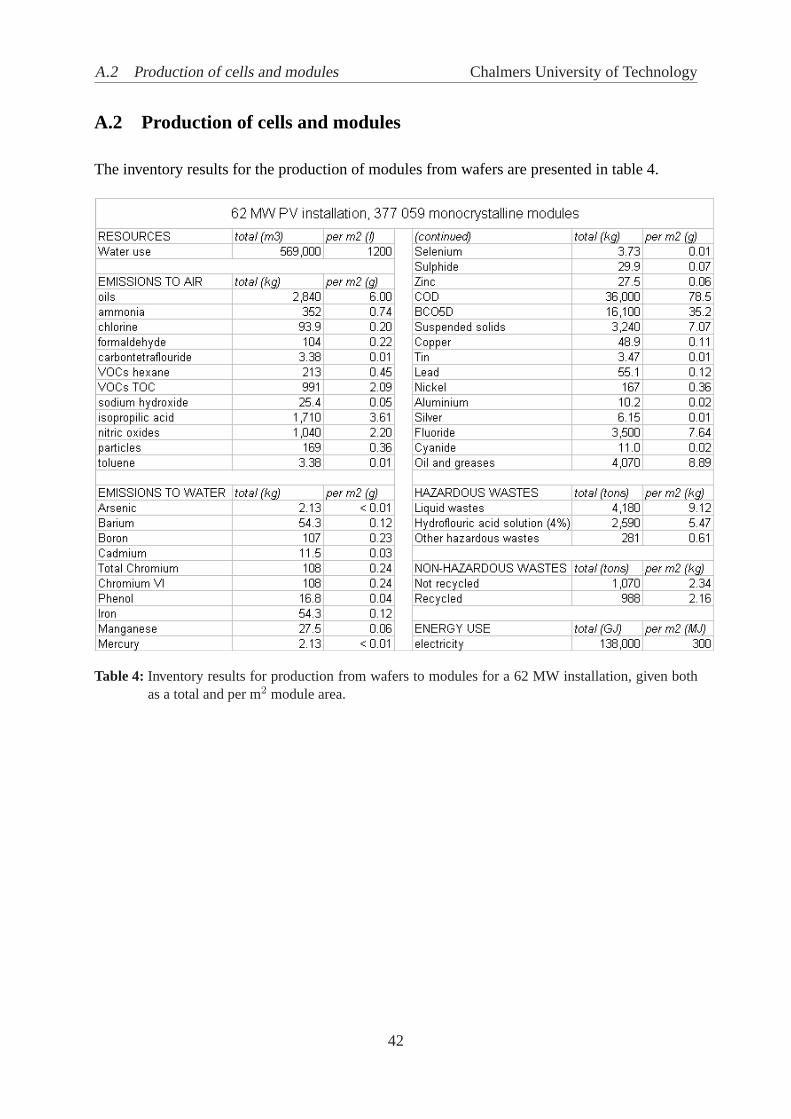
A.2 Production of cells and modules Chalmers University of Technology
A.2 Production of cells and modules
The inventory results for the production of modules from wafers are presented in table 4.
Table 4: Inventory results for production from wafers to modules for a 62 MW installation, given bothas a total and per m2 module area.
42
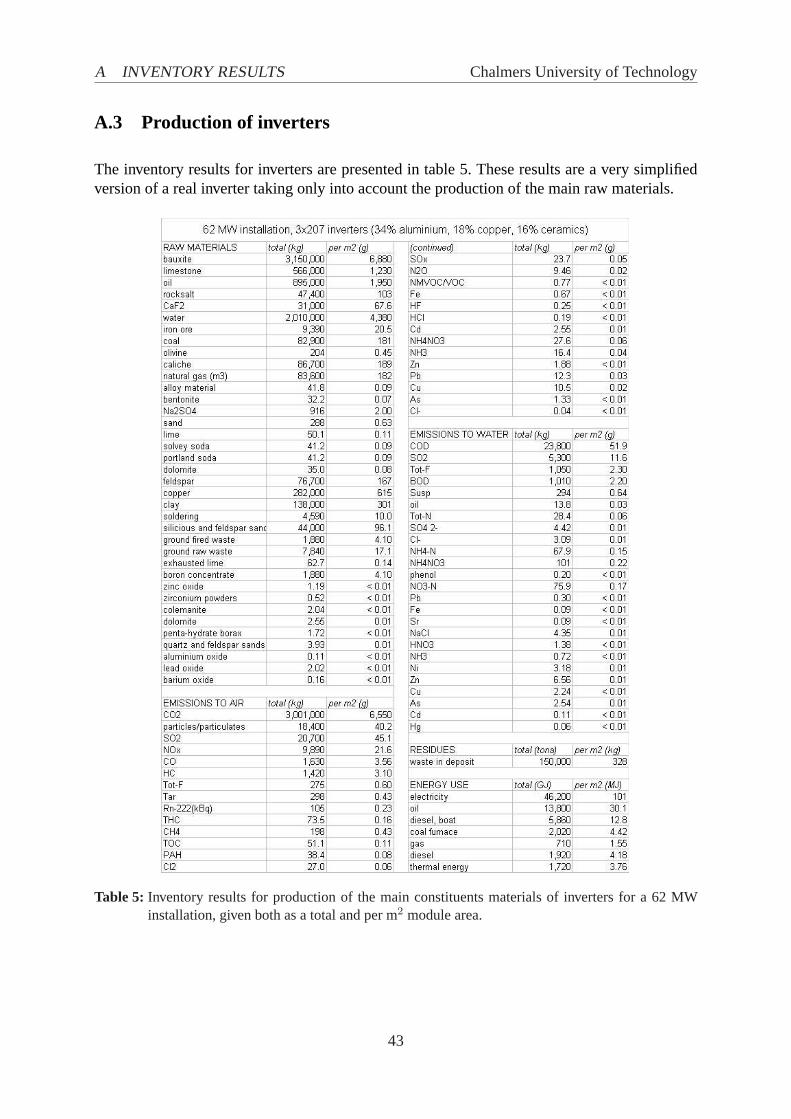
A INVENTORY RESULTS Chalmers University of Technology
A.3 Production of inverters
The inventory results for inverters are presented in table 5. These results are a very simplifiedversion of a real inverter taking only into account the production of the main raw materials.
Table 5: Inventory results for production of the main constituents materials of inverters for a 62 MWinstallation, given both as a total and per m2 module area.
43
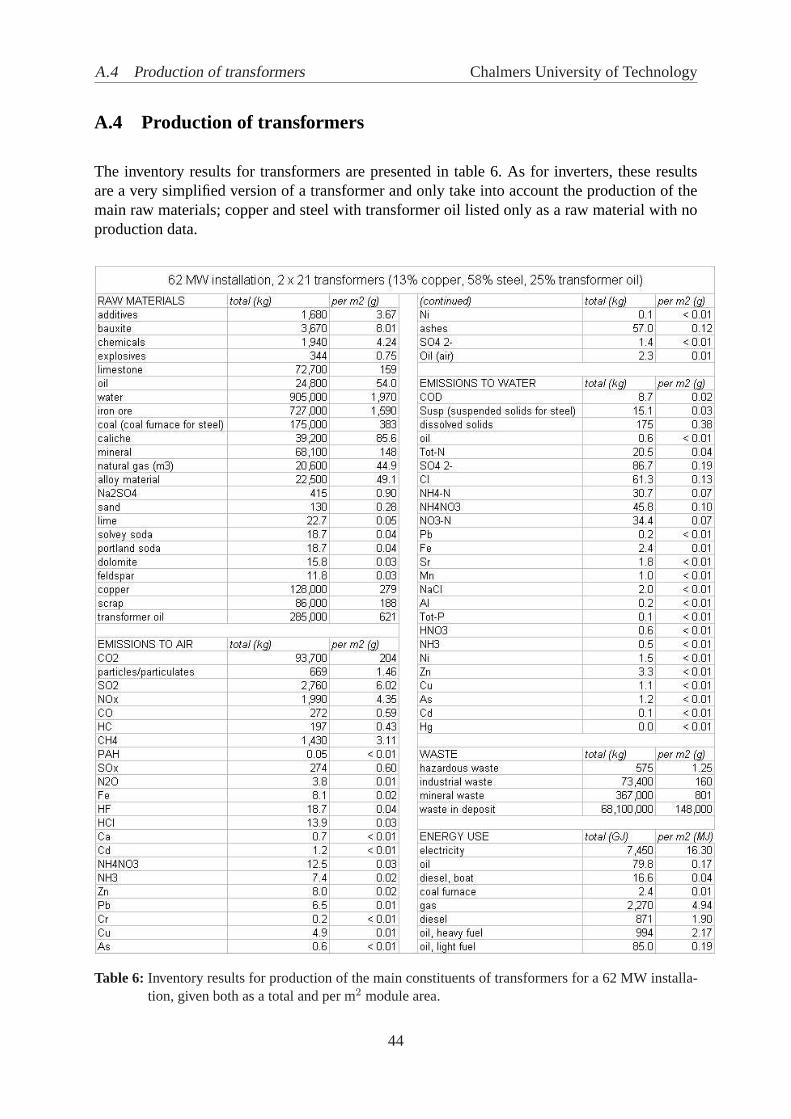
A.4 Production of transformers Chalmers University of Technology
A.4 Production of transformers
The inventory results for transformers are presented in table 6. As for inverters, these resultsare a very simplified version of a transformer and only take into account the production of themain raw materials; copper and steel with transformer oil listed only as a raw material with noproduction data.
Table 6: Inventory results for production of the main constituents of transformers for a 62 MW installa-tion, given both as a total and per m2 module area.
44
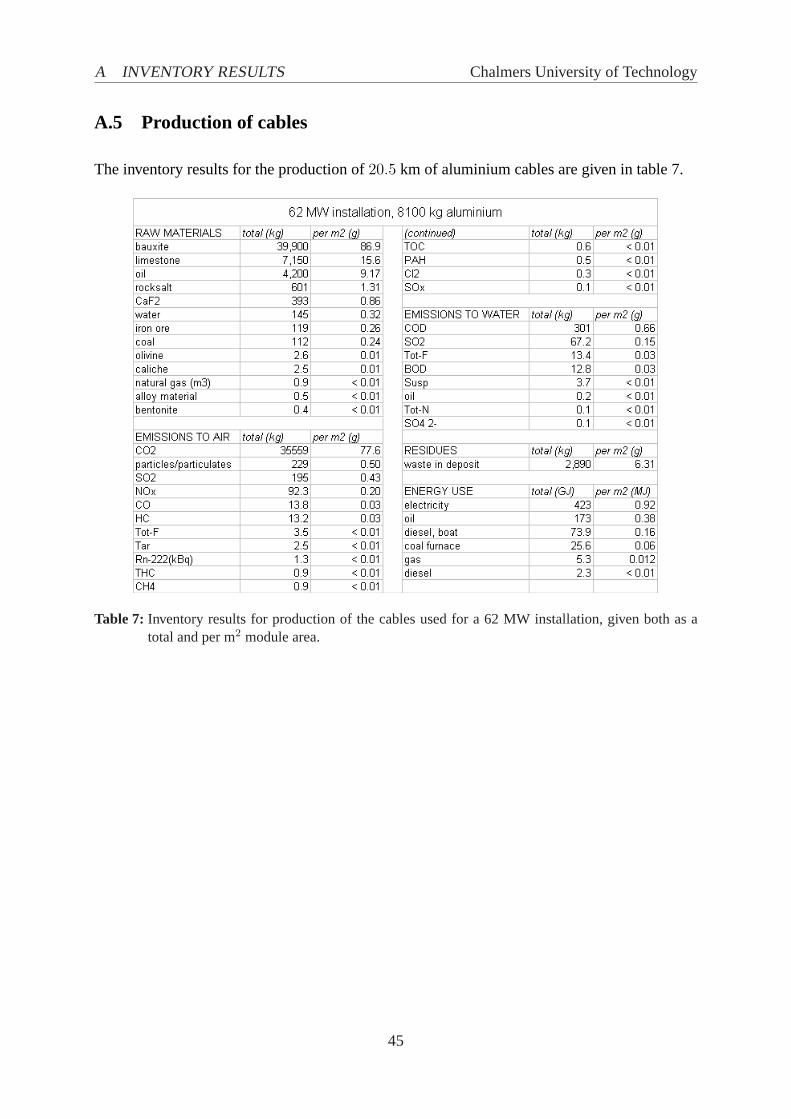
A INVENTORY RESULTS Chalmers University of Technology
A.5 Production of cables
The inventory results for the production of20.5 km of aluminium cables are given in table 7.
Table 7: Inventory results for production of the cables used for a 62 MW installation, given both as atotal and per m2 module area.
45
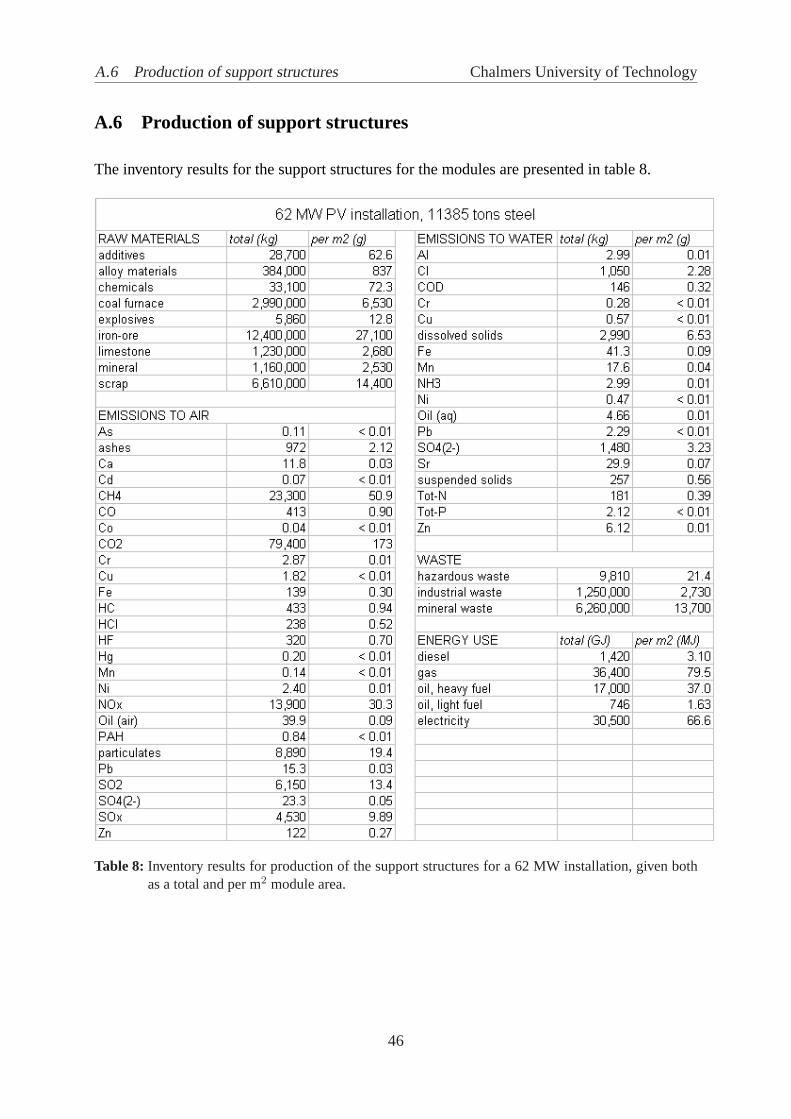
A.6 Production of support structures Chalmers University of Technology
A.6 Production of support structures
The inventory results for the support structures for the modules are presented in table 8.
Table 8: Inventory results for production of the support structures for a 62 MW installation, given bothas a total and per m2 module area.
46
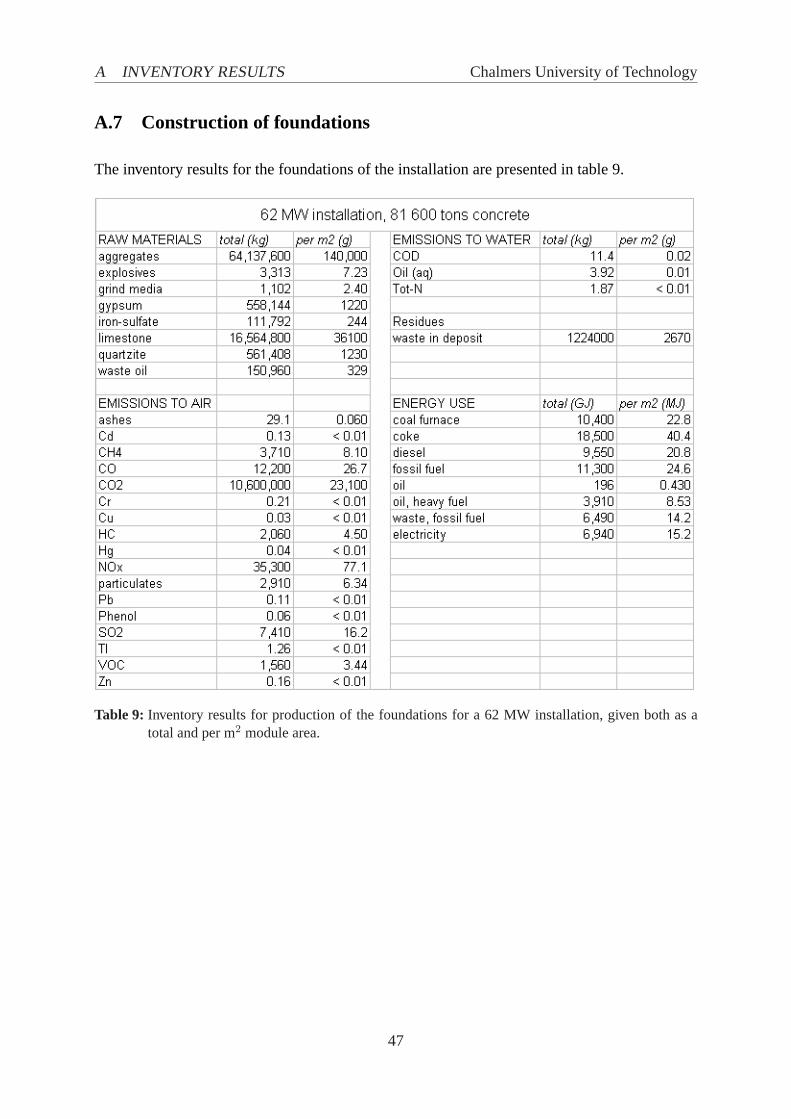
A INVENTORY RESULTS Chalmers University of Technology
A.7 Construction of foundations
The inventory results for the foundations of the installation are presented in table 9.
Table 9: Inventory results for production of the foundations for a 62 MW installation, given both as atotal and per m2 module area.
47
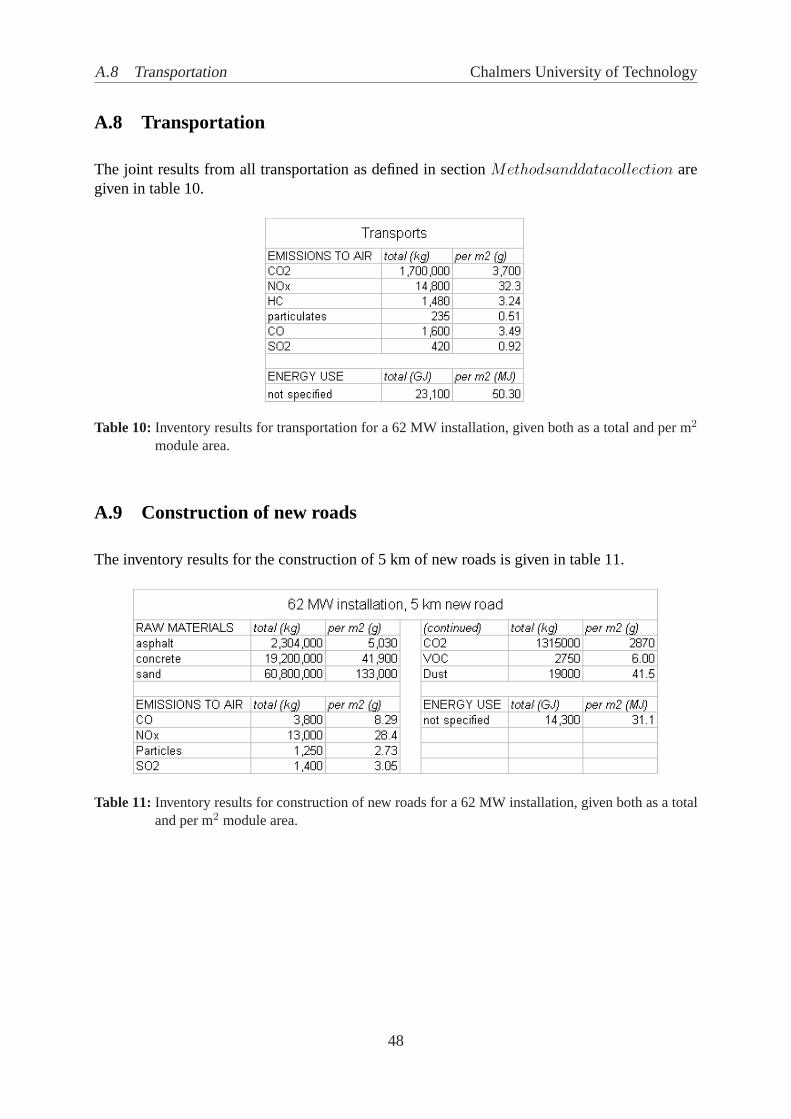
A.8 Transportation Chalmers University of Technology
A.8 Transportation
The joint results from all transportation as defined in sectionMethodsanddatacollection aregiven in table 10.
Table 10: Inventory results for transportation for a 62 MW installation, given both as a total and per m2
module area.
A.9 Construction of new roads
The inventory results for the construction of 5 km of new roads is given in table 11.
Table 11: Inventory results for construction of new roads for a 62 MW installation, given both as a totaland per m2 module area.
48
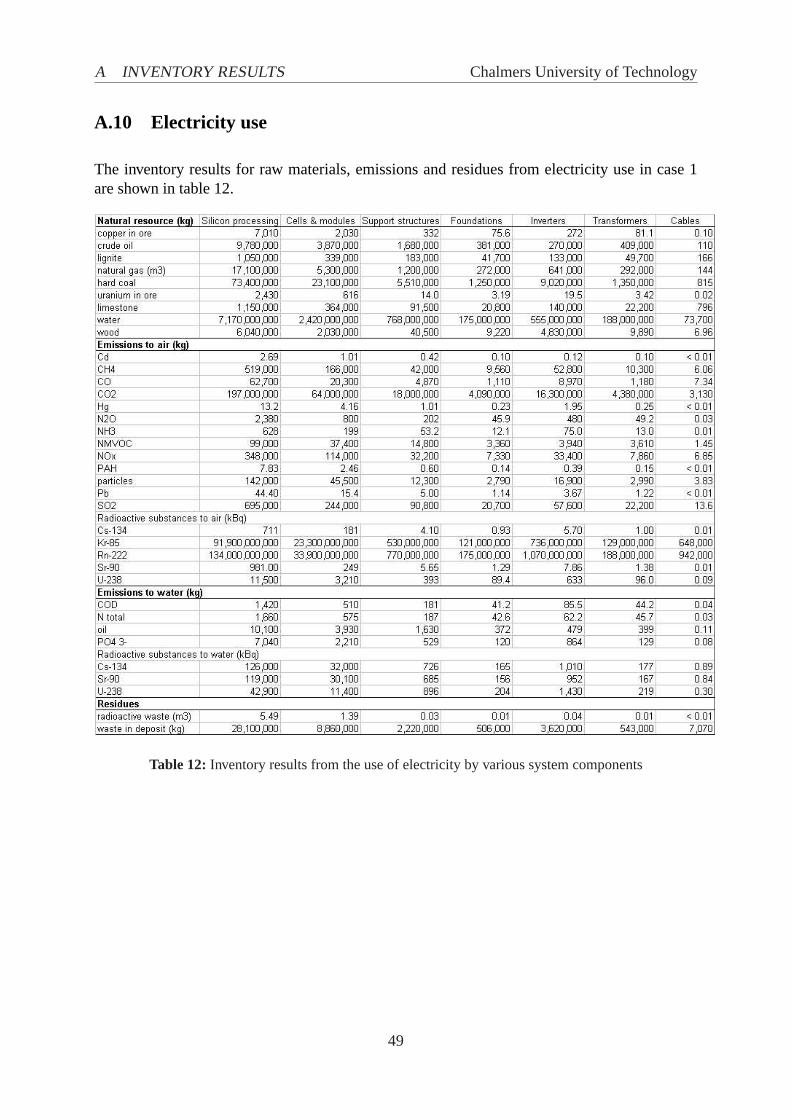
A INVENTORY RESULTS Chalmers University of Technology
A.10 Electricity use
The inventory results for raw materials, emissions and residues from electricity use in case 1are shown in table 12.
Table 12: Inventory results from the use of electricity by various system components
49
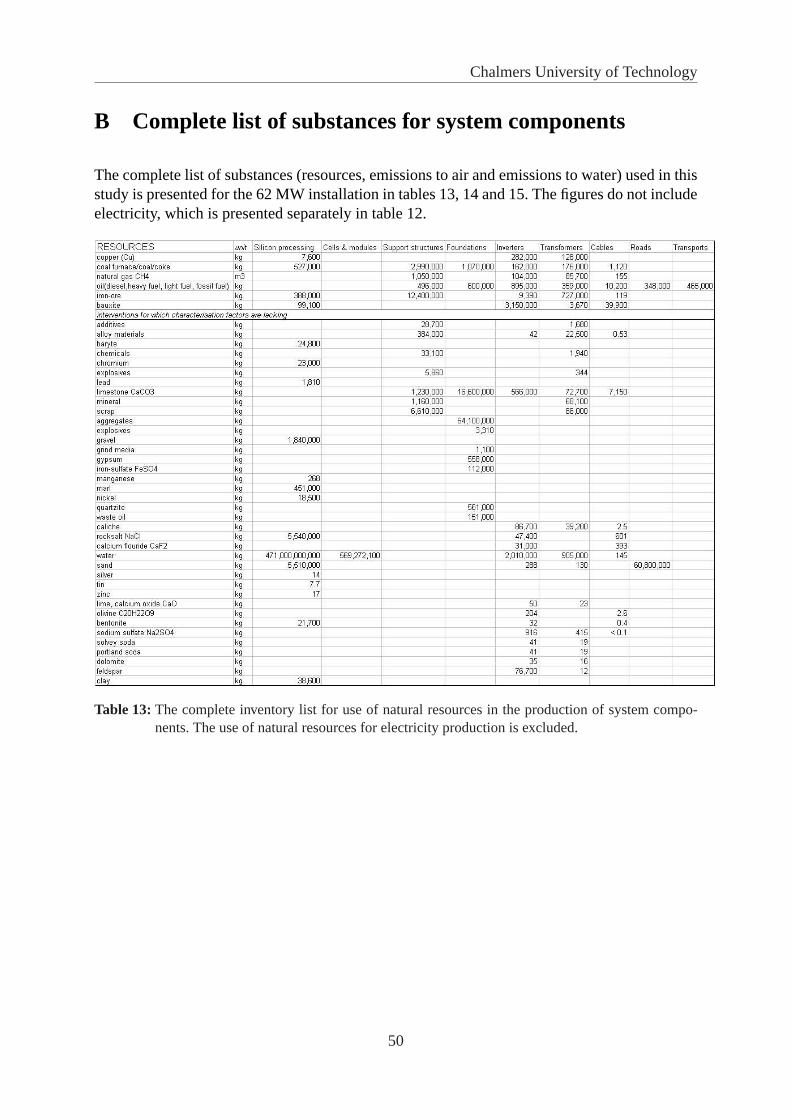
Chalmers University of Technology
B Complete list of substances for system components
The complete list of substances (resources, emissions to air and emissions to water) used in thisstudy is presented for the 62 MW installation in tables 13, 14 and 15. The figures do not includeelectricity, which is presented separately in table 12.
Table 13:The complete inventory list for use of natural resources in the production of system compo-nents. The use of natural resources for electricity production is excluded.
50
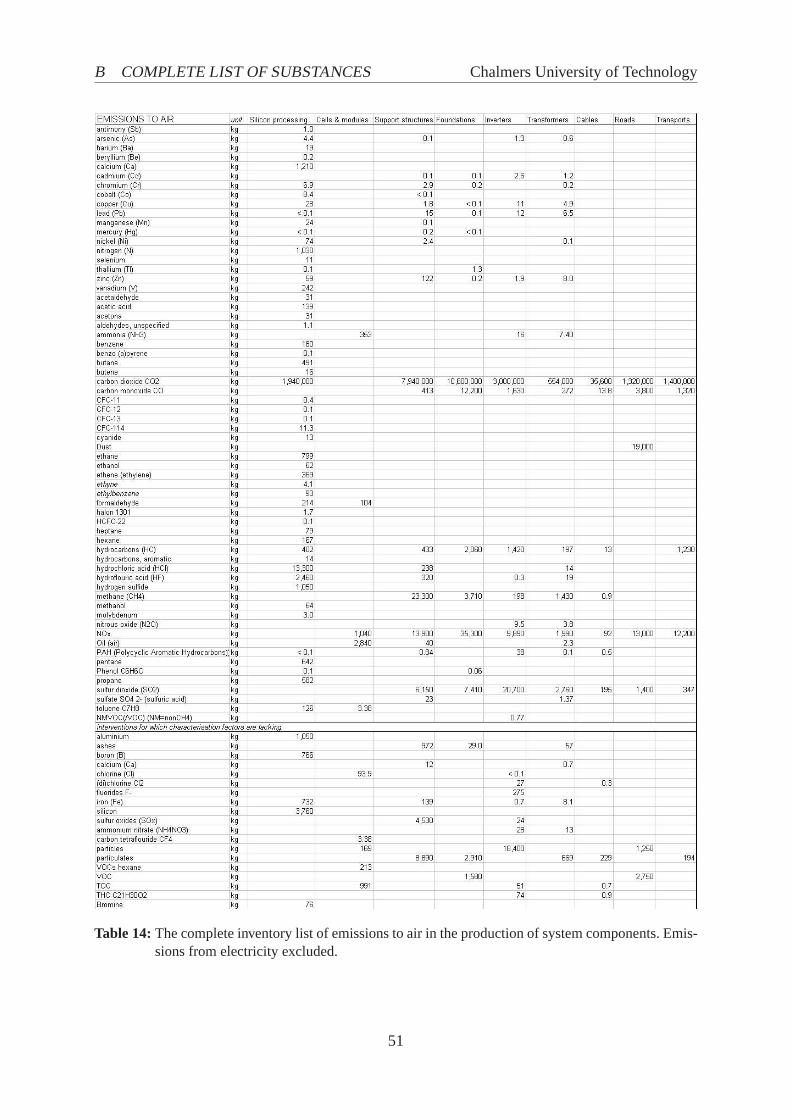
B COMPLETE LIST OF SUBSTANCES Chalmers University of Technology
Table 14:The complete inventory list of emissions to air in the production of system components. Emis-sions from electricity excluded.
51
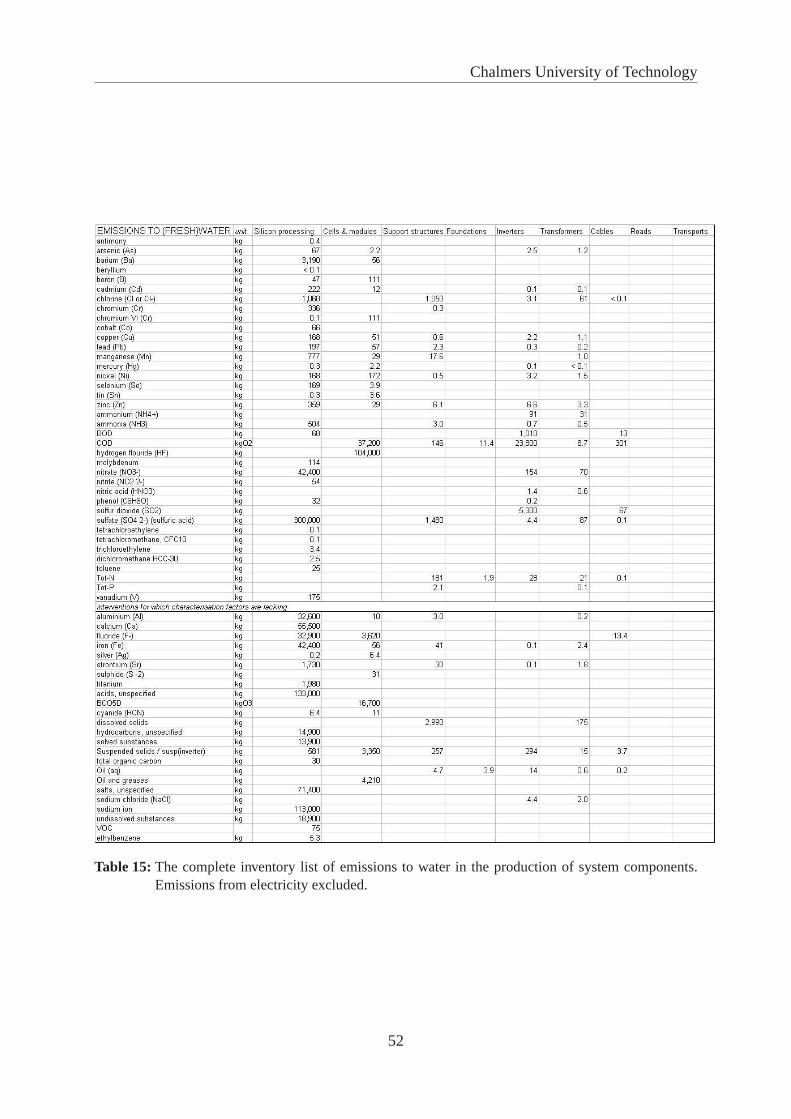
Chalmers University of Technology
Table 15:The complete inventory list of emissions to water in the production of system components.Emissions from electricity excluded.
52