kirloskar oil engines | koel...
TRANSCRIPT

JM Financial Institutional Securities Limited
India’s home-grown engineering powerhouse
Kirloskar Oil Engines (KOEL) is one of India’s oldest engineering houses and
largest diesel genset suppliers in India (30%/23% volume/value mkt share).
Following a change in the top management team in FY13, including the MD,
CFO and SBU Heads, KOEL has led several initiatives such as swifter product
launches, stricter cost controls with higher R&D, geographical expansion
and numerous techno-commercial tie-ups. With forecasted net profit CAGR of
24% over FY16–19E, the company has a strong financial profile, including
FCF yield of 6–7%, RoICs of 25%+ and robust cash position (16% of market
cap.). We initiate with BUY, valuing the stock at `400, 20x Sep’18E EPS.
Management change driving new initiatives, product launches: Five out of
the top-13 members of the senior management have been part of KOEL for
less than five years, including MD, CFO and SBU Heads. The new team led
several developments such as: a) swifter product launches, b) improved NWC
days (negative in FY15), c) market share gains (+300bps since FY10), d)
higher R&D spends (2.7% of sales vs. 1.3%), f) cost controls (we expect
+300bps margin jump), and g) various techno-commercial partnerships.
Product launches to strengthen growth profile: KOEL launched a host of
products in the past three years, including high kVA gensets, power tillers,
portable gensets, fire-fighting pumps and compact gensets for defence, which
are expected to generate 15% additional sales by FY18. Furthermore, the
company has identified portfolio gaps in its existing portfolio and will be
launching products to fill the gaps with an addressable market size of `55–60bn.
Strong FCF generation and RoIC at 25%+: RoEs appear low at 11%, though
business returns are not low. RoIC stands high at 29% for KOEL (in FY17E),
similar to Cummins India, despite a much lower margin profile. Also, free
cash flow generation yield stands strong at 6–7% during FY17–19, while cash
balance will increase to `93/share by the end of FY19 (16% of mkt cap).
Initiate with BUY and TP of `400: We forecast the adjusted net profit to increase
at a CAGR of 24% during FY16–19E, led by a sales CAGR of 13% and improving
margins (+300bps by FY19E). Our TP of `400 implies 20x Sep’18E EPS, 20%
premium to its LT median multiple. Compared to its peer MNC company, our
target multiple is at 15% discount, while PEG ratio is much lower at 0.8x vs 2.2x.
Key risks are technology disruption, management attrition and prolonged
stagnation in the real estate industry. E 1.Vicky
Sandeep Tulsiyan
Tel: (+91 22) 66303085
Key data
Market cap (bn) ` 51.1 / US$ 0.8
Shares in issue (mn) 144.6
Diluted share (mn) 144.6
3-mon avg daily val (mn) ` 9.5/US$ 0.1
52-week range ` 361.9/199.2
Sensex/Nifty 28,221/8,744
`/US$ 66.5
Daily performance
-20%-10%0%10%20%30%40%50%60%70%80%
0
50
100
150
200
250
300
350
400
Sep-13 Mar-14 Sep-14 Mar-15 Sep-15 Mar-16 Sep-16
Kirloskar Oil Engines
Kirloskar Oil Engines Relative to Sensex (RHS)
% 1M 3M 12M
Absolute 23.8 31.3 27.6
Relative 24.9 27.4 22.3
* To the BSE Sensex
Shareholding pattern (%)
Mar-16 Mar-15
Promoters 59.3 72.7
FII 12.3 10.7
DII 8.8 6.2
Public / Others 19.6 10.4
Kirloskar Oil Engines | KOEL IN
6 October 2016
India | Industrials | Initiating Coverage
Price: `353
BUY
12M Target: `400
Exhibit 1. Financial summary (` mn)
Y/E March FY15A FY16A FY17E FY18E FY19E
Net sales 25,071 24,547 27,949 31,604 34,987
Sales growth (%) 8.1 -2.1 13.9 13.1 10.7
EBITDA 2,486 2,397 3,361 3,952 4,560
EBITDA (%) 9.9 9.8 12.0 12.5 13.0
Adjusted net profit 1,431 1,615 2,213 2,692 3,079
EPS (`) 9.9 11.2 15.3 18.6 21.3
EPS growth (%) -19.8 12.8 37.0 21.7 14.4
ROIC (%) 11.3 11.9 16.7 21.5 24.7
ROE (%) 11.0 11.6 14.8 16.8 17.7
PE (x) 35.7 31.7 23.1 19.0 16.6
Price/Book value (x) 3.8 3.6 3.3 3.1 2.8
EV/EBITDA (x) 16.9 17.9 12.0 9.9 8.2
Source: Company data, JM Financial. Note: Valuations as of 06/10/2016
JM Financial Research is also available
on: Bloomberg - JMFR <GO>,
Thomson Publisher & Reuters,
S&P Capital IQ and FactSet
Please see Appendix I at the end of this
report for Important Disclosures and
Disclaimers and Research Analyst
Certification.

Kirloskar Oil Engines 6 October 2016
JM Financial Institutional Securities Limited Page 2
Executive summary
KOEL, established in 1944, manufactures diesel engines, used in generator sets,
industrial machinery and agricultural pumps. It is one of the largest diesel
generator manufacturers in India with a 30%/23% market share in volume/value
terms. It offers diesel generators up to the 1,000kVA and is the leader in the
<250kVA category. The company has four manufacturing facilities located at
Pune, Kagal, Nashik and Rajkot.
Exhibit 2. Company snapshot
Kirloskar Oil Engines
Power Generation
(40%)
Gensets
Alternators, batteries and control panel
Agriculture (17%)
Crop irrigation
Farm mechanisation
Industrial (14%)
Off-highway engines
Tractor engines
Customer Support (14%)
Large Engines (5%)
Stationary power plants
Marine, defence and
railways
Exports (10%)
Source: Company, JM Financial
Exhibit 3. Revenue share and growth drivers
Revenue
Sales CAGR (%) Sales CAGR (%)
Segment Share (%) Constituents FY13-16 FY16-19E Growth drivers
Power Generation 40% Power gensets 4.4 12.5
Commercial and residential real estate
Alternators, batteries and control panel
Infra investments like airports, metros
Agriculture 17% Crop Irrigation -0.1 15.9 Farm income
Farm Mechanisation Agriculture subsidies
Industrial
14% Off-highway engines -1.8 14.5
Road construction
Tractor engines
Customer Support 14% Maintenance and repair -1.8 11.3 Segment 1 and 3
Spare Parts
Large Engines 5% Stationary power plants -12.6 8.3 Nuclear power and marine
Marine, defence and railways
Exports 10% 11.2 5.6 Investments in MENA region
Total
100%
1.4 12.5
Source: Company, JM Financial

Kirloskar Oil Engines 6 October 2016
JM Financial Institutional Securities Limited Page 3
Investment thesis
Management change to drive new initiatives, product
launches
While KOEL has a rich history of bringing in new products to the market,
developed largely using in-house technology, we have observed improved
execution following the assumption of office by the new management in FY13. We
saw several changes, including swifter product launches, improved financials,
geographical expansion and signing of several new technology tie-ups. We take a
look at various changes brought in by the new management in the past four
years:
Swifter product launches under new management: KOEL launched a host of
new products in the past three years, including low kVA portable gensets (in
petrol and diesel variants), petrol/kerosene pumpsets, high discharge pumps,
high kVA gensets, power tillers under farm mechanisation umbrella brand
called KMW, fire-fighting pumps, and traded products such as alternators,
batteries and control panel. The products have been able to make up for 30%
of lost sales in the past three years. We expect these products to generate
`3.5–4bn of additional sales over FY17–18, forming around 15% of FY16
sales. Furthermore, the company has entered 2–3 new countries every year
through various product streams such as power generation, industrial and
agriculture. This has led to consistent increase in exports at a CAGR of 10.3%
over FY11–16 and increased its share from 6% to 10% of net sales.
Exhibit 4. New product launches and geographies entered between FY13–16
Year Products launched/markets entered
FY13 5kVA Chhota Chilli gensets
New markets: Mozambique and Tanzania
FY14 Petrol kerosene pumpsets
High discharge pumps
New markets: Togo, Benin, Burkina Faso, Philippines and Algeria
FY15 CPCB-2 compliant gensets under KOEL Green brand
Alternators for gensets and pumpsets
<5kVA petrol and diesel Chhota Chilli gensets
15-hp power tiller launched under KMW brand
Engines for new applications in industrial segment
750kVA genset launched
New markets: Israel, Australia, France
FY16 3 new variants of tiller launched
Higher hp fire-fighting pumpset
New Markets: Nicargua, Peru, Russia, UK
Source: Company, JM Financial
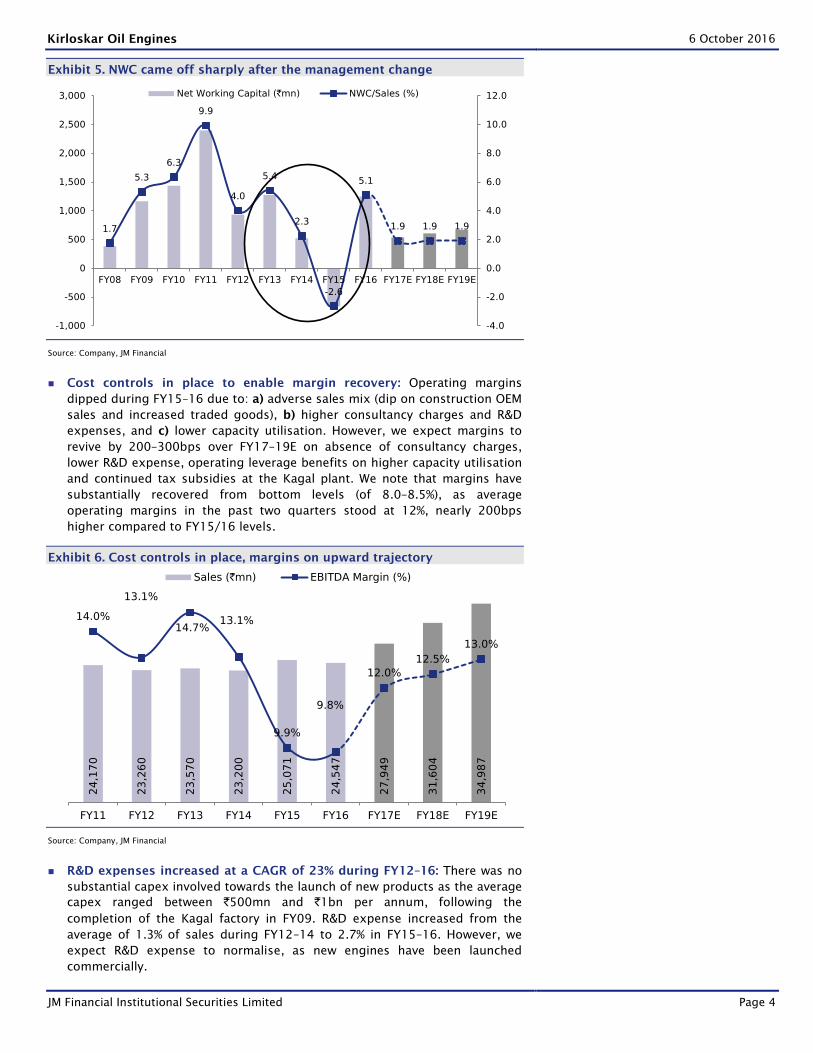
Net working capital declined materially: KOEL operates with an efficient net
working capital cycle of 15–20 days (during FY07–13) compared to Cummins
India, which operates at an average working capital of 70–90 days. The
difference is due to higher exposure to agriculture (25% of sales), low/mid
kVA gensets (25% of sales) and lower contribution of high kVA gensets (5% of
sales), which are linked to long gestation projects. However, the efficiency
was further enhanced as net working capital cycle turned negative during
FY15, leading to a jump in cash flows. The improvement was a function of a
dip in debtor days, which declined from 45 days in FY13 to 8/15 days in
FY15/16. We also highlight that though NWC appears to have reverted back
to 19 days in FY16; the same is owing to non-provision of dividend in FY16
and should settle in 5–10 days range as dividend provisioning normalises in
FY18/19.
Kirloskar Oil Engines 6 October 2016
JM Financial Institutional Securities Limited Page 4
Exhibit 5. NWC came off sharply after the management change
1.7
5.3
6.3
9.9
4.0
5.4
2.3
-2.6
5.1
1.9 1.9 1.9
-4.0
-2.0
0.0
2.0
4.0
6.0
8.0
10.0
12.0
-1,000
-500
0
500
1,000
1,500
2,000
2,500
3,000
FY08 FY09 FY10 FY11 FY12 FY13 FY14 FY15 FY16 FY17E FY18E FY19E
Net Working Capital (`mn) NWC/Sales (%)
Source: Company, JM Financial
Cost controls in place to enable margin recovery: Operating margins
dipped during FY15–16 due to: a) adverse sales mix (dip on construction OEM
sales and increased traded goods), b) higher consultancy charges and R&D
expenses, and c) lower capacity utilisation. However, we expect margins to
revive by 200–300bps over FY17–19E on absence of consultancy charges,
lower R&D expense, operating leverage benefits on higher capacity utilisation
and continued tax subsidies at the Kagal plant. We note that margins have
substantially recovered from bottom levels (of 8.0–8.5%), as average
operating margins in the past two quarters stood at 12%, nearly 200bps
higher compared to FY15/16 levels.
Exhibit 6. Cost controls in place, margins on upward trajectory
24
,17
0
23
,26
0
23
,57
0
23
,20
0
25
,07
1
24
,54
7
27
,94
9
31
,60
4
34
,98
7
14.0%
13.1%
14.7%13.1%
9.9%
9.8%
12.0%
12.5%
13.0%
FY11 FY12 FY13 FY14 FY15 FY16 FY17E FY18E FY19E
Sales (`mn) EBITDA Margin (%)
Source: Company, JM Financial
R&D expenses increased at a CAGR of 23% during FY12–16: There was no
substantial capex involved towards the launch of new products as the average
capex ranged between `500mn and `1bn per annum, following the
completion of the Kagal factory in FY09. R&D expense increased from the
average of 1.3% of sales during FY12–14 to 2.7% in FY15–16. However, we
expect R&D expense to normalise, as new engines have been launched
commercially.

Kirloskar Oil Engines 6 October 2016
JM Financial Institutional Securities Limited Page 5
Exhibit 7. R&D expense increased at a CAGR of 23% during FY12–16
0.9%
2.0%
1.3%1.2%
1.3%
2.5%
2.8%
0.0%
0.5%
1.0%
1.5%
2.0%
2.5%
3.0%
0
100
200
300
400
500
600
700
800
FY10 FY11 FY12 FY13 FY14 FY15 FY16
R&D expense (`mn) % of net sales
Source: Company, JM Financial
Product integration to avoid quality hiccups: Kirloskar started sales of
auxiliary genset products such as alternators, batteries and control panel
from 4QFY14 onwards. Integrating procurement of these products by KOEL
helped achieve various objectives such as: a) integration of product
manufacturing, b) reduction in product quality issues and c) creation of new
revenue stream. Sale of traded goods increase three-fold during FY11 to
FY16, and now constitute 17% of net sales, while average gross margins on
these products stand at 24% compared to 39% on manufactured products.
Exhibit 8. Products integrated to improve sales quality
Sales (`mn) FY11 FY12 FY13 FY14 FY15 FY16
Engines and Gensets 19 5 212 244 329 65
K-Oil 1,273 1,436 1,687 1,669 1,951 1,840
Alternators, Batteries, Panel and Switchgear 0 0 0 557 2,272 2,343
1,291 1,442 1,899 2,471 4,552 4,247
Gross Margin (%) FY11 FY12 FY13 FY14 FY15 FY16
Engines and Gensets 19% 10% 41% 25% 33% 17%
K-Oil 30% 27% 29% 31% 30% 38%
Alternators, Batteries, Panel and Switchgear 5% 10% 14%
Total 30% 27% 30% 25% 20% 24%
Source: Company, JM Financial
KOEL is among the few brands that increased market share: The diesel
power generator market contracted from `66bn in FY10 to `56bn in FY16,
due to a slump in the telecom tower market and decline in base load/prime
power market on improved power supply position. However, average
realisations increased during the period due to implementation of CPCB-2
norms in FY15, which bumped up realisations by 5–10%. Over the same
period, KOEL increased its value market share from 21% to 23%, and volume
share from 27% to 30%; this was achieved through extending its product
offerings and expanding its dealership network. We would like to highlight
that these gains are entirely organic in nature and there have been no
acquisitions in the past.

Kirloskar Oil Engines 6 October 2016
JM Financial Institutional Securities Limited Page 6
Exhibit 9. KOEL’s market share increased
Volume Share Value Share
27%
30%
24%
25%
26%
27%
28%
29%
30%
31%
FY10 FY16
21%
23%
20%
20%
21%
21%
22%
22%
23%
23%
FY10 FY16
Source: Company, JM Financial
Engaged in several technology tie-ups: We have noticed a sharp increase in
the number of technology tie-ups engaged in the past two years. While few
contracts were entered into for market access, most tie-ups were engaged to
source technology. Our interaction with the management indicates that the
company is not acquisitive in nature (despite large cash balance) and prefers
to increase its products offerings in new areas through technical tie-ups and
in-house development of technology.
Exhibit 10. Technology and commercial tie-ups in the past five years
Company Product Sector Year Rationale
Daihatsu Diesel
HHP propulsion
engines Marine Jul'11 Technology
Rolls Royce
MTU engines and
components Nuclear power Feb'15 Technology
Anglo Belgium Corp HHP traction engines Indian Railways FY16 Technology
Gulf Petrochem K-Oil
Gensets, tractors and
construction Jun'16 Market access
Biocube Corp Biocube equipment Renewable Energy Mar'16 Technology
Source: Company, JM Financial
New product launches to drive growth
Low kVA portable genset (diesel/petrol): KOEL launched low kVA gensets in
the 3–5kVA range, as the absence of diesel gensets in this category created
an opportunity, since running costs could be lowered by `10/litre. Later, the
company expanded its range to include petrol gensets in the 2–5kVA range
and expects to generate sales of `1–1.2bn in this segment. The segment
largely caters to residential units, small shops and restaurants, among others.
High kVA gensets: The DV series genset range was expanded to include 750
and 1,010 kVA gensets, which would complete KOEL’s product range in the
high kVa segment. Of the estimated market size of 1,500 units (up to 1,010
kVA), the company is expecting to garner a 10–15% market share with
potential sales of `900mn by FY18.
Power tillers: KOEL launched the 15-hp model initially and will be launching a
12-hp model soon to leverage on its distribution network catering to
agricultural customers. The company is looking to clock sales of 5,000–6,000
units in FY17, resulting in incremental sales of `750–900mn.
Fire-fighting pumpsets and compact gensets: The company launched niche
products such as fire-fighting pumpsets and compact gensets for defence
(mkt size: `1bn) to cater to specific applications, which will help expand the
addressable market, as diesel pumpsets sales are facing headwinds.

Kirloskar Oil Engines 6 October 2016
JM Financial Institutional Securities Limited Page 7
Exhibit 11. Revenue potential of new products
New products Incremental sales (`mn)
Portable gensets in 2–5kVA range 400-500
750/1,010 kVA gensets 800-1,000
Power tillers 1,000-1,500
Compact gensets and fire-fighting pumps 300-500
Exports 500-700
Total 3,000-4,200
Source: Company, JM Financial
Identified portfolio gaps, which will fuel future growth
Following successful launches of several new products across power generation,
agriculture and industrial segments, the management has identified its portfolio
gaps and probable launch pipeline over the next 3–4 years. To enable a launch
platform, it has developed several umbrella brands under each division such as
Kirloskar Mechanisation Works (KMW) for farm equipment, Kirloskar Shakti (for
alternators), Varsha (for agri. pumpsets), KOEL Green (for power generators), and
OEMCARE (for customer support). KOEL leverages its expansive dealer network
as it helps in: a) gauging customer feedback before launch, which helps in
introducing design/features accordingly (for e.g., power tillers), and b)
augmenting ROI of existing dealers and trade partners through expansion of
product range. New products identified in each sub segment are as follows:
Power generation: Genset nodes above 1,000 kVA range, namely 1,250 kVA,
1,500kVA and 2,000kVA.
Agriculture: Exploring trading opportunities in farm implements such as
rotavator, thresher and harvester.
Industrial: Engines for mining and railway applications.
Exhibit 12. Product portfolio gaps identified for future launches
Product Market size (`mn) Tentative launch period
Gensets above 1,010 kVA 3,500-4,000 2 to 2.5 years
Engines for mining applications 2,000-2,500 1 to 1.5 years
Engines for railways 7,500-8,000 1 to 1.5 years
Trading opportunities in farm mechanisation 40,000-45,000 4-5 years
Source: Company, JM Financial
12-17% of FY16 sales
Kirloskar Oil Engines 6 October 2016
JM Financial Institutional Securities Limited Page 8
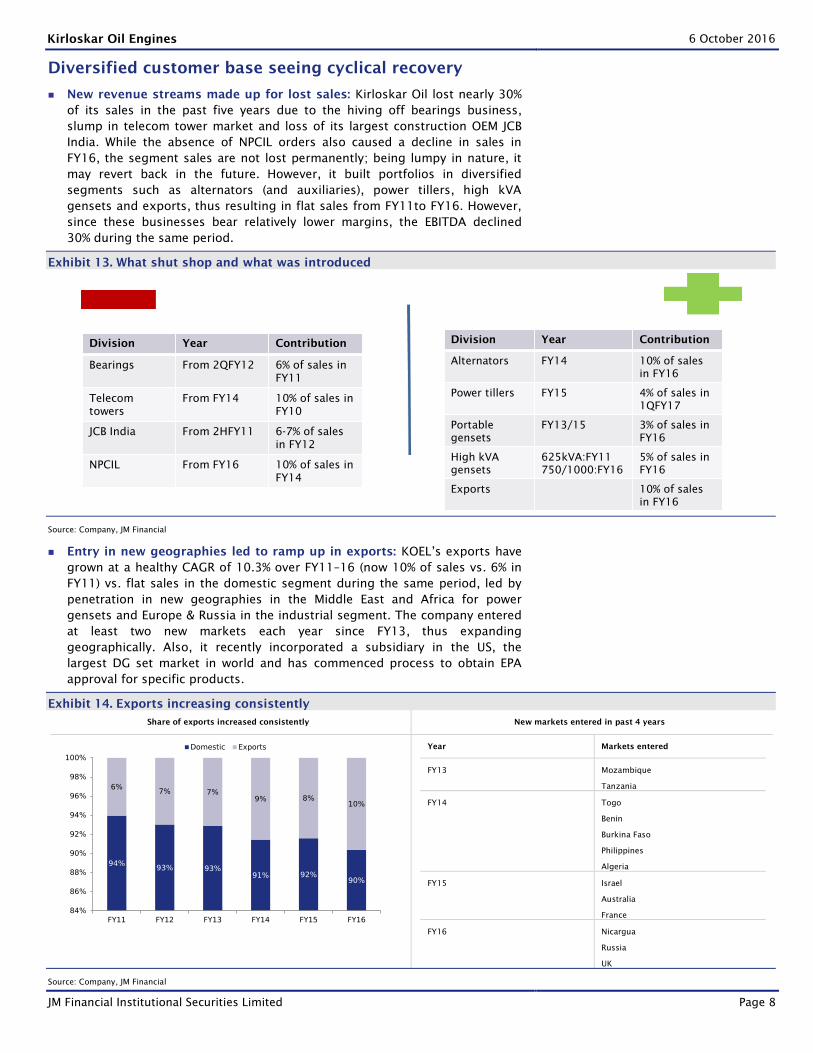
Diversified customer base seeing cyclical recovery
New revenue streams made up for lost sales: Kirloskar Oil lost nearly 30%
of its sales in the past five years due to the hiving off bearings business,
slump in telecom tower market and loss of its largest construction OEM JCB
India. While the absence of NPCIL orders also caused a decline in sales in
FY16, the segment sales are not lost permanently; being lumpy in nature, it
may revert back in the future. However, it built portfolios in diversified
segments such as alternators (and auxiliaries), power tillers, high kVA
gensets and exports, thus resulting in flat sales from FY11to FY16. However,
since these businesses bear relatively lower margins, the EBITDA declined
30% during the same period.
Exhibit 13. What shut shop and what was introduced
Source: Company, JM Financial
Entry in new geographies led to ramp up in exports: KOEL’s exports have
grown at a healthy CAGR of 10.3% over FY11–16 (now 10% of sales vs. 6% in
FY11) vs. flat sales in the domestic segment during the same period, led by
penetration in new geographies in the Middle East and Africa for power
gensets and Europe & Russia in the industrial segment. The company entered
at least two new markets each year since FY13, thus expanding
geographically. Also, it recently incorporated a subsidiary in the US, the
largest DG set market in world and has commenced process to obtain EPA
approval for specific products.
Exhibit 14. Exports increasing consistently
Share of exports increased consistently New markets entered in past 4 years
94%93% 93%
91% 92%90%
6%7% 7%
9% 8%10%
84%
86%
88%
90%
92%
94%
96%
98%
100%
FY11 FY12 FY13 FY14 FY15 FY16
Domestic Exports
Year Markets entered
FY13 Mozambique
Tanzania
FY14 Togo
Benin
Burkina Faso
Philippines
Algeria
FY15 Israel
Australia
France
FY16 Nicargua
Russia
UK
Source: Company, JM Financial
Division Year Contribution
Bearings From 2QFY12 6% of sales in
FY11
Telecom
towers
From FY14 10% of sales in
FY10
JCB India From 2HFY11 6-7% of sales
in FY12
NPCIL From FY16 10% of sales in
FY14
Division Year Contribution
Alternators FY14 10% of sales
in FY16
Power tillers FY15 4% of sales in
1QFY17
Portable
gensets
FY13/15 3% of sales in
FY16
High kVA
gensets
625kVA:FY11
750/1000:FY16
5% of sales in
FY16
Exports 10% of sales
in FY16

Kirloskar Oil Engines 6 October 2016
JM Financial Institutional Securities Limited Page 9
Strong RoIC and free cash flow generation profile
Strong balance sheet: Despite stagnant sales and 30% lower EBITDA in the
past five years, Kirloskar Oil’s strong balance sheet stands strong, led by
minimal capex (`50–100mn per annum), improved working capital efficiency
and repayment of loans. With an estimated profit CAGR of 24% during FY16–
19E and a conservative approach towards acquisitions by the management,
we expect the company’s balance sheet strength to improve further.
Robust cash flow generation, leading to improved cash balance: KOEL
generates operating cash flows amounting to `3.8–4.2bn per annum, while
capex requirement are minimal given the current capacity utilisation rates are
hovering between 50% and 60%. This has led to a burgeoning cash balance,
which stands at `8.3bn or `57/share at the end of FY16 and is expected to
increase to `13.5bn by the end of FY19 or `93/share (including liquid
investments).
Exhibit 15. FCF generation profile aiding cash per share to increase consistently
42
3
3,6
27
1,3
38
2,8
32
3,1
04
-33
1
3,5
98
2,7
71
3,2
12
39.035.3
42.5
47.4
60.8 61.9 54.2 54.2 54.2
0.0
10.0
20.0
30.0
40.0
50.0
60.0
70.0
-1,000
-500
0
500
1,000
1,500
2,000
2,500
3,000
3,500
4,000
FY11 FY12 FY13 FY14 FY15 FY16 FY17E FY18E FY19E
Free Cash Flow (`mn) Dividend payout (%)
327 327 327 327 327 327 327 327 327 327
18.1 22.0 38.1 30.6 45.6 62.3 57.1 73.7 82.8 93.5
FY10 FY11 FY12 FY13 FY14 FY15 FY16 FY17E FY18E FY19E
CMP (`/share) Cash on books (`/share)
Source: Company, JM Financial
Strong RoIC profile, comparable to market leader: RoEs appear low at 11%,
though business returns are very healthy. RoIC is expected to increase to 29%
in FY17, which is similar to Cummins India, despite a much lower margin
profile of 12–13% vs. 16-17% for Cummins India. However, we note that core
RoICs may exceed Cummins India by a huge margin as margins expand on
operating leverage benefits due to higher capacity utilisation.
Exhibit 16. RoIC profile similar to Cummins
10%
20%
30%
40%
50%
60%
70%
FY11 FY12 FY13 FY14 FY15 FY16 FY17E FY18E FY19E
KOEL Cummins India
Source: Company, JM Financial

Kirloskar Oil Engines 6 October 2016
JM Financial Institutional Securities Limited Page 10
Company Overview
KOEL, established in 1944, manufactures diesel engines, used in generator sets,
industrial machinery and agricultural pumps. It is one of the largest diesel
generator manufacturers in India with a 30%/23% market share in volume/value
terms. It offers diesel generators up to the 1,000kVA and is the leader in the
<250kVA category. The company has four manufacturing facilities located at
Pune, Kagal, Nashik and Rajkot.
Exhibit 17. Company snapshot
Kirloskar Oil Engines
Power Generation
(40%)
Gensets
Alternators, batteries and control panel
Agriculture (17%)
Crop irrigation
Farm mechanisation
Industrial (14%)
Off-highway engines
Tractor engines
Customer Support (14%)
Large Engines (5%)
Stationary power plants
Marine, defence and
railways
Exports (10%)
Source: Company, JM Financial
Exhibit 18. Manufacturing locations
Location Unit Products manufactured
Pune I Engines
Kagal I Engines, gensets and pumpsets
II Engines
III Power Tillers
Spare Parts Spares, packing and distributing
Nashik I Engines
Rajkot I Engines, gensets and pumpsets
Spare Parts
Bhare I Gensets and Pumpsets
Source: Company

Kirloskar Oil Engines 6 October 2016
JM Financial Institutional Securities Limited Page 11
Power generation (40% of sales)
Exhibit 19. Power generation: Segment overview
Power Generation (40% of sales)
DV Series
From 325-750kVA
Alternators, batteries, panel, switchgear
Low/mid kVA gensets
Source: Company
Genset industry contracted from its peak in FY10…: The Indian power
genset industry has been on a steady downward trend contracting from
`65.5bn in FY10 to just over `5.5bn in FY16. This can be attributed to two
major factors: a) the overall pick up in power generation, which has resulted
in peak/base deficit slumping from 16.6/9.8% in FY08 to a mere 2.0/0.7% in
YTDFY17, and b) muted demand from the telecom tower market, which
witnessed a drastic slowdown in the annual tower addition from 60,000
during FY08–12 to just 6,000 in FY16. Moreover, forecasts indicate that India
might have a base power surplus of 1.1% in FY17, which would pose more
challenges to the growth of the genset industry.
Exhibit 20. Anathema of diesel genset market
Power deficit nearly eliminated Telecom tower additions fell
9.9 9.8
11.010.1
8.5 8.5 8.7
4.2
3.62.1
0.7
13.5
16.6
12.0
13.3
10.311.1
9.0
4.5 4.7
0.42.0
FY07 FY08 FY09 FY10 FY11 FY12 FY13 FY14 FY15 FY16 YTDFY17
Base Deficit (%) Peak Deficit (%)
14
,28
3
27
,41
8
46
,00
0
61
,31
7
64
,90
0
76
,80
8
52
,97
5
15
,00
0
4,0
00
1,0
00
6,0
00
7,0
00
2005 2006 2007 2008 2009 2010 2011 2012 2013 2014 2015 2016
Telecom Tower additions (units)
Source: JM Financial
Kirloskar Oil Engines 6 October 2016
JM Financial Institutional Securities Limited Page 12
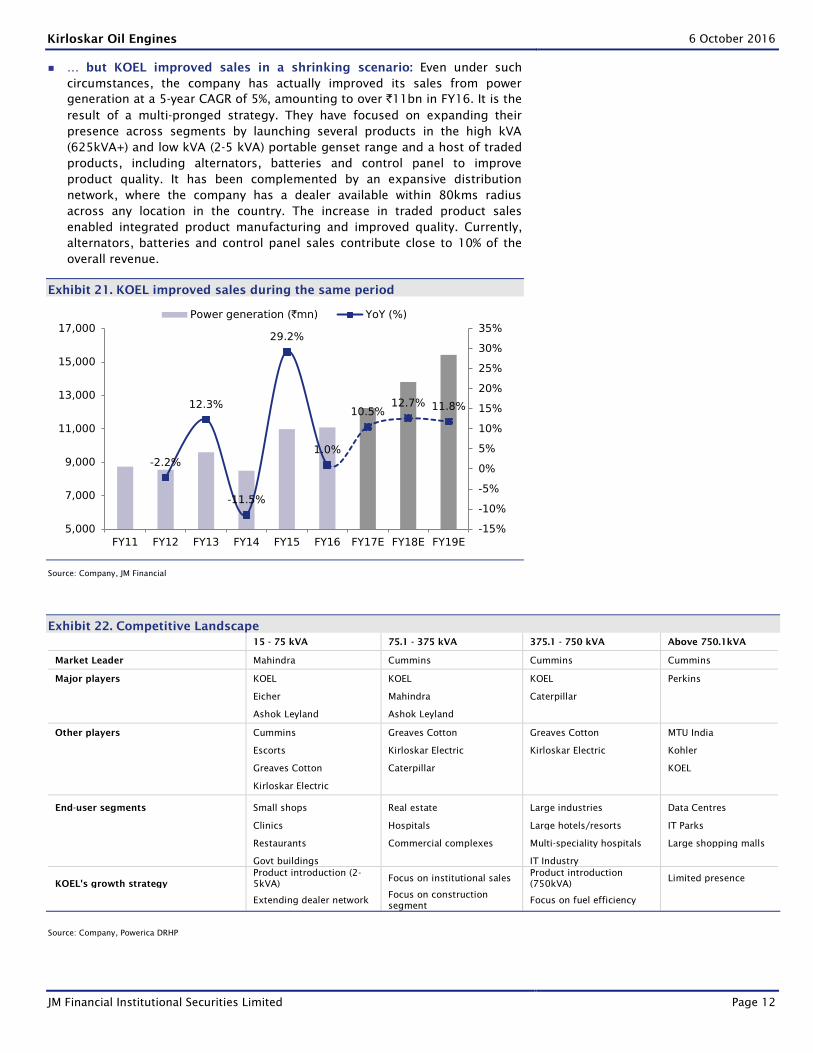
… but KOEL improved sales in a shrinking scenario: Even under such
circumstances, the company has actually improved its sales from power
generation at a 5-year CAGR of 5%, amounting to over `11bn in FY16. It is the
result of a multi-pronged strategy. They have focused on expanding their
presence across segments by launching several products in the high kVA
(625kVA+) and low kVA (2-5 kVA) portable genset range and a host of traded
products, including alternators, batteries and control panel to improve
product quality. It has been complemented by an expansive distribution
network, where the company has a dealer available within 80kms radius
across any location in the country. The increase in traded product sales
enabled integrated product manufacturing and improved quality. Currently,
alternators, batteries and control panel sales contribute close to 10% of the
overall revenue.
Exhibit 21. KOEL improved sales during the same period
-2.2%
12.3%
-11.5%
29.2%
1.0%
10.5%12.7% 11.8%
-15%
-10%
-5%
0%
5%
10%
15%
20%
25%
30%
35%
5,000
7,000
9,000
11,000
13,000
15,000
17,000
FY11 FY12 FY13 FY14 FY15 FY16 FY17E FY18E FY19E
Power generation (`mn) YoY (%)
Source: Company, JM Financial
Exhibit 22. Competitive Landscape
15 - 75 kVA 75.1 - 375 kVA 375.1 - 750 kVA Above 750.1kVA
Market Leader Mahindra Cummins Cummins Cummins
Major players KOEL KOEL KOEL Perkins
Eicher Mahindra Caterpillar
Ashok Leyland Ashok Leyland
Other players Cummins Greaves Cotton Greaves Cotton MTU India
Escorts Kirloskar Electric Kirloskar Electric Kohler
Greaves Cotton Caterpillar KOEL
Kirloskar Electric
End-user segments Small shops Real estate Large industries Data Centres
Clinics Hospitals Large hotels/resorts IT Parks
Restaurants Commercial complexes Multi-speciality hospitals Large shopping malls
Govt buildings IT Industry
KOEL's growth strategy
Product introduction (2-
5kVA) Focus on institutional sales
Product introduction
(750kVA) Limited presence
Extending dealer network Focus on construction
segment Focus on fuel efficiency
Source: Company, Powerica DRHP
Kirloskar Oil Engines 6 October 2016
JM Financial Institutional Securities Limited Page 13
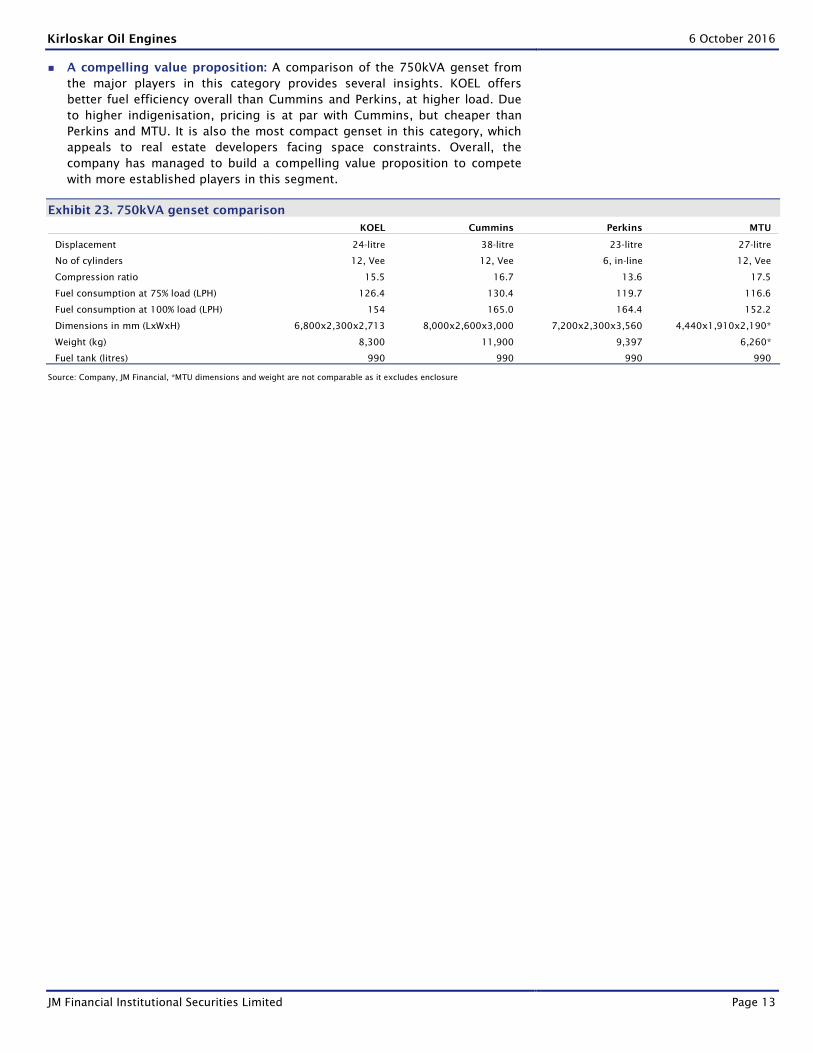
A compelling value proposition: A comparison of the 750kVA genset from
the major players in this category provides several insights. KOEL offers
better fuel efficiency overall than Cummins and Perkins, at higher load. Due
to higher indigenisation, pricing is at par with Cummins, but cheaper than
Perkins and MTU. It is also the most compact genset in this category, which
appeals to real estate developers facing space constraints. Overall, the
company has managed to build a compelling value proposition to compete
with more established players in this segment.
Exhibit 23. 750kVA genset comparison
KOEL Cummins Perkins MTU
Displacement 24-litre 38-litre 23-litre 27-litre
No of cylinders 12, Vee 12, Vee 6, in-line 12, Vee
Compression ratio 15.5 16.7 13.6 17.5
Fuel consumption at 75% load (LPH) 126.4 130.4 119.7 116.6
Fuel consumption at 100% load (LPH) 154 165.0 164.4 152.2
Dimensions in mm (LxWxH) 6,800x2,300x2,713 8,000x2,600x3,000 7,200x2,300x3,560 4,440x1,910x2,190*
Weight (kg) 8,300 11,900 9,397 6,260*
Fuel tank (litres) 990 990 990 990
Source: Company, JM Financial, *MTU dimensions and weight are not comparable as it excludes enclosure

Kirloskar Oil Engines 6 October 2016
JM Financial Institutional Securities Limited Page 14
Agriculture (17% of sales)
Exhibit 24. Agriculture: Segment Overview
Agriculture (17% of sales)
Crop Irrigation
Pumpsets
Farm mechanisation
Power tillers
Tractor spares
Source: Company
KOEL has product offerings that cater to the crop irrigation and farm
mechanisation segments.
Weak monsoons played havoc for crop irrigation sales: Portfolio includes a
range of products such as engines in the 3–130hp range, largely catering to
diesel, petrol and kerosene pumpsets in the agriculture segment. In addition,
it sells small quantities of engines to concrete mixers, hoists, harvesters,
threshers, in/out-board motors. India has had to endure below normal
monsoons for the past two years, resulting in low farm incomes. Also,
improved rural electrification and energisation of pumpsets has led to
migration of diesel pumps customers to electric/solar power-based pumpsets
in smaller ranges (3–5hp). Consequently, the crop irrigation segment has
expanded at a 5-year CAGR of just 1.4%.
Exhibit 25. Monsoons trend over the past decade
-0.5 -0.6
5.3
-1.9
-22.5
2.61.0
-7.9
5.2
-12.6
-14.5
-3.0
-25.0
-20.0
-15.0
-10.0
-5.0
0.0
5.0
10.0
2005 2006 2007 2008 2009 2010 2011 2012 2013 2014 2015 2016
Monsoon surplus/(deficit) ((%)
Source: IMD. +/-6% is considered normal

Kirloskar Oil Engines 6 October 2016
JM Financial Institutional Securities Limited Page 15
KOEL sailed through by introducing new products and market share
gains: However, KOEL was able to outperform weak industry sales through: a)
launch of traded products (alternators and oil), b) expansion of dealer
network and service outlets, c) extension of product offerings
(petrol/kerosene pumpsets), and d) increase in market share from 15% to
20%. It has also consolidated all engines under the Varsha brand to improve
brand recall/recognition. With better monsoons in 2016, pumpset sales are
expected to improve. In 1QFY17, the company had added 900 retailers
enabling network strength of 18,000+ in this segment.
Exhibit 26. Crop irrigation sales trend
-3%
24%
-12% -18%
11%
-20%
-15%
-10%
-5%
0%
5%
10%
15%
20%
25%
30%
0
500
1,000
1,500
2,000
2,500
3,000
3,500
4,000
4,500
FY11 FY12 FY13 FY14 FY15 FY16
Crop irrigation sales (`mn) YoY (%)
Source: Company, JM Financial
Farm mechanisation levels set to rise: This sub-segment has emerged as a
real growth driver in recent years aided by a number of structural factors.
Current farm mechanisation levels in India stand at a lowly 40%. Agriculture
studies indicate using a tractor in paddy fields is difficult due to swamp soil
conditions, while paddy constitutes 16% of arable land in India and 15% of
total agricultural output. With MSP for paddy increasing at 4-5% per annum in
the past 4 years, thereby improving yields, paddy cultivation is expected to
substantially go up. KOEL has a major presence in all the top 7 states, which
constitute nearly 65% of total paddy output. Low farm income makes
investment in farm mechanisation equipment unviable. Thus, the government
provides subsidy of 30–50% for different equipment. Current subsidy rates for
power tillers vary between 40% and 50%, thus bringing down the initial
investment to `30,000-40,000 (assuming LTV of 70%).
Exhibit 27. Paddy share highest among food grains
State Paddy share (%)
West Bengal 14%
Uttar Pradesh 14%
Andhra Pradesh 12%
Punjab 11%
Odisha 7%
Chhattisgarh 6%
Tamil Nadu 5%
Rest of India 31%
Source: Ministry of agriculture

Kirloskar Oil Engines 6 October 2016
JM Financial Institutional Securities Limited Page 16
Exhibit 28. Paddy prices on continuous uptick
` /quintal FY13 FY14 FY15 FY16 FY17
Common 1,250 1,310 1,360 1,410 1,470
YoY (%) 16% 5% 4% 4% 4%
Grade A 1,280 1,345 1,400 1,450 1,510
YoY (%) 15% 5% 4% 4% 4%
Source: Agri. census
Exhibit 29. Subsidy structure of power tiller
Name of the
Farm
Equipment
For SC, ST, Small & Marginal
Farmers, Women and NE States’
Beneficiaries
For Other Beneficiaries
Maximum Permissible
subsidy per
Equipment
Assistance
Maximum
Permissible
subsidy per
Equipment
Assistance
Power Tiller
(below 8 BHP) `50,000 50% `40,000 40%
Power Tiller (8
BHP & above) `75,000 50% `60,000 40%
Source: RKVY
Subsidy approval, superior features to drive sales: KOEL’s power tiller is
launched after receiving first hand feedback from farmers through its
dealerships and stands above competition with features such as higher
power, seat, brakes, self-start and fuel-efficiency. Kirloskar launched power
tillers (15hp) under an umbrella brand KMW and clocked sales of `200mn in
FY16, which caters to small/marginal farmers, as it performs most functions
of tractors, while being more cost efficient. The company sold 1,000 tillers in
1QFY17 vs. 1,443 sold in FY16. Subsidy approval in other states will increase
volumes to 500-600 tillers/month compared to 350 tillers/month currently.
Exhibit 30. Power tiller industry sales trend
17
,48
1
22
,30
3
24
,79
1
26
,13
5
35
,29
4
38
,79
4
55
,10
0
60
,00
0
47
,00
0
56
,00
0
48
,00
0
50
,00
0
27.6%
11.2%
5.4%
35.0%
9.9%
42.0%
8.9%
-21.7%
19.1%
-14.3%
4.2%
-30%
-20%
-10%
0%
10%
20%
30%
40%
50%
0
10,000
20,000
30,000
40,000
50,000
60,000
70,000
FY05 FY06 FY07 FY08 FY09 FY10 FY11 FY12 FY13 FY14 FY15 FY16
Units YoY (%)
Source: Industry, JM Financial

Kirloskar Oil Engines 6 October 2016
JM Financial Institutional Securities Limited Page 17
Tillers offer strong value proposition against low cost tractors: Power
tillers cost ` 0.12-0.15mn compared to a tractor, which costs ` 0.3-0.8mn.
Also, government subsidy on tillers is much higher at 40-50% vs. 25-35% for
tractors. KOEL also launched two variants of tillers for sugarcane (12hp) and a
deluxe version (self-start). Power tillers manufactured by KOEL (Mega-T) are
sold through 180 dealerships (till 1QFY17) and present in 14 states. Fitments
available with Mega-T enable it to perform functions carried out by tractors
such as: hauling (up to 1.5ton), ploughing, sowing, spraying, ridging, potato
digging, hopping and puddling.
Exhibit 31. Tiller vs. tractors
Power tiller Tractors
Engine 9-15hp 15-90hp
Type Single cylinder Multi cylinder
Seat Yes Yes
Self-start Yes Yes
Drive 2W 4W
Subsidy 40-50% 25-35%
License requirement No Yes
Speed Up to 15kmph Up to 50kmph
Navigation Difficult Easy
Multiple use Yes Tillers + lifting + harvesting
Source: Company website
Superior features to drive market share gains: Kirloskar’s Mega-T delivers
many unique features such as: a) seating for long working hours, b) safety
feature like brakes, and c) self-start systems. Pricing, power and speed are
not comparable as other brands have relatively less powerful products in the
12–15hp market. The company has also introduced a 12hp variant recently
and has stated that it will be targeting volumes initially vs. profits.
Exhibit 32. KOEL tiller stands out vs. competition
Mega-T VST (40% share) KAMCO (25% share)
Engine 15 hp 13 hp 12 hp
Type
4-stroke single
cylinder
4-stroke single
cylinder
4-stroke single
cylinder
Displacement 996 cc 673cc 744cc
Start system Self-start Hand cranking Hand cranking
Brakes Yes No No
Seat Yes No No
Gears-forward 6 6 6
Gears-reverse 2 2 2
Speed 15.88kmph 14.2kmph 15kmph
Source: Company websites
Existing dealer platforms to will be capitalised to launch new products:
New set of agriculture implements are being assessed and will be soon
introduced through its dealerships, thus improving their RoI. It recently
launched a rotavator under ‘Univator’ brand and will be gradually expanding
its product range to capture the `50bn farm mechanisation market.

Kirloskar Oil Engines 6 October 2016
JM Financial Institutional Securities Limited Page 18
Industrials (14% of sales)
Exhibit 33. Industrials: Segment Overview
Industrial (14% of sales)
Off-highway Tractors
Source: JM Financial
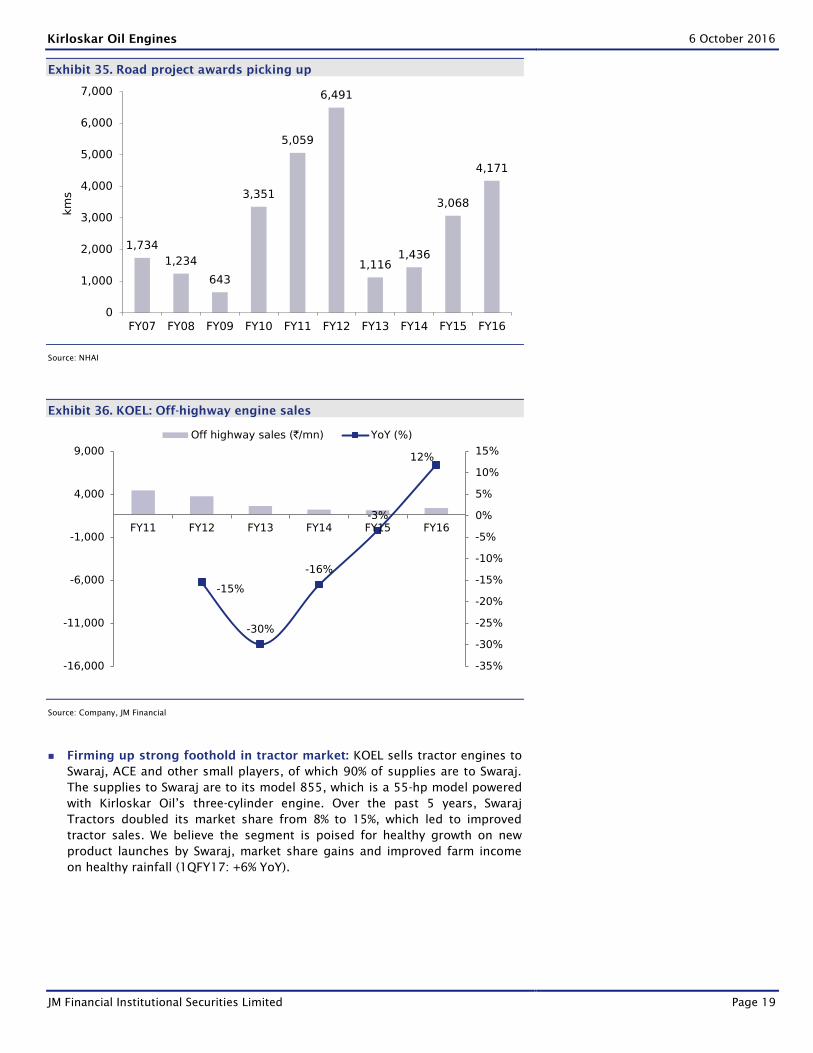
Improved road project awards raise high double-digit growth
expectation: KOEL sells engines in the 20-800hp range catering to various
applications such as earthmoving, construction, mining, mat handling and
fluid handling. The construction equipment market (10% of sales) stabilised
after four consecutive years of decline. The company holds a market share of
30%, down from 55% as supplies to JCB India stopped after the latter
integrated backwards. However, sales have improved in FY16 on: a) OEM
additions and b) launch of new products (excavators, motor graders and fire-
fighting). We expect this segment to grow in high double-digits on improved
road project awards (1QFY17: +40% YoY).
Exhibit 34. Construction engine industry sales slumped during FY11-16
70
,00
0
80
,00
0
64
,00
0
55
,00
0
46
,00
0
47
,00
0
14%
-20%
-14%-16%
2%
-25%
-20%
-15%
-10%
-5%
0%
5%
10%
15%
20%
25%
-1,00,000
-80,000
-60,000
-40,000
-20,000
0
20,000
40,000
60,000
80,000
1,00,000
FY11 FY12 FY13 FY14 FY15 FY16
No of units YoY (%)
Source: Company, JM Financial
Kirloskar Oil Engines 6 October 2016
JM Financial Institutional Securities Limited Page 19
Exhibit 35. Road project awards picking up
1,734
1,234
643
3,351
5,059
6,491
1,1161,436
3,068
4,171
0
1,000
2,000
3,000
4,000
5,000
6,000
7,000
FY07 FY08 FY09 FY10 FY11 FY12 FY13 FY14 FY15 FY16
km
s
Source: NHAI
Exhibit 36. KOEL: Off-highway engine sales
-15%
-30%
-16%
-3%
12%
-35%
-30%
-25%
-20%
-15%
-10%
-5%
0%
5%
10%
15%
-16,000
-11,000
-6,000
-1,000
4,000
9,000
FY11 FY12 FY13 FY14 FY15 FY16
Off highway sales (`/mn) YoY (%)
Source: Company, JM Financial
Firming up strong foothold in tractor market: KOEL sells tractor engines to
Swaraj, ACE and other small players, of which 90% of supplies are to Swaraj.
The supplies to Swaraj are to its model 855, which is a 55-hp model powered
with Kirloskar Oil’s three-cylinder engine. Over the past 5 years, Swaraj
Tractors doubled its market share from 8% to 15%, which led to improved
tractor sales. We believe the segment is poised for healthy growth on new
product launches by Swaraj, market share gains and improved farm income
on healthy rainfall (1QFY17: +6% YoY).

Kirloskar Oil Engines 6 October 2016
JM Financial Institutional Securities Limited Page 20
Exhibit 37. Tractor sales are expected to witness cyclical uptick
Tractor sales slumped in FY15-16, now reviving Swaraj engines gaining market share consistently
-20%
-10%
0%
10%
20%
30%
40%
50%
60%
70%
80%
FY09 FY10 FY11 FY12 FY13 FY14 FY15 FY16
Industry Volumes - YoY Swaraj Engines - YoY
9.0%
11.6%11.9%
12.4% 12.6%13.1%
13.7% 13.8%
15.3%
5.0%
7.0%
9.0%
11.0%
13.0%
15.0%
17.0%
FY08 FY09 FY10 FY11 FY12 FY13 FY14 FY15 FY16
Source: Company, JM Financial
Exhibit 38. KOEL’s tractor engine sales
42%
-23%
50%
-6% -5%
-30%
-20%
-10%
0%
10%
20%
30%
40%
50%
60%
0
200
400
600
800
1,000
1,200
1,400
FY11 FY12 FY13 FY14 FY15 FY16
Tractor sales (`/mn) YoY (%)
Source: Company, JM Financial
Kirloskar Oil Engines 6 October 2016
JM Financial Institutional Securities Limited Page 21
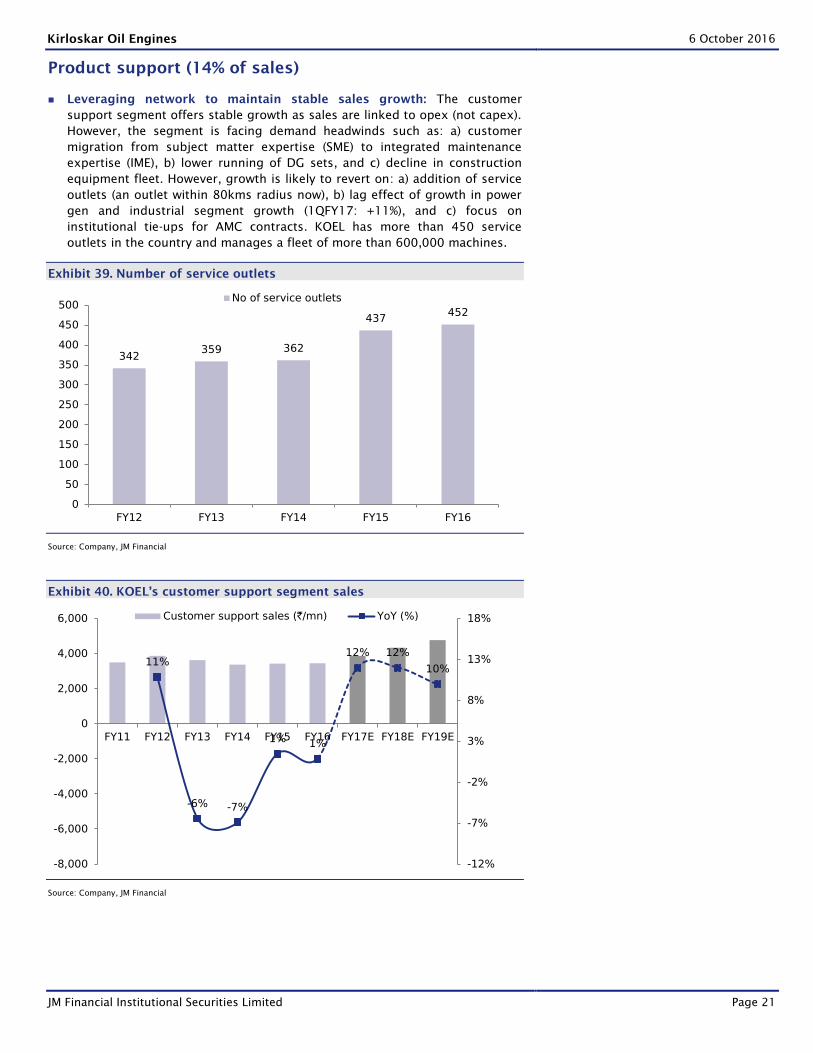
Product support (14% of sales)
Leveraging network to maintain stable sales growth: The customer
support segment offers stable growth as sales are linked to opex (not capex).
However, the segment is facing demand headwinds such as: a) customer
migration from subject matter expertise (SME) to integrated maintenance
expertise (IME), b) lower running of DG sets, and c) decline in construction
equipment fleet. However, growth is likely to revert on: a) addition of service
outlets (an outlet within 80kms radius now), b) lag effect of growth in power
gen and industrial segment growth (1QFY17: +11%), and c) focus on
institutional tie-ups for AMC contracts. KOEL has more than 450 service
outlets in the country and manages a fleet of more than 600,000 machines.
Exhibit 39. Number of service outlets
342359 362
437452
0
50
100
150
200
250
300
350
400
450
500
FY12 FY13 FY14 FY15 FY16
No of service outlets
Source: Company, JM Financial
Exhibit 40. KOEL’s customer support segment sales
11%
-6% -7%
1% 1%
12% 12%
10%
-12%
-7%
-2%
3%
8%
13%
18%
-8,000
-6,000
-4,000
-2,000
0
2,000
4,000
6,000
FY11 FY12 FY13 FY14 FY15 FY16 FY17E FY18E FY19E
Customer support sales (`/mn) YoY (%)
Source: Company, JM Financial

Kirloskar Oil Engines 6 October 2016
JM Financial Institutional Securities Limited Page 22
Large Engines (5% of sales)
Lumpy nature of NPCIL order keeps growth topsy-turvy in this segment:
KOEL supplies diesel engines in 2,400hp to 11,000hp catering to DG sets
from 1.7MW to 7.1MW for stationary power plants. Sales in this segment are
lumpy due to the investment nature of NPCIL, which procures gensets for
critical standby purpose. Following the completion of the large order from
NPCIL in 1HFY15, we saw a sharp drop in sales in the large engines business
segment. Currently, KOEL is under negotiation for a large order from NPCIL,
but we have not factored the same in our estimates due to uncertain nature
of order.
Technology tie-ups and new products to drive growth: KOEL engaged in
several technology tie-ups with Rolls Royce for high capacity MTU engines,
Bio Cube Corp, Canada, and Anglo Belgium Corp for HHP rail engines to
increase its product offerings in the large engine segment. The company is
targeting to improve growth in LEBG through: a) new products in defence:
compact genset for Indian army (mkt size: `1bn) and energy systems for
radar applications at high altitudes, b) new products for the Indian Railways,
working with RDSO, and c) initiated export of marine engines through first
order from Bangladesh.
Exhibit 41. Large engine business overview
Large engines business split Customer profile
Large Engines (5% of sales)
Stationary power plantsPropusion and auxiliary
engines
Stationary power plants Propulsion auxiliary sets and spares
Nuclear Power Corp India Indian Navy
Bharat Heavy Electricals Ltd Ship builders
Engineers India Ship owners
MECON Ship operators
Bechtel
Source: Company, JM Financial
Exhibit 42. Large engine segment’s sales trend
1,150 1,154 1,107 1,363 1,120
260 526 1,903
1,057
0
500
1,000
1,500
2,000
2,500
3,000
3,500
FY12 FY13 FY14 FY15 FY16
`m
n
Propulsion auxiliary sets and spares Stationary power plants
Source: Company, JM Financial
NPCIL order

Kirloskar Oil Engines 6 October 2016
JM Financial Institutional Securities Limited Page 23
Exports (10% of sales)
Witnessing consistent growth in sales since FY11: Exports constitute 10%
of net sales and have expanded consistently at a CAGR of 10.3% over FY11–
16 compared to domestic sales, which remained flat during the same period.
The growth was largely driven by the expansion of the existing product
franchise to new markets. While the company exports to over 40 countries,
nearly 90% of its exports are concentrated in the Middle East (58%) and Africa
(30%).
Exhibit 43. Exports: Sales grown consistently
11%
4%
18%
4%
13%
0%
8%9%
-5%
0%
5%
10%
15%
20%
0
500
1,000
1,500
2,000
2,500
3,000
FY11 FY12 FY13 FY14 FY15 FY16 FY17E FY18E FY19E
Exports (Rsmn) YoY (%)
Source: Company, JM Financial
Entry in new markets to drive future growth: KOEL has a vision to expand
footprint across the globe by 2025, by consistently entering 2–3 new
countries each year. While penetration in the Middle East and Africa is
through power gensets, entry in Europe and Russia is for industrial engines.
KOEL also recently incorporated a subsidiary in the US, the largest DG set
market in world and has identified products to get EPA approval.
Exhibit 44. Exports split: Geography and segment wise
The Middle East and Africa constitute 90% of exports Export sales split between different segments
Middle East58%
Africa30%
South Asia5%
Americas4%
Others3%
Power gen57%
Agriculture15%
Industrial20%
Customer support
8%
Large engines0%
Source: Company, JM Financial

Kirloskar Oil Engines 6 October 2016
JM Financial Institutional Securities Limited Page 24
Financials
Net sales growth to accelerate after a long lull: Over FY11–16, net sales
remained flat as the company lost nearly 30% of sales due to the hiving off
bearings division, backward integration of JCB India and slump in the telecom
tower segment. However, we expect KOEL to report sales CAGR of 13% over
FY16-19E, of which nearly 50% of incremental sales will be driven from launch
of new products, while existing product portfolio is expected to at a CAGR of
6-7%.
Robust net profit CAGR of 24%: Adjusting for VRS expense, net profit in
FY16 was lower by 10% compared to FY11. This drop was on due to flat sales
and shrinking margin profile, as operating margins declined from 14% in
FY11 to 9.8% in FY16. Shrinking sales in lucrative sectors such as
construction OEM, lower capacity utilisation and increasing share of traded
goods led to the drop in margins. However, operating margins are expected
to bounce back by 300bps over FY16–19E, led by the improving sales mix,
absence of higher consultancy/R&D charges and operating leverage benefits.
Thus, we expect adjusted net profit CAGR of 24% over FY16–19E.
Exhibit 45. Operational performance since FY11
Sales and EBITDA margin trend Net profit and growth trend
24
,17
0
23
,26
0
23
,57
0
23
,20
0
25
,07
1
24
,54
7
27
,94
9
31
,60
4
34
,98
7
14.0%
13.1%
14.7%13.1%
9.9%
9.8%
12.0%
12.5%
13.0%
FY11 FY12 FY13 FY14 FY15 FY16 FY17E FY18E FY19E
Sales (`mn) EBITDA Margin (%)
1,7
74
1,5
84
2,1
22
1,7
85
1,4
31
1,6
15
2,2
13
2,6
92
3,0
79
8.2%
-10.7%
34.0%
-15.9%
-19.8%
12.8%
37.0%
21.7%14.4%
FY11 FY12 FY13 FY14 FY15 FY16 FY17E FY18E FY19E
Net Profit (`mn) Growth (%)
Source: Company, JM Financial
Net working capital days turned negative: Kirloskar witnessed a significant
improvement in net working capital days as it turned negative from an
average of 20 days prior to FY13 to -10 days in FY15. The same was achieved
due to sharp reduction in debtors, which declined from 45 days in FY13 to 8
days in FY15 and 23 days in FY16. Although NWC jumped to 19 days in FY16,
we highlight that the same was due to non-provision of dividend in FY16,
resulting in a swing of 13 days. Cash conversion cycle remained low at three
days. We note that the NWC days will remain low in the 5-7 days range, as
dividend provisioning normalises from FY17 onwards.
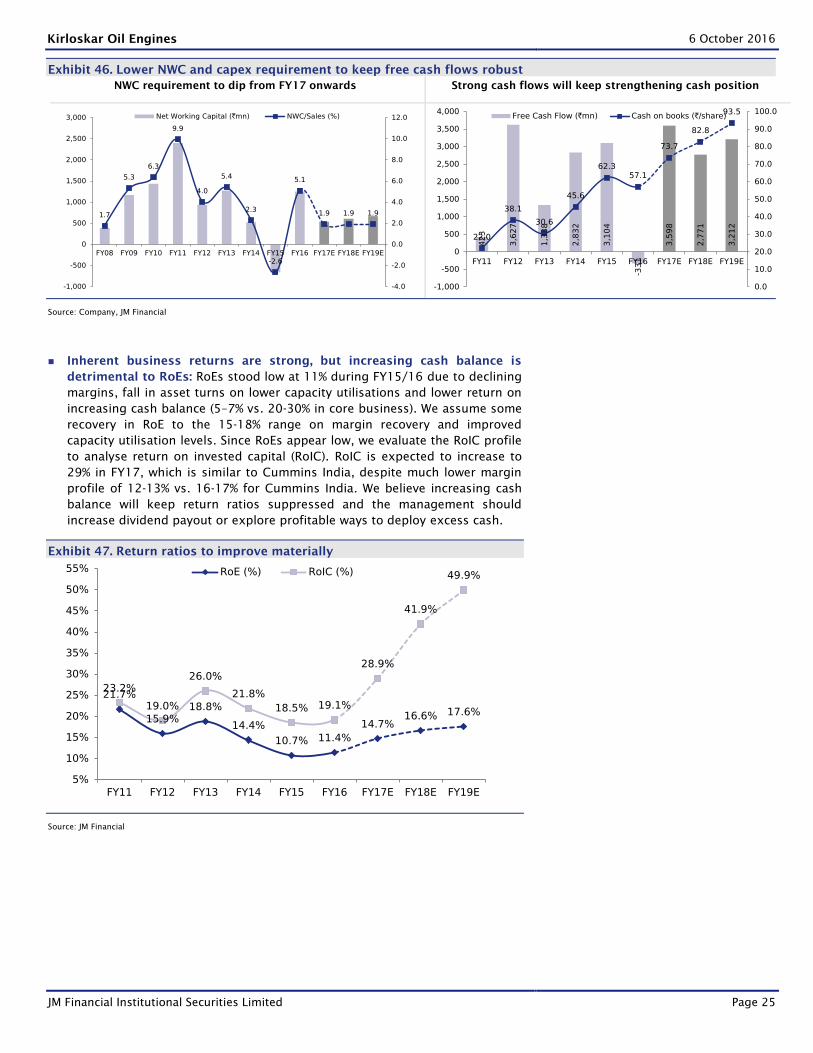
Strong cash flows continue to strengthen cash position: Lowering working
capital requirement and steady profits kept operating cash flow strong at an
average of `2.5bn/annum during FY11–16, with an average cash flow
conversion ratio (OCF/PAT) of 140%. Also, minimal capex requirement kept
investing requirement low, as the company setup a greenfield plant in Kagal
in FY09, which remained underutilised due to flat sales growth. Hence, free
cash flows stood robust at `3–3.5bn/annum, implying yield of 10%+ (barring
FY16, where non-provision of dividend led to negative FCF).
Kirloskar Oil Engines 6 October 2016
JM Financial Institutional Securities Limited Page 25
Exhibit 46. Lower NWC and capex requirement to keep free cash flows robust
NWC requirement to dip from FY17 onwards Strong cash flows will keep strengthening cash position
1.7
5.3
6.3
9.9
4.0
5.4
2.3
-2.6
5.1
1.9 1.9 1.9
-4.0
-2.0
0.0
2.0
4.0
6.0
8.0
10.0
12.0
-1,000
-500
0
500
1,000
1,500
2,000
2,500
3,000
FY08 FY09 FY10 FY11 FY12 FY13 FY14 FY15 FY16 FY17E FY18E FY19E
Net Working Capital (`mn) NWC/Sales (%)
42
3
3,6
27
1,3
38
2,8
32
3,1
04
-33
1
3,5
98
2,7
71
3,2
12
22.0
38.1
30.6
45.6
62.357.1
73.7
82.8
93.5
0.0
10.0
20.0
30.0
40.0
50.0
60.0
70.0
80.0
90.0
100.0
-1,000
-500
0
500
1,000
1,500
2,000
2,500
3,000
3,500
4,000
FY11 FY12 FY13 FY14 FY15 FY16 FY17E FY18E FY19E
Free Cash Flow (`mn) Cash on books (`/share)
Source: Company, JM Financial
Inherent business returns are strong, but increasing cash balance is
detrimental to RoEs: RoEs stood low at 11% during FY15/16 due to declining
margins, fall in asset turns on lower capacity utilisations and lower return on
increasing cash balance (5–7% vs. 20-30% in core business). We assume some
recovery in RoE to the 15-18% range on margin recovery and improved
capacity utilisation levels. Since RoEs appear low, we evaluate the RoIC profile
to analyse return on invested capital (RoIC). RoIC is expected to increase to
29% in FY17, which is similar to Cummins India, despite much lower margin
profile of 12-13% vs. 16-17% for Cummins India. We believe increasing cash
balance will keep return ratios suppressed and the management should
increase dividend payout or explore profitable ways to deploy excess cash.
Exhibit 47. Return ratios to improve materially
21.7%
15.9%18.8%
14.4%
10.7% 11.4%
14.7%16.6% 17.6%
23.2%
19.0%
26.0%
21.8%
18.5% 19.1%
28.9%
41.9%
49.9%
5%
10%
15%
20%
25%
30%
35%
40%
45%
50%
55%
FY11 FY12 FY13 FY14 FY15 FY16 FY17E FY18E FY19E
RoE (%) RoIC (%)
Source: JM Financial
Kirloskar Oil Engines 6 October 2016
JM Financial Institutional Securities Limited Page 26
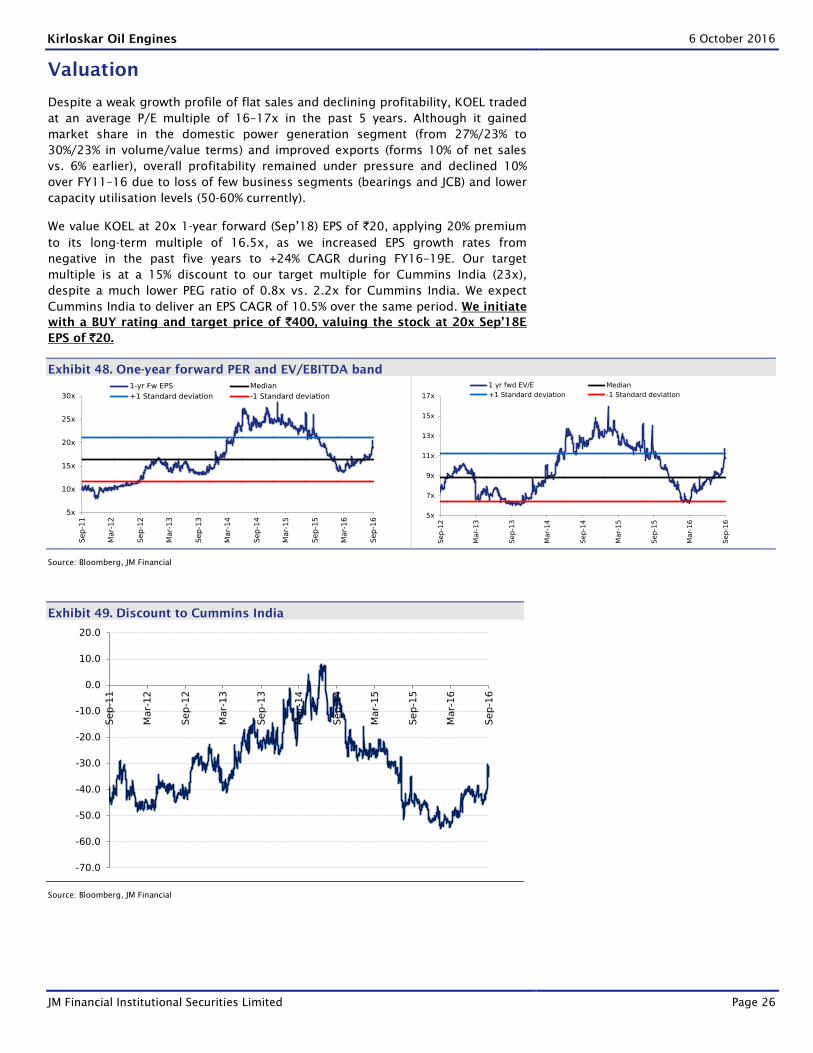
Valuation
Despite a weak growth profile of flat sales and declining profitability, KOEL traded
at an average P/E multiple of 16–17x in the past 5 years. Although it gained
market share in the domestic power generation segment (from 27%/23% to
30%/23% in volume/value terms) and improved exports (forms 10% of net sales
vs. 6% earlier), overall profitability remained under pressure and declined 10%
over FY11–16 due to loss of few business segments (bearings and JCB) and lower
capacity utilisation levels (50-60% currently).
We value KOEL at 20x 1-year forward (Sep’18) EPS of `20, applying 20% premium
to its long-term multiple of 16.5x, as we increased EPS growth rates from
negative in the past five years to +24% CAGR during FY16–19E. Our target
multiple is at a 15% discount to our target multiple for Cummins India (23x),
despite a much lower PEG ratio of 0.8x vs. 2.2x for Cummins India. We expect
Cummins India to deliver an EPS CAGR of 10.5% over the same period. We initiate
with a BUY rating and target price of `400, valuing the stock at 20x Sep’18E
EPS of `20.
Exhibit 48. One-year forward PER and EV/EBITDA band
5x
10x
15x
20x
25x
30x
Sep
-11
Mar-
12
Sep
-12
Mar-
13
Sep
-13
Mar-
14
Sep
-14
Mar-
15
Sep
-15
Mar-
16
Sep
-16
1-yr Fw EPS Median
+1 Standard deviation -1 Standard deviation
5x
7x
9x
11x
13x
15x
17x
Sep
-12
Mar-
13
Sep
-13
Mar-
14
Sep
-14
Mar-
15
Sep
-15
Mar-
16
Sep
-16
1 yr fwd EV/E Median
+1 Standard deviation -1 Standard deviation
Source: Bloomberg, JM Financial
Exhibit 49. Discount to Cummins India
-70.0
-60.0
-50.0
-40.0
-30.0
-20.0
-10.0
0.0
10.0
20.0
Sep
-11
Mar-
12
Sep
-12
Mar-
13
Sep
-13
Mar-
14
Sep
-14
Mar-
15
Sep
-15
Mar-
16
Sep
-16
Source: Bloomberg, JM Financial

Kirloskar Oil Engines 6 October 2016
JM Financial Institutional Securities Limited Page 27
Peer valuation
KOEL currently trades at 19x FY18E EPS, 34%/22% discount to Cummins India/JMF
Industrials coverage (Exhibit 50). However, we expect KOEL to deliver a CAGR of
29% during FY16–18E, which is far superior to peer group companies, barring the
ones with eroded net profits such as BHEL, GE T&D and ABB India. Though RoE is
suppressed due to high cash on books, KOEL is expected to report average RoE of
17% during FY17–19, which is still higher than the average of 15% for JMF’s
Industrials coverage.
Exhibit 50. Peer Valuation
Company CMP M.Cap EPS CAGR (%) P/E (x) P/BV (x) RoE (%) EV/EBITDA (x)
Rs Rsbn FY16-18E FY17E FY18E FY17E FY18E FY17E FY18E FY17E FY18E
Kirloskar Oil Engines 353 51 29.1 23.1 19.0 3.3 3.0 14.7 16.6 14.4 11.9
Cummins India 934 259 9.8 32.1 28.5 7.5 6.8 24.3 25.0 30.1 26.1
Greaves Cotton* 130 32 11.2 15.3 13.6 3.3 2.9 21.1 22.1 8.8 7.3
Average - Domestic Peers
14.3 22.0 19.2 3.7 3.4 20.0 21.2 14.1 12.1
ABB India 1,170 248 56.2 55.3 33.9 7.4 6.2 10.3 15.8 62.1 47.9
AIA Engineering 1,310 124 7.6 27.7 25.2 4.7 4.1 18.1 17.4 19.2 17.2
BHEL 137 335 298.8 14.1 12.4 0.9 0.9 0.5 6.8 6.8 6.1
Crompton 79 50 52.4 19.8 16.7 1.0 0.9 2.6 5.0 13.1 11.9
FAG Bearings 4,120 68 9.8 32.6 27.0 4.7 4.0 15.2 16.1 21.0 16.9
GE T&D 346 89 56.2 37.0 21.4 6.4 5.4 5.9 17.6 17.6 11.5
SKF India 1,404 74 29.1 30.9 26.0 4.3 3.9 14.6 15.7 21.7 17.9
Techno Electric 300 34 5.3 18.5 16.6 2.9 2.6 17.0 16.5 13.3 12.1
Thermax 910 108 30.3 37.9 30.5 4.4 4.0 11.8 13.7 25.4 20.2
Timken India 560 38 13.6 36.3 29.9 6.2 5.2 18.4 19.0 22.8 18.8
Voltas 395 131 17.0 29.2 25.6 4.8 4.2 17.5 17.5 25.1 21.5
Average - JMF Industrials
51.7 31.1 24.4 4.6 4.0 12.6 15.3 23.0 18.8
Source: Bloomberg, JM Financial, *Bloomberg consensus

Kirloskar Oil Engines 6 October 2016
JM Financial Institutional Securities Limited Page 28
Key risks
Technology disruption: Low kVA diesel generators face obsolescence risk
from high capacity solar-based inverters. However, the overlap is limited to
small-sized generators in areas with strict pollution norms. While solar
inverter systems are cheaper on the operational cost front, the initial outgo is
much higher, while the surface area required to install solar systems is large
and currently not feasible in most segments.
Management attrition: Of the five new team members in the top
management, one member has recently left. While the company has
conducted significant changes after assumption of office by the new
management team, we see limited risk of attrition as the composition of the
board of directors is likely to remain intact. However, we believe introduction
of an ESOP scheme will help retain senior positions in the company.
Higher power availability: Power deficit has declined from a peak of 16.6%
in FY08 to 2% in FY16, which has led to a decline in base load/prime power
categories of gensets. However, standby generators will remain unaffected
due to lack of alternatives. We note that share of backup gensets has
increased from 60% in FY08 to nearly 95% in FY16.
Rise in diesel prices: Diesel prices have exhibited a negative correlation with
demand for power gensets in the past. However, a decline in share of base
load/prime power gensets has reduced this impact as demand for standby
generators is not elastic due to lack of alternatives.
Kirloskar Oil Engines 6 October 2016
JM Financial Institutional Securities Limited Page 29
Management profile
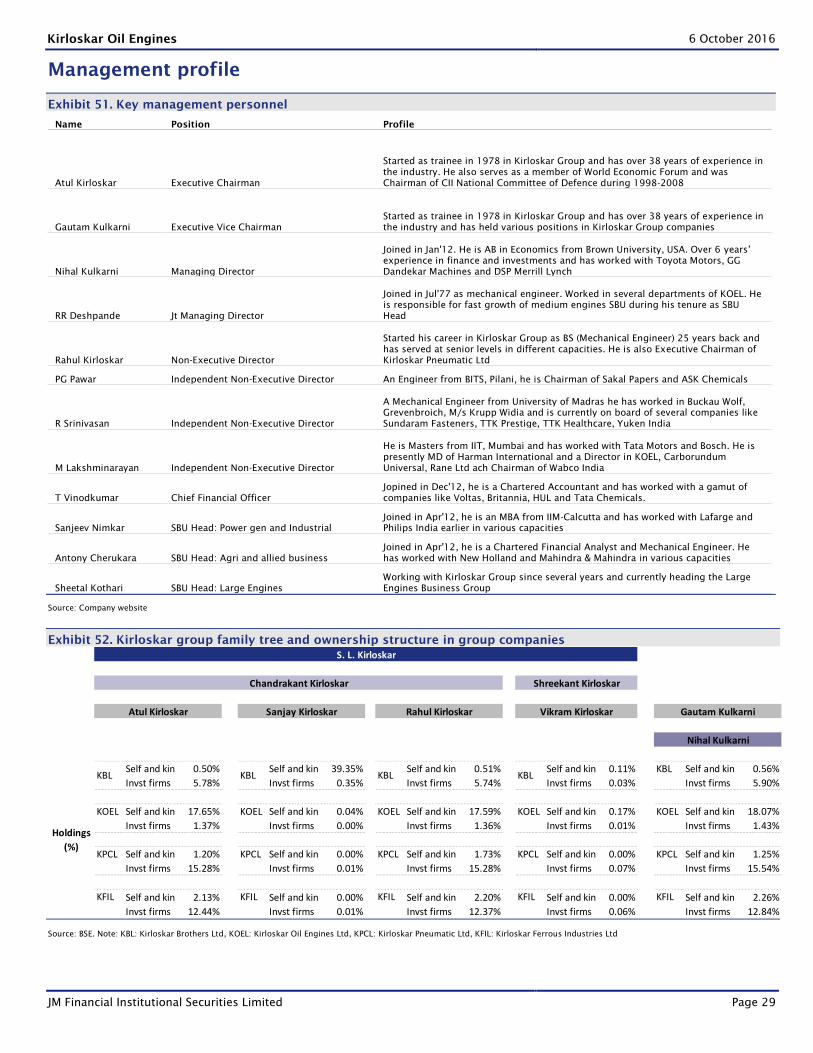
Exhibit 51. Key management personnel
Name Position Profile
Atul Kirloskar Executive Chairman
Started as trainee in 1978 in Kirloskar Group and has over 38 years of experience in
the industry. He also serves as a member of World Economic Forum and was
Chairman of CII National Committee of Defence during 1998-2008
Gautam Kulkarni Executive Vice Chairman
Started as trainee in 1978 in Kirloskar Group and has over 38 years of experience in
the industry and has held various positions in Kirloskar Group companies
Nihal Kulkarni Managing Director
Joined in Jan'12. He is AB in Economics from Brown University, USA. Over 6 years’
experience in finance and investments and has worked with Toyota Motors, GG
Dandekar Machines and DSP Merrill Lynch
RR Deshpande Jt Managing Director
Joined in Jul'77 as mechanical engineer. Worked in several departments of KOEL. He
is responsible for fast growth of medium engines SBU during his tenure as SBU
Head
Rahul Kirloskar Non-Executive Director
Started his career in Kirloskar Group as BS (Mechanical Engineer) 25 years back and
has served at senior levels in different capacities. He is also Executive Chairman of
Kirloskar Pneumatic Ltd
PG Pawar Independent Non-Executive Director An Engineer from BITS, Pilani, he is Chairman of Sakal Papers and ASK Chemicals
R Srinivasan Independent Non-Executive Director
A Mechanical Engineer from University of Madras he has worked in Buckau Wolf,
Grevenbroich, M/s Krupp Widia and is currently on board of several companies like
Sundaram Fasteners, TTK Prestige, TTK Healthcare, Yuken India
M Lakshminarayan Independent Non-Executive Director
He is Masters from IIT, Mumbai and has worked with Tata Motors and Bosch. He is
presently MD of Harman International and a Director in KOEL, Carborundum
Universal, Rane Ltd ach Chairman of Wabco India
T Vinodkumar Chief Financial Officer
Jopined in Dec'12, he is a Chartered Accountant and has worked with a gamut of
companies like Voltas, Britannia, HUL and Tata Chemicals.
Sanjeev Nimkar SBU Head: Power gen and Industrial
Joined in Apr'12, he is an MBA from IIM-Calcutta and has worked with Lafarge and
Philips India earlier in various capacities
Antony Cherukara SBU Head: Agri and allied business
Joined in Apr'12, he is a Chartered Financial Analyst and Mechanical Engineer. He
has worked with New Holland and Mahindra & Mahindra in various capacities
Sheetal Kothari SBU Head: Large Engines
Working with Kirloskar Group since several years and currently heading the Large
Engines Business Group
Source: Company website
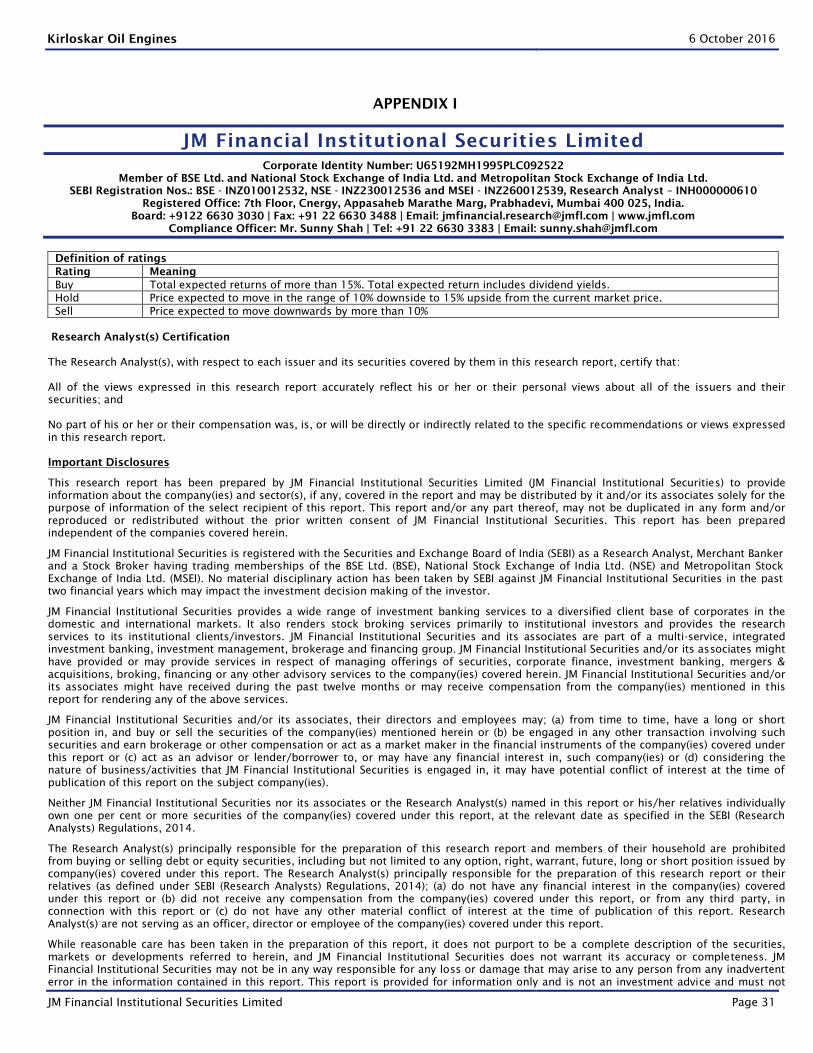
Exhibit 52. Kirloskar group family tree and ownership structure in group companies
Self and kin 0.50% Self and kin 39.35% Self and kin 0.51% Self and kin 0.11% KBL Self and kin 0.56%
Invst firms 5.78% Invst firms 0.35% Invst firms 5.74% Invst firms 0.03% Invst firms 5.90%
KOEL Self and kin 17.65% KOEL Self and kin 0.04% KOEL Self and kin 17.59% KOEL Self and kin 0.17% KOEL Self and kin 18.07%
Invst firms 1.37% Invst firms 0.00% Invst firms 1.36% Invst firms 0.01% Invst firms 1.43%
KPCL Self and kin 1.20% KPCL Self and kin 0.00% KPCL Self and kin 1.73% KPCL Self and kin 0.00% KPCL Self and kin 1.25%
Invst firms 15.28% Invst firms 0.01% Invst firms 15.28% Invst firms 0.07% Invst firms 15.54%
KFIL Self and kin 2.13% KFIL Self and kin 0.00% KFIL Self and kin 2.20% KFIL Self and kin 0.00% KFIL Self and kin 2.26%
Invst firms 12.44% Invst firms 0.01% Invst firms 12.37% Invst firms 0.06% Invst firms 12.84%
S. L. Kirloskar
Chandrakant Kirloskar Shreekant Kirloskar
Atul Kirloskar Sanjay Kirloskar Rahul Kirloskar Vikram Kirloskar
KBL
Holdings
(%)
KBL
Nihal Kulkarni
Gautam Kulkarni
KBL KBL
Source: BSE. Note: KBL: Kirloskar Brothers Ltd, KOEL: Kirloskar Oil Engines Ltd, KPCL: Kirloskar Pneumatic Ltd, KFIL: Kirloskar Ferrous Industries Ltd

Kirloskar Oil Engines 6 October 2016
JM Financial Institutional Securities Limited Page 30
Financial Tables (Standalone)
Profit & Loss Statement (` mn)
Y/E March FY15A FY16A FY17E FY18E FY19E
Net sales (Net of excise) 25,071 24,547 27,949 31,604 34,987
Growth (%) 8.1 -2.1 13.9 13.1 10.7
Other operational income 0 0 0 0 0
Raw material (or COGS) 16,257 15,431 17,888 20,226 22,392
Personnel cost 1,884 1,856 1,949 2,211 2,437
Other expenses (or SG&A) 4,444 4,864 4,751 5,215 5,598
EBITDA 2,486 2,397 3,361 3,952 4,560
EBITDA (%) 9.9 9.8 12.0 12.5 13.0
Growth (%) -18.3 -3.6 40.2 17.6 15.4
Other non-op. income 589 740 814 895 985
Depreciation and amort. 1,019 1,115 1,134 1,150 1,199
EBIT 2,056 2,022 3,041 3,698 4,346
Add: Net interest income -2 -1 -10 -10 -10
Pre tax profit 2,054 2,021 3,031 3,688 4,336
Taxes 623 361 818 996 1,257
Add: Extraordinary items 0 -255 0 0 0
Less: Minority interest 0 0 0 0 0
Reported net profit 1,431 1,405 2,213 2,692 3,079
Adjusted net profit 1,431 1,615 2,213 2,692 3,079
Margin (%) 5.7 6.6 7.9 8.5 8.8
Diluted share cap. (mn) 145 145 145 145 145
Diluted EPS (`) 9.9 11.2 15.3 18.6 21.3
Growth (%) -19.8 12.8 37.0 21.7 14.4
Total Dividend + Tax 870 870 1,198 1,458 1,667 Source: Company, JM Financial
Balance Sheet (` mn)
Y/E March FY15A FY16A FY17E FY18E FY19E
Share capital 289 289 289 289 289
Other capital 0 0 0 0 0
Reserves and surplus 13,125 14,108 15,123 16,357 17,768
Networth 13,414 14,397 15,412 16,646 18,057
Total loans 0 0 0 0 0
Minority interest 0 0 0 0 0
Sources of funds 13,414 14,397 15,412 16,646 18,057
Intangible assets 0 0 0 0 0
Fixed assets 12,492 13,120 13,870 14,870 15,870
Less: Depn. and amort. 7,356 8,346 9,480 10,630 11,828
Net block 5,136 4,773 4,390 4,240 4,041
Capital WIP 213 289 0 0 0
Investments 8,763 7,867 7,867 7,867 7,867
Def tax assets/- liability -289 -177 -177 -177 -177
Current assets 5,212 6,655 9,840 12,075 14,473
Inventories 1,716 2,029 2,297 2,598 2,876
Sundry debtors 526 1,522 1,914 2,165 2,396
Cash & bank balances 253 395 2,795 4,109 5,654
Other current assets 631 495 536 606 671
Loans & advances 2,086 2,215 2,297 2,598 2,876
Current liabilities & prov. 5,621 5,011 6,509 7,360 8,148
Current liabilities 4,204 4,448 4,977 5,628 6,231
Provisions and others 1,417 563 1,531 1,732 1,917
Net current assets -409 1,645 3,331 4,715 6,325
Others (net) 0 0 0 0 0
Application of funds 13,414 14,397 15,412 16,646 18,057 Source: Company, JM Financial
Cash flow statement (` mn)
Y/E March FY15A FY16A FY17E FY18E FY19E
Reported net profit 1,431 1,405 2,213 2,692 3,079
Depreciation and amort. 995 990 1,134 1,150 1,199
-Inc/dec in working cap. 1,451 -1,369 -148 -50 -46
Others 0 0 0 0 0
Cash from operations (a) 3,877 1,027 3,198 3,791 4,231
-Inc/dec in investments -2,686 896 0 0 0
Capex -494 -703 -461 -1,000 -1,000
Others -266 -542 861 -20 -19
Cash flow from inv. (b) -3,446 -350 400 -1,020 -1,019
Inc/-dec in capital 181 448 0 0 0
Dividend+Tax thereon -870 -870 -1,198 -1,458 -1,667
Inc/-dec in loans 0 0 0 0 0
Others -14 -112 0 0 0
Financial cash flow ( c ) -703 -534 -1,198 -1,458 -1,667
Inc/-dec in cash (a+b+c) -272 143 2,400 1,313 1,545
Opening cash balance 524 253 395 2,795 4,109
Closing cash balance 253 395 2,795 4,109 5,654 Source: Company, JM Financial
Key Ratios
Y/E March FY15A FY16A FY17E FY18E FY19E
BV/Share (`) 92.8 99.6 106.6 115.1 124.9
ROIC (%) 11.3 11.9 16.7 21.5 24.7
ROE (%) 11.0 11.6 14.8 16.8 17.7
Net Debt/equity ratio (x) -0.7 -0.6 -0.7 -0.7 -0.7
Valuation ratios (x)
PER 35.7 31.7 23.1 19.0 16.6
PBV 3.8 3.6 3.3 3.1 2.8
EV/EBITDA 16.9 17.9 12.0 9.9 8.2
EV/Sales 1.7 1.7 1.4 1.2 1.1
Turnover ratios (no.)
Debtor days 8 23 25 25 25
Inventory days 25 30 30 30 30
Creditor days 76 78 78 78 78
Source: Company, JM Financial
Kirloskar Oil Engines 6 October 2016
JM Financial Institutional Securities Limited Page 31
APPENDIX I
JM Financial Institutional Securities Limited
Corporate Identity Number: U65192MH1995PLC092522
Member of BSE Ltd. and National Stock Exchange of India Ltd. and Metropolitan Stock Exchange of India Ltd.
SEBI Registration Nos.: BSE - INZ010012532, NSE - INZ230012536 and MSEI - INZ260012539, Research Analyst – INH000000610
Registered Office: 7th Floor, Cnergy, Appasaheb Marathe Marg, Prabhadevi, Mumbai 400 025, India.
Board: +9122 6630 3030 | Fax: +91 22 6630 3488 | Email: [email protected] | www.jmfl.com
Compliance Officer: Mr. Sunny Shah | Tel: +91 22 6630 3383 | Email: [email protected]
Definition of ratings
Rating Meaning
Buy Total expected returns of more than 15%. Total expected return includes dividend yields.
Hold Price expected to move in the range of 10% downside to 15% upside from the current market price.
Sell Price expected to move downwards by more than 10%
Research Analyst(s) Certification
The Research Analyst(s), with respect to each issuer and its securities covered by them in this research report, certify that:
All of the views expressed in this research report accurately reflect his or her or their personal views about all of the issuers and their
securities; and
No part of his or her or their compensation was, is, or will be directly or indirectly related to the specific recommendations or views expressed
in this research report.
Important Disclosures
This research report has been prepared by JM Financial Institutional Securities Limited (JM Financial Institutional Securities) to provide
information about the company(ies) and sector(s), if any, covered in the report and may be distributed by it and/or its associates solely for the
purpose of information of the select recipient of this report. This report and/or any part thereof, may not be duplicated in any form and/or
reproduced or redistributed without the prior written consent of JM Financial Institutional Securities. This report has been prepared
independent of the companies covered herein.
JM Financial Institutional Securities is registered with the Securities and Exchange Board of India (SEBI) as a Research Analyst, Merchant Banker
and a Stock Broker having trading memberships of the BSE Ltd. (BSE), National Stock Exchange of India Ltd. (NSE) and Metropolitan Stock
Exchange of India Ltd. (MSEI). No material disciplinary action has been taken by SEBI against JM Financial Institutional Securities in the past
two financial years which may impact the investment decision making of the investor.
JM Financial Institutional Securities provides a wide range of investment banking services to a diversified client base of corporates in the
domestic and international markets. It also renders stock broking services primarily to institutional investors and provides the research
services to its institutional clients/investors. JM Financial Institutional Securities and its associates are part of a multi-service, integrated
investment banking, investment management, brokerage and financing group. JM Financial Institutional Securities and/or its associates might
have provided or may provide services in respect of managing offerings of securities, corporate finance, investment banking, mergers &
acquisitions, broking, financing or any other advisory services to the company(ies) covered herein. JM Financial Institutional Securities and/or
its associates might have received during the past twelve months or may receive compensation from the company(ies) mentioned in this
report for rendering any of the above services.
JM Financial Institutional Securities and/or its associates, their directors and employees may; (a) from time to time, have a long or short
position in, and buy or sell the securities of the company(ies) mentioned herein or (b) be engaged in any other transaction involving such
securities and earn brokerage or other compensation or act as a market maker in the financial instruments of the company(ies) covered under
this report or (c) act as an advisor or lender/borrower to, or may have any financial interest in, such company(ies) or (d) considering the
nature of business/activities that JM Financial Institutional Securities is engaged in, it may have potential conflict of interest at the time of
publication of this report on the subject company(ies).
Neither JM Financial Institutional Securities nor its associates or the Research Analyst(s) named in this report or his/her relatives individually
own one per cent or more securities of the company(ies) covered under this report, at the relevant date as specified in the SEBI (Research
Analysts) Regulations, 2014.
The Research Analyst(s) principally responsible for the preparation of this research report and members of their household are prohibited
from buying or selling debt or equity securities, including but not limited to any option, right, warrant, future, long or short position issued by
company(ies) covered under this report. The Research Analyst(s) principally responsible for the preparation of this research report or their
relatives (as defined under SEBI (Research Analysts) Regulations, 2014); (a) do not have any financial interest in the company(ies) covered
under this report or (b) did not receive any compensation from the company(ies) covered under this report, or from any third party, in
connection with this report or (c) do not have any other material conflict of interest at the time of publication of this report. Research
Analyst(s) are not serving as an officer, director or employee of the company(ies) covered under this report.
While reasonable care has been taken in the preparation of this report, it does not purport to be a complete description of the securities,
markets or developments referred to herein, and JM Financial Institutional Securities does not warrant its accuracy or completeness. JM
Financial Institutional Securities may not be in any way responsible for any loss or damage that may arise to any person from any inadvertent
error in the information contained in this report. This report is provided for information only and is not an investment advice and must not
Kirloskar Oil Engines 6 October 2016
JM Financial Institutional Securities Limited Page 32
alone be taken as the basis for an investment decision. The investment discussed or views expressed or recommendations/opinions given
herein may not be suitable for all investors. The user assumes the entire risk of any use made of this information. The information contained
herein may be changed without notice and JM Financial Institutional Securities reserves the right to make modifications and alterations to this
statement as they may deem fit from time to time.
This report is neither an offer nor solicitation of an offer to buy and/or sell any securities mentioned herein and/or not an official
confirmation of any transaction.
This report is not directed or intended for distribution to, or use by any person or entity who is a citizen or resident of or located in any
locality, state, country or other jurisdiction, where such distribution, publication, availability or use would be contrary to law, regulation or
which would subject JM Financial Institutional Securities and/or its affiliated company(ies) to any registration or licensing requirement within
such jurisdiction. The securities described herein may or may not be eligible for sale in all jurisdictions or to a certain category of investors.
Persons in whose possession this report may come, are required to inform themselves of and to observe such restrictions.
Persons who receive this report from JM Financial Singapore Pte Ltd may contact Mr. Ruchir Jhunjhunwala ([email protected]) on
+65 6422 1888 in respect of any matters arising from, or in connection with, this report.
Additional disclosure only for U.S. persons: JM Financial Institutional Securities has entered into an agreement with JM Financial Securities,
Inc. ("JM Financial Securities"), a U.S. registered broker-dealer and member of the Financial Industry Regulatory Authority ("FINRA") in order to
conduct certain business in the United States in reliance on the exemption from U.S. broker-dealer registration provided by Rule 15a-6,
promulgated under the U.S. Securities Exchange Act of 1934 (the "Exchange Act"), as amended, and as interpreted by the staff of the U.S.
Securities and Exchange Commission ("SEC") (together "Rule 15a-6").
This research report is distributed in the United States by JM Financial Securities in compliance with Rule 15a-6, and as a "third party research
report" for purposes of FINRA Rule 2241. In compliance with Rule 15a-6(a)(3) this research report is distributed only to "major U.S.
institutional investors" as defined in Rule 15a-6 and is not intended for use by any person or entity that is not a major U.S. institutional
investor. If you have received a copy of this research report and are not a major U.S. institutional investor, you are instructed not to read, rely
on, or reproduce the contents hereof, and to destroy this research or return it to JM Financial Institutional Securities or to JM Financial
Securities.
This research report is a product of JM Financial Institutional Securities, which is the employer of the research analyst(s) solely responsible for
its content. The research analyst(s) preparing this research report is/are resident outside the United States and are not associated persons or
employees of any U.S. registered broker-dealer. Therefore, the analyst(s) are not subject to supervision by a U.S. broker-dealer, or otherwise
required to satisfy the regulatory licensing requirements of FINRA and may not be subject to the Rule 2241 restrictions on communications
with a subject company, public appearances and trading securities held by a research analyst account.
JM Financial Institutional Securities only accepts orders from major U.S. institutional investors. Pursuant to its agreement with JM Financial
Institutional Securities, JM Financial Securities effects the transactions for major U.S. institutional investors. Major U.S. institutional investors
may place orders with JM Financial Institutional Securities directly, or through JM Financial Securities, in the securities discussed in this
research report.
Additional disclosure only for U.K. persons: Neither JM Financial Institutional Securities nor any of its affiliates is authorised in the United
Kingdom (U.K.) by the Financial Conduct Authority. As a result, this report is for distribution only to persons who (i) have professional
experience in matters relating to investments falling within Article 19(5) of the Financial Services and Markets Act 2000 (Financial Promotion)
Order 2005 (as amended, the "Financial Promotion Order"), (ii) are persons falling within Article 49(2)(a) to (d) ("high net worth companies,
unincorporated associations etc.") of the Financial Promotion Order, (iii) are outside the United Kingdom, or (iv) are persons to whom an
invitation or inducement to engage in investment activity (within the meaning of section 21 of the Financial Services and Markets Act 2000) in
connection with the matters to which this report relates may otherwise lawfully be communicated or caused to be communicated (all such
persons together being referred to as "relevant persons"). This report is directed only at relevant persons and must not be acted on or relied
on by persons who are not relevant persons. Any investment or investment activity to which this report relates is available only to relevant
persons and will be engaged in only with relevant persons.
Additional disclosure only for Canadian persons: This report is not, and under no circumstances is to be construed as, an advertisement
or a public offering of the securities described herein in Canada or any province or territory thereof. Under no circumstances is this report
to be construed as an offer to sell securities or as a solicitation of an offer to buy securities in any jurisdiction of Canada. Any offer or sale
of the securities described herein in Canada will be made only under an exemption from the requirements to file a prospectus with the
relevant Canadian securities regulators and only by a dealer properly registered under applicable securities laws or, alternatively, pursuant
to an exemption from the registration requirement in the relevant province or territory of Canada in which such offer or sale is made. This
report is not, and under no circumstances is it to be construed as, a prospectus or an offering memorandum. No securities commission or
similar regulatory authority in Canada has reviewed or in any way passed upon these materials, the information contained herein or the
merits of the securities described herein and any representation to the contrary is an offence. If you are located in Canada, this report has
been made available to you based on your representation that you are an “accredited investor” as such term is defined in National
Instrument 45-106 Prospectus Exemptions and a “permitted client” as such term is defined in National Instrument 31-103 Registration
Requirements, Exemptions and Ongoing Registrant Obligations. Under no circumstances is the information contained herein to be
construed as investment advice in any province or territory of Canada nor should it be construed as being tailored to the needs of the
recipient. Canadian recipients are advised that JM Financial Securities, Inc., JM Financial Institutional Securities Limited, their
affiliates and authorized agents are not responsible for, nor do they accept, any liability whatsoever for any direct or consequential loss
arising from any use of this research report or the information contained herein.