kirklees council waste needs assessment · kirklees council waste needs assessment . ... that...
TRANSCRIPT

Part 2:
Growth Forecasts and Assessment of Future Capacity
Requirements
January 2016
Kirklees Council
Waste Needs Assessment
Details Prepared by Reviewed and approved by
Version 1 Gill Tatum, Peter Greifenberg Carolyn Williams
Version 2 Gill Tatum, Peter Greifenberg Paul Knott and Carolyn Williams
Version 3 Paul Knott, Gill Tatum, Peter Greifenberg
Paul Knott
Version 4 Gill Tatum, Peter Greifenberg, Carolyn Williams
Carolyn Williams
3
Part 2: Growth Forecasts
and Assessment of Future
Capacity Requirements
Contents FOREWORD ..................................................................................................................................................... 5 EXECUTIVE SUMMARY ...................................................................................................................................... 6
1. INTRODUCTION ................................................................................................................................ 13
2. OVERVIEW OF KIRKLEES WASTE ARISINGS ............................................................................... 16
3. CONTEXT FOR THE NEEDS ASSESSMENT .................................................................................. 18
4. METHODOLOGY FOR PREDICTING FUTURE WASTE CAPACITY REQUIREMENTS ................ 22
4.2. IDENTIFYING CURRENT WASTE ARISINGS AND EXISTING CAPACITY ...................................................... 22 4.3. MODELLING AND ASSUMPTIONS ......................................................................................................... 24
5. POTENTIAL CAPACITY GAPS IN 2031 ........................................................................................... 33
6. FUTURE REQUIREMENTS ............................................................................................................... 37
6.1. INTRODUCTION .................................................................................................................................. 37 6.2. LOCAL AUTHORITY COLLECTED WASTE (LACW) ................................................................................ 37 6.3. COMMERCIAL AND INDUSTRIAL (C&I) WASTE ...................................................................................... 42 6.4. CONSTRUCTION, DEMOLITION AND EXCAVATION (CD&E) WASTE ........................................................ 46 6.5. HAZARDOUS WASTE .......................................................................................................................... 48 6.6. AGRICULTURAL WASTE...................................................................................................................... 49 6.7. LOW LEVEL RADIOACTIVE WASTE ...................................................................................................... 50 6.8. WASTE WATER / SEWAGE SLUDGE .................................................................................................... 51
7. CONCLUSIONS & NEXT STEPS ...................................................................................................... 52
7.1. PRINCIPAL CONCLUSIONS .................................................................................................................. 52 GLOSSARY OF TERMS .................................................................................................................................... 55
Figures
Figure 1: Relative Proportions of Principal Wastes Generated in Kirklees ................................................. 17
Figure 2: Methodology for Predicting Future Waste Requirements ............................................................ 22
Figure 3: The Waste Hierarchy ................................................................................................................... 25
Figure 4: Comparison of Capacity Gaps at 2031 with Maximum Growth – EfW Plant Assumed to Close in
2028 ............................................................................................................................................................. 35
Figure 5: Comparison of Capacity Gaps at 2031 with Maximum Growth – EfW Plant Assumed to Remain
Open ............................................................................................................................................................ 36
Tables
Table 1: Arisings of Controlled Wastes in Kirklees in 2013/14 ................................................................... 16
Table 2: Summary of Growth Scenarios ..................................................................................................... 26
Table 3: Summary of Behaviour Scenarios ................................................................................................. 28

4
Table 4: Assumptions about Existing and Planned Waste Management Sites .......................................... 29
Table 5: Waste Management Facility Categories Used in the Model ......................................................... 30
Table 6: Estimated Annual Capacity Available from Licensed Operational Waste Management Facilities
within Kirklees ............................................................................................................................................. 31
Table 7: Capacity Gap Comparison for the Scenarios Modelling the Least and Most Extensive Changes in
Requirements .............................................................................................................................................. 33
Table 8: Table 8: Comparison of the LACW (H) and LACW (Other) Capacity Gaps .................................. 39
Table 9: Capacity Gaps for Recycling C&I Waste Over the Plan Period* .................................................. 43

5
Part 2: Growth Forecasts
and Assessment of Future
Capacity Requirements Foreword
Kirklees Unitary Authority commissioned this study in November 2014. The Waste
Needs Assessment uses information correct at that time and it is therefore a living
document. This includes information on waste arisings obtained from the EA Waste
Data Interrogator 2013 and the EA Hazardous Waste Data Interrogator 2013 (both
published in October 2014). The study covers the local authority area of Kirklees.

6
Executive Summary
Content of the Data Study
I. Urban Vision and 4Resources were contracted by Kirklees Council to prepare a
Waste Needs Assessment. The Study evaluates a number of scenarios predicting
future waste arisings in the period 2014 to 2031, comparing the results with
existing local waste capacity to identify any gaps in provision that will need to be
addressed. The Council has also specified that the work should provide forecasts
over an additional five years beyond the end of the Plan period to 2036.
II. The Study has been produced in two parts. Part 1 provides a detailed analysis of
current waste arisings in Kirklees for all waste streams and of the movement of
wastes into and out of the area. In both cases data refer to the situation in 2013
which is the latest year for which information is available on all the principal waste
streams.
III. This Report, Part 2, documents subsequent analysis that provides a detailed
analysis of capacity gaps for managing each of the waste streams.
Waste Streams
IV. Seven waste streams have been analysed to estimate the quantity of waste that
will be produced within Kirklees as follows (with the analysis largely focused on
the first five):
Local Authority Collected Waste (LACW): waste collected by the Local Authority
which is primarily waste produced by households (LACW(H)) but which can also
include waste from certain non-household sources (LACW(Other)). Residues
produced by the Energy From Waste (EfW) process which is used to treat some
LACW(H) have also been included (LACW(Secondary))1;
Commercial and Industrial wastes (C&I): wastes produced by companies in all
industry sectors, including C&I waste collected by the Local Authority;
Construction, Demolition and Excavation wastes (CD&E): waste produced as a
result of building, engineering, renovation and maintenance activities;
Hazardous waste: A sub category of all waste streams, where the material
produced is hazardous and requires specialist treatment;
Agricultural Waste: waste produced by farming and forestry activity;
1 These distinctions are made solely for the purposes of accurately identifying the respective quantities of wastes and how
they are accounted for in this assessment in terms of how they are managed. They have no wider applicability.

7
Part 2: Growth Forecasts
and Assessment of Future
Capacity Requirements Low Level Non-Nuclear Radioactive Waste (LLW): waste associated with the use of
low level radioactive substances (ie. when taking x-rays and in laboratory testing);
and
Waste Water / Sewage Sludge: waste produced from washing, cleaning, and
activities to treat waste water and sewage effluents.
Modelling Future Waste Arisings and Capacity Gaps
V. Modelling work uses baseline data (set out in the Part 1 report referred to above)
comprising the capacity of existing sites and the waste management functions
they perform. This information is combined with projections of future change in
arisings and management methods using combinations of five growth scenarios
and three behaviour scenarios.
VI. One growth scenario (‘no growth’) assumes arisings will remain at current levels
throughout the period to 2031, although this is recognised as improbable. The
other four scenarios assume increasing growth in arisings as follows:
LACW increasing by between 3% and 3.3% per annum in the short term, and
between 2% and 2.3% thereafter;
The other main streams would increase by between 0.55% and 0.87% per annum
over the Plan period.
VII. The ‘no growth’ and four other growth scenarios reflect the assumed impact of
different economic factors applied to employment sector growth for LACW, C&I,
CD&E and for the hazardous components of these waste streams. These factors
include changes in population which will affect the quantity of waste produced by
households (LACW(H)), economic changes that may increase the waste output of
businesses and services (C&I waste) and infrastructure and housing growth
(CD&E waste).
VIII. The three behaviour scenarios represent how each of the streams could be
managed over the plan period and can be summarised as follows:
Scenario 1 – current levels of recycling and recovery are maintained;
Scenario 2 – recycling and recovery of LACW, C&I and CD&E wastes improves to
achieve relevant statutory and non-statutory targets by 2020 and continues to
improve further so that the rates achieved by 2031 are the maximum that are
expected to be possible using current technology and given the composition of each
stream;
Scenario 3 – a median level (between scenarios 1 and 2) which envisages modest
improvement in recycling and recovery of LACW, C&I and CD&E wastes and

8
LACW(H) wastes and some diversion of waste away from landfill, though the 2020
target for recycling / composting of the former is not achieved.
IX. Improvements in recycling performance assumed for Scenarios 2 and 3 result in
proportionate reduction in the use of landfill disposal.
X. Parameters in the growth and behaviour scenarios have been agreed with officers
at Kirklees Council. The former are consistent with econometric forecasts that
inform other Council plans, policy and strategy, while assumptions about future
changes to management behaviour reflect industry expectations or, in the case of
LACW, the strategy that the Council’s Waste Collection and Disposal function is
pursuing.
Existing Waste Capacity
XI. A review of existing licensed waste management facilities operating within Kirklees
has been undertaken, and this identifies a total of 64 sites. Most of the facilities
are household waste recycling centres and transfer stations where LACW, C&I
and CD&E wastes can be sorted, bulked and separated before onward transport
for further management. There is a substantial amount of metal recycling capacity
also, but a limited amount of treatment capacity, the most important of which is the
Huddersfield Energy from Waste Plant. There are also a number of landfill sites
and other sites where inert wastes are imported for landscaping and restoration
purposes. The assessment assumes capacity will be available throughout the Plan
period except where it is already known that sites will close prematurely (this
constraint applies to three landfill sites).
XII. By reviewing the existing waste management sites, establishing the type and
quantity of waste they can manage annually, then matching this with the amount
of waste being produced each year (under the different scenarios), the model
calculates how much remaining capacity there is for each waste management
route over time and to identify where gaps exist at present or will develop in the
future.
Summary of Future Capacity Requirements
XIII. The various combinations of growth and behaviour scenarios define an ‘envelope’
within which a number of different outcomes and requirements for additional
capacity can be identified. The Energy from Waste facility in Huddersfield is
scheduled to operate until 2023. The Council has an option to extend this period to
2028 and has asked that the study also evaluates continued operation of the plant
to 2036. Both assessments are made solely for the purpose of informing the
ongoing review of the residual LACW management strategy and do not imply any
commitment to pursue either option at the present time. The table below identifies
the results of capacity assessment for three of the options looked at along with the
gaps for other waste management routes, these are set out in Table 2 of the main
report. The three scenarios illustrate the implications of assuming no change and

9
Part 2: Growth Forecasts
and Assessment of Future
Capacity Requirements of the high levels rates of growth and improvement in landfill diversion. In all cases
negative figures identify capacity surpluses for certain routes.
Waste Management Route & Wastes
Baseline / No Growth 2031
Growth 4 Maximised Recycling /
Recovery 2031
Growth 3 Median/Recovery
Landfill (C+I 101,515 46,664 72,074
Landfill LACW 10,835 9,713 9478
Landfill (Hazardous) 7,229 8,428 8,188
Landfill (Hazardous LACW secondary)
1358 2,055 2,005
Landfill (C+D&E) -32,003 -135,620 -72,916
Thermal treatment with energy recovery (‘Energy from waste’)
Closure in 2028: 105,068
Operating to 2031:
-26,932
Closure in 2028: 100,574
Operating to 2031:
-31,426
Closure in 2028
97,724
Operating to 2031
-19,937
Thermal treatment (without energy recovery)
6,105 4,897 4,777
Recycling (C+I, & Agricultural)
10,313 106,165 77,286
Recycling (LACW only) 8,481 27,103 25,663
Recycling (C+D) 82,649 164,515 90,810
Recycling (metals only) -38,424 -28,133 -30,056
Recycling (Hazardous) 20,100 24,697 24,008
Recycling (specialist WEEE)
-38,424 -28,133 --30,056
Composting 15,451 15,873 15,489
Treatment plant -23,179 -18,836 -19,345
Other treatment plant / transfer (Hazardous / C&I)
25,875 29,702 34,550
Land recovery -67,187 -26,463 -28,713
Source: Kirklees Waste Needs Assessment model May 2015. All figures in tonnes]

10
XIV. The points below summarise the principal conclusions about capacity needed to
manage each stream based on the results of modelling.
LACW
There is a small capacity shortfall for preliminary sorting of LACW Recycling
throughout the Plan period with the resources focused on a small footprint at the
Huddersfield Materials Recycling Facility under the current contract arrangements.
There are no operational sites composting green wastes within Kirklees and it is
anticipated these materials will continue to be exported to facilities in other
authorities.
The existing EfW plant provides sufficient capacity for thermal treatment of LACW
throughout the Plan period provided it remains operational beyond current
contractual arrangements up to 2023/8.
Kirklees has no landfill sites currently taking non-inert wastes such as LACW and
therefore all waste that is not recycled or sent to the EfW plant is exported. If policy
aims to implement the maximum level of recycling assumed in the analysis then the
amount of waste sent to landfill will fall substantially although there will still be a
shortfall in capacity for the disposal of LACW waste of over 9,700 tonnes by 2031.
Should the median recycling option be taken forward, the requirement for landfill of
C&I waste under growth 3 reduces from baseline levels but is around 18,000tpa
more than maximised recycling and places a greater demand on energy from waste
for LACW, but existing capacity is sufficient assuming that the existing contract is
extended beyond 2028.
C&I Waste
There will be a gap of 10,000 tonnes of recycling capacity for handling mixed C&I
wastes in 2015 rising to over 100,000 tonnes under the largest growth assumptions
by 2031 for maximised recycling. Under median recycling the demand is lower, but
a gap of over 14,000tpa is seen in 2014 rising to 77,000tpa by 2031.
As with the LACW stream it will be necessary to rely on continuing export of
recyclate to external re-processors until such time as the identified local capacity
comes forward. This situation applies to all scenarios but, as indicated above, the
additional capacity needed will increase if the Plan seeks to promote high levels of
recycling of these wastes.
Under all the scenarios there is adequate transfer station capacity at sites handling
mixed wastes and those handling specific materials such as metals.
There is no EfW capacity for C&I wastes (the existing Huddersfield plant is currently
contracted to handle LACW only). Even with recovery increasing from current
baseline by 1% to 4% by 2031 the additional capacity needed is very small and may
be insufficient to make a local facility cost effective. Therefore it is likely that C&I
wastes for EfW processing will continue to be exported outside the plan area.

11
Part 2: Growth Forecasts
and Assessment of Future
Capacity Requirements As with LACW there is an existing landfill capacity shortage that will persist
throughout the Plan period though it will be reduced substantially under those
scenarios assuming high levels of recycling and recovery. Should median recycling
options be taken forward, the demand for landfill increases for C&I, but remains
around the 10,000tpa for LACW.
CD&E Waste
Kirklees at present has significant surplus landfill capacity for managing inert C&D
and excavation wastes (and also capacity to use the latter in restoration projects if
current rates of re-using this material are maintained)
There is a surplus of capacity at waste transfer stations and bulking facilities for
C&D over the whole Plan period throughout the plan period under all scenarios.
At present there is a shortage of capacity for recycling CD&E wastes under all the
scenarios over the whole Plan period. However the true rate may be disguised
because mobile plant is being used to recycle this waste where it is created and
these arisings are never reported. Similarly some transfer stations may also be
making an unquantified contribution to recycling rates.
Hazardous Waste
Kirklees currently relies on external treatment and recovery capacity to handle local
arisings and it is unlikely that the small quantities involved would result in new local
capacity coming forward
Two landfill sites provide regionally significant capacity that result in the area being
a net importer of hazardous wastes, however the eventual closure of both sites by
2028 will result in a small gap. This situation might be addressed if one or both
facilities are granted extensions otherwise it will require new capacity or further
reliance on external facilities.
Agricultural Waste
The assessment has not identified the need for facilities to manage this stream
specifically and any requirement is included in the assessed need for additional
capacity to handle C&I wastes.
Sewage Sludge
Yorkshire Water has advised the Council that additional capacity is likely to be
needed at two plants within the Borough. The timescale for improvement has not
been established yet and will be identified through ongoing dialogue with the
company.

12
Low Level Radioactive Waste (LLW)
Kirklees contains a single location generating a very small amount of low-level
radioactive waste, the nature of which means it can be disposed via the foul sewer
network with other wastes. Therefore there is no need for specialised local
management capacity.
XV. If Kirklees is to become (net) self-sufficient in waste management capacity the
Council will need to consider the requirements identified by this assessment and
to adopt appropriate projections to plan for future waste capacity which would be
delivered by the Plan.
XVI. For any waste still requiring export to other areas, the Council should contact
waste planning authorities receiving waste from Kirklees in order to establish
whether they are aware of any foreseeable changes that may affect this position
over the life of the Plan and in order to meet its obligations under the Duty to Co-
Operate as defined in the Localism Act.

13
Part 2: Growth Forecasts
and Assessment of Future
Capacity Requirements
1. Introduction
1.1.1. Kirklees Unitary Authority (hereafter, the Council) is preparing the Kirklees Local Plan
(KLP) which will include the planning framework for managing wastes arising within the
authority area.
1.1.2. Urban Vision and 4Resources were contracted by the Council to prepare a Waste
Needs Assessment to assess future waste capacity requirements. This will enable the
Council to plan for managing waste arisings up to 2031 and represents a key part of the
evidence base supporting the KLP. In addition the Council has requested that the
Assessment should also review the implications of change in waste management
requirements over an additional 5-year period to 2036.
1.1.3. The Waste Needs Assessment has been produced in two parts:
Part 1: Waste Arisings in Kirklees;
Part 2: Waste Capacity in Kirklees.
1.1.4. Part 1 of the Waste Data Study provides a detailed analysis of current waste arisings in
Kirklees for all waste streams and waste movements into and out of the area for 2013.
The information in Waste Data Study Part 1 has informed this report and provides the
basis for estimating future capacity requirements reported here.
1.1.5. This, Part 2, report presents the modelling options used to identify the future
requirements for the plan area over the period referred to above. It provides detailed
analysis of capacity gaps for each waste stream and the various ways in which the
materials in it will be managed.
1.1.6. A number of scenarios have been modelled. Each scenario presents a different option
for modelling waste based on a range of recycling and recovery targets and growth
levels being achieved.
1.1.7. In the next stage of work the Council will need to decide which of the modelled
scenarios should be taken forward for the identification of future capacity requirements
for the KLP.

14
1.1.8. The Waste Needs Assessment addresses the following seven controlled waste
streams:
Local Authority Collected Waste (LACW): waste collected by Local Authorities
which is primarily waste produced by householders (referred to as LACW(H)) but
which can also include some non household waste such as collected road
sweepings (LACW(other)). It also includes secondary waste arising as a by-product
from treating residual household waste in an Energy from Waste facility
(LACW(Secondary));
Commercial and Industrial wastes (C&I): wastes produced by all sectors of industry;
Construction, Demolition and Excavation wastes (CD&E): waste produced through
the undertaking of building, engineering, renovation and maintenance of structures;
Hazardous waste: A sub category of all waste streams, where the material
produced is hazardous and requires specialist treatment and which cannot be
managed with other wastes;
Agricultural Waste: wastes produced by farming and forestry activity;
Low Level Non-Nuclear Radioactive Waste (LLW): waste associated with activities
such as taking x-rays and laboratory testing which use substances with low levels of
radioactive emissions; and
Waste Water/Sewage Sludge: waste produced from washing, cleaning, and
hygienic activities to create waste water and sewage effluents.
1.1.9. A detailed review of the robustness and limitations of available information on current
and expected arisings of waste in Kirklees has been carried out for all waste streams
and is reported in the Part 1 report referred to above.
1.1.10. The data underlying the projections in this report represents the best available
information at February 2015 although delays in publishing the principal sources means
that the most recent data are for 2013, which is therefore the base year from which
forecasts are projected forward. Sources include data reported via the Environment
Agency Waste Data Interrogator (WDI) and Hazardous Waste Data Interrogator (HWDI)
(both refer to 2013), and data from Defra’s WasteDataFlow reporting facility which
provides information on LACW. Information on C&I waste is recognised to be poor and
the Needs Assessment is based on interpolating the results of a 2009 survey of the
former North West region which represents the best available proxy for estimating the
size of this stream locally and how it is managed.

15
Part 2: Growth Forecasts
and Assessment of Future
Capacity Requirements 1.1.11. It is acknowledged that this Study presents a picture at a particular point in time and
requirements will need to be reviewed periodically throughout the preparation of the
Plan as appropriate.
16
2. Overview of Kirklees Waste Arisings
2.1.1. Waste in Kirklees is generated by a wide range of sources and processes. The most
familiar is waste collected from households, such as packaging and food. However this
material only accounts for part of the overall waste arisings and much larger quantities
are generated by the construction industry (Construction, Demolition and Excavation
waste – CD&E), such as broken bricks and cables; and from business activities
(Commercial and Industrial waste – C&I), such as food from restaurants and paper from
offices. These three streams make up the majority of waste produced within Kirklees.
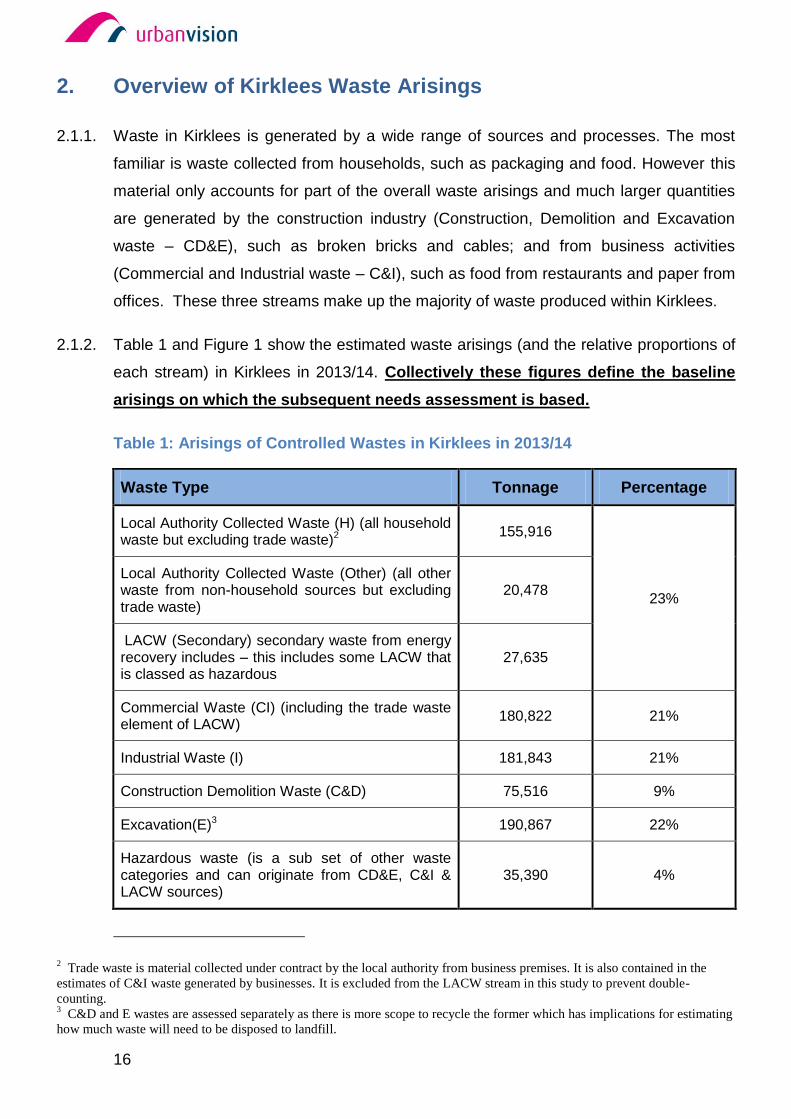
2.1.2. Table 1 and Figure 1 show the estimated waste arisings (and the relative proportions of
each stream) in Kirklees in 2013/14. Collectively these figures define the baseline
arisings on which the subsequent needs assessment is based.
Table 1: Arisings of Controlled Wastes in Kirklees in 2013/14
Waste Type Tonnage Percentage
Local Authority Collected Waste (H) (all household waste but excluding trade waste)2
155,916
23%
Local Authority Collected Waste (Other) (all other waste from non-household sources but excluding trade waste)
20,478
LACW (Secondary) secondary waste from energy recovery includes – this includes some LACW that is classed as hazardous
27,635
Commercial Waste (CI) (including the trade waste element of LACW)
180,822 21%
Industrial Waste (I) 181,843 21%
Construction Demolition Waste (C&D) 75,516 9%
Excavation(E)3 190,867 22%
Hazardous waste (is a sub set of other waste categories and can originate from CD&E, C&I & LACW sources)
35,390 4%
2 Trade waste is material collected under contract by the local authority from business premises. It is also contained in the
estimates of C&I waste generated by businesses. It is excluded from the LACW stream in this study to prevent double-
counting. 3 C&D and E wastes are assessed separately as there is more scope to recycle the former which has implications for estimating
how much waste will need to be disposed to landfill.

17
Part 2: Growth Forecasts
and Assessment of Future
Capacity Requirements
Waste Type Tonnage Percentage
Agricultural Waste (leaving farm holdings) 3,835 <1%
Total 872,300 100%
[Source: Waste Needs Assessment Part 1: Waste Arisings in Kirklees, May 2015]
Figure 1: Relative Proportions of Principal Wastes Generated in Kirklees
[Source: analysis using Environment Agency Waste Data Interrogator, 2013, WasteDataFlow, Extrapolated NW 2009 C&I Survey
and Extrapolated Agricultural 2003 survey]
2.1.3. Responsibility for managing waste water and sewage lies with Yorkshire Water.
Additional capacity to meet population growth is most likely to be provided by expanding
existing treatment facilities. This situation only has implications for the Plan if it requires
the allocation of land outside the curtillage of existing waste water treatment facilities.
2.1.4. Arisings of low level radioactive wastes are negligible and cannot be readily identified by
weight. A single site in the Plan area generates these wastes the quantity and nature of
which means they can be safely disposed to foul sewer with other waste water.
2.1.5. Further detail on managing waste water and sewage and low level radioactive wastes is
provided later in this report.

18
3. Context for the Needs Assessment
3.1.1. Most waste is produced as a result of demand for products or the creation of new
infrastructure. The need to reduce waste creation directly, or indirectly by greater use of
recycled materials is at the heart of strategies promoting sustainable consumption that
apply at EU and national levels and which impact local waste strategies equally.
Promoting change at local level for LACW is achieved through mechanisms such as the
local Municipal Waste Management Strategy. Voluntary agreements such as the
Courtauld Commitment - whereby manufacturers seek to reduce packaging waste by
better design and use of predominantly recyclable materials – also contribute
significantly to the reduction of wastes.
3.1.2. Planning for future waste management must also reflect the external influence of
relevant legislation and the obligations this places on the Council as Waste Collection
and Disposal Authority as well as its role as competent authority in preparing a Waste
(and Minerals) Plan to provide for sustainable management of locally arising of wastes.
Some legislative influences are readily identified; others are proposed and their
implications cannot be taken into account at this time and represent risks that have to
be considered when establishing policy.
3.1.3. Key aspects of the legislative landscape and their implications for this assessment and
the Council’s waste planning are summarised below. Several matters impact the options
for managing residual LACW in the future and aspects of this assessment will assist the
Council in moving towards an appropriate strategy for dealing with this stream in the
period after the current PFI contract ends. Other matters, such as future changes to
mandatory targets, will need to be taken into account when assessing appropriate
growth and performance assumptions that will be taken forward into the Plan.
EU Landfill Directive What is in force or proposed?: Sets target of reducing biodegradable waste sent to landfill to 35% of 1995 levels by 2020.
What are the implications?: Local performance currently exceeds the EU target substantially (7% household waste to landfill in 2013/14) as a result of a reliance on the EfW plant for residual disposal. A key issue for the medium/long-term will be the evolution of the strategy for managing residual LACW, whether current diversion rates can be maintained, and the technical solution(s) that can be used to achieve this.
EU Waste Framework Directive & Waste
What is in force or proposed?: Directive sets target of recycling, composting or re-using 50% of household waste by 2020.

19
Part 2: Growth Forecasts
and Assessment of Future
Capacity Requirements Management Plan for England
What are the implications?: Local performance in 2013/14 was below the national average and action to address it in the short-term is being taken. ‘Direct’ diversion to recycling was relatively low (30%). In addition to this, the Council has a high rate of waste diversion classed as ‘recovery’. This recovery does not count towards the government’s 50% recycling target. The Council therefore needs to make further improvements on its recycling levels to meet national targets. With the EfW plant apparently operating at close to full capacity there is limited scope to divert more household waste down this route using existing local facilities. The local opportunity to implement increased recycling measures is dependent on the terms of the Authority’s PFI contract with Sita Kirklees Ltd. The Council’s upcoming waste strategy review may need to consider the viability and desirability of introducing organic waste collections.
Waste Management Plan for England
What is in force or proposed?: In addition to the proposals from the EU, publication of the national Waste Management Plan introduced policy directions promoting the circular economy. One key aspect is the proposal for quality controls on materials collected and sorted by Materials Recycling Facilities. The aim of the proposal is to meet the standards required from organisations reprocessing plastics, glass, paper, etc. into secondary or recycled products thereby stimulating the development of a national recycling sector with the intention of reducing the export of recyclate (and therefore loss of a resource). At present these proposals refer only to monitoring of materials against defined standards and thresholds but without specific legislation enforcing them, although the latter is likely to emerge in due course.
A second policy direction of note involves promoting separate collection of food waste where this is not already provided. The Plan devolves this decision to individual authorities though, as referred to above, it may be necessary to deploy it widely in order to achieve further improvement in recycling and composting performance.
What are the implications?: In the short-term this development primarily has implications for Sita Kirklees Ltd in managing the wastes handled under the PFI contract. However the implications of this development will need to be followed through in the review of the residual waste management strategy so that infrastructure brought forward later in the plan period to replace the PFI facilities will meet any emerging standards.
EU Waste Framework Directive
What is in force or proposed?: Sets target of recycling 70% of CD&E wastes by 2020. Performance against this target is difficult to assess and affected by significant differences in the size and recycling opportunities for the C&D and E streams separately.
What are the implications?: Local C&D recycling performance already significantly exceeds the EU target (89% in 2013) but this is offset by limited recycling of E wastes (only 10%). Overall performance is therefore 32% but rises to 53% if E waste re-used in restoration or land recovery is included in the total. However there is no mechanism for reporting the quantity of E wastes that are used in backfilling and restoring the sites where they were generated. The level of recycling and re-use is likely to be significantly underestimated though an accurate figure cannot be identified. This situation is not necessarily critical of local performance. Defra claims

20
that national performance outstrips the EU target and that in many other Member States, but the inclusion of E wastes will have the same effect at national level as it does in the Authority and assessment is again hampered by a lack of accurate data. This is not a matter that the Authority can plan for proactively as the opportunity to maintain potentially higher rates of E waste re-use will depend on demand for landscaping material from future development projects and for fill to restore mineral sites. Conversely, high levels of local C&D recycling are likely to be maintained as the cost of alternative management methods is expensive by comparison and secondary materials should be cheaper than virgin material provided quality standards can be met.
EU Thematic Framework on Waste
What is in force or proposed?: The evolving thematic framework may result in further changes to the Waste Framework Directive. In Summer 2014 the EU proposed further changes with key ones being:
Recycle, compost or re-use 70% of household waste by 2030;
End landfill disposal of biodegradable waste by 2025;
Reduce food waste arisings by 30% compared to current levels by 2025.
The EU has moderated its position on these proposals but is committed to further consultation on them and other policy changes with respect to packaging materials. These developments are intended to help in implementing the wider policy intention of creating a circular economy that uses materials more efficiently and sparingly, and that relies on greater use of recycled resource and less virgin material.
What are the implications?: These proposals could have greater implications for waste strategies that rely on moderate to high levels of energy recovery and this applies to Kirklees regardless of whether a landfill ban is implemented. Potential for policy change will need to be taken into account in the future definition of the residual waste management strategy for LACW. It also implies that a Waste Plan seeking to implement net self-sufficiency will need to evaluate the implications of providing sufficient infrastructure to allow diversion of biodegradable C&I waste also.
Defra Landfill Ban Proposals
What is in force or proposed?: Defra has consulted the waste industry and wider public in the last 4 years on the possible introduction of legislation banning certain materials from landfills. The materials covered include glass, plastics, wood, food waste, textiles, aluminium and other metals. Current diversion rates depend in part on householder support in separating materials at source and also on waste contractors having infrastructure to intercept mixed residual waste and removing material where possible.
The consultations concluded that – for the time being – landfill bans were impractical. At the time the landfill tax was regarded as the strongest motivation for reducing disposal of recyclables. Defra intends to review this policy although this may be unnecessary while landfill tax continues to rise, albeit at a slower rate than before. However the recent EU proposals (see above) would implement similar changes and would impose a timescale on the UK.
What are the implications?: Options for managing residual waste in the future need to consider the implications of a complete ban on

21
Part 2: Growth Forecasts
and Assessment of Future
Capacity Requirements biodegradable materials and the implications this will have for the type and quantity of infrastructure needed to bring about complete diversion of these materials whether they are part of the LACW or the C&I stream.

22
4. Methodology for Predicting Future Waste Capacity
Requirements
4.1.1. The Waste Needs Assessment has employed the structure shown in Figure 2 to assess
future capacity requirements.
Figure 2: Methodology for Predicting Future Waste Requirements
4.2. Identifying Current Waste Arisings and Existing Capacity
4.2.1. In order to identify future waste arisings and capacity it is important to gain as accurate
a picture as possible of current waste arisings and the capacity of existing permitted
waste management facilities. Economic and waste trends are then used to forecast
future waste growth and subsequently the need for new facilities can be projected
based on any capacity gaps that are identified.
4.2.2. Data on waste arisings across the streams listed in Table 1 has been analysed and
identified in the Part 1 report which defines the situation in the baseline year of 2013.
4.2.3. A review of existing licensed waste management facilities operating within Kirklees has
been undertaken in parallel. Appendix 1 provides detail of the existing waste
management sites in the Borough, the functions they provide, and the type of wastes
that each manages. Appendix 2 summarises the aggregate capacity of all facilities of a
particular type.

23
Part 2: Growth Forecasts
and Assessment of Future
Capacity Requirements 4.2.4. There are currently 64 facilities operating in Kirklees carrying out a range of waste
management activities across the principal waste streams. They include:
facilities such as household waste recycling centres;
transfer stations, where waste can be sorted, bulked and separated before onward
transport for further management;
sites recycling mixed wastes and specific materials such as metals;
a range of treatment facilities dealing with common residual wastes;
energy recovery facilities such as the Energy from Waste (EfW) plant in
Huddersfield; and
other facilities taking material such as hazardous wastes, electrical equipment, etc.
that may require special handling.
4.2.5. There are also a number of landfill sites and other locations accepting inert wastes for
backfilling, restoration and landscaping purposes (collectively referred to as land
recovery operations). Planning permissions for three landfill sites in the Plan area will
expire during the plan period.
4.2.6. Operational waste sites were identified from those locations listed in the Environment
Agency’s Waste Data Interrogator tool for 2013, which were cross-checked against a list
of permitted facilities provided by the EA and against the Public Registers4. The Council
also provided details of recently permitted sites that have yet to start operations but
which are expected to contribute to local capacity during the Plan period. The resulting
list was reviewed by council officers to identify any further information from relevant
planning permissions or other sources regarding the capacity and end date for the
existing use of a site.
4.2.7. Some capacity data has been compiled from the EA licence, and/or Planning
Permission information (where available). However the EA has recently ceased
supplying details of licensed capacity for a site as this is a theoretical value and may not
4 In the course of identifying site capacity (as subscribed in the following paragraphs) a number of sites were identified that
had reported accepting waste in previous years but not in 2013. Sites that had only recently apparently stopped accepting waste
recently were assumed to be mothballed for a short time and included in the capacity assessment except where Council officers
advised a facility was known to have shut permanently. Sites that stopped accepting waste in 2010 or earlier were excluded
based on the expectation that the recession had forced them to shut.

24
accurately reflect the physical throughput that the site can provide5. As a result a review
of past annual throughputs was also undertaken to ascertain the most accurate
information for the actual available capacity at each site. The past 5 years’ data was
reviewed in identifying the maximum perceived capacity for each facility based on how
much material it actually handled.
4.2.8. The capacity of all existing waste sites validated through this process has been included
in the model for purposes of estimating future waste requirements for the KLP. The
maximum throughput capacity identified over the last 5 years is assumed to be available
for the duration of the KLP, unless the operator/landowner has advised otherwise.
4.2.9. All companies currently or recently operating waste sites were contacted by email to
check details about their operations; however the response rate was extremely poor
and did not identify any significant changes or new information.
4.3. Modelling and Assumptions
4.3.1. The Waste Needs Assessment provides information on future waste arisings for the
principal waste streams shown in Table 1, and identifies where there may be a capacity
gap at any time in the period 2013-2031. Information is also provided on hazardous
waste, which is a sub category of LACW, C&I and CD&E waste. The data study
provides a level of detail and consistency that has not previously been available to
Kirklees. The projection of future waste capacity requirements must consider how much
waste arises and must evaluate the potential for recycling or energy recovery with the
aim of managing waste more sustainably and moving it up the Waste Hierarchy as
shown in Figure 3.
5 Environmental Permits for waste operations are issued in capacity bands and therefore the site capacity may be substantially
less than the maximum allowed by its Permit. When such inaccuracies are repeated across a substantial number of sites there is
a risk that the available capacity will be significantly over-estimated and therefore it is necessary to estimate capacity in other
ways.

25
Part 2: Growth Forecasts
and Assessment of Future
Capacity Requirements Figure 3: The Waste Hierarchy
Source: DCLG, National Planning Policy for Waste, Appendix A
4.3.2. In order to comply with the EU Waste Framework Directive and the National Planning
Policy for Waste, each type of waste must be managed at the highest technically and
economically feasible level in the Waste Hierarchy, while recognising that landfill will
remain the only realistic option for disposing of certain wastes. The need for waste
management facilities to deal with the waste in a more sustainable way will form an
integral part of the waste element of the KLP. This approach is consistent with the
Government's wider sustainable development agenda and its approach to sustainable
waste management in particular.
4.3.3. As noted in section 3 of this report, local performance in recycling LACW is currently not
on track to achieve the statutory target for 2020, while the combined levels of recycling
and energy recovery mean that the corresponding target for diverting biodegradable
waste from landfill is already being exceeded five years ahead of the 2020 target date.
4.3.4. Forecasting future requirements involved constructing a number of scenarios based on
different levels of arisings growth, and different levels of recycling, recovery and landfill
performance.
4.3.5. The growth scenarios considered for the LACW, C&I, CD&E and agricultural waste
streams are summarised in Table 2.

26
Table 2: Summary of Growth Scenarios
Scenario Annual growth rate assumptions
Baseline Growth No further growth in arisings in all waste streams
Growth Scenario 1 (Lowest Growth)
LACW (H) – 3% to 2015; 2% thereafter
C&I, CD&E and hazardous – all 0.5485% throughout the Plan period
No change in arisings in other streams
Growth Scenario 2 (Moderate Growth)
LACW (H) – 3.0354% to 2015; 2.0354% thereafter
C&I, CD&E and hazardous – all 0.59125% throughout the Plan period
No change in arisings in other streams
Growth Scenario 3 (Higher Growth)
LACW (H) – 3.1341% to 2015; 2.1341% thereafter
C&I, CD&E and hazardous – all 0.7087% throughout the Plan period
No change in arisings in other streams
Growth Scenario 4 (Maximum Growth)
LACW (H) – 3.2728% to 2015; 2.2728% thereafter
C&I, CD&E and hazardous – all 0.8733% throughout the Plan period
No change in arisings in other streams
[Sources: Kirklees Council WDA forecasts; Demographic Analysis and Forecasts, September 2014, Edge Analytics for Kirklees
Council]
4.3.6. Growth rates reflect both external influences on future waste arisings and the Council’s
own expectations. The Council’s Waste Disposal Authority provided the projections for
LACW(H) which reflects the effects of changes in waste arisings as a result of waste
reduction and recycling initiatives promoted through the Municipal Waste Management
Strategy together with the impact of future population growth in the Borough.
4.3.7. Forecast growth rates for other streams are based on demographic projections of
employment in Kirklees, drawing forecasts from econometric modelling undertaken for
the Council that informs, and is therefore consistent with, other plans and strategies.
They reflect:
future anticipated levels of economic activity;
the impact of fiscal financial/legislative factors such as landfill tax charges driving
waste away from landfill (which affects LACW also);
financial incentives such as Renewable Obligations Certificates which increase the
economic viability of energy recovery).

27
Part 2: Growth Forecasts
and Assessment of Future
Capacity Requirements 4.3.8. Three waste management behavioural scenarios were defined in order to assess the
implications of different options for managing these streams in terms of the proportion of
material recycled, treated, used for energy recovery, and disposal. Table 3 sets out the
three scenarios chosen to reflect the potential changes in practice in the management
of waste arisings. It takes into account the increasing recycling potential through the
changes in waste collection, processing and treatment practices, particularly for
Commercial and Industrial waste, and the corresponding reduction in landfill disposal.
4.3.9. These ‘behaviour modifiers’ are based on professional judgement of realistic maximum
levels of landfill diversion that might be achieved and were agreed with Council officers.
They also reflect the best available information at the time this report was prepared and
can be amended and re-modelled to take account of any future changes if performance
falls below or exceeds these assumptions.
4.3.10. The LACW(H) targets have been selected to model the government target of recycling
of LACW(H) for a combined country approach to 50% recycling by 2020 (Maximum
recycling) and a lower target of 40% recycling (Median recycling) by 2020 (the baseline
position for LACW(H) is 30% at 2013/14).

28
Table 3: Summary of Behaviour Scenarios
Behaviour Scenario 1 (Baseline)
No change - the Part 1 report identifies the proportions of each waste stream that are currently recycled, composted, treated, sent to energy recovery or to landfill.
Behaviour Scenario 2 (Maximised Recycling and Recovery)
By 2020 By 2031
LACW(H) 50% recycled or composted; 45% to energy recovery 5% to landfill
LACW (all types) – no change from 2020
Other LACW as for baseline
C - 75% recycled; 5% to EfW; 4% to other treatment; 16% to landfill
C – 80% recycled; 6% to EfW; 4% to other treatment; 10% to landfill
I – 81% recycled or composted; 16% to landfill; 3% to land recovery
I – 85% recycled or composted; 12% to landfill; 3% to land recovery
C&D – 55% recycled; 25% treated; 20% to landfill
C&D – 65% recycled; 25% treated; 10% to landfill
E – 50% recycled; 2% treated; 13% to landfill; 35% to land recovery
E – 55% recycled; 2% treated; 8% to landfill; 35% to land recovery
Agricultural and hazardous as for baseline Agricultural and hazardous as for baseline
Behaviour Scenario 3 (Median Recycling and Maximised Recovery)
By 2020 By 2031
LACW (H) – 40% recycled or composted; 55% to energy recovery; 5% to landfill
LACW(all types) – no change from 2020
Other LACW as for baseline
C – 70% recycled; 4% treated; 2% to energy recovery; 24% to landfill
C – 75% recycled; 4% treated; 4% to energy recovery; 17% to landfill
I – 76% recycled or composted; 21% to landfill; 3% to land recovery
I – 80% recycled or composted; 18% to landfill; 2% to land recovery
C&D – 50% recycled; 28% treated; 22% to landfill
C&D – 55% recycled; 30% treated; 15% to landfill
E – 15% recycled; 10% treated; 45% to landfill; 30% to land recovery
E – 20% recycled; 5% treated; 40% to landfill; 35% to land recovery
Agricultural and hazardous as for baseline Agricultural and hazardous as for baseline

29
Part 2: Growth Forecasts
and Assessment of Future
Capacity Requirements 4.3.11. The approach summarised above allows up to 9 future scenarios to be modelled using
different combinations of growth and behaviour assumptions. A summary of the waste
arisings forecast for each combination of scenarios is provided in Appendix 3.
4.3.12. The approach to estimating capacity has been explained earlier in this chapter. In
addition, assumptions have been made on specific existing waste management sites
using information from the Council in regard to landfill sites, with total capacity void
space remaining figures obtained from the Environment Agency. This is set out in
Table 4. The estimated site closure dates may be subject to change and the model will
be updated to reflect any new information.
Table 4: Assumptions about Existing and Planned Waste Management Sites
Waste Site Capacity Assumption
Laneside Quarry Landfill site
Landfill (non-hazardous)l with 1,250,000 m3 of void space6
Planning permission due to expire in August 2015. The model has 2 options –
site closes in 2015
site remains open to 2025 accepting 27,847 tonnes per annum
Kirklees Energy from Waste plant
132,000 tonnes (annual)
Funded through PFI between Council and Sita Kirklees Ltd. Contract expires in 2023 with an option for a 5 year extension to 2028. The model has 2 options –
site closes in 2028
site continues to operate up to 20367
[Source: Kirklees Council]
4.3.13. Many of the existing waste management operations can treat more than one waste type
- eg. sites using technologies to treat residual can also treat residual C&I waste. Waste
management site licences and planning permissions do not specify limits on the
proportions of waste from each waste stream that can be handled at different sites. As a
result professional judgement has to be applied to identify which waste streams each
site handles, but it is not possible to determine the relative proportions except on those
6 The Council has advised that the permission for this site allows for acceptance of non-inert waste but that it is currently
accepting inert waste only. However the capacity assessment assumes that it will be capable of accepting both types of waste
while it remains operational. 7 These options are included for the purpose of modelling the effects of continued operation of the plant on residual waste
disposal needs and do not imply any commitment at the present time to operation beyond 2023.

30
sites contracted to handle LACW only or which have permissions to handle hazardous
wastes.
4.3.14. It is therefore not possible to assess each existing waste management facility by
individual waste stream and so results are grouped together to gain an overall picture of
capacity by waste management type. The resulting waste management types are
shown in Table 5.
Table 5: Waste Management Facility Categories Used in the Model
Waste Management Facility Type
Landfill (C&I and LACW)
Landfill (Hazardous)
Inert Landfill (CD&E)
Landfill (LACW Secondary)
Energy from Waste (LACW, C&I)
Thermal Treatment without energy recovery (LACW,C&I)
Recycling (LACW, C&I, Agricultural)
Recycling (C&D)
Recycling (Specialised)8
Recycling (Hazardous)
Recycling (LACW Secondary)
Composting (C&I, LACW)
Treatment (C&I,)
Other Treatment/Transfer (Hazardous/CI)
Land Recovery (CD&E)
8 The work distinguishes between Materials Recycling Facilities that accept and separate a range of mixed wastes, and
specialised facilities that only manage certain types of material. Virtually all the latter type of local capacity is located in metal
recycling sites and vehicle dismantlers with Kirklees containing a considerable surplus of both in common with many other
local authorities. At the same time there may be a shortfall of capacity for recycling LACW and C&I wastes, but such
specialised sites lack facilities for handling these materials and therefore any surplus of this type of capacity must not be traded
against a shortfall of other capacity as there is no scope for this to happen.

31
Part 2: Growth Forecasts
and Assessment of Future
Capacity Requirements 4.3.15. Utilising the latest data (at December 2014), existing information was assembled and
collated into a Waste Facility Capacity Database, with each site allocated to managing
one or more waste streams. Table 6 summarises the available capacity by stream and
management function, which is assumed to be available for the duration of the plan
unless information has been obtained from the operator indicating earlier closure.
Table 6: Estimated Annual Capacity Available from Licensed Operational Waste
Management Facilities within Kirklees
Transfer station
Recycling (MRF)
Recycling (special)
Treatment Energy recovery
Land recovery
Landfill
LACW only 250 32 132
LACW + C&I
C&I only 85 95 14
C&I + CD&E
62 95 <1
CD&E only 22 157
E only 98
Hazardous 1 1 22
TOTAL 250 32 132
[Source: Kirklees Waste Needs Assessment model January 2015. All figures in 000 tonnes, rounded]
4.3.16. The modelling process calculates the total available capacity for particular types of
waste management sites and matches this to the arisings which can be managed
through these sites. The process involves the following stages:
For each stream or combination of streams the amount of capacity available for
each management route is summed (eg. the amount of recycling capacity available
to handle LACW and C&I wastes);
The chosen Growth Modifier scenario (see Table 2) is used to forecast the change
in arisings over the Plan period
The chosen Behaviour Modifier scenario (see Table 3) is used to distribute the
quantity of arisings between the different management routes reflecting the relative
levels of recycling, recovery and disposal that are assumed;

32
The available capacity is subtracted from the forecast quantity of waste that will
need to be managed and the result indicates whether there is a gap or a surplus of
capacity.
4.3.17. The model cannot show capacity surpluses or gaps for any single site or waste stream
unless there is only one site entered in the model which is designated to take only one
category of waste. In all other cases figures identify the total available capacity for the
waste management type across all sites. The model has been designed to assume that
all available waste management capacity is used to manage waste arising in Kirklees
and no allowance is made for the use of capacity at merchant sites to accept wastes
from outside the Authority.

33
Part 2: Growth Forecasts
and Assessment of Future
Capacity Requirements
5. Potential Capacity Gaps in 2031
5.1.1. The model allows the results of modelling all 15 scenario options as defined in the
previous chapter to be used to assess future capacity requirements. At the time of
writing this report no decision has been taken on which scenario the KLP would aim to
deliver. This chapter documents and summarises the gap analysis for the scenarios.
5.1.2. The model projects capacity gaps across each of the modelling scenarios for the period
2015-2031. The detailed results of the requirements for each waste management route
are set out in Appendix 4 and a summary of the position at the end of the Plan period is
shown in Table 7. These three scenarios are presented as they represent the least and
most extensive changes from the current position and the impact of choosing a median
recycling option. Note that negative figures in the tables and figures below, and those in
Appendix 4, identify capacity surpluses.
5.1.3. Table 7 also distinguishes between the EfW capacity available if the plant closes when
planned, or if it continues to operate as referred to in Table 4.
5.1.4. Figures 5 and 6 (which follow Table 7) summarise the outcomes for the three
behavioural scenarios and maximum growth at 2031 and also show the effect of
different closure dates for the EfW plant.
Table 7: Capacity Gap Comparison for the Scenarios Modelling the Least and
Most Extensive Changes in Requirements
Waste Management
Route & Wastes
Baseline / No Growth 2031
Growth 4 Maximised Recycling /
Recovery 2031
Growth 3 Median/Recovery
Landfill (C+I 101,515 46,664 72,074
Landfill LACW 10,835 9,713 9478
Landfill (Hazardous) 7,229 8,428 8,188
Landfill (Hazardous LACWsecondary)
1358 2,055 2,005
Landfill (C+D&E) -32,003 -135,620 -72,916

34
Waste Management
Route & Wastes
Baseline / No Growth 2031
Growth 4 Maximised Recycling /
Recovery 2031
Growth 3 Median/Recovery
Thermal treatment with energy recovery (‘Energy from waste’)
Closure in 2028: 105,068
Operating to 2031:
-26,932
Closure in 2028: 100,574
Operating to 2031:
-31,426
Closure in 2028
97,724
Operating to 2031
-19,937
Thermal treatment (without energy recovery)
6,105 4,897 4,777
Recycling (C+I, & Agricultural)
10,313 106,165 77,286
Recycling (LACW only)
8,481 27,103 25,663
Recycling (C+D) 82,649 164,515 90,810
Recycling (metals only)
-38,424 -28,133 -30,056
Recycling (Hazardous)
20,100 24,697 24,008
Recycling (specialist WEEE)
-38,424 -28,133 --30,056
Composting 15,451 15,873 15,489
Treatment plant -23,179 -18,836 -19,345
Other treatment plant / transfer (Hazardous / C&I)
25,875 29,702 34,550
Land recovery -67,187 -26,463 -28,713
[Source: Kirklees Waste Needs Assessment model May 2015. All figures in tonnes – negative figures indicate capacity surpluses]

Figure 4: Comparison of Capacity Gaps at 2031 with Maximum Growth – EfW Plant Assumed to Close in 2028
[Source: Kirklees Waste Needs Assessment model January 2015]
-200,000
-150,000
-100,000
-50,000
0
50,000
100,000
150,000
200,000
250,000
Ton
ne
s
Waste Management Method
Comparision of gap under 3 Recycling Scenarios and Growth 4 at 2031
baseline
Median recycling
Maximised Recycling

36
Figure 5: Comparison of Capacity Gaps at 2031 with Maximum Growth – EfW Plant Assumed to Remain Open
[Source: Kirklees Waste Needs Assessment model January 2015]
-200,000
-150,000
-100,000
-50,000
0
50,000
100,000
150,000
200,000
250,000
Ton
ne
s
Waste Management Method
Comparision of gap under 3 Recycling Scenarios and Growth 4 at 2031
baseline
Median recycling
Maximised Recycling
6. Future Requirements
6.1. Introduction
6.1.1. This section of the report sets out the future requirements for each of the principal waste
streams in turn, setting out:
Current arisings and capacity of existing facilities;
Capacity of additional facilities that will be required to deal with forecast future
arisings9.
6.2. Local Authority Collected Waste (LACW)
6.2.1. The collection and management of LACW across Kirklees is the responsibility of
Kirklees Council as statutory Waste Collection and Waste Disposal Authority. LACW
includes some "trade waste” which the council collects from businesses and other
organisations. For the purpose of modelling and the waste needs assessment this
material has been deducted from LACW as it is already captured under C&I waste
management. For modelling purposes LACW has been further separated as LACW (H)
(waste collected from households) and LACW (Other) (non-household wastes such as
street sweepings) to allow assessment against the Waste Framework Directive
recycling target (50% by 2020) which applies only to waste collected from households.
The secondary waste by-products created from the first stage EfW recovery process
have been further included as LACW (Secondary). The term residual waste refers to the
waste that cannot be or is not separated for recycling or composting. The Council
currently diverts most of its residual waste away from landfill through the waste disposal
contract with Sita Kirklees Ltd (formerly Sita), principally through the Huddersfield EfW
Plant.
LACW: Current Arisings, Facilities and Management Mix
6.2.2. In 2013/4 arisings of LACW(H) totalled 155,916 tonnes with a further 20,478 tonnes of
LACW(Other) and 27,635 tonnes of LACW (secondary). Therefore the total quantity of
LACW waste was 204,029 representing 23% of all waste arisings in the Plan area10.
9 The summary of the LACW stream includes a specific section reviewing future arisings due to the importance attached to
understanding the implications of continued operation of the EfW facility and requirements for other infrastructure beyond the
end of the PFI contract. 10
Further to the comment in the previous paragraph, the quantity of trade waste collected in 2013/14 and deducted from total
LACW arisings was 25,147 tonnes.

38
6.2.3. As stated above, Kirklees currently relies on the EfW facility at Huddersfield as the
primary method of disposing of residual LACW and at present the plant currently
handles a total of 101,211 tonnes of LACW(H) and LACW(Other)).
6.2.4. Mixed recyclables are handled at the dedicated Materials Recycling Facility in
Huddersfield and the Thornhill integrated Waste Management Facility in Dewsbury. In
2014 33,725 tonnes were recycled at these two sites with separated wastes sent to third
party-operated reprocessing plants outside the Plan area. Some materials that require
more specialised recycling (eg. batteries) are taken to other reprocessing sites operated
by Suez (Sita’s parent company) which serve several regions and which are located
outside the authority.
6.2.5. There are no operational non-hazardous landfill sites in Kirklees (although one site
Laneside Quarry Landfill is permitted until the end of 2015 to accept such material) and
as a result any residual waste that cannot be sent for energy recovery is currently
exported out of the Plan area. Currently the main export routes are to landfills in
Scunthorpe, Wakefield and Leeds, however it is understood that during 2015 all waste
will start to go to Skelton Grange landfill in Leeds. In 2013 the quantity of LACW(H)
disposed to landfill was 10,440 tonnes.
6.2.6. There is a single site in Huddersfield that has a composting pad and which has
permission to compost green waste. However the PFI contractor currently sends around
12,700 tonnes of material to a facility in Wakefield and the capacity gap assessment
assumes this arrangement will continue in the foreseeable future.
LACW: Future Arisings
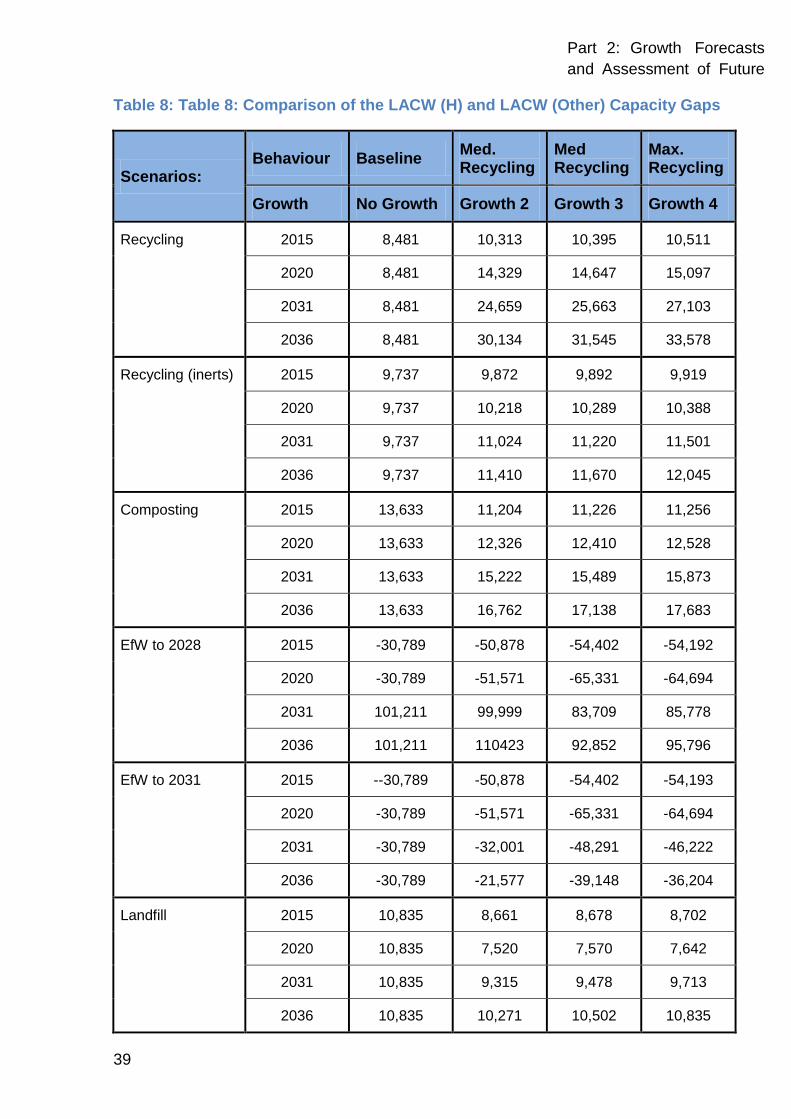
6.2.7. Table 8 summarises an analysis of the LACW capacity gap for all management routes
for four combinations of growth and management scenarios covering the range of
possible outcomes. It also allows comparison of the impact of closure of the EfW facility
in 2028 and if it remains in operation subsequently.
6.2.8. Table 8 shows that while the Growth 2, 3 and 4 scenarios would result in greater landfill
diversion rates, the limited quantity of certain local capacity results in a corresponding
increase in the capacity gap for facilities for recycling LACW(H) including a small
amount of inert waste in that stream.
39
Part 2: Growth Forecasts
and Assessment of Future
Capacity Requirements Table 8: Table 8: Comparison of the LACW (H) and LACW (Other) Capacity Gaps
Scenarios: Behaviour Baseline
Med. Recycling
Med Recycling
Max. Recycling
Growth No Growth Growth 2 Growth 3 Growth 4
Recycling
2015 8,481 10,313 10,395 10,511
2020 8,481 14,329 14,647 15,097
2031 8,481 24,659 25,663 27,103
2036 8,481 30,134 31,545 33,578
Recycling (inerts) 2015 9,737 9,872 9,892 9,919
2020 9,737 10,218 10,289 10,388
2031 9,737 11,024 11,220 11,501
2036 9,737 11,410 11,670 12,045
Composting
2015 13,633 11,204 11,226 11,256
2020 13,633 12,326 12,410 12,528
2031 13,633 15,222 15,489 15,873
2036 13,633 16,762 17,138 17,683
EfW to 2028
2015 -30,789 -50,878 -54,402 -54,192
2020 -30,789 -51,571 -65,331 -64,694
2031 101,211 99,999 83,709 85,778
2036 101,211 110423 92,852 95,796
EfW to 2031
2015 --30,789 -50,878 -54,402 -54,193
2020 -30,789 -51,571 -65,331 -64,694
2031 -30,789 -32,001 -48,291 -46,222
2036 -30,789 -21,577 -39,148 -36,204
Landfill
2015 10,835 8,661 8,678 8,702
2020 10,835 7,520 7,570 7,642
2031 10,835 9,315 9,478 9,713
2036 10,835 10,271 10,502 10,835

40
[Source: Kirklees Waste Needs Assessment model May 2015 – all figures in tonnes; negative values identify where there is a
capacity surplus]
LACW: Required Facilities – Energy Recovery
6.2.9. The modelling scenarios assume that the existing energy recovery facility with a
capacity of 132,000 tonnes will be available until 2028 and a further modelling exercise
examines the effect of extended operations to 2036. Current operations allocate this
capacity for managing LACW only and the assessment therefore assumes that any
spare capacity that may be identified would not be available for energy recovery of
residual C&I wastes.
6.2.10. Two other assumptions about EfW capacity should be noted:
the capacity shown above reflects the maximum throughput reported over the
period 2010-2014 and is therefore considered to be a realistic estimate of what can
be accepted once the effect of partial closure for periodic scheduled maintenance is
taken into account;
it is expected that the plant will need to be refurbished if it continues operation
beyond 2028 though it is not known whether this would result in a change in
capacity. The model assumes the capacity referred to above would continue to be
available throughout the extended operating period.
6.2.11. If the EfW plant closes in 2028, under the No growth/Baseline scenario combination
there will be a shortfall of capacity of over 100,000 tonnes (101,211t) annually for the
remainder of the Plan period, and under Growth/maximised recycling combination this
gap increases from just over 99,000 tonnes (99,752t) in 2029 to almost 116,500 tonnes
(116,486t) tonnes by 2036, under median recycling the gap is similar at 97,610 tonnes
rising to 112,906 tonnes by 2036. If the EfW plant is not continued then the plan will
need to address this gap.
6.2.12. This aspect of the assessment can now inform the Council’s review of the strategy for
managing residual LACW once the current PFI contract has ended.
LACW: Required Facilities – Recycling & Reprocessing
6.2.13. The requirement for additional recycling capacity to achieve net self sufficiency
increases over the plan period in all of the growth scenarios. The gap at primary
processing facilities (specifically MRFs) increases from 10,500 to 33,500 tonnes over

41
Part 2: Growth Forecasts
and Assessment of Future
Capacity Requirements the Plan period under the Growth4/Maximum recycling scenario combination, under
median recycling the requirements rise from 13,762 in 2014 to 25,663 tonnes in 2031.
6.2.14. However it is important to recognise that recycling is a multi-stage process and the
current assessment can only assess requirements for the initial stage of separating
materials, whether this occurs at MRFs or HWRCs. The separated material requires
further downstream capacity to reprocess it into secondary products and at present this
activity occurs outside Kirklees. As recyclate comes from both LACW and C&I sources
and from a wide geographic range of sources the delivery of new capacity locally will
depend on whether it is commercially attractive to private waste contractors and it is not
clear that the Plan can provide for these facilities specifically. Any continued reliance on
external capacity has implications for matters the Council needs to address with respect
to the Duty to Cooperate.
6.2.15. In addition to the gap identified above there is also a small, persistent gap for recycling
the same quantity (10,000 to 12,000 tonnes) of inert wastes which have been identified
as part of this stream.
6.2.16. Additional non-inert capacity may be provided by expansion of the existing facilities
however this will depend on the approach taken by the current PFI contractor. The small
scale of the inert capacity gap and the current quantity of arisings suggests these
materials will be handled at merchant sites locally or in other authorities, or that the
contractor is moving them to a centralised facility outside Kirklees.
LACW: Required Facilities – Landfill
6.2.17. Even though all the Growth scenarios result in falling levels of landfill disposal there will
still be a shortfall throughout the Plan period due to a lack of local capacity. The
shortfalls for disposal of LACW(H) and LACW(other)) wastes fall from 10,800 tonnes
under the baseline position to 7,570 tonnes (Median Recycling/Growth 3) and 7,642
tonnes (Maximised recycling/Growth 4 scenario). These figures reflect the situation at
2020, and the gap then rises to 10,271 tonnes, 10,502 and 10,835 tonnes respectively
by 2036 as a result of the assumptions of continued growth in arisings under each
scenario.
42
6.3. Commercial and Industrial (C&I) Waste
6.3.1. There have been no specific surveys of C&I waste arisings in Kirklees and therefore the
quantities of C&I waste arisings have been extrapolated from a survey of this stream in
the North West region as it is geographically close to Kirklees and data is published in
sufficient detail with respect to the number, size and sector distribution of businesses to
allow the results to be extrapolated to the Plan area.
C&I Waste: Current Arisings, Facilities and Management
6.3.2. Industrial waste makes up 54% of C&I arisings with the principal sources being Textiles
/ Wood / Paper / Publishing (27%), Other Manufacturing (25%) and Chemical and Non-
metallic Minerals Manufacturing (23%). Commercial waste makes up 46% of C&I
arisings with the main producing sectors being Retail and Wholesale, Other Services
(ie. banks, insurance, solicitors, service providers) and the Hotel and Catering sectors.
6.3.3. Combined C&I arisings at present amount to 395,000 tonnes of which around 32,000
tonnes is classified as hazardous waste.
6.3.4. Extrapolation of the NW survey results suggests recycling is the predominant waste
management route for both parts of the stream, with rates of 71% for Industrial wastes
(around 129,000 tonnes) and 66% for Commercial wastes (around 119,000 tonnes). In
both cases 23% of waste (around 90,000 tonnes from both streams) is disposed to
landfill.
6.3.5. Many of the existing waste management operations can treat more than one waste
stream. However the facilities serving the PFI contract handle LACW only and therefore
it is possible to identify the capacity available to manage C&I waste.
6.3.6. Currently there is estimated to be 275,000 tonnes of capacity for recycling C&I wastes.
However it should be recognised that some of these facilities also manage CD&E
wastes with the respective quantities varying from year to year as the materials are
normally managed under short-term contracts, making it difficult to establish
requirements accurately.
6.3.7. There is also a moderate quantity of 95,000 tonnes of specialised recycling capacity
(typically handling metals) and around 15,000 tonnes of treatment capacity.

43
Part 2: Growth Forecasts
and Assessment of Future
Capacity Requirements C&I Waste Required Facilities: Transfer Stations
6.3.8. Waste transfer stations and bulking facilities provide a valuable component in the
efficient management of waste materials though they do not contribute to recycling or
recovery rates directly. They are particularly useful when waste arisings are relatively
small in quantity and widely distributed within high density populated areas.
6.3.9. Under all growth projections and future arisings scenarios modelled, there is adequate
capacity at existing transfer station facilities within the Plan period to 2031 (and to
2036). However, there is no certainty that transfer capacity is in the right location to
serve future waste management needs and the Plan needs to be flexible up to a point,
allowing additional facilities to come forward if it can be demonstrated that there are
local shortages of capacity close to where waste arises.
C&I Waste Required Facilities: Recycling Facilities
6.3.10. The Baseline Scenario/no growth indicates that a gap in the order of 10,000 tonnes in
capacity appears for the baseline position and increases under all growth scenarios and
with increased recycling. The gap becomes significant for C&I under both Growth
options 3 and 4 when seeking to achieve the Maximised recycling scenario by 2031.
Table 9 shows the growth in the capacity gap under this scenario combination.
Table 9: Capacity Gaps for Recycling C&I Waste Over the Plan Period*
Year Baseline
No Growth Median Recycling
Growth 2 Median Recycling
Growth 3 Maximised
Recycling Growth 4
2015 10,313 17,817 18,279 24,205
2021 10,313 40,221 42,286 64,648
2031 10,313 71,940 77,286 106,165
*Due to the nature of licensed waste management sites being able to treat both C&I, some agricultural wastes for recycling and
LACW waste (origin in this classification is not distinguished when reporting to the Environment Agency from sites) local knowledge
has also been applied to aid separation of LACW wastes.
[Source: Kirklees waste needs assessment model, May 2015]
C&I Waste Required Facilities: Composting
6.3.11. The summary of LACW capacity requirements refers to a single site in Kirklees that is
equipped and permitted to compost green waste. This facility has never been in service
and is operated by the PFI contractor which currently makes alternative arrangements

44
using capacity outside Kirklees. It is unlikely this site will open for this purpose or that
the capacity would be available to manage similar waste in the C&I stream.
6.3.12. Around 2,600 tonnes of C&I waste is currently composted. All modelling scenarios
based on increase recycling performance also assume a proportionate increase in
composting and under the Growth4/maximised recycling) scenario the quantity rises to
around 3,500 tonnes by the end of the Plan period. This level of requirement is typical of
a small-scale green waste composting facility and suggests it would be realistic for the
Plan to make provision for such a facility to come forward and reduce dependence on
external capacity.
C&I Waste Required Facilities: Specialised Recycling
6.3.13. Modelling shows a surplus capacity for this type of facility throughout the Plan period
under all scenario combinations though there are small differences in the size of the
surplus (between 28,000 and 38,500 tonnes). Therefore no further capacity is needed to
manage local wastes
C&I Waste Required Facilities: Treatment
6.3.14. Treatment includes a wide range of processes that may be required to deal with specific
materials prior to recycling, energy recovery or final disposal. There is a current surplus
of some 20,000 tonnes capacity within Kirklees throughout the entire Plan period. It is
expected this will primarily be available to treat C&I wastes as the management route
for LACW is determined by the terms of the PFI contract until 2023.
C&I Waste Required Facilities: Energy from Waste
6.3.15. Existing energy recovery capacity is dedicated to managing LACW through the PFI
contract and, as stated previously, the assessment assumes there is no spare overhead
available to manage locally arising C&I waste.
6.3.16. The baseline position suggests that only a small proportion of C&I waste is currently
going to thermal treatment with or without energy recovery. Even under the maximum
recycling growth assumptions it would account for no more than around 4% of arisings
(around 15,000 tonnes). This situation is likely to reflect the existing high level of
recycling which leaves only a moderate amount of residual waste, much of which may
be unsuitable for this form of treatment.

45
Part 2: Growth Forecasts
and Assessment of Future
Capacity Requirements 6.3.17. This quantity is too small to make a local facility economically viable unless it serves a
wider market. Published reports suggest the UK currently has a surplus of operational
or planned EfW capacity. Therefore there would be limited incentive to bring forward
additional capacity locally. It will be necessary to continue relying on capacity in other
authorities.
C&I Waste Required Facilities: Non-Hazardous Landfill
6.3.18. There is a single landfill (Laneside Quarry) permitted to accept non-hazardous waste
but it has only accepted inert waste in the past and is due to close in 2015.
Nevertheless, for the purposes of this study the capacity it offers has been taken into
account in the very early years of the Plan period while the site remains open.
6.3.19. Closure of the site will create a capacity gap of over 100,000 tonnes from 2016, rising to
120,000 tonnes by 2031 if there is no further improvement in recycling performance.
Note that while further improvement could be envisaged for LACW in order to work
towards EU and national targets, the high existing level of diversion of C&I wastes
suggests the existing level may be a more accurate reflection of capacity needs in the
longer term. In contrast the higher recycling performance assumed for the Growth
4/Maximised Recycling scenario combination would reduce the capacity shortfall to
46,664 tonnes by 2031 and under Growth3/Median Recycling.
6.3.20. The fate of the site cannot be judged at this time. However if it was granted a further
operational extension and if it began to take non-hazardous waste then the capacity gap
of 100,000 tonnes would not materialise until 2026. However if higher recycling
performance is achieved the shortfall would be around 36,000 tonnes.
6.3.21. Given the previous history of this site it appears unlikely to expect that the operator
would begin to take biodegradable waste, not least because of the complications this
would entail in minimising environmental impacts, some of which should not arise while
it takes inert waste only. As a result the Council will need to assume that disposal of
residual C&I waste will continue to depend on external capacity and it will need to take
appropriate steps to contact receiving authorities to establish that capacity will continue
to be available through the Plan period.

46
6.4. Construction, Demolition and Excavation (CD&E) Waste
6.4.1. Waste materials generated from Construction, Demolition and Excavation (CD&E)
operations include surplus waste construction materials as well as a range of materials
generated by the demolition of buildings and soils and sub-soils from excavation. Most
of these materials are inert with respect to their pollution potential though small
quantities of materials containing gypsum or asbestos, or that have been contaminated
by previous land uses, are classified as hazardous waste.
CD&E Waste: Current Arisings, Facilities & Management
6.4.2. Kirklees at present has significant capacity for managing inert C&D and excavation
wastes. This is primarily in the form of landfill capacity, though there is some treatment
plant, recycling and transfer facilities. Around 72% of C&D and 84% of excavation waste
arising locally were also managed locally.
6.4.3. Data published by the Environment Agency suggests that around 80,000 tonnes of C&D
waste was produced in Kirklees in 2013 with 75% of this material being managed locally
and the rest exported. The corresponding quantities of Excavation waste were 200,000
tonnes of arisings of which around 15% was exported.
6.4.4. The current management mix for C&D wastes is 38% recycling, 25% treatment, 21%
inert landfill and 16% other management routes (other transfer facilities). Current
management mix for excavation wastes are 56% landfill, 27% land reclamation, 10%
recycling and 7% other management routes (transfer facilities).
6.4.5. In both cases these figures may disguise potentially higher rates of recycling or other
diversion from landfill. Current requirements mean that some wastes managed or re-
used at source go unreported however such practice makes no use of capacity at third
party-provided facilities that the Plan may need to provide for. Therefore the figures
above are a reasonable estimate of the current position recognising the limitations of
the data sources.
CD&E Waste Required Facilities: Transfer Stations
6.4.6. Waste transfer stations and bulking facilities often provide a valuable component in the
transfer and bulking of CD&E waste materials. There is a surplus of such capacity over
the whole Plan period, reflecting a situation common with other authorities.

47
Part 2: Growth Forecasts
and Assessment of Future
Capacity Requirements CD&E Waste Required Facilities: Recycling
6.4.7. There is a shortfall of capacity for recycling of CD&E materials over the whole Plan
period. The baseline situation (change in requirement driven by arisings growth only not
by increased recycling performance) suggests a gap of over 82,500 tonnes by the end
of the Plan period. This figure doubles to almost 165,000 tonnes under the higher
performance rates assumed by the Growth 4/Maximised recycling scenario combination
and reaches just over 90,000 tonnes under Growth 3/Median recycling.
6.4.8. Several local sites that may be capable of handling CD&E wastes are classified as
transfer stations as this was their original function. Recycling provides operators with an
additional revenue stream and is therefore a logical diversification of use at these
locations. Experience from other needs assessment studies suggests they can
contribute a potentially significant amount of additional recycling capacity that is hidden
from the current analysis.
6.4.9. The Council may wish to undertake further research to identify whether any local sites
are contributing extra recycling capacity which may reduce or possibly eliminate the
gaps identified above. Note that this issue also applies to the C&I stream as many of
these facilities manage both C&I and CD&E wastes though it may be difficult to
establish the respective quantities and the implications for the individual capacity gaps.
6.4.10. The only means of recycling Excavation waste is through re-use of the material in
landscaping development sites, engineering and restoration of landfill sites or minerals
workings. Provision of future capacity lies outside the scope of the Plan because it will
be dictated to a large extent by the scale and timing of development and regeneration
activities that may require this material, both of which are unpredictable. It should also
be noted that Excavation wastes extracted and re-used at source are not reported and
therefore the ‘capacity’ (actually the demand for this material) will arise elsewhere in
Kirklees or in other authorities.
CD&E Waste Required Facilities: Landfill
6.4.11. Kirklees at present has significant capacity for managing inert C&D and excavation
wastes through existing landfill capacity throughout the plan period for all scenarios.

48
6.5. Hazardous Waste
6.5.1. Materials are classified as hazardous if they have characteristics that make them
harmful to human health, or to the environment, either immediately or over an extended
period of time. Such wastes require specialised handling during movement and
management and usually arise in small quantities at sites spread over a wide area. As a
result a network of specialised facilities has evolved to process the UK’s hazardous
wastes, with sites typically serving regional or national catchments.
Hazardous Waste: Current Arisings, Facilities & Management
6.5.2. A total of 35,390 tonnes of hazardous waste was recorded as arising in Kirklees in 2013
of which 26,388 tonnes (75%) were exported for management elsewhere. However,
Kirklees is a net importer of hazardous waste with 109,407 tonnes recorded as imported
in 2013.
6.5.3. The principal local management capacity is in the form of two landfill sites which
accepted almost 100,000 tonnes of material in 2013. Only 7% of this material originated
locally, illustrating that they serve a much wider catchment as referred to above.
6.5.4. There is also a small amount of transfer station capacity and a modest amount of
treatment capacity (around 22,500 tonnes). The latter is specialised and is discussed
below in the section on agricultural wastes.
6.5.5. Landfill disposal accounted for 75% of wastes that arose and were managed locally,
which is unsurprising given the availability of this capacity and limited facilities for other
management methods. Over 80% of local wastes that were exported were treated or
recovered with the quantity being almost four times that landfilled locally. These figures
suggest local management of hazardous wastes conforms well to the Waste Hierarchy
even if there is a dependence on external capacity.
Hazardous Waste Required Facilities: Landfill
6.5.6. The existing landfills mean that Kirklees is a net importer of hazardous wastes and the
limited demand for capacity means there is no requirement during most of the Plan
period.
6.5.7. However both facilities have time-limited permissions and it is not known whether
applications to extend operations will be sought or granted. The projected capacity
49
Part 2: Growth Forecasts
and Assessment of Future
Capacity Requirements shortage following closure of both facilities is limited, ranging from just over 7,000
tonnes to almost 8,500 tonnes.
6.5.8. If no further time extension is possible it will be necessary to use facilities in other
authorities unless additional local sites can be identified. However the implications of
closure will probably be greater for other authorities that make use of these sites.
Hazardous Waste Required Facilities: Treatment & Recovery
6.5.9. The details above indicate the level of reliance on external capacity to treat and/or
recover local hazardous wastes and this situation is unlikely to change significantly over
the Plan period. As explained previously, the small quantities and diverse management
requirements for handling these wastes mean that local facilities handling only small
quantities of waste are unlikely to be economically viable. Consequently the KLP cannot
make specific provision for such facilities though it might identify any allocated sites that
might be suitable for this use in the event that a future planning application is submitted.
6.5.10. Instead the priority is to contact those Waste Planning Authorities receiving hazardous
waste from Kirklees in order to establish whether they are aware of any foreseeable
changes which may affect the availability of capacity over the Plan period, and in order
that the Council complies with its obligations under the Duty to Cooperate. The
accompanying Part 1 report on this study identifies the authorities that received local
wastes in 2013 and the quantities involved.
6.6. Agricultural Waste
6.6.1. Agricultural premises are defined in the Agriculture Act 1947 as land used for:
horticulture, fruit growing, seed growing, dairy farming, livestock breeding and keeping,
grazing land, meadow land, osier land (growing willow), market gardens and nursery
grounds. It should be noted that accurate assessment of arisings and management
methods is hampered by the lack of current data, with the principal sources used to
calibrate these estimate being from 2001 and 2003.
Agricultural Waste: Current Arisings, Facilities & Management
6.6.2. There are 841 farm holdings in Kirklees which are estimated to generate almost
576,000 tonnes of waste. However over 99% of this material comprises organic by-

50
products (eg. waste milk, slurry) that is spread or buried on the farm where arises, while
other material such as waste straw, wood, etc. is either re-used, buried or burned at
source. As a result only 3,835 tonnes of these wastes are estimated to require external,
off-farm capacity and to fall within the scope of capacity planning that the Plan needs to
address.
6.6.3. Most of the material leaving the holdings is either incinerated or recycled. Themajority of
the former occurs at specialised facilities in order to comply with Animal By-Products
legislation. The waste involved falls within the category of hazardous waste and again
this means treatment capacity is specialised, centralised, and typically serves a national
catchment. Residual waste suitable for recycling typically comprises wood, glass, paper,
etc. It is therefore indistinguishable from parts of the C&I stream and managed at the
same facilities, albeit in much smaller quantities.
Agricultural Waste: Required Facilities
6.6.4. The future projections assume no growth in arisings or significant change in agricultural
practices have occurred since the original surveys were undertaken or that such
changes will not occur over the Plan period. Such changes are considered to be
unlikely. Any facilities to manage off site recycling and hazardous landfill would only be
economically viable if larger quantities of these wastes arose locally and, as stated
above, recyclable wastes can be managed at the same sites as C&I waste.
6.6.5. Capacity for specialised treatment is already available locally at facilities in Dewsbury
(storage and rendering) and Huddersfield (high temperature incineration) and it is not
anticipated that additional capacity will be needed.
6.7. Low Level Radioactive Waste
Arisings and Required Facilities
6.7.1. Information provided by the EA shows that a single site within the Plan area generates
these wastes in very small quantities. The emissions are sufficiently harmless and in
liquid form which enables their safe disposal to foul sewer along with other non-
hazardous wastes.

51
Part 2: Growth Forecasts
and Assessment of Future
Capacity Requirements 6.7.2. Given the limited number of sources and quantity and nature of material involved there
does not appear to be a requirement to provide any specialised facilities for managing
low-level wastes within the Plan area.
6.7.3. Local disposal also implies the Council does not need to check on the availability of
capacity in other authorities. However it should be noted that the EA no longer reports
the quantities and sources of these arisings and it may be prudent for the Council to
consider a future, small-scale survey of potential local sources of these materials to
check that the current situation has not changed, and to take appropriate action if it has.
6.8. Waste Water / Sewage Sludge
Arisings and Required Facilities
6.8.1. Relevant waste water infrastructure falls into two categories: waste water treatment
works (WWTWs) which process materials delivered by foul sewer, and sewage sludge
treatment works (SSTWs) that treat semi-liquid treatment residues. In addition to a
network of the former, a single SSTW operates within the Plan area.
6.8.2. The quantity of arisings is largely immaterial for the Plan insofar as treatment separates
purified liquids (discharged to controlled waters) from residual sludge for which there
are a number of disposal options (landfill, land spreading following decontamination in a
sludge treatment works, or incineration). The choice of management methods lies with
the statutory local undertaker: Yorkshire Water. Of these methods only landfill disposal
has implications for the waste management capacity needs addressed by this study, but
this material is already included as part of the C&I waste stream.
6.8.3. The key issue for the Plan is whether land will be needed outside the curtillage of
existing WWTWs and SSWs to provide the additional capacity to meet future demand
as a result of housing growth and industrial activity in the Plan area.
6.8.4. Recent discussions between Kirklees Council and Yorkshire Water have identified a
need for infrastructure improvements at treatment facilities serving the Meltham and
Clayton West areas. No date for the implementation of increased capacity has been
identified as yet and both parties remain in discussion to determine the timing and
whether any additional land take will be needed.
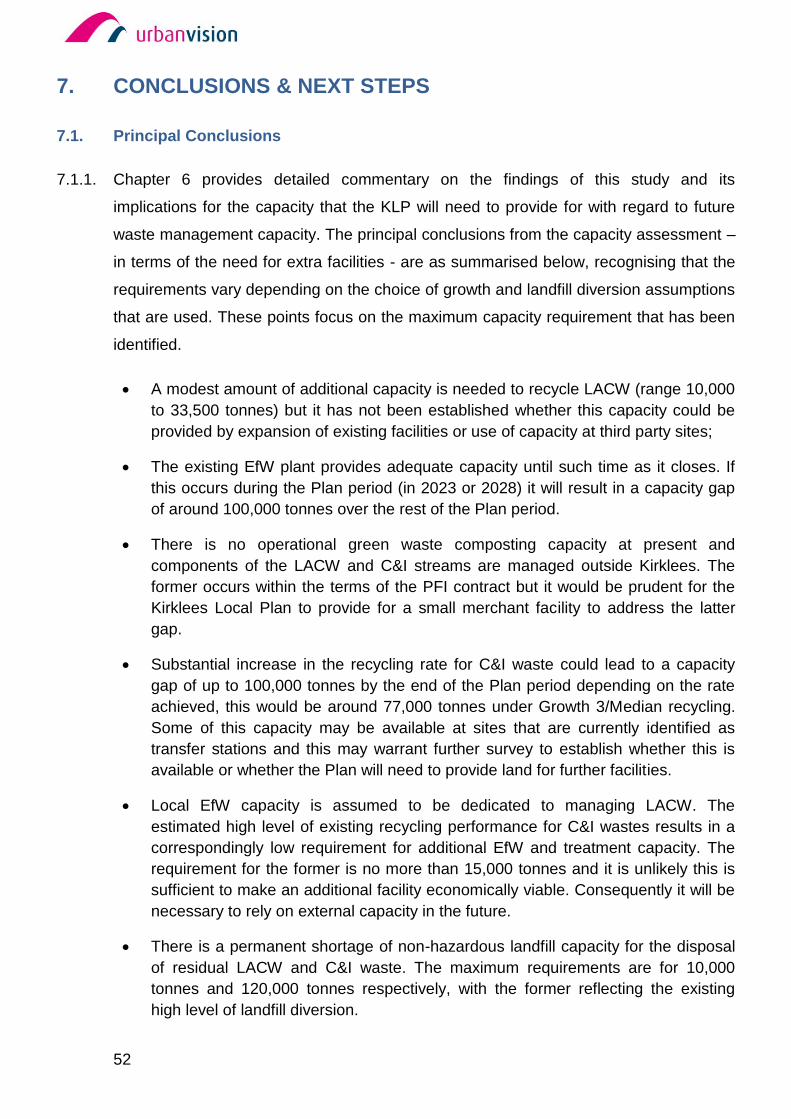
52
7. CONCLUSIONS & NEXT STEPS
7.1. Principal Conclusions
7.1.1. Chapter 6 provides detailed commentary on the findings of this study and its
implications for the capacity that the KLP will need to provide for with regard to future
waste management capacity. The principal conclusions from the capacity assessment –
in terms of the need for extra facilities - are as summarised below, recognising that the
requirements vary depending on the choice of growth and landfill diversion assumptions
that are used. These points focus on the maximum capacity requirement that has been
identified.
A modest amount of additional capacity is needed to recycle LACW (range 10,000
to 33,500 tonnes) but it has not been established whether this capacity could be
provided by expansion of existing facilities or use of capacity at third party sites;
The existing EfW plant provides adequate capacity until such time as it closes. If
this occurs during the Plan period (in 2023 or 2028) it will result in a capacity gap
of around 100,000 tonnes over the rest of the Plan period.
There is no operational green waste composting capacity at present and
components of the LACW and C&I streams are managed outside Kirklees. The
former occurs within the terms of the PFI contract but it would be prudent for the
Kirklees Local Plan to provide for a small merchant facility to address the latter
gap.
Substantial increase in the recycling rate for C&I waste could lead to a capacity
gap of up to 100,000 tonnes by the end of the Plan period depending on the rate
achieved, this would be around 77,000 tonnes under Growth 3/Median recycling.
Some of this capacity may be available at sites that are currently identified as
transfer stations and this may warrant further survey to establish whether this is
available or whether the Plan will need to provide land for further facilities.
Local EfW capacity is assumed to be dedicated to managing LACW. The
estimated high level of existing recycling performance for C&I wastes results in a
correspondingly low requirement for additional EfW and treatment capacity. The
requirement for the former is no more than 15,000 tonnes and it is unlikely this is
sufficient to make an additional facility economically viable. Consequently it will be
necessary to rely on external capacity in the future.
There is a permanent shortage of non-hazardous landfill capacity for the disposal
of residual LACW and C&I waste. The maximum requirements are for 10,000
tonnes and 120,000 tonnes respectively, with the former reflecting the existing
high level of landfill diversion.

53
Part 2: Growth Forecasts
and Assessment of Future
Capacity Requirements The capacity shortfall for recycling CD&E wastes is substantial, rising from 82,500
tonnes to 165,000 under the highest performance assumptions and just under
91,000 tonnes under Growth 3/Median recycling. However, as with C&I wastes,
some of this shortfall may be available already at sites currently categorised as
transfer stations. It may be prudent to undertake further review of their waste
management functions in order that the Plan does not over-provide this capacity if
it is greater than currently estimated.
Three quarters of locally-produced hazardous wastes are exported to
management facilities in other authorities due to a lack of local capacity. This
situation is commonplace due to the specialised nature of the materials and how
they must be managed and consequently most authorities rely on capacity at
external facilities that are part of a network of sites with regional or national
catchments. The Plan can continue to rely on this approach provided the Council
continues to check the availability of this external capacity with the authorities
where the facilities are located.
A small shortfall in hazardous landfill capacity will occur towards the end of the
Plan period once both of the sites currently operating have closed. This situation
may require reliance on external capacity unless operations can be extended at
one or both of these sites.
7.1.2. Otherwise the Plan area is well-served by transfer station capacity, specialised recycling
facilities (eg. those handling metal wastes), and voidspace at inert and hazardous
landfills. Existing disposal and recycling arrangements for agricultural and low-level
radioactive wastes are not expected to require additional capacity during the Plan
period.
Next Steps
7.1.3. The information presented in this report is based on the best available data as at
January 2015 when the principal analysis was undertaken. Some additional information
has come to light subsequently and the capacity assessment was revised in May 2015,
although the overall findings remain the same.
7.1.4. If Kirklees is to become net self-sufficient in managing its waste then it will need to
consider the implications and requirements of the modelling scenarios and select an
appropriate scenario to identify the capacity gap and plan for future waste facilities in
Kirklees.

54
7.1.5. Based on the findings of this study, the Council will need to identify sites/areas suitable
to accommodate new waste management facilities to address the identified gaps. The
number of sites and land area required cannot be established at this time and the next
step will be to review the implications of the different analyses and to select the
combination of Growth and Behaviour scenarios that defines the level of waste
management performance the Council will aim to deliver through the KLP within the
context of also meeting its statutory and non-statutory targets.
7.1.6. Assessment is not a one-off exercise and it will be prudent to re-assess capacity of
existing sites periodically – as well as checking whether any new facilities have come
forward in the interim – in order to assess the implications of both for the meeting the
needs identified by this study.
7.1.7. Some capacity gaps result from a lack of local facilities and may persist because waste
contractors will continue to take wastes to sites outside Kirklees rather than bringing
forward new local capacity. This situation currently applies to green waste composting,
reprocessing of separated recyclables into secondary products, and landfill disposal of
non-hazardous waste. Detail on the destination and quantity of wastes involved has
been provided in the Part 1 report.
7.1.8. In such circumstances, the Council should make contact with those Waste Planning
Authorities receiving waste from Kirklees in order to establish whether they are aware of
any changes which may affect the availability of external capacity over the life of the
Plan. Again, this is not a one-off process and will need to be reviewed periodically.
7.1.9. Any loss of access to external capacity will increase certain existing capacity gaps, or
create new ones where the current assessment assumes reliance on external facilities
will persist and this will need to be reflected in site allocations for future waste capacity
included in the KLP.

55
Part 2: Growth Forecasts
and Assessment of Future
Capacity Requirements Glossary of Terms
Acronym Term Definition
AD Anaerobic Digestion
A process where biodegradable material is encouraged to break down in the absence of oxygen. Material is placed into a closed vessel and in controlled conditions the waste breaks down to produce a mixture of carbon dioxide, methane and solids/liquids known as digestate which can be used for fertiliser, compost or Solid Recovered Fuel (SRF)
APCRs Air Pollution Control Residues
Bi-product produced from treatment of wastes through an energy from waste plant
C&I Commercial and Industrial Waste
Waste generated by shops, offices, factories and other businesses and industry
- Composting
A biological process which takes place in the presence of oxygen in which organic wastes, such as garden and kitchen waste, are converted into a stable, granular material. This can be applied to land to improve soil structure and enrich nutrient content.
CD&E Construction Demolition and Excavation Waste
Controlled waste arising from the construction, repair, maintenance and demolition of buildings and structures.
EfW
Energy from Waste
The controlled high temperature burning of waste. Energy recovery is achieved by utilising the calorific value of the materials burnt. The most efficient facilities combine the production of heat (usually in the form of steam) with power (electricity) which is usually referred to as combined heat and power (CHP).
ELV
End of Life Vehicle
Motor vehicles that fall into the category of 'waste' as defined by the EU Waste Directive.
EA
Environment Agency
Agency which regulates waste management activities by issuing waste management licenses and other permits and exemptions. The EA also conducts national surveys of waste arising and waste facilities.
GVA Gross Value Added
A measure of the value of the goods and services produced in the economy.
- Hazardous waste A sub category of all waste streams, where the material produced is hazardous and requires specialist treatment

56
Acronym Term Definition
- Inert waste
Inert waste is waste that does not undergo significant physical, chemical or biological changes following disposal and does not adversely affect other matters that it may come into contact with, and does not endanger surface or groundwater.
- Landfill Restoration of land (for example, a former quarry) using waste.
- Land recovery The restoration of land using inert waste to enable the land to be used for a new purpose.
LACW Local Authority Collected Waste
Previously known as municipal waste, LACW refers to all waste collected by a Local Authority.
LACW(H) Local Authority Collected Waste Household
Household waste collected by a Local Authority
LACW (Other)
Local Authority Collected Waste other
Non-household waste collected by a Local Authority (such as street cleaning collection, rubble from household waste recycling sites).
LACW
(Secondary)
Local Authority Collected Waste secondary
Secondary bi-products from initial treatment of LACW household waste through EfW producing metals, APCRs and bottom ash
LLW Low level Radioactive Waste
Radioactive waste having a radioactive content not exceeding four GBq/te of alpha or 12 GBq/te of beta/gamma activity.
Recycling Turning waste into a new substance or product, includes composting if it meets quality protocols.
ROCs
Renewable Obligations Certificates
Green certificates issued to operators of accredited renewable generating stations for the eligible renewable electricity they generate.
SSTW Sewage Sludge Treatment Works
Infrastructure providing initial treatment of material delivered by foul sewer from homes, businesses and the network draining the wider public realm.
Thermal Treatment without energy recovery
Management of waste by incineration without use of facilities to capture heat given off for the purposes of energy recovery. Some facilities using this technology to manage LACW still exist while others involve very high temperature incineration due to the properties of specific wastes (ie.clinical, animal by-products and other hazardous wastes)

57
Part 2: Growth Forecasts
and Assessment of Future
Capacity Requirements
Acronym Term Definition
Transfer/Transfer Station
Facility for receiving and ‘bulking up’ waste before its onward journey for treatment, recycling or disposal elsewhere.
Treatment Physical, chemical, biological or thermal waste management processes which change the characteristics of waste.
- Waste facilities
Waste facilities include:
Transfer stations
Energy from Waste (Incineration with energy recovery)
Recycling facility
Treatment facility (e.g. mechanical biological or mechanical heat treatment)
Household waste recycling centre
Landfill/landraise
Materials recovery facility
- Waste streams
Waste streams include:
LACW
C&I
CD&E
Hazardous
Agricultural
LLW
Waste Water/Sewage Sludge
- Waste management routes
Waste management routes include:
Recycling
Composting (in vessel or open windrow)
Treatment (recovery via thermal, physical, chemical or biological treatment)
Landfill/landraise
Transfer onwards to other waste management facility
WDI/HWDI
Waste Data Interrogator / Hazardous Waste Data Interrogator
Data tool prepared by the EA based on information provided by waste operators. It allows for assessments of strategic waste and general waste flow.
WEEE Waste Electrical and Electronic Equipment
Term used to describe old, end-of-life or discarded appliances using electricity.

58
Acronym Term Definition
WWTW Waste Water Treatment Works
Infrastructure providing initial treatment of material delivered by foul sewer from homes, businesses and the network draining the wider public realm.