kiribati - fao.org · • kiribati to await the consideration fao sapa to fund the coconut...
TRANSCRIPT
Global Forest Resources Assessment 2015Country Report Kiribati
Rome, 2014
Kiribati

FAO, at the request of its member countries, regularly monitors the world´s forests and theirmanagement and uses through the Global Forest Resources Assessment (FRA). This country reportis prepared as a contribution to the FAO publication, the Global Forest Resources Assessment 2015(FRA 2015).The content and the structure are in accordance with the recommendations and guidelines given byFAO in the document Guide for country reporting for FRA 2015 (http://www.fao.org/3/a-au190e.pdf).These reports were submitted to FAO as official government documents.
The content and the views expressed in this report are the responsibility of the entity submitting thereport to FAO. FAO may not be held responsible for the use which may be made of the informationcontained in this report.
FRA 2015 – Country Report, Kiribati
3
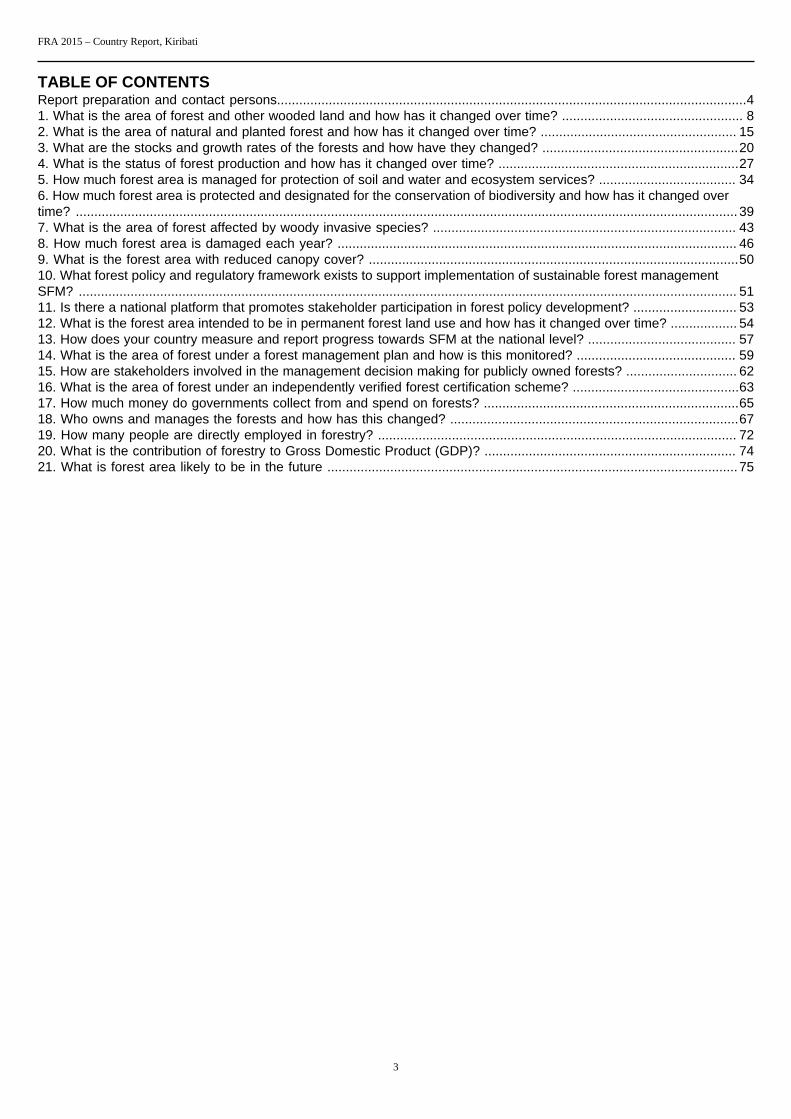
TABLE OF CONTENTSReport preparation and contact persons...............................................................................................................................41. What is the area of forest and other wooded land and how has it changed over time? ................................................. 82. What is the area of natural and planted forest and how has it changed over time? ..................................................... 153. What are the stocks and growth rates of the forests and how have they changed? .....................................................204. What is the status of forest production and how has it changed over time? .................................................................275. How much forest area is managed for protection of soil and water and ecosystem services? ..................................... 346. How much forest area is protected and designated for the conservation of biodiversity and how has it changed overtime? ................................................................................................................................................................................... 397. What is the area of forest affected by woody invasive species? .................................................................................. 438. How much forest area is damaged each year? ............................................................................................................ 469. What is the forest area with reduced canopy cover? ....................................................................................................5010. What forest policy and regulatory framework exists to support implementation of sustainable forest managementSFM? .................................................................................................................................................................................. 5111. Is there a national platform that promotes stakeholder participation in forest policy development? ............................ 5312. What is the forest area intended to be in permanent forest land use and how has it changed over time? .................. 5413. How does your country measure and report progress towards SFM at the national level? ........................................ 5714. What is the area of forest under a forest management plan and how is this monitored? ........................................... 5915. How are stakeholders involved in the management decision making for publicly owned forests? .............................. 6216. What is the area of forest under an independently verified forest certification scheme? .............................................6317. How much money do governments collect from and spend on forests? .....................................................................6518. Who owns and manages the forests and how has this changed? ..............................................................................6719. How many people are directly employed in forestry? ................................................................................................. 7220. What is the contribution of forestry to Gross Domestic Product (GDP)? .................................................................... 7421. What is forest area likely to be in the future ...............................................................................................................75

FRA 2015 – Country Report, Kiribati
4
Report preparation and contact personsContact personsThe present report was prepared by the following person(s)
Name (FAMILYNAME, first name)
Institution/address Email Tables
N/A N/A N/A N/A
N/A N/A N/A N/A
N/A N/A N/A N/A
N/A N/A N/A N/A
Introductory TextPlace an introductory text on the content of this report
Kiribati is comprised of 33 coral atolls in 3 main groups of islands; the Gilbert, Phoenix and Line Islands. Only
21 islands are inhabited. The total Land Area is only 811 km 2 (around 313 sq mi) but each of the islands is
widely dispersed across a 3.5 million km 2 EEZ in the middle of Pacific Ocean.
Map 1. Republic of Kiribati Tarawa Atoll, Capital
Detailed Map of Kiribati © Microsoft Corporation. All Rights Reserved. Microsoft ® Encarta ® 2008.© 1993-2007 Microsoft Corporation.
All rights reserved.
Population as of 2005 census is 92,533 with 44% residing on Tarawa Atoll, the capital. The population in 2000was 84,494 and when compared with the figure in 2005 it represents an increase of 9.5% or 8,093 people with anaverage annual rate of growth of 1.8%. And there with this annual growth, the population has reached 103,000.
The main diet for I-Kiribati people include: fish, coconut, breadfruit, local root crops, imported rice, chickenand tin meat (in the form of processed fish, beef e.g. ox and palm, etc). Fish consumption per capita is oneof the highest in the world-almost .5kg/day/capita. Most I-Kiribati prefer to consume more of those importedfrom overseas. With this change of behavior, there is high prevalence of diabetic and hypertension starting fromthe early age.
Kiribati which is comprised of tiny atolls still claims to have its forest in its own right and should be respectedby countries that have more thick vegetation. Although our forest may not comply with international notions,they are truly forests to us and we want the world to understand it. At the regional level forest is defined as;‘trees that have a certain size of canopy, they are not agricultural and are not located in urban areas’. Thoughour trees are not in this category, they provide ecological services to sustain the lives of creatures in particular

FRA 2015 – Country Report, Kiribati
5
people in terms of food, shelter, medicinal purposes, etc. Kiribati is appreciating the recognition of atolls’ forestby Food and Agriculture Organisation (FAO) and other United Nation conventions.
An area that is covered by coconut trees in Kiribati is classified as the first category in defining the forest andthe tree is called the King Tree . Pandanus trees (the Queen Tree) falls under the second category and mangroveswamp being the third. These trees play important roles in providing: housing materials for construction, shelterfor both human and species, food, protection of water reserves and coastal areas that are most affected by theclimate change and sea level rise.
With the effect of climate change and sea level rise as well as the increase in population, a number of treeshave eaten away due to erosion, many die and fallen off the ground due to prolong droughts, and some werechopped down for handicraft and building purposes. The rest have reached their maturity age and are startingto produce less for consumption.
While Kiribati is engaging on the FRA assignment, there are problems encountered especially in the collectionof data, thus affect the quality of information on our forest. For such reasons Kiribati needs to ask for overseasassistance in the area of getting the digitized data and record on all known forest trees in Kiribati and to havethem stored safely in MapInfo Computer implemented under the Remote Sensing Programme. Things like forestdegradations, coastal erosions, and other important variables covered under the FRA be incorporated in theprogramme mentioned for use by planners in Lands Planning Section, Agriculture Research and Environmentand Conservation.
Mangroves replanting scheme has already begun on affected areas of Tarawa. This is a voluntary scheme ofEnvironment Youths Club (EYC) instigated by the MELAD and Cosmo Oil Co from Japan and further inspiredby this FAO Forestry Outlook 2020 exercise. Coconut Replanting has begun in terms of providing the seedlingsto outer islands. This was carried out during the campaign against food crisis in 2008. However there is a needto continue this project as it will merge with our coconut sawmilling project most probably mid year 2009.
Way forward
• Kiribati to await the consideration FAO SAPA to fund the Coconut Sawmilling Project as expected to start early this year 2009.• Kiribati to await as well the consideration of FAO Samoa to assist in procuring the MapInfo programme that covers the
requirements needed for the management of forestry in Kiribati.• Increasing community participation by public awareness to get the message through the mindset of people that planting trees is
their supreme responsibility and life obligation;

FRA 2015 – Country Report, Kiribati
6
Acronyms and Abbreviations
MELAD Ministry of Environment, Lands and AgriculturalDevelopment
ALD Agriculture and Livestock Development
ECD Environment and Conservation Division
LMD Lands Management Department
SOE State Of Environment
NA Not Available
N/A Not Applicable
PIPA Phoenix Island Protected Area
CBD Convention of Biodiversity
CS Copra Society
NS Not Stated
ODA Overseas Development Assistant
SPC South Pacific Community
FAO Food and Agriculture Organization
ISME through Cosmo Oil Co Japan International Society for Mangrove Ecosystem
EYC Environment Youth Club
MFMRD Ministry of Fisheries and Marine ResourceDevelopment
NGOs Non Government Organizations
Desk Study?
Check "yes" if this survey is a Desk Study, "no" otherwise

FRA 2015 – Country Report, Kiribati
7
Desk Study? yes

FRA 2015 – Country Report, Kiribati
8
1. What is the area of forest and other wooded land and how has it changed over time?Documents for this question:
• Guide for country reporting FRA 2015• FRA 2015 Terms and Definitions
1.1 Categories and definitions
Category Definition
Forest Land spanning more than 0.5 hectares with trees higher than 5 meters and a canopy cover of more than10 percent or trees able to reach these thresholds in situ. It does not include land that is predominantlyunder agricultural or urban land use.
Other wooded land Land not classified as "Forest" spanning more than 0.5 hectares with trees higher than 5 meters anda canopy cover of 5-10 percent or trees able to reach these thresholds ; or with a combined coverof shrubs bushes and trees above 10 percent. It does not include land that is predominantly underagricultural or urban land use.
Other land All land that is not classified as "Forest" or "Other wooded land".
...of which with tree cover(sub-category)
Land considered as "Other land", that is predominantly agricultural or urban lands use and has patchesof tree cover that span more than 0.5 hectares with a canopy cover of more than 10 percent of trees ableto reach a height of 5 meters at maturity. It includes bothe forest and non-forest tree species.
Inland water bodies Inland water bodies generally include major rivers, lakes and water reservoirs.
Forest expansion Expansion of forest on land that, until then, was not defined as forest.
...of which afforestation(sub-category)
Establishment of forest through planting and/or deliberate seeding on land that, until then, was notdefined as forest.
...of which naturalexpansion of forest (sub-category)
Expansion of forests through natural succession on land that, until then, was under another land use(e.g. forest succession on land previously used for agriculture).
Deforestation The conversion of forest to other land use or the longterm reduction of the tree canopy cover below theminimum 10 percent threshold.
...of which humaninduced (sub-category)
Human induced conversion of forest to other land use or the permanent reduction of the tree canopycover below the minimum 10 percent threshold.
Reforestation Natural regeneration or re-establishment of forest through planting and/or deliberate seeding on landalready in forest land use.
...of which artificialreforestation (sub-category)
Re-establishment of forest through planting and/or deliberate seeding on land already in forest land use.
1.2 National data
1.2.1 Data sources
References to sourcesof information
Variables Years Additional comments

FRA 2015 – Country Report, Kiribati
9
1 Metz, D.W. 1996. TheMangroves of Kiribati: AnInventory, Feasibility andManagement Study. Vol 1.Prepared for AgricultureDivision, MNRD, Republicof Kiribati by USDA ForestService in collaborationwith South Pacific ForestryDevelopment Programme(FAO/UNDP/RAS/92/361)Suva, Fiji. Unpublished.
Mangroves on four islands inKiribati
1995 This working paper is oneof a series of publicationsprepared during the course(1992 – 96) of the UNDP/FAO South Pacific ForestryDevelopment Programme.This is also one of the firstcomprehensive study onmangroves undertaken inKiribati. This figure may beslightly on the lower side,since the extent of mangrovesfound in many small islandsis not available.
2 Ward, J.D.1998. Mangrovesof Kiribati A pricelessresources needs protection.http://na.fs.fed.us/spfo/pubs/misc/mangroves/mangroves.htm
Mangrove in Kiribati 1995 Secondary source. Refersto 185 ha of mangroves onButaritari
3 South Pacific ForestryDevelopment Programme andUSDA Forest Service. 1995.Assessment of mangroveresources.
Mangrove area 1995 Ground survey Cited in:Ward, J.D. and Metz,W.D. Mangrove forests asmodifiers of the impactsof climate change onhigh islands and atollsin the south pacific:mobilizing people andgovernments to act (atolls).Pacific Islands RegionalForestry Programme. http://www.spcforests.org/Library/Mangroves/atolls/atolls.htmThis figure may be slightlyon the lower side, since theextent of mangroves foundin many small islands is notavailable.
4 Barr, J.J.F. 1993. TechnicalReport on Coconut Researchin Kiribati (1990-1992)Ministry of Environment& Natural ResourcesDevelopment Division ofAgriculture
Plantation and naturalcoconut area
1990 1991 1992 N/A
5 Government of Republicof Kiribati 2004. Stateof Environment Report2000-2002. http://www.sprep.org/att/IRC/eCOPIES/Countries/Kiribati/20.pdf
N/A 2002 N/A

FRA 2015 – Country Report, Kiribati
10
6 MELAD, ECD. 2006.Government of KiribatiNational BiodiversityStrategies and Actions Planto the Conference of theParties to the Conventionon Biological Diversity.http://www.sprep.org/att/IRC/eCOPIES/Countries/Kiribati/9.pdf
N/A N/A The country report (below)and the NBSAP - Kiribatihave been cabinet approved.Both the report and theNBSAP- Kiribati reflectbaseline data on the statusof protected areas and theconservation of biologicaldiversity in the context ofKiribati as an atoll nation.
7 MELAD, ECD. 2007.Kiribati Country Report tothe Conference of Parties(COP) to the Convention onBiological Diversity (CBD).http://www.sprep.org/att/IRC/eCOPIES/Countries/Kiribati/93.pdf
N/A 2005 N/A
8 GEF/UNDP/UNFCCCREPUBLIC OF KIRIBATINATIONAL ADAPTATIONPROGRAM OF ACTION(NAPA) 2007.
Planting programme N/A General information on theplantation strategy.
1.2.2 Classification and definitions
National class Definition
Coconut forestry Land occupied by coconut only
Land with tree/natural woodland Land occupied by Pandanus tectorius, Artocapus altilis, Ficuscarica (wild fig), and Calophyllum inophyllum planted byman. Also includes: Fallow littoral shrubs, bushes Morindacitrifolia a, Tormefortia argentea,. Pandanus tectorius (wild)Guerttarda speciosa, and Scavola taccada Mangrove: Bruguieragymnorrhiza; Lumnitzera littorea;Rhizophora mucronata;Sonneratia alba
Areas with absence of trees Pond and open fields
Replanting Refers to replanting and planting of trees in particular coconuttrees, mangroves and such to hold and protect the soil fromerosion and other natural disasters and mostly to adapt andminimize adverse impact of climate change.
Agro-forestry Refers to forestry combined with farming. Within theAgricultural Division this section looks after food crops,medicinal plants, fuel wood, nitrogen fixation plants and otherplants that are useful to households. This is where they establishmother plant from which they propagate them and sold them tohouseholds such as breadfruit, pandanus, etc however some arefree for the communities, i.e. women’s club, church, youths plusthe feed only for starch crops
Rehabilitation Refers to maintaining and improving the life span of coconuttrees only. This happens in 1990s,

FRA 2015 – Country Report, Kiribati
11
Natural regenerated forests Land comprises of Littoral shrubs as in Table 1 with a highindication of human disturbance in regards for high demand oftimber, fuel wood, and handicraft.
Planted forest with Introduced species Trees such as bamboo and nitrogen fixations occupying only alimited land areas
1.2.3 Original data
Forest area
Inventory on Kiribati vegetation haven’t carried out ever since therefore data provided based on estimation.
Since it is estimated that 80% of the total land areas is covered with coconut it is estimated that 15% coveredby other trees, bushes and shrubs while 5% used up by ponds, open fields, and building.
Classes Percentage 1000 of hectares FRA classes
Land occupied bycoconut only
80 64.8 Other land with treecover
Land occupied by
1. Pandanus tectorius, Artocapus altilis ,Ficus carica (wildfig), and Calophylluminophyllum planted byman.
2. Fallow littoralshrubs, bushes Morindacitrifolia a, Tormefortiaargentea , . Pandanustectorius (wild)Guerttarda speciosa ,and Scavola taccada.
3. Mangrove
Bruguiera gymnorrhiza; Lumnitzeralittorea;Rhizophoramucronata; Sonneratiaalba
15 12.15 Forests
Areas with absenceof trees: Ponds, openfields and buildings
5 4.05 Other land and inlandwater

FRA 2015 – Country Report, Kiribati
12
Total 100 81.00
Fallow littoral shrubs, bushes, planted land, and mangroves were considered forest area as there is not enoughdata to sub-divided in other categories. Note that trees are more than 5 meters high.
Most reliable, recent mangrove area estimate
ha year
Mangrove 258 1995
Source: Metz 1996.
Forest expansion, reforestation
No specific data was available. Information about the species that are to be included in the planting strategyare presented on the comment section.
1.3 Analysis and processing of national data
1.3.1 Adjustment
Forest area
Not needed.
1.3.2 Estimation and forecasting
Forest area
Forest and all other classes are considered constant since 1990.
1.3.3 Reclassification
Forest area
See 1.2.3 above.
1.4 DataTable 1a
Categories Area (000 hectares)

FRA 2015 – Country Report, Kiribati
13
1990 2000 2005 2010 2015
Forest 12.15 12.15 12.15 12.15 12.15
Other wooded land 0 0 0 0 0
Other land 68.85 68.85 68.85 68.85 68.85
... of which with tree cover 64.8 64.8 64.8 64.8 64.8
Inland water bodies 0 0 0 0 0
TOTAL 81.00 81.00 81.00 81.00 81.00
Table 1bAnnual forest establishment /loss (000 hectares per year)
...of which of introducedspecies (000 hectares per year)
Categories
1990 2000 2005 2010 1990 2000 2005 2010
Forest expansion N/A N/A N/A N/A N/A N/A N/A N/A
... of which afforestation 0 0 0 0 0 0 0 0
... of which natural
expansion of forest
0 0 0 0 0 0 0 0
Deforestation N/A N/A N/A N/A N/A N/A N/A N/A
... of which human induced N/A N/A N/A N/A N/A N/A N/A N/A
Reforestation N/A N/A N/A N/A N/A N/A N/A N/A
... of which artificial 0 0 0 0 0 0 0 0
Tiers
Category Tier for status Tier for reported trend
Forest Tier 1 Tier 1
Other wooded land Tier 1 Tier 1
Forest expansion Tier 1 Tier 1
Deforestation N/A N/A
Reforestation Tier 1 Tier 1
Tier criteria
Category Tier for status Tier for reported trend
FRA 2015 – Country Report, Kiribati
14
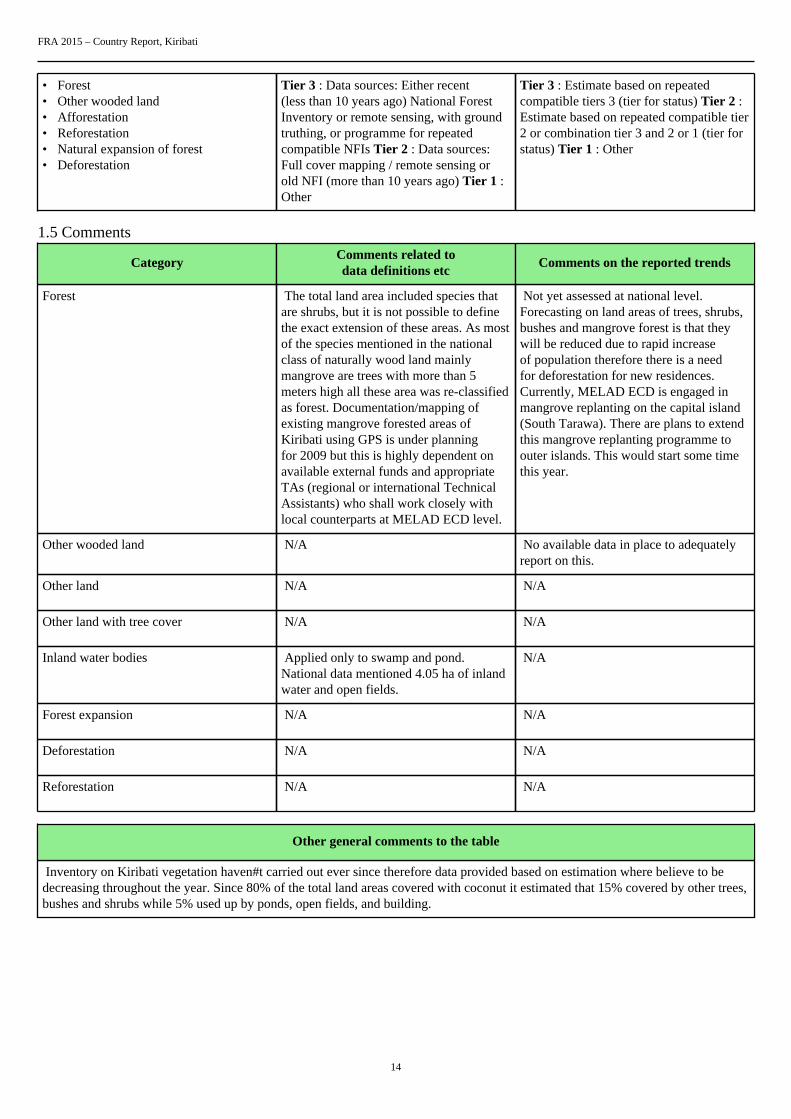
• Forest• Other wooded land• Afforestation• Reforestation• Natural expansion of forest• Deforestation
Tier 3 : Data sources: Either recent(less than 10 years ago) National ForestInventory or remote sensing, with groundtruthing, or programme for repeatedcompatible NFIs Tier 2 : Data sources:Full cover mapping / remote sensing orold NFI (more than 10 years ago) Tier 1 :Other
Tier 3 : Estimate based on repeatedcompatible tiers 3 (tier for status) Tier 2 :Estimate based on repeated compatible tier2 or combination tier 3 and 2 or 1 (tier forstatus) Tier 1 : Other
1.5 Comments
CategoryComments related todata definitions etc
Comments on the reported trends
Forest The total land area included species thatare shrubs, but it is not possible to definethe exact extension of these areas. As mostof the species mentioned in the nationalclass of naturally wood land mainlymangrove are trees with more than 5meters high all these area was re-classifiedas forest. Documentation/mapping ofexisting mangrove forested areas ofKiribati using GPS is under planningfor 2009 but this is highly dependent onavailable external funds and appropriateTAs (regional or international TechnicalAssistants) who shall work closely withlocal counterparts at MELAD ECD level.
Not yet assessed at national level.Forecasting on land areas of trees, shrubs,bushes and mangrove forest is that theywill be reduced due to rapid increaseof population therefore there is a needfor deforestation for new residences.Currently, MELAD ECD is engaged inmangrove replanting on the capital island(South Tarawa). There are plans to extendthis mangrove replanting programme toouter islands. This would start some timethis year.
Other wooded land N/A No available data in place to adequatelyreport on this.
Other land N/A N/A
Other land with tree cover N/A N/A
Inland water bodies Applied only to swamp and pond.National data mentioned 4.05 ha of inlandwater and open fields.
N/A
Forest expansion N/A N/A
Deforestation N/A N/A
Reforestation N/A N/A
Other general comments to the table
Inventory on Kiribati vegetation haven#t carried out ever since therefore data provided based on estimation where believe to bedecreasing throughout the year. Since 80% of the total land areas covered with coconut it estimated that 15% covered by other trees,bushes and shrubs while 5% used up by ponds, open fields, and building.

FRA 2015 – Country Report, Kiribati
15
2. What is the area of natural and planted forest and how has it changed over time?Documents for this question:
• Guide for country reporting FRA 2015• FRA 2015 Terms and Definitions
2.1 Categories and definitions
Term Definition
Naturally regeneratedforest
Forest predominantly composed of trees established through natural regeneration.
Naturalized introducedspecies
Other naturally regenerated forest where the tree species are predominantly non-native and do not needhuman help to reproduce/maintain populations over time.
Introduced species A species, subspecies or lower taxon occurring outside its natural range (past or present) and dispersalpotential (i.e. outside the range it occupies naturally or could occupy without direct or indirectintroduction or care by humans).
Category Definition
Primary forest Naturally regenerated forest of native species where there are no clearly visible indications of humanactivities and the ecological processes are not significantly disturbed.
Other naturallyregenerated forest
Naturally regenerated forest where there are clearly visible indications of human activities.
...of which of introducedspecies (sub-category)
Other naturally regenerated forest where the trees are predominantly of introduced species.
...of which naturalized(sub-sub category)
Other naturally regenerated forest where the trees are predominantly of naturalized introduced species.
Planted forest Forest predominantly composed of trees established through planting and/or deliberate seeding.
...of which of introducedspecies (sub-category)
Planted forest where the planted/seeded trees are predominantly of introduced species.
Mangroves Area of forest and other wooded land with mangrove vegetation.
...of which planted (sub-category)
Mangroves predominantly composed of trees established through planting.
2.2 National data
2.2.1 Data sources
References to sourcesof information
Variables Years Additional comments

FRA 2015 – Country Report, Kiribati
16
1 Metz, D.W. 1996. TheMangroves of Kiribati: AnInventory, Feasibility andManagement Study. Vol 1.Prepared for AgricultureDivision, MNRD, Republicof Kiribati by USDA ForestService in collaborationwith South Pacific ForestryDevelopment Programme(FAO/UNDP/RAS/92/361)Suva, Fiji. Unpublished.
Mangroves on four islands inKiribati
1995 This working paper is oneof a series of publicationsprepared during the course(1992 – 96) of the UNDP/FAO South Pacific ForestryDevelopment Programme.This is also one of the firstcomprehensive study onmangroves undertaken inKiribati. This figure may beslightly on the lower side,since the extent of mangrovesfound in many small islandsis not available.
2 South Pacific ForestryDevelopment Programme andUSDA Forest Service. 1995.Assessment of mangroveresources.
Mangrove area 1995 Ground survey Cited in:Ward, J.D. and Metz,W.D. Mangrove forests asmodifiers of the impactsof climate change onhigh islands and atollsin the south pacific:mobilizing people andgovernments to act (atolls).Pacific Islands RegionalForestry Programme. http://www.spcforests.org/Library/Mangroves/atolls/atolls.htmThis figure may be slightlyon the lower side, since theextent of mangroves foundin many small islands is notavailable.
3 MELAD, ECD. 2005.Government of Kiribati1st Country Report to theConference of the Parties tothe Convention on BiologicalDiversity. MELAD, ECD.2005. Government of KiribatiNational BiodiversityStrategies and Actions Planto the Conference of theParties to the Convention onBiological Diversity.
N/A 2005 The country report and theNBSAP - Kiribati have beencabinet approved and are nowready for submission to theSecretariat of the Conventionon Biological Diversity. Boththe report and the NBSAP-Kiribati reflect baseline dataon the status of protectedareas and the conservationof biological diversity in thecontext of Kiribati as an atollnation.
4 N/A N/A N/A N/A
2.2.2 Classification and definitions
National class Definition
Natural regenerated forests Land comprises of Littoral shrubs as in Table 1 with a highindication of human disturbance in regards for high demand oftimber, fuel wood, and handicraft.

FRA 2015 – Country Report, Kiribati
17
Planted forest with Introduced species Trees such as bamboo and nitrogen fixations occupying only alimited land areas
N/A N/A
N/A N/A
2.2.3 Original data
Classes FRA classes
Land occupied by Pandanus tectorius , Artocapusaltilis , Ficus carica (wild fig), and Calophylluminophyllum planted by man.
Planted forest
Fallow littoral shrubs, bushes Morinda citrifoliaa, Tormefortia argentea , . Pandanus tectorius(wild) Guerttarda speciosa , and Scavola taccada.
Naturally regenerated
Mangroves
Bruguiera gymnorrhiza ; Lumnitzeralittorea;Rhizophora mucronata; Sonneratia alba
Naturally regenerated
Most reliable, recent mangrove area estimate
1995
ha FRA class
Mangrove 258 natural regenerated
Bamboo introduced from Australia found in agriculture research in the main land and Butaritari in the northernisland both are not common, just occupying a small land area.
Rubber is not available in the country
2.3 Analysis and processing of national data
2.3.1 Adjustment

FRA 2015 – Country Report, Kiribati
18
2.3.2 Estimation and forecasting
2.3.3 Reclassification
2.4 DataTable 2a
Forest area (000 hectares)Categories
1990 2000 2005 2010 2015
Primary forest 0 0 0 0 0
Other naturally regeneratedforest
12.15 12.15 12.15 12.15 12.15
... of which of introducedspecies
0 0 0 0 0
... of which naturalized N/A N/A N/A N/A N/A
Planted forest 0 0 0 0 0
... of which of introducedspecies
0 0 0 0 0
TOTAL 12.15 12.15 12.15 12.15 12.15
Table 2b
Primary forest converted to (000 ha)
1990-2000 2000-2010 2010-2015
Othernatural
regenerationPlanted Other land
Othernatural
regenerationPlanted Other land
Othernatural
regenerationPlanted Other land
N/A N/A N/A N/A N/A N/A N/A N/A N/A
Table 2c
Area (000 hectares)Categories
1990 2000 2005 2010 2015
Mangroves (forest and OWL) 0.258 0.258 0.258 0.258 0.258
... of which planted N/A N/A N/A N/A N/A
Tiers

FRA 2015 – Country Report, Kiribati
19
Category Tier for status Tier for reported trend
Primary forest Tier 1 Tier 1
Other naturally regenerated forest Tier 1 Tier 1
Planted forest Tier 1 Tier 1
Mangroves Tier 1 Tier 1
Tier Criteria
Category Tier for status Tier for reported trend
Primary forest/Other naturally regeneratedforest/Planted forest
Tier 3 : Data sources: Recent (less than10 years) National Forest Inventory orremote sensing with ground truthing ordata provided by official agencies orprogramme for repeated compatible NFIsTier 2 : Data sources: Full cover mapping/remote sensing or old NFI (more than 10years) Tier 1 : Other
Tier 3 : Estimate based on repeatedcompatible tiers 3 (tier for status) Tier 2 :Estimate based on repeated compatible tier2 or combination tier 3 and 2 or 1 (tier forstatus) Tier 1 : Other
2.5 Comments
CategoryComments related todata definitions etc
Comments on reported trend
Primary forest N/A N/A
Other naturally regenerating forest Not yet assessed Comprises of shrubsnormally assist in providing timber to thecommunity therefore actually disturbed byhuman.
N/A
Planted forest Introduced forest including bambooand other nitrogen fixing trees which arenot common in the country found on asmall scale of land. Actual planting ondesignated planting sites on importantatoll forestry have been carried out mainlyon South Tarawa, as the capital island.From MELAD ECD, actual planting ondesignated planting sites on important atollforestry resources have been carried outmainly on South Tarawa, as the capitalisland.
The National Adaptation Programmefor Action has a component of mangroveplantation in the coastal zone managementresilience, enhancement and adaptation.http://unfccc.int/resource/docs/napa/kir01.pdf
Mangroves N/A N/A
Other general comments to the table
Natural forest in Kiribati involved abandoned areas where wild pandanus, bushes, and shrubs grow naturally. Unfortunately dataare not available as plant/tree inventory haven#t carried out ever since therefore inventory is one of the country needs which requiretechnical and financial support.

FRA 2015 – Country Report, Kiribati
20
3. What are the stocks and growth rates of the forests and how have they changed?Documents for this question:
• Guide for country reporting FRA 2015• FRA 2015 Terms and Definitions
3.1 Categories and definitions
Category Definition
Growing stock Volume over bark of all living trees with a minimum diameter of 10 cm at breast height (or abovebuttress if these are higher). Includes the stem from ground level up to a top diameter of 0 cm,excluding branches.
Net Annual Increment(NAI)
Average annual volume of gross increment over the given reference period less that of natural losses onall trees, measured to minimum diameters as defined for "Growing stock".
Above-ground biomass All living biomass above the soil including stem stump branches bark seeds and foliage.
Below-ground biomass All biomass of live roots. Fine roots of less than 2 mm diameter are excluded because these often cannotbe distinguished empirically from soil organic matter or litter.
Dead wood All non-living woody biomass not contained in the litter either standing lying on the ground or in thesoil. Dead wood includes wood lying on the surface dead roots and stumps larger than or equal to 10 cmin diameter or any other diameter used by the country.
Carbon in above-groundbiomass
Carbon in all living biomass above the soil including stem stump branches bark seeds and foliage.
Carbon in below-groundbiomass
Carbon in all biomass of live roots. Fine roots of less than 2 mm diameter are excluded because theseoften cannot be distinguished empirically from soil organic matter or litter.
Carbon in dead wood Carbon in all non-living woody biomass not contained in the litter, either standing, lying on the ground,or in the soil. Dead wood includes wood lying on the surface, dead roots and stumps larger than or equalto 10 cm in diameter or any other diameter used by the country.
Carbon in litter Carbon in all non-living biomass with a diameter less than the minimum diameter for dead wood (e.g.10 cm ) lying dead in various states of decomposition above the mineral or organic soil.
Soil carbon Organic carbon in mineral and organic soils (including peat) to a soil depth of 30 cm.
3.2 National data
3.2.1 Data sources
References to sourcesof information
Variables Years Additional comments
1 Rhett Butler Growing stock 1994-2006 Species
2 World Resources Institute Growing stock 2006 Species
3 N/A N/A N/A N/A
4 N/A N/A N/A N/A
FRA 2015 – Country Report, Kiribati
21
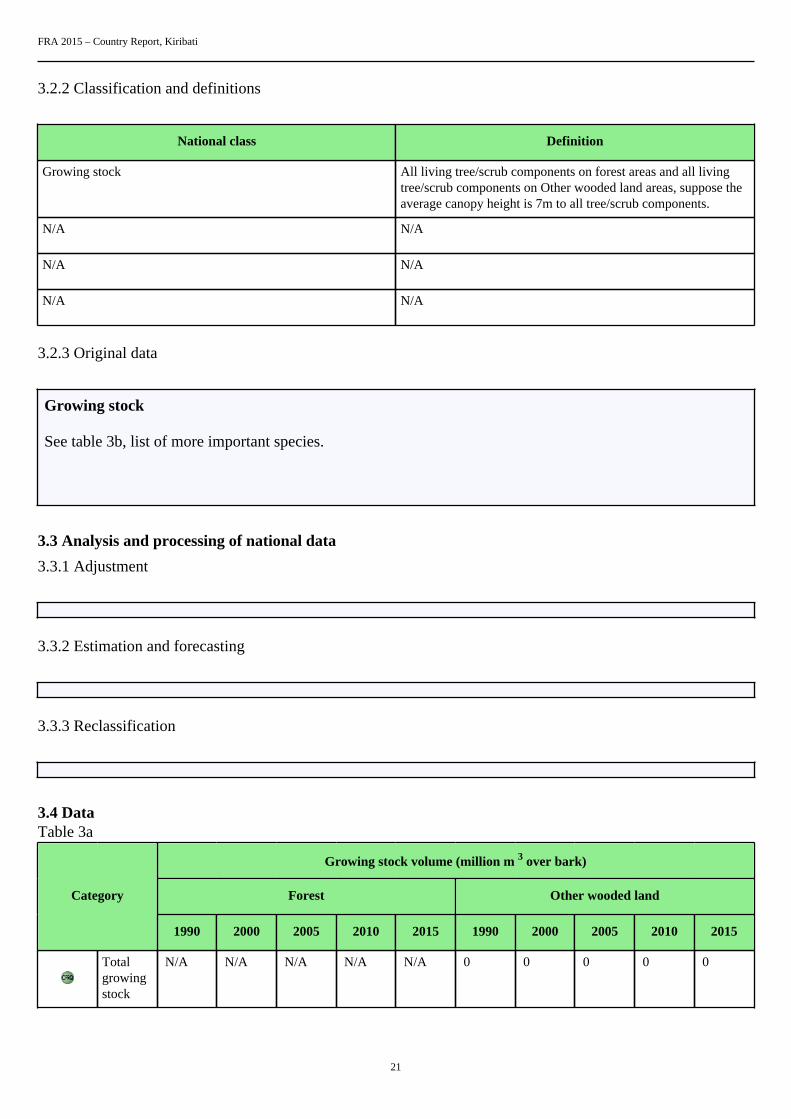
3.2.2 Classification and definitions
National class Definition
Growing stock All living tree/scrub components on forest areas and all livingtree/scrub components on Other wooded land areas, suppose theaverage canopy height is 7m to all tree/scrub components.
N/A N/A
N/A N/A
N/A N/A
3.2.3 Original data
Growing stock
See table 3b, list of more important species.
3.3 Analysis and processing of national data
3.3.1 Adjustment
3.3.2 Estimation and forecasting
3.3.3 Reclassification
3.4 DataTable 3a
Growing stock volume (million m 3 over bark)
Forest Other wooded landCategory
1990 2000 2005 2010 2015 1990 2000 2005 2010 2015
Totalgrowingstock
N/A N/A N/A N/A N/A 0 0 0 0 0

FRA 2015 – Country Report, Kiribati
22
... ofwhichconiferous
N/A N/A N/A N/A N/A 0 0 0 0 0
... ofwhichbroadleaved
N/A N/A N/A N/A N/A 0 0 0 0 0
Table 3b
Category/Species name Growing stock in forest (million cubic meters)
Rank Scientific name Common name 1990 2000 2005 2010
1 st Cocos nucifera Coconut N/A N/A N/A N/A
2 nd Scaevola sericeaVahl
Salt bush N/A N/A N/A N/A
3 rd Guettarda spp Guettarda;wut N/A N/A N/A N/A
4 th Tournefortia spp Tree heliotrope N/A N/A N/A N/A
5 th Mirindacitrifolia
Beach mulberry N/A N/A N/A N/A
6 th Pemphis acidulaforst. (I)
Iron wood,pemphis
N/A N/A N/A N/A
7 th Rhizophora spp Mangroves N/A N/A N/A N/A
8 th Pandanustectorius
Pandanus tree N/A N/A N/A N/A
9 th Cyrtospermachamissions
Giant SwampTaro
N/A N/A N/A N/A
10 th Casuarinaeqiseifola
Ironwood, she-oak, beefwoodtree
N/A N/A N/A N/A
Remaining N/A N/A N/A N/A
TOTAL .00 .00 .00 .00
THE PRE-FILLED VALUES FOR GROWING STOCK REFER TO THE FOLLOWINGTHRESHOLD VALUES (SEE TABLE BELOW)
Item Value Complementary information
Minimum diameter (cm) at breast heightof trees included in growing stock (X)
N/A N/A
Minimum diameter (cm) at the top end ofstem for calculation of growing stock (Y)
N/A N/A
Minimum diameter (cm) of branchesincluded in growing stock (W)
N/A N/A

FRA 2015 – Country Report, Kiribati
23
Volume refers to above ground (AG) orabove stump (AS)
N/A N/A
PLEASE NOTE THAT THE DEFINITION OF GROWING STOCK HAS CHANGED AND SHOULDBE REPORTED AS GROWING STOCK DBH 10 CM INCLUDING THE STEM FROM GROUNDLEVEL UP TO A DIAMETER OF 0 CM, EXCLUDING BRANCHES.
Table 3c
Net annual increment (m 3 per hectare and year)
ForestCategory
1990 2000 2005 2010 2015
Net annualincrement
N/A N/A N/A N/A N/A
... of whichconiferous
N/A N/A N/A N/A N/A
... of whichbroadleaved
N/A N/A N/A N/A N/A
Table 3d
Biomass (million metric tonnes oven-dry weight)
Forest Other wooded landCategory
1990 2000 2005 2010 2015 1990 2000 2005 2010 2015
Abovegroundbiomass
N/A N/A N/A N/A N/A 0 0 0 0 0
Belowgroundbiomass
N/A N/A N/A N/A N/A 0 0 0 0 0
Deadwood
N/A N/A N/A N/A N/A 0 0 0 0 0
TOTAL .00 .00 .00 .00 .00 .00 .00 .00 .00 .00
Table 3e
Carbon (Million metric tonnes)
Forest Other wooded landCategory
1990 2000 2005 2010 2015 1990 2000 2005 2010 2015
Carbonin abovegroundbiomass
N/A N/A N/A N/A N/A 0 0 0 0 0

FRA 2015 – Country Report, Kiribati
24
Carbonin belowgroundbiomass
N/A N/A N/A N/A N/A 0 0 0 0 0
SubtotalLivingbiomass
N/A N/A N/A N/A N/A 0 0 0 0 0
Carbonin deadwood
N/A N/A N/A N/A N/A 0 0 0 0 0
Carbonin litter
N/A N/A N/A N/A N/A 0 0 0 0 N/A
SubtotalDeadwoodand litter
N/A N/A N/A N/A N/A 0 0 0 0 0
Soilcarbon
N/A N/A N/A N/A N/A 0 0 0 0 0
TOTAL .00 .00 .00 .00 .00 .00 .00 .00 .00 .00
Tiers
Variable/category Tier for status Tier for trend
Total growing stock Tier 1 Tier 1
Net annual increment Tier 1 Tier 1
Above ground biomass Tier 1 Tier 1
Below ground biomass Tier 1 Tier 1
Dead wood Tier 1 Tier 1
Carbon in above-ground biomass Tier 1 Tier 1
Carbon in below ground biomass Tier 1 Tier 1
Carbon in dead wood and litter Tier 1 Tier 1
Soil carbon Tier 1 Tier 1
Tier criteria
Category Tier for status Tier for reported trend

FRA 2015 – Country Report, Kiribati
25
Total growing stock Tier 3: Data sources Recent 10 yearsNational Forest Inventory or remotesensing with ground truthing orprogramme for repeated compatible NFI10 years Domestic volume functions Tier2: Data sources/registers and statisticsmodelling or old NFI 10 years or partialfield inventory Tier 1: Other data sources
Tier 3: Estimate based on repeatedcompatible tiers 3 (tier for status)Domestic growth functions Tier 2:Estimate based on repeated compatible tier2 or combination tier 3 and 2 or 1 tier forstatus Tier 1: Other
Net annual increment Tier 3: Scientifically tested nationalvolume and growth functions Tier 2:Selection of volume and growth functionsas relevant as possible Tier 1: Other
Tier 3: Confirmation/adjustment offunctions used through scientific workTier 2: Review work done to seekalternative functions Tier: 1 Other
Biomass Tier 3: Country-specific national or sub-national biomass conversion expansionfactors applied or other domestic orotherwise nationally relevant biomassstudies Tier 2: Application of countryspecific national or sub-national biomassconversion factors from other countrywith similar climatic conditions and foresttypes Tier 1: International/regional defaultbiomass expansion factors applied
Tier 3 : Estimate based on repeatedcompatible tiers 3 (tier for status) Tier 2 :Estimate based on repeated compatible tier2 or combination tier 3 and 2 or 1 (tier forstatus) Tier 1 : Other
• Carbon in above ground biomass• Carbon in below ground biomass• Carbon in dead wood and litter• Soil carbon
Tier 3: Country-specific national or sub-national biomass conversion expansionfactors applied Tier 2: Applicationof country specific national or sub-national biomass conversion factorsform from other country with similarclimatic conditions and forest types Tier1: International/regional default biomassexpansion factors applied
Tier 3 : Estimate based on repeatedcompatible tiers 3 (tier for status) Tier 2 :Estimate based on repeated compatible tier2 or combination tier 3 and 2 or 1 (tier forstatus) Tier 1 : Other
3.5 Comments on growing stock biomass and carbon
CategoryComments related todata definitions etc
Comments on the reported trend
Total growing stock N/A N/A
Growing stock of broadleaved coniferous N/A N/A
Growing stock composition N/A N/A
Net annual increment N/A N/A
Above-ground biomass N/A N/A
Below-ground biomass N/A N/A
Dead wood N/A N/A
Carbon in above-ground biomass N/A N/A
Carbon in below-ground biomass N/A N/A

FRA 2015 – Country Report, Kiribati
26
Carbon in dead wood N/A N/A
Carbon in litter N/A N/A
Soil carbon N/A N/A
Other general comments to the table
N/A

FRA 2015 – Country Report, Kiribati
27
4. What is the status of forest production and how has it changed over time?Documents for this question:
• Guide for country reporting FRA 2015• FRA 2015 Terms and Definitions
4.1 Categories and definitions
Term Definition
Primary designatedfunction
The primary function or management objective assigned to a management unit either by legalprescription documented decision of the landowner/manager or evidence provided by documentedstudies of forest management practices and customary use.
Non wood forest product(NWFP)
Goods derived from forests that are tangible and physical objects of biological origin other than wood.
Commercial value ofNWFP
For the purpose of this table, value is defined as the commercial market value at the forest gate.
Category Definition
Production forest Forest area designated primarily for production of wood, fibre, bio-energy and/or non-wood forestproducts.
Multiple use forest Forest area designated for more than one purpose and where none of these alone is considered as thepredominant designated function.
Total wood removals The total of industrial round wood removals and woodfuel removals.
...of which woodfuel The wood removed for energy production purposes, regardless whether for industrial, commercial ordomestic use.
4.2 National data
4.2.1 Data sources
References to sourcesof information
Variables Years Additional comments

FRA 2015 – Country Report, Kiribati
28
1 Phoenix Islands ProtectedArea (PIPA) Information FactSheet
The designation of thePhoenix Islands ProtectedArea (PIPA) also includesterrestrial biodiversityconservation, which includesexisting flora and faunaavailable in these islands.The designation of the PIPAcame about after a seriesof scientific expeditionsby a recognized researchorganization (New EnglandAquarium), who has beeninstrumental in advising theGovernment of Kiribati thatthese islands and surroundingmarine environment havehigh biodiversity values thatneed to be protected. ThePIPA is now the biggestprotected area designated inthe world.
2006 N/A
2 PIPA Regulations 2008 N/A 2008 The PIPA Regulations 2008is a regulation under theEnvironment Act 1999 (asamended 2007)
3 Wildlife ConservationOrdinance
1977 N/A The Wildlife ConservationOrdinance will be revisedsome time in 2009
4 Government of Kiribaticountry report (1st) tothe Conference of theParties to the Conventionon Biological Diversity(CBD) & Government ofKiribati National BiodiversityStrategies and Actions Plan(NBSAP – Kiribati)
2005 N/A The country report and theNBSAP - Kiribati have beencabinet approved and are nowready for submission to theSecretariat of the Conventionon Biological Diversity. Boththe report and the NBSAP-Kiribati reflect baseline dataon the status of protectedareas and the conservationof biological diversity in thecontext of Kiribati as an atollnation.
5 Maps – Lands ManagementDivision (LMD) of Ministryof Environment, Lands &Agricultural Development(MELAD)Government ofKiribati country report (1st)to the Conference of theParties to the Conventionon Biological Diversity(CBD) & Government ofKiribati National BiodiversityStrategies and Actions Plan(NBSAP – Kiribati)
N/A 2005 Be available later

FRA 2015 – Country Report, Kiribati
29
6 Metz, D.W. 1996. TheMangroves of Kiribati: AnInventory, Feasibility andManagement Study. Vol 1.Prepared for AgricultureDivision, MNRD, Republicof Kiribati by USDA ForestService in collaborationwith South Pacific ForestryDevelopment Programme(FAO/UNDP/RAS/92/361)Suva, Fiji. Unpublished.
N/A 1995 This working paper is oneof a series of publicationsprepared during the course(1992 – 96) of the UNDP/FAO South Pacific ForestryDevelopment Programme.This is also one of the firstcomprehensive study onmangroves undertaken inKiribati. This figure may beslightly on the lower side,since the extent of mangrovesfound in many small islandsis not available.
4.2.2 Classification and definitions
National class Definition
N/A N/A
N/A N/A
N/A N/A
N/A N/A
4.2.3 Original data
4.3 Analysis and processing of national data
4.3.1 Adjustment
4.3.2 Estimation and forecasting
4.3.3 Reclassification
4.4 DataTable 4a
Forest area (000 hectares)Categories
1990 2000 2005 2010 2015

FRA 2015 – Country Report, Kiribati
30
Production forest 0 0 0 0 0
Multiple useforest
0 0 0 0 0
Table 4b
Rank Name of product Key species
Commercial valueof NWFP removals
2010 (value 1000local currency)
NWFP category
1 st N/A N/A N/A N/A
2 nd N/A N/A N/A N/A
3 rd N/A N/A N/A N/A
4 th N/A N/A N/A N/A
5 th N/A N/A N/A N/A
6 th N/A N/A N/A N/A
7 th N/A N/A N/A N/A
8 th N/A N/A N/A N/A
9 th N/A N/A N/A N/A
10 th N/A N/A N/A N/A
TOTAL .00
2010
Name of local currency N/A
Category
Plant products / raw material
1 Food
2 Fodder
3 Raw material for medicine and aromatic products
4 Raw material for colorants and dyes
5 Raw material for utensils handicrafts construction
6 Ornamental plants

FRA 2015 – Country Report, Kiribati
31
7 Exudates
8 Other plant products
Animal products / raw material
9 Living animals
10 Hides skins and trophies
11 Wild honey and beewax
12 Wild meat
13 Raw material for medicine
14 Raw material for colorants
15 Other edible animal products
16 Other non-edible animal products
Table 4c Pre-filled data from FAOSTAT
FRA 2015 category (1000 m 3 u.b.)Year
Total wood removals ...of which woodfuel
1990 2.03 2.03
1991 2.06 2.06
1992 2.09 2.09
1993 2.12 2.09
1994 2.06 2.06
1995 2.08 2.08
1996 2.14 2.14
1997 2.16 2.16
1998 2.2 2.2
1999 2.24 2.24
2000 2.4 2.4
2001 2.45 2.45
2002 2.5 2.5

FRA 2015 – Country Report, Kiribati
32
2003 2.55 2.55
2004 2.6 2.6
2005 2.65 2.65
2006 2.7 2.7
2007 2.76 2.76
2008 2.82 2.82
2009 2.88 2.88
2010 2.94 2.94
2011 2.99 2.99
Tiers
Category Tier for status Tier for reported trend
Production forest Tier 1 Tier 1
Multiple use forest Tier 1 Tier 1
Tier Criteria
Category Tier for status Tier for reported trend
Production forest Multiple use forest Tier 3: Updated including fieldverifications national forest mapsincluding functions Tier 2: Forest mapsolder than 6 years including forestfunctions Tier 1: Other
Tier 3 : Estimate based on repeatedcompatible tiers 3 (tier for status) Tier 2 :Estimate based on repeated compatible tier2 or combination tier 3 and 2 or 1 (tier forstatus) Tier 1 : Other
4.5 Comments
CategoryComments related todata definitions etc
Comments on the reported trend
Production forest N/A N/A
Multiple use forest Phoenix Islands Protected Area (PIPA)Regulations 2008 designate the PhoenixIslands Group as a Protected Area formultiple uses under the IUCN ProtectedAreas strategy 1b - wilderness area.
PIPA management plan is still in draft.
Total wood removals N/A N/A
Commercial value of NWFP N/A N/A
Other general comments to the table

FRA 2015 – Country Report, Kiribati
33
The Republic of Kiribati has taken the remarkable step of declaring the Phoenix Islands archipelago and surrounding waters, anarea of 410,500 sq. km., as the Phoenix Islands Protected Area (PIPA). It is the largest marine protected area in the world today. ThePhoenix Islands group is one of the Earth#s last intact oceanic coral archipelago ecosystems and represents a marine wilderness areathat has had very limited human exploitation due to their extremely remote location.

FRA 2015 – Country Report, Kiribati
34
5. How much forest area is managed for protection of soil and water and ecosystemservices?Documents for this question:
• Guide for country reporting FRA 2015• FRA 2015 Terms and Definitions
5.1 Categories and definitions
Category Definition
Protection of soil andwater
Forest area designated or managed for protection of soil and water
...of which productionof clean water (sub-category)
Forest area primarily designated or managed for water production, where most human uses are excludedor heavily modified to protect water quality.
...of which coastalstabilization (sub-category)
Forest area primarily designated or managed for coastal stabilization.
...of which desertificationcontrol (sub-category)
Forest area primarily designated or managed for desertification control.
...of which avalanchecontrol (sub-category)
Forest area primarily designated or managed to prevent the development or impact of avalanches onhuman life assets or infrastructure.
...of which erosion, floodprotection or reducingflood risk (sub-category)
Forest area primarily designated or managed for protecting communities or assets from the impacts oferosion riparian floods and landslides or for providing flood plain services.
...of which other (sub-category)
Forest area primarily designated or managed for other protective functions.
Ecosystem services,cultural or spiritual values
Forest area primarily designated or managed for selected ecosystem services or cultural or spiritualvalues.
...of which publicrecreation (sub-category)
Forest area designated or managed for public recreation.
...of which carbon storageor sequestration (sub-category)
Forest area designated or managed for carbon storage or sequestration.
...of which spiritual orcultural services (sub-category)
Forest area designated or managed for spiritual or cultural services.
...of which other (sub-category)
Forest area designated or managed for other ecosystem services.
5.2 National data
5.2.1 Data sources
References to sourcesof information
Variables Years Additional comments
1 N/A N/A N/A N/A
2 N/A N/A N/A N/A

FRA 2015 – Country Report, Kiribati
35
3 N/A N/A N/A N/A
4 N/A N/A N/A N/A
5.2.2 Classification and definitions
National class Definition
N/A N/A
N/A N/A
N/A N/A
N/A N/A
5.2.3 Original data
5.3 Analysis and processing of national data
5.3.1 Adjustment
5.3.2 Estimation and forecasting
5.3.3 Reclassification
5.4 DataTable 5a
Forest area (1000 hectares)Categories
1990 2000 2005 2010 2015
Protection of soiland water
N/A N/A N/A N/A N/A
... of whichproduction ofclean water
N/A N/A N/A N/A N/A
... of whichcoastalstabilization
N/A N/A N/A N/A N/A

FRA 2015 – Country Report, Kiribati
36
... of whichdesertificationcontrol
N/A N/A N/A N/A N/A
... of whichavalanchecontrol
N/A N/A N/A N/A N/A
... of whicherosion, floodprotection orreducing floodrisk
N/A N/A N/A N/A N/A
... of which other(please specifyin commentsbelow the table)
N/A N/A N/A N/A N/A
Other
N/A
Table 5b
Forest area (1000 hectares)Categories
1990 2000 2005 2010 2015
Ecosystem services,cultural or spiritualvalues
N/A N/A N/A N/A N/A
...of which publicrecreation
N/A N/A N/A N/A N/A
...of whichcarbon storage orsequestration
N/A N/A N/A N/A N/A
...of which spiritualor cultural services
N/A N/A N/A N/A N/A
...of which other(please specify incomments belowthe table)
N/A N/A N/A N/A N/A
Tiers
Category Tier for reported trend Tier for status
Protection of soil and water N/A N/A
Ecosystem services, cultural or spiritualvalues
N/A N/A
Tier criteria
Category Tier for status Tier for reported trend

FRA 2015 – Country Report, Kiribati
37
Protection of soil and water Tier 3: High reliability data derived eitherfrom high intensity sample survey or dataobtained from national or state agenciesresponsible for regulations or legislationrelating to soil and water protection. Tier2: Approaches based on low intensityor incomplete sample-based surveys orstudies that provide data for specific areasthat is extrapolated through statisticalanalysis to national level estimates. Tier 1:Other
Tier 3 : Estimate based on repeatedcompatible tiers 3 (tier for status) Tier 2 :Estimate based on repeated compatible tier2 or combination tier 3 and 2 or 1 (tier forstatus) Tier 1 : Other
• Cultural or spiritual values• Public recreation• Spiritual or cultural services• Other
Tier 3: High reliability data derivedeither from high intensity sample surveyor data obtained from national or stateagencies responsible for regulations. Tier2: Approaches based on low intensityor incomplete sample-based surveys orstudies that provide data for specific areasthat is extrapolated through statisticalanalysis to national level estimates. Tier 1:Other
Tier 3 : Estimate based on repeatedcompatible tiers 3 (tier for status) Tier 2 :Estimate based on repeated compatible tier2 or combination tier 3 and 2 or 1 (tier forstatus) Tier 1 : Other
5.5 Comments
CategoryComments related todata definitions etc
Comments on the reported trend
Protection of soil and water N/A N/A
Production of clean water N/A N/A
Coastal stabilization N/A N/A
Desertification control N/A N/A
Avalanche control N/A N/A
Erosion, flood protection or reducing floodrisk
N/A N/A
Other protective functions N/A N/A
Ecosystem services, cultural or spiritualvalues
N/A N/A
Public recreation N/A N/A
Carbon storage or sequestration N/A N/A
Spiritual or cultural services N/A N/A
Other ecosystem services N/A N/A
Other general comments to the table
FRA 2015 – Country Report, Kiribati
38
N/A

FRA 2015 – Country Report, Kiribati
39
6. How much forest area is protected and designated for the conservation of biodiversityand how has it changed over time?Documents for this question:
• Guide for country reporting FRA 2015• FRA 2015 Terms and Definitions
6.1 Categories and definitions
Category Definition
Conservation ofbiodiversity
Forest area designated primarily for conservation of biological diversity. Includes but is not limited toareas designated for biodiversity conservation within the protected areas.
Forest area withinprotected areas
Forest area within formally established protected areas independently of the purpose for which theprotected areas were established.
6.2 National data
6.2.1 Data sources
References to sourcesof information
Variables Years Additional comments
1 Phoenix Islands ProtectedArea (PIPA) Information FactSheet
N/A 2006 The designation of thePhoenix Islands ProtectedArea (PIPA) also includesterrestrial biodiversityconservation, which includesexisting flora and faunaavailable in these islands.The designation of the PIPAcame about after a seriesof scientific expeditionsby a recognized researchorganization (New EnglandAquarium), who has beeninstrumental in advising theGovernment of Kiribati thatthese islands and surroundingmarine environment havehigh biodiversity values thatneed to be protected. ThePIPA is now the biggestprotected area designated inthe world.
2 PIPA Regulations 2008 N/A 2008 The PIPA Regulations 2008is a regulation under theEnvironment Act 1999 (asamended 2007)
3 Wildlife ConservationOrdinance
N/A 1977 The Wildlife ConservationOrdinance will be revisedsome time in 2009
FRA 2015 – Country Report, Kiribati
40
4 Government of Kiribaticountry report (1st) tothe Conference of theParties to the Conventionon Biological Diversity(CBD) & Government ofKiribati National BiodiversityStrategies and Actions Plan(NBSAP – Kiribati)
N/A 2005 The country report and theNBSAP - Kiribati have beencabinet approved and are nowready for submission to theSecretariat of the Conventionon Biological Diversity. Boththe report and the NBSAP-Kiribati reflect baseline dataon the status of protectedareas and the conservationof biological diversity in thecontext of Kiribati as an atollnation.
5 Maps – Lands ManagementDivision (LMD) of Ministryof Environment, Lands &Agricultural Development(MELAD)
N/A N/A Be available later
6 Metz, D.W. 1996. TheMangroves of Kiribati: AnInventory, Feasibility andManagement Study. Vol 1.Prepared for AgricultureDivision, MNRD, Republicof Kiribati by USDA ForestService in collaborationwith South Pacific ForestryDevelopment Programme(FAO/UNDP/RAS/92/361)Suva, Fiji. Unpublished.
N/A 1995 This working paper is oneof a series of publicationsprepared during the course(1992 – 96) of the UNDP/FAO South Pacific ForestryDevelopment Programme.This is also one of the firstcomprehensive study onmangroves undertaken inKiribati. This figure may beslightly on the lower side,since the extent of mangrovesfound in many small islandsis not available.
6.2.2 Classification and definitions
National class Definition
N/A N/A
N/A N/A
N/A N/A
N/A N/A
6.2.3 Original data
The designation of the Phoenix Islands Protected Area (PIPA) also includes terrestrial biodiversity conservation,which includes existing flora and fauna available in these islands.
There is not information available to determine the forest area existing in the littoral of this protected area.

FRA 2015 – Country Report, Kiribati
41
6.3 Analysis and processing of national data
6.3.1 Adjustment
6.3.2 Estimation and forecasting
6.3.3 Reclassification
6.4 DataTable 6
Forest area (000 hectares)Categories
1990 2000 2005 2010 2015
Conservation ofbiodiversity
0.258 0.258 0.258 0.258 0.258
Forest areawithin protectedareas
N/A N/A N/A N/A N/A
Tiers
Category Tier for status Tier for reported trend
Conservation of biodiversity Tier 1 Tier 1
Forest area within protected areas Tier 1 Tier 1
Tier criteria
Category Tier for status Tier for reported trend
• Conservation of biodiversity• Forests within protected areas
Tier 3: Data obtained from national orstate agencies responsible for conservationand protected area or legislation relatingto area protection. Tier 2: Studies thatprovide data for specific areas that isextrapolated through statistical analysis tonational level estimates Tier 1 Other
Tier 3 : Estimate based on repeatedcompatible tiers 3 (tier for status) Tier 2 :Estimate based on repeated compatible tier2 or combination tier 3 and 2 or 1 (tier forstatus) Tier 1 : Other
6.5 Comments
CategoryComments related todata definitions etc
Comments on the reported trend

FRA 2015 – Country Report, Kiribati
42
Conservation of biodiversity Not yet assessed. Baseline informationand maps have been collected mainly.These baseline information and dataneed to be verified. Verification pending,subject to available funds and appropriateTAs to be identified, who would workclosely with local counterparts withinECD MELAD. However, data on totalland areas and bush areas are availablewith MELAD LMD. All mangrove areahas been included in this category.
SOE report is still in draft, informationand data on conservation of biodiversity isalso included.
Forest area within protected areas Forest area within designatedconservation closed areas (on landand on conservation off-islets) andwildlife sanctuaries under the WildlifeConservation ordinance 1977 are yet to beassessed.
N/A
Other general comments to the table
The Republic of Kiribati has taken the remarkable step of declaring the Phoenix Islands archipelago and surrounding waters, anarea of 410,500 sq. km., as the Phoenix Islands Protected Area (PIPA). It is the largest marine protected area in the world today. ThePhoenix Islands group is one of the Earth#s last intact oceanic coral archipelago ecosystems and represents a marine wilderness areathat has had very limited human exploitation due to their extremely remote location.

FRA 2015 – Country Report, Kiribati
43
7. What is the area of forest affected by woody invasive species?Documents for this question:
• Guide for country reporting FRA 2015• FRA 2015 Terms and Definitions
7.1 Categories and definitions
Category Definition
Invasive species Species that are non-native to a particular ecosystem and whose introduction and spread cause, or arelikely to cause, socio-cultural, economic or environmental harm or harm to human health.
7.2 National data
7.2.1 Data sources
References to sourcesof information
Variables Years Additional comments
1 Agricultural Report onKiribati invasive speciesKiribati National Report toCPBD - CBD was draftedby Temakei Tebano with theassistance of RibanataakeAwira and Kaitu Koina, incollaboration with variousgovernment ministries anddepartments, NGOs andindividuals. 1999
List of species presented inthe section of comments.
N/A N/A
2 Space, J.C. and Imada,C.T. 2004. Report to theRepublic of Kiribati onInvasive Plant Species on theIslands of Tarawa, Abemama,Butaritari and Maianahttp://www.sprep.org/att/IRC/eCOPIES/Countries/Kiribati/11.pdf
List of invasive species (floraand fauna)
N/A N/A
3 N/A N/A N/A N/A
4 N/A N/A N/A N/A
7.2.2 Classification and definitions
National class Definition
N/A N/A
N/A N/A
N/A N/A

FRA 2015 – Country Report, Kiribati
44
N/A N/A
7.2.3 Original data
7.3 Analysis and processing of national data
7.3.1 Adjustment
7.3.2 Estimation and forecasting
7.3.3 Reclassification
7.4 DataTable 7
Forest area affected (000 ha)Scientific name of
woody invasive species2005 2010
Premna serratifolia N/A N/A
N/A N/A N/A
N/A N/A N/A
N/A N/A N/A
N/A N/A N/A
N/A N/A N/A
N/A N/A N/A
N/A N/A N/A
N/A N/A N/A
N/A N/A N/A
Total N/A N/A
Tiers

FRA 2015 – Country Report, Kiribati
45
Category Tier for status Tier for reported trend
Invasive species Tier 1 Tier 1
Tier Criteria
Category Tier for status Tier for reported trend
Invasive species Tier 3: Systematic assessment in forestinventory or other survey (e.g. byconservation department) within the last5 years) Tier 2: Systematic assessment inforest inventory or other survey (e.g. byconservation department conducted morethan 5 years ago) Tier 1: Other
Tier 3 : Estimate based on repeatedcompatible tiers 3 (tier for status) Tier 2 :Estimate based on repeated compatible tier2 or combination tier 3 and 2 or 1 (tier forstatus) Tier 1 : Other
7.5 Comments
CategoryComments related todata definitions etc
Comments on the reported trend
Invasive species All above N/A
Other general comments to the table
N/A
FRA 2015 – Country Report, Kiribati
46
8. How much forest area is damaged each year?Documents for this question:
• Guide for country reporting FRA 2015• FRA 2015 Terms and Definitions
8.1 Categories and definitions
Category Definition
Number of fires Number of fires per year
Burned area Area burned per year
Outbreaks of insects A detectable reduction in forest health caused by a sudden increase in numbers of harmful insects.
Outbreaks of diseases A detectable reduction in forest health caused by a sudden increase in numbers of harmful pathogens,such as bacteria, fungi, phytoplasma or virus.
Severe weather events Damage caused severe weather events, such as snow, storm, drought, etc.
8.2 National data
8.2.1 Data sources
References to sourcesof information
Variables Years Additional comments
1 N/A N/A N/A N/A
2 N/A N/A N/A N/A
3 N/A N/A N/A N/A
4 N/A N/A N/A N/A
8.2.2 Classification and definitions
National class Definition
N/A N/A
N/A N/A
N/A N/A
N/A N/A
8.2.3 Original data

FRA 2015 – Country Report, Kiribati
47
8.3 Analysis and processing of national data
8.3.1 Adjustment
8.3.2 Estimation and forecasting
8.3.3 Reclassification
8.4 DataTable 8a
000 ha, number of fires
2003 2004 2005 2006 2007Category
000 ha # 000 ha # 000 ha # 000 ha # 000 ha #
Totalland areaburned
0 N/A 0 N/A 0 N/A 0 N/A 0 N/A
... ofwhichforestareaburned
0 N/A 0 N/A 0 N/A 0 N/A 0 N/A
2008 2009 2010 2011 2012Category
000 ha # 000 ha # 000 ha # 000 ha # 000 ha #
Totalland areaburned
0 N/A 0 N/A 0 N/A 0 N/A 0 N/A
... ofwhichforestareaburned
0 N/A 0 N/A 0 N/A 0 N/A 0 N/A
Table 8b
Outbreak category Description/name Year(s) of latest outbreak Area damaged (000 hectares)
N/A N/A Early 1990s N/A
N/A N/A Early 1990s N/A

FRA 2015 – Country Report, Kiribati
48
N/A N/A Early 1990s N/A
N/A N/A N/A N/A
N/A N/A N/A N/A
N/A N/A N/A N/A
N/A N/A N/A N/A
N/A N/A N/A N/A
N/A N/A N/A N/A
N/A N/A N/A N/A
Outbreak category
1 Insects
2 Diseases
3 Severe weather events
Tiers
Category Tier for status Tier for trend
Area affected by fire Tier 2 Tier 2
• Insects• Diseases• Severe weather events
Tier 1 Tier 1
Tier criteria
Category Tier for status Tier for reported trend
Burned area Tier 3 : National fire monitoring routinesTier 2 : Remote sensing surveys Tier 1 :Other
Tier 3 : Estimate based on repeatedcompatible tiers 3 (tier for status) Tier 2 :Estimate based on repeated compatible tier2 or combination tier 3 and 2 or 1 (tier forstatus) Tier 1 : Other
• Insects• Diseases• Severe weather events
Tier 3 : Systematic survey (e.g. viainventory or aerial damage assessment)Tier 2 : Management records Tier 1 :Other
Tier 3 : Estimate based on repeatedcompatible tiers 3 (tier for status) Tier 2 :Estimate based on repeated compatible tier2 or combination tier 3 and 2 or 1 (tier forstatus) Tier 1 : Other
8.5 Comments
CategoryComments related todata definitions etc
Comments on the reported trend

FRA 2015 – Country Report, Kiribati
49
Burned area N/A N/A
Insects N/A N/A
Diseases N/A N/A
Severe weather events N/A N/A
Other general comments to the table
N/A

FRA 2015 – Country Report, Kiribati
50
9. What is the forest area with reduced canopy cover?Documents for this question:
• Guide for country reporting FRA 2015• FRA 2015 Terms and Definitions
Category Definition
Reduction in canopycover
Forest that has undergone a reduction of canopy cover of more than 20% between the years 2000 and2010 within the forest canopy cover range of 30-80% as detected by the MODIS VCF sensor.
Table 9
Category Area of forest with reduced canopy cover (000 ha)
Reduction in canopycover
N/A
Tiers
Category Tier for reported trend
Reduction in canopycover
N/A
Tier criteria
Category Tier for reported trend
Reduction in canopycover
Tier 3 : Remote sensing with ground truthing and/or Landsat imagery Tier 2 : Remote sensing usingModis (using pre-filled data provided by FAO) Tier 1 : Expert opinion
Comments
Category Comments related to data definitions etc
Reduction in canopycover
N/A
Other general comments

FRA 2015 – Country Report, Kiribati
51
10. What forest policy and regulatory framework exists to support implementation ofsustainable forest management SFM?Documents for this question:
• Guide for country reporting FRA 2015• FRA 2015 Terms and Definitions
10.1 Categories and definitions
Category Definition
Policies supportingsustainable forestmanagement
Policies or strategies that explicitly encourage sustainable forest management.
Legislation andregulations supportingsustainable forestmanagement
Legislation and regulations that govern and guide sustainable forest management, operations and use.
10.2 National data
10.2.1 Data sources
References to sourcesof information
Variables Years Additional comments
1 N/A N/A N/A N/A
2 N/A N/A N/A N/A
3 N/A N/A N/A N/A
4 N/A N/A N/A N/A
10.2.2 Classification and definitions
National class Definition
N/A N/A
N/A N/A
N/A N/A
N/A N/A
10.2.3 Original data
10.3 Data

FRA 2015 – Country Report, Kiribati
52
Table 10
Sub-nationalCategoryNational
Regional Provincial/State Local
Policies supportingsustainable forestmanagement
... of which, in publiclyowned forests
... of which, in privatelyowned forests
Legislation andregulations supportingsustainable forestmanagement
... of which, in publiclyowned forests
... of which, in privatelyowned forests
10.4 Comments
Variable / category Comments related to data definitions etc
Policies supporting sustainable forest management N/A
Legislation and regulations supporting sustainable forestmanagement
N/A
Other general comments

FRA 2015 – Country Report, Kiribati
53
11. Is there a national platform that promotes stakeholder participation in forest policydevelopment?Documents for this question:
• Guide for country reporting FRA 2015• FRA 2015 Terms and Definitions
11.1 Categories and definitions
Category Definition
National stakeholderplatform
A recognized procedure that a broad range of stakeholders can use to provide opinions, suggestions,analysis, recommendations and other input into the development of national forest policy.
11.2 National data
11.2.1 Data sources
References to sources of information Years Additional comments
1 N/A N/A N/A
2 N/A N/A N/A
3 N/A N/A N/A
4 N/A N/A N/A
Table 11Is there a national platform that promotes or allows forstakeholder participation in forest policy development?
11.3 Comments
Category Comments related to data definitions etc
National stakeholder platform N/A
Other general comments

FRA 2015 – Country Report, Kiribati
54
12. What is the forest area intended to be in permanent forest land use and how has itchanged over time?Documents for this question:
• Guide for country reporting FRA 2015• FRA 2015 Terms and Definitions
12.1 Categories and definitions
Category Definition
Forest area intended to bein permanent forest landuse
Forest area that is designated or expected to be retained as forest and is highly unlikely to be convertedto other land use.
...of which permanentforest estate (sub-category)
Forest area that is designated by law or regulation to be retained as forest and may not be converted toother land use.
12.2 National data
12.2.1 Data sources
References to sourcesof information
Variables Years Additional comments
1 N/A N/A N/A N/A
2 N/A N/A N/A N/A
3 N/A N/A N/A N/A
4 N/A N/A N/A N/A
12.2.2 Classification and definitions
National class Definition
N/A N/A
N/A N/A
N/A N/A
N/A N/A
12.2.3 Original data
12.3 Analysis and processing of national data

FRA 2015 – Country Report, Kiribati
55
12.3.1 Adjustment
12.3.2 Estimation and forecasting
12.3.3 Reclassification
12.4 DataTable 12
Categories Forest area 2010 (000 ha)
Forest area intended to be in permanentforest land use
N/A
... of which permanent forest estate N/A
Tiers
Category Tier for status
Forest area intended to be in permanent forest land use N/A
Permanent forest estate N/A
Tier Criteria
Category Tier for status
Forest area intended to be in permanent forest land use Tier 3 : National or sub-national land use plans strategydocuments or other reports within the past 10 years Tier 2 :National or sub-national land use plans strategy documents orother reports within the past 20 years Tier 1 : Other
Permanent forest estate Tier 3 : National or sub-national land use plans strategydocuments or other reports within the past 10 years Tier 2 :National or sub-national land use plans strategy documents orother reports within the past 20 years Tier 1 : Other
12.5 Comments
Category Comments related to data definitions etc
Forest area intended to be in permanent forest land use N/A
Permanent forest estate N/A

FRA 2015 – Country Report, Kiribati
56
Other general comments

FRA 2015 – Country Report, Kiribati
57
13. How does your country measure and report progress towards SFM at the nationallevel?Documents for this question:
• Guide for country reporting FRA 2015• FRA 2015 Terms and Definitions
13.1 Categories and definitions
Category Definition
Forest area monitoredunder a national forestmonitoring framework
Forest area monitored by a national monitoring framework or systems that provide measurement basedperiodic monitoring of forest extent and quality.
Forest reporting atnational scale
National reporting of forest extent and characteristics that includes some measure of progress towardsustainable forest management.
13.2 National data
13.2.1 Data sources
References to sourcesof information
Variables Years Additional comments
1 N/A N/A N/A N/A
2 N/A N/A N/A N/A
3 N/A N/A N/A N/A
4 N/A N/A N/A N/A
13.2.2 Classification and definitions
National class Definition
N/A N/A
N/A N/A
N/A N/A
N/A N/A
13.3 DataTable 13a

FRA 2015 – Country Report, Kiribati
58
Check all boxes that apply
Category% of totalforest area
Mostrecent year
Continuous PeriodicPermanent
groundplots
Temporaryground
plots
Aerial/remotesensingsamplebased
Aerial/remote
sensing fullcoverage
Forestinventory
N/A N/A
Other fieldassessments
N/A N/A
Updatesto othersources
N/A N/A
Expertestimate
N/A N/A
Table 13b
Type of forest reporting used at national scale Check boxes that apply
1 Criteria and Indicators reporting
2 Periodic national state of the forest report
3 Other (please document)
4 None
Other type of forest reporting
N/A
13.4 Comments
Category Comments
N/A N/A
N/A N/A
N/A N/A
Other general comments
FRA 2015 – Country Report, Kiribati
59
14. What is the area of forest under a forest management plan and how is this monitored?Documents for this question:
• Guide for country reporting FRA 2015• FRA 2015 Terms and Definitions
14.1 Categories and definitions
Category Definition
Forest area withmanagement plan
Forest area that has a long-term documented management plan, aiming at defined management goalswhich is periodically revised
...of which for production(sub-category)
Forest management plan mainly focused on production
...of which forconservation (sub-category)
Forest management plan mainly focused on conservation
Monitoring of forestmanagement plans
Government monitoring of forest management plan implementation conducted through field visits oraudits of forest management plan performance
14.2 National data
14.2.1 Data sources
References to sourcesof information
Variables Years Additional comments
1 Phoenix Islands ProtectedArea (PIPA) Information FactSheet
N/A 2006 The designation of thePhoenix Islands ProtectedArea (PIPA) also includesterrestrial biodiversityconservation, which includesexisting flora and faunaavailable in these islands.The designation of the PIPAcame about after a seriesof scientific expeditionsby a recognized researchorganization (New EnglandAquarium), who has beeninstrumental in advising theGovernment of Kiribati thatthese islands and surroundingmarine environment havehigh biodiversity values thatneed to be protected. ThePIPA is now the biggestprotected area designated inthe world.
2 PIPA Regulations 2008 N/A 2008 The PIPA Regulations 2008is a regulation under theEnvironment Act 1999 (asamended 2007)

FRA 2015 – Country Report, Kiribati
60
3 Wildlife ConservationOrdinance
N/A 1977 The Wildlife ConservationOrdinance will be revisedsome time in 2009
4 Government of Kiribaticountry report (1st) tothe Conference of theParties to the Conventionon Biological Diversity(CBD) & Government ofKiribati National BiodiversityStrategies and Actions Plan(NBSAP – Kiribati)
N/A 2005 The country report and theNBSAP - Kiribati have beencabinet approved and are nowready for submission to theSecretariat of the Conventionon Biological Diversity. Boththe report and the NBSAP-Kiribati reflect baseline dataon the status of protectedareas and the conservationof biological diversity in thecontext of Kiribati as an atollnation.
5 Maps – Lands ManagementDivision (LMD) of Ministryof Environment, Lands &Agricultural Development(MELAD)
N/A N/A Be available later
6 Metz, D.W. 1996. TheMangroves of Kiribati: AnInventory, Feasibility andManagement Study. Vol 1.Prepared for AgricultureDivision, MNRD, Republicof Kiribati by USDA ForestService in collaborationwith South Pacific ForestryDevelopment Programme(FAO/UNDP/RAS/92/361)Suva, Fiji. Unpublished.
Mangroves on four islands inKiribati
1995 This working paper is oneof a series of publicationsprepared during the course(1992 – 96) of the UNDP/FAO South Pacific ForestryDevelopment Programme.This is also one of the firstcomprehensive study onmangroves undertaken inKiribati. This figure may beslightly on the lower side,since the extent of mangrovesfound in many small islandsis not available.
14.3 DataTable 14a
Forest plan type Forest area 2010 (000 ha)
Forest area with management plan 0.258
... of which for production N/A
... of which for conservation N/A
Table 14b
Indicate which (if any) of the following are required in forest management plans in your country
1 Soil and water management
2 High conservation value forest delineation

FRA 2015 – Country Report, Kiribati
61
3 Social considerations community involvement
Table 14c
Percent of area under forest management plan that is monitored annually N/A
Tiers
Category Tier for status
Forest area with management plan Tier 1
Percent of area under forest management plan that is monitoredannually
N/A
Tier criteria
Category Tier for status
Forest area with management plan Tier 3 : Reports that describe national records 5 years old or lessthat contain long-term forest monitoring plans Tier 2 : Industryor other records indicating the presence of a long-term forestmanagement plan Tier 1 : Other
Percent of area under forest management plan that is monitoredannually
Tier 3 : Government documentation of monitoring extent Tier 2: Reports from forest managers or other documental sources Tier1 : Other
14.4 Comments
Category Comments
Forest area with management plan Mangrove management plan has been completed since 1997 butthis plan is yet to be fully implemented at national level.
N/A N/A
N/A N/A
Other general comments

FRA 2015 – Country Report, Kiribati
62
15. How are stakeholders involved in the management decision making for publiclyowned forests?Documents for this question:
• Guide for country reporting FRA 2015• FRA 2015 Terms and Definitions
15.1 Categories and definitions
Category Definition
Stakeholder involvement Stakeholder involvement is defined as significant inputs into at least one aspect of forest management atthe operational scale
Table 15
Please indicate the type of stakeholder involvement in forest management decision making required in your country
1. Planning phase
2. Operations phase
3. Review of operations
Tiers
Category Tier for status
Type of stakeholder inputs N/A
Tier criteria
Category Tier for status
Type of stakeholder inputs Tier 3 : Government (national or sub-national) documentation ofstakeholder inputs Tier 2 : Government (national or subnational)requirement but stakeholder inputs not documented Tier 1 :Other
15.2 Comments
Category Comments
N/A N/A
N/A N/A
N/A N/A
Other general comments

FRA 2015 – Country Report, Kiribati
63
16. What is the area of forest under an independently verified forest certification scheme?Documents for this question:
• Guide for country reporting FRA 2015• FRA 2015 Terms and Definitions
16.1 Categories and definitions
Category Definition
FSC certification Forest area certified under the Forest Stewardship Council certification scheme
PEFC certification Forest area certified under the Programme for the Endorsement of Forest Certification scheme
Other international forestmanagement certification
Forest area certified under an international forest management certification scheme with publishedstandards and is independently verified by a third-party, excluding FSC and PEFC certification.
Certified forest areausing a domestic forestmanagement certificationscheme
Area certified under a forest management certification scheme with published standards that arenationally recognized and independently verified by a thirdparty
16.2 DataTable 16a
Forest area (000 ha)International forest
management certification2000 2001 2002 2003 2004 2005 2006
FSC 0 0 0 0 0 0 0
PEFC 0 0 0 0 0 0 0
Other 0 0 0 0 0 0 0
2007 2008 2009 2010 2011 2012
FSC 0 0 0 0 0 0
PEFC 0 0 0 0 0 0
Other 0 0 0 0 0 0
Table 16b
Forest area (000 ha)Domestic forest
management certification2000 2001 2002 2003 2004 2005 2006
N/A 0 0 0 0 0 0 0
N/A 0 0 0 0 0 0 0
N/A 0 0 0 0 0 0 0

FRA 2015 – Country Report, Kiribati
64
2007 2008 2009 2010 2011 2012
0 0 0 0 0 0
0 0 0 0 0 0
0 0 0 0 0 0
Tier criteria
Category Tier for status
International forest management certification Tier 3: International forest management scheme recordsmaintained by the certifying organization for the reporting yearTier 2: International forest management scheme records reportedby the certifying organization for a period 2 years prior to thereporting year Tier: 1 Other
Domestic forest management certification Tier 3: National registry reports for domestic forest managementcertification maintained by the certifying organization for thereporting year Tier 2: Domestic forest management schemerecords reported by the certifying organization for a period 2years prior to the reporting year Tier: 1 Other
Tiers
Category Tier for status
International forest management certification N/A
Domestic forest management certification N/A
16.3 Comments
Category Comments related to data definitions etc
Certified forest area using an international forest managementcertification scheme
N/A
Domestic forest management certification N/A
Other general comments

FRA 2015 – Country Report, Kiribati
65
17. How much money do governments collect from and spend on forests?Documents for this question:
• Guide for country reporting FRA 2015• FRA 2015 Terms and Definitions
17.1 Categories and definitions
Category Definition
Forest revenue All government revenue collected from the domestic production and trade of forest products andservices. For this purpose revenue include:• Goods : roundwood; sawnwood; biomass; woodbased panels; pulp and paper and non-wood forest
products.• Services : including concession fees and royalties, stumpage payments, public timber sales revenue
taxes and charges based on forest area or yield, taxes on domestic trade and export of forest products,special levies on forestry activities and payments into forest related funds, other miscellaneousinspection, licence and administrative fees levied by forest administrations, permit and licence feesfor recreation and other forest related activities.
Public expenditure onforestry
All government expenditure on forest related activities.
17.2 National data
17.2.1 Data sources
References to sourcesof information
Variables Years Additional comments
1 Agriculture and LivestockDepartment
First and second half of year(Progress report)- MinistryOperational Plan (MOP)
2000 N/A
2 Kiribati Handicraft LocalProduce
N/A N/A Data has not been centralizedand consolidated thuseverything is scattered aswell. However rough figuresof annual revenue earnedfrom handicrafts
3 Other sources N/A N/A Some information obtainedfrom home and neighbouringfamilies and colleagues in theoffice.
4 Women’s Handicraftcommunity
N/A N/A No concrete data to refer to
17.3 DataTable 17
Revenues / expenditures (000 local currency)Category
2000 2005 2010
Forest revenue 3 9 N/A
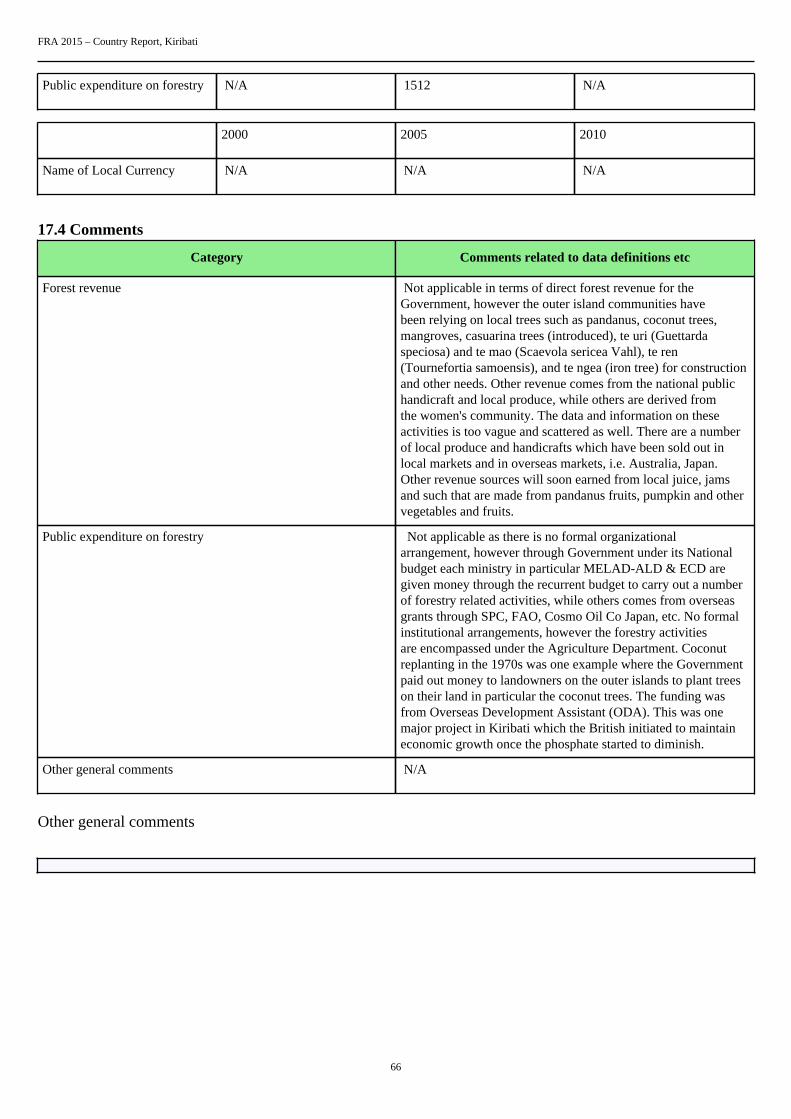
FRA 2015 – Country Report, Kiribati
66
Public expenditure on forestry N/A 1512 N/A
2000 2005 2010
Name of Local Currency N/A N/A N/A
17.4 Comments
Category Comments related to data definitions etc
Forest revenue Not applicable in terms of direct forest revenue for theGovernment, however the outer island communities havebeen relying on local trees such as pandanus, coconut trees,mangroves, casuarina trees (introduced), te uri (Guettardaspeciosa) and te mao (Scaevola sericea Vahl), te ren(Tournefortia samoensis), and te ngea (iron tree) for constructionand other needs. Other revenue comes from the national publichandicraft and local produce, while others are derived fromthe women's community. The data and information on theseactivities is too vague and scattered as well. There are a numberof local produce and handicrafts which have been sold out inlocal markets and in overseas markets, i.e. Australia, Japan.Other revenue sources will soon earned from local juice, jamsand such that are made from pandanus fruits, pumpkin and othervegetables and fruits.
Public expenditure on forestry Not applicable as there is no formal organizationalarrangement, however through Government under its Nationalbudget each ministry in particular MELAD-ALD & ECD aregiven money through the recurrent budget to carry out a numberof forestry related activities, while others comes from overseasgrants through SPC, FAO, Cosmo Oil Co Japan, etc. No formalinstitutional arrangements, however the forestry activitiesare encompassed under the Agriculture Department. Coconutreplanting in the 1970s was one example where the Governmentpaid out money to landowners on the outer islands to plant treeson their land in particular the coconut trees. The funding wasfrom Overseas Development Assistant (ODA). This was onemajor project in Kiribati which the British initiated to maintaineconomic growth once the phosphate started to diminish.
Other general comments N/A
Other general comments

FRA 2015 – Country Report, Kiribati
67
18. Who owns and manages the forests and how has this changed?Documents for this question:
• Guide for country reporting FRA 2015• FRA 2015 Terms and Definitions
18.1 Categories and definitions
Category Definition
Public ownership Forest owned by the State or administrative units of the public administration or by institutions orcorporations owned by the public administration.
...of which owned by thestate at national scale(sub-category)
Forest owned by the State at the national scale or administrative units of the public administration or byinstitutions or corporations owned by the public administration.
...of which owned by thestate at the sub-nationalgovernment scale (sub-category)
Forest owned by the State at the sub-national government scale or administrative units of the publicadministration or by institutions or corporations owned by the public administration.
Private ownership Forest owned by individuals, families, communities, private cooperatives corporations and otherbusiness entities, private, religious and educational institutions, pension or investment funds, NGOs,nature conservation associations and other private institutions.
...of which individuals(sub-category)
Forest owned by individuals and families.
...of which privatebusiness entities andinstitutions (sub-category)
Forest owned by private corporations cooperatives companies and other business entities as well asprivate nonprofit organizations such as NGOs nature conservation associations, and private religiousand educational institutions etc.
...of which local tribal andindigenous communities(sub-category)
Forest owned by a group of individuals belonging to the same community residing within or in thevicinity of a forest area or forest owned by communities of indigenous or tribal people The communitymembers are coowners that share exclusive rights and duties and benefits contribute to the communitydevelopment.
Unknown ownership Forest area where ownership is unknown includes areas where ownership is unclear or disputed.
Categories related tomanagement rights
of public forestsDefinition
Public Administration The Public Administration (or institutions or corporations owned by the Public Administration) retainsmanagement rights and responsibilities within the limits specified by the legislation.
Individuals households Forest management rights and responsibilities are transferred from the Public Administration toindividuals or households through long-term leases or management agreements.
Private companies Forest management rights and responsibilities are transferred from the Public Administration tocorporations, other business entities private cooperatives, private nonprofit institutions and associations,etc., through long-term leases or management agreements.
Communities Forest management rights and responsibilities are transferred from the Public Administration to localcommunities (including indigenous and tribal communities) through long-term leases or managementagreements.
Other form ofmanagement rights
Forests for which the transfer of management rights does not belong to any of the categories mentionedabove.
18.2 National data
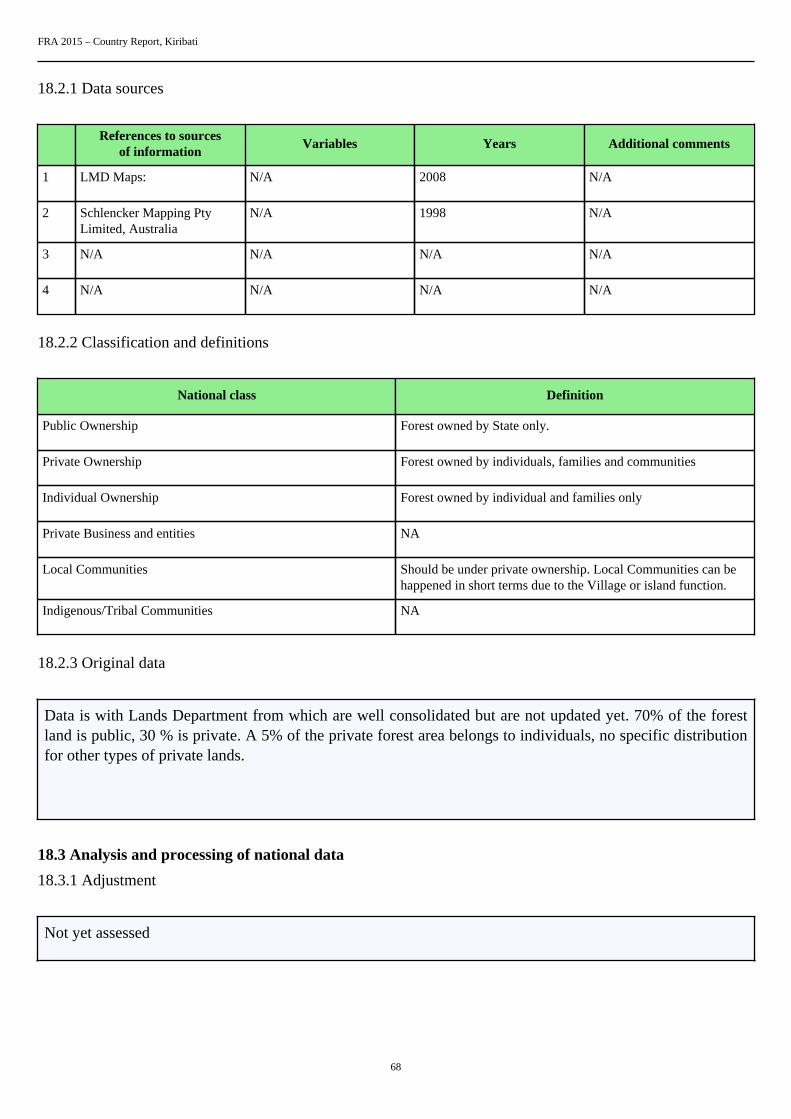
FRA 2015 – Country Report, Kiribati
68
18.2.1 Data sources
References to sourcesof information
Variables Years Additional comments
1 LMD Maps: N/A 2008 N/A
2 Schlencker Mapping PtyLimited, Australia
N/A 1998 N/A
3 N/A N/A N/A N/A
4 N/A N/A N/A N/A
18.2.2 Classification and definitions
National class Definition
Public Ownership Forest owned by State only.
Private Ownership Forest owned by individuals, families and communities
Individual Ownership Forest owned by individual and families only
Private Business and entities NA
Local Communities Should be under private ownership. Local Communities can behappened in short terms due to the Village or island function.
Indigenous/Tribal Communities NA
18.2.3 Original data
Data is with Lands Department from which are well consolidated but are not updated yet. 70% of the forestland is public, 30 % is private. A 5% of the private forest area belongs to individuals, no specific distributionfor other types of private lands.
18.3 Analysis and processing of national data
18.3.1 Adjustment
Not yet assessed

FRA 2015 – Country Report, Kiribati
69
18.3.2 Estimation and forecasting
Increase due to increase private ownership, however due to population increase forest ownership will decrease.
18.3.3 Reclassification
18.4 DataTable 18a
Forest area (1000 hectares)Categories
1990 2000 2005 2010
Public ownership 8.505 8.505 8.505 8.505
... of which ownedby the state atnational scale
N/A N/A N/A N/A
... of which ownedby the state atthe sub-nationalgovernment scale
N/A N/A N/A N/A
Private ownership 3.645 3.645 3.645 3.645
... of which ownedby individuals
0.182 0.182 0.182 0.182
... of which ownedby private businessentities andinstitutions
N/A N/A N/A N/A
... of which ownedby local, tribaland indigenouscommunities
0 0 0 0
Unknownownership
0 0 0 0
TOTAL 12.15 12.15 12.15 12.15
Tiers
Category Tier for status Tier for reported trend
Public ownership Tier 1 Tier 1
Private ownership Tier 1 Tier 1
Unknown ownership Tier 1 Tier 1

FRA 2015 – Country Report, Kiribati
70
Tier criteria
Category Tier for status Tier for reported trend
Ownership Tier 3: National forestry statistics registersof land titles or maps on land ownershipor all forest area under one ownershipcategory that is five years old or less. Tier2:National forestry statistics registers ofland titles or maps on land ownership orquestionnaires that are more than fiveyears old. Tier 1: Other
Tier 3 : Estimate based on repeatedcompatible tiers 3 (tier for status) Tier 2 :Estimate based on repeated compatible tier2 or combination tier 3 and 2 or 1 (tier forstatus) Tier 1 : Other
Table 18b - Holder of management rights of public forests
Forest area (000 hectares)Categories
1990 2000 2005 2010
Public Administration N/A N/A N/A N/A
Individuals N/A N/A N/A N/A
Private companies N/A N/A N/A N/A
Communities N/A N/A N/A N/A
Other N/A N/A N/A N/A
TOTAL .00 .00 .00 .00
Category Tier for reported trend Tier for status
Public Administration N/A N/A
Individuals N/A N/A
Private companies N/A N/A
Communities N/A N/A
Other N/A N/A
18.5 Comments
CategoryComments related todata definitions etc
Comments on the reported trend
Public ownership Government land areas mainly in the Lineand Phoenix Islands
Includes littoral forest and mangrovesareas.

FRA 2015 – Country Report, Kiribati
71
Private ownership The forest percent coverage is 30%due to very small land area of each ofthe islands of which owned by privateowners Applicable for lands ownedby individuals. It also applicable to anindividual who buys/lease land frompublic Administration
Include coconut plantations.
Unknown ownership Applicable to lands used by privatecompanies, churches and schools
N/A
Management rights Government have full management right,however on the outer islands and throughthe local Government the private andindividual land owner may have theirmanagement rights. In Butaritari (NorthernPart of Kiribati). Lands and forests are freeto be accessed in special occasions e.g. forcatechist and church purposes
N/A
Other general comments to the table
Data is with Lands Department from which are well consolidated but are not updated yet. 70% of the forest land is public, 30 % isprivate. A 5% of the private forest area belongs to individuals, no specific distribution for other types of private lands.

FRA 2015 – Country Report, Kiribati
72
19. How many people are directly employed in forestry?Documents for this question:
• Guide for country reporting FRA 2015• FRA 2015 Terms and Definitions
19.1 Categories and definitions
Category Definition
Full-time equivalents(FTE)
A measurement equal to one person working full-time during a specified reference period.
Employment in forestry Employment in activities related to production of goods derived from forests. This category correspondsto the ISIC/NACE Rev. 4 activity A02 (Forestry and logging).
19.2 National data
19.2.1 Data sources
References to sourcesof information
Variables Years Additional comments
1 Report on the 2000 Census ofPopulation
2000 Information is sufficient andthe figures given in tablesbelow are based on analysisby this office
N/A
2 2005 Census of Population,Volume 1: Basic Informationand tables
2005 Information is sufficient andthe figures given in tablesbelow are based on analysisby this office
N/A
3 Kiribati 2005 Census,Volume 2: Analytical Report
2005 Information is sufficient andthe figures given in tablesbelow are based on analysisby this office
N/A
4 Report on 1990 Census ofPopulation.
1990 Information is sufficient andthe figures given in tablesbelow are based on analysisby this office
N/A
19.2.2 Classification and definitions
National class Definition
N/A N/A
N/A N/A
N/A N/A
N/A N/A

FRA 2015 – Country Report, Kiribati
73
19.2.3 Original data
General data is well consolidated but without specific information on forestry.
19.3 DataTable 19
Employment (000 years FTE)Category
1990 2000 2005 2010
Employment inforestry
N/A N/A N/A N/A
... of which female N/A N/A N/A N/A
19.4 Comments
CategoryComments related todata definitions etc
Comments on the reported trend
Employment in forestry According Statistics figures, out of totalpopulation in 2005 which is 90,000+a portion of it is approximately (69%)involved with primary production only,but not exclusively on forestry.
N/A
Other general comments to the table
N/A

FRA 2015 – Country Report, Kiribati
74
20. What is the contribution of forestry to Gross Domestic Product (GDP)?Documents for this question:
• Guide for country reporting FRA 2015• FRA 2015 Terms and Definitions
20.1 Categories and definitions
Category Definition
Gross value added fromforestry (at basic prices)
This category corresponds to the ISIC/NACE Rev. 4 activity A02 (Forestry and logging).
20.2 DataTable 20 (Pre-filled data from UNdata/EUROSTAT)
Category Million CurrencyYear for latest
available information
Gross value added fromforestry (at basic prices)
N/A N/A N/A
20.3 Comments
Category Comments
N/A N/A
Other general comments

FRA 2015 – Country Report, Kiribati
75
21. What is forest area likely to be in the futureDocuments for this question:
• Guide for country reporting FRA 2015• FRA 2015 Terms and Definitions
21.1 Categories and definitions
Category Definition
Government target/aspiration for forest area
Government target/aspiration for forest area for a specific year.
Forests earmarked forconversion
Forest area that is allocated/classified or scheduled to be converted into non-forest uses.
21.2 National data
21.2.1 Data sources
References to sourcesof information
Variables Years Additional comments
1 N/A N/A N/A N/A
2 N/A N/A N/A N/A
3 N/A N/A N/A N/A
4 N/A N/A N/A N/A
21.3 DataTable 21a
Forest area (000 ha)Category
2020 2030
Government target/aspiration for forestarea
N/A N/A
Table 21b
Forest area (000 ha)Category
2013
Forests earmarked for conversion N/A
21.4 Comments
Category Comments
Government target/aspiration for forest area N/A

FRA 2015 – Country Report, Kiribati
76
Forests earmarked for conversion N/A
Other general comments