kingston hospital nhs foundation trust finance report ... · pdf fileenc g original plan...
TRANSCRIPT
Enc G
Original Plan
£
0
0
0
'
s Var £000's
Kingston Hospital NHS Foundation Trust
Finance Report
February 2016 (Month 11)
A revised annual plan of a £6.1m deficit was submitted to Monitor in September. The analysis in this report is shown against this revised plan. For reference,
the original budget is shown on page 4.
CONTENTS
EXECUTIVE SUMMARY…………………...………………………………………………………………………..………………......3
SECTION 1: OVERALL INCOME AND EXPENDITURE……….…………..……………………………….………….…….…….4
SECTION 2: DIVISIONAL POSITIONS……………....………………………………………….……………………………………5
SECTION 3: COST IMPROVEMENT PROGRAMME ………..…………….……………….……………………………………..10
SECTION 4: INCOME………………………………………...…………………………….…………………………………………..11
SECTION 5: PAY COSTS……....……………………………………………………………………………………….……………..12
SECTION 6: NON PAY COSTS……..……………………………………………….………………………………….…………….15
SECTION 7: STATEMENT OF FINANCIAL POSITION …………..…….…..……………………………………………………..16
SECTION 8: CASH FLOW STATMENT.……..…..…………………………………………………………………………………..17
SECTION 9: DEBTORS………..…………………………….…..……………….…………………………………………..……….18
SECTION 10: CREDITORS…..…………....………………….….……………….…………………………………………..……….19
SECTION 11: CAPITAL …………...……..…………………………………………………………………………………………......21
SECTION 12: FINANCIAL SUSTAINABILITY RISK RATING (FSRR) … …….……………...……………………………..……22
Appendix 1 - INCOME DETAIL ….………………………....………………………..………………..………..……….…………….23
Appendix 2 - ACTIVITY DETAIL …..……..….…………………….……………………………………………..…………….……..24
Appendix 3 - INCOME PENALTIES ………... …….…..….……...…………………….………………………..…………….……..25
Contents

Pg3
EXECUTIVE SUMMARY
Headline
Trend
against
Revised
Plan
Trend
against
Revised
Plan
Narrative
(January) (February)
At the end of M11 the Trust reported a year to date deficit of
£6.5m, which is £0.7m adverse to the revised plan submitted to
Monitor.
The Trust reported an in month deficit of £0.4m. The underlying positive variance on patient care income is £0.1m after removing the
impact of high cost drugs (£0.2m). Other income has improved in month due to additional LDA and research income. There is also non-
recurrent benefits from the release of GRNI and income risk reserves, together totalling £0.7m.
The underlying clinical income favourable variance was £0.1m
of the reported £0.3m patient care income variance (£0.2m of
the reported position related to high cost drugs).
The in-month income is above forecast by £0.3m which includes the benefit of £0.2m of high cost drugs,which is a pass through cost.
Pay and Non Pay Expenditure directly associated with the
delivery of clinical services is over forecast by £1.1m in M11.
Pay is £0.5m adverse in month while Non Pay is overspent by £0.5m. High agency usage due to escalations, specials and winter
pressures are driving the pay increase. Non Pay variances are partly due to high cost drugs (£0.2m) and partly to small clinical supplies
overspends across a large number of service lines.
Corporate Services pay and non pay were £0.2m better than
forecast in M11
The main driver for this is a reduction in agency usage compared to forecast
CIP Delivery stands at 83% YTD and 88% in month.
The CIP programme shortfall remains mainly due to Emergency service lines where only 56% of CIPs have been achieved YTD. All other
divisions are forecasting over 90% achievement.
The Trust is forecasting a deficit of £6.9m.
This is £0.5m higher than the forecast presented to Monitor since Month 8. This movement is mainly due to the junior doctor strikes
reducing activity and incurring additional costs.
At the end of M11, capital expenditure is below forecast.
Capital YTD expenditure is 87% of the revised plan. Equipment and IT delays contribute to the slippage on capital, we expect this
underspend to continue to 31st March 2016
The cash balance reported at the end of M11 was £1.6m.
The closing cash position for January was £1.6m which was a deterioration of £0.3m on the previous month's position. At the time of
producing the report the cash balance was £12.6m.

\\lares\FINANCE.grp\Secure Department Folders\Planning\2015\Reporting\Monthly Position\M11\M11 Finance Report V8 Pg4
£m
SECTION 1: OVERALL INCOME AND EXPENDITURE Version 1
Summary as at the end of Feb-16
IN MONTH YEAR TO DATE
Income & Expenditure
Original Plan
£000's
Revised Plan
Revised Plan v Actuals
Revised plan
£000's Actual £000's Var £000's
Revised Plan v Actuals
Revised plan
£000's Actual £000's Var £000's
Income Patient Care Income
Other Income
203,316
24,506
204,623
24,724
16,814
1,901
17,133
2,049
319
148
186,954
22,832
188,191
24,472
1,236
1,640
Income 227,823 229,347 18,715 19,182 467 209,786 212,662 2,876
Expenditure Pay
Non Pay
(143,006)
(77,641)
(146,690)
(73,549)
(12,279)
(5,937)
(12,431)
(5,899)
(152)
38
(134,422)
(67,549)
(135,451)
(70,115)
(1,029)
(2,566)
Expenditure (220,646) (220,239) (18,216) (18,330) (114) (201,971) (205,566) (3,595)
EBITDA 7,176 9,108 499 852 353 7,815 7,096 (719)
Depreciation and Amortisation
Investment Revenue
Finance Costs
Public Dividend Capital
(9,394)
16
(3,411)
(3,232)
(8,625)
24
(3,347)
(3,228)
(702)
2
(275)
(269)
(741)
1
(275)
(268)
(39)
(1)
1
2
(7,658)
22
(3,071)
(2,959)
(7,591)
20
(3,154)
(2,894)
66
(2)
(83)
65
Total I&E (8,845) (6,068) (746) (431) 315 (5,851) (6,523) (672)
Original Plan
Revised Plan
Plan
Actual
Plan
Actual YTD
EBITDA Margin
EBITDA Achieved
I&E Surplus Margin
3.1%
100.0%
-3.9%
4.0%
100.0%
-2.6%
2.7%
100.0%
-4.0%
4.4%
170.7%
-2.2%
3.7%
100.0%
-2.8%
3.3%
90.8%
-3.1%
2.0
Cumulative Position Against Plan 2015/16
0.0
-2.0
Apr May Jun Jul Aug Sep Oct Nov Dec Jan Feb Mar
-4.0
-6.0
-8.0
-10.0
Actuals 2014/15 Actuals 2015/16 Original Plan 2015/16 Forecast 2015/16

Pg5
SECTION 2: DIVISIONAL POSITIONS
Overview
Summary as at the end of Feb-16
IN MONTH YEAR TO DATE
Income & Expenditure
Revised
Plan
£000's
Revised Plan v Actuals
Revised
plan Actual Var
£000's £000's £000's
Variances
Inc Pay Non Pay Total
Revised Plan v Actuals
Revised
plan Actual Var
£000's £000's £000's
Variances
Non
Inc Pay Pay Total
Clinical Support Services
Emergency Care Specialist Services
(24,692)
14,698 51,496
(2,087)
1,124 4,140
(2,221)
416 3,808
(135)
(709) (332)
18
(109) (29)
(68)
(381) (97)
(85)
(219) (206)
(135)
(709) (332)
(22,596)
13,343 46,804
(23,718)
10,559 45,282
(1,122)
(2,784) (1,522)
274
(226) (365)
(627)
(1,312) (152)
(769)
(1,247) (1,006)
(1,122)
(2,784) (1,522)
Clinical Divisions 41,503 3,178 2,003 (1,175) (120) (546) (510) (1,175) 37,551 32,123 (5,428) (316) (2,091) (3,022) (5,428)
Commercial Director
Corporate Affairs
Finance
Human Resources
Medical Director
Nursing Director
Operations
(2,107)
(3,396)
(4,220)
(1,883)
(425)
(2,175)
(26,024)
(177)
(290)
(304)
(167)
(50)
(242)
(2,168)
(140)
(136)
(279)
(69)
(53)
(254)
(2,190)
36
153
25
98
(3)
(11)
(22)
(3)
12
(4)
(22)
(9)
24 (6)
69
38
57
58
5
96 55
(29)
104
(28)
62
0
(131)
(71)
36
153
25
98
(3)
(11)
(22)
(1,930)
(3,105)
(3,916)
(1,732)
(376)
(1,940)
(23,862)
(1,890)
(2,777)
(3,917)
(1,792)
(310)
(2,043)
(23,203)
40
327
(1)
(60)
66
(103) 658
(10)
62
7
27
38
136 305
88
243
64
(53)
26
194 413
(37)
22
(71)
(34)
2
(433)
(59)
40
327
(1)
(60)
66
(103) 658
Directorates (40,231) (3,397) (3,121) 276 (9) 377 (92) 276 (36,861) (35,933) 928 564 976 (612) 928
Central Income
Other Central Budgets 7,001
836
592
126
971
999
380
872 0
128
468
3
13
249
392
380
872
6,417
709
7,253
3,653
836
2,945 0
399
2,228
11
75
426
642
836
2,945 0
EBITDA 9,108 499 852 353 467 (152) 38 353 7,815 7,096 (719) 2,876 (1,029) (2,566) (719)
Depreciation & Losses
Interest
PDC
(8,625)
(3,323)
(3,228)
(702)
(273)
(269)
(741)
(274)
(268)
(39)
(0)
2
(39)
(0)
2
(7,658)
(3,050)
(2,959)
(7,594)
(3,134)
(2,894)
63
(85)
65
63
(85)
65
Total I&E (6,068) (746) (431) 315 315 (5,851) (6,526) (675) (675)
COMMENTARY
• Income has underperformed in month in Respiratory, T&O, AAU and Specialist outpatients mainly as a result of lower non elective activity. However this is offset by improved income on A&E, Gynaecology, General Surgery and Cardiology. Pay has been overspent within nursing due to escalations and winter pressures being funded through agency. Specials and locum usage in medical has also contributed to this overspend. Non Pay has been overspent in month due laboratory equipment in Pathology, Laproscopic consumables in Anaesthetics and additional consumable usage in A&E due to additional activity.
• Income in corporate areas has improved in both pay and non pay due partly to a faster reduction in agency spend than had been forecast.
• Central Income and Central Budgets includes additional LDA and NMET income recieved in monthof £0.2m. It also includes the £0.5m release of GRNI accruals posted into the I&E as
per the recovery plan. The income risk was also reassessed in month given the lower levels of activity and £0.3m was released into the position form central budgets. Both of these were unplanned resulting in a variance.

Pg6
SECTION 2: DIVISIONAL POSITIONS
Clinical Support Services Summary as at the end of Feb-16
IN MONTH YEAR TO DATE
IN MONTH YEAR TO DATE
Income & Expenditure Original
Plan
£000's
Revised
Plan
£000's
Revised Plan v Actuals
Revised
plan Actual Var
£000's £000's £000's
Revised Plan v Actuals
Revised
plan Actual Var
£000's £000's £000's
Service Lines Revised
plan
£000's
Revised Plan v Actuals
Revised
plan Actual
£000's £000's Var £000's
Revised Plan v Actuals
Revised
plan Actual
£000's £000's Var £000's
Patient Care Activ ities
Other
5,360
18,501
5,568
1,534
358
1,564
346
30
(12)
16,903
5,210
16,648
5,739
(255)
529
Anaesthetics, Theatre and DSU
Histopathology
Imaging
Intensive Care Unit
Pathology
Pharmacy
Sterile Services Department
Therapies
(13,335)
(2,242)
(9,388)
(4,945)
(10,615)
(2,582)
(1,545)
(4,109)
(1,100)
(189)
(769)
(417)
(802)
(211)
(129)
(361)
(1,130)
(202)
(802)
(486)
(853)
(195)
(119)
(344)
(30)
(13)
(33)
(69)
(50)
16
10
17
(12,235)
(2,053)
(8,619)
(4,528)
(9,813)
(2,294)
(1,415)
(3,752)
(12,449)
(2,096)
(8,842)
(4,846)
(10,339)
(2,351)
(1,358)
(3,824)
(214)
(44)
(222)
(317)
(526)
(58)
58
(73)
Income 5,360 24,069 1,892 1,910 18 22,113 22,387 274
Expenditure - Pay
Medical & Dental
Nursing & Midwifery
Scientific,Professional & Tech
Admin & Clerical
Other
(9,757)
(7,977)
(3,929)
(1,504)
(9,109)
(9,857)
(7,834)
(4,017)
(1,552)
(9,043)
(814)
(653)
(334)
(126)
(764)
(840)
(704)
(343)
(120)
(750)
(27)
(51)
(9)
6
13
(9,044)
(7,181)
(3,660)
(1,427)
(8,286)
(9,121)
(7,527)
(3,737)
(1,462)
(8,378)
(77)
(346)
(77)
(35)
(92) (48,761) (3,979) (4,131) (152) (44,709) (46,105) (1,396)
Pay (32,275) (32,304) (2,690) (2,758) (68) (29,597) (30,224) (627) Service Lines In Month Variances
Inc Pay Non Pay
YTD Variances
Inc Pay Non Pay Expenditure - Non Pay
Clinical Supplies & Services
Other
(13,164)
(2,838)
(13,457)
(3,000)
(1,058)
(230)
(1,118)
(255)
(60)
(24)
(12,400)
(2,712)
(12,798)
(3,084)
(398)
(371)
Anaesthetics, Theatre and DSU
Histopathology
Imaging
Intensive Care Unit
Pathology
Pharmacy
Sterile Services Department
Therapies
27
(9)
(53)
42
(8)
7
(0)
11
1
3
(30)
(63)
(24)
20
(1)
26
(31)
(15)
(3)
(6)
(26)
(4)
11
(9)
176
(47)
(288)
(155)
402
169
(1)
19
(42)
12
(184)
(237)
(172)
45
(5)
(46)
(173)
(56)
(38)
(81)
(354)
(103)
63
(27)
Non Pay (16,002) (16,457) (1,289) (1,373) (85) (15,112) (15,881) (769)
Expenditure (48,277) (48,761) (3,979) (4,131) (152) (44,709) (46,105) (1,396)
Income Less Direct Costs (42,917) (24,692) (2,087) (2,221) (135) (22,596) (23,718) (1,122)
18 (68) (85) 274 (627) (769)
Income & Expenditure Commentary
• The month 11 position is £135k adverse against the revised plan.
• Patient Care Income is £30k better than forecast and this is driven by the continued increase in activity in ICU in month which has resulted in an overperformance in income against forecast ,. The acuity of patients and therefore the tariff received is still lower than had been planned (organ 1, 2 and 3 supported) ,likely due to the success of the inreach and 24/7 sepsis initiatives.
• Other Income is £12k adverse against the plan in month driven by an adjustment to the invoices to Surbiton Hospital and Surbiton Health Centre as part of the Your
Healthcare service contract.
• Pay is £68k adverse against the revised plan and this is mainly ICU, Radiographers and Radiologists and Pathology. In Imaging additional premium agency costs have been incurred due to the Gynae and thyroid lists being moved to theweekend and out of hours working to accommodate the breast work. Recruitment is underway to recruit permanently into the vacant consultant posts. In Pathology agency costs relating to chemical pathology are driving the adverse variance against forecast but these are chargeable to SWL Pathology and are reflected in other income. In ICU, agency usage to cover 9 wte vacancies is driving the overspend.
• Non Pay is £85k adverse against the revised plan. The adverse position largely lies within Pathology and Anaesthetics . The overspend in Pathology relates to lab equipment
in chemical pathology and the SWL Pathology contract. These are chargeable to SWL Pathology and are reflected in other income. In Anaesthetics the overspend is due to laparoscopic consumables, wound closures, respiratory tubes and masks and medical and surgical equipment .
CIP Commentary • In month, the division achieved £83k (95%) of its
target.
• The main shortfall relates to ceasing the Radiology
SLA with St Georges for junior Doctors (£63k YTD)
Divisional Actions Actions were agreed within ICU, imaging and theatres to include: • Plans to address recruitment to reduce agency
spend
• Reviewing data on consultant productivity with action plans produced
• Review non pay spend within Imaging and
understand the increase in the charge on the managed service contract.
• Develop plan to ring-fence slots for GPs
• Develop plan with theatres to ensure capacity
available and wastage minimised
• Outsource out of hours reporting to expand in house capacity for routine work.
• Agree job plans for Imaging consultants and
recruit into 3 vacant posts which will reduce agency usage from July 2016

Pg7
SECTION 2: DIVISIONAL POSITIONS
Emergency Care Summary as at the end of Feb-16
IN MONTH YEAR TO DATE
IN MONTH YEAR TO DATE
Income & Expenditure Original
Plan
£000's
Revised plan
£000's
Revised Plan v Actuals
Revised
plan Actual
£000's £000's Var £000's
Revised Plan v Actuals
Revised plan Actual Var
£000's £000's £000's
Service Lines
Revised
plan
£000's
Revised Plan v Actuals
Revised
plan Actual
£000's £000's Var £000's
Revised Plan v Actuals
Revised
plan Actual
£000's £000's Var £000's
Patient Care Activ ities
Other
1,347
58,867
1,413
4,745
84
4,751
(31)
6
(114)
53,897
1,329
53,931
1,070
34
(260)
Accident and Emergency
Acute Assessment Unit
Cardiology
Elderly Care
Gastro and Endoscopy
Respiratory
Site management
(9,723)
(5,356)
(8,229)
(13,002)
(5,075)
(3,139)
(1,059)
(785)
(421)
(660)
(1,081)
(412)
(260)
(87)
(823)
(510)
(789)
(1,304)
(494)
(299)
(87)
(38)
(89)
(129)
(223)
(82)
(39)
0
(8,938)
(4,934)
(7,569)
(11,927)
(4,663)
(2,879)
(973)
(9,735)
(5,138)
(8,124)
(12,346)
(5,163)
(2,947)
(989)
(796)
(204)
(555)
(419)
(500)
(67)
(17)
Income 1,347 60,281 4,829 4,720 (109) 55,226 55,000 (226)
Expenditure - Pay
Medical & Dental
Nursing & Midwifery
Scientific,Professional & Tech
Admin & Clerical
Other
(10,557)
(18,603)
(810)
(2,382)
(313)
(12,179)
(20,344)
(809)
(2,191)
(633)
(1,054)
(1,618)
(64)
(182)
(41)
(1,059)
(1,974)
(68)
(192)
(46)
(5)
(356)
(4)
(10)
(5)
(11,125)
(18,732)
(746)
(2,009)
(592)
(11,566)
(19,482)
(789)
(2,019)
(658)
(441)
(750)
(43)
(10)
(66)
(45,583) (3,705) (4,305) (600) (41,883) (44,442) (2,558)
Pay (32,666) (36,156) (2,959) (3,340) (381) (33,203) (34,515) (1,312) Service Lines In Month Variances
Inc Pay Non Pay
YTD Variances
Inc Pay Non Pay Expenditure - Non Pay
Clinical Supplies & Services
Other
(3,023)
(6,457)
(2,836)
(6,591)
(233)
(514)
(317)
(648)
(85)
(134)
(2,604)
(6,076)
(3,025)
(6,902)
(421)
(825)
Accident and Emergency
Acute Assessment Unit
Cardiology
Elderly Care
Gastro and Endoscopy
Respiratory
Site management
143
(64)
122
(150)
(12)
(143)
(3)
(1)
(80)
(18)
(195)
(56)
(31)
0
(37)
(9)
(111)
(28)
(25)
(8)
(0)
358
(226)
148
(234)
(49)
(203)
(20)
(549)
(178)
55
(367)
(270)
(10)
6
(248)
(27)
(610)
(52)
(230)
(58)
(23)
Non Pay (9,479) (9,427) (746) (965) (219) (8,680) (9,927) (1,247)
Expenditure (42,145) (45,583) (3,705) (4,305) (600) (41,883) (44,442) (2,558) Income Less Direct Costs (40,798) 14,698 1,124 416 (709) 13,343 10,559 (2,784)
(109) (381) (219) (226) (1,312) (1,247)
Income & Expenditure Commentary
• The month 11 position is £709k adverse against the revised plan.
• �Patient Care Income is £6k better than the revised plan. A&E activity has been higher than forecast but this is offset by an underperformance in non elective income. Other
income is £114k adverse and this is in elderly care where the commissioners will not be paying for the Geriatritian of the day service. (GOD Service)
• Pay is £381k adverse against plan. This is mainly within the nursing staff group. where escalations and winter pressures including Claremont have been funded through
agency. Specials usage in Hardy ward along with the locum usage in medical staffing in Gastro is driving the pay overspend.
• �Non pay is £219k adverse against the revised plan. This is partly due to high cost drugs (£71k) which are offset by income within Cardiology . In A&E ,the overspend is due
to purchase of medical & surgical supplies reflecting higher activity.
CIP Commentary
The Emergency Services Division achieved 36% of its CIP
target in month.
Underachieving CIPs
• Sleep Apnoea
• ED Case mix / over-performance
• EDOU closure resulted in the loss of CIP's associated
with it.
Divisional Actions
• All ECIST steps are being factored into the transformation plan to
minimise 4 hour breeches going forward.
• Pursue with recruiting into the consultant vacancies within the
Gastro/Endo specialities
• Recruitment to vacant medical posts in progress. with success in
the DD and CoE role will continue with locums in CoE , Stroke and
ACPs while we continue to recruit.
• Matrons to lead on reducing the Specials expenditure through
better management of substantive HCA establishment and
improved assessment of patients.
• Discharge project will be working to reduce LoS along with
employment of Locum CoE consultant against current vacancy.
• Working to ring fence AAU trollies to increase ambulatory care
activity has not yet been successful

IN MONTH YEAR TO DATE
Service Lines Revised
plan
£000's
Revised Plan v Actuals
Revised
plan Actual
£000's £000's Var £000's
Revised Plan v Actuals
Revised
plan Actual
£000's £000's Var £000's
GUM
Gynaecology and Breast
Maternity
Ophthalmology
Oral and ENT
Paediatrics and NNU
Specialist Outpatients
(3,749)
(5,820)
(19,158)
(7,751)
(4,066)
(10,237)
(10,097)
(321)
(496)
(1,595)
(638)
(341)
(890)
(854)
(346)
(514)
(1,567)
(722)
(350)
(907)
(862)
(25)
(18)
28
(84)
(9)
(17)
(7)
(3,428)
(5,305)
(17,563)
(7,114)
(3,725)
(9,347)
(9,243)
(3,410)
(5,215)
(17,324)
(7,457)
(3,778)
(9,390)
(9,508)
17
90
239
(344)
(53)
(43)
(264)
Total Specialist Services (60,878) (5,135) (5,268) (133) (55,726) (56,082) (357)
General Surgery and Urology
Trauma and Orthopaedics
(8,658)
(9,433)
(705)
(810)
(833)
(852)
(128)
(42)
(7,969)
(8,623)
(8,510)
(8,883)
(541)
(260)
Total (78,970) (6,649) (6,953) (303) (72,318) (73,476) (1,157)
Service Lines In Month Variances Inc Pay Non Pay
YTD Variances Inc Pay Non Pay
GUM
Gynaecology and Breast
Maternity
Ophthalmology
Oral and ENT
Paediatrics and NNU
Specialist Outpatients
21
72
18
19
50
41
(60)
3
14
25
(46)
0
(9)
7
(28)
(33)
3
(38)
(10)
(8)
(15)
48
50
(210)
187
228
38
454
20
154
174
(111)
17
(20)
53
(3)
(64)
66
(233)
(70)
(23)
(317)
Total Specialist Services 161 (5) (129) 794 288 (644)
General Surgery and Urology
Trauma and Orthopaedics
62
(252)
(82)
(11)
(47)
(31)
(131)
(1,027)
(366)
(73)
(174)
(187)
Total (29) (97) (206) -365 (152) (1,006)
SECTION 2: DIVISIONAL POSITIONS
Specialist Services Summary as at the end of Feb-16
IN MONTH YEAR TO DATE
Income & Expenditure Original
Plan
£000's
Revised
Plan
£000's
Revised Plan v Actuals
Revised plan Actual Var
£000's £000's £000's
Revised Plan v Actuals
Revised
plan Actual Var
£000's £000's £000's
Income
Patient Care Activities
Other
122,237
4,944
125,420
5,047
10,381
409
10,208
553
0
(172)
144
114,474
4,648
113,726
5,031
(748)
384
Income 127,180 130,466 10,790 10,761 (29) 119,122 118,757 (365)
Expenditure - Pay
Medical & Dental
Nursing & Midwifery
Scientific,Professional & Tech
Admin & Clerical
Other
(20,203)
(25,235)
(1,630)
(5,501)
(1,154)
(20,487)
(25,055)
(1,597)
(5,450)
(1,172)
(1,694)
(2,169)
(141)
(463)
(95)
(1,796)
(2,208)
(140)
(413)
(102)
(102)
(39)
1
49
(6)
(18,793)
(22,902)
(1,457)
(4,988)
(1,077)
(19,445)
(22,593)
(1,416)
(4,805)
(1,109)
(652)
308
41
183
(32)
Pay (53,723) (53,761) (4,561) (4,659) (97) (49,215) (49,367) (152)
Expenditure - Non Pay
Clinical Supplies & Services
Other
(7,686)
(16,262)
(7,616)
(17,593)
(637)
(1,451)
(770)
(1,524)
(133)
(72)
(6,969)
(16,134)
(7,349)
(16,759)
(380)
(625)
Non Pay (23,947) (25,209) (2,088) (2,294) (206) (23,103) (24,108) (1,006)
Expenditure (77,670) (78,970) (6,649) (6,953) (303) (72,318) (73,476) (1,157)
Income Less Direct Costs 49,510 51,496 4,140 3,808 (332) 46,804 45,282 (1,522)
Income & Expenditure Commentary
• The month 11 position is £332k adverse against the revised plan.
• Patient Care Income is £172k adverse against forecast. This is mainly within Trauma and Orthopaedics.
• Pay is £97k adverse against the revised plan. The overspend is mainly within medical staffing with agency usage in Paediatrics due to the shortage in middle grades. and in Ophthalmology.
• Non Pay is £206k adverse against the revised plan. £156k of this relates to clinical supplies mainly within Gynaecology, Surgery , Ophthalmology and Trauma and Orthopaedics. The purchases
are activity driven and there is also an overspend in GUM relating to drugs within tariff.
CIP Commentary
• The division has achieved £0.2m of its target in month
(87%). Schemes not delivering in month mainly relate to:
• T&O - coding of outpatient with procedures and non
pay savings. Although procedure coding is being undertaken by the service this does not secure additional funding. Investigations are being undertaken between the coding, service and commissioning teams to understand this.
Divisional Actions • Understanding from the partnership board
/Epsom Orthopaedics Centre the recovery of the current SWELOC position.
• A review of process in Gynaecology to ensure
maximum utilisation of theatres and DSU has been undertaken. Consultants are signing off theatre lists now and this will drive better utilisation of theatres.
• DNA's are high in Gynae & Breast and the ser vice
have developed an action plan to address the underlying causes .
• The service management are working
collaboratively with theatres to address and resolve some of the under utilisation of theatres. Benefit of this is expected to be seen from March onwards.
• Job plans for Orthopaedics is being reviewed and
will be undertaken by the new CD.
Pg8

Service Lines In Month Variances
Inc Pay Non Pay
YTD Variances
Inc Pay Non Pay
Commercial Director
Corporate Affairs
Finance
Human Resources
Medical Director
Nursing Director
Operations
(3)
12
(4)
(22)
(9)
24
(6)
69
38
57
58
5
96
55
(29)
104
(28)
62
0
(131)
(71)
(10)
62
7
27
38
136
305
88
243
64
(53)
26
194
413
(37)
22
(71)
(34)
2
(433)
(59)
(9) 377 (92) 564 976 (612)
SECTION 2: DIVISIONAL POSITIONS
Corporate Summary as at the end of Feb-16
IN MONTH YEAR TO DATE
FORECAST OUTTURN
IN MONTH YEAR TO DATE
Income & Expenditure Original
Plan
Revised
Plan Revised Plan v Actuals Revised Plan v Actuals Budget v Forecast
Variances Service Lines
Revised Plan Revised Plan v Actuals Revised Plan v Actuals
Revised
Plan Actual Var
Revised
Plan Actual Plan Forecast
Revised
Plan Actual
Revised
Plan Actual
£000's £000's £000's £000's £000's £000's £000's Var £000's £000's £000's Var £000's Inc Pay Non Pay Total £000's £000's £000's Var £000's £000's £000's Var £000's
Commercial Director (2,107) (177) (140) 36 (1,930) (1,890) 40
Patient Care Activities 1,080 1,019 85 85 0 935 955 21 Corporate Affairs (3,396) (290) (136) 153 (3,105) (2,777) 327
Other 5,938 5,921 474 465 (9) 5,439 5,982 544 Finance (4,220) (304) (279) 25 (3,916) (3,917) (1)
Income 7,018 6,940 558 549 (9) 6,373 6,937 564 Human Resources (1,883) (167) (69) 98 (1,732) (1,792) (60)
Expenditure - Pay Medical Director (425) (50) (53) (3) (376) (310) 66
Medical & Dental (1,972) (2,019) (180) (92) 88 (1,848) (1,729) 119 Nursing Director (2,175) (242) (254) (11) (1,940) (2,043) (103)
Nursing & Midwifery (2,369) (2,291) (206) (181) 25 (2,085) (2,045) 40 Operations (26,024) (2,168) (2,190) (22) (23,862) (23,203) 658
Scientific,Professional & Tech (567) (487) (36) (37) (1) (450) (516) (66) (40,231) (3,397) (3,121) 276 (36,861) (35,933) 928
Admin & Clerical (8,659) (10,560) (818) (706) 111 (9,740) (9,375) 365
Other (8,609) (8,936) (809) (655) 154 (8,128) (7,610) 518
Pay (22,176) (24,293) (2,049) (1,671) 377 (22,251) (21,275) 976
Expenditure - Non Pay
Clinical Supplies & Services (439) (567) (51) (49) 1 (515) (534) (19)
Other (21,419) (22,313) (1,856) (1,950) (94) (20,468) (21,061) (593)
Non Pay (21,857) (22,879) (1,907) (1,999) (92) (20,983) (21,595) (612)
Expenditure (44,034) (47,172) (3,955) (3,670) 285 (43,234) (42,870) 364
Income Less Direct Costs (37,016) (40,231) (3,397) (3,121) 276 (36,861) (35,933) 928
Income & Expenditure Commentary
The month 11 position is £276k favourable in month against the revised plan in month. The main areas are explained below:
• Income is (£9k) adverse in month against plan. This is mainly due to reduced Nursery income received in month (£38k)
• Pay is £377k favourable against plan in month. This is driven by Nursing, Commercial, HR, Operations and Finance . This is driven by a rationalisation of Agency use and accruals £157k, Substantive vacancies £193k, Medical staff recharges £24k.
• Non pay is adverse against the revised plan by (£92k) in month. This continues to be driven by Overseas recruitment of Nurses will continue until the end of the year (£56k) and Clinical Equipement and IT (£56k); Estates department postage (£73k) due to a billing backlog;
offset by Corporate Affairs and others £37k.
CIP Commentary
The Corporate Directorate achieved 94% of its CIP
target in month and 96% YTD.
Underachieving CIPs
• Energy Rebate negotiations for £150k rebate are
ongoing.
Divisional Actions
• �Recruiting to vacant posts.
• Finance has almost completed its recruitment drive
which is resulting in a lower agency spend.
• PFI variation model is being developed to forecast
seasonality.
Pg9
Pg10
IN MONTH YEAR TO DATE
Division Annual
Plan £000's
Plan Actual Variance
£000's £000's £000's
Plan Actual Variance
£000's £000's £000's
Emergency Care
Specialist Services
Clinical Support Services
Commercial
Corporate Affairs
Finance
HR
Medical
Nursing
Operations
Central (CNST)
1,338
2,898
1,004
110
191
108
56
19
50
760
2,421
111 41 (70)
229 199 (30)
88 83 (5)
10 7 (2)
19 17 (1)
10 5 (5)
5 4 (0)
2 2 0
4 4 0
58 49 (9)
202 202 0
2,441
1,227 685 (541)
2,672 2,441 (231)
916 854 (62)
100 96 (4)
172 170 (2)
98 95 (2)
51 50 (1)
18 18 (0)
46 46 0
702 579 (124)
2,219 2,219 0
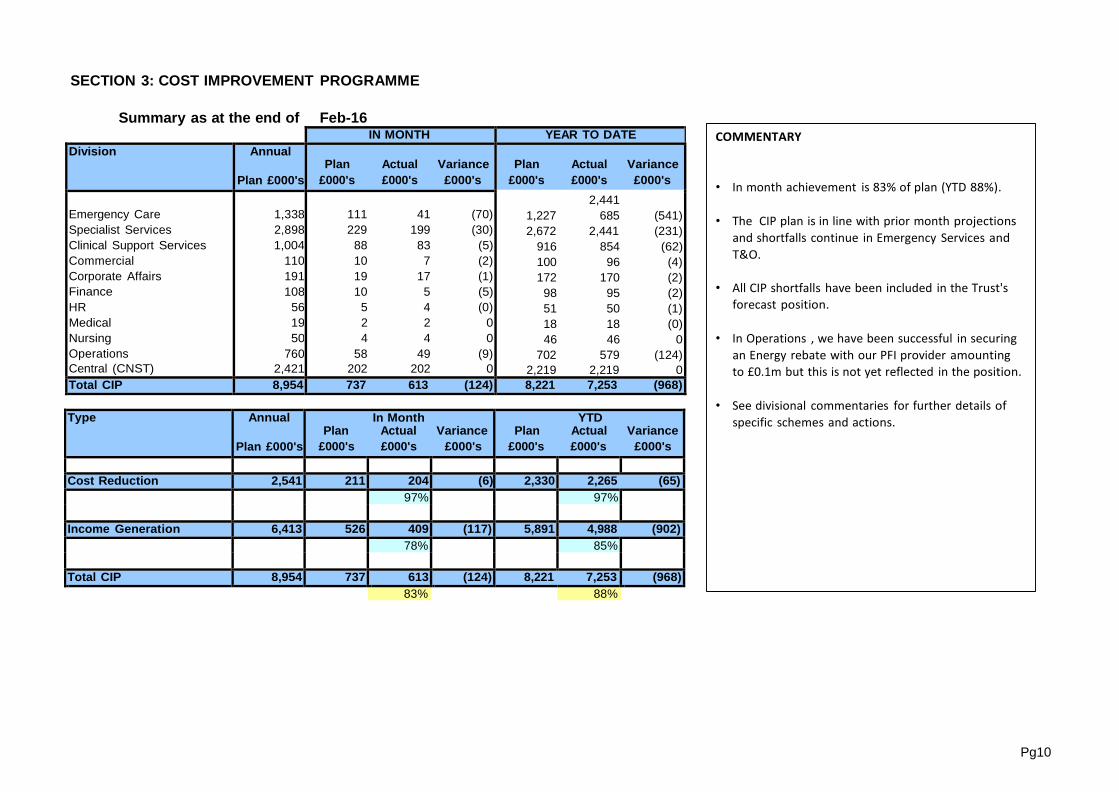
Total CIP 8,954 737 613 (124) 8,221 7,253 (968)
Type Annual
Plan £000's
In Month Plan Actual Variance
£000's £000's £000's
YTD Plan Actual Variance
£000's £000's £000's
Cost Reduction 2,541 211 204 (6) 2,330 2,265 (65)
97% 97%
Income Generation 6,413 526 409 (117) 5,891 4,988 (902)
78% 85%
Total CIP 8,954 737 613 (124) 8,221 7,253 (968)
83% 88%
SECTION 3: COST IMPROVEMENT PROGRAMME
Summary as at the end of Feb-16
COMMENTARY
• In month achievement is 83% of plan (YTD 88%).
• The CIP plan is in line with prior month projections
and shortfalls continue in Emergency Services and
T&O.
• All CIP shortfalls have been included in the Trust's
forecast position.
• In Operations , we have been successful in securing
an Energy rebate with our PFI provider amounting
to £0.1m but this is not yet reflected in the position.
• See divisional commentaries for further details of
specific schemes and actions.
Pg11
Var £000's
I&E YTD (£186.1m)
Billed (£182.8m)
Paid (£175.3m)
Unpaid (£7.5m)
Low Risk(£3.2m)*
Medium Risk(£0.1m)*
Year End Accrual
Billed £7.1m
Paid (£6.6m)
£7.2m Unpaid (£0.4m)
Accrued £0.1m Low Risk(£0m)*
Medium Risk(£0.1m)*
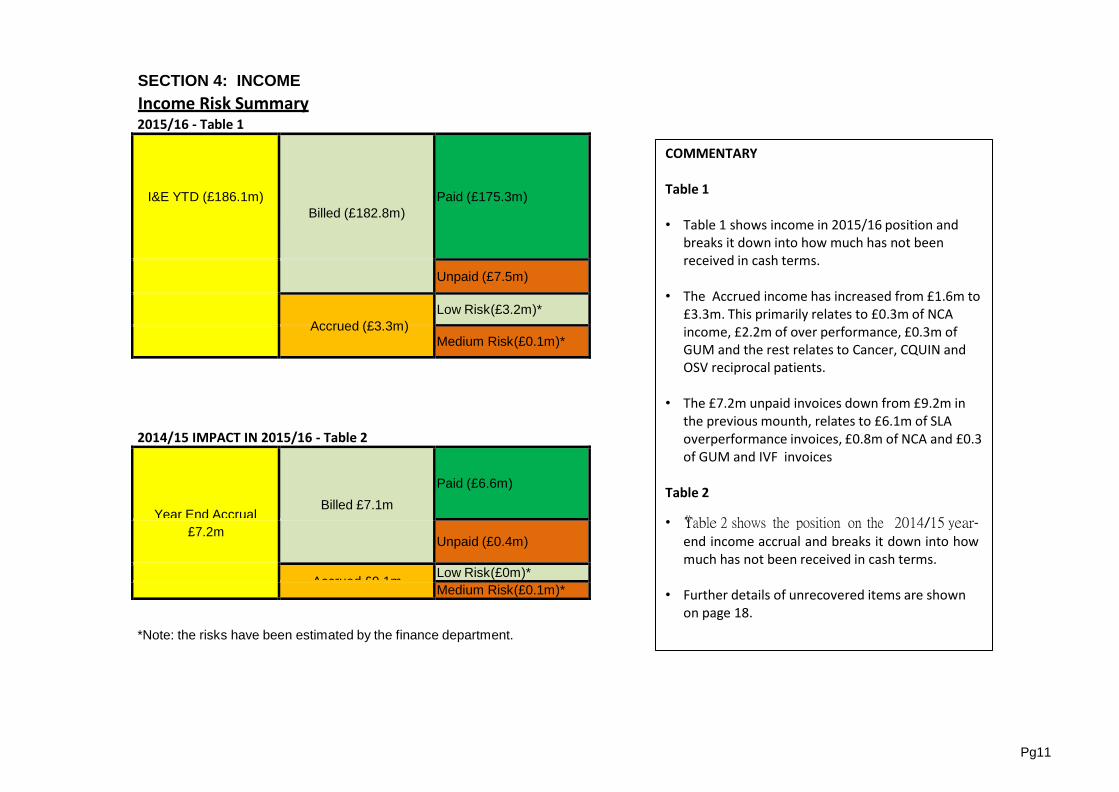
SECTION 4: INCOME
Income Risk Summary 2015/16 - Table 1
Accrued (£3.3m)
COMMENTARY
Table 1
• Table 1 shows income in 2015/16 position and breaks it down into how much has not been received in cash terms.
• The Accrued income has increased from £1.6m to
£3.3m. This primarily relates to £0.3m of NCA income, £2.2m of over performance, £0.3m of GUM and the rest relates to Cancer, CQUIN and OSV reciprocal patients.
2014/15 IMPACT IN 2015/16 - Table 2
*Note: the risks have been estimated by the finance department.
• The £7.2m unpaid invoices down from £9.2m in the previous mounth, relates to £6.1m of SLA overperformance invoices, £0.8m of NCA and £0.3 of GUM and IVF invoices
Table 2
• �Table 2 shows the position on the 2014/15 year-
end income accrual and breaks it down into how much has not been received in cash terms.
• Further details of unrecovered items are shown
on page 18.

Pg12
SECTION 5: PAY COSTS
Costs
Revised Plan
£000's
In Month
Var £000's Actual £000's Variance £000's
Revised Year to Date Plan
£000's Actual £000's Variance £000's
Medical & Dental
Nursing & Midwifery
AHP
Scientific, Professional & Tech
Directors & Managers
Admin & Clerical
Support Staff
(44,542)
(55,523)
(7,902)
(6,910)
(10,052)
(19,832)
(1,837)
(3,742)
(4,645)
(670)
(575)
(884)
(1,594)
(155)
0
(3,788)
(5,067)
(679)
(588)
(728)
(1,435)
(147)
(46)
(422)
(9)
(13)
156
159
9
(40,810)
(50,899)
(7,238)
(6,312)
(9,168)
(18,235)
(1,681)
(41,861)
(51,647)
(7,405)
(6,457)
(8,711)
(17,728)
(1,641)
(1,052)
(748)
(167)
(145)
457
507
41
Total Pay before Central Bud (146,598) (12,266) (12,431) (165) (134,344) (135,451) (1,107)
Reserves & CIP (92) (13) 0 13 (78) 0 78
Total Pay (146,690) (12,279) (12,431) (152) (134,422) (135,451) (1,029)
COMMENTARY
The in-month pay is £0.2m adverse against the revised plan.
The majority of the nursing overspend is due to high usage of agency for escalations during the month with Claremont ward remaining open.
The main adverse variances are in A&E, Elderly Care and AAU.
Admin & Clerical and Managers have performed better as most of the agency posts have been recruited to or discontinued. The agency caps
are also having a positive impact.

Pg13
Qualified
Nursing &
Midwifery
Medical & Dental
Admin and
Estates Staff
Managers
Other
Grand Total
£000's £000 £000 £000 Var £000's £000 £000 £000
Agency
Bank
770
498
396
184
9
103
56
16
Managers
34
-
61
10
1,327
810
Total Current Month 1,268 580 112 72 34 71 2,137
YTD
Agency
Bank
7,324
4,634
3,949
2,170
2,421
1,312
852
129
1,154
- 0
804
137
16,504
8,382
Total YTD 11,957 6,119 3,733 982 1,154 942 24,886
Current
Month
Year To Date
£000 £000
Elderly Care
Accident and Emergency
Trauma and Orthopaedics
Paediatrics and NNU
Gastro and Endoscopy
Other
299
178
90
86
78
596
2,436
1,996
1,071
585
828
9,588
Total 1,327 16,504
SECTION 5: PAY COSTS
Temporary Staffing analysis
Commentary
Total agency as a proportion of pay expenditure
decreased from 11.2% to 10.7% in month, whilst
Bank staff expenditure has increased from 6.0%
to 6.5% of total pay.
Top 5 Agency users
The additional staffing required for winter
escalation is managed through agency, resulting
in the agency spend not decreasing significantly.
Monitor's cap of 10% applies for Q3 and Q4 and
relates to nursing agency as a percentage of
total nursing pay excluding HCA's. In January
this percentage is 15.6%, up from 15.0% in
January.

Pg14
Original Plan
£
0
0
0
'
s Var £000's
Year To Date £000
Elderly Care
Accident and Emergency
General Surgery and Urology
Gastro and Endoscopy
Trauma and Orthopaedics
Others
3,555
2,932
1,236
1,237
1,400
14,526
Total 24,886
£0
00
SECTION 5: PAY COSTS
Costs
2500
2015/16 Bank and Agency Spend
2000
1500
1000
500
0
-500
Admin and Estates Staff Allied Health Professionals Managers Medical And Dental Staff
Qualified Nursing & Midwifery Other Grand Total
Top 5 Agency and Bank Users
Current Month £000
Elderly Care
Accident and Emergency
General Surgery and Urology
Gastro and Endoscopy
Trauma and Orthopaedics
Others
415
208
139
133
132
1,109
Total 2,137

Pg15
SECTION 6: NON-PAY
Non Pay
Revised Plan
£000's
In Month Revised
Plan Actual Variance
£000's £000's £000's
Year to Date Revised
Plan Actual Variance
£000's £000's £000's
Clinical Supplies & Services
Drugs
High Cost Drugs
Transport
Establishment
General Supplies
Other
Premises
PFI
CNST
(24,499)
(4,877)
(12,837)
(1,479)
(1,993)
(1,916)
(2,760)
(7,139)
(12,340)
(4,757)
(1,980)
(248)
(1,192)
(140)
(188)
(145)
(185)
(595)
(1,030)
(396)
(2,262)
(1,387)
(1,192)
(121)
(263)
(126)
(209)
(671)
(1,034)
(397)
(282)
(1,139)
0
20
(75)
19
(24)
(76)
(3)
(1)
(22,508)
(4,477)
(11,792)
(1,345)
(1,801)
(1,689)
(2,575)
(6,550)
(11,310)
(4,361)
(23,743)
(4,165)
(12,866)
(1,230)
(1,875)
(1,925)
(3,069)
(6,982)
(11,277)
(4,367)
(1,235)
312
(1,074)
115
(73)
(236)
(495)
(432)
34
(6)
Non Pay before Central Budgets (74,596) (6,101) (7,662) (1,561) (68,409) (71,500) (3,091)
Reserves 1,047 163 571 408 861 1,385 524
Total Non Pay (73,549) (5,937) (7,091) (1,154) (67,549) (70,115) (2,566)
COMMENTARY
Non Pay is overspent by £1.2m in month or £0.6m after removing the impact of pathology recharges, high cost drugs and one
off GRNI releases from the balance sheet.
The clinical supplies and services overspend in the clinical divisions is driven by specialties such as Gynaecology,
Ophthalmology, Cardiology and General Surgery and Urology where the activity has improved. In Anaesthetics, there is a
continued overspend on laparoscopic consumables and other medical and surgical equipment.

Pg16
2014/15
Audited
£m
January
£m
February
£m
NON CURRENT ASSETS: Property plant and equipment
Intangible assets
Other assets
127.2
6.9
0.2
129.4
7.9
0.3
128.9
7.9
0.3
TOTAL NON CURRENT ASSETS: 134.3 137.6 137.1
CURRENT ASSETS:
Inventories
Trade and other receivables Cash and cash equivalents
0.9
20.4
6.4
0.9
24.3
2.3
0.8
23.9
1.6
TOTAL CURRENT ASSETS 27.7 27.6 26.3
CURRENT LIABILITIES:
Trade and other payables Current Borrowings
Current Provisions
(29.2)
(0.9)
(0.4)
(33.2)
(0.9)
(0.1)
(31.9)
(1.4)
(0.1)
TOTAL CURRENT LIABILITIES (30.5) (34.2) (33.4)
NET CURRENT ASSETS LESS CURRENT
LIABILITIES
(2.8)
(6.6)
(7.1)
TOTAL ASSETS LESS CURRENT LIABILITIES
131.5
131.0
130.0
NON CURRENT LIABILITIES:
Borrowings Provisions Other liabilities
(29.6)
(1.3)
(34.8)
(1.4)
(34.2)
(1.4)
TOTAL ASSETS EMPLOYED 100.6 94.8 94.4
FINANCED BY
TAXPAYERS EQUITY:
Public Dividend Capital
Revaluation reserve
Income and Expenditure Reserve - Prior years Income and Expenditure Reserve - Current year
58.7
25.9
16.0
59.0
25.9
16.0
(6.1)
59.0
25.9
16.0
(6.5)
TOTAL TAXPAYERS EQUITY 100.6 94.8 94.4
SECTION 7: STATEMENT OF FINANCIAL POSITION
COMMENTARY
Non - Current Assets There was a £0.5m decrease in February, comprising £0.2m of additions and £0.7m depreciation.
Current Assets There was a £0.8m decrease in Current Assets in February 2016 comprising: £0.7m decrease in Cash and Cash Equivalents, as analysed in Section 8: Cash Flow Statement and a £0.1m decrease in Inventories.
Current Liabilities The decrease of £0.8m in Current Liabilities in February was largely due to a decrease in non-NHS Accruals which is analysed further in Section 10.

Pg17
January 2015 £m
Surplus/(deficit) after tax 0.1
Non-cash flows in operating surplus/(deficit)
Depreciation and amortisation 0.7
PDC Dividend expense 0.3
Non-cash flows in operating surplus/(deficit) 1.0
Operating Cash flows before movements in working capital 1.1
Increase/(Decrease) in working capital
(Increase) in Inventories 0.1
(Increase) in Trade and other receivables (0.0)
(Decrease) in Current Provisions (0.0)
(Decrease) in Trade and Other payables (1.5)
Increase/(Decrease) in working capital (1.5)
Net cash (outflow) from operating activities (0.4)
Net cash inflow/(outflow) from investing activities
Property Plant and Equipment (0.2)
Intangible assets (0.1)
Other assets 0.0
Net cash inflow/(outflow) from investing activities (0.2)
Net cash inflow/(outflow) from financing activities
PDC Drawdowns 0.0
PDC Dividend paid 0.0
Borrowings (0.1)
Net cash inflow/(outflow) from financing activities (0.1)
Net (decrease) in cash (0.7)
Opening cash 2.3
Closing cash 1.6
SECTION 8: CASH FLOW STATEMENT
Var £000's
COMMENTARY
The closing cash position for February was £1.6m which was £1.7m below the original month 5 forecast. The shortfall in the cash position was primarily attributable to unpaid overperformance invoices from commissioners for Q1 and Q2 totalling £3.0m (Kingston, Richmond and Surrey Downs CCGs). Of this amount, £1.2m has subsequently been paid by Surrey Downs in the first week of March.
The impact of these unpaid amounts was offset in the month by slowing payments to trade creditors (£1.6m at the end of February). Lower than expected receipts from Royal Marsden (£0.2m) and St Georges (£0.3m) were compensated by higher than forecast payments from Local Government organisations for GUM services (£0.2m) and VAT reclaimed from HMRC (£0.2m).

Pg18
SECTION 9: DEBTORS Breakdown of Trade and Other Receivables (SoFP) in £m:
Months Mar-15 Apr-15 May-15 Jun-15 Jul-15 Aug-15 Sep-15 Oct-15 Nov-15 Dec-15 Jan-16 Feb-16
Income Accruals 10.3 10.7 10.1 8.4 9.1 6.5 8.1 10.4 8.2 6.9 5.0 7.1
Aged Debtors (NHS and non NHS) 8.9 10.9 10.2 15.6 13.7 11.0 10.0 9.4 12.8 14.4 16.6 15.7
Prepayments (mainly maintenance) 0.7 1.5 1.4 1.6 1.6 1.7 1.7 2.4 2.3 2.4 1.8 0.9
Other* 0.5 -0.3 0.5 0.1 0.6 -0.2 0.1 (0.3) (0.3) 0.1 0.4 0.2
Total 20.4 22.8 22.2 25.7 25.0 19.0 19.9 21.9 23.0 23.7 23.8 23.9
Total Debt Outstanding
As at 29th February 2016 Up To 30 Da 31 To 60 Days 1 to 90 DayOver 90 DayOverall Total
Feb-16 Jan-16 Dec-15 Total
Total debt at 29th February 2016 9,264 748 1,319 4,162 15,493
60% 5% 9% 27%
Total debt at 31st January 2016 7,214 4,060 218 5,162 16,654
43% 24% 1% 31%
Total debt at 31st December 2015 8,361 298 1,041 4,655 14,354
58% 2% 7% 32%
Commentary
Trade and Other Receivables have increased by £0.1m to £23.9m, the net effect of a £2.1m increase in Income Accruals, a £0.9m decrease in Prepayments and a £0.9m decrease in
Aged Debtors (NHS and non NHS) and a £0.2m decrease in Other Debtors.
Aged debtors decreased from £16.6m to £15.7m in month. Within this total, the current (<30 day) debt increased by £2.1m, debt from 31-60 days decreased by £3.3m, 61-90 day
debt increased by £1.1m and debt over 90 days decreased by £1.0m. Within these categories the significant movements were:-
• Invoices issued to CCGs at the end of January for the cumulative freeze position at Month 8 totalling £1.8m remain unpaid but remain in the 0-30 days bucket due to the short
length of February
• Richmond CCG paid £0.5m for Q1 & Q2 2015/16 overperformance reducing 31-60 days debt
• Merton CCG paid £0.2m over-performance invoices reducing 31-60 days debt
• Payments of £0.3m from Barking Havering & Redbridge NHST and £0.3m from BMI Healthcare both reduced over 90 days debt
The increase of £2.1m in income accruals relates mainly to month 9 overperformance. The £0.9m decrease in Prepayments was largely due to a £0.4m decrease in the CNST
prepayment, a £0.2m decreasein the AAH prepayment and a £0.1m decrease in the Business Rates prepayment
*Other includes the Provision of Irrecoverable Debts, Recoverable VAT and Other Debtors all due within one year.
Pg19
SECTION 10: CREDITORS
Description Aug-15 Sep-15 Oct-15 Nov-15 Dec-15 Jan-16 Feb-16
NHS Accruals (2.3) (2.4) (2.6) (2.5) (3.3) (3.1) (3.4)
Non NHS Accruals (14.0) (13.0) (11.8) (12.6) (10.6) (10.1) (8.8)
Capital Accruals (2.7) (2.4) (2.6) (2.2) (2.2) (2.4) (2.1)
System GRNI Accruals (2.9) (3.2) (3.2) (2.5) (1.8) (6.3) (1.8)
Deferred Income (3.6) (2.6) (4.6) (3.6) (2.6) (3.8) (3.1)
Trade Creditors (2.7) (5.9) (1.9) (3.1) (6.1) (6.3) (6.6)
Income Tax and PDC Due Within 1 Yr (4.4) (4.5) (4.5) (4.6) (4.6) (4.6) (4.7)
Others including Provisions, PFI and Finance Leases (2.8) (1.2) (1.4) (1.7) (2.1) (2.4) (2.9)
Total (35.4) (35.2) (32.7) (32.8) (33.3) (34.2) (33.4)
Commentary
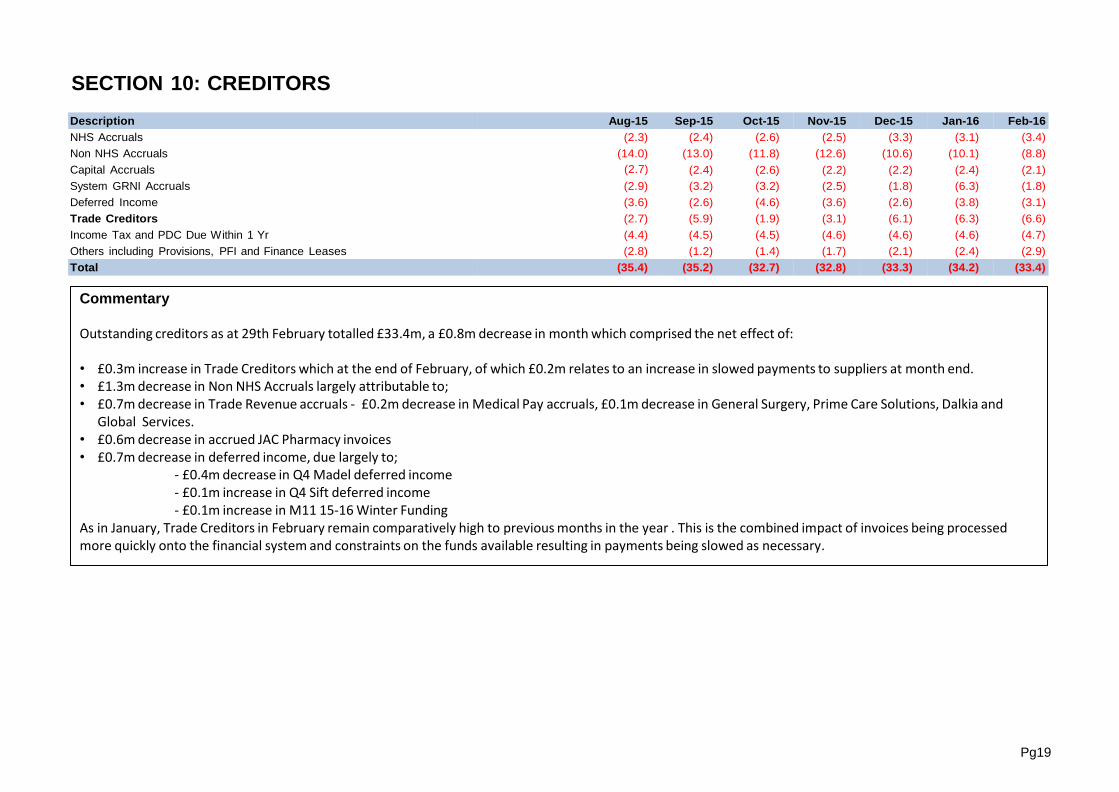
Outstanding creditors as at 29th February totalled £33.4m, a £0.8m decrease in month which comprised the net effect of:
• £0.3m increase in Trade Creditors which at the end of February, of which £0.2m relates to an increase in slowed payments to suppliers at month end. • £1.3m decrease in Non NHS Accruals largely attributable to; • £0.7m decrease in Trade Revenue accruals - £0.2m decrease in Medical Pay accruals, £0.1m decrease in General Surgery, Prime Care Solutions, Dalkia and
Global Services. • £0.6m decrease in accrued JAC Pharmacy invoices • £0.7m decrease in deferred income, due largely to;
- £0.4m decrease in Q4 Madel deferred income - £0.1m increase in Q4 Sift deferred income - £0.1m increase in M11 15-16 Winter Funding
As in January, Trade Creditors in February remain comparatively high to previous months in the year . This is the combined impact of invoices being processed more quickly onto the financial system and constraints on the funds available resulting in payments being slowed as necessary.
Pg20
SECTION 10: CREDITORS (BETTER PAYMENTS PRACTICE CODE)
Original Plan
£000's Var £000's
Commentary
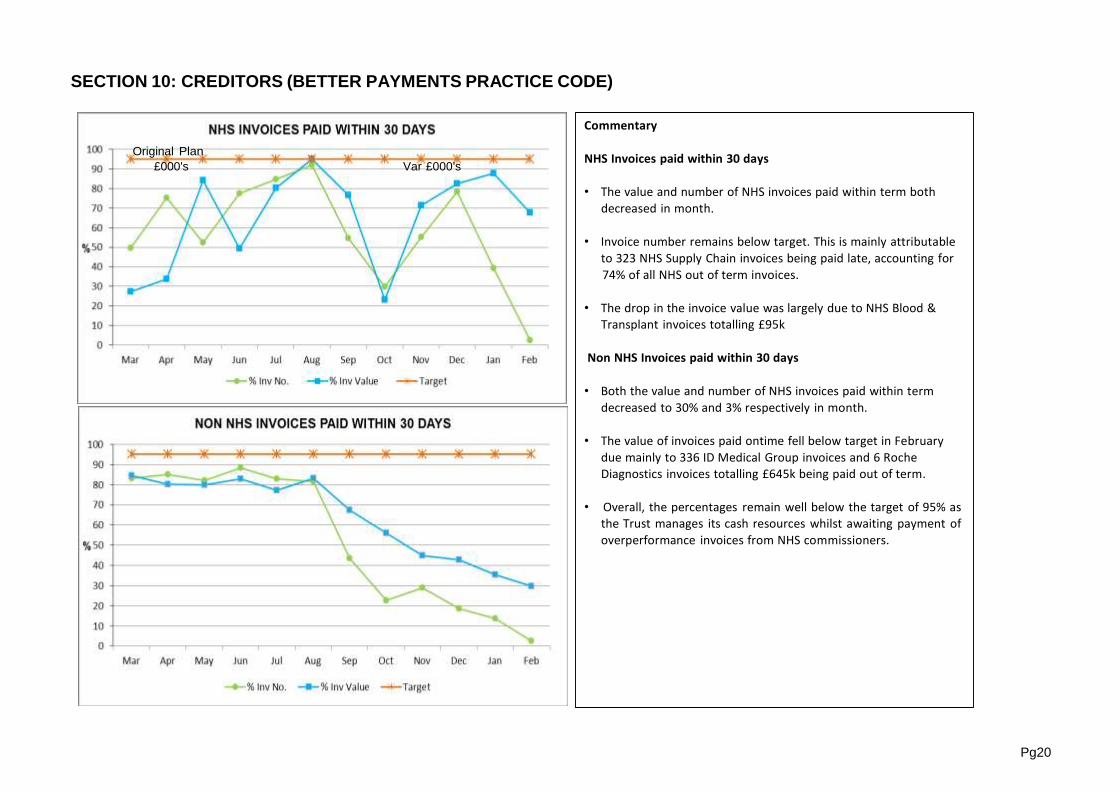
NHS Invoices paid within 30 days
• The value and number of NHS invoices paid within term both
decreased in month.
• Invoice number remains below target. This is mainly attributable
to 323 NHS Supply Chain invoices being paid late, accounting for
74% of all NHS out of term invoices.
• The drop in the invoice value was largely due to NHS Blood &
Transplant invoices totalling £95k
Non NHS Invoices paid within 30 days
• Both the value and number of NHS invoices paid within term
decreased to 30% and 3% respectively in month.
• The value of invoices paid ontime fell below target in February
due mainly to 336 ID Medical Group invoices and 6 Roche Diagnostics invoices totalling £645k being paid out of term.
• Overall, the percentages remain well below the target of 95% as
the Trust manages its cash resources whilst awaiting payment of
overperformance invoices from NHS commissioners.

Pg21
2015/16
Capital
Budget
£000
YTD
Revised
Plan
£000
YTD Spend
£000
YTD
Variance
£000
Annual Plan
£000
Updated
Plan
£000
Variance to
Revised
Plan
£000
ESTATES MAINTENANCE 3,130 1,659 1,453 206 3,130 1,772 1,358
5,972 971 5,133 538 5,972 5,773 199
EQUIPMENT TOTAL 927 971 490 481 927 927 -
IT TOTAL 3,570 3,234 3,113 121 3,570 3,253 317
Others 550 286 51 235 550 550 -
TOTAL CAPITAL PROGRAMME 14,149 11,821 10,240 1,581 14,149 12,275 1,874
SECTION 11: CAPITAL
COMMENTARY
•Cumulative to Month 11, the Trust spent £10.2m. This is
£1.6m below the Trust’s updated plan capital programme of £11.8m.
• Equipment spend is below updated plan by £0.49m. A&E
& ITU monitoring machines (£560k) scheduled for November have not arrived yet.
• IMT is £0.1m underspent. Delays in commencement of
SSD Track and Trace (£130k), Server Replacement (£134k) and PC and Mobile Replacement (£41k) were the main reasons for this underspend .
• Estates Strategy is £0.5m underspent at M11 .
Outpatients is £557k behind plan. The revised costs for 2015/16 are currently been reviewed but some slippage into 2016/17 is expected.
• Estates Maintenance is underspent by £0.2m, due to
delays in the commencement of Nurse Call Esher Wing (£22k) and slippage in Pipework Replacement Phase II (£73k) and Electrical Distribution Boards (£56k). These slippages are expected to be corrected before year end.
• Others relates to Nursing Tech Fund and Charity Funded
capital projects.

Weight
25%
25%
25%
25%
4
2.50
-
1%
0%
3
1.75
- 7.00
0%
-1%
2
1.25
- 14.00
-1%
-2%
1
<1.25
<-14
<=-1
<=-2
100%
15/16 15/16 15/16 15/16 15/16 15/16 15/16 15/16 15/16 15/16 15/16 15/16
Heading M1 M2 M3 M4 M5 M6 M7 M8 M9 M10 M11 M12
Capital Servicing Capacity
Liquidity
I&E Margin - Underlying performance
I&E Margin - Variance from plan
0.5
(5.1)
(4.5%)
0.0%
0.7
(6.4)
(4.0%)
0.0%
0.9
(8.0)
(3.1%)
0.0%
1.2
(4.5)
(2.3%)
0.0%
0.7
(8.9)
(4.0%)
0.0%
0.8
(11.5)
(3.8%)
(0.0%)
1.0
(11.3)
(3.1%)
0.0%
1.0
(8.7)
(2.9%)
(0.3%)
0.8
(12.2)
(3.6%)
(0.6%)
1.0
(12.1)
(3.1%)
(0.5%)
1.5
(12.7)
(1.6%)
1.2%
13/14 13/14 13/14 13/14 13/14 13/14 13/14 13/14 13/14 13/15 13/16 13/17
Heading M1 M2 M3 M4 M5 M6 M7 M8 M9 M10 M11 M12
Capital Service Cover
Liquidity
I&E Margin - Underlying performance
I&E Margin - Variance from plan
1
3
1
4
1
3
1
4
1
2
1
4
1
3
1
4
1
2
1
4
1
2
1
3
1
2
1
4
1
2
1
3
1
2
1
3
1
2
1
3
2
2
1
4
Capital Servicing Capacity
SECTION 12: FINANCIAL SUSTAINABILITY RISK RATING (FSRR) Liquidity
I&E Margin - Underlying performance
I&E Margin - Variance from plan
2.50
2.00
1.50
1.00
0.50
0.00
Capital Servicing Capacity Liquid ratio
I&E Margin Actual I&E Margin Variance From Plan
Weighted average FSRR 2.25 2.25 2.00 2.25 2.00 1.75 2.00 1.75 1.75 1.75 2.25 0.00 Rounded Weighted average COSR 2.00 2.00 2.00 2.00 2.00 2.00 2.00 2.00 2.00 2.00 2.00 0.00
COMMENTARY
Our FSRR rating for month 11 is a 2. This is driven by a variance from plan of 1%
Pg22

Pg23
Appendix 1: INCOME DETAIL
Income Summary
Income
Revised Plan
£000's
Revised In Month
Actual Var
£000's £000's
Revised Year to Date
Plan Actual Variance
£000's £000's £000's
Patient Care Activities - CCG
RTA\OSV
Private Patients
Other Patient Care Income
202,405
645
460
1,113
16,634
54
40
86
16,988
30
28
86
355
(24)
(12)
(0)
184,931
592
405
1,027
186,134
537
369
1,151
1,203
(55)
(36)
124
Total Patient Care Income 204,623 16,814 17,133 319 186,954 188,191 1,236
Education
BMI
Provider to Provider
Other
8,069
2,142
4,284
10,228
653
172
344
731
692
168
441
749
39
(4)
97
17
7,426
1,970
3,940
9,496
8,263
1,932
4,067
10,209
837
(37)
128
712
Total Income 229,347 18,715 19,182 467 209,786 212,662 2,876
COMMENTARY
Patient care income has improved due to the reassessment of income risk.
Other income shows a favourable variance as additional LDA income recieved from HESL.

Pg24
Appendix 2: ACTIVITY DETAIL
Patient Care Activity
Activity
Revised Plan
In Month Spells / Attendances
Revised Plan Variance
Year to Date Spells / Attendances
Revised Plan Actual Variance
Elective Day
Cases Non
Elective Out
Patients A&E
Critical Care
Direct Access
3,964
23,953
26,028
364,424
111,424
9,216
2,858,356
330
1,996
2,169
30,369
9,285
768
238,196
332
2,005
2,135
34,045
9,368
690
229,373
2
9
(34)
3,676
83
(78)
(8,824)
2,973
17,965
19,521
273,318
83,568
6,912
2,143,767
3,519
21,535
24,994
369,248
102,315
8,964
2,604,615
546
3,570
5,473
95,930
18,747
2,052
460,847
Patient Care Income
Income Revised
Plan £000's
Revised In Month
Plan £000's Actual £000's Var £000's
Revised Year to Date
Plan £000's Actual £000's Variance £000's
Elective Day
Cases Non
Elective
Non Elective Threshold
Readmissions
Out Patients
A&E
Critical Care
Direct Access
High Cost Drugs
Non Elective - Maternity Pathway
Out Patients - Maternity Pathway
Other
CQUIN
8,892
19,333
52,300
0
(1,627)
46,408
12,632
9,014
8,250
12,817
12,391
18,058
3,937
779
1,686
4,259
0
(133)
4,018
923
682
684
1,050
1,033
962
362
328
720
1,646
3,958
0
(132)
3,842
1,089
708
683
1,192
1,012
1,002
951
318
(59)
(40)
(301)
0
0
(177)
166
26
(1)
142
(21)
40
589
(10)
17,667
47,829
0
(1,494)
42,228
11,528
8,276
7,522
11,769
12,369
11,326
12,302
3,609
7,803
17,385
46,909
0
(1,529)
41,654
11,999
8,165
7,312
12,814
12,242
11,163
6,713
3,503
7,803
(282)
(920)
0
(35)
(573)
471
(112)
(210)
1,046
(127)
(163)
(5,589)
(105)
SLA Income 202,405 16,634 16,988 355 184,931 186,134 1,203
COMMENTARY
The activity performance is detailed below:
Non Electives and Critical care activity are below forecast. However A&E attenders are performing above plan.

Appendix 3
Income Penalties
April
May
June
July
August
September
October
November
December
January
February
YTD
£000 £000 £000 £000 £000 £000 £000 £000 £000 £000 £000
18 week Breaches
Mixed Sex Accomodation penalty
Cancer Waits
Cancelled Operations
MRSA Penalty
A&E Breaches
Ambulance handovers
OP New to Follow Up
DC2OP
Readmissions
1
0
0
0
0
55
14
18
9
137
0
1
0
1
0
47
8
1
9
141
0
0
0
0
0
80
12
7
10
137
0
0
1
0
0
21
1
8
12
141
0
0
0
0
0
0
1
5
17
141
0
0
0
0
10
38
1
-2
13
137
0
0
0
2
0
9
1
-3
11
142
0
0
1
2
0
16
1
5
14
137
0
0
0
1
0
9
1
4
15
141
0
0
0
0
0
37
1
10
16
141
0
0
0
0
0
47
1
10
13
132
1
1
2
7
10
358
42
63
136
1,529
234 208 245 185 164 197 161 176 171 205 203 2,150
Commentary - The above table now shows all penalties that have been incurred by the Trust. A&E breaches penalties has increased in month. All other penalties remain in line with trend.