kingspan group plc half-yearly financial report for … · kingspan group plc half-yearly financial...
TRANSCRIPT
KINGSPAN GROUP PLC
HALF-YEARLY FINANCIAL REPORT
for the period ended 30 June 2015

KINGSPAN GROUP PLC
RESULTS FOR THE HALF YEAR 30 JUNE 2015
Kingspan the global leader in high performance insulation and building envelope solutions
issues its half-yearly financial report for the six month period ended 30 June 2015.
Financial Highlights:
Revenue up 39% to €1.24bn, (pre-currency, up 29%).
Trading profit up 61% to €111.7m, (pre-currency up 44%).
Acquisitions contributed 26% to sales growth and 31% to trading profit growth in the
period.
Group trading margin of 9.0%, an increase of 120bps versus the same period in 2014.
Net debt of €449.3m (H1 2014: €113.4m). Net debt to EBITDA of 1.9x (H1 2014: 0.7x),
with pro-forma net debt to EBITDA being 1.6x.
Basic EPS up 59% to 46.5 cent (H1 2014: 29.2 cent).
Interim dividend per share up 28% to 8.0 cent (H1 2014: 6.25 cent).
11.3% ROCE (H1 2014: 12.4%) with annualised ROCE of 14.4% post the full year
contribution of recent acquisitions.
Business Highlights:
Strong delivery overall with encouraging organic growth complemented by significant
development activity.
Insulated Panel revenue growth of 43% to €753m, reflecting solid organic growth in key
markets, combined with the acquired sales of Joris Ide and Vicwest.
Insulation Boards revenue growth of 44% to €319m, largely driven by the Pactiv and PAL
acquisitions late in 2014, as well as robust sales growth in the UK and Western Europe.
Environmental sales were slightly ahead and profitability has recovered significantly.
Access Floors delivered a solid performance in North America, countered by slightly
weaker EU sales. Sales overall were ahead by 22%.
Organic capacity expansion and plant upgrades planned in Belgium, France, the Nordics,
UAE, Mexico, US, Australia and Russia. These facilities, across both Insulated Panels and
Insulation Boards will come on stream progressively between now and 2020.

Summary Financials:
H1’15
€m
H1’14
€m
% Change
Revenue 1,235.3 889.3 +39%
EBITDA 137.9 88.9 +55%
Trading Profit* 111.7 69.2 +61%
Trading Margin 9.0% 7.8% +120bps
EPS (cent per share) 46.5 29.2 +59% *Operating profit before amortisation of intangibles
Gene Murtagh, Chief Executive of Kingspan commented:
“Kingspan has had an exceptionally strong start to the year, underpinned by solid organic growth.
Good progress has also been made with the integration of the Joris Ide and Vicwest businesses
acquired during the period, both of which contribute significantly to the global evolution of
Kingspan. With reduced levels of economic uncertainty in Continental Europe, and improving
levels of building activity in the UK and US, we are optimistic about the outlook for the full year.”
For further information contact: Murray Consultants
Douglas Keatinge
Tel: +353 (0) 1 4980 300
Business Review
The first half of 2015 has been a record period for Kingspan which resulted in revenue growth of
39% to €1,235.3m and trading profit growth of 61% to €111.7m. Pre-acquisitions, these growth
rates were 13% and 30% respectively, benefitting also from significant year-on-year currency and
raw material gains. Trading margin was 9.0%, ahead of prior year by 120bps reflecting the strong
leverage in core markets and complemented partly by the timing of recent acquisitions which did
not include their typically lower winter trading period.
Revenue in Mainland Europe, our largest market, grew by 46% and represented 37% of total
Group turnover in the period. The Joris Ide acquisition, completed in March 2015 for a
consideration of €320m, contributed €138m to revenue in the period. More generally, our sales
performance in Germany has continued to improve, as it has in the Benelux, whilst France has
been stable at an organic level. Central Europe has been mixed although broadly flat in aggregate.
Underlying revenue in the Gulf region was steady, and order intake improved notably which
should translate into sales over the latter half of the year. North America has been performing well,
and Australasia has hit a more challenging patch on revenues as we prioritise margin over volume.
During the first half of the year, we completed two substantial deals for a total outlay of €459m.
Joris Ide, the larger of the two, is a Belgium based manufacturer of Insulated Panels and related
products with further facilities in France, Germany, Romania and Russia. The Joris Ide brand and
business model are distinct and are complementary to Kingspan. We intend growing this business
and brand independently from our existing presence in Continental Europe and, in time, further
afield. Vicwest, a Canadian based manufacturer of Insulated Panels and metal profiles was
acquired in May. In addition to its Canadian facilities, it also has two Insulated Panel plants in the
US, addressing a tier of the market previously not serviced by the Kingspan brand. As with Joris
Ide, it is our intention to grow this business along the lines it has been developed to-date, while
simultaneously consolidating the Canadian manufacturing footprint. Both businesses are
integrating smoothly and are already seeing some of the Kingspan operational and material cost
benefits.
Since the period end we have completed the acquisition of SPU Oy, a Finnish based rigid
insulation boards business. Revenues are in the order of €25m and it represents our first
manufacturing step into the Nordics insulation sector. The business is currently undergoing a
complete brand migration to “Kingspan Insulation”.
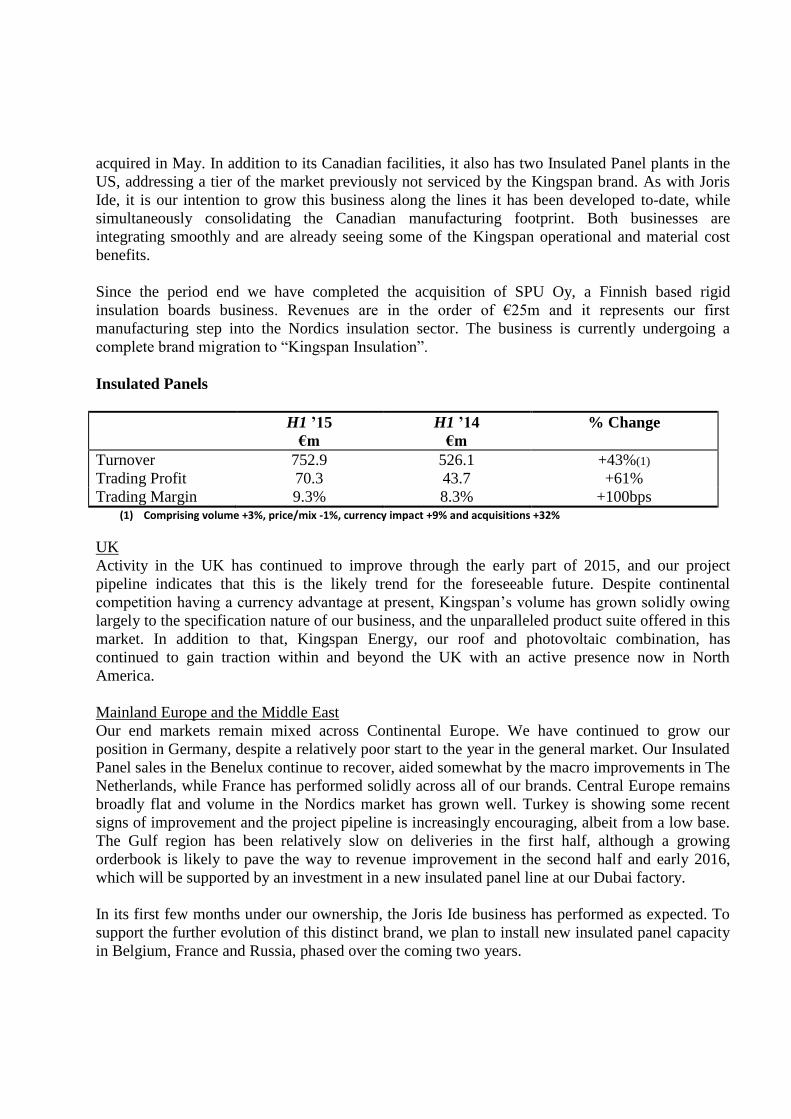
Insulated Panels
H1 ’15
€m
H1 ’14
€m
% Change
Turnover 752.9 526.1 +43%(1)
Trading Profit 70.3 43.7 +61%
Trading Margin 9.3% 8.3% +100bps (1) Comprising volume +3%, price/mix -1%, currency impact +9% and acquisitions +32%
UK
Activity in the UK has continued to improve through the early part of 2015, and our project
pipeline indicates that this is the likely trend for the foreseeable future. Despite continental
competition having a currency advantage at present, Kingspan’s volume has grown solidly owing
largely to the specification nature of our business, and the unparalleled product suite offered in this
market. In addition to that, Kingspan Energy, our roof and photovoltaic combination, has
continued to gain traction within and beyond the UK with an active presence now in North
America.
Mainland Europe and the Middle East
Our end markets remain mixed across Continental Europe. We have continued to grow our
position in Germany, despite a relatively poor start to the year in the general market. Our Insulated
Panel sales in the Benelux continue to recover, aided somewhat by the macro improvements in The
Netherlands, while France has performed solidly across all of our brands. Central Europe remains
broadly flat and volume in the Nordics market has grown well. Turkey is showing some recent
signs of improvement and the project pipeline is increasingly encouraging, albeit from a low base.
The Gulf region has been relatively slow on deliveries in the first half, although a growing
orderbook is likely to pave the way to revenue improvement in the second half and early 2016,
which will be supported by an investment in a new insulated panel line at our Dubai factory.
In its first few months under our ownership, the Joris Ide business has performed as expected. To
support the further evolution of this distinct brand, we plan to install new insulated panel capacity
in Belgium, France and Russia, phased over the coming two years.
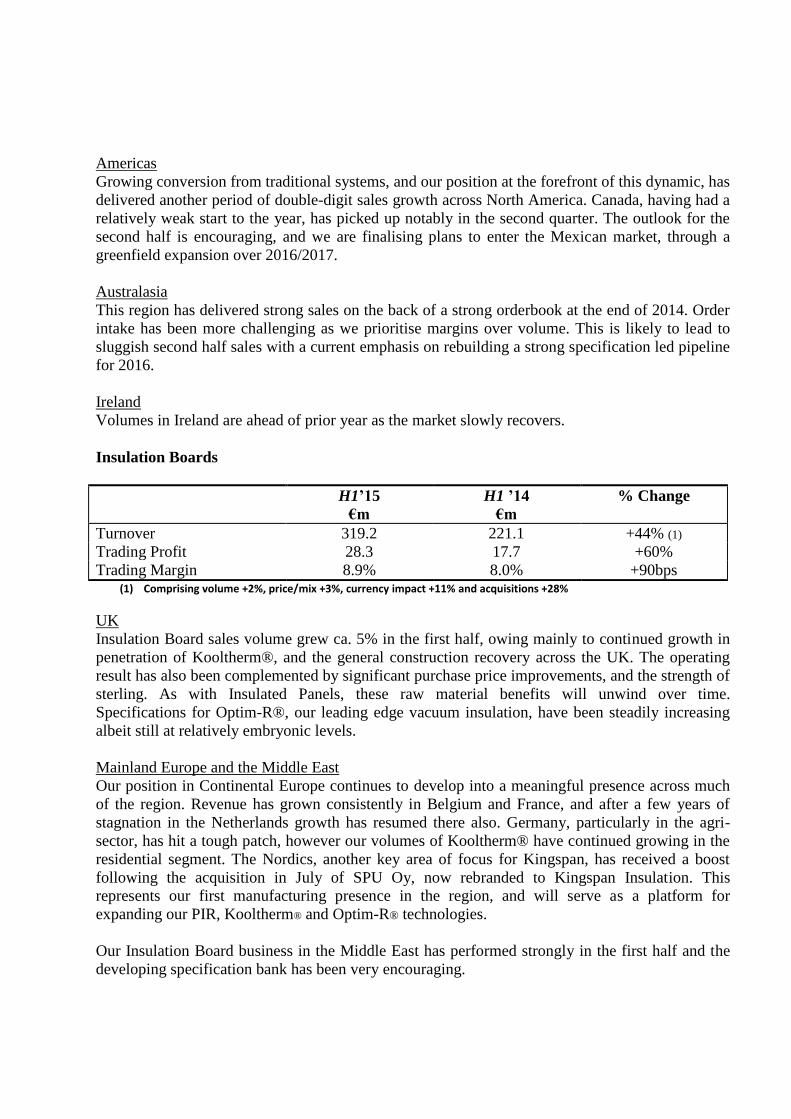
Americas
Growing conversion from traditional systems, and our position at the forefront of this dynamic, has
delivered another period of double-digit sales growth across North America. Canada, having had a
relatively weak start to the year, has picked up notably in the second quarter. The outlook for the
second half is encouraging, and we are finalising plans to enter the Mexican market, through a
greenfield expansion over 2016/2017.
Australasia
This region has delivered strong sales on the back of a strong orderbook at the end of 2014. Order
intake has been more challenging as we prioritise margins over volume. This is likely to lead to
sluggish second half sales with a current emphasis on rebuilding a strong specification led pipeline
for 2016.
Ireland
Volumes in Ireland are ahead of prior year as the market slowly recovers.
Insulation Boards
H1’15
€m
H1 ’14
€m
% Change
Turnover 319.2 221.1 +44% (1)
Trading Profit 28.3 17.7 +60%
Trading Margin 8.9% 8.0% +90bps (1) Comprising volume +2%, price/mix +3%, currency impact +11% and acquisitions +28%
UK
Insulation Board sales volume grew ca. 5% in the first half, owing mainly to continued growth in
penetration of Kooltherm®, and the general construction recovery across the UK. The operating
result has also been complemented by significant purchase price improvements, and the strength of
sterling. As with Insulated Panels, these raw material benefits will unwind over time.
Specifications for Optim-R®, our leading edge vacuum insulation, have been steadily increasing
albeit still at relatively embryonic levels.
Mainland Europe and the Middle East
Our position in Continental Europe continues to develop into a meaningful presence across much
of the region. Revenue has grown consistently in Belgium and France, and after a few years of
stagnation in the Netherlands growth has resumed there also. Germany, particularly in the agri-
sector, has hit a tough patch, however our volumes of Kooltherm® have continued growing in the
residential segment. The Nordics, another key area of focus for Kingspan, has received a boost
following the acquisition in July of SPU Oy, now rebranded to Kingspan Insulation. This
represents our first manufacturing presence in the region, and will serve as a platform for
expanding our PIR, Kooltherm® and Optim-R® technologies.
Our Insulation Board business in the Middle East has performed strongly in the first half and the
developing specification bank has been very encouraging.

Americas
Almost one year into the acquisition of Pactiv Insulation, now rebranded as Kingspan, the business
has developed well in its core XPS product category, which is manufactured at the Winchester
facility in Virginia. This plant is effectively now at full capacity and our focus is on refining an
investment plan that will see capacity rise by the annual revenue equivalent of $40m. We expect to
commission the new line by mid 2017. In the meantime, we are developing a specification
presence around growing our Kooltherm® product range across North America. This should
become an increasingly attractive proposition as the market becomes ever-more receptive to low-
energy building solutions.
Ireland
Sales revenue in Ireland has grown significantly in the first half, driven by Kooltherm® as well as
a gradually improving construction backdrop. This trend can be expected to continue for the
foreseeable future.
Environmental
H1 ’15
€m
H1 ’14
€m
% Change
Turnover 77.5 71.6 +8%
Trading Profit 3.3 0.2
Trading Margin 4.3% 0.3% +400bps
This recent period at the Environmental Division has proved one of the more encouraging in recent
years. Following a relatively prolonged spell of either stagnant or declining sales, activity has now
stabilised. With the additional leverage benefits of a shrunken overhead base, profitability has
grown markedly in the period.
Growing this business more internationally is now key, with particular emphasis on environmental
fuel storage solutions, water and treatment applications.
Access Floors
H1 ’15
€m
H1 ’14
€m
% Change
Turnover 85.7 70.5 +22% (1)
Trading Profit 9.8 7.6 +29%
Trading Margin 11.4% 10.8% +60bps (1) Comprising volume -6%, price/mix +10% and currency impact +18%
This division has experienced mixed performances by geography during the first half of 2015. In
North America revenue grew significantly, driven largely by the expanded datacentre product suite
that has been developed under the Tate brand as well as a comparison against a tough start to 2014.
This product category will provide significant longer-term scope for this division, at a time when
the traditional office floor market still remains somewhat subdued. This segment too should, in
time, see the resumption of growth in high rise office across North America.

Despite a very strong orderbook in the UK, deliveries in the early part of the year declined
marginally from prior year. This trend is not expected to continue with sales into London, in
particular, expected to show significant growth towards year-end and into early 2016.
Financial Review
Overview of results
Group revenue increased by 39% to €1,235.3m (H1 2014: €889.3m) and trading profit increased
by 61% to €111.7m (H1 2014: €69.2m). This represented a 29% increase in sales and a 44%
increase in trading profit on a constant currency basis. The Group’s trading margin increased by
120bps to 9.0% (H1 2014: 7.8%). The amortisation charge in respect of intangibles was €3.7m
compared to €2.2m in the first half of 2014 with the increase reflecting, primarily, intangible assets
acquired in respect of Joris Ide in March 2015 and Pactiv Insulation in October 2014. Group
operating profit after amortisation grew 61% to €108.0m. Profit after tax was €82.4m compared to
€49.9m in the first half of 2014 driven, in the main, by the growth in trading profit. Basic EPS for
the period was 46.5 cent, representing an increase of 59% on the first half of 2014 (H1 2014: 29.2
cent).
The Group’s underlying sales and trading profit performance by division is set out below:
Sales Underlying Currency Acquisition Total
Insulated Panels +2% +9% +32% +43%
Insulation Boards +5% +11% +28% +44%
Access Floors +4% +18% - +22%
Environmental -1% +9% - +8%
Group +3% +10% +26% +39%
The Group’s trading profit measure is earnings before interest, tax and amortisation of intangibles:
Trading Profit Underlying Currency Acquisition Total
Insulated Panels +12% +15% +34% +61%
Insulation Boards +2% +20% +38% +60%
Access Floors +7% +22% - +29%
Environmental n/a n/a n/a n/a
Group +13% +17% +31% +61%
Finance costs (net) Finance costs for the period were modestly higher than the same period last year at €7.6m (H1
2014: €7.0m). Finance costs include a non-cash charge of €0.1m (H1 2014: €0.1m) in respect of
the Group’s legacy defined benefit pension schemes. A net non-cash charge of €0.4m was
recorded in respect of swaps on the Group’s USD private placement notes (H1 2014: Nil). The
Group’s net interest expense on borrowings (bank and loan notes) was €7.1m compared to €6.9m
in the first half of 2014. The flat interest charge, despite the higher level of debt, reflects
favourable financing initiatives carried out in 2014 and the repayment of a higher coupon private
placement loan note on maturity in March 2015.

Taxation The tax charge for the first half of the year was €18.0m (H1 2014: €10.1m) which represents an
effective tax rate of 18% on profit before tax and amortization (H1 2014: 16.2%). The increase in
the effective rate reflects the global mix of earnings year on year.
Retirement benefits The Group has two legacy defined benefit schemes which are closed to new members and to future
accrual. In addition, the Group assumed a defined benefit obligation in respect of certain current
and former employees of ThyssenKrupp Construction acquired during 2012. The net pension
liability in respect of all the Group’s defined benefit obligations was €9.9m as at 30 June 2015 (30
June 2014: €6.4m).
Acquisitions
The Group completed two significant acquisitions during the period. In March 2015, the Group
completed the acquisition of Joris Ide. Joris Ide is a pan European manufacturer and supplier of
insulated panels, profiles and related accessories, with leading market positions in France and the
Benelux. It has five insulated panel manufacturing facilities in Belgium, Germany, Romania and
Russia, and eleven regional manufacturing sites across Europe. The consideration was €320m,
satisfied on completion partly in cash and by the assumption of net debt, with the balance of the
consideration satisfied by the issue of three million shares in Kingspan Group plc. The completion
balance sheet has been the subject of a fair value exercise and this is set out in note 15 in the
accounts.
In May 2015, the Group completed the acquisition of the Building Products (“BP”) division of
Vicwest Inc. (“Vicwest”). It comprises three Insulated Panel manufacturing plants, one of which is
to be disposed of under an arrangement with the Canadian anti-trust authorities, in addition to a
number of profiling facilities across Canada and the US. The total consideration was €139m,
including the assumption of net debt. Given the proximity of completion of the acquisition to the
period end the fair value exercise has not yet been completed.
Free cashflow
Free cashflow H1’15 H1’14
€’m €’m
EBITDA* 137.9 88.9
Movement in working capital ** 17.1 (29.5)
Net capital expenditure (34.2) (21.0)
Pension contributions (1.4) (1.2)
Net finance costs paid (7.7) (7.6)
Income taxes paid (9.5) (6.0)
Other including non-cash items 3.5 5.1
Free cashflow 105.7 28.7
*Earnings before finance costs, income taxes, depreciation and amortization
**Excludes working capital on acquisition but includes working capital movements since that point

Working capital at 30 June 2015 was €332m, an increase of €68.7m in the period. This increase is
driven by the working capital on acquisitions in the period, partly offset by a reduction in working
capital in the underlying businesses.
The average working capital to sales % was 14.2% (11.5% when adjusted to reflect the annualized
sales of the current period acquisitions) in H1 2015 compared to 12.7% in H1 2014 and was helped
in 2015 by an untypical working capital mix some of which will unwind in the second half.
Net Debt
Net debt increased by €323.8m during the first half to €449.3m (31 December 2014: €125.5m) due
to acquisitions completed in the period. This is analysed in the table below:
Movement in net debt H1’15 H1’14
€’m €’m
Free cashflow 105.7 28.7
Acquisitions (414.8) (23.4)
Share issues 7.2 4.3
Dividends paid (17.6) (14.6)
Cashflow movement (319.5) (5.0)
Exchange movements on translation (4.3) (1.7)
Increase in net debt (323.8) (6.7)
Net debt at start of period (125.5) (106.7)
Net debt at end of period (449.3) (113.4)
Capital Structure and Group Financing
The Group funds itself through a combination of equity and debt. Debt is funded through a
combination of syndicated bank facilities and private placement loan notes. The primary bank debt
facility is a €300m revolving credit facility, with a syndicate of international banks, with a term to
March 2019.
In December 2014, the Group agreed a €127.5m private placement loan note with equal maturities
of 6, 8 and 10 years. These notes were drawn in March 2015 to fund the repayment of maturing
loan notes of $158m.
Also in December 2014, the Group agreed bi-lateral facilities of €190m with three banks with a
two year maturity, of which €150m was drawn at period-end.
The Group has two US Private Placement loan notes in issue and the total US Private Placement
debt outstanding at period-end was $242m. $42m matures in March 2017 with the balance of
$200m maturing in August 2021.
The Group has significant available undrawn facilities which provide appropriate headroom for
ongoing operational requirements and development funding.

Related Party Transactions
There were no changes in related party transactions from the 2014 Annual Report that could have a
material effect on the financial position or performance of the Group in the first half of the year.
Principal Risks & Uncertainties
Details of the principal risks and uncertainties facing the Group can be found in the 2014 Annual
Report. These risks, namely volatility in the macro environment, failure to innovate, product
failure, business interruption (including IT continuity), credit risks and credit control, remain the
most likely to affect the Group in the second half of the current year. The Group actively manages
these and all other risks through its control and risk management processes.
Dividend The Board has proposed an interim dividend of 8.0 cent per ordinary share, an increase of 28% on
the 2014 interim dividend of 6.25 cent per share. The interim dividend will be paid on 25
September 2015 to shareholders on the register on the record date of 4 September 2015.
Outlook Building activity in the UK and US in particular has been gradually improving over the past year,
and it is likely this trend will broadly continue for the time being, although we have seen some
easing of activity in the UK in recent months. European markets, in general, have underperformed
relatively with trading nonetheless stable in most continental markets. With the backdrop of
broader Eurozone uncertainty now dwindling, any improvement in consumer confidence should
give way to a form of gradual and sustained market recovery, ultimately reflected on building sites
and in our volumes. In contrast to this our input environment has been at a cyclical low in recent
months. Given past experience we anticipate this situation to harden over time. Similiary, the
impact of Euro denominated exchange rates is significantly better than the average rates over the
last ten years.
These factors, combined with our well established energy driven conversion model, should see
Kingspan grow steadily over time and into the future.

RESPONSIBILITY STATEMENT
Directors’ Responsibility Statement in respect of the half-yearly financial report for the six
month period ended 30 June 2015
Each of the directors of Kingspan Group plc confirm our responsibility for preparing the half-
yearly financial report in accordance with the Transparency (Directive 2004/109/EC) Regulations
2007, the Transparency Rules of the Republic of Ireland's Financial Regulator and with IAS 34
"Interim Financial Reporting" as adopted by the EU. We confirm that to the best of our
knowledge:
a) The condensed consolidated half-yearly financial statements comprising the Condensed
Consolidated Income Statement, the Condensed Consolidated Statement of Comprehensive
Income, the Condensed Consolidated Statement of Financial Position, the Condensed Consolidated
Statement of Changes in Equity, the Condensed Consolidated Statement of Cash Flows and related
notes have been prepared in accordance with the Transparency (Directive 2004/109/EC)
Regulations 2007, the Transparency Rules of the Republic of Ireland's Financial Regulator and
with IAS 34 "Interim Financial Reporting" as adopted by the EU.
b) The interim management report includes a fair review of the information required by:
i) Regulation 8(2) of the Transparency (Directive 2004/109/EC) Regulations 2007, being an
indication of important events that have occurred during the first six months of the financial year
and their impact on the condensed set of financial statements; and a description of the principal
risks and uncertainties for the remaining six months of the year; and
ii) Regulation 8(3) of the Transparency (Directive 2004/109/EC) Regulations 2007, being related
party transactions that have taken place in the first six months of the current financial year and that
have materially affected the financial position or performance of the entity during that period; and
any changes in the related party transactions described in the last annual report that could do so.
The directors of Kingspan Group plc, and their functions, are as listed in the 2014 Annual Report,
with the exception of the following changes during the period:
Kieran Murphy retired as a non-executive director on 7 May 2015;
Bruce McLennan was appointed as a non-executive director on 26 June 2015.
On behalf of the Board
Gene Murtagh Geoff Doherty
Chief Executive Officer Chief Financial Officer
24 August 2015 24 August 2015

Independent Review Report to Kingspan Group PLC
Introduction
We have been engaged by the company to review the condensed consolidated financial statements
for the six months ended 30 June 2015 which comprises the Condensed Consolidated Income
Statement, the Condensed Consolidated Statement of Comprehensive Income, the Condensed
Consolidated Statement of Financial Position, the Condensed Consolidated Statement of Changes
in Equity, the Condensed Consolidated Statement of Cash Flows and the related explanatory notes.
We have read the other information contained in the half-yearly financial report and considered
whether it contains any apparent misstatements or material inconsistencies with the information in
the condensed set of consolidated financial statements.
This report is made solely to the company in accordance with the terms of our engagement to assist
the company in meeting the requirements of the Transparency (Directive 2004/109/EC)
Regulations 2007 as amended (“the TD Regulations”) and the Transparency Rules of the Central
Bank of Ireland. Our review has been undertaken so that we might state to the company those
matters we are required to state to it in this report and for no other purpose. To the fullest extent
permitted by law, we do not accept or assume responsibility to anyone other than the company for
our review work, for this report, or for the conclusions we have reached.
Directors’ responsibilities
The half-yearly financial report is the responsibility of, and has been approved by, the directors.
The directors are responsible for preparing the half-yearly financial report in accordance with the
TD Regulations and the Transparency Rules of the Central Bank of Ireland.
As disclosed in note 1, the annual financial statements of the group are prepared in accordance
with International Financial Reporting Standards as adopted by the EU. The directors are
responsible for ensuring that the condensed consolidated financial statements included in this half-
yearly financial report has been prepared in accordance with IAS 34 Interim Financial Reporting
as adopted by the EU.
Our responsibility
Our responsibility is to express to the company a conclusion on the condensed consolidated
financial statements based on our review.
Scope of review
We conducted our review in accordance with the Financial Reporting Council’s International
Standard on Review Engagements (UK and Ireland) 2410 Review of Interim Financial Information
Performed by the Independent Auditor of the Entity. A review of interim financial information
consists of making enquiries, primarily of persons responsible for financial and accounting
matters, and applying analytical and other review procedures. A review is substantially less in
scope than an audit conducted in accordance with International Standards on Auditing (UK and
Ireland) and consequently does not enable us to obtain assurance that we would become aware of

all significant matters that might be identified in an audit. Accordingly, we do not express an audit
opinion.
Conclusion
Based on our review, nothing has come to our attention that causes us to believe that the
condensed consolidated financial statements for the six months ended 30 June 2015 are not
prepared, in all material respects, in accordance with IAS 34 as adopted by the EU, the TD
Regulations and the Transparency Rules of the Central Bank of Ireland.
Roger Gillespie 24 August 2015
for and on behalf of KPMG
Chartered Accountants, Statutory Audit Firm
1 Stokes Place
St. Stephen’s Green
Dublin 2
Ireland

Kingspan Group plc
Condensed consolidated income statement (unaudited) for the 6 month period ended 30 June 2015 6 months 6 months
ended ended
30 June 2015 30 June 2014
Note €m €m
Revenue 4 1,235.3 889.3
Cost of Sales (874.2) (648.6)
Gross Profit
361.1
240.7
Operating Costs, excluding intangible amortisation (249.4) (171.5)
Trading Profit
4
111.7
69.2
Intangible amortisation (3.7) (2.2)
Operating Profit 108.0 67.0
Finance expense 6 (7.7) (7.1)
Finance income 6 0.1 0.1
Profit for the period before income tax 100.4 60.0
Income tax expense 7 (18.0) (10.1)
Net Profit for the period 82.4 49.9
Attributable to owners of Kingspan Group plc
81.7
49.8
Attributable to non-controlling interests 0.7 0.1
82.4
49.9
Earnings per share for the period
Basic 11 46.5c 29.2c
Diluted
11
45.7c
28.6c

Kingspan Group plc
Condensed consolidated statement of comprehensive income (unaudited) for the 6 month period ended 30 June 2015 6 months 6 months
ended ended
30 June 2015 30 June 2014
€m €m
Net profit for financial period 82.4 49.9
Other comprehensive income:
Items that may be reclassified subsequently to profit or loss
Exchange differences on translating foreign operations 66.3 21.8
Effective portion of changes in fair value of cash flow hedges (2.0) (2.3)
Income taxes relating to changes in fair value of cash flow hedges 0.2 0.3
Items that will not be reclassified to profit or loss
Actuarial losses on defined benefit pension schemes - -
Income taxes relating to actuarial losses on defined benefit pension schemes - -
Total comprehensive income for the period
146.9
69.7
Attributable to owners of Kingspan Group plc 145.5 69.6
Attributable to non-controlling interests 1.4 0.1
146.9 69.7

Kingspan Group plc Condensed consolidated statement of financial position as at 30 June 2015 At 30 June At 30 June At 31 December
2015
(unaudited)
2014
(unaudited)
2014
(audited) Note €m €m €m
Assets
Non-current assets Goodwill 12 809.8 399.0 475.3
Other intangible assets 63.7 19.2 31.2
Property, plant and equipment 13 638.4 495.0 497.0 Investment in joint ventures - 9.0 8.4
Derivative financial instruments 19.6 1.4 15.4
Retirement benefit assets 6.2 7.3 4.7
Deferred tax assets 6.9 7.1 7.0
1,544.6 938.0 1,039.0
Current assets
Inventories 364.6 228.0 236.5 Trade and other receivables 549.6 390.7 364.0
Derivative financial instruments 0.1 - 11.3
Cash and cash equivalents 9 170.6 192.7 185.7
1,084.9 811.4 797.5
Total assets 2,629.5 1,749.4 1,836.5
Liabilities
Current liabilities
Trade and other payables 582.2 373.5 337.2 Provisions for liabilities 37.0 37.1 29.6
Derivative financial instruments 2.6 5.0 0.6
Deferred contingent consideration 8.3 7.2 0.6 Interest bearing loans and borrowings 287.4 4.3 132.7
Current income tax liabilities 60.2 39.0 42.6
977.7 466.1 543.3
Non-current liabilities
Retirement benefit obligations 16.1 13.7 16.4
Provisions for liabilities 31.5 16.4 26.2 Interest bearing loans and borrowings 352.1 297.0 204.6
Derivative financial instruments - 3.3 -
Deferred tax liabilities 46.7 24.7 22.1 Deferred contingent consideration 1.3 5.2 14.8
447.7 360.3 284.1
Total liabilities 1,425.4 826.4 827.4
Net Assets
1,204.1
923.0
1,009.1
Equity
Share capital 23.2 22.9 23.0
Share premium 55.4 47.2 48.4 Capital redemption reserve 0.7 0.7 0.7
Treasury shares (11.3) (30.7) (30.7)
Other reserves (5.5) (105.4) (63.2) Retained earnings 1,132.2 980.3 1,022.9
Equity attributable to owners of Kingspan Group plc 1,194.7 915.0 1,001.1
Non-controlling interests 9.4 8.0 8.0
Total Equity 1,204.1 923.0 1,009.1
Kingspan Group plc
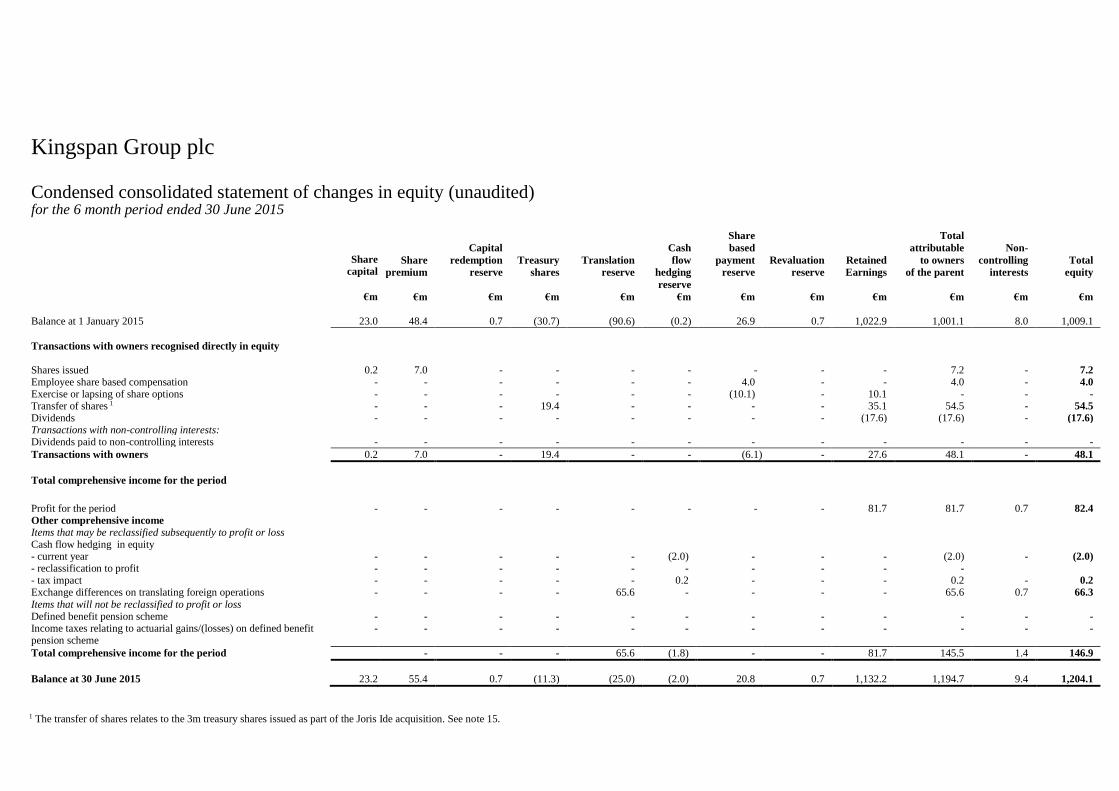
Condensed consolidated statement of changes in equity (unaudited) for the 6 month period ended 30 June 2015
Share
capital
Share
premium
Capital
redemption
reserve
Treasury
shares
Translation
reserve
Cash
flow
hedging
reserve
Share
based
payment
reserve
Revaluation
reserve
Retained
Earnings
Total
attributable
to owners
of the parent
Non-
controlling
interests
Total
equity
€m €m €m €m €m €m €m €m €m €m €m €m
Balance at 1 January 2015 23.0 48.4 0.7 (30.7) (90.6) (0.2) 26.9 0.7 1,022.9 1,001.1 8.0 1,009.1
Transactions with owners recognised directly in equity
Shares issued 0.2 7.0 - - - - - - - 7.2 - 7.2
Employee share based compensation - - - - - - 4.0 - - 4.0 - 4.0
Exercise or lapsing of share options - - - - - - (10.1) - 10.1 - - -
Transfer of shares 1 - - - 19.4 - - - - 35.1 54.5 - 54.5
Dividends - - - - - - - - (17.6) (17.6) - (17.6)
Transactions with non-controlling interests:
Dividends paid to non-controlling interests - - - - - - - - - - - -
Transactions with owners 0.2 7.0 - 19.4 - - (6.1) - 27.6 48.1 - 48.1
Total comprehensive income for the period
Profit for the period - - - - - - - - 81.7 81.7 0.7 82.4
Other comprehensive income
Items that may be reclassified subsequently to profit or loss
Cash flow hedging in equity
- current year - - - - - (2.0) - - - (2.0) - (2.0)
- reclassification to profit - - - - - - - - - -
- tax impact - - - - - 0.2 - - - 0.2 - 0.2
Exchange differences on translating foreign operations - - - - 65.6 - - - - 65.6 0.7 66.3
Items that will not be reclassified to profit or loss
Defined benefit pension scheme - - - - - - - - - - - -
Income taxes relating to actuarial gains/(losses) on defined benefit pension scheme
- - - - - - - - - - - -
Total comprehensive income for the period - - - 65.6 (1.8) - - 81.7 145.5 1.4 146.9
Balance at 30 June 2015
23.2
55.4
0.7
(11.3)
(25.0)
(2.0)
20.8
0.7
1,132.2
1,194.7
9.4
1,204.1
1 The transfer of shares relates to the 3m treasury shares issued as part of the Joris Ide acquisition. See note 15.

Kingspan Group plc
Condensed consolidated statement of changes in equity (unaudited) for the 6 month period ended 30 June 2014
Share
capital
Share
premium
Capital
redemption
reserve
Treasury
shares
Translation
reserve
Cash
flow
hedging
reserve
Share
based
payment
reserve
Revaluation
reserve
Retained
Earnings
Total
attributable
to owners
of the parent
Non-
controlling
interests
Total
equity
€m €m €m €m €m €m €m €m €m €m €m €m
Balance at 1 January 2014 22.7 43.1 0.7 (30.7) (148.0) (0.7) 21.9 0.7 942.0 851.7 7.9 859.6
Transactions with owners recognised directly in equity
Shares issued 0.2 4.1 - - - - - - - 4.3 - 4.3
Employee share based compensation - - - - - - 3.9 - - 3.9 - 3.9
Exercise or lapsing of share options - - - - - - (3.0) - 3.0 - - -
Dividends - - - - - - - - (14.5) (14.5) - (14.5)
Transactions with non-controlling interests:
Dividends paid to non-controlling interests - - - - - - - - - - - -
Transactions with owners 0.2 4.1 - - - - 0.9 - (11.5) (6.3) - (6.3)
Total comprehensive income for the period
Profit for the period - - - - - - - - 49.8 49.8 0.1 49.9
Other comprehensive income
Items that may be reclassified subsequently to profit or loss
Cash flow hedging in equity
- current year - - - - - (2.3) - - - (2.3) - (2.3)
- tax impact - - - - - 0.3 - - - 0.3 - 0.3
Exchange differences on translating foreign operations - - - - 21.8 - - - - 21.8 - 21.8
Items that will not be reclassified subsequently to profit or loss
Defined benefit pension scheme - - - - - - - - - - - -
Income taxes relating to actuarial gains/(losses) on defined benefit pension scheme
- - - - - - - - - - - -
Total comprehensive income for the period - - - - 21.8 (2.0) - - 49.8 69.6 0.1 69.7
Balance at 30 June 2014
22.9
47.2
0.7
(30.7)
(126.2)
(2.7)
22.8
0.7
980.3
915.0
8.0
923.0

Kingspan Group plc
Condensed consolidated statement of changes in equity (audited) for the financial year ended 31 December 2014
Share
Capital
Share
Premiu
m
Capital
Redemption
Reserve
Treasury
Shares
Translation
Reserve
Cash
flow
Hedging
Reserve
Share
Based
Payment
Reserve
Revaluation
Reserve
Retained
Earnings
Total
attributable
to owners
of the parent
Non
Controlling
Interests
Total
Equity
€m €m €m €m €m €m €m €m €m €m €m €m
Balance at 1 January 2014 22.7 43.1 0.7 (30.7) (148.0) (0.7) 21.9 0.7 942.0 851.7 7.9 859.6
Transactions with owners recognised directly in equity
Shares issued 0.3 5.3 - - - - - - - 5.6 - 5.6
Employee share based compensation - - - - - - 7.7 - - 7.7 - 7.7
Tax on employee share based compensation - - - - - - 1.1 - 1.1 2.2 - 2.2
Exercise or lapsing of share options - - - - - - (3.8) - 3.8 - - -
Dividends - - - - - - - - (25.3) (25.3) - (25.3)
Transactions with non-controlling interests:
Buy out of non-controlling interests - - - - - - - - - - - -
Dividends paid to non-controlling interests - - - - - - - - - - - -
Transactions with owners 0.3 5.3 - - - - 5.0 - (20.4) (9.8) - (9.8)
Total comprehensive income for the year
Profit for the year - - - - - - - - 107.2 107.2 (0.7) 106.5
Other comprehensive income
Items that may be reclassified subsequently to profit or loss Cash flow hedging in equity
- current year - - - - - 0.6 - - - 0.6 - 0.6
- reclassification to profit - - - - - - - - - - - -
- tax impact - - - - - (0.1) - - - (0.1) (0.1)
Exchange differences on translating foreign operations
- - - - 57.4 - - - - 57.4 0.8 58.2
Items that will not be reclassified subsequently to profit or loss
Defined benefit pension scheme - - - - - - - - (6.7) (6.7) - (6.7)
Income taxes relating to actuarial gains/ (losses) on defined benefit pension scheme
- - - - - - - - 0.8 0.8 - 0.8
Total comprehensive income for the year - - - - 57.4 0.5 - - 101.3 159.2 0.1 159.3
Balance at 31 December 2014
23.0
48.4
0.7
(30.7)
(90.6)
(0.2)
26.9
0.7
1,022.9
1,001.1
8.0
1,009.1

Operating activities
Net profit for the period 82.4 49.9
Income tax 18.0 10.1
Depreciation of property, plant and equipment 26.2 19.7
Amortisation of intangible assets 3.7 2.2
Impairment of non-current assets 5.3 -
Employee equity-settled share options 4.0 3.9
Finance income (0.1) (0.1)
Finance expense 7.7 7.1
Non-cash items 0.9 1.7
Profit on sale of property, plant and equipment (0.2) (0.1)
Change in inventories (6.6) (33.5) Change in trade and other receivables (91.8) (72.3)
Change in trade and other payables 115.5 76.4
Pension contributions (1.4) (1.2)
Cash generated from operations 163.6 63.8 Taxes paid (9.5) (6.0)
Net cash flow from operating activities 154.1 57.8
Investing activities
Additions to property, plant and equipment (36.7) (21.5)
Proceeds from disposals of property, plant and equipment 2.5 0.5
Purchase of subsidiary undertakings (including net debt/cash acquired) (414.8) (23.4) Payment of deferred consideration in respect of acquisitions (4.2) (0.4)
Interest received 0.2 0.2
Net cash flow from investing activities (453.0) (44.6)
Financing activities
Drawings / (Repayment) of bank loans 294.9 (2.5)
Change in finance lease liability (0.1) (0.2) Proceeds from share issues 7.2 4.3
Interest paid (7.9) (7.8) Dividends paid (17.6) (14.6)
Net cash flow from financing activities 276.5 (20.8)
Decrease in cash and cash equivalents
(22.4)
(7.6) Translation adjustment 7.3 3.7
Cash and cash equivalents at the beginning of the period 185.7 196.6
Cash and cash equivalents at the end of the period 170.6 192.7
Cash and cash equivalents at beginning of period were made up of: - Cash and cash equivalents 185.7 196.6
- Overdrafts - -
185.7 196.6
Cash and cash equivalents at end of period were made up of:
- Cash and cash equivalents 170.6 192.7 - Overdrafts - -
170.6 192.7
Kingspan Group plc
Condensed consolidated statement of cash flows (unaudited) for the 6 month period ended 30 June 2015 6 months
ended
30 June 2015
€m
6 months
ended 30 June 2014
€m

Kingspan Group plc
Notes forming part of the financial statements
1 Reporting entity
Kingspan Group plc (“the Company” or “the Group”) is a public limited company registered and
domiciled in Ireland. The condensed consolidated interim financial statements of the Company as
at and for the six month period ended 30 June 2015 comprise the Company and its subsidiaries
(together referred to as the "Group") and the Group's interests in jointly controlled entities.
The Group is primarily involved in the manufacture of high performance insulation and building
envelope solutions.
The financial information presented in the half-yearly report does not represent full statutory
accounts. Full statutory accounts for the year ended 31 December 2014 prepared in accordance
with IFRS, as adopted by the EU, upon which the auditors have given an unqualified audit report,
are available on the Group's website (www.kingspan.com).
2 Basis of preparation
This Half-Yearly Financial Report is unaudited but has been reviewed by the auditors.
(a) Statement of compliance
These condensed consolidated interim financial statements (the Interim Financial Statements)
have been prepared in accordance with IAS 34 Interim Financial Reporting and do not include all
of the information required for full annual financial statements.
The Interim Financial Statements were approved by the Board of Directors on 21 August 2015.
(b) Significant accounting policies
The accounting policies applied by the Group in the Interim Financial Statements are the same as
those applied by the Group in its consolidated financial statements as at and for the year ended 31
December 2014, except for the adoption of the Annual Improvements to IFRSs 2011 to 2013
Cycle which became effective in the current period.
The effect of the adoption of the Annual Improvements to IFRSs 2011 to 2013 Cycle in the
current period did not have any significant impact on the Interim Financial Statements.
(c) Estimates
The preparation of interim financial statements requires management to make judgements,
estimates and assumptions that affect the application of accounting policies and the reported
amounts of assets and liabilities, income and expense. Actual results may differ from these
estimates.

In preparing the Interim Financial Statements, the significant judgements made by management in
applying the Group's accounting policies and the key sources of estimation uncertainty were the
same as those that applied to the consolidated financial statements as at and for the year ended 31
December 2014.
The Interim Financial Statements are available on the Group's website (www.kingspan.com).
(d) Going concern
The Directors have reviewed forecasts and projected cash flows for a period of not less than 12
months from the date of these Interim Financial Statements, and considered its net debt position,
available committed banking facilities and other relevant information including the economic
conditions currently affecting the building environment generally. On the basis of this review the
Directors have concluded that there are no material uncertainties that would cast significant doubt
over the Group’s ability to continue as a going concern. For this reason, the Directors consider it
appropriate to adopt the going concern basis in preparing the financial statements.
3 Reporting currency
The Interim Financial Statements are presented in euro which is the functional currency of the
Company and presentation currency of the Group.
Results and cash flows of foreign subsidiary undertakings have been translated into euro at the
average exchange rates for the period, as these approximate the exchange rates at the dates of the
transactions. The related assets and liabilities have been translated at the closing rates of exchange
ruling at the end of the reporting period.
The following significant exchange rates were applied during the period:
Average rate Closing rate
H1 2015 H1 2014 FY 2014 30.06.15 30.06.14 31.12.14
Euro =
Pound Sterling 0.733 0.822 0.806 0.713 0.800 0.780
US Dollar 1.117 1.371 1.328 1.120 1.362 1.215
Canadian Dollar 1.378 1.504 1.467 1.386 1.457 1.409
Australian Dollar 1.427 1.499 1.473 1.447 1.446 1.483
Czech Koruna 27.503 27.443 27.534 27.271 27.468 27.744
Polish Zloty 4.139 4.175 4.185 4.173 4.154 4.259
Hungarian Forint 307.24 306.79 308.69 311.88 308.55 314.85

4 Operating segments
The Group has the following four reportable segments:
Insulated Panels Manufacture of insulated panels, structural framing and metal facades.
Insulation Boards Manufacture of rigid insulation boards, building services insulation and
engineered timber systems.
Environmental Manufacture of distributed energy, water and environmental management
solutions.
Access Floors Manufacture of raised access floors.
Analysis by class of business
Segment revenue Insulated
Panels
€m
Insulation
Boards
€m
Environmental
€m
Access
Floors
€m
Total
€m Total revenue - H1 2015 752.9 319.2 77.5 85.7 1,235.3
Total revenue - H1 2014 526.1 221.1 71.6 70.5 889.3
Segment result (profit before finance expense) Insulated
Panels
€m
Insulation
Boards
€m
Environmental
€m
Access
Floors
€m
Total
€m
Trading profit - H1 2015
70.3
28.3
3.3
9.8
111.7
Intangible amortisation (2.1) (1.6) - - (3.7)
Operating result - H1 2015
68.2
26.7
3.3
9.8
108.0
Net finance expense
(7.6)
Profit for the period before income tax 100.4
Income tax expense (18.0)
Profit for the period - H1 2015
82.4
Insulated
Panels
€m
Insulation
Boards
€m
Environmental
€m
Access
Floors
€m
Total
€m
Trading profit - H1 2014
43.7
17.7
0.2
7.6
69.2
Intangible amortisation (1.4) (0.7) (0.1) - (2.2)
Operating result - H1 2014
42.3
17.0
0.1
7.6
67.0
Net finance expense
(7.0)
Profit for the period before income tax 60.0
Income tax expense (10.1)
Profit for the period - H1 2014
49.9

Segment assets and liabilities
Insulated
Panels
€m
Insulation
Boards
€m
Environmental
€m
Access
Floors
€m
Total
30 June
2015
€m
Total
30 June
2014
€m
Assets - H1 2015 1,513.2 593.2 165.2 160.8 2,432.4
Assets – H1 2014 804.6 451.0 156.3 136.2 1,548.1
Derivative financial instruments 19.6 1.5
Cash and cash equivalents 170.6 192.7
Deferred tax asset 6.9 7.1
Total assets 2,629.5 1,749.4
Liabilities - H1 2015 (452.9) (152.6) (46.2) (24.7) (676.4)
Liabilities - H1 2014 (282.1) (106.1) (39.5) (25.4) (453.1)
Interest bearing loans and borrowings (current and non-current) (639.5) (301.3)
Derivative financial instruments (current and non-current) (2.6) (8.3)
Income tax liabilities (current and deferred) (106.9) (63.7)
Total liabilities (1,425.4) (826.4)
Other segment information
Insulated
Panels
€m
Insulation
Boards
€m
Environmental
€m
Access
Floors
€m
Total
€m
Capital Investment - H1 2015
136.6
11.4
2.1
3.1
153.2
Capital Investment - H1 2014 11.0 8.7 1.1 0.7 21.5
Depreciation included in segment
result - H1 2015
(15.6)
(7.8)
(1.7)
(1.1)
(26.2)
Depreciation included in segment
result - H1 2014
(11.5) (5.7) (1.6) (0.9) (19.7)
Non cash items included in segment result -
H1 2015
(2.2)
(1.0)
(0.3)
(0.5)
(4.0)
Non cash items included in segment result -
H1 2014
(2.0) (1.2) (0.4) (0.4) (4.0)
Analysis of segmental data by geography
Republic
of Ireland
€m
United
Kingdom
€m
Rest of
Europe
€m
Americas
€m
Others
€m
Total
€m
Income Statement Items
Revenue - H1 2015 40.4 399.7 459.0 225.9 110.3 1,235.3
Revenue - H1 2014 35.1 335.3 314.2 113.7 91.0 889.3
Statement of Financial Position Items
Non-current assets - H1 2015 48.4 365.4 614.5 384.6 105.2 1,518.1
Noncurrent assets - H1 2014 51.8 336.4 298.8 177.2 65.2 929.4
Capital Investment - H1 2015 2.6 13.1 97.6 32.8 7.1 153.2
Capital Investment - H1 2014 1.1 6.0 10.7 2.0 1.7 21.5
In presenting information on the basis of geographic segments, segment revenue is based on the
geographic location of customers. Segment assets are based on the geographic location of the assets.

5 Seasonality of operations
Activity in the global construction industry is characterised by cyclicality and is dependent to a
significant extent on the seasonal impact of weather in some of the Group's operating locations.
Activity is second half weighted and is likely to be more pronounced in the future due to the activity
profile of recent acquisitions.
6 Finance expense and finance income 6 months
ended
30 June 2015
€m
6 months
ended
30 June 2014
€m
Finance expense
Bank loans 1.7 1.1
Private placement 5.5 5.9
Net defined benefit pension scheme 0.1 0.1
Fair value movement on derivative financial instruments (2.9) (1.8)
Fair value movement on private placement debt 3.3 1.8
7.7 7.1
Finance income
Interest earned (0.1) (0.1)
Net finance cost
7.6
7.0
No borrowing costs were capitalised during the period (H1 2014: Nil).
7 Taxation
Taxation provided for on profits is €18.0m which represents 18% of the profit before tax and
amortization for the period (H1 2014: 16.2%). The full year effective tax rate in 2014 was 16.4%.
The taxation charge for the six month period is accrued using an estimate of the applicable rate for the
year as a whole.
8 Analysis of net debt At
30 June 2015
€m
At
30 June 2014
€m
Cash and cash equivalents 170.6 192.7
Derivative financial instruments 19.6 (4.8)
Current borrowings (287.4) (4.3)
Non-current borrowings (352.1) (297.0)
Total net debt
(449.3)
(113.4)
Net debt, which is a non GAAP measure, is stated net of interest rate and currency hedges which
relate to hedges of debt. Foreign currency derivatives which are used for transactional hedging are not
included in the definition of net debt.

9 Financial instruments
The following table outlines the components of net debt by category:
Loans &
Receivables &
Other Financial
Assets/(Liabilities)
at Amortised Cost
€m
Liabilities at
Fair Value
through
Profit or
Loss
€m
Derivatives
Designated as
Hedging
Instruments
€m
Total Net
Debt by
Category
€m
Assets:
Interest rate swaps - - 19.6 19.6
Cash at bank and in hand 170.6 - - 170.6
Total assets 170.6 - 19.6 190.2
Liabilities:
Interest rate swaps - - - -
Private placement notes (202.0) (145.5) - (347.5)
Other loans (292.0) - - (292.0)
Total liabilities (494.0) (145.5) - (639.5)
At 30 June 2015
(323.4)
(145.5)
19.6
(449.3)
Loans &
Receivables &
Other Financial
Assets/(Liabilities)
at Amortised Cost
€m
Liabilities at
Fair Value
through
Profit or
Loss
€m
Derivatives
Designated as
Hedging
Instruments
€m
Total Net
Debt by
Category
€m
Assets:
Interest rate swaps - - 1.5 1.5
Cash at bank and in hand 192.7 - - 192.7
Total assets 192.7 - 1.5 194.2
Liabilities:
Interest rate swaps - - (6.4) (6.4)
Private placement notes (177.2) (119.4) - (296.6)
Other loans (4.6) - - (4.6)
Total liabilities (181.8) (119.4) (6.4) (307.6)
At 30 June 2014
10.9
(119.4)
(4.9)
(113.4)
For information on the currency and maturity profile of net debt please refer to note 20 in the 2014
Annual Report.
Fair value of financial instruments carried at fair value
Financial instruments recognised at fair value are analysed between those based on quoted prices in
active markets for identical assets or liabilities (Level 1), those involving inputs other than quoted
prices that are observable for the assets or liabilities, either directly or indirectly (Level 2); and those
involving inputs for the assets or liabilities that are not based on observable market data (Level 3).
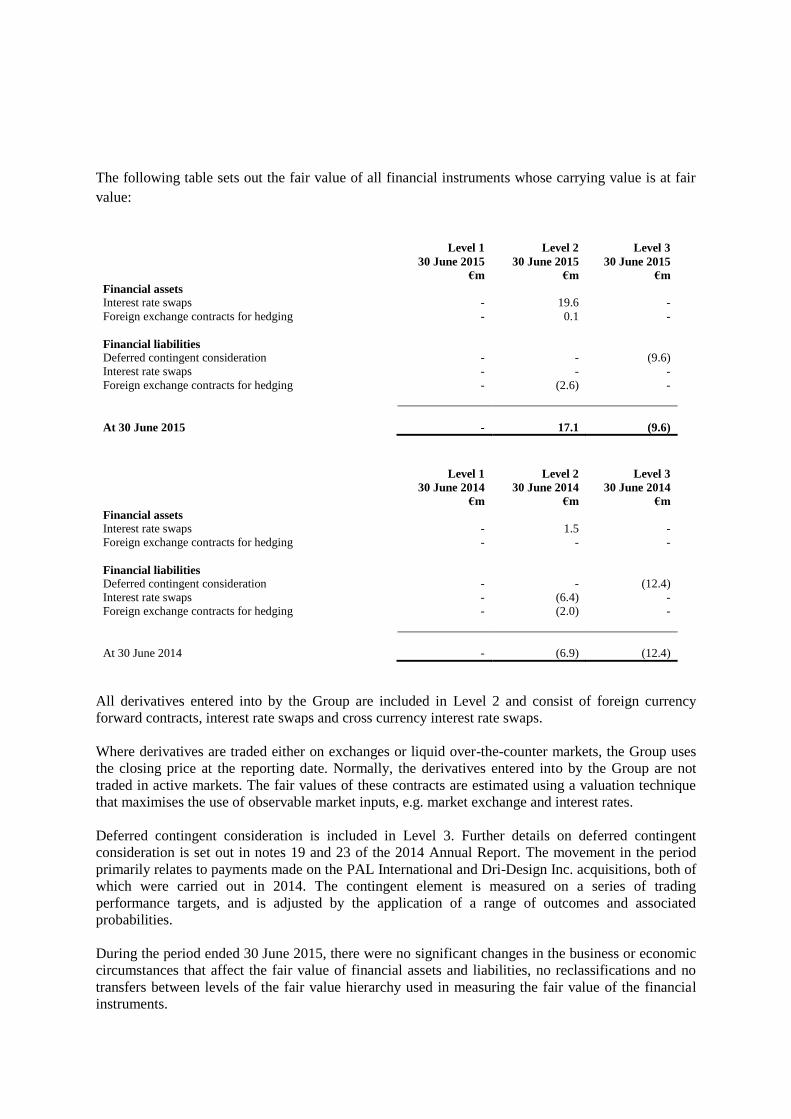
The following table sets out the fair value of all financial instruments whose carrying value is at fair
value:
Level 1
30 June 2015
€m
Level 2
30 June 2015
€m
Level 3
30 June 2015
€m
Financial assets
Interest rate swaps
Foreign exchange contracts for hedging
Financial liabilities
Deferred contingent consideration
Interest rate swaps
Foreign exchange contracts for hedging
-
-
-
-
-
19.6
0.1
-
-
(2.6)
-
-
(9.6)
-
-
At 30 June 2015
-
17.1
(9.6)
Level 1
30 June 2014
€m
Level 2
30 June 2014
€m
Level 3
30 June 2014
€m
Financial assets
Interest rate swaps
Foreign exchange contracts for hedging
Financial liabilities
Deferred contingent consideration
Interest rate swaps
Foreign exchange contracts for hedging
-
-
-
-
-
1.5
-
-
(6.4)
(2.0)
-
-
(12.4)
-
-
At 30 June 2014
-
(6.9)
(12.4)
All derivatives entered into by the Group are included in Level 2 and consist of foreign currency
forward contracts, interest rate swaps and cross currency interest rate swaps.
Where derivatives are traded either on exchanges or liquid over-the-counter markets, the Group uses
the closing price at the reporting date. Normally, the derivatives entered into by the Group are not
traded in active markets. The fair values of these contracts are estimated using a valuation technique
that maximises the use of observable market inputs, e.g. market exchange and interest rates.
Deferred contingent consideration is included in Level 3. Further details on deferred contingent
consideration is set out in notes 19 and 23 of the 2014 Annual Report. The movement in the period
primarily relates to payments made on the PAL International and Dri-Design Inc. acquisitions, both of
which were carried out in 2014. The contingent element is measured on a series of trading
performance targets, and is adjusted by the application of a range of outcomes and associated
probabilities.
During the period ended 30 June 2015, there were no significant changes in the business or economic
circumstances that affect the fair value of financial assets and liabilities, no reclassifications and no
transfers between levels of the fair value hierarchy used in measuring the fair value of the financial
instruments.

Fair value of financial instruments at amortised cost
Except as detailed below, it is considered that the carrying amounts of financial assets and financial
liabilities recognised at amortised cost in the Interim Financial Statements approximate their fair
values.
Private placement notes
Carrying amount
€m
Fair value
€m
At 30 June 2015 347.5 366.3
At 30 June 2014 296.6 313.3
10 Dividends
A final dividend on ordinary shares of 10.0 cent per share in respect of the year ended 31 December
2014 (31 December 2013: 8.5c) was paid on 15 May 2015.
The Directors are proposing an interim dividend of 8.0 cent (2014: 6.25 cent) per share in respect of
2015, which will be paid on 25 September 2015 to shareholders on the register on the record date of 4
September 2015.
11 Earnings per share
6 months
ended
30 June 2015
€m
6 months
ended
30 June 2014
€m
The calculations of earnings per share are based on the
following:
Profit attributable to owners of the Company 81.7 49.8
Number of
shares ('000)
6 months
ended
30 June 2015
Number of
shares ('000)
6 months
ended
30 June 2014 Weighted average number of ordinary shares for
the calculation of basic earnings per share
175,706
170,790
Dilutive effect of share options 3,117 3,605
Weighted average number of ordinary shares
for the calculation of diluted earnings per share
178,823
174,395
€ cent
€ cent
Basic earnings per share
46.5
29.2
Diluted earnings per share
45.7
28.6
Adjusted basic (pre amortisation) earnings per share
48.6
30.5
There are no options which are anti-dilutive included in the above calculations. At 30 June 2015, there
were no anti-dilutive shares (30 June 2014: 613,012) included in the above calculations.
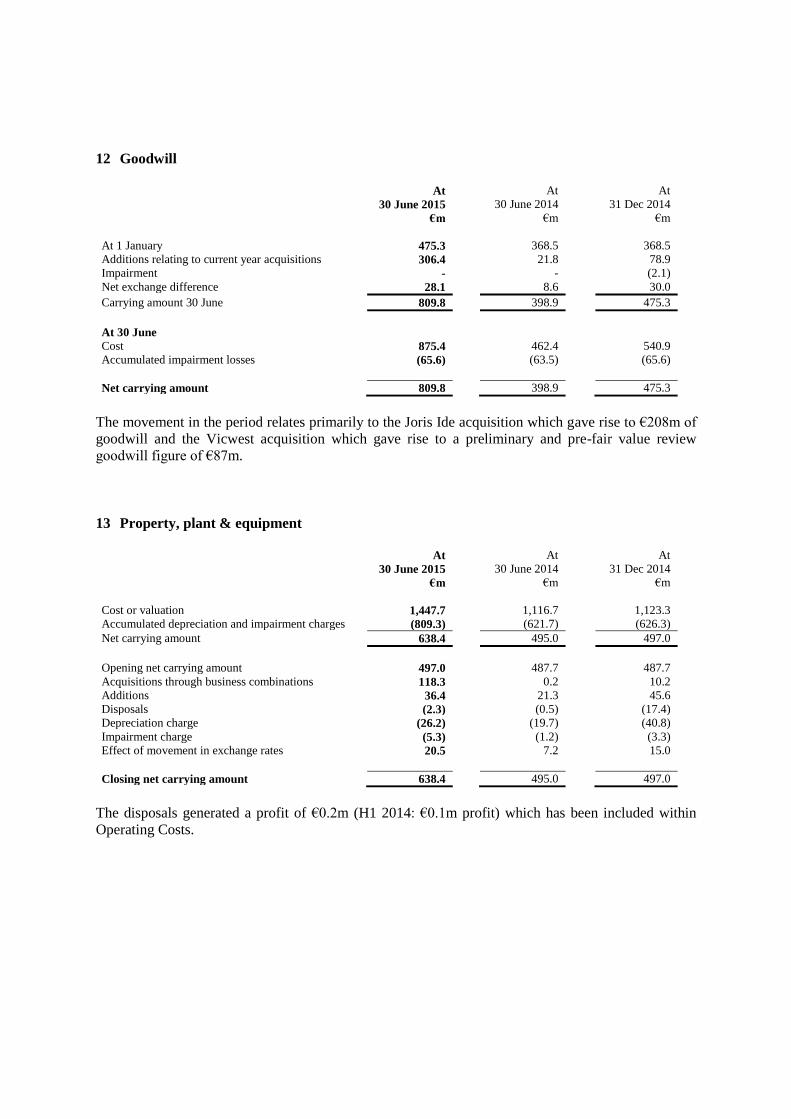
12 Goodwill At
30 June 2015
€m
At
30 June 2014
€m
At
31 Dec 2014
€m
At 1 January
475.3
368.5
368.5
Additions relating to current year acquisitions 306.4 21.8 78.9
Impairment - - (2.1)
Net exchange difference 28.1 8.6 30.0
Carrying amount 30 June 809.8 398.9 475.3
At 30 June
Cost 875.4 462.4 540.9
Accumulated impairment losses (65.6) (63.5) (65.6)
Net carrying amount 809.8 398.9 475.3
The movement in the period relates primarily to the Joris Ide acquisition which gave rise to €208m of
goodwill and the Vicwest acquisition which gave rise to a preliminary and pre-fair value review
goodwill figure of €87m.
13 Property, plant & equipment At
30 June 2015
€m
At
30 June 2014
€m
At
31 Dec 2014
€m
Cost or valuation
1,447.7
1,116.7
1,123.3
Accumulated depreciation and impairment charges (809.3) (621.7) (626.3)
Net carrying amount 638.4 495.0 497.0
Opening net carrying amount 497.0 487.7 487.7
Acquisitions through business combinations 118.3 0.2 10.2
Additions 36.4 21.3 45.6
Disposals (2.3) (0.5) (17.4)
Depreciation charge (26.2) (19.7) (40.8)
Impairment charge (5.3) (1.2) (3.3)
Effect of movement in exchange rates 20.5 7.2 15.0
Closing net carrying amount 638.4 495.0 497.0
The disposals generated a profit of €0.2m (H1 2014: €0.1m profit) which has been included within
Operating Costs.

14 Reconciliation of net cash flow to movement in net debt 6 months
ended
30 June 2015
€m
6 months
ended
30 June 2014
€m
Year ended
31 December
2014
€m
(Decrease)/increase in cash and bank overdrafts (15.1) (7.6) (19.9)
(Increase)/decrease in debt (302.2) 2.5 4.3
(Increase)/decrease in lease finance (2.2) 0.1 0.1
Change in net debt resulting from cash flows
(319.5)
(5.0)
(15.5)
Translation movement - relating to US dollar loans (5.2) (6.2) (43.6)
Translation movement - other 7.4 3.7 8.5
Derivative financial instruments movement (6.5) 0.8 31.8
Net movement
(323.8)
(6.7)
(18.8)
Net debt at start of the period
(125.5)
(106.7)
(106.7)
Net debt at end of the period
(449.3)
(113.4)
(125.5)

15 Acquisitions
On 17 February 2015, the Group acquired the remaining 50% of a previously held joint venture,
Kingspan Industrial Insulation (“KII”). KII forms part of the Insulation division and operates
mainly in the Benelux countries and the UK. In line with IFRS 3, this transaction has been treated
as a disposal of the group’s share of the joint venture and acquisition of the full 100% of the
business.
In March 2015, the Group acquired 100% of the share capital of Steel Partners NV, the holding
company of the Joris Ide. Joris Ide is a pan European manufacturer and supplier of insulated
panels, profiles and related accessories.
The provisional fair values of the acquired assets and liabilities at the respective acquisition dates
are set out below:
Joris Ide
Kingspan
Industrial
Insulation
Total
€’m €’m €’m
Non-current assets
Intangible assets 34.5 - 34.5
Property, plant and equipment 84.5 4.8 89.3
Current assets
Inventories 79.6 3.0 82.6
Trade and other receivables 37.2 6.6 43.8
Current liabilities
Trade and other payables (91.7) (6.4) (98.1) Provisions for liabilities (9.8) (2.1) (11.9)
Non-current liabilities Deferred tax liabilities (21.9) (0.2) (22.1)
Total identifiable assets 112.4 5.7 118.1
Goodwill 208.0 9.8 217.8
Total consideration 320.4 15.5 335.9
Satisfied by:
Cash (net of cash/debt acquired) 265.9 7.7 273.6
Share capital issued 54.5 - 54.5
Value attributed to initial 50% of the business - 7.8 7.8
Total consideration 320.4 15.5 335.9
Since the valuation of the fair value of assets and liabilities recently acquired is still in progress,
the above values are determined provisionally.
Both the Joris Ide and KII goodwill is attributable principally to the profit generating potential of
the business, together with a strong workforce and synergies expected to be achieved from
integrating these businesses into Kinsgpan’s existing structure.

15 Acquisitions (continued)
VicWest Inc.
In May 2015, Kingspan received regulatory approval for the acquisition of the Building Products
division of Vicwest Inc. (“Vicwest”). Vicwest is a Canadian listed company and its BP
division comprises three Insulated Panel manufacturing plants, in addition to a number of
profiling facilities across Canada and the US. The total consideration including debt and related
costs amounts to €139m.
Due to the close proximity of the acquisition to 30 June 2015, the fair value of the Vicwest
balance sheet on acquisition cannot be ascertained at this point, however, the fair value exercise
will be completed prior to year end.
In the post-acquisition period to 30 June 2015, the businesses acquired in the current period
contributed total revenue of €184m and a trading profit of €16.2m to the Group’s results.
16 Capital and reserves
Issues of ordinary shares
1,808,084 ordinary shares (H1 2014: 1,283,257) were issued as a result of the exercise of vested
options arising from the Group’s share option schemes (see the 2014 Annual Report for full
details of the Group’s share option schemes). Options were exercised at an average price of €3.99
per option.
As part of the consideration for the acquisition of Joris Ide, 3 million shares were issued to the
vendors.
17 Significant events and transactions
There were no individually significant events or transactions in the period which contributed to
the material changes in the Statement of Financial Position; the more significant movements are
described below:
the changes in Inventories, Trade & other receivables and Trade & other payables reflect the
normal business cycle;
the fair value of derivatives moved as a result of the movements in the US dollar exchange
rate against both sterling and the euro; and
the positive currency translation movement of €66.3m reflected in the Consolidated Statement
of Comprehensive Income reflects primarily the strengthening of sterling and the US dollar.

18 Related party transactions
There were no changes in related party transactions from the 2014 Annual Report that could have
a material effect on the financial position or performance of the Group in the first half of the year.
19 Subsequent events
On 1 July 2015, Kingspan completed the acquisition of SPU Oy (“SPU”), a Finnish based
Insulation boards business, for consideration of €22.5m. Further disclosure on the SPU
acquisition has not been provided on the grounds of materiality. Since acquisition, SPU has been
integrated into Kingspan’s existing Insulation Boards division.