king township economic development strategy 26, 2014 · economic development strategy final report...
TRANSCRIPT

Millier Dickinson Blais: King Township Economic Development Strategy
King Township Economic Development Strategy Final Report Approved November 2013
On behalf of Council, it is my pleasure to present the first ever Economic Development Strategy for King Township. The Strategy will guide sustainable economic development opportunities over the longer term and support growth and investment in the community through the attraction of new business and the efforts of nurturing the growth of existing businesses and entrepreneurs. There are four high level goals that are intended to anchor and qualify the Township’s strategic economic development initiatives. These goals also support the Township’s overreaching vision of a sustainable community and the desired outcomes of the economic development planning process.
I would like to take this opportunity to encourage you to get involved, support our local businesses and support a viable and sustainable local economy in King. We are pleased to have our Economic Development Strategy underway and look forward to the five year journey which will enrich and complement our community. Sincerely,
Mayor Steve Pellegrini Township of King
Mayor’s Message
Councillor Peter Grandilli, Mayor Steve Pellegrini, Councillor Cleve Mortelliti, Councillor Bill Cober, Councillor Debbie Schaefer
Councillor Linda Pabst, Councillor Avia Eek

Millier Dickinson Blais: King Township Economic Development Strategy
Contents
1 EXECUTIVE SUMMARY .................................................................................................................. 1
2 INTRODUCTION .............................................................................................................................. 6
2.1 A NEW DIRECTION FOR ECONOMIC DEVELOPMENT 6
2.2 APPROACH AND METHODOLOGY 7
2.3 ALIGNMENT WITH OTHER PLANS 7
3 CURRENT CONTEXT .................................................................................................................... 10
3.1 REGIONAL ECONOMIC PERFORMANCE 10
3.1.1 POPULATION GROWTH 10
3.1.2 INDUSTRY TRENDS 11
3.1.3 GROWING SERVICE ECONOMY 12
3.1.4 YORK REGION ECONOMIC DEVELOPMENT ACTION PLAN 13
3.2 ATTRIBUTES OF THE LOCAL ECONOMY 15
3.2.1 POPULATION 15
3.2.2 LABOUR FORCE 18
3.2.3 BUSINESS AND INDUSTRY 22
3.2.4 INFRASTRUCTURE AND EMPLOYMENT LAND 24
3.2.5 COMMUNITY BASED ASSETS 29
3.3 POLICY ENVIRONMENT 32
3.3.1 PROVINCIAL AND REGIONAL PLANNING CONSIDERATIONS 33
3.3.2 LOCAL PLANNING FRAMEWORK 34
3.4 FISCAL CONSIDERATIONS 37
3.5 MAJOR COLLABORATIVE INITIATIVES 39
3.5.1 AN EQUESTRIAN CENTRE OF EXCELLENCE 39
3.5.2 BUILDING BROADBAND AND A KNOWLEDGE ECONOMY 40
3.5.3 EXPANDING THE POST-SECONDARY PRESENCE IN YORK REGION 41
3.5.4 BRINGING LOCAL FOOD AND INNOVATIONS TO MARKET 42

Millier Dickinson Blais: King Township Economic Development Strategy
4 SWOT ASSESSMENT ................................................................................................................... 45
4.1 STRENGTHS 45
4.2 WEAKNESSES 47
4.3 OPPORTUNITIES 48
4.4 THREATS 50
5 STRATEGY DEVELOPMENT PROCESS ...................................................................................... 53
5.1 VISION STATEMENT 54
5.2 GOALS, OBJECTIVES AND ACTIONS 54
5.3 PERFORMANCE MEASUREMENTS 56
5.4 ACTION PLAN 57
GOAL 1 – INVESTMENT READINESS 57
GOAL 2 – A COMMITMENT TO COMMUNITY AND SUSTAINABILITY 60
GOAL 3 – A CULTURE OF ENTREPRENEURSHIP 62
GOAL 4 – A STRONG INNOVATIVE RURAL BRAND 65
5.5 IMPLEMENTATION PLAN 67

Millier Dickinson Blais: King Township Economic Development Strategy

1 Millier Dickinson Blais: King Township Economic Development Strategy
1 Executive Summary
Planned Growth
There are a number of regional initiatives and assets that have the potential to transform the economic fortunes of King
Township in the coming years. This includes the planned expansion of Seneca College‟s King Campus and the York Region
Broadband Strategy. In addition, many of the high-value initiatives that are impacting the growth of York Region – such as the
improvements to the 400-series highways, the GTA West Corridor, the expansion of public transportation including GO Transit,
the current and planned review of the Provincial Policy Statement, the Greenbelt Plan and the Oak Ridges Moraine
Conservation Plan, while wholly dependent on the support, advocacy and/or decisions of the regional and provincial
governments, have the potential to significantly alter the Region‟s and the Township‟s economic landscape.
The Approach
The approach employed in the economic development strategy has involved the following steps:
1. An environmental scan and literature review of available local and regional census data, reports, studies and land use
planning documents;
2. A review of local and regional economic development efforts considered relevant to the development of the strategy;
3. An assessment of local and regional business and investment trends;
4. The development of an economic profile that highlights key patterns of change in relation to a variety of socio economic
indicators;
5. An analysis of target industry and business attraction opportunities;
6. Stakeholder interviews with key business and community leaders, as well as municipal officials who are able to provide further
insight into trends related to the Town‟s ongoing strategic planning efforts, and land use and policy framework, and how
these issues may affect the Town‟s economic growth and development; and
7. A SWOT assessment (strengths, weaknesses, opportunities and threats) that examined the Township‟s ability to support the
attraction, retention and expansion of business investment and its capacity to deliver on economic development
programming.

2 Millier Dickinson Blais: King Township Economic Development Strategy
Strengths, Weaknesses, Opportunities, and Threats
Strengths A Preferred Place to Live
Location in the Greater Toronto Area
A Strong Regional Economy
Access to a Talented Local and Regional Labour Force
Effective Community Partners: Flourishing agricultural Community
Strong and Growing Educational Sector
An Emerging Creative Economy
Unique Cultural and Recreational Assets
Weaknesses Lack of Investment Readiness
Limited Broadband Connectivity
High Cost of Employment Land
Small Employment Base
Outflow of Local Labour Force
Age of Land Use Planning Documents
High Cost of Housing
Lack of Cultural Diversity
Lack of a Distinctive Identity
Opportunities Complete Community Improvement Plans
Create a Corporate Gateway to the Community Leverage Post-Secondary Presence
Pursue an Agri-business Innovation Hub
Support for Small and Medium Sized Businesses
Identify Strategic Employment Area
Advocate Alignment of Economic Policy with Urban and Rural Economies
Develop a Stronger Value Proposition for Business Investment
Threats Changes to Provincial Planning Framework will Take Time
Sustainability of Debt Servicing
Limited Public Transit Linkages
Decline of the Equine Industry

3 Millier Dickinson Blais: King Township Economic Development Strategy
High Level Goals
The King Township Economic Development Strategy has four
high level goals that are intended to anchor and qualify the
Township‟s strategic economic development initiatives. These
goals also support the Township‟s overarching vision of a
sustainable community and the desired outcomes of the
economic development planning process.
1. Investment Readiness
Increase attractiveness to new business investment and entrepreneurs and expand existing businesses
Pursue collaborative partnerships that demonstrate leadership in rural economic development
2. A Commitment to Community & Sustainability
Support the growth of a viable local economy by enhancing the quality of place of our villages
Become a model rural community that strives to balance economic growth with environmental responsibility
3. A Culture of Entrepreneurship
Leverage local talent and expertise to generate new
investment and innovation in our economy
Link regional post-secondary institutions and research
activities to the local economy
Support the growth and development of small business and
entrepreneurs
4. A Strong, Innovative Rural Brand
Build awareness of the Township‟s economic potential
Promote and enhance the Township‟s cultural, heritage and recreational resources

4 Millier Dickinson Blais: King Township Economic Development Strategy
Action Items
Goal 1: Investment Readiness
1. Initiate a review of the Township‟s Official Plan and Zoning Bylaws 2. Prepare Community Improvement Plans in the settlement areas of King Township 3. Develop an inventory of commercial and industrial real estate 4. Increase the availability of shovel ready industrial land and seek the appropriate approvals 5. Complete a Corridor Study for King Road between Jane and Dufferin Streets with the goal of stimulating economic
development 6. Streamline the development approvals process for new commercial and industrial development 7. Pursue opportunities to designate the lands at Highway 400 and King Road as a Strategic Employment Area 8. Support and promote York Region‟s efforts to improve and leverage broadband connectivity 9. Pursue opportunities to diversify sources of on farm revenue
10. Pursue opportunities to expand the range of land uses that are permitted within the Township‟s Greenbelt lands 11. Participate in the tourism and industry development efforts being undertaken by Headwaters Equine Leadership 12. Contribute to provincial discussions regarding the future 427 and 400 link.
Goal 2: A Commitment to Community & Sustainability
13. Support the creation of Business Improvement Areas in each of the Villages 14. Effectively promote the features and characteristics of the Township‟s Villages that will appeal to visitors 15. Consider the opportunities to create innovative live-work arrangements 16. Consider the opportunities associated with the development of lifestyle housing 17. Continue to support the implementation of a BR+E program 18. Position and promoting King Township libraries as community gathering points 19. Consider opportunities to create an eco-industrial park at King and Jane 20. Amend the Township‟s 2004 Procurement By-law to place a greater emphasis on environmental stewardship
Goal 3: A Culture of Entrepreneurship
21. Secure the development of an Agri-business Centre around Holland Marsh focused on innovation
22. Pursue opportunities to create an innovation hub focused on research and education
23. Initiate a crowdsourcing initiative for King Township to raise money for community development projects
24. Give consideration to creating an economic development working group within the sustainability committee
25. Work with Seneca College and York Region to support and expedite the Phase I planned expansion to be completed in 2016.
26. Work with Seneca College and the Holland Marsh Growers Association to develop and host a symposium on the “Future of
Local Food in York Region”
27. Collaborate with York Region`s Economic Development Department
28. Promote the services of the York Small Business Enterprise Centre
29. Develop a stronger partnership with ventureLAB in Markham to encourage and support entrepreneurship
30. Work with Chamber of Commerce and Small Business Enterprise Centre

5 Millier Dickinson Blais: King Township Economic Development Strategy
Goal 4: A Strong, Innovative Rural Brand
31. Prepare a detailed investment and community profile that illustrates the characteristics of the Township
32. Build on the success of www.economicking.ca by creating a website that is dedicated to economic development
33. Complete sector profiles for key economic sectors
34. Leverage the investment marketing resources and efforts of York Region Economic Development
35. Build on the success of Holland Marsh Soupfest and Feast of Fields to organize other local food events
36. Promote more participation of local farms in York Region‟s Farm Fresh Initiative
37. Align the Schomberg Fair with the province‟s Local Food Week. Leverage provincial funding and seek innovative partnerships
to enhance the Schomberg Fair.
38. Develop a Cultural Plan and Cultural Asset Map to support the development of the arts, culture, recreation and culinary
tourism
Measuring Performance
The effective implementation of the recommended actions for the King Township`s economic development office must be
accompanied by effective performance measurement and monitoring. Performance measures are a tool to evaluate the
effectiveness of an organization‟s activities. By tracking and reporting on its efforts, the economic development office will
be more likely to:
Be accountable and responsive to the expectations of its stakeholders;
Be able to demonstrate the return on investment into the department and the programs it supports;
Improve its performance by learning from prior efforts, and;
Receive additional support (in the form of staff, funding and other resources) to pursue its mandate.
To that end, this strategy provides a series of potential performance measurements associated with each goal statement.
These performance measures are preliminary suggestions to inform a more detailed accounting and evaluation of the
office‟s activities.

6 Millier Dickinson Blais: King Township Economic Development Strategy
2 Introduction
2.1 A New Direction for Economic Development
In an economy that is increasingly global, rural municipalities the size of King Township take a back seat to larger urban
centres and economic regions that can provide modern and efficient infrastructure, transportation connections and large
consumer and labour markets. More often than not, rural communities are left grappling with how to respond to youth out-
migration, an aging population, a smaller tax base to pay for government services and fewer educational, cultural and
recreation opportunities when compared to larger urban areas.
As a community of approximately 20,000 people, King Township is the smallest municipality in York Region with a limited
asset base in terms of clusters of employment or industrial activity. Though the Township has many advantages inherent
in its natural environment, the presence of post-secondary institutions, access to a 400 series highway and a skilled
workforce, competition for business investment with larger and better-resourced neighbours will rarely be in its favour.
Furthermore, there are few areas where the township has complete control over its own economic growth, but rather must
rely on collaboration, partnerships and the decisions of senior levels of government and private sector to advance its
economic development agenda.
In preparing its first economic development strategy the Township needs to reflect an understanding of the opportunities
for cooperation and regional collaboration and be prepared to contribute to those efforts that will provide the greatest
return and reward to the municipality. Presently, there are a number of regional initiatives and assets that have the
potential to transform the economic fortunes of King Township including the planned expansion of Seneca College and
the York Region Broadband Strategy. In addition, many of the high-value initiatives that are impacting the growth of York
Region – such as the improvements to the 400-series highways, the GTA West Corridor, the expansion of public
transportation including GO Transit, the current and planned review of the Provincial Policy Statement, the Greenbelt Plan
and the Oak Ridges Moraine Conservation Plan, while wholly dependent on the support, advocacy and/or decisions of the
regional and provincial governments, have the potential to significantly alter the Region‟s and the Township‟s economic
landscape.
In this environment, a strong relationship with the Region‟s economic development office is essential. York Region is
better resourced, better positioned to market to investors, better able to support the needs of small business and better
able to negotiate on behalf of its municipal partners for economic development funding from upper levels of government

7 Millier Dickinson Blais: King Township Economic Development Strategy
and required shifts in the province‟s land use policy framework. This regional collaboration, done in conjunction with local
economic development efforts that includes the advancement of investment ready employment land can direct new
opportunities to the Township that would otherwise be unavailable.
2.2 Approach and Methodology
It is King Township‟s intent to develop a five year economic development strategy that will guide sustainable economic
development opportunities over the longer term and support growth and investment in the community through the
attraction of new business and industries to the community and the efforts of existing businesses and entrepreneurs.
A critical component to the development of any economic development strategy regardless of the size of the community is
a solid understanding of a community‟s performance against a range of local and regional socio-economic indicators
combined with an analysis of current and emerging business and industrial investment trends and their related impact.
The discussion contained in this report provides an understanding of the issues and external forces that are shaping
economic growth in King Township and York Region. Consideration has been given to the current context for growth
including the constraints associated with the province‟s Places to Grow Growth Plan.
The results of this assessment have been used to inform the subsequent stakeholder discussions about the opportunities
and the challenges facing King Township in its efforts to enhance its value proposition for the attraction of business,
investment and residents to the community. The resulting strategy capitalizes on the elements and characteristics that
distinguish the township and more effectively positions it for a sustainable future.
The appendices to this report provide a more detailed understanding of the issues and forces that are shaping economic
growth in King Township and more generally in York Region.
2.3 Alignment with Other Plans
In addition to the direction provided by the economic development strategy, King Township has also developed a
framework for community sustainability in the form of an Integrated Community Sustainability Plan. The Plan which was
adopted by Council in 2012 conveys the municipality‟s aspirations to bring a balanced approach to the environmental,
economic, socio-cultural and financial priorities of King Township. There are a number of goals in the plan with direct
implications for the economic development strategy:
8 Millier Dickinson Blais: King Township Economic Development Strategy
We will have a strong local economy, where existing and new businesses prosper and the commercial and retail
needs of King Township residents are met locally.
Agriculture and farming will be an economically viable and prosperous industry, recognized for its contribution to
sustainability. We will promote and celebrate our local food.
There will be a clear vision and strategy for driving economic growth, built on community collaboration and
engagement. We will proactively attract and strategically plan for new businesses that are compatible with the
community‟s values and priorities.
The goals, strategic objectives and actions contained in King‟s economic development strategy are well aligned with these
expectations and include performance-based metrics for achieving these outcomes together with select economic
indicators that will monitor changes in the local economy and results achieved by the Township over the implementation
of the economic development strategic plan.

9 Millier Dickinson Blais: King Township Economic Development Strategy

10 Millier Dickinson Blais: King Township Economic Development Strategy
3 Current Context
King Township is fortunate to be part of a larger economic region that is characterized as having one of the fastest
growing and diverse economies in Ontario and Canada. This fact alone suggests that the King has significant
opportunities to direct local growth.
This section of the report provides an understanding of the recent economic performance of York Region and reflects on
the economic development priorities for the region as a whole. The discussion provides insight into the opportunities and
challenges that King must confront in advancing its economic agenda and establishes the context for a review of King‟s
local economy. King‟s current policy environment for guiding decision making and to a large extent the implementation of
the economic development strategy is also discussed.
3.1 Regional Economic Performance
3.1.1 Population Growth
The province‟s Growth Plan for the Greater Golden Horseshoe (the Growth Plan) sets outs a vision and policies to better
manage growth, to plan for complete communities and to protect the region‟s natural environment. In the Growth Plan it
assumes that population in York Region will increase from 760,000 in 2001 to 1.5 million by 2031 and 1.8 million by
2041.1
In addition to the rapid growth in the region, York‟s population is becoming one of the most ethnically diverse in Canada,
with much of these populations concentrated in Markham, Richmond Hill and Vaughan. York region is also
characteristically young, well-educated and highly skilled with much of the labour force employed in professional, scientific
and technical services, information and cultural industries, educational services and financial services occupations. The
quality of the labour force has been a contributing factor to the region‟s historical success in attracting business
investment and entrepreneurs. As a result, York Region‟s economic development office is focused on ensuring that
workforce attraction and development efforts continue to align with the needs of existing and new businesses in the
region.
1 Proposed Amendment 2 (2012) to the Growth Plan for the Greater Golden Horseshoe, 2006, Schedule 3, p.8.

11 Millier Dickinson Blais: King Township Economic Development Strategy
3.1.2 Industry Trends
From an industry growth perspective, York Region has a clear advantage over many other communities across Ontario
and Canada in information technology, biotechnology, automotive and business services industries.
The information technology sector is highly integrated with other industries for which it can provide and adopt
technological solutions. Many communities in York (e.g. Richmond Hill, Markham, and Newmarket) have identified this
sector as a key growth industry for investment expansion and attraction efforts in conjunction with other elements of their
economies. The research and education support available at the University of Toronto, York University and Seneca
College are helping advance technological breakthroughs and are contributing to the development of a workforce that is
well suited to York Region‟s knowledge-based industries.
York‟s biotechnology sector is largely comprised of pharmaceutical, medical devices, medical technologies and
bioinformatics industries. Regional assets such as York University‟s Centre for Research in Mass Spectrometry, the
Southlake Regional Health Sciences Centre in Newmarket and leading multinational innovators such as IBM in Markham
are key players in expanding future opportunities in this sector across the region.
York‟s sector industry has one of the most influential automotive parts manufacturers in the world with Magna
International in Aurora. Considerable public and private research and development investment has been directed into this
industry and companies across the value chain for design and clean technology innovation have benefitted.
Another key industry that is driving growth in the region is the business services sector. This sector includes businesses
that are addressing efficient and effective ways of containing business costs. They typically include computer systems
design, engineering services, management consulting and accounting services businesses. Leading innovative firms such
as OpenText and WorleyParsons are global leaders in this field and located in the region.
The agricultural sector is concentrated in the northern municipalities of the region. The centre of this sector in the region is
the Holland Marsh, one of Ontario‟s and Canada‟s most productive growing areas. The highest proportions of farms in the
region are in horse and other equine production, hay farming, beef cattle ranching and vegetable farming. Urban growth in
the south has also created a large consumer market for locally grown products and contributed to an expanding agri-
tourism sector. Ongoing efforts to align the Holland Marsh growers with agri-business entrepreneurs and research
institutes will only strengthen this segment of the economy.
Tourism is also a growing sector of the regional economy. York Region is part of the largest concentration (i.e. the GTA)
of people in Canada, which provides a ready market for tourism activities and programming although much of the visitor
and tourist activity to York Region is same day visits. Total annual same day visits for the Central Counties Tourism
Association (which includes York Region, Durham Region and Hills of the Headwaters) was estimated at 5.4 million in

12 Millier Dickinson Blais: King Township Economic Development Strategy
2010 as compared to 4.7 million in 2006.2 Tourism assets such as Canada‟s Wonderland and Vaughan Mills Shopping
Centre in Vaughan draw many of these same day visitors. However, regional sporting events, a strong base of local
festivals, cycling trails and other tourism amenities place York region in a strong competitive position to further develop a
sustainable, viable, regional tourism industry.
3.1.3 Growing Service Economy
The region‟s growth in the high technology, service-oriented industries places an increased reliance on the need for
skilled or „creative class workers. The concept of the creative class refers to people who employ a high level of analytical,
social and reasoning skills in roles that offer a high degree of autonomy. These people tend to have higher levels of
education and higher wages than the rest of the workforce. Research has also found that there is a strong correlation
between the regional stock of creative occupations and economic development, leading economic development
professionals, at least in part, to develop assets that cater to this group of workers. Creative people tend to be highly
mobile and able to choose where they live on the basis of local assets that include cost of living, access to cultural
amenities, entertainment options and natural beauty.
York region has a very large composition of creative class workers at approximately 36.5% of the labour force (2006),
compared to the province which has approximately 29.5% of the labour force composed of the creative class workers.3
The higher than average share reflects the nature of the regional economy, but also suggests that creative class workers
have chosen to live in York Region because of the perceived quality of life options that are available.
While creative class workers4 have driven significant growth in the region, the service class
5 (e.g. retail professions) has
also expanded. This trend is not unexpected given the rapid population growth that has occurred in recent years; however
service class occupations typically earn lower compensation, which can result in higher levels of commuting between high
cost and low cost jurisdictions.
2 Ministry of Tourism, Regional Tourism Organization 6, based on data collected in the Travel Survey of Residents of Canada and the International Travel Survey, 2006, 2010.
http://www.mtc.gov.on.ca/en/research/rtp/rtp.shtml, last modified on January 10th, 2013, viewed on April 12th, 2013.
3 Derived from Millier Dickinson Blais using Statistics Canada‟s 2006 Census data.
4 Creative class– those workers that are paid to think including scientists and technologists, artists and entertainers, managers and analysts.
5 Routine class - where work involves limited autonomy and is service-oriented, and includes (for example) clerks and food-service workers.

13 Millier Dickinson Blais: King Township Economic Development Strategy
3.1.4 York Region Economic Development Action Plan
Despite the historic challenges and issues that have impacted economic growth in King Township, the community is part
of a larger economic region that is characterized as having one of the fastest growing and diverse economies in the
country. With the Province‟s Growth Plan anticipating a significant rate of growth over the next twenty years, Vision 2051
– a strategic blue print for the Region‟s growth over the next 40 years, gives priority to creating the conditions for an
“Innovation Economy”.
The plan‟s goal of an Innovation Economy is articulated as follows:
“Resilient and focused on creativity and innovation with sufficient infrastructure and resources to support a knowledge economy. York Region’s diverse labour force is supported with opportunities for
collaboration and continuous learning development.”
Building on this desired outcome, York Region has released its Economic Development Action Plan that leverages the
successful implementation of its 2005 Economic Development Strategy and places a renewed emphasis on creating jobs.
This emphasis on job creation includes targets to address the quantity of jobs required to maintain a healthy live-work
balance, the types of knowledge-based employment it is looking to attract and foster, as well as the creation and
expansion of innovative companies and assets across the Region.
The six goals that inform the overall direction of the action plan have direct implications for King Township. In particular, goals 1 and 2 are seen as transformational for both the region and the township resulting in significant long term economic impact.
1. Develop a greater post-secondary and research presence. York Region is actively supporting the expansion of
post-secondary activities, programs and partnerships across the region. While efforts are focused on attracting a „new‟
post-secondary campus, the Region is also targeting opportunities for public and private research-based investments and
focusing on partnerships with existing facilities and support development of new innovation hubs.
2. Provide connectivity to support innovation. York Region is committed to enhancing and extending innovation-
supportive infrastructure across the region. This includes assessing community readiness to develop network connections
and upgrades and an assessment of gaps in existing broadband/bandwidth networks. The results will be used to identify
priority areas, hubs and linkages for network connections and opportunities for public and/ or business incubators as
anchors in key sectors.
3. Develop the innovation network connecting businesses to opportunities. With over 80% of jobs in York Region in
the service producing sectors, additional emphasis is being placed on engaging and helping companies and institutions
become innovative in order to grow. Significant clusters already exist in the region in information and communications

14 Millier Dickinson Blais: King Township Economic Development Strategy
technology, life sciences, and financial services, with a strong emphasis on the provision of services such as
management, engineering, and research and development in these areas.
4. Develop a strong, shared marketing message. Investors and investment intermediaries have identified the need for
a common set of marketing messages and a marketing plan to relay the region‟s competitive advantages in a consistent
fashion to a variety of audiences. While the York Region sees itself as an economic powerhouse, able to compete on the
global stage for the best and the brightest investments and talent, it remains under the radar of many investors in
comparison to other regions within Greater Toronto Area and Hamilton area and its marketing efforts are often viewed as
fragmented.
5. Creating the place to live, work and invest, including appropriate real estate. Employment lands along the
region‟s 400 series highways are viewed as supporting future value-added, knowledge-based employment growth – a key
component of future economic prosperity. The Region believes that these land areas, where available, should be
protected for high value-added users, as the supply of direct frontage sites is limited. In addition to the 400 corridors,
consideration is also being given to developing spaces that support innovation, including research parks and business
incubators. Maintaining an inventory of office and employment land development sites for marketing and industry policy
development purposes is seen as an essential step in this effort.
6. Develop a viable workforce. To sustain an innovative and knowledge based economy, the Region acknowledges that
at least two-thirds of all new jobs will need to be in the core economy of business services, manufacturing and related
activities. This type of employment activity is not tied directly to population, but rather to a host of location factors such as
the presence of industry clusters and the elements that support them. It will require effort to attract and retain this type of
employment and the region will need to maintain a steady net in-flow of highly-skilled immigrants into the economy to
ensure the region‟s workforce continues to satisfy growing employer needs.
A key consideration in the development of King Township`s economic development strategy is the degree to which it can
align its efforts with the programming and activities being undertaken at the regional level. While the region‟s employment
base still has a large manufacturing base, it is shifting away from goods-producing industries and towards a more service
based economy, driven in large part by business and financial services. Furthermore, the regional economy has the
capacity to support technological innovation and commercialization efforts as evidenced by partnerships such as
ventureLAB, and the growth of small business and business start-ups as evidenced through the work of the York Region
Small Business Enterprise Centres.
It is also important to recognize that much of the region‟s business growth has been driven by small, innovative and often
entrepreneurial firms. In fact, small firms are the predominant enterprises in York Region with over 88.5% of firms in 2012

15 Millier Dickinson Blais: King Township Economic Development Strategy
employing less than 20 people. This fact should inform King Township‟s employment land polices, as well as its economic
development programming.
3.2 Attributes of the Local Economy
A full and complete economic base analysis of King Township is provided in Appendix I of this report. The following
section highlights some of the primary considerations impacting economic development priorities for the community.
3.2.1 Population
While King Township benefits from the proximity to the Greater Toronto Area, it is largely characterized as a rural
community, due in large part to the growth limits imposed by the province‟s Greenbelt Plan and Oak Ridges Moraine Plan.
Results of the 2001, 2006 and 2011 Census of Canada, illustrate the limited population and employment growth that has
occurred over this time period. While York Region‟s population expanded by some 41.6%, King‟s rate of growth was just
7.4% (See Figure 1). If consideration is given to select municipalities, the results are similar. Richmond Hill experienced a
40.5% increase in population, while Aurora experienced a 32.5% increase. Caledon and Whitchurch-Stouffville
experienced a 17.5% and 71% increase, respectively. (See Appendix I for additional information on the attributes of the
local economy)
FIGURE 1: POPULATION CHANGE, 2001-2011, KING AND SURROUNDING COMMUNITIES
Source: 2001 and 2011 Census of Canada, Statistics Canada
71.0%
41.6% 40.5% 32.5%
17.5% 7.4%

16 Millier Dickinson Blais: King Township Economic Development Strategy
Notwithstanding the obvious limit on development, King is embarking on a period of unprecedented growth over the next
18 years. Based on York Region forecasts, King‟s population will increase from 23,400 residents in 2011 to 35,100 in
2031 with employment slated to increase from 8,000 jobs to 12,100.6 Based on these projections, the Township will need
to provide an additional 920 residential units to accommodate the intensification targets established for York Region in the
Growth Plan7, as well as the necessary employment land to accommodate new business and enterprises that will be
attracted to the Township. The planned growth will be directed to the villages of King City, Schomberg and Nobleton.
With only modest population increases, it is evident that the population of King is also getting older and that housing costs
are restricting labour mobility that would otherwise attract a younger workforce to the community. The median age of a
resident of King, as of 2011 was 42.9 years of age, 2.5 years older than the provincial median and 3.6 years above the
median age for York Region. The population between the ages of 25-39 makes up a smaller share of the population than
older cohorts which has implications for the long term productivity of the local labour force and the ability of the community
to attract business investment. One of the contributing factors to this trend is the cost of housing, which is among the
highest in the GTA. As of 2012, the average value of a dwelling in King was $616,811 compared to $462,946 in Caledon
and $485,148 in Richmond Hill.8 This will limit the municipality‟s ability to attract and retain younger workers and families,
singles and retirees. A recent study conducted by the Kennedy School at Harvard confirmed that housing prices and land-
use restrictions threaten labour mobility, a vital part of a healthy economy.9
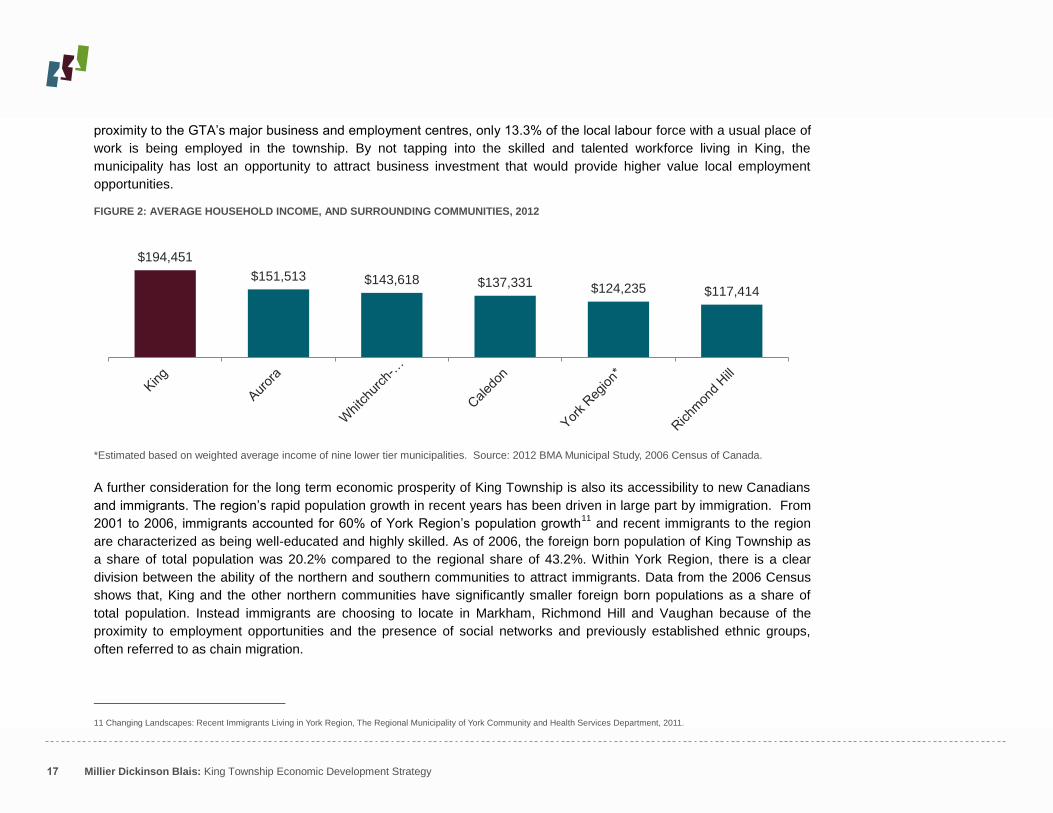
It is not surprising given these trends that average household income in King was found to be nearly 60% greater than the
average across York Region (Figure 2). The implication of an affluent, but aging population is mixed. On the one hand the
Township has the opportunity to attract the range of services and amenities that will be demanded by a more affluent
population – higher end restaurants and retail, recreation and cultural amenities. On the other hand, King Township will be
challenge to provide diverse housing choices and local, accessible amenities and services for a population that will
ultimately age in the community.
Residents of King Township are well educated and York Region as a whole is amongst the most educated in North
America.10
Nearly six out of 10 people in King and 55% of people over the age of 15 in York Region have completed
some level of post-secondary education. It is also worth noting that nearly 50% of King Township‟s residents that have
completed a post-secondary program have studied architecture, engineering and related technologies, or business
administration. Despite this concentration of talent and skills, much of King‟s working population leaves the community
daily for employment in other parts of the GTA. While this pattern of commuting can be expected given the township‟s
6 York Region 2031 Population and Employment Forecasts, York Region Planning and Development Services, January 2009.
7 Growth Plan for the Greater Golden Horseshoe, Ministry of Infrastructure, June 2016.
8 BMA Consulting, 2012 Municipal Study.
9 Immobile Labour, Harvard Magazine, January-February 2013.
10 Advantage Ontario, Ontario‟s Jobs and Prosperity Council, 2012
17 Millier Dickinson Blais: King Township Economic Development Strategy
proximity to the GTA‟s major business and employment centres, only 13.3% of the local labour force with a usual place of
work is being employed in the township. By not tapping into the skilled and talented workforce living in King, the
municipality has lost an opportunity to attract business investment that would provide higher value local employment
opportunities.
FIGURE 2: AVERAGE HOUSEHOLD INCOME, AND SURROUNDING COMMUNITIES, 2012
*Estimated based on weighted average income of nine lower tier municipalities. Source: 2012 BMA Municipal Study, 2006 Census of Canada.
A further consideration for the long term economic prosperity of King Township is also its accessibility to new Canadians
and immigrants. The region‟s rapid population growth in recent years has been driven in large part by immigration. From
2001 to 2006, immigrants accounted for 60% of York Region‟s population growth11
and recent immigrants to the region
are characterized as being well-educated and highly skilled. As of 2006, the foreign born population of King Township as
a share of total population was 20.2% compared to the regional share of 43.2%. Within York Region, there is a clear
division between the ability of the northern and southern communities to attract immigrants. Data from the 2006 Census
shows that, King and the other northern communities have significantly smaller foreign born populations as a share of
total population. Instead immigrants are choosing to locate in Markham, Richmond Hill and Vaughan because of the
proximity to employment opportunities and the presence of social networks and previously established ethnic groups,
often referred to as chain migration.
11 Changing Landscapes: Recent Immigrants Living in York Region, The Regional Municipality of York Community and Health Services Department, 2011.
$194,451
$151,513 $143,618 $137,331 $124,235 $117,414

18 Millier Dickinson Blais: King Township Economic Development Strategy
3.2.2 Labour Force
As noted earlier, King Township has experienced only modest population and employment growth in recent years.
Between 2006 and 2011, the total labour force in King decreased from 11,360 to 10,945, a net decrease of 415 people.
The goods-producing12
sector represented 30.24% of King`s labour force and the service-producing sector13
accounted
for the remaining 69.67% (See Figure 3). The service sector of the economy was projected to decrease by 5.34% due to
major declines in professional, scientific and technical services, accommodation and food services and finance and
insurance. Although there was an overall decline, there was strong growth in the retail trade and educational services
sectors. The goods-producing sector, despite the decline employment led by weakness in manufacturing, was still
projected to increase by 0.3%.
FIGURE 3: LABOUR FORCE BY INDUSTRY, 2006 AND 2011
Industry 2006
% Share of Total
Labour Force
2011
% Share of Total
Labour Force
Absolute Change in
Labour Force
All Industries 11,360 100.0% 10,945 100.00% -415
Agriculture, forestry, fishing and hunting 505 4.4% 650 5.94% 145
Mining and oil and gas extraction 25 0.2% 0 0.00% -25
Utilities 45 0.4% 50 0.46% 5
Construction 1,355 11.9% 1,620 14.80% 265
Manufacturing 1,370 12.1% 990 9.05% -380
Wholesale trade 680 6.0% 690 6.30% 10
Retail trade 950 8.4% 1,175 10.74% 225
Transportation and warehousing 485 4.3% 415 3.79% -70
Information and cultural industries 205 1.8% 170 1.55% -35
Finance and insurance 485 4.3% 380 3.47% -105
Real estate and rental and leasing 370 3.3% 285 2.60% -85
12 Goods producing Sector include the following industries: Agriculture; Forestry, Fishing, Mining, Quarrying, oil and gas; Utilities, Construction and Manufacturing
13 Service-producing Sector includes the following industries: Wholesale trade; Retail trade; Transportation and warehousing; Information and cultural industries; Finance and insurance;
Real estate and rental and leasing; Professional, scientific and technical services; Management of companies and enterprises; Administrative and support, waste management and
remediation services; Educational services; Health care and social assistance; Arts, entertainment and recreation; Accommodation and food service; Other services (except public
administration); Public administration.

19 Millier Dickinson Blais: King Township Economic Development Strategy
Industry 2006
% Share of Total
Labour Force
2011
% Share of Total
Labour Force
Absolute Change in
Labour Force
All Industries 11,360 100.0% 10,945 100.00% -415
Professional, scientific and technical services 1,195 10.5% 1,015 9.27% -180
Management of companies and enterprises 80 0.7% 30 0.27% -50
Administrative and support, waste management and remediation services 545 4.8% 540 4.93% -5
Educational services 700 6.2% 835 7.63% 135
Health care and social assistance 750 6.6% 665 6.08% -85
Arts, entertainment and recreation 360 3.2% 310 2.83% -50
Accommodation and food services 405 3.6% 265 2.42% -140
Other services (except public administration) 500 4.4% 465 4.8% 107
Public administration 345 3.0% 385 3.3% 65
Source: Statistics Canada. 2013. King, TP, Ontario (Code 3519049) (table). National Household Survey (NHS) Profile. 2011 National Household Survey. Statistics Canada Catalogue no. 99-004-XWE. Ottawa. Released September 11, 2013
From an occupational perspective the groups that show the highest concentrations in King were Management
occupations – 2,070 people or 18.9% of the labour force, Business, finance and administrative occupations – 1,970
people or 18.0% of the labour force, Trades, transport and equipment operators – 1,865 or 17.0% of the labour force, and
Sales and service occupations – 1,615 or 14.8% of the labour force (See Figure 4).
FIGURE 4: LABOUR FORCE BY OCCUPATION, 2001,2006,2011
Occupations
2001 2006 2011
Number
% of Total
Labour Force
Number
% of Total
Labour Force
Number
% of Total
Labour Force
All Occupations 10,585 100.0% 11,360 100.0% 10,945 100.0%
Management occupations 1,900 17.9% 2,115 18.6% 2,070 18.9%
Business, finance and administrative occupations 1,890 17.9% 2,255 19.9% 1,970 18.0%
Natural and applied sciences and related occupations 680 6.4% 655 5.8% 695 6.4%

20 Millier Dickinson Blais: King Township Economic Development Strategy
Occupations
2001 2006 2011
Number
% of Total
Labour Force
Number
% of Total
Labour Force
Number
% of Total
Labour Force
All Occupations 10,585 100.0% 11,360 100.0% 10,945 100.0%
Health occupations 405 3.8% 480 4.2% 460 4.2%
Occupations in social science, education, government service and religion 840 7.9% 780 6.9% 1,175 10.7%
Occupations in art, culture, recreation and sport 440 4.2% 420 3.7% 395 3.6%
Sales and service occupations 1,940 18.3% 2,105 18.5% 1,615 14.8%
Trades, transport and equipment operators and related occupations 1,490 14.1% 1,535 13.5% 1,865 17.0%
Occupations unique to primary industry 635 6.0% 755 6.6% 500 4.6%
Occupations unique to processing, manufacturing and utilities 375 3.5% 250 2.2% 200 1.8%
Source: Adapted from Statistics Canada (Census of Population, 2001 & 2006) Statistics Canada. 2013. King, TP, Ontario (Code 3519049) (table). National Household Survey (NHS) Profile. 2011 National Household Survey. Statistics Canada Catalogue no. 99-004-XWE. Ottawa. Released September 11, 2013.
While the occupations in King Township are concentrated in the business, finance, and administrative professions, many
residents are employed outside of the township. As was mentioned earlier, only 13.3% of King‟s labour force (having a
usual place of work) is employed in the township with the remainder working outside the community (See Figure 6). In
2006, the last year for which labour force by place of work data was available, King was a net exporter of 4,340
employees to the GTA.

21 Millier Dickinson Blais: King Township Economic Development Strategy
FIGURE 5: PLACE OF WORK STATUS OF KING TOWNSHIP'S LABOUR FORCE, 2006
Source: Statistics Canada, 2006 Census
As a result of the net outflow, the number of people working in King Township is significantly below the total labour force
number reported above. The York Region Employment Survey found that there were 6,284 people employed by business
in King Township in 2012. Total employment in King Township has grown by 4.2% per year from 2002-2012. During this
period, full-time employment increased by 1,183 jobs, part-time by 445 jobs and seasonal employment increased by 502
jobs. In 2012, full-time employment represented 60% of all employment in King Township with part-time and seasonal
work accounting for the remaining 40% of employment. It should be noted the numbers reported by the Employment
Survey do not include people employed in the agriculture rural areas of King Township.
King Township‟s position as a net exporter of labour, affects the entire local economy. Human capital – the skills, talents
and creativity of labour force – is the single most important determinate of a communities economic prosperity.
Increasingly the location choice of businesses, small and large, rests on the availability and accessibility of skilled
workers. Reducing this outflow of labour will not be easy, given the nature of the occupations and the likely seniority of the
individuals. However, King Township like other parts of York Region recognizes that enhancing quality of place and
creating attractive amenities can draw in a talented people, which in turn attract business investment, as well as draws in
visitors to the community. As of 2011, 41.1% of King Township‟s labour force was in creative class jobs.
22 Millier Dickinson Blais: King Township Economic Development Strategy
3.2.3 Business and Industry
While the greatest concentration of businesses in York continues to be in its southern communities, specifically along the
400 series highways, it is worth noting that much of the region‟s business growth has in fact been driven by small,
innovative and entrepreneurial firms.
As of June 2012, Statistics Canada Business Patterns data14
reported that there were a total of 2,646 businesses located
in King Township, of which 959 had employees. The remaining 1,687 businesses are comprised of enterprises which do
not maintain an employee payroll and can often be characterized as home based or self-employed businesses. The
actual number of businesses in King Township has changed very little since 2004, decreasing by only seven, but the
number of businesses with employees has increased. This is a positive sign that suggests new business investment in the
community or the growth and expansion of existing firms.
Like the region, an overwhelming number of businesses in King Township are small enterprises employing less than 10
employees. Of the reported 959 businesses with employees, 80.3% have less than 10 employees. This fact suggests that
serving the needs of these enterprises should be a major priority of any future economic development programming. The
focus on small and entrepreneurial firms however, can be challenging for economic developers. When large firms
dominate the economic landscape of a community, corporate care programs or business retention and expansion efforts
can be tailored and focused by industry. In the case of smaller firms, retention and expansion efforts require a different
level of support to connect them with new opportunities, build awareness of new markets for products and services,
access financing, or regional and provincial programs or assist with long-term business planning.
Many of the small businesses located in King Township can be classified as being creative businesses. Creative
businesses include such industries as advertising, education, film, music, public relations and other industries. In 2012,
there are 355 creative businesses in King Township including business consulting (117 businesses), engineering (54
businesses) and film (33 businesses). As the economy shifts away from traditional industrial activity, there is growing
recognition, especially in more rural communities that creative businesses can be a driver of innovation and productivity.
Moving forward, a strong and growing business services sector should be seen as an asset that propels the local
economy into emerging sectors.
For its size, King Township‟s business community is a mix of goods producing and service industries. The highest
proportion of local businesses are concentrated in construction, professional, scientific and technical services,
administrative support, waste management and remediation services, retail trade and agriculture, forestry, fishing and
14 Statistics Canada‟s Canadian Business Patterns data provides a record of business establishments by industry and size. Sources of information are updates from the Statistics Canada
survey program and the business number registration source collected from the Canada Revenue Agency (CRA).

23 Millier Dickinson Blais: King Township Economic Development Strategy
hunting sectors. Of these sectors, professional, scientific and technical services and agriculture, forestry, fishing and
hunting represent the greatest opportunity for future business investment and expansion. It is also important to note that
while the business patterns data reports that there are 62 businesses or enterprises in the agriculture sector, the 2011
Agricultural Census reports that there are some 239 farms located in King Township. This represents approximately
28.9% of all farms in York Region suggesting that agricultural sector should be a key consideration in future economic
development programming. The equine industry, which is seen as being under threat due to reduced funding from the
provincial government, together with the Holland Marsh dominates the farming operations in King Township. To maximize
the economic impact created by these industries the Township will need to leverage regional resources and partnership
opportunities that support the long term viability of these industries.
FIGURE 6: BUSINESS PATTERNS, KING TOWNSHIP, 2012
Industry (NAICS) 2012
Total Indeterminate Subtotal 1-4 5-9 10-19 20-49 50-99 100+
All Industries 2,646 1,687 959 626 145 98 53 15 17
Agriculture, forestry, fishing and hunting 146 84 62 38 16 5 3 - -
Mining and oil and gas extraction 5 2 3 3 - - - - -
Utilities 2 1 1 1 - - - - -
Construction 465 248 217 142 31 24 13 2 2
Manufacturing 92 45 47 22 6 6 7 2 3
Wholesale trade 96 54 42 29 6 5 2 - -
Retail trade 145 81 64 36 11 9 6 1 1
Transportation and warehousing 74 47 27 17 2 5 2 - 1
Information and cultural industries 50 37 13 7 3 2 - 1 -
Finance and insurance 210 171 39 31 2 4 1 - -
Real estate and rental and leasing 295 265 30 19 8 - 3 - -
Professional, scientific and technical services 374 257 117 91 16 6 1 2 1
Management of companies and enterprises 184 170 14 13 1 - - - -
Administrative and support, waste management and remediation services
169 91 78 36 21 11 7 3 -
Educational services 27 18 9 5 2 1 - - 1
Health care and social assistance 61 17 44 29 6 8 1 - -

24 Millier Dickinson Blais: King Township Economic Development Strategy
Industry (NAICS) 2012
Total Indeterminate Subtotal 1-4 5-9 10-19 20-49 50-99 100+
All Industries 2,646 1,687 959 626 145 98 53 15 17
Arts, entertainment and recreation 44 24 20 8 1 1 3 2 5
Accommodation and food services 50 23 27 8 3 9 3 2 2
Other services (except public administration) 156 52 104 91 10 2 1 - -
Public administration 1 - 1 - - - - - 1
Source: Canadian Business Patterns, Statistics Canada, 2012.
3.2.4 Infrastructure and Employment Land
Employment Area Lands
A variety of factors have contributed to the migration of employment uses from urban cores and older suburbs within
many urban municipalities to more suburban or outlying areas. This trend is evident by the development that has slowly
moved northwards along Highway 404 and Highway 400 in York Region. Much of this visible commercial and industrial
development has occurred on lands designated as employment areas. With the population of the GTA projected to add an
additional 3.7 million people and another 1.8 million jobs by 2031, municipalities are under pressure to provide serviced
employment land recognizing that market demand is shifting away from manufacturing towards more flexible office and
Business Park uses.
York Region estimates that employment in King Township will increase by approximately 5,000 jobs by 2031. The new
jobs will be divided between population-related employment (2,530) and employment land employment (2,300). (See
below). At present, King Township has approximately 206 acres of designated employment land at various stages of
investment readiness. The employment area lands are spread across King City (100 acres), Schomberg (55 acres) and
Nobleton (51 acres) with a total of 32.8 acres being serviced (See Figure 8). In 2007, King Township issued design
guidelines to provide guidance on how future employment lands could be integrated into the countryside and villages. The
development and occupancy of these lands represents future commercial and industrial assessment for the municipality
and as such should be a continuing priority for the Township. In the short-term an 85 acre Greenfield development parcel
comprising the King Corporate Centre at King Road and Jane Street provides the Township with a significant opportunity
to create a prestige employment area in a business park setting. While servicing of the site is still one to two years away,
it represents a gateway location for the community where higher order business and employment uses can cluster. Given
the location of these lands relative to a 400 series highway, they are also likely to appeal to small business and light

25 Millier Dickinson Blais: King Township Economic Development Strategy
industrial operations. Due to King‟s limited supply of employment area lands, it will be important that these lands be
preserved for employment uses if the Township is to meet York Region‟s employment estimates by 2031.
Longer-term, lands at the Highway 400 and King Road interchange represent an attractive employment area opportunity if
the lands can be re-designated for development. Currently the lands are outside of the King City settlement area and fall
under the provinces Greenbelt Plan. Given the pattern of growth on Highway 400, the settlement area boundary extension
and development of these lands could be seen as reasonable steps that leverage ongoing infrastructure investment and
provide for needed employment land in one of the GTA‟s fastest growing regions.
FIGURE 7: ACRES OF EMPLOYMENT AREA LANDS, SERVICED AND UNSERVICED
Source: King Township, Planning Department, 2013
Given the competition for business investment across the GTA, it will be essential that King Township have a strong value
proposition and plan to attract investors and investment to employment areas as these areas are serviced. One of the
biggest challenges facing King Township is the cost per acre of its key employment areas relative to comparable sites.
The 2012 BMA Municipal study found that the prices in King Township ranged from $450,000 - $550,000. Without the
necessary land use policies to support development and an understanding of the market opportunities, King Township
loses an opportunity to drive new investment.
52
3
36.8
14.8
85
15
Unserviced
Serviced
Unserviced
Serviced
Unserviced
Serviced
Schom
berg
Noble
ton
Kin
g C
ity

26 Millier Dickinson Blais: King Township Economic Development Strategy
FIGURE 8: COST PER ACRE OF INDUSTRIAL PARKS, KING TOWNSHIP AND SURROUNDING COMMUNITIES
Municipality Industrial Park Size
Acres
Price Per Acre
Ownership High Low
King
27-9 Business Park - Schomberg 22 $ 500,000 $ 450,000 Private
King City Corporate Centre 100 $ 550,000 $ 500,000 Private
Boyton Lands - Nobleton 35 $ 500,000 $ 450,000 Private
Aurora
Aurora Gateway Business Park 81 N/A N/A Private
Aurora South Industrial 14 $ 275,000 $ 175,000 Private
Industrial Parkway North 38 $ 275,000 $ 175,000 Private
Hallgrove Business Park 48 $ 500,000 $ 425,000 Private
Aurora Business Park 88 N/A N/A Public
Caledon
Bolton Industrial park 320 $ 550,000 $ 300,000 Private
Tullamore Industrial Park 148 N/A N/A Private
Mayfield West- Kennedy Road 358 N/A N/A Private
Victoria Business Park 83 $ 425,000 $ 275,000 Private
Whitchurch-Stouffville
Stouffville* 497 $ 475,000 $ 500,000 Private
Vandorf 12 N/A N/A Private
Gomley 251 $ 400,000 $ 450,000 Private
Richmond Hill Beaver Creek Business Park 614 $ 600,000 $ 450,000 Private
Heaford Business Park 433 $ 600,000 $ 450,000 Private
* Lands known to be serviced Source: 2012 BMA Municipal Study.
Transportation Infrastructure
As a community on the urban fringe, how, when and where future investments in transportation infrastructure are made
will have an effect on the speed at which goods and people are able to move in and out of the community. The following
provides a brief summary of King Township‟s connectivity within the GTA via highways and public transit, including
proposed expansions and investments.
The majority of King Township‟s labour force commutes to work via car. The large outflow and inflow of workers that
occurs is made possible by the township`s proximity to several major provincial highways - Highway 400 and Highway 9.
27 Millier Dickinson Blais: King Township Economic Development Strategy
The GTA West Corridor Environmental Assessment Study: Transportation Development Strategy15
completed in 2012
includes two major projects that will further enhance King Township`s location in the GTA. The first is the proposed
expansion of Highway 400 from six to 10 lanes by 2031 between Major Mackenzie and King Road. The second project is
the construction of a new transportation corridor situated along King Township‟s southern border. The new corridor would
be built to connect Highway 427 to Highway 400. Both of these transportation investments reinforce the positioning of
lands at King Road and Highway 400 for future sustainable employment uses.
King Township is serviced by both York Region Transit (YRT) and GO Transit. YRT provides rapid transit services
throughout York Region. The 120 routes operated by YRT connect the nine local municipalities and offer connecting
services to Toronto. Currently YRT operates three routes that include stops at Seneca College. The primary route is the
22 King City route. Introduced in 2005, this route connects Seneca College to King City. The route travels from Seneca
College across Bloomington Road to Yonge Street and over to King City via King Road, before traveling south on Keele
Street to the Maple Community Centre in Vaughan. The service as it exists is limited to King City. Nobleton and
Schomberg are not currently serviced by YRT. King has a GO Train Station on the west side of Keele Street, south of
King Road. It has weekday GO train service on the Barrie Line and GO bus routes which service both Toronto and Barrie.
During the week, the King Local (Route 61) travels between Nobleton, Schomberg, Pottageville and Kettleby and the King
City GO station connecting residents to the GO station at rush hour. This service is designed to help with the efficient
outflow of residents to job outside of the community. The current level of GO service on the line is limited and the parking
infrastructure according to the Integrated Community Sustainability Plan is insufficient to accommodate current demand.
In addition to the Barrie Line, GO Bus currently services Nobleton twice a day.
The York Region Transportation Master Plan16
identifies future investments to improve the connectivity of King Township
to other areas of York Region. For example the master plan proposes a priority network through King Township between
Highway 9 and Highway 400 and the Anchor Hub/ Regional Centre located in Newmarket. In addition rural links
connecting Schomberg, Nobleton and King City to York Region‟s Yonge Street rapid transit corridor are also planned. The
completion of these new links will enhance King Township‟s connectivity and accessibility to York Region and the GTA.
Water and Wastewater Infrastructure
One of the objectives of the Province`s Growth Plan is to direct development to existing built areas in order to intensify
existing land use. As a result intensification is expected to be focused on growth centres and around transit. However,
financial restraints related to the servicing of these lands may limit the ability to accommodate intensification and future
population growth. Estimated capital costs for water and wastewater infrastructure projects to service population and
15 GTA West Corridor Environmental Assessment Study, Transportation Development Strategy Report, Ontario Ministry of Transportation, November 2012, pp. 174. 16 Moving on Sustainability, York Region Transportation Master Plan Update, and November 2009.

28 Millier Dickinson Blais: King Township Economic Development Strategy
employment growth in York Region are expected to reach $4.8 billion by 2031. York Region has developed a priority
setting framework to ensure that the construction of water and wastewater infrastructure projects is carried out effectively
and efficiently as possible. The water and wastewater capital works projects for King Township identified in the York
Region “Water and Wastewater Master Plan Update” include a new Nobleton water systems well supply and watermain
network, the installation of sewers in King City, York Water Supply (YWS) to King City and the implementation of the
Nobleton Water Pollution Control Plant and Collection System.17
King Township is projecting total capital expenditures
between 2012 and 2021, for water and wastewater of $29.4 million.
Human Infrastructure
In a knowledge-based economy, the presence of and connection to post-secondary institutions are regarded by investors
as a competitive advantage. Currently King Township has three post-secondary institutions present in the community that
can be effectively leveraged to attract interest and investment to the community.
Seneca College: Seneca College‟s King Campus is a 697 acre site located along Dufferin Street and 15th
Sideroad. Its
location within both the Ontario Greenbelt and the Oak Ridge‟s Moraine has allowed the campus to maintain a rural feel
and provided the campus with unique environmental stewardship opportunities. The campus currently has a full-time
student population of 3,200. The College currently offers a roster of core programs including nursing, early childhood
education, social services, underwater skills (relating to commercial diving, welding, construction, salvage and inspection
and repair work related to the offshore oil industry), veterinary technician and emergency services.
King Campus is expected to double the size of its current student population by 2021 to just below 7,000 students. To
accommodate future growth of the student body, Seneca completed a Master Plan for the campus in 2011. Seneca
College is planning on implementing the Master Plan for its King Campus in two phases. The first phase to be completed
over the next 10 years is based on $ 43 million in funding provided by the provincial government. This funding will be used
to revitalize the current buildings and expand community safety and health services training on campus. In total, space for
an additional 1,450 students will be created when the expansion is completed. The second phase, referred to as a “Full
Build-out Scenario”, would follow with the build out of the campus‟s East Village Precinct, the Athletic Precinct and the
North Eaton Residence Precinct. The expansion of Seneca College and its effect on King Township is discussed in more
detail in Section 2.5.3.
University of Toronto: In 1995, Drs. Murray and Marvelle Koffler donated their 860 acre estate named Jokers Hill to the
University of Toronto. The estate located on the Oak Ridges Moraine is made up of wetlands and forests. The Koffler
Scientific Reserve is internationally recognized as a site for research and education into biodiversity, ecology and
17 Water and Wastewater Master Plan Update, Regional Municipality of York, completed by Genivar et al. November 2009, pp. 111-112

29 Millier Dickinson Blais: King Township Economic Development Strategy
conservation biology. From the ecological observatory, scientists are able to measure and analyze the natural ecosystem.
Throughout the year, the University of Toronto brings student to the Koffler Scientific Reserve to get hands on experience
studying the natural environment.
Along with the research and university programming, the reserve runs special events including guided nature walks and
natural history workshops. In addition the public can make use of the walking trail along the eastern edge of Jokers Hill.
University of Guelph: Located in Kettleby, the Muck Crops Research Station includes a plant pathology lab,
greenhouses with ebb and flow benches and computer monitoring environments, cold storage facilities and research
fields.
Research activities at the station are focused on the vegetable crops grown in what is one of the most intensive
agricultural areas of Canada. There is a special interest in the growth of onions, carrots, lettuce, celery and Asian
vegetables. Faculty and students active at the station are interested in new methods to protect crops, improve pest
management and manage crops.
3.2.5 Community Based Assets
Increasingly the unique place-based attributes of communities (e.g. natural environment, parks and recreation facilities,
local culture and arts and food) are seen as assets that contribute to an overall quality of life and can be leveraged to
attract new residents, visitors and business investment.
As part of the background research for the economic development strategy, an initial inventory of 92 cultural assets was
identified. Cultural mapping is a systematic approach to identifying and classifying a community‟s cultural resources using
geographic information system (GIS) technologies and enables the identification of both tangible and intangible cultural
assets. The following assets were identified in King Township:
Cultural spaces and facilities – e.g. King Township Museum, King Public Library Branches and the Schomberg Fair
Grounds, Trisan Centre and the Dr. William Laceby Nobleton Community Centre and Arena
Fixed or immoveable heritage – e.g. Eaton Hall, Richard Serra‟s art installation the Shift, Hogan‟s Inn
Natural heritage – e.g. Cold Creek Conservation Area, Oak Ridges Moraine, Holland Marsh and parks
Events and Festivals –e.g. Cold Creek Winterfest, King City Festival, farmers markets, Holland Marsh Soupfest,
Feast of Fields, Nobleton‟s Victoria Day Fair and Schomberg farm tours
Post-secondary Institutions – e.g. Seneca College King‟s Campus, University of Guelph Muck Research Centre
Creative industries - e.g. King Print and Design, King Brewery, Holland Marsh Winery and the Art Society of King

30 Millier Dickinson Blais: King Township Economic Development Strategy
31 Millier Dickinson Blais: King Township Economic Development Strategy
In addition to these cultural assets King Township also sits on some of the most idyllic natural heritage lands in Ontario.
Three of the most important sites within King Township are the Happy Valley Forest, the Pottageville Swamp and the
Holland Marsh. The Happy Valley Forest is one of the largest remaining hardwood forests in the Oak Ridges Moraine. It
has been designated by the province as an Area of Natural and Scientific Interest. The Pottageville Swamp was
recognized in the 1970‟s as an International Biological Programme Site by the International Council of Scientific Unions.
Finally the Holland Marsh, located at the northeast edge of King Township, is considered Ontario‟s `soup and salad bowl`
because of the variety of produce and quantity produced annually.
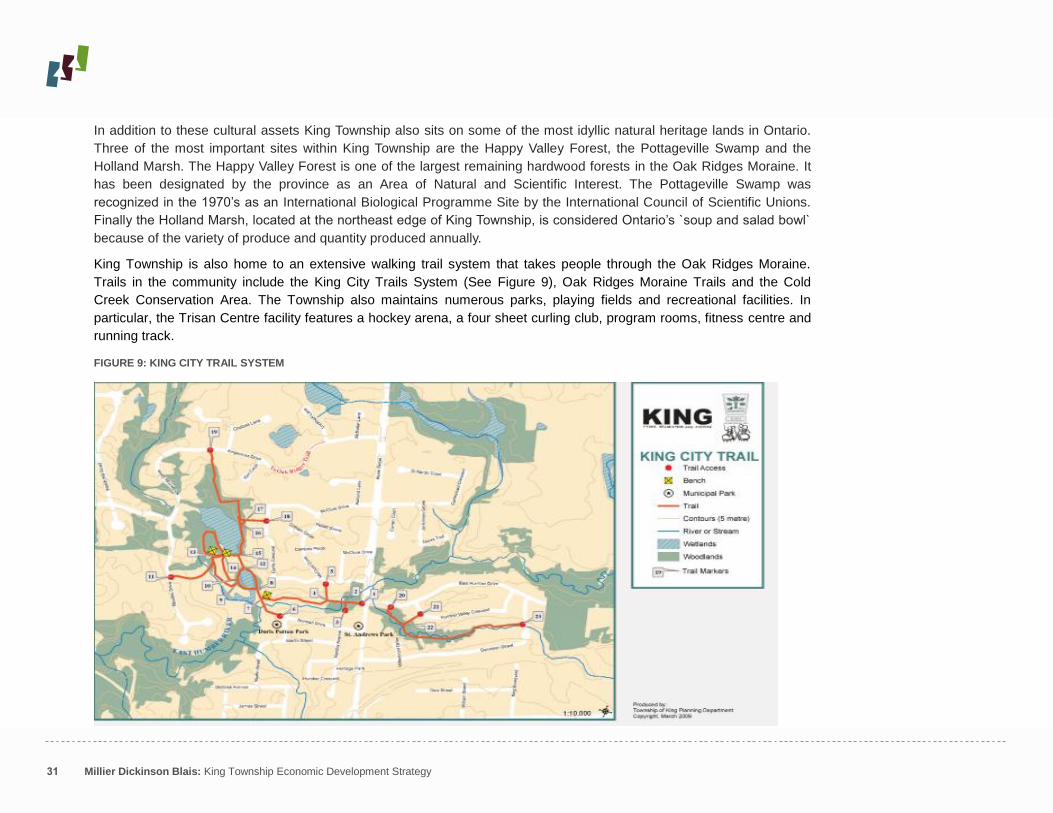
King Township is also home to an extensive walking trail system that takes people through the Oak Ridges Moraine.
Trails in the community include the King City Trails System (See Figure 9), Oak Ridges Moraine Trails and the Cold
Creek Conservation Area. The Township also maintains numerous parks, playing fields and recreational facilities. In
particular, the Trisan Centre facility features a hockey arena, a four sheet curling club, program rooms, fitness centre and
running track.
FIGURE 9: KING CITY TRAIL SYSTEM
32 Millier Dickinson Blais: King Township Economic Development Strategy
King Township also has three conference facilities which host business and social events. The Kingbridge Conference
Centre & Institute was originally built to be a world class spa facility but was converted into a state-of-the-art corporate
training facility for CIBC in the early 1990‟s. Today, Kingbridge is owned by John Abele, co-founder of Boston Scientific,
and is focused on programming and events that focus on science, children‟s literacy, education and new technology. The
facility has 124 guest rooms, meeting spaces, restaurant, bar and other amenities spread a 113 acre campus. Eaton Hall
Inn & Conference Centre, the main house on the old Eaton Family estate includes 44 guest rooms and is a historic
building. The other major conference facility is the Seneca King Residence and Conference Centre.
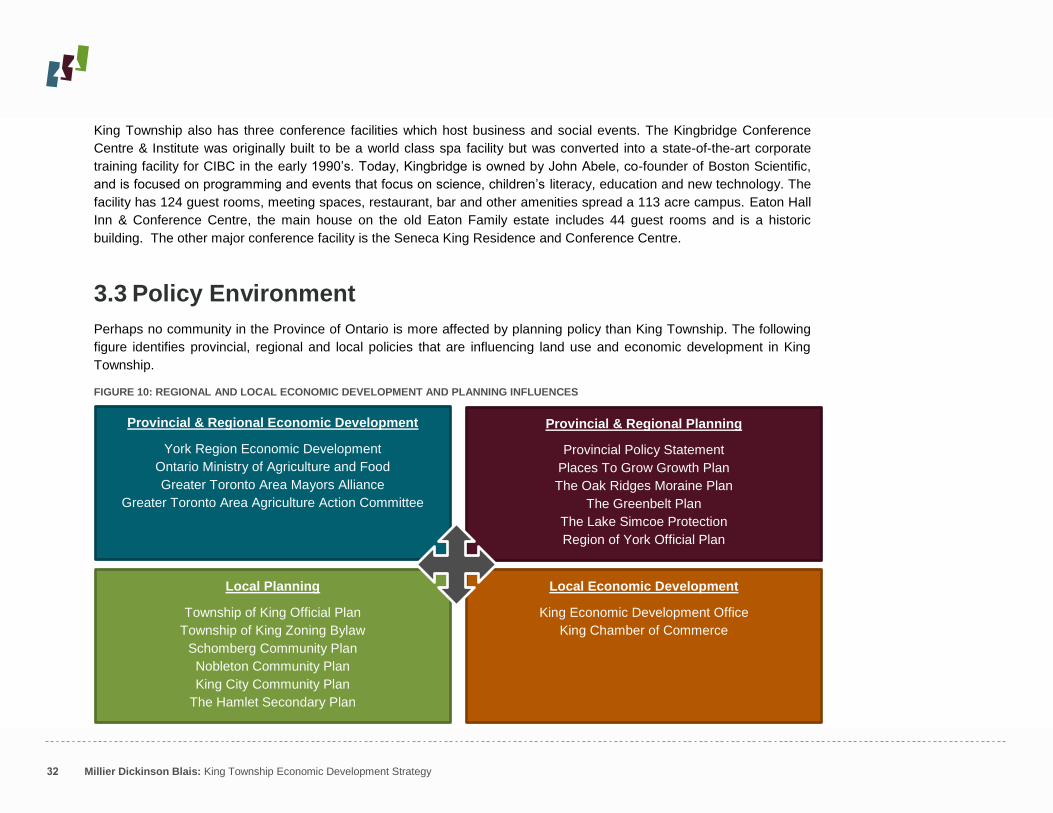
3.3 Policy Environment
Perhaps no community in the Province of Ontario is more affected by planning policy than King Township. The following
figure identifies provincial, regional and local policies that are influencing land use and economic development in King
Township.
FIGURE 10: REGIONAL AND LOCAL ECONOMIC DEVELOPMENT AND PLANNING INFLUENCES
Provincial & Regional Economic Development
York Region Economic Development
Ontario Ministry of Agriculture and Food
Greater Toronto Area Mayors Alliance
Greater Toronto Area Agriculture Action Committee
Local Planning
Township of King Official Plan
Township of King Zoning Bylaw
Schomberg Community Plan
Nobleton Community Plan
King City Community Plan
The Hamlet Secondary Plan
Provincial & Regional Planning
Provincial Policy Statement
Places To Grow Growth Plan
The Oak Ridges Moraine Plan
The Greenbelt Plan
The Lake Simcoe Protection
Region of York Official Plan
Local Economic Development
King Economic Development Office
King Chamber of Commerce

33 Millier Dickinson Blais: King Township Economic Development Strategy
3.3.1 Provincial and Regional Planning Considerations
The layering of provincial and regional policy direction creates a complex environment for King Township. Many of the
provincial planning policies protect the natural environment by restricting development in rural areas of the township (i.e.
Oak Ridges Moraine Plan, Greenbelt Plan) and encourage higher densities (i.e. Places to Grow Growth Plan) in
settlement areas. All of the layers of legislation place the community in a difficult position to meet population and
employment growth targets. For example, the Oak Ridges Moraine Act and subsequent Oak Ridges Moraine Plan restrict
development on nearly 70% of King Township‟s land area. In addition the Greenbelt Plan places specific restrictions on
the types of activities that are allowed in agricultural areas. For example, in the Holland Marsh land is designated as
“Speciality Crop Areas18
”, which places limits on the types of activities and opportunities that could be pursued by farmers
and local business owners.
In November 2012, the Province issued a proposed amendment to the Growth Plan. If approved, it would extend the
growth forecasts from 2031 to 2041. By 2041, the Greater Golden Horseshoe is forecast to grow to almost 13.5 million
people and 6.2 million jobs. In York Region, growth is forecast to grow to 1.8 million people and 900,000 jobs.19
These
population and employment targets put pressures on rural communities like King Township since they are required to
reach higher-density employment uses in areas that typically attract low-density employment activity. Low-density
employment uses include outdoor storage yards, transportation and warehousing facilities and contractor yards. Many of
the provincial planning policies identified earlier limit the types of rural economic development opportunities that are
driving growth in the township. Agriculture is a key driver of the economy despite the fact that planning policies limit the
ability of business owners to expand their operations or pursue value added opportunities associated with rural creative
economies.
Another layer of legislation that affects King Township is the Lake Simcoe Protection Plan (200920
). This plan is intended
to protect and restore the ecological health of the Lake Simcoe Watershed. The Lake Simcoe and Lake Ontario drainage
divide passes through the centre of King Township and separates Schomberg from Nobleton and King City. The drainage
divide places Schomberg into the Lake Simcoe Protection Plan area and under special legislation to protect any
discharge into the watershed that may harm the water quality, hydrology or restorative elements. The plan specifies that
any proposed increase to the rated capacity of a sewage treatment plant related to the expansion of a settlement area
18 Speciality Crop Area Policies: Within the speciality crop areas, normal farm practices and a full range of agricultural, agricultural-related and secondary uses are supported and
permitted. Lands within speciality crop areas shall not be re-designated in municipal official plans for non-agricultural uses, with the exception of those uses permitted in the general
policies. Towns/Villages and Hamlets are not permitted to expand into speciality crop areas. New land uses, including the creation of lots, as permitted by the policies of this Plan, and new
or expanding livestock facilities shall comply with the minimum distance separation formulae.
19 Proposed Amendment 2 (2012) to the Growth Plan for the Greater Golden Horseshoe, 2006, Schedule 3, p.8.
20 Lake Simcoe Protection Plan, Ministry of the Environment, 2009

34 Millier Dickinson Blais: King Township Economic Development Strategy
such as Schomberg requires an environmental assessment and mandates additional monitoring and stewardship of water
quality.
3.3.2 Local Planning Framework
King Township‟s Integrated Community Sustainability Plan was formally adopted by Council in April 2012 and was
designed to guide the future of the Township, community groups, businesses, local organizations and the broader public
as they make decisions related to the vitality and prosperity of the community. The plan is organized around four pillars of
sustainability (environment, economy; socio-culture; and finance) and 19 themes. The four themes under the Economic
pillar directly inform the development of this strategy - village vitality & prosperity, agriculture & equine, local economy and
tourism advancement and promotion.
Village Vitality & Prosperity – King City, Nobleton and Schomberg are commercial hubs that play an important role
in determining the future prosperity of King Township. Building these commercial and retail areas to meet the needs
of residents is seen as necessary to having a strong local economy. To achieve the plan, there is a need to revitalize
the villages, promote, grow and retain existing local businesses and attract and encourage the development of new
businesses in the village cores.
Agriculture & Equine – With over 239 agricultural farming operations21
in King Township, the industry is closely
linked to the township‟s identity and plays a significant role in the local economy. The goal for agriculture and equine is
that they will be economically viable and prosperous industries in a community that celebrates local food. This informs
specific recommendations in the economic development strategy as it suggests that the achievement of this goal is
dependent on considering and supporting new policies to encourage value-added activities.
Local Economy – To achieve prosperity the Township Council and senior administrators recognize the need to create
new job and economic opportunities in King Township based on existing strengths and assets. As the Integrated
Community Sustainability Plan points out, the employment areas in King Township are primarily found in the three
villages. The employment areas in King City, Schomberg and Nobleton are strategic assets and require a
coordinated effort to attract and generate new business activity in King Township in a manner that fits with the values
and priorities of the community.
Tourism Advancement & Promotion – The final goal set under the economic pillar was for King Township to
promote and capitalize on considerable strengths, including the uniqueness of the Township villages and hamlets, the
21 Statistics Canada, 2011 Agriculture Census of Canada.

35 Millier Dickinson Blais: King Township Economic Development Strategy
local arts community and natural assets. It is recommended that these assets be leveraged to build the local tourism
industry and attract visitors.
Each of themes reflects King Township‟s desire for a responsible and sustainable local economy. An economy that
supports and encourages economic activity in a manner that is environmentally and financially sustainable and utilizes the
skills, abilities and leadership found in the community. A further consideration that emerged from the sustainability plan
comes under the environmental pillar. This is the need for King Township to review its official plan documents (including
community plans) and zoning by-laws.
King Township has several municipal planning documents in place to guide policies and decisions related to land use for
industry, commerce, residential housing, agriculture and environmental areas. The primary land use document is the
Township of King Official Plan (1970), which is largely focused on the rural and agricultural areas of the township. There
has been a series of amendments to the Official Plan to align with new provincial planning frameworks and address
development in the settlement areas. In addition to the provisions of the Official Plan, the township‟s settlement areas
(King City, Nobleton and Schomberg) are also subject to individual community plans. A hamlet secondary plan has been
prepared to manage development in Kettleby, Laskay, Pottageville and Snowball.
The Nobleton Community Plan (2005) establishes the land use areas and policies required to accommodate expected
growth, while seeking to protect the character of Nobleton. The plan provides for the improvement of the village core and
the establishment of new commercial and business areas and the support of ongoing agricultural activities. The business
area policies for the land fronting on the east side of Highway 27 at the south limit of Nobleton are identified in the plan as
a destination for future employment within the community. The plan highlights the importance of providing municipal
infrastructure to support both residential and business growth, however, a recent report from the Township of King
Planning Department indicates that there is limited servicing capacity available development applications.
The King City Community Plan (2000) was established with principles, objectives and policies to guide development to
2016. The plan is premised on a future population for King City of 12,000 people and 4,422 jobs in 2021.22
The plan is
based on four principles: environment first; a distinctive community identity; a healthy community; and financial feasibility.
Any development activity that takes place must preserve the integrity of the natural environment, maintain the distinctive
character of the community, balance environmental and economic sustainability, and demonstrate financially feasibility in
terms of capital, operating and maintenance costs.
The Schomberg Community Plan (1998) was established to guide the development of the community to the year 2011.
The objective of the plan as it relates to the economic and financial future of Schomberg is to support the expansion and
22 King City Community Plan, January 27th, 2000, p. 3.
36 Millier Dickinson Blais: King Township Economic Development Strategy
diversification of the community's economic base to support a range of employment opportunities. There are two main
areas intended to accommodate future development and intensification - the Main Central Area and the industrial areas.
The Main Central Area is intended as a destination for convenience shopping in a pedestrian friendly environment.
Industrial development is being encouraged in Schomberg in areas that are accessible to existing and proposed highways
and arterial and collector roads. At present the industrial area to the east of Highway 27 along Highway 9 is the most
significant concentration of industrial development in King Township.
The Township of King Zoning By-law (1974) regulates development by specifying permitted uses for land use zones. In
addition, this document lays out standards such as the size, height, density and location of buildings and structures on
properties.
All of the land use policy documents in King Township are dated. The most recent community plan was completed in 2005
while other planning documents are 10 to 40 years old. While a series of amendments to the official plan and community
plans have been adopted, the absence of consolidated planning policies may be seen as cumbersome for developers and
restricting development in the township. In addition, the planning documents do not reflect the range of current planning
tools available to communities to support downtown revitalization, infill and redevelopment, the protection and
enhancement of cultural resources, or emerging policy considerations for development in agricultural or rural areas.
In Early 2013, King Township‟s Parks, Recreation & Culture department initiated a project to update its 2004 Master Plan
to ensure the provision and management of parks, recreation and culture programs, facilities and services, heritage
opportunities and local amenities. The purpose of the update was to assist the community in effectively managing
municipal and community-based assets to deliver quality services to local residents into the future. The update identifies
the need for Park, Recreation & Culture to continue to work closely with the Planning department on matters related to
parkland and public spaces. The recommendations in the updated Master Plan have an effect on a number of issues
identified throughout this strategy. Specifically the recommendations in the Master Plan update around supporting the
needs of an aging population, creating opportunities to develop community hubs in public spaces to facilitate social
interaction and the completion of a cultural asset mapping exercise will directly impact economic development efforts
Township Council and administrators regard investments in leisure assets as helping create an environment that is
attractive to employees and businesses. Due to the expansive natural areas and the many residential communities across
King Township, there is a desire to provide ample opportunities for people to enjoy physical activity and the outdoors. At
present King Township home to a walking trail system, which include the King City Trails System (See Figure 9), Oak
Ridges Moraine Trails and the Cold Creek Conservation Area. The Township also maintains numerous parks, playing
fields and recreational facilities. Other recreation and culture assets include the Trisan Centre in Schomberg and three
conference facilities (Eaton Hall Inn & Conference Centre, Kingbridge Conference Centre & Institute and Seneca King
Residence and Conference Centre) for hosting business and social events. When completed, this Master Plan will

37 Millier Dickinson Blais: King Township Economic Development Strategy
articulate the community‟s needs for a framework that will integrate the parks, recreation and culture assets in King
Township.
3.4 Fiscal Considerations
Municipal governments across Canada are struggling financially to reinvest in the infrastructure and programming that
makes communities vibrant. According to the Federation of Canadian Municipalities23
, over the last 20 years municipal
government expenditures have been increasing faster than revenue. Across Canada, the largest source of revenue for
municipalities continues to be property taxes, development charges, user fees and intergovernmental transfers.
King Township like many other communities in the GTA is facing financial challenges. The community‟s size, low density,
non-contiguous settlement areas are leading to rising expenditures over the long-run. A recent report prepared for the
Greater Toronto Countryside Mayors Alliance warned that municipal expenditures for the Countryside municipalities,
(which includes King Township) have increased at approximately double the rate of the 905 Greater Toronto Area-
Hamilton (GTAH) municipalities. In addition, to keep pace with rising municipal expenditures, municipal property taxes per
household have increased for the Countryside municipalities at a considerably greater rate over the past eight years
(5.0% vs. 3.6% annually) when compared to the remaining GTAH region.24
These expenditures include the maintenance
and construction of infrastructure such as sewers, bridges and roads.
Figure 11 shows the financial position of King Township relative to the average of all municipalities included in BMA
Management Consulting‟s 2012 Municipal Study. All three measures shown indicate that King Township is in a
challenging financial position. The data shows that King Township ran a deficit of $(1,349) per capita, well below the
average surplus of $153 calculated for the study.
FIGURE 11: FINANCIAL INDICATORS
King Caledon Aurora Richmond Hill Whitchurch - Stouffville Survey
Average
Financial Position per Capita25
$(1,349) $352 $958 NA ($599) $153
Source: BMA Management Consulting Inc, Municipal Study, 2012
23 http://www.fcm.ca/Documents/reports/The_State_of_Canadas_Cities_and_Communities_2012_EN.pdf
24 Greater Toronto Countryside Alliance Communities Economic Analysis, 2010, p.76.
25 Total fund balances including equity in business government enterprises less the amount to be recovered in future years associated with the long term liabilities on a per capita basis.

38 Millier Dickinson Blais: King Township Economic Development Strategy
King Township‟s, 2013 Budget and Business Plan, suggests that the Township will need to carefully manage debt levels
and maintain adequate reserves in order to ensure that obligations to creditors and service expectations of residents are
being met. At the end of 2012, King Township had an outstanding debt of $29.7M (principle and interest). In addition to
the current debt, King Township is forecasting that it will incur an additional $11.5 million over the next few years to
construct sanitary sewers for Nobleton. King Township will be challenged to meet the population and employment
forecasts allocated as part of the Places to Grow planning framework under a 25% debt capacity level.
The ratio of residential to non-residential tax assessment is an important indicator of the long-term sustainability assuming
rates are set appropriately. The split between residential and non-residential tax assessment in King Township is 86.8%
residential to 13.2% non-residential. Within the non-residential assessment component, the majority of revenue is being
generated from the farmlands (7.9%) and commercial areas (3.5%) (See Figure 12). It should be noted that educational
institutions in King Township which have a significant presence in the community are not required to pay property taxes.
As a point of comparison, the Greater Toronto Area average ratio is 79.7% residential to 20.3% non-residential.26
The
higher dependency on residential assessment is particularly problematic in King Township due to the fact that non-
residential assessment can generate greater revenue at a lower servicing cost for the township.
FIGURE 12: ASSESSMENT COMPOSITION KING TOWNSHIP, 2013
Source: King Township 2012.
26 BMA Management Consulting Inc, Municipal Study, 2012
87.2
0.3 3.4 0.9 0.3 7.9
0.0 0
20
40
60
80
100
Un
weig
hte
d A
ssesm
en
t C
om
po
sit
ion
(%
)

39 Millier Dickinson Blais: King Township Economic Development Strategy
3.5 Major Collaborative Initiatives
The implementation of this strategy and decisions around economic development programming for King Township cannot
be conducted in a vacuum. The municipality has neither the resources nor the economies of scale necessary to achieve
economic sustainability on its own and there are few instances where the Township has complete control over its own
fate, particularly around matters of economic growth and development.
In this instance, municipalities are better served when they collaborate and cooperate around key issues either through
formal organizations or informal mechanisms. The discussion that follows highlights some of the major initiatives being
advanced at a regional and provincial level that will have direct bearing on the sustainability of King‟s economy. It is
essential that King Township have a role in developing and advancing the agenda for each of these opportunities.
3.5.1 An Equestrian Centre of Excellence
The equine industry brings a wide array of economic benefits and spin-offs to southern Ontario, creating employment
opportunities and protecting the rural landscape. Recent decades have seen the sector grow and evolve in Ontario. The
Ontario Horse Racing Industry Association economic research study completed in 2011, estimated that the industry
generated $2.3 billion in GDP and approximately 31,440 full time jobs across Ontario. 27
One of the major contributors to this success has been the $345 million Slot at Racetracks Program (SARP). However, in
2012, the Province of Ontario announced its intention to reallocate the SARP funds to health and education effectively
threatening the entire equine industry in Ontario. Facing pressure from industry and constituents, the Ontario legislature
announced in March of 2013 that it was extending SARP funding until 2014. However, the extension does little to provide
long-term financial sustainability to the industry.
The loss of SARP funding makes the work of the Headwaters Equine Leadership Group all that more important. A
committee of the Hills of Headwater Tourism Association, the Leadership Group is a regional initiative to promote and
support the equine industry in Dufferin County, Erin and Caledon. While King Township is not formally within the tourism
association‟s area, this association has invited King Township to participate as a stakeholder due to the proximity and
number of horse farms (King Township has 51 operational horse farms28
).
27 The Economic Impacts of Horse Racing and Breeding in Ontario, 2010.
28 2011 Agricultural Census of Canada, Statistics Canada.

40 Millier Dickinson Blais: King Township Economic Development Strategy
The Headwater Equine Leadership Group includes stakeholders from both the private and public sector and has received
$119,000 from the Ontario Trillium Foundation to support its work. It is anticipated that the funding will assist in advancing
the Headwater region as a centre of equine excellence in Ontario by:
Promoting the region as a centre of equine excellence;
Unlocking the economic development opportunities associated with the growth and sustainability of the industry;
Enhancing regional capacity by capitalizing on emerging opportunities in cooperation with partners;
Educating the public on issues related to the industry;
Establishing mutually beneficial partnership between stakeholders including businesses, municipalities, non-for-profits
and other groups in the region; and
Capitalizing on being selected to host the equine event for the Toronto 2015 PanAm/Parapan Games.
The Headwaters Equine Leadership Group proposed that King Township become a full partner in this initiative and assist
in building an economic framework to support the equine industry and rural economies in the region. As a member of this
leadership group King Township would be actively involved in building long term sustainability in this sector and the rural
economy of King Township more generally.
3.5.2 Building Broadband and a Knowledge Economy
The adoption and rapid expansion of digital technologies is allowing people around the world to work together to solve
problems in innovative ways. As work is increasingly done online through devices such as smartphones, tablets, cloud
technologies and social media networks, the broadband infrastructure that connects individuals is seen as a competitive
advantage. In the future competitive regions will be places that can build a high speed digital platform, based on
broadband connectivity that allows researchers, talent and the business community to generate and share new ideas and
knowledge.
Given the importance of broadband connectivity to economic prosperity, York Region has made the provision of ultra-fast
broadband to all parts of the region a major priority and sees this initiative as one that will transform both its urban and
rural communities.
The quality of King Township‟s internet connectivity was a major issue that emerged during preparation of the economic
development strategy. However, King Township is not alone in York Region when it comes to inadequate internet
connectivity. High-speed broadband services across the Region are currently inconsistent. While the urban areas along
Highway 7 have access to affordable high-speed broadband options, the cost of accessing high-speed broadband in

41 Millier Dickinson Blais: King Township Economic Development Strategy
some urban areas and many of the rural areas can be prohibitive. York Region is working to ensure that all residents and
businesses have access to high-speed broadband. York Region has begun an assessment of the readiness of local
municipalities to develop, support and utilize network connections and upgrades. Based on these assessments, a list of
priority projects will be developed to maximize existing resources and partnerships. The outcome will be the creation of
new links that can support innovation.
3.5.3 Expanding the Post-Secondary Presence in York Region
York Region‟s economic action plan identified the attraction of a greater post-secondary and research presence as a
priority. To attract additional institutional investment, York has outlined a strategy that includes three steps. First, the
Region`s economic development office has committed to supporting local municipalities wishing to respond to the
undergraduate post-secondary campus call-for-proposal expected to be issued by the Province. Second, regional
economic development stakeholders are working to attract investment in applied research. Finally, the regional
stakeholders want to build links between research projects already underway in the region to the private sector.
The post-secondary attraction strategy put forward by York Region seeks to partner with the post-secondary institutions
already in region. While there are numerous institutions with a presence in the region including York University, the
University of Guelph and the University of Toronto, Seneca College is by far the largest. Seneca`s two campuses located
in King Township and Markham are targeted to undergo major expansions.
According to Seneca College‟s recently developed Master Plan, the King Campus has the lowest square foot to full-time
enrolled student ratio (SF/FTE) of any campus in the GTA. Currently the SF/FTE ratio for the three Seneca College
campuses is 83.3, nearly 20% below what the Ontario Colleges Facilities Managers Association deems the minimum
space requirement which is 100 SF / FTE. Over the long-term, Seneca College has projected a ratio of 113.5 SF/FTE. In
order for Seneca to meet its space ratio, overcome the current shortage of space and grow by between 20,000 and
27,000 FTE by 2020/2021 the College needs to almost double its current foot print across all three campuses by adding
1,396,000 SF of new space.
King Campus is expected to double the size of its student population by 2021 to just below 7,000 students. At the time
the Master Plan was being completed an additional 1,400 students could be accommodated at King Campus based on
already committed government funds and partnerships. Another 2,000 students are anticipated within a ten year time
frame, but no funding has been committed at present. In response, Seneca has elected to expand King Campus in two
phases. The first phase will include the development of a new student centre and athletic centre. This work has already
received $43 million in funding from the provincial government. Where possible, the College would like to partner with the

42 Millier Dickinson Blais: King Township Economic Development Strategy
community to support expanded sports facilities such as a hockey arena. To accommodate the additional students the
campus requires additional classrooms, lecture halls, laboratories, campus services, administrative and faculty space and
student life amenity spaces. Student housing will also be needed but is not planned as part of the current expansion
effort.
As Seneca College expands it is also looking to foster more partnerships with other post-secondary institutions and the
private sector and expects to seek degree granting status. King Campus senior administrators are looking for King
Township to be a partner, as it needs assistance to develop affordable student housing and bring additional public transit
to the campus. Seneca sees opportunities to better integrate the college with the community by improving the trail
connections and working with business locally and in the region to align programming with workforce trends. By
strengthening its relationship with Seneca College, King Township can leverage the resources of the college to support
small and medium sized business locally and organize events that complement other initiatives.
3.5.4 Bringing Local Food and Innovations to Market
Rural food clusters are seen to be part of place-based creative economic development. By connecting local food
production to consumption, rural communities are seeing new economic development opportunities emerge. According to
research completed by Anne Lee at the University of Waterloo, there are two advantages associated with growing a local
food cluster. First, it creates high income creative occupations that are associated with innovation and entrepreneurship.
Second, local food helps to develop a place`s identity which when marketed and branded can lead to economic growth.
This emerging trend in rural economic development impacts Ontario‟s agriculture sector, as it is estimated to support
164,000 jobs and contribute $22 billion in gross economic impact. The local food system in Ontario is highly productive
with fertile land, a favourable climate, abundant water resources, effective sector logistics and innovative firms throughout
the value chain.
In March 2013, the Ontario government re-introduced the Local Food Act designed to help make local foods more
available in markets, schools, grocery stores and restaurants across Ontario. Led by the Ministry of Agriculture and Food,
the government is dedicated to supporting and growing the local and regional food system. The purpose of the proposed
legislation is to:
Foster successful and resilient local food economies and systems throughout Ontario;
Increase awareness of the diversity of local food in Ontario; and
Encourage the development of new markets for local food.
43 Millier Dickinson Blais: King Township Economic Development Strategy
When implemented, the Local Food Act will provide funding for collaborative food projects and to support innovation in the
agri-food industry. As part of the legislation it is proposed that the week beginning with the Monday following Victoria Day
each year to serve as “Local Food Week”.
The Local Food Week and other initiatives that come out of the Act‟s implementation could be used to jump-start a
discussion about the provincial changes needed to enable value added agri-business operations in the province‟s rural
areas, particularly those around the GTA and the Holland Marsh in particular. The Local Food Act also provides further
support to the implementation of recommendations from a business retention and expansion project completed by King
Township and Whitchurch-Stouffville in 2012.29
The proposed action plan place a significant emphasis on fostering
partnerships between regional non-for-profits and the two municipalities. For example, York Region can be an important
partner for King Township to promote and increase the sale of local food. Earlier this year, York Region Food Network
released its food charter which seeks to co-ordinate food-related policies and programs among the Region‟s nine
municipalities. The York Region Food Charter is a vision for thriving urban and rural communities in which a resilient
foods system is being created. Amongst the values identified in the charter is promoting economic development plans that
ensure the sustainability of agriculture in the region. The following were among the key recommendations in the BR&E
study:
Investigating a regional Taste Trail in Regional Tourism Organization 6 (Central Counties Tourism);
Evaluating opportunities in the ethnic food sector;
Building a relationship with the York Region Farm Fresh program; and
Supporting the York Agricultural Advisory Liaison Group on sector specific issues and initiatives.
29 King + Whitchurch-Stouffville Cultivating Business, Business Retention and Expansion Final Report, October 2012.

44 Millier Dickinson Blais: King Township Economic Development Strategy
45 Millier Dickinson Blais: King Township Economic Development Strategy
4 SWOT Assessment
An important component in the advancement of any economic development strategy is the opinions and thoughts of both
business and community leaders present within the municipality. They can provide an excellent source of up-to-date
information or perceptions, as it relates to an area‟s strengths and weaknesses, as well as the opportunities and threats
that may be confronting the business community or broader region in its efforts to attract and retain business investment.
In this context a SWOT (strengths, weaknesses, opportunities and threats) assessment of King Township was undertaken
to examine its ability to support the attraction, retention and expansion of business investment and its capacity to deliver
on economic development programming. Input to the SWOT includes comments received during the stakeholder
interviews, focus group sessions and findings from the context review.
Based on the input received from the consultation effort, together with the findings derived during the development of the
strategic plan‟s background report, the major themes of the SWOT assessment are summarized below.
4.1 Strengths
It is essential that an economic development strategy build off and capitalize on the unique elements and strengths of a
local community in a way that will lead to growth and critical mass of business and investment activity in the future.
The following discussion highlights some of the key elements on which to build a strong economic future.
A Preferred Place to Live: Consultation participants stated that residents of King Township are attracted to the
community because of its rural nature, village atmosphere and lifestyle opportunities. There is also the added advantage
of living in a small community, while at the same time having ready access to the economic and cultural benefits that the
city of Toronto and other parts of York Region have to offer.
Location in the Greater Toronto Area: King Township has immediate access to Highway 400 one of the province‟s
busiest 400 series highways. This transportation corridor with linkages to Highway 407 and 401 provides local
businesses with access to the larger urban centres of the GTA and Central Ontario.
A Strong Regional Economy: York Region has a clear advantage in the attraction of business and industry investment
in sectors such as information technology, biotechnology, automotive and business services. King Township can leverage
these conditions to create opportunities for potential industry growth and partnership opportunities.

46 Millier Dickinson Blais: King Township Economic Development Strategy
Access to a Talented Local and Regional Labour Force: Not only does King Township have a well-educated, but it is
part of a regional labour market that is among the most diverse and skilled in the country. Access to this talent pool is an
asset to local businesses and companies looking to expand or relocate to the municipality.
Effective Community Partners: King Township benefits from strong community partners that have a vested interest in
the continued success and viability of the local economy. The King Chamber of Commerce together with the King Public
Library are well positioned to support the growth of local entrepreneurs and small business through the delivery and
hosting of economic development related programming and connecting small business with needed resources. The
Kingbridge Centre and Seneca College have also made long term commitments to the community and are actively
engaging local business around the tools and talent needed to achieve local success.
Flourishing Agricultural Community: Almost 30% of all the farms in York Region are located in King Township. Home
to the Holland Marsh, better known as the “soup and salad bowl of Ontario”, the Township has some of the most fertile
land in the country and the success of local farming is evident in the high farm receipts. In addition, King Township is part
of a larger equine production region. The agricultural sector continues to flourish creating employment opportunities
across a regional supply chain.
Strong and Growing Educational Sector: Three post-secondary institutions along with several private elementary and
secondary schools are located in King Township. Seneca College‟s King Campus is accompanied by two unique
research centres operated by the University of Toronto and the University of Guelph. During the consultation process,
participants saw the planned expansion of Seneca College, particularly as it relates to its degree granting opportunities,
as an opportunity to draw attention and investment to the township.
An Emerging Creative Economy: There is a concentration of business consulting, engineering and film companies that
together make up the core of the township`s creative businesses and enterprises. Supporting this is a rapidly expanding
labour force in creative class occupations.
Unique Cultural and Recreational Assets: King Township is home to a strong base of cultural and recreational assets
that include Cold Creek Conservation Area, Seneca College, the Trisan Centre, Kingsbridge Centre, numerous golf clubs
and an extensive trail system. Throughout the year the community hosts events such as the Schomberg Fair, Holland
Marsh Soupfest, and Feast of Fields provide opportunities for residents and visitors to experience aspects of the local
culture and quality of life associated with living in King Township. In addition, there are a 138 cultural creative businesses
that contribute to the local economy making it a more vibrant and livable community.

47 Millier Dickinson Blais: King Township Economic Development Strategy
4.2 Weaknesses
While the previous discussion outlined the strengths on which to base economic growth, this does not necessarily ensure
a community‟s readiness or ability to capitalize on these growth opportunities.
The following sets out some of the weaknesses or competitive disadvantages facing King Township.
Lack of Investment Readiness: While the size of a community is not necessarily a limiting factor in investment
attraction, King Township‟s lack of serviced employment land, coupled with appropriate land use and zoning provisions
limits the municipality‟s ability to attract higher order employment or office-oriented employment uses. The absence of a
comprehensive community investment profile is also seen as limiting the Township`s ability to attract this needed
investment.
Limited Broadband Connectivity: The township is perceived by many within the community as having limited or poor
broadband connectivity, particularly in its more rural areas. As businesses depend on high speed broadband access for
their business operations and interactions with clients, it is essential that King address this matter as part of the broader
York Region broadband initiative.
High Cost of Employment Land: The cost of land per acre in King Township‟s employment areas ranges from
$450,000 - $550,000 for un-serviced sites. At these prices levels, the cost of land in King Township may act as a barrier
to investment. When the cost of land in King Township is compared to surrounding communities such as Caledon,
Richmond Hill, Aurora, Whitchurch-Stouffville, the township is at a competitive disadvantage in the attraction of business
and investment to the community.
Small Employment Base: There are 959 firms in the township with over 80% of these firms employing less than 10
people. In the absence of large scale business and industrial development opportunities, these findings suggest that the
township will continue to be dependent on small business and entrepreneurs to create employment opportunities in the
community. The nature of local businesses may also limit King Township‟s economic growth potential, as there are a
significant number of firms concentrated in sectors like construction, retail, administrative support and educational
services as well as a significant number of home based businesses.
Outflow of Local Labour Force: The small employment base limits opportunities for residents of King Township to live
and work locally. This is exacerbated by the fact that King Township is comprised of a highly skilled and well educated
labour force that hold occupations in management, business and finance, social science, education and government and
natural and applied sciences. The result is that many people who live in King Township commute to employment
opportunities in other parts of York Region and the GTA.
48 Millier Dickinson Blais: King Township Economic Development Strategy
Age of Land Use Planning Documents: The Township‟s Official Plan and Zoning By-law were completed in the 1970s.
While there has been a series of amendments to the Official Plan to bring it into conformity with the provincial planning
framework or account for site specific developments, the policies do not reflect current market trends and economic
development opportunities. Stakeholders consulted as part of the strategy development process suggested that
navigating through the series of amendments is cumbersome and the timing associated with development approvals is a
deterrent to investment.
High Cost of Housing: As of 2012, the average value of a dwelling in King Township was $616,811 compared to
$462,946 in Caledon and $485,148 in Richmond Hill30
. The high cost of housing in the municipality limits its ability to
attract and retain younger workers and families, singles and retirees. Many participants in the consultation process also
suggested that the lack of housing options is also a challenge making it difficult for young people to remain in the
community unless they live at home. The high cost of housing ultimately acts to undermine the investments made in
quality of life assets that would otherwise bring people and businesses to the community.
Lack of Cultural Diversity: In the future, Ontario and Canada will rely on immigration to provide the skilled workers and
entrepreneurs needed to support the continued growth and expansion of the provincial and national economies. While
portions of York Region (Vaughan, Richmond Hill and Markham) have become ethnically diverse, communities like King
Township have not; due in part to a small employment base and the lack of social networks or services to support this
growing portion of the GTA‟s population.
Lack of a Distinctive Identity: The community continues to struggle with the notion of a distinctive identity around which
to rally residents and attract visitors and business to the area. This is due in part to the fact that population in the
Township is dispersed to a number of villages and hamlets, all of which see themselves as unique.
4.3 Opportunities
External factors can also play a significant role in determining the possibilities for an economic development strategy. This
can include structural changes in the broader economy, shifts in demographics and technological changes.
The following summarizes some of the major factors that will influence the outcome of the economic development
strategy.
30 BMA Consulting, 2012 Municipal Study.

49 Millier Dickinson Blais: King Township Economic Development Strategy
Undertake Community Improvement Plans: Communities across Ontario are deploying a range of fiscal and land use
planning tools to assist with the revitalization of downtowns and older industrial areas or encourage higher density
residential development or investment in select areas of their communities. A community improvement plan (CIP) can
help reduce or defer development costs. Typically, a CIP can include two types of financial incentive programs – ones
that maintain and enhance the existing building stock, including heritage buildings; and others that are intended to
facilitate new development projects. In the case of King Township, both types of incentive programs should be
considered.
Create a Corporate Gateway to the Community: With the planned development of prestige employment uses on the 85
acre King City Corporate Centre at King Road and Jane Street, coupled with the presence of the Kingbridge Conference
Centre location and the consideration being given to the moving of the Township‟s municipal offices to the corridor, King
Township has a unique opportunity to create a significant corporate gateway to the community and leverage this
investment potential.
Leverage Post-Secondary Presence: Seneca College‟s King Campus is undergoing a major expansion which will result
in a doubling of its student population and the introduction of new programs, services and facilities. Working together with
the Region, public transit can be improved and better integrated with new housing for students. As Seneca grows, its
activities will have a positive spillover effect for the local economy. Colleges are seen as a local resource for businesses
who seek to gain access to both talent and research that the institution produces.
Pursue an Agri-business Innovation Hub: The York Region economic development action plan includes a goal to
develop a greater post-secondary and research presence in the region. This will be accomplished through greater support
for public and private research-based investments, focusing on partnerships with existing facilities. In particular, the plan
will focus on the development of innovation hubs including one at the Holland Marsh focused on agri-business and
innovation in food production. The Holland Marsh is an ideal location for such a centre and the Township should be
actively involved in the planning and development of such a facility.
Support for Small and Medium Sized Businesses: Much of the growth in the regional economy and indeed the local
economy can be attributed to small and medium sized firms across a wide range of industries, many of which are
innovative and entrepreneurial. The Township needs to build on this trend in its marketing and promotion efforts but also
in its land use planning. There are opportunities to cultivate a knowledge based economy in the community that effectively
leverages the presence of Seneca College, builds on the perception of King Township as a „green‟ community and
reflects the high degree of entrepreneurship already evident in the Township.
Identify a Strategic Employment Area: Consideration should also be given to identifying the lands at King
Road/Highway 400 as a long term strategic employment area despite the fact that they are currently outside the

50 Millier Dickinson Blais: King Township Economic Development Strategy
settlement boundary for King City. There are a growing number of GTA municipalities calling for enhanced investment in
the 400-series highway network through and adjacent to their communities. While these lands are protected under the
province‟s Greenbelt Act, this protection needs to be reconsidered in light of the opportunity to stimulate economic growth
in the township and support an expanding York Region economy.
Advocate Alignment of Economic Policy with Urban and Rural Economies: The GTA Countryside has a different
economy than the more urban areas of the GTA and province. Businesses located in the countryside often have different
locational requirements (e.g. outdoor storage) than the more urban areas. Furthermore, provincial fiscal and planning
policies often have unintended consequences for the industries that are important to rural communities. The results can
leave rural communities struggling with changing economic conditions driven by external pressures, which they have little
potential to resolve for their constituents.
With this in mind, King Township needs to be actively involved in advocating for new policy approaches that respects the
workings of an urban economy, while reflecting the unique needs and requirements of near urban and rural areas of the
GTA. This includes an enhanced definition of agricultural related uses in the Provincial Policy Statement to include larger
scale industrial operations that have a relationship to the local agricultural function; and expanding permitted uses in
protected areas of the Greenbelt to promote and enable economic development, environmental sustainability, recreation
and tourism activities and employment uses supporting agricultural operations.
Develop a Strong Value Proposition for Business Investment: Feedback from the community stakeholder‟s suggests
that the Township needs to be more proactive in its approach to marketing and promotion, particularly as it relates to an
external audience. Taking into consideration the nature of the local business community, the planned infrastructure
investment and development and the transformational nature of Seneca College‟s expansion, King Township has a
unique opportunity to shape the perceptions of and interests in the community.
4.4 Threats
The obvious measure of success for any economic development strategy will be how well a jurisdiction capitalizes on its
opportunities in order to drive economic growth and prosperity. Equally important however, is how those same
jurisdictions address or manage the internal and external threats that may impact that vision of a vibrant and healthy
community.
The following discussion lays out the key threats facing King Township in the implementation of an effective economic
development strategy.

51 Millier Dickinson Blais: King Township Economic Development Strategy
Changes to Provincial Planning Framework will Take Time: The province‟s Provincial Policy Statement (PPS) is
currently under review and both the Greenbelt and the Places to Grow plans will be the subject of reviews beginning in
2015. It is essential that King Township together with other rural communities in York Region and across the GTA
countryside be actively engaged and consulted in any proposed changes. Notwithstanding this effort, changes to
provincial legislation will take time. In preparation for these reviews, King Township should be advocating for a detailed
review of the economic impact of the Greenbelt Plan on rural communities in York Region.
Sustainability of Debt Servicing: King Township has assumed a considerable amount of debt to service the capital
expenditures required to accommodate population and employment growth as part of regional growth management plan.
The community is relatively small with a base population of approximately 20,000 people with infrastructure development
costs spread over a small number of households, business and enterprises. The province‟s debt servicing ceiling is set at
25% of a municipality‟s annual revenues. While development charges can lessen the cost of infrastructure to a
municipality, not all costs are fully recoverable.
Limited Public Transit Linkages: York Region Transit (YRT/Viva) currently operates limited service into King Township.
There are three service routes at present into Seneca College‟s King Campus, St. Thomas Villanova College and a
limited area in King City. Limited GO train service is available at King City but parking is insufficient to accommodate
demand. The lack of public transit to King Township will challenge employers in the attraction of workers as they will have
to rely on personal vehicles to get to work. Further, the nature of local employment coupled with the high cost of housing
in the Township suggests that local employers will also have to rely on attracting a regional workforce to satisfy their
staffing needs.
Decline of the Equine Industry: The announcement to end the Slots at Racetracks Program in 2012 is seen by many in
the industry as threatening the entire equine industry value chain in southern Ontario. While a temporary reprieve was
granted in March of 2013, the Ontario Horse Racing Industry Association has stated that the funding extension to 2014
does not provide the stability needed for the industry to survive long-term.

52 Millier Dickinson Blais: King Township Economic Development Strategy
53 Millier Dickinson Blais: King Township Economic Development Strategy
5 Strategy Development Process
A comprehensive five year Economic Development Strategy for King Township has emerged from a multi-phase process
premised on a thorough research and analysis of the township‟s economic opportunities, as well as internal and external
consultation.
The strategy development process began in December 2012 with a review of background documents to establish the
policy and planning context in which the economic development strategy was to be created and implemented. This
included a review of such documents such as the Township‟s Official Plan, Secondary Plans for Nobleton, King City and
Schomberg and King Township‟s Integrated Sustainability Plan. Key findings from this review are reflected throughout this
document. The background review was supplemented with the completion of an economic base analysis that illustrated
the demographic and socio-economic composition of the Township in the broader context of regional and provincial
trends.
Community and stakeholder consultation has supported this research and analysis. This included a visioning session with
the Sustainability Committee, 25 one-to-one interviews with Mayor, members of Council, the Chief Administrative Officer,
department heads, local employers and community economic development organizations. These sessions were
complemented with a broader public outreach that included three focus group discussions with business and community
stakeholders hosted at the Kingbridge Centre.
The internal and external analysis conducted generated a wealth of information which was assessed using a SWOT
(strengths, weaknesses, opportunities and threats) assessment. The SWOT assessment summarizes the key issues
impacting the formulation and implementation of the strategy.
The final output of the strategy development process is the articulation of clear and attainable economic development
goals and objectives coupled with programs and activities that will direct King Township during implementation.
In addition to serving as a guide for the Township‟s senior administration, it is hoped that the strategy will provide an
opportunity to more effectively engage with other economic development partners, senior levels of government, and the
private sector.

54 Millier Dickinson Blais: King Township Economic Development Strategy
5.1 Vision Statement
King Township, through the development of its Sustainability Plan, established an overarching vision of the ideal future for
the community based on the common values, priorities and aspirations of residents.
“King Township is an idyllic countryside community of communities, proud of its rural, cultural and agricultural heritage. We are respected for treasuring nature, encouraging a responsible local
economy, and celebrating our vibrant quality of life.”
5.2 Goals, Objectives and Actions
Goals contained in an economic development strategy speak to the aspirations of a community and convey the desired
outcomes of the strategic planning process. Objectives then define what is to be accomplished while the actions outline
how we will make this happen.
The goals, objectives and associated actions that follow require King Township to assume a greater leadership role
regarding engaging regional stakeholders and creating more of an enabling environment for business and industry to
thrive.
The King Township Economic Development Strategy has four high level goals, intended to anchor and qualify the
Township‟s strategic economic development initiatives. The timing for the associated actions that serve to implement the
strategy are categorized as short term (one to two years), medium term (two to three years) and long term (five years).
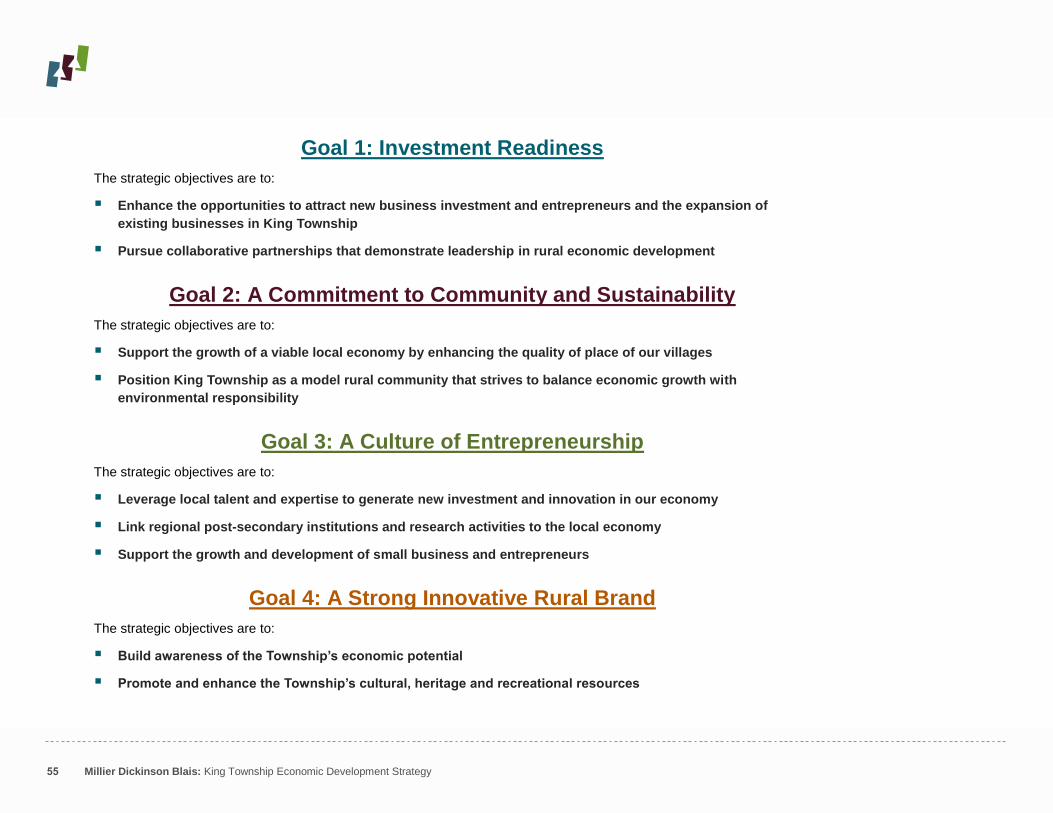
55 Millier Dickinson Blais: King Township Economic Development Strategy
Goal 1: Investment Readiness
The strategic objectives are to:
Enhance the opportunities to attract new business investment and entrepreneurs and the expansion of
existing businesses in King Township
Pursue collaborative partnerships that demonstrate leadership in rural economic development
Goal 2: A Commitment to Community and Sustainability
The strategic objectives are to:
Support the growth of a viable local economy by enhancing the quality of place of our villages
Position King Township as a model rural community that strives to balance economic growth with
environmental responsibility
Goal 3: A Culture of Entrepreneurship
The strategic objectives are to:
Leverage local talent and expertise to generate new investment and innovation in our economy
Link regional post-secondary institutions and research activities to the local economy
Support the growth and development of small business and entrepreneurs
Goal 4: A Strong Innovative Rural Brand
The strategic objectives are to:
Build awareness of the Township’s economic potential
Promote and enhance the Township’s cultural, heritage and recreational resources
56 Millier Dickinson Blais: King Township Economic Development Strategy
5.3 Performance Measurements
The effective implementation of the recommended actions for the King Township`s economic development office must be
accompanied by effective performance measurement and monitoring. Performance measures are a tool to evaluate the
effectiveness of an organization‟s activities. By tracking and reporting on its efforts, the economic development office will
be more likely to:
Be accountable and responsive to the expectations of its stakeholders;
Be able to demonstrate the return on investment into the department and the programs it supports;
Improve its performance by learning from prior efforts, and;
Receive additional support (in the form of staff, funding and other resources) to pursue its mandate.
To that end, this strategy provides a series of potential performance measurements associated with each goal statement.
These performance measures are preliminary suggestions to inform a more detailed accounting and evaluation of the
office‟s activities.

57 Millier Dickinson Blais: King Township Economic Development Strategy
5.4 Action Plan
Goal 1 – Investment Readiness
Required Actions Township
Lead Potential Partners
Priority/ Timing
Performance Measure
Objective 1: Enhance the opportunities to attract new business investment and entrepreneurs and the expansion of existing businesses in King Township.
1. Initiate a review of the Township‟s Official Plan and Zoning Bylaws to ensure there
is a clear vision, goals, policies and implementation mechanisms to direct and
manage growth in the Township and that they support the attraction of business
investment in the Township‟s target sectors as well as home based businesses.
Planning Department
Economic Development
Office
High/
Short term
Updated Official Plan and Zoning Bylaws
2. Prepare Community Improvement Plans in the settlement areas of King City,
Nobleton and Schomberg to make use of grants and tax incentives to jump start
investment and assist with place-making efforts.
2.1. Include a review of the Village Centre Urban Design Guidelines.
Planning Department
Economic Development
Office, Finance
Department
High/
Short term
Completion of community improvement plans for Township Villages
3. Develop an inventory of available serviced and un-serviced commercial and
industrial land, as well as commercial and industrial buildings in the Township and
make the information available on the Township‟s website. The following information
should be included at a minimum:
Parcel size,
Privately or municipally owned,
Contact information
Zoning and servicing information
Proximity to regional/provincial roads
Economic Development
Office
Planning Department, land owners, real estate community
High /
Short term
Current listing of available properties
4. Assess the opportunity to expedite the provision of full services to the Township‟s
existing employment lands as a way to increase the availability of shovel ready
industrial land and seek the appropriate approvals as required.
4.1. Protect designated employment areas for higher order employment uses
Economic Development
Office, Planning
Department
York Region, land owners
High /
Short to Medium Term
Increase in inventory of available serviced employment land

58 Millier Dickinson Blais: King Township Economic Development Strategy
Required Actions Township
Lead Potential Partners
Priority/ Timing
Performance Measure
5. Complete a Corridor Study for King Road between Jane and Dufferin Streets with
the goal of stimulating economic development, making it a more attractive and
profitable location to do business and creating a focal point for retail/service and
special events in the community.
Planning Department
Economic Development
Office
High/
Short term
Creation of “Gateway” to King Township, Intensification along Corridors and the creation of a vibrant street life
6. Streamline the development approvals process for new commercial and industrial
development. As part of this effort the Township should communicate its intent for
specific areas to the development community.
Planning Department
Economic Development
Office
High/
Short term
Average time to approve development applications benchmarked against neighbouring municipalities
7. Pursue opportunities to designate the lands at Highway 400 and King Road as a
Strategic Employment Area for future growth and the achievement of long-term
employment targets set by York Region.
Planning Department
Office
Economic Development, York Region
High /
Long Term
Lands removed from Greenbelt
Objective 2: Pursue collaborative partnerships that demonstrate leadership in rural economic development.
8. Support and promote York Region‟s efforts to improve and leverage broadband
connectivity in the region as a means for local businesses to remain competitive and
grow.
Economic Development
Office
Region of York
Economic Development, Chamber of Commerce
High /
Short to Medium Term
Average upload speed of rural residents and businesses
9. Pursue opportunities to diversify sources of on farm revenue and access emerging
economic development opportunities in the Township‟s rural area including
processing operations that have a relationship to the region‟s agricultural function.
Mayor and Council,
CAO, economic
development, planning and
finance departments
Region of York
Economic Development Department,
Planning Department,
local landowners,
Greater Toronto
Countryside Mayors Alliance,
Public Library
Medium/
Short term to long term
Broaden secondary uses permitted on agricultural lands
Increased business investment in the rural area

59 Millier Dickinson Blais: King Township Economic Development Strategy
Required Actions Township
Lead Potential Partners
Priority/ Timing
Performance Measure
10. Pursue opportunities to expand the range of land uses that are permitted within the
Township‟s Greenbelt lands as a way to stimulate economic development,
recreational and tourism activities and enhance employment uses that support
agricultural operations.
Mayor and Council,
CAO, economic
development, planning and
finance departments
Region of York, Greater
Toronto Countryside
Mayors Alliance
High/
Short term to Medium term
Development of strategic approach that defines roles and responsibilities
11. Participate in the tourism and industry development efforts being undertaken by
Headwaters Equine Leadership Team and leverage this work to increase
awareness of the economic impact of the equine industry in the region and identify
next steps for King Township.
Economic Development
Office
Hills of the Headwaters
Tourism Association
(Headwaters Equine
Leadership Team)
Medium/
Medium term
Well defined supply chain and increased investment in equine industry
12. Contribute to provincial discussions regarding the future 427 and 400 link. Mayor and Council,
CAO, planning
department
Region of York
Medium/
Long term
Government infrastructure funding commitment for the GTA West corridor
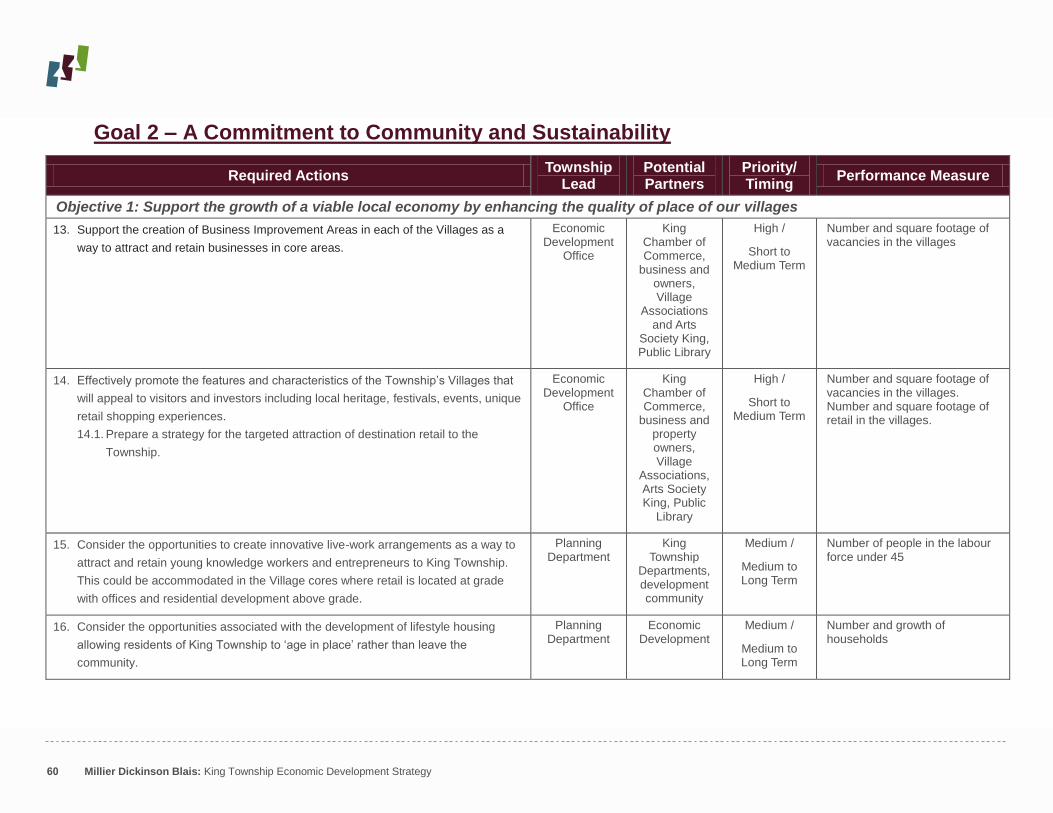
60 Millier Dickinson Blais: King Township Economic Development Strategy
Goal 2 – A Commitment to Community and Sustainability
Required Actions Township
Lead Potential Partners
Priority/ Timing
Performance Measure
Objective 1: Support the growth of a viable local economy by enhancing the quality of place of our villages
13. Support the creation of Business Improvement Areas in each of the Villages as a
way to attract and retain businesses in core areas.
Economic Development
Office
King Chamber of Commerce,
business and owners, Village
Associations and Arts
Society King, Public Library
High /
Short to Medium Term
Number and square footage of vacancies in the villages
14. Effectively promote the features and characteristics of the Township‟s Villages that
will appeal to visitors and investors including local heritage, festivals, events, unique
retail shopping experiences.
14.1. Prepare a strategy for the targeted attraction of destination retail to the
Township.
Economic Development
Office
King Chamber of Commerce,
business and property owners, Village
Associations, Arts Society King, Public
Library
High /
Short to Medium Term
Number and square footage of vacancies in the villages. Number and square footage of retail in the villages.
15. Consider the opportunities to create innovative live-work arrangements as a way to
attract and retain young knowledge workers and entrepreneurs to King Township.
This could be accommodated in the Village cores where retail is located at grade
with offices and residential development above grade.
Planning Department
King Township
Departments, development community
Medium /
Medium to Long Term
Number of people in the labour force under 45
16. Consider the opportunities associated with the development of lifestyle housing
allowing residents of King Township to „age in place‟ rather than leave the
community.
Planning Department
Economic Development
Medium /
Medium to Long Term
Number and growth of households

61 Millier Dickinson Blais: King Township Economic Development Strategy
Required Actions Township
Lead Potential Partners
Priority/ Timing
Performance Measure
17. Continue to support the implementation of a BR+E program geared to the
Township„s key economic sectors (agriculture/agri-business, manufacturing,
business and professional services).
17.1. Implement the recommendations from the agricultural business retention and
expansion program
Economic Development
Office
Chamber of Commerce
High /
Medium Term
Number of BR&E recommendations implemented
18. Position and promoting King Township libraries as community gathering points for
business networking and small business support (e.g. regular business seminars,
meeting rooms with technology, free wireless capability, video conferencing etc.).
Economic Development
Office
Public Library, Chamber of Commerce
Medium /
Short to Medium Term
Number of Small Business Events, Number of Users of Services
Objective 2: Position King Township as a model rural community that strives to balance economic growth with environmental responsibility
19. Consider opportunities to create an eco-industrial park at King Road and Jane
Street as a way to encourage environmentally responsible and resource efficient
development and attract higher order users to the site.
19.1. Work with York Region Economic Development to develop a business plan for
the park
Economic Development
Office
Planning Department, York Region Economic
Development Department, land owners,
Medium /
Short to Medium Term
Business plan created for the eco-industrial park
20. Amend the Township‟s 2004 Procurement By-law to place a greater emphasis on
environmental stewardship
20.1. Policy should aim to demonstrate the municipality‟s commitment to
environmental stewardship and values.
Finance Department
Economic Development
Office
Medium/
Medium term to long term
Amendments to the Township„s Procurement By-law

62 Millier Dickinson Blais: King Township Economic Development Strategy
Goal 3 – A Culture of Entrepreneurship
Required Actions Township
Lead Potential Partners
Priority/ Timing
Performance Measure
Objective 1: Leverage local talent and expertise to generate new investment and initiatives.
21. Secure the development of an Agri-business Centre around Holland Marsh focused
on innovation in food production.
Economic Development
Office
York Region Economic
Development, Holland Marsh
Growers Association, University of
Guelph
High /
Short to long-term
Funding and site secured for an agri-business centre
22. Pursue opportunities to create an innovation hub focused on research and
education in bio-diversity, ecology and conservation biology centered on the
University of Toronto Koffler Scientific Reserve.
Economic Development
Office
York Region Economic
Development, University of
Toronto
Medium / Medium to Long Term
Funding dollars directed to the University of Toronto„s Koffler Scientific Reserve
23. Initiate a crowdsourcing initiative for King Township to raise money for small
businesses and community development projects. Work with local groups and high
schools to identify projects that will facilitate economic activity, assist with the
revitalization of the Township‟s villages and foster community pride.
Economic Development
Office
King Chamber of Commerce, York Region
Small Business Enterprise
Centre
High/
Short term
Funding dollars to support development projects
24. Give consideration to creating an economic development working group within the
sustainability committee comprised of key members of the business community and
regional economic development organizations to support local entrepreneurs and
business programming.
Economic Development
Office
York Region Economic
Development, business
community leaders
Medium /
Short to long term
Economic Development Advisory Committee created
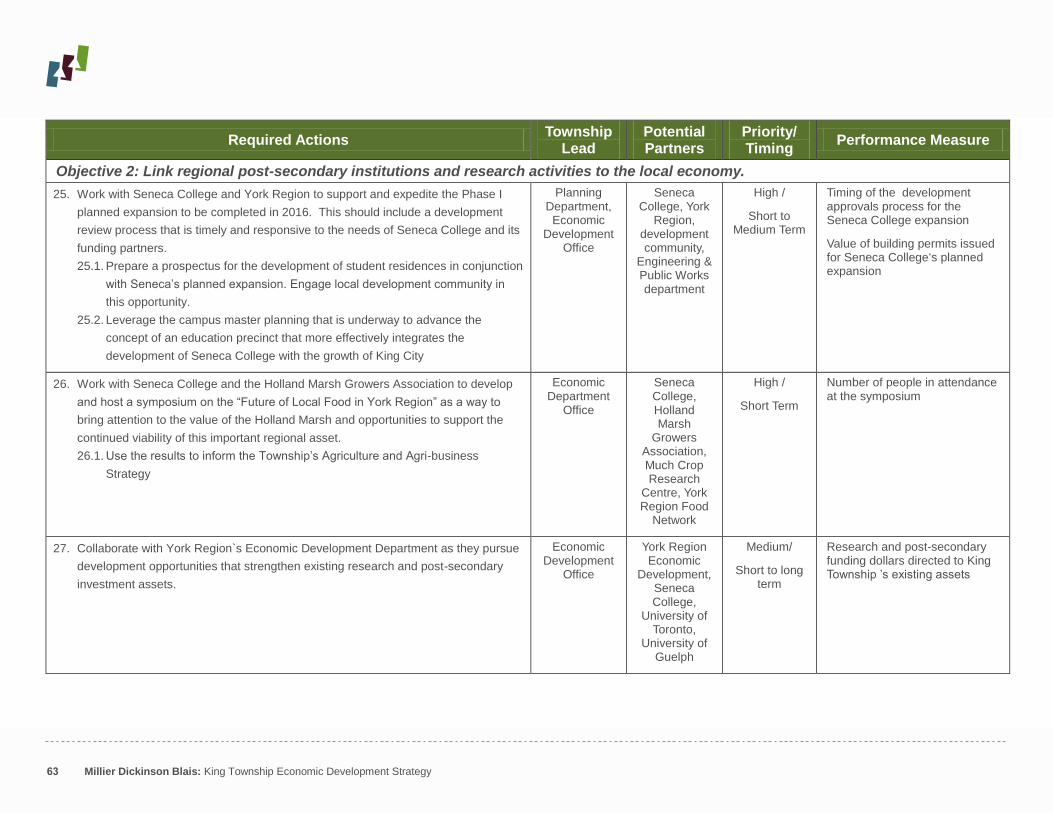
63 Millier Dickinson Blais: King Township Economic Development Strategy
Required Actions Township
Lead Potential Partners
Priority/ Timing
Performance Measure
Objective 2: Link regional post-secondary institutions and research activities to the local economy.
25. Work with Seneca College and York Region to support and expedite the Phase I
planned expansion to be completed in 2016. This should include a development
review process that is timely and responsive to the needs of Seneca College and its
funding partners.
25.1. Prepare a prospectus for the development of student residences in conjunction
with Seneca‟s planned expansion. Engage local development community in
this opportunity.
25.2. Leverage the campus master planning that is underway to advance the
concept of an education precinct that more effectively integrates the
development of Seneca College with the growth of King City
Planning Department,
Economic Development
Office
Seneca College, York
Region, development community,
Engineering & Public Works department
High /
Short to Medium Term
Timing of the development approvals process for the Seneca College expansion
Value of building permits issued for Seneca College„s planned expansion
26. Work with Seneca College and the Holland Marsh Growers Association to develop
and host a symposium on the “Future of Local Food in York Region” as a way to
bring attention to the value of the Holland Marsh and opportunities to support the
continued viability of this important regional asset.
26.1. Use the results to inform the Township‟s Agriculture and Agri-business
Strategy
Economic Department
Office
Seneca College, Holland Marsh
Growers Association, Much Crop Research
Centre, York Region Food
Network
High /
Short Term
Number of people in attendance at the symposium
27. Collaborate with York Region`s Economic Development Department as they pursue
development opportunities that strengthen existing research and post-secondary
investment assets.
Economic Development
Office
York Region Economic
Development, Seneca College,
University of Toronto,
University of Guelph
Medium/
Short to long term
Research and post-secondary funding dollars directed to King Township ‟s existing assets

64 Millier Dickinson Blais: King Township Economic Development Strategy
Required Actions Township
Lead Potential Partners
Priority/ Timing
Performance Measure
Objective 3: Support the growth and development of small and medium size businesses.
28. Promote the services of the York Small Business Enterprise Centre and encourage
opportunities to host small business events in King Township. Encourage the
participation of senior business leaders who are residents of King Township.
Economic Development
Office
York Region Economic
Development, King
Chamber of Commerce,
Public Library
High/
Short-term
Small business events held in King Township
29. Develop a stronger partnership with ventureLAB in Markham to encourage and
support entrepreneurship, innovation, commercialization and investment in King
Township‟s industry, especially agriculture.
Economic Development
Office
ventureLAB Medium/
Short to long term
Funding dollars committed to support ventureLAB
30. Work with Chamber of Commerce and Small Business Enterprise Centre to promote
and deliver small business seminars geared to e-marketing, website development,
business networking, workforce planning and marketing. Connect small businesses
with senior business leaders in the community who can act as mentors and
coaches.
King Chamber of Commerce
Economic Development,
Small Business Enterprise
Centre, Public Library
Medium /
Medium term
Number of people enrolled in the training courses.
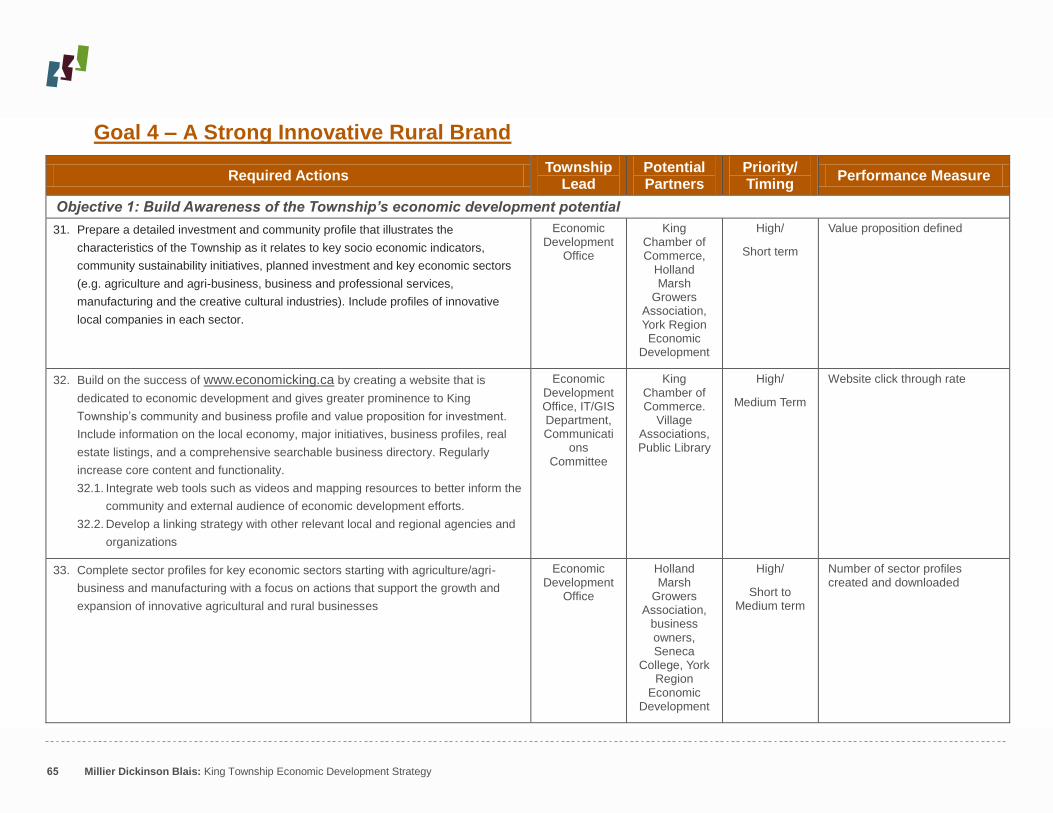
65 Millier Dickinson Blais: King Township Economic Development Strategy
Goal 4 – A Strong Innovative Rural Brand
Required Actions Township
Lead Potential Partners
Priority/ Timing
Performance Measure
Objective 1: Build Awareness of the Township’s economic development potential
31. Prepare a detailed investment and community profile that illustrates the
characteristics of the Township as it relates to key socio economic indicators,
community sustainability initiatives, planned investment and key economic sectors
(e.g. agriculture and agri-business, business and professional services,
manufacturing and the creative cultural industries). Include profiles of innovative
local companies in each sector.
Economic Development
Office
King Chamber of Commerce,
Holland Marsh
Growers Association, York Region Economic
Development
High/
Short term
Value proposition defined
32. Build on the success of www.economicking.ca by creating a website that is
dedicated to economic development and gives greater prominence to King
Township‟s community and business profile and value proposition for investment.
Include information on the local economy, major initiatives, business profiles, real
estate listings, and a comprehensive searchable business directory. Regularly
increase core content and functionality.
32.1. Integrate web tools such as videos and mapping resources to better inform the
community and external audience of economic development efforts.
32.2. Develop a linking strategy with other relevant local and regional agencies and
organizations
Economic Development Office, IT/GIS Department, Communicati
ons Committee
King Chamber of Commerce.
Village Associations, Public Library
High/
Medium Term
Website click through rate
33. Complete sector profiles for key economic sectors starting with agriculture/agri-
business and manufacturing with a focus on actions that support the growth and
expansion of innovative agricultural and rural businesses
Economic Development
Office
Holland Marsh
Growers Association,
business owners, Seneca
College, York Region
Economic Development
High/
Short to Medium term
Number of sector profiles created and downloaded

66 Millier Dickinson Blais: King Township Economic Development Strategy
Required Actions Township
Lead Potential Partners
Priority/ Timing
Performance Measure
34. Leverage the investment marketing resources and efforts of York Region Economic
Development to promote King Township„s economic development opportunities to a
broader audience.
Economic Development
Office
York Region Economic
Development
Medium/
Short term to long term
Integration of King Township„s investment marketing resources with York Region„s resources
Objective 2: Promote and Enhance the Township’s cultural, heritage and recreational resources
35. Build on the success of Holland Marsh Soupfest and Feast of Fields to organize
other local food events and activities that promote the culinary diversity of foods in
the region and the Holland Marsh in particular.
Parks, Recreation and Culture Department
Economic Development Office, Public
Library
Medium /
Short to medium term
Estimated event attendance
36. Promote more participation of local farms in York Region‟s Farm Fresh Initiative
(e.g./ Pumpkin Pie Trail)
Economic Development
Office
York Region Farm Fresh
High /
Short to Medium term
Uptake among local farms in the York Region Farm Fresh initiative
37. Align the Schomberg Fair with the province‟s Local Food Week. Leverage provincial
funding and seek innovative partnerships to enhance the Schomberg Fair.
Economic Development
Office
Parks, Recreation
and Culture, Schomberg Agricultural
Society
High/
Medium term
Government funding dollars directed to support the Schomberg Fair
38. Develop a Cultural Plan and Cultural Asset Map to support the development of the
arts, culture, recreation and culinary tourism in the Township based on the Cultural
Resource Framework in Appendix II. Leverage the work completed by other
communities in York Region towards the creation of a searchable database and
asset map of tourism and cultural resources in York Region.
38.1. Build on the findings to create a signature event for King Township
Parks, Recreation &
Culture, IT/GIS
Department
Economic Development
Office, Planning
department, King
Chamber of Commerce,
business community, Arts Society
King
High /
Short to Medium Term
Cultural Plan and Asset Map created

67 Millier Dickinson Blais: King Township Economic Development Strategy
5.5 Implementation Plan
The action plan assumes a larger role for King Township to drive economic development. The completion of this strategy
and action plan will begin the business planning process that incorporates the short term priorities set out in the strategy
and articulates the resources required to move forward with the strategy`s implementation.
Economic development services are delivered by an economic development officer who reports to the Chief
Administrative Officer. However, there is no separate governance structure that is responsible for monitoring
implementation. King Township should establish an economic development working group within the sustainability
committee to monitor the implementation of this strategy and action plan. This working group should provide insight and
advice to economic development personnel during implementation.
The 2013 budget for economic development services is approximately $230,000. This amount includes salaries and
benefits, travel and programming. The recommended actions suggest that additional expenditures will be required for the
economic development office to implement critical actions in the coming years. It may be sufficient to dedicate half of
one additional staff person`s time to the implementation of the strategy and action plan. The remainder of the time could
be devoted to another department such as parks, recreation & culture or planning.

68 Millier Dickinson Blais: King Township Economic Development Strategy

Millier Dickinson Blais: King Township Economic Development Strategy – Final Report -Appendices
King Township Economic Development Strategy Final Report – Appendices Approved November 2013

Millier Dickinson Blais: King Township Economic Development Strategy – Final Report -Appendices

Millier Dickinson Blais: King Township Economic Development Strategy – Final Report -Appendices
Contents
APPENDIX I: ECONOMIC BASE ANALYSIS ....................................................................................... 1
1.1 DEMOGRAPHICS 1
1.1.1 POPULATION 1
1.1.2 POPULATION AGE 2
1.1.3 IMMIGRATION 4
1.1.4 EDUCATIONAL ATTAINMENT 7
1.2 LABOUR FORCE AND EMPLOYMENT CHARACTERISTICS 9
1.2.1 LABOUR FORCE AND EMPLOYMENT CHARACTERISTICS 9
1.2.2 CREATIVE ECONOMY PROFILE 19
1.2.3 INDUSTRY SECTOR ANALYSIS 23
1.2.4 AGRICULTURAL PROFILE 32
1.2.5 LAND USE & PHYSICAL INFRASTRUCTURE ASSESSMENT 39
1.2.6 TAXES 43
1.3 COMMUNITY ASSET MAPPING 45
1.3.1 KING TOWNSHIP 45
1.3.2 KING CITY 46
1.3.3 SCHOMBERG 48
1.3.4 NOBLETON 50
APPENDIX II: STAKEHOLDER CONSULTATIONS ............................................................................53
APPENDIX III: PRELIMINARY CULTURAL ASSET INVENTORY ......................................................56

Millier Dickinson Blais: King Township Economic Development Strategy – Final Report -Appendices

1 Millier Dickinson Blais: King Township Economic Development Strategy – Final Report -Appendices
Appendix I: Economic Base Analysis
1.1 Demographics
1.1.1 Population
By 2031, the population of King Township is projected to increase from approximately 20,000 to 35,100 and the number
of jobs is projected to increase by 5,000.1 Growth is expected to be concentrated in the villages of King City, Schomberg
and Nobleton. In addition, it has been calculated that a minimum of 920 residential units will be needed to accommodate
the intensification targets established for York Region in the Growth Plan for the Greater Golden Horseshoe.2 The
projected population and employment growth forms a basis for the report as it underlines the planning, management and
work that is required to ensure that economic activity is supported in the township.
FIGURE 1: KING POPULATION AND EMPLOYMENT PROJECTIONS, 2011-2031
Source: York Region 2031, Population and Employment Forecasts, York Region Planning and Development Services, January, 2009
1 York Region 2031 Population and Employment Forecasts, York Region Planning and Development Services, January 2009
2 Growth Plan for the Greater Golden Horseshow, Ministry of Infrastructure, June 2016
23,400
8,000
35,100
12,100
Population Employment
2011 2031
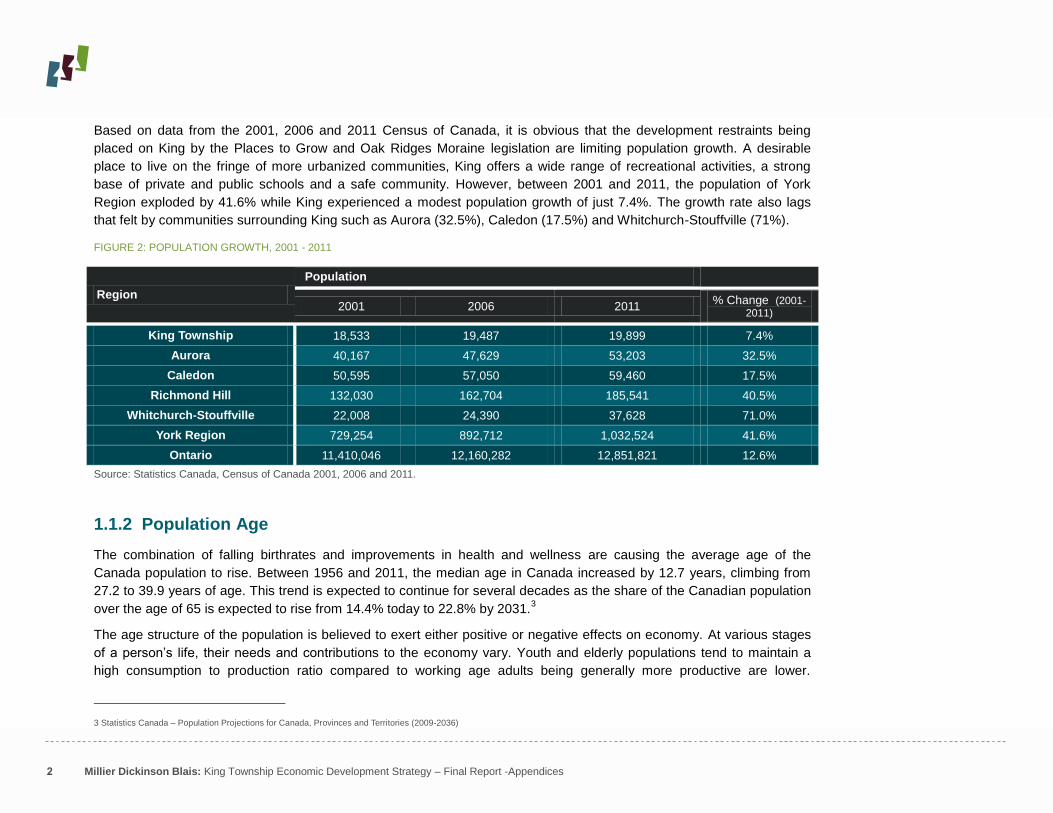
2 Millier Dickinson Blais: King Township Economic Development Strategy – Final Report -Appendices
Based on data from the 2001, 2006 and 2011 Census of Canada, it is obvious that the development restraints being
placed on King by the Places to Grow and Oak Ridges Moraine legislation are limiting population growth. A desirable
place to live on the fringe of more urbanized communities, King offers a wide range of recreational activities, a strong
base of private and public schools and a safe community. However, between 2001 and 2011, the population of York
Region exploded by 41.6% while King experienced a modest population growth of just 7.4%. The growth rate also lags
that felt by communities surrounding King such as Aurora (32.5%), Caledon (17.5%) and Whitchurch-Stouffville (71%).
FIGURE 2: POPULATION GROWTH, 2001 - 2011
Region
Population
2001 2006 2011 % Change (2001-
2011)
King Township 18,533 19,487 19,899 7.4%
Aurora 40,167 47,629 53,203 32.5%
Caledon 50,595 57,050 59,460 17.5%
Richmond Hill 132,030 162,704 185,541 40.5%
Whitchurch-Stouffville 22,008 24,390 37,628 71.0%
York Region 729,254 892,712 1,032,524 41.6%
Ontario 11,410,046 12,160,282 12,851,821 12.6%
Source: Statistics Canada, Census of Canada 2001, 2006 and 2011.
1.1.2 Population Age
The combination of falling birthrates and improvements in health and wellness are causing the average age of the
Canada population to rise. Between 1956 and 2011, the median age in Canada increased by 12.7 years, climbing from
27.2 to 39.9 years of age. This trend is expected to continue for several decades as the share of the Canadian population
over the age of 65 is expected to rise from 14.4% today to 22.8% by 2031.3
The age structure of the population is believed to exert either positive or negative effects on economy. At various stages
of a person‟s life, their needs and contributions to the economy vary. Youth and elderly populations tend to maintain a
high consumption to production ratio compared to working age adults being generally more productive are lower.
3 Statistics Canada – Population Projections for Canada, Provinces and Territories (2009-2036)

3 Millier Dickinson Blais: King Township Economic Development Strategy – Final Report -Appendices
According to a recent report from Harvard‟s Program on Global Demography of Aging, determinants of economic growth
such as aggregate labour supply, productivity, consumption and saving vary with the age cycle of the population.4 As a
result regions with large youth and/or elderly population are prone to experience slower economic growth than those
areas where the proportion of the working age population is higher.
While, an aging population is a signal of slower economic growth, there are many other factors at play such as the levels
of capital investment and the composition of the economy that determine the full impact. In King Township, the median
age of the population is 42.9 years of age. When King Township is compared to surrounding communities and the
province, the media age is two and a half years older than the next closest benchmarks (Caledon and the province).
FIGURE 3: MEDIAN AGE OF POPULATION, KING AND PEER REGIONS, 2011
Source: 2011 Census of Canada, Statistics Canada
As Figure 4 shows, the largest age group in King Township is 45-49 year olds which make up 9.8 percent of the total
population. One of the key observations that can be taken from the population pyramid is the thinning of the population
between the ages of 25-39. In King Township, the population above the median age can be expected to be heavy
consumers of health care and other services due to the above average incomes in the community. The strong
consumption power represents an economic opportunity for both local and external businesses.
4 Harvard Program on the Global Demography of Aging, Implications of Population Aging for Economic Growth; David E. Bloom, David Canning and Gunther Fink, 2011) -
http://www.hsph.harvard.edu/pgda/WorkingPapers/2011/PGDA_WP_64.pdf
20.2%
43.2%
28.5%
King York Region Ontario

4 Millier Dickinson Blais: King Township Economic Development Strategy – Final Report -Appendices
FIGURE 4: KING TOWNSHIP AGE PYRAMID, 2011
Statistics Canada. 2012. King, Ontario (Code 3519049) and York, Ontario (Code 3519) (table). Census Profile. 2011 Census. Statistics Canada Catalogue no. 98-316-XWE. Ottawa. Released October 24, 2012. http://www12.statcan.gc.ca/census-recensement/2011/dp-pd/prof/index.cfm?Lang=E (accessed February 6, 2013).
1.1.3 Immigration
The Canadian labour force is projected to grow from 18.5 million in 2010 to between 20.5 million and 22.5 million by 2031
according to estimates by Statistics Canada5. All projections indicate that over that time the rate of growth in the labour
force will slow and the participation rate will decline. The main source of labour force growth is expected to be through
immigration. By 2031, approximately one in three people in the labour force could be foreign born. Over the last 20 plus
years, the main source of new immigrants to Canada has been from Asian countries.
Economic literature has increasingly stressed the role of diversity in promoting economic prosperity. First, new immigrants
play an important role in filling labour market gaps in regions throughout Canada. Secondly, in a global economy, the
5 http://www.statcan.gc.ca/daily-quotidien/110817/dq110817b-eng.htm
6 4 2 0 2 4 6
0 to 4 years5 to 9 years
10 to 14 years15 to 19 years20 to 24 years25 to 29 years30 to 34 years35 to 39 years40 to 44 years45 to 49 years50 to 54 years55 to 59 years60 to 64 years65 to 69 years70 to 74 years75 to 79 years80 to 84 years
85 years and over
% Female
% Male
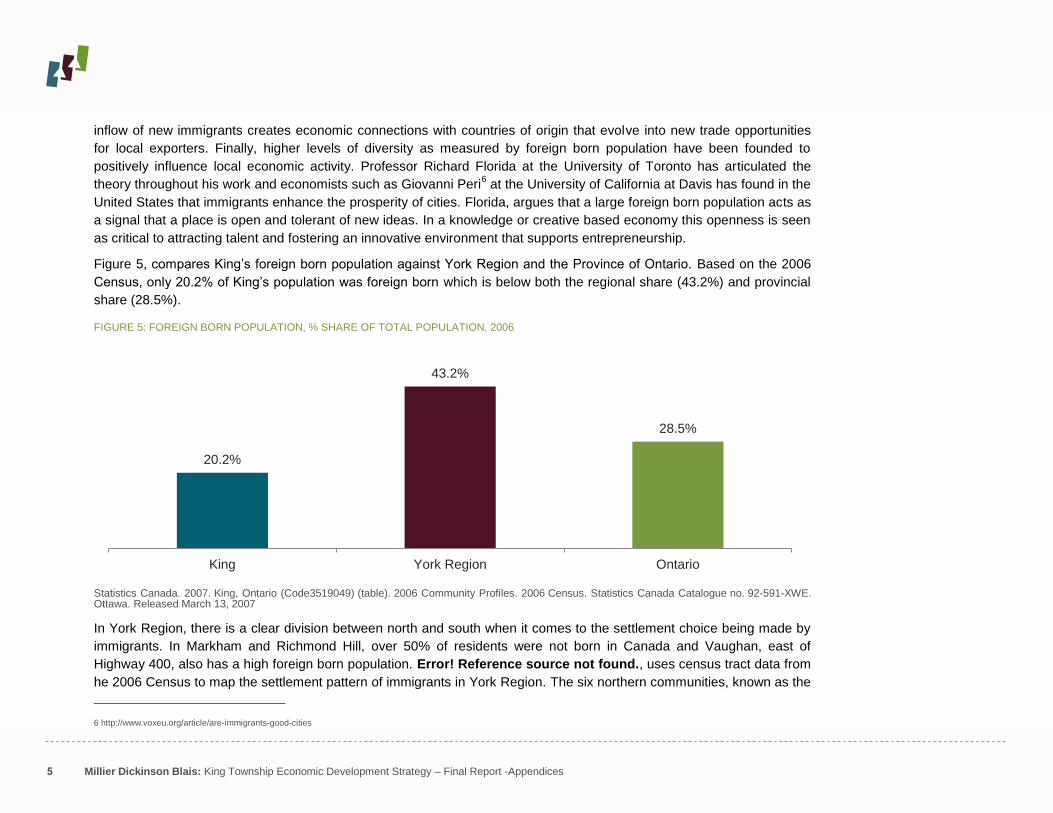
5 Millier Dickinson Blais: King Township Economic Development Strategy – Final Report -Appendices
inflow of new immigrants creates economic connections with countries of origin that evolve into new trade opportunities
for local exporters. Finally, higher levels of diversity as measured by foreign born population have been founded to
positively influence local economic activity. Professor Richard Florida at the University of Toronto has articulated the
theory throughout his work and economists such as Giovanni Peri6 at the University of California at Davis has found in the
United States that immigrants enhance the prosperity of cities. Florida, argues that a large foreign born population acts as
a signal that a place is open and tolerant of new ideas. In a knowledge or creative based economy this openness is seen
as critical to attracting talent and fostering an innovative environment that supports entrepreneurship.
Figure 5, compares King‟s foreign born population against York Region and the Province of Ontario. Based on the 2006
Census, only 20.2% of King‟s population was foreign born which is below both the regional share (43.2%) and provincial
share (28.5%).
FIGURE 5: FOREIGN BORN POPULATION, % SHARE OF TOTAL POPULATION, 2006
Statistics Canada. 2007. King, Ontario (Code3519049) (table). 2006 Community Profiles. 2006 Census. Statistics Canada Catalogue no. 92-591-XWE. Ottawa. Released March 13, 2007
In York Region, there is a clear division between north and south when it comes to the settlement choice being made by
immigrants. In Markham and Richmond Hill, over 50% of residents were not born in Canada and Vaughan, east of
Highway 400, also has a high foreign born population. Error! Reference source not found., uses census tract data from
he 2006 Census to map the settlement pattern of immigrants in York Region. The six northern communities, known as the
6 http://www.voxeu.org/article/are-immigrants-good-cities
20.2%
43.2%
28.5%
King York Region Ontario

6 Millier Dickinson Blais: King Township Economic Development Strategy – Final Report -Appendices
N6, King, Aurora, Newmarket, East Gwillimbury, Whitchurch-Stouffville and Georgina, except for a small pocket in
southwestern Newmarket have foreign born population below 30% of the total population.
FIGURE 6: 2006 YORK REGION IMMIGRATION POPULATIONS
Source: The Regional Municipality of York Community and Health Services Department, Just the Facts About Your Community, 2008

7 Millier Dickinson Blais: King Township Economic Development Strategy – Final Report -Appendices
1.1.4 Educational Attainment
Educational attainment is one of the most important socio-economic indicators to consider in evaluating a community's
labour market growth potential, as it speaks directly to its ability to staff new and existing local businesses. This has taken
on increasing importance in recent years, in a knowledge-based economy, where an increasing share of work depends on
the skills and creativity found in the workforce. While a goods-producing economy and a knowledge-based economy are
not exclusive categories, what is clear is that a post-secondary education is an increasing requirement in the workforce.
The level of educational attainment in King Township is equivalent to the Province of Ontario (Figure 7). However, among
the benchmark municipalities, both Richmond Hill and Aurora have higher levels of educational attainment. Nearly six out
ten people over the age of 15 in King Township have completed some level of post-secondary education. This is a
positive indicator for King with proviso that it is predominately a bedroom community. People have been attracted to King
due to its high quality of life and access to employment centres throughout the GTA, not for employment opportunities
found in King Township.
FIGURE 7: POST-SECONDARY EDUCATIONAL ATTAINMENT
Statistics Canada. 2013. King, TP, Ontario (Code 3519049) (table). National Household Survey (NHS) Profile. 2011 National Household Survey. Statistics Canada Catalogue no. 99-004-XWE. Ottawa. Released September 11, 2013.
64.6%
61.8% 60.2%
58.6%
54.7% 54.6% 54.6%
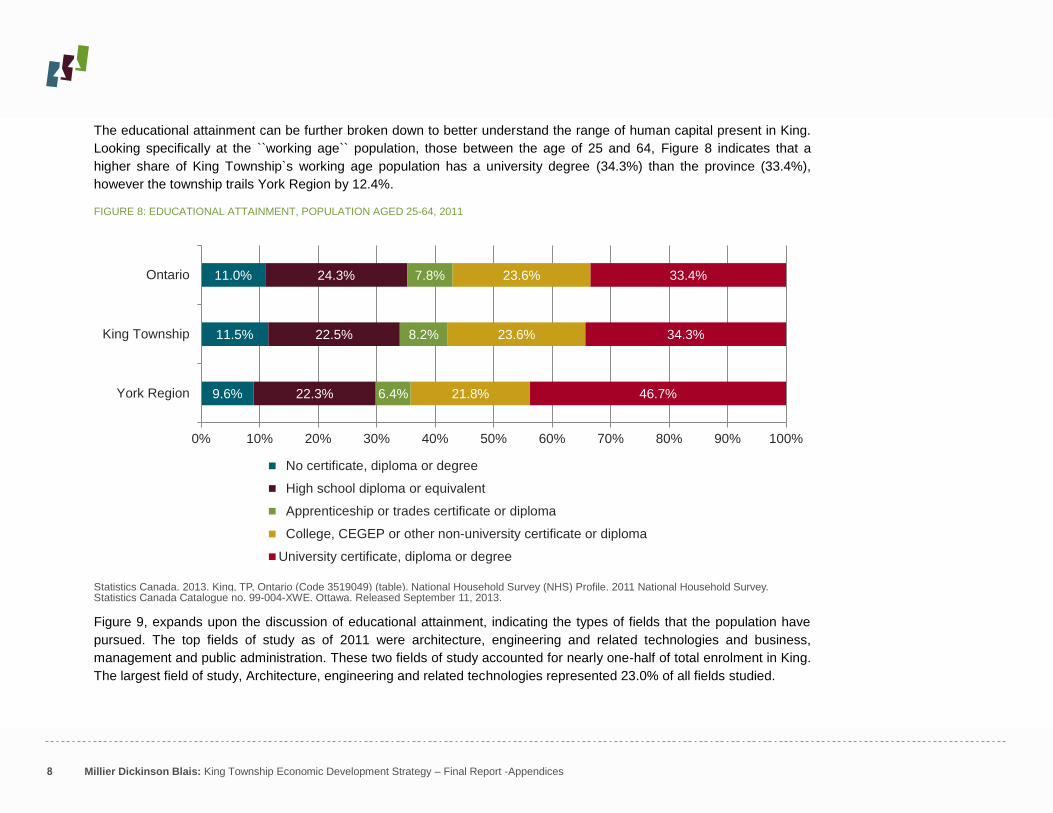
8 Millier Dickinson Blais: King Township Economic Development Strategy – Final Report -Appendices
The educational attainment can be further broken down to better understand the range of human capital present in King.
Looking specifically at the ``working age`` population, those between the age of 25 and 64, Figure 8 indicates that a
higher share of King Township`s working age population has a university degree (34.3%) than the province (33.4%),
however the township trails York Region by 12.4%.
FIGURE 8: EDUCATIONAL ATTAINMENT, POPULATION AGED 25-64, 2011
Statistics Canada. 2013. King, TP, Ontario (Code 3519049) (table). National Household Survey (NHS) Profile. 2011 National Household Survey. Statistics Canada Catalogue no. 99-004-XWE. Ottawa. Released September 11, 2013.
Figure 9, expands upon the discussion of educational attainment, indicating the types of fields that the population have
pursued. The top fields of study as of 2011 were architecture, engineering and related technologies and business,
management and public administration. These two fields of study accounted for nearly one-half of total enrolment in King.
The largest field of study, Architecture, engineering and related technologies represented 23.0% of all fields studied.
9.6%
11.5%
11.0%
22.3%
22.5%
24.3%
6.4%
8.2%
7.8%
21.8%
23.6%
23.6%
46.7%
34.3%
33.4%
0% 10% 20% 30% 40% 50% 60% 70% 80% 90% 100%
York Region
King Township
Ontario
No certificate, diploma or degree
High school diploma or equivalent
Apprenticeship or trades certificate or diploma
College, CEGEP or other non-university certificate or diploma
University certificate, diploma or degree

9 Millier Dickinson Blais: King Township Economic Development Strategy – Final Report -Appendices
FIGURE 9: EDUCATIONAL PROFILE BY MAJOR FIELD OF STUDY, 2011
Statistics Canada. 2013. King, TP, Ontario (Code 3519049) (table). National Household Survey (NHS) Profile. 2011 National Household Survey. Statistics Canada Catalogue no. 99-004-XWE. Ottawa. Released September 11, 2013.
1.2 Labour Force and Employment Characteristics
The following section focuses on King Township‟s overall economic positions and prospects for growth and sustainability.
The analysis looks at King Township‟s labour force and employment (i.e. jobs) composition and growth by industry and
occupation, as well as the place of work of the labour force. In addition, Canadian Business Patterns data is utilized to
look at the business activity in King Township by industry and size of establishment.
1.2.1 Labour Force and Employment Characteristics
Industry and occupational activity in King Township will play an important role in determining its future economic
prosperity. While industry and occupational data are similar they in fact tell two very different stories about economic
activity in King Township. More traditional economic analysis and theory has typically focused on industrial activity – what
is being produced. As the economy in North America has shifted away from manufacturing towards knowledge and
0.0%
2.0%
3.3%
3.5%
5.0%
5.6%
6.0%
8.0%
11.5%
12.2%
19.8%
23.0%
Other fields of study
Agriculture, natural resources and conservation
Physical and life sciences and technologies
Mathematics, computer and information sciences
Visual and performing arts, and communications…
Personal, protective and transportation services
Humanities
Education
Social and behavioural sciences and law
Health and related fields
Business, management and public administration
Architecture, engineering, and related technologies

10 Millier Dickinson Blais: King Township Economic Development Strategy – Final Report -Appendices
services based activities the question of how things are being made has become more important. Using occupational data
is one way of understanding regional differences and local advantages.
1.2.1.1 Labour Force by Industry
Error! Reference source not found., shows that between 2006 and 2011, the total labour force in King decreased from
1,360 to 10,945, a net decrease of 415 people. The goods-producing7 sector represented 30.24% of King`s labour force
and the service-producing sector8 accounted for the remaining 69.67%. The service sector of the economy was projected
to decrease by 5.34% due to major declines in professional, scientific and technical services, accommodation and food
services and finance and insurance. Although there was an overall decline, there was strong growth in the retail trade and
educational services sectors. The goods-producing sector, despite the decline employment led by weakness in
manufacturing, was still projected to increase by 0.3%.
As seen in Error! Reference source not found., the areas of greatest concentration for the Township`s labour force
sing the 2011 National Household Survey was:
Construction – 1,620 people or 14.8% of the labour force;
Retail trade – 1,175 or 10.7% of the labour force
Professional, scientific and technical services – 1,015 people or 9.3% of the labour force;
Manufacturing – 990 or 9.0% of the labour force; and
Educational services – 835 or 7.6% of the labour force.
FIGURE 10: LABOUR FORCE BY INDUSTRY, 2006, 2011
Industry 2006
% Share of Total
Labour Force
2011
% Share of Total
Labour Force
Absolute Change in
Labour Force
All Industries 11,360 100.0% 10,945 100.00% -415
Agriculture, forestry, fishing and hunting 505 4.4% 650 5.94% 145
7 Goods producing Sector include the following industries: Agriculture; Forestry, Fishing, Mining, Quarrying, oil and gas; Utilities, Construction and Manufacturing
8 Service-producing Sector includes the following industries: Wholesale trade; Retail trade; Transportation and warehousing; Information and cultural industries; Finance and insurance;
Real estate and rental and leasing; Professional, scientific and technical services; Management of companies and enterprises; Administrative and support, waste management and
remediation services; Educational services; Health care and social assistance; Arts, entertainment and recreation; Accommodation and food service; Other services (except public
administration); Public administration.

11 Millier Dickinson Blais: King Township Economic Development Strategy – Final Report -Appendices
Industry 2006
% Share of Total
Labour Force
2011
% Share of Total
Labour Force
Absolute Change in
Labour Force
All Industries 11,360 100.0% 10,945 100.00% -415
Mining and oil and gas extraction 25 0.2% 0 0.00% -25
Utilities 45 0.4% 50 0.46% 5
Construction 1,355 11.9% 1,620 14.80% 265
Manufacturing 1,370 12.1% 990 9.05% -380
Wholesale trade 680 6.0% 690 6.30% 10
Retail trade 950 8.4% 1,175 10.74% 225
Transportation and warehousing 485 4.3% 415 3.79% -70
Information and cultural industries 205 1.8% 170 1.55% -35
Finance and insurance 485 4.3% 380 3.47% -105
Real estate and rental and leasing 370 3.3% 285 2.60% -85
Professional, scientific and technical services 1,195 10.5% 1,015 9.27% -180
Management of companies and enterprises 80 0.7% 30 0.27% -50
Administrative and support, waste management and remediation services 545 4.8% 540 4.93% -5
Educational services 700 6.2% 835 7.63% 135
Health care and social assistance 750 6.6% 665 6.08% -85
Arts, entertainment and recreation 360 3.2% 310 2.83% -50
Accommodation and food services 405 3.6% 265 2.42% -140
Other services (except public administration) 500 4.4% 465 4.8% 107
Public administration 345 3.0% 385 3.3% 65
Source: Statistics Canada. 2013. King, TP, Ontario (Code 3519049) (table). National Household Survey (NHS) Profile. 2011 National Household Survey. Statistics Canada Catalogue no. 99-004-XWE. Ottawa. Released September 11, 2013
The above numbers for the labour force could be perceived as misleading, since they do not accurately show the
economic activity occurring within King Township`s boundaries. Part of a regional labour force, King Township
experiences a net outflow of people on a daily basis. According to the 2006 Census, while, 70.0% of the employed labour
force worked at a usual place, the majority of those workplaces were located outside of King Township.

12 Millier Dickinson Blais: King Township Economic Development Strategy – Final Report -Appendices
FIGURE 10: PLACE OF WORK STATUS OF KING TOWNSHIP LABOUR FORCE, 2011
Source: Statistics Canada. 2013. King, TP, Ontario (Code 3519049) (table). National Household Survey (NHS) Profile. 2011 National Household Survey. Statistics Canada Catalogue no. 99-004-XWE. Ottawa. Released September 11, 2013.
Figure 11, displays both the number of jobs and the labour force of King Township. As of 2012, there were an estimated
5,400 jobs in King Township. At the industry level, King Township exported labour in all industries except Mining,
quarrying, and oil and gas extraction (+15), Management of companies and enterprises (+99), Educational services
(+215), Arts, entertainment and recreation (+12), and Accommodation and food services (36). These gains suggest that
King Township may have some level of specialization in these specific industries.
FIGURE 11: LABOUR FLOW ANALYSIS, LABOUR FORCE 15 YEARS OF AGE AND OVER BY INDUSTRY, 2012
Industry Jobs Labour Force Net exp(-)/imp(+) of
labour
All industries 5,406 10,945 -5,539
Agriculture, forestry, fishing and hunting 197 650 -453
Mining, quarrying, and oil and gas extraction 15 0 15
Worked at home, 13.9%
Worked outside Canada, 0.8%
No fixed workplace
address, 15.3%
Worked at usual place, 70.0%

13 Millier Dickinson Blais: King Township Economic Development Strategy – Final Report -Appendices
Industry Jobs Labour Force Net exp(-)/imp(+) of
labour
All industries 5,406 10,945 -5,539
Utilities 13 50 -37
Construction 640 1,620 -980
Manufacturing 582 990 -408
Wholesale trade 145 690 -545
Retail trade 524 1,175 -651
Transportation and warehousing 185 415 -230
Information and cultural industries 74 170 -96
Finance and insurance 116 380 -264
Real estate and rental and leasing 136 285 -149
Professional, scientific and technical services 222 1,015 -793
Management of companies and enterprises 129 30 99
Administrative and support, waste management and remediation services 303 540 -237
Educational services 1050 835 215
Health care and social assistance 194 665 -471
Arts, entertainment and recreation 322 310 12
Accommodation and food services 301 265 36
Other services (except public administration) 205 465 -260
Public administration 53 385 -332
Source: Derived from Statistics Canada (Census of Population, 2012) by Millier Dickinson Blais, Inc.
Another source of information that can be drawn on to understand local job activity in King Township is the annual York
Region Employment Survey. While not perfectly compatible with the Statistics Canada data shown above, due to its
exclusion of agriculture and home based activity, the Survey does still indicate the health of the local economy. The
employment survey shows that between 2002 and 2012 the number of jobs in King grew at an average annual rate of
4.2% per year, increasing from 4,154 jobs to 6,284 jobs (YRES 2012). The increase in jobs can be further broken down
by type of employment. During the same period, full-time employment increased by 1,183 jobs, part-time by 445 jobs and
seasonal employment increased by 502 jobs. In 2012, full-time employment represented 59% of all employment in King

14 Millier Dickinson Blais: King Township Economic Development Strategy – Final Report -Appendices
with part-time and seasonal work accounting for the remain 40% of employment It should be noted the numbers reported
by the Employment Survey exclude farm and home based employment in King.
FIGURE 12: EMPLOYMENT BY TYPE OF WORKER, 2012
Notes: Figure represents employment at businesses surveyed. Farm and home-based employment excluded.
Source: York Region Long Range Planning, Office of the CAO, 2012
To understand the composition of jobs in King Township the best data source is till the 2006 Census as it is inclusive of all
parts of the economy. Figure 14 shows that jobs in King Township are concentrated in the following industries:
Educational Services – 1050 people or 19.4% of employed labour force,
Construction – 640 people or 11.8% of employed labour force,
Manufacturing – 582 people or 10.8% of employed labour force, and
Retail Trade – 524 people or 9.7% of employed labour force
Full Time 59%
Part-Time 21%
Seasonal 20%

15 Millier Dickinson Blais: King Township Economic Development Strategy – Final Report -Appendices
FIGURE 13: EMPLOYED LABOUR FORCE BY INDUSTRY, 2012
Industry Employed Labour Force
(>15 years of age) % of Employed Labour Force
All industries 5,406
Agriculture, forestry, fishing and hunting 197 3.6%
Mining, quarrying, and oil and gas extraction 15 0.3%
Utilities 13 0.2%
Construction 640 11.8%
Manufacturing 582 10.8%
Wholesale trade 145 2.7%
Retail trade 524 9.7%
Transportation and warehousing 185 3.4%
Information and cultural industries 74 1.4%
Finance and insurance 116 2.1%
Real estate and rental and leasing 136 2.5%
Professional, scientific and technical services 222 4.1%
Management of companies and enterprises 129 2.4%
Administrative and support, waste management and remediation services 303 5.6%
Educational services 1050 19.4%
Health care and social assistance 194 3.6%
Arts, entertainment and recreation 322 6.0%
Accommodation and food services 301 5.6%
Other services (except public administration) 205 3.8%
Public administration 53 1.0%
Source: 2006 Census of Canada, Statistics Canada, Industry - North American Industry Classification System 2002 (21), Occupation - National Occupational Classification for Statistics 2006 (11), Work Activity in 2005 (4) and Sex (3) for the Employed Labour Force 15 Years and Over Having a Usual Place of Work

16 Millier Dickinson Blais: King Township Economic Development Strategy – Final Report -Appendices
1.2.1.2 Labour Force by Occupation
By looking at the occupations in which the labour force works, a better understanding can be gained of the actual work
that people do and the skills that they employ in their jobs.
Figure 14 shows the occupational composition of the labour force for King Township for the years 2001, 2006 and 2011.
The occupational categories employing the largest shares of King Township‟s labour force (as of 2011) were:
Management occupations – 2,070 people or 18.9% of the labour force
Business, finance and administrative occupations – 1,970 people or 18.0% of the labour force
Trades, transport and equipment operators – 1,865 or 17.0% of the labour force
Sales and service occupations – 1,615 or 14.8% of the labour force
FIGURE 14: LABOUR FORCE BY OCCUPATION, KING TOWNSHIP, 2001, 2006, 2011
Occupations
2001 2006 2011
Number
% of Total
Labour Force
Number
% of Total
Labour Force
Number
% of Total
Labour Force
All Occupations 10,585 100.0% 11,360 100.0% 10,945 100.0%
Management occupations 1,900 17.9% 2,115 18.6% 2,070 18.9%
Business, finance and administrative occupations 1,890 17.9% 2,255 19.9% 1,970 18.0%
Natural and applied sciences and related occupations 680 6.4% 655 5.8% 695 6.4%
Health occupations 405 3.8% 480 4.2% 460 4.2%
Occupations in social science, education, government service and religion 840 7.9% 780 6.9% 1,175 10.7%
Occupations in art, culture, recreation and sport 440 4.2% 420 3.7% 395 3.6%
Sales and service occupations 1,940 18.3% 2,105 18.5% 1,615 14.8%
Trades, transport and equipment operators and related occupations 1,490 14.1% 1,535 13.5% 1,865 17.0%
Occupations unique to primary industry 635 6.0% 755 6.6% 500 4.6%
Occupations unique to processing, manufacturing and utilities 375 3.5% 250 2.2% 200 1.8%
Source: Adapted from Statistics Canada (Census of Population, 2001 & 2006) Statistics Canada. 2013. King, TP, Ontario (Code 3519049) (table). National Household Survey (NHS) Profile. 2011 National Household Survey. Statistics Canada Catalogue no. 99-004-XWE. Ottawa. Released September 11, 2013.
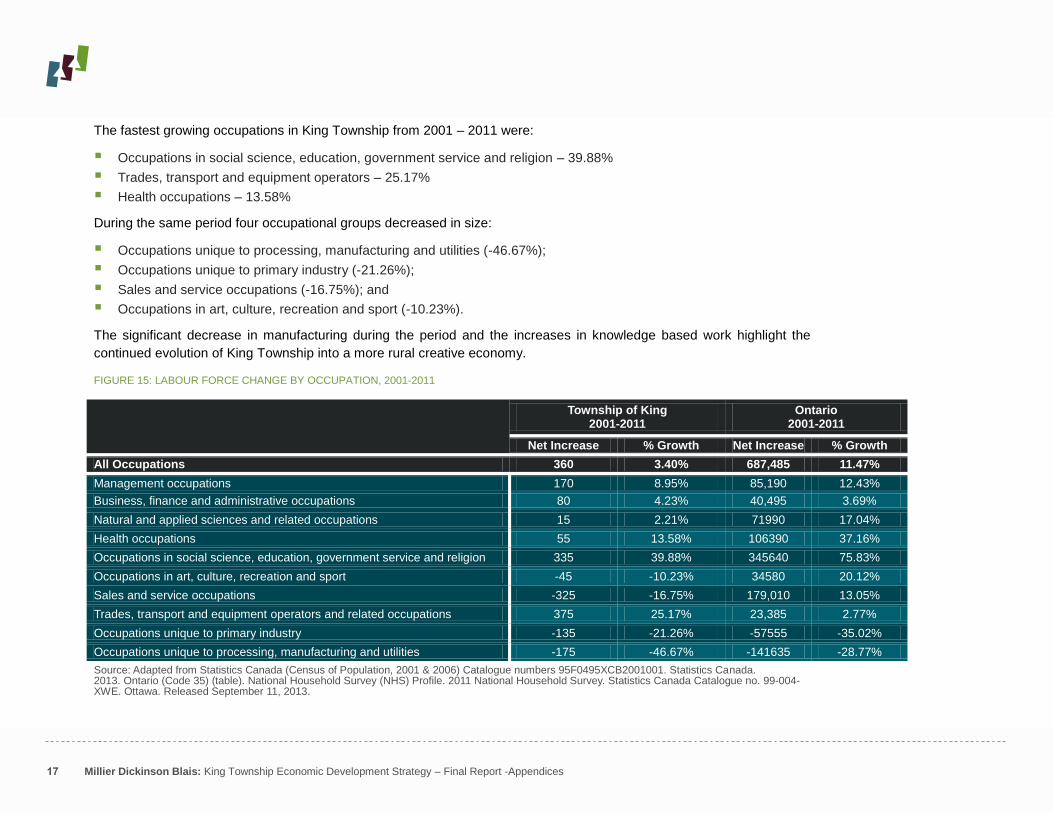
17 Millier Dickinson Blais: King Township Economic Development Strategy – Final Report -Appendices
The fastest growing occupations in King Township from 2001 – 2011 were:
Occupations in social science, education, government service and religion – 39.88%
Trades, transport and equipment operators – 25.17%
Health occupations – 13.58%
During the same period four occupational groups decreased in size:
Occupations unique to processing, manufacturing and utilities (-46.67%);
Occupations unique to primary industry (-21.26%);
Sales and service occupations (-16.75%); and
Occupations in art, culture, recreation and sport (-10.23%).
The significant decrease in manufacturing during the period and the increases in knowledge based work highlight the
continued evolution of King Township into a more rural creative economy.
FIGURE 15: LABOUR FORCE CHANGE BY OCCUPATION, 2001-2011
Township of King 2001-2011
Ontario 2001-2011
Net Increase % Growth Net Increase % Growth
All Occupations 360 3.40% 687,485 11.47%
Management occupations 170 8.95% 85,190 12.43%
Business, finance and administrative occupations 80 4.23% 40,495 3.69%
Natural and applied sciences and related occupations 15 2.21% 71990 17.04%
Health occupations 55 13.58% 106390 37.16%
Occupations in social science, education, government service and religion 335 39.88% 345640 75.83%
Occupations in art, culture, recreation and sport -45 -10.23% 34580 20.12%
Sales and service occupations -325 -16.75% 179,010 13.05%
Trades, transport and equipment operators and related occupations 375 25.17% 23,385 2.77%
Occupations unique to primary industry -135 -21.26% -57555 -35.02%
Occupations unique to processing, manufacturing and utilities -175 -46.67% -141635 -28.77%
Source: Adapted from Statistics Canada (Census of Population, 2001 & 2006) Catalogue numbers 95F0495XCB2001001. Statistics Canada. 2013. Ontario (Code 35) (table). National Household Survey (NHS) Profile. 2011 National Household Survey. Statistics Canada Catalogue no. 99-004-XWE. Ottawa. Released September 11, 2013.

18 Millier Dickinson Blais: King Township Economic Development Strategy – Final Report -Appendices
1.2.1.3 Creative Occupations
There is growing recognition across Canada, and particularly in rural parts of Ontario, of the importance of creativity,
culture and quality of place in growing local economies. Many communities are now recognizing that enhancing quality of
place and creating attractive amenities can draw talented people, which in turn attract business investment, as well as
draw visitors and investment to the community in the form of tourism.
It is within this broader policy context that broader definitions of the creative economy have emerged to suggest that
creative and knowledge-based work underlies all sectors of the economy. Creativity can be applied to the introduction of
new processes, the creation of new products, and the design of systems in fields from construction to craft-making. In this
sense, the creative economy is defined by the skills and ideas that people employ, and is typically measured using
occupational data. Creative industries and occupations encompass a wide range of knowledge-based jobs in which
innovation and creativity drives value creation. These industries and occupations encompass sectors such as science and
medicine, financial services, engineering, among others.
In a model of economic development premised on culture and creativity, it is important to understand how notions of the
creative economy are measured and defined. People take centre stage in this model – what they know, what they do, and
where they work. Understanding these characteristics can help communities position themselves and differentiate on the
basis of their unique local assets and economic structure.
Creative occupations can exist throughout a range of industries; consider an industrial designer on the shop floor of an
automotive plant, or an architect on the work site of a new project. However, the creative economy can also be
understood in a more traditional fashion – that is, by the industries that are fundamentally driven by ongoing innovation,
adaptation, and the generation of intellectual property.
Creative class– workers are expected to apply specialized knowledge and thinking skills to dynamic situations and
make decisions. People working in creative class jobs are usually able to identify patterns and utilize self-educating
techniques that lead to improved performance. Creative jobs include lawyers, doctors, artists and bankers.
Service Class – workers are expected to carry out repetitive service tasks in a pre-defined order. Service class
occupations include food service workers, janitors, secretaries and clerks.
Working Class – depend on the physical skills of workers who are typically asked to do repetitive tasks. Examples of
working class occupations include mechanics, crane operators, assembly line workers and pipe-fitters.
Farming, Fishing and Forestry – workers are paid to remove natural resources from the earth. These jobs include
farmers, oil and gas well drillers, and mine labourers.
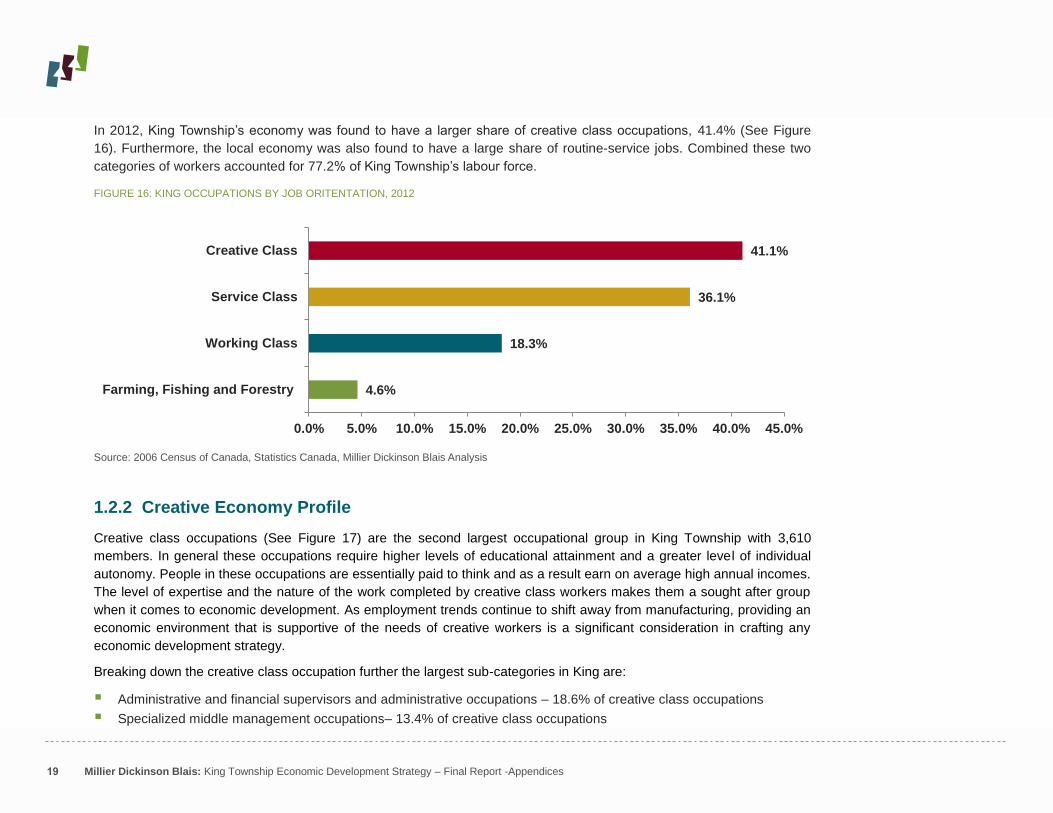
19 Millier Dickinson Blais: King Township Economic Development Strategy – Final Report -Appendices
In 2012, King Township‟s economy was found to have a larger share of creative class occupations, 41.4% (See Figure
16). Furthermore, the local economy was also found to have a large share of routine-service jobs. Combined these two
categories of workers accounted for 77.2% of King Township‟s labour force.
FIGURE 16: KING OCCUPATIONS BY JOB ORITENTATION, 2012
Source: 2006 Census of Canada, Statistics Canada, Millier Dickinson Blais Analysis
1.2.2 Creative Economy Profile
Creative class occupations (See Figure 17) are the second largest occupational group in King Township with 3,610
members. In general these occupations require higher levels of educational attainment and a greater level of individual
autonomy. People in these occupations are essentially paid to think and as a result earn on average high annual incomes.
The level of expertise and the nature of the work completed by creative class workers makes them a sought after group
when it comes to economic development. As employment trends continue to shift away from manufacturing, providing an
economic environment that is supportive of the needs of creative workers is a significant consideration in crafting any
economic development strategy.
Breaking down the creative class occupation further the largest sub-categories in King are:
Administrative and financial supervisors and administrative occupations – 18.6% of creative class occupations
Specialized middle management occupations– 13.4% of creative class occupations
4.6%
18.3%
36.1%
41.1%
0.0% 5.0% 10.0% 15.0% 20.0% 25.0% 30.0% 35.0% 40.0% 45.0%
Farming, Fishing and Forestry
Working Class
Service Class
Creative Class

20 Millier Dickinson Blais: King Township Economic Development Strategy – Final Report -Appendices
Professional occupations in education services – 12.1% of creative class occupations.
FIGURE 17: CREATIVE CLASS OCCUPATIONS, 2012
Occupation Total % Share
Total Creative Class Occupations 4250
00 Senior management occupations 385 9.1%
01-05 Specialized middle management occupations 570 13.4%
11 Professional occupations in business and finance 340 8.0%
12 Administrative and financial supervisors and administrative occupations 790 18.6%
21 Professional occupations in natural and applied sciences 430 10.1%
22 Technical occupations related to natural and applied sciences 245 5.8%
30 Professional occupations in nursing 80 1.9%
31 Professional occupations in health (except nursing) 200 4.7%
32 Technical occupations in health 115 2.7%
40 Professional occupations in education services 515 12.1%
41 Professional occupations in law and social, community and government services 235 5.5%
51 Professional occupations in art and culture 50 1.2%
52 Technical occupations in art, culture, recreation and sport 295 6.9%
Source: 2012 Census of Canada, Statistics Canada, Millier Dickinson Blais Analysis
The concentrations have an impact on other areas of King Township‟s economy. The discussion of business enterprises
and industry based activity found that King‟s economy had strengths in Professional, scientific and technical services,
Health Care and social assistance and Educational Services. All three of these industries employ a high percentage of
creative workers. For instance 76.5% of all workers in Professional, scientific and technical services are classified as
being in creative-oriented occupations.
Service class occupations differ from the creative occupations in that workers in these jobs generally have less workplace
autonomy and receive lower pay. Due to the type of works undertaken by the service class, they tend to be concentrated
in specific industries such as retail trade, hospitality and tourism and real estate and rental and leasing. In King Township,
the service class accounts for 36.1% of the total labour force and are concentrated in three industries retail trade,
manufacturing and construction.
The top three service occupations in King as of 2012 are:
Middle management occupations in trades, transportation, production and utilities – 17.1% of service class
occupations

21 Millier Dickinson Blais: King Township Economic Development Strategy – Final Report -Appendices
Sales representatives and salespersons - wholesale and retail trade – 15.3% of service class occupations
Office support occupations – 12.6% of service class occupations.
FIGURE 18: SERVICE CLASS OCCUPATIONS, 2012
Occupation Total % Share
Total Service Class Occupations 3735
06 Middle management occupations in retail and wholesale trade and customer services 405 10.8%
07-09 Middle management occupations in trades, transportation, production and utilities 640 17.1%
13 Finance, insurance and related business administrative occupations 150 4.0%
14 Office support occupations 470 12.6%
15 Distribution, tracking and scheduling co-ordination occupations 135 3.6%
34 Assisting occupations in support of health services 55 1.5%
42 Paraprofessional occupations in legal, social, community and education services 90 2.4%
43 Occupations in front-line public protection services 100 2.7%
44 Care providers and educational, legal and public protection support occupations 180 4.8%
62 Retail sales supervisors and specialized sales occupations 225 6.0%
63 Service supervisors and specialized service occupations 95 2.5%
64 Sales representatives and salespersons - wholesale and retail trade 570 15.3%
65 Service representatives and other customer and personal services occupations 200 5.4%
66 Sales support occupations 235 6.3%
67 Service support and other service occupations, n.e.c. 185 5.0%
Source: 2012 Census of Canada, Statistics Canada, Millier Dickinson Blais Analysis
The working class occupations are most closely associated with manufacturing but also include skilled trade and
construction workers. In the past, these workers were the major driving force of local, provincial and national prosperity.
Today the jobs of these workers are often under threat as many firms look to shift lower value-added activities overseas to
lower cost regions. As this trend has unfolded, the jobs that have tended to remain locally have been higher skilled job
functions.
In King Township the top three working class occupations as of 2012 were:
Industrial, electrical and construction trades – 37.6% of working class occupations
Maintenance and equipment operation trades – 24.3% of working class occupations
Transport and heavy equipment operation and related maintenance occupations – 18% of working class occupations

22 Millier Dickinson Blais: King Township Economic Development Strategy – Final Report -Appendices
FIGURE 19: WORKING CLASS OCCUPATIONS, 2012
Occupation Total % Share
Total Working Class Occupations 1890
72 Industrial, electrical and construction trades 710 37.6%
73 Maintenance and equipment operation trades 460 24.3%
74 Other installers, repairers and servicers and material handlers 145 7.7%
75 Transport and heavy equipment operation and related maintenance occupations 340 18.0%
76 Trades helpers, construction labourers and related occupations 105 5.6%
92 Processing, manufacturing and utilities supervisors and central control operators 10 0.5%
94 Processing and manufacturing machine operators and related production workers 30 1.6%
95 Assemblers in manufacturing 40 2.1%
96 Labourers in processing, manufacturing and utilities 50 2.6%
Source: 2012 Census of Canada, Statistics Canada, Millier Dickinson Blais Analysis
The final occupational group is Farming, Fishing and Forestry (FFF) occupations. As a rural community, agriculture
remains a major component of King‟s economy. However, based on the 2012 census, there are only 475 people
employed in routine-resource based jobs, which is less than 5% of the labour force. For the most part, the working class
are employed in the agriculture, forestry, fishing and hunting sector of King Township‟s economy, however, nearly one
quarter of FFF jobs are in other sectors of the economy such as wholesale trade, administrative and support, waste
management and arts, entertainment and recreation.
FIGURE 20: ROUTINE-RESOURCE OCCUPATIONS, 2012
Occupation Total % Share
Total Working Class Occupations 475
82 Supervisors and technical occupations in natural resources, agriculture and related production 70 14.7%
84 Workers in natural resources, agriculture and related production 240 50.5%
86 Harvesting, landscaping and natural resources labourers 165 34.7%
Source: 2012 Census of Canada, Statistics Canada, Millier Dickinson Blais Analysis

23 Millier Dickinson Blais: King Township Economic Development Strategy – Final Report -Appendices
1.2.3 Industry Sector Analysis
1.2.3.1 Location Quotients
In order to determine the level and degree of business and industrial specialization, thus the economic diversity that may
be developing in King Township, location quotients (LQs) have been calculated to identify and measure the concentration
of industry/business activity by major sector and/or sub-sectors.
LQs are a commonly used tool in local/regional economic analysis. They assess the concentration of economic activities
within a smaller area relative to the overarching region in which it resides. For the purposes of this study LQs have been
calculated to compare the concentration of the labour force and businesses relative to the Province of Ontario.
A LQ greater than 1.0 for a given sector indicates a local concentration of economic activity as compared to the
overarching region (either Ontario or any other region) and may be an indication of competitive advantage with respect to
the attraction of that industry sector. An LQ equal to 1.0 for a given sector suggests that the study area has the same
concentration of economic activity as the overarching region. Finally, an LQ of less than 1.0 suggests that the community
does not have a strong competitive advantage in that sector.
In theory, an industrial or business concentration that is greater than the overarching regional average may also represent
the export base of the participating municipality (both in terms of products or services). Businesses that make up this
export base may have chosen to locate in the community due to certain local or regional competitive advantages. These
competitive advantages can be used to attract additional investment, in the same or complementary industries.
Based on this form of analysis the industry concentrations in King Township relative to Ontario reveals the highest labour
force location quotients in the following sectors in 2011 (See Error! Reference source not found.):
Management of companies and enterprises - 47.81 LQ
Arts, entertainment and recreation - 2.70 LQ
Educational services – 2.53 LQ
Agriculture, forestry, fishing and hunting – 2.23 LQ
Construction – 1.91 LQ
The LQs indicate comparatively high local employment concentration and perhaps competitive advantage in these
industries. With the exception of construction and agriculture, forestry, fishing and hunting, the other three industries with
high LQs are associated with more knowledge based work. Eight industries in King Township were found to have low
LQs. The four lowest LQs in 2011 were in the following sectors:
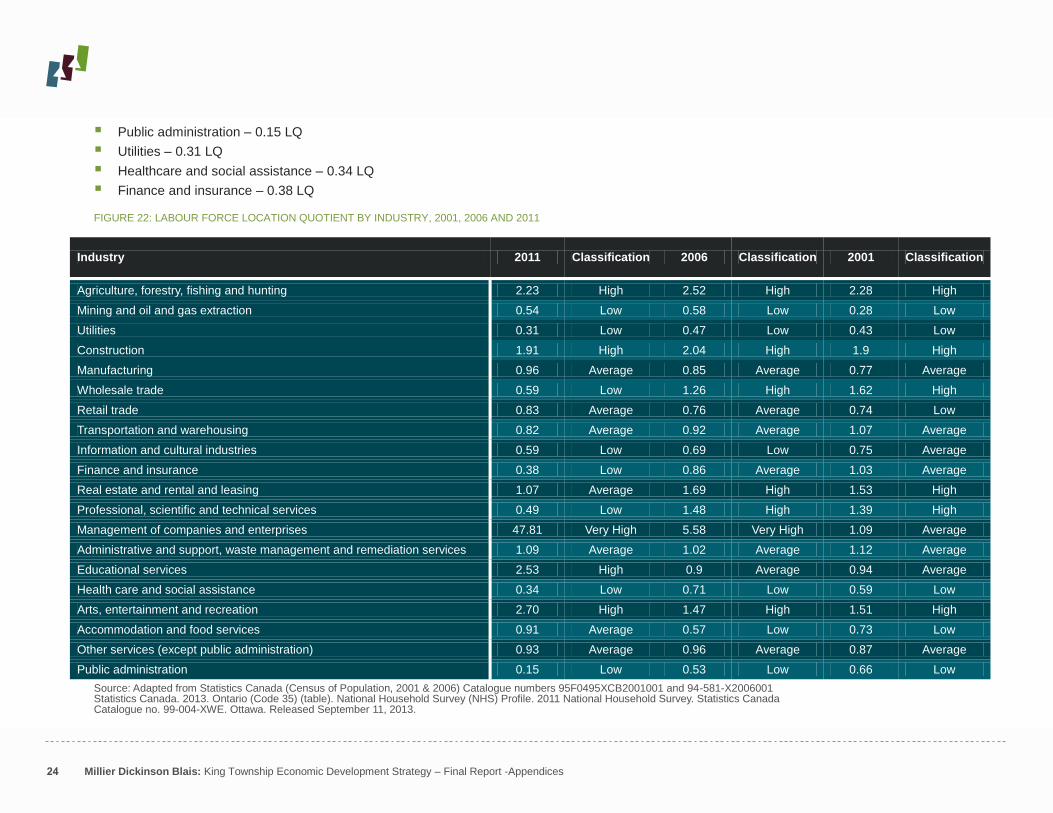
24 Millier Dickinson Blais: King Township Economic Development Strategy – Final Report -Appendices
Public administration – 0.15 LQ
Utilities – 0.31 LQ
Healthcare and social assistance – 0.34 LQ
Finance and insurance – 0.38 LQ
FIGURE 22: LABOUR FORCE LOCATION QUOTIENT BY INDUSTRY, 2001, 2006 AND 2011
Industry 2011 Classification 2006 Classification 2001 Classification
Agriculture, forestry, fishing and hunting 2.23 High 2.52 High 2.28 High
Mining and oil and gas extraction 0.54 Low 0.58 Low 0.28 Low
Utilities 0.31 Low 0.47 Low 0.43 Low
Construction 1.91 High 2.04 High 1.9 High
Manufacturing 0.96 Average 0.85 Average 0.77 Average
Wholesale trade 0.59 Low 1.26 High 1.62 High
Retail trade 0.83 Average 0.76 Average 0.74 Low
Transportation and warehousing 0.82 Average 0.92 Average 1.07 Average
Information and cultural industries 0.59 Low 0.69 Low 0.75 Average
Finance and insurance 0.38 Low 0.86 Average 1.03 Average
Real estate and rental and leasing 1.07 Average 1.69 High 1.53 High
Professional, scientific and technical services 0.49 Low 1.48 High 1.39 High
Management of companies and enterprises 47.81 Very High 5.58 Very High 1.09 Average
Administrative and support, waste management and remediation services 1.09 Average 1.02 Average 1.12 Average
Educational services 2.53 High 0.9 Average 0.94 Average
Health care and social assistance 0.34 Low 0.71 Low 0.59 Low
Arts, entertainment and recreation 2.70 High 1.47 High 1.51 High
Accommodation and food services 0.91 Average 0.57 Low 0.73 Low
Other services (except public administration) 0.93 Average 0.96 Average 0.87 Average
Public administration 0.15 Low 0.53 Low 0.66 Low
Source: Adapted from Statistics Canada (Census of Population, 2001 & 2006) Catalogue numbers 95F0495XCB2001001 and 94-581-X2006001 Statistics Canada. 2013. Ontario (Code 35) (table). National Household Survey (NHS) Profile. 2011 National Household Survey. Statistics Canada Catalogue no. 99-004-XWE. Ottawa. Released September 11, 2013.

25 Millier Dickinson Blais: King Township Economic Development Strategy – Final Report -Appendices
1.2.3.2 Business Patterns Characteristics
The following descriptive statistics look at the types of business in King Township using Canadian Business Patterns
which reflects the number of business establishment by employment size ranges and industry. The data used throughout
this analysis represents the number of businesses in King as of June 2012 as defined by the Business Register Database
of Canada. The business data collected includes all businesses that meet at least one of the three criteria:
Have an employee workforce for which they submit payroll remittances to the CRA; or
Have a minimum of $30,000 in annual sales revenue; or
Are incorporated under a federal or provincial act and have filed a federal tax return.
The Canadian Business Patterns Data records business counts by “Total”, “Indeterminate” and “Subtotal” categories. The
establishments in the “Indeterminate” category include the self-employed (i.e. those who do not maintain an employee
payroll, but may have a workforce consisting of contracted workers, family members or business owners).
A review of the business patterns for 2004, 2009 and 2012 for King Township provides an understanding of the growth or
decline of businesses and helps focus in on key industries that define the local business community.
In June 2012, there were 2,646 businesses in King Township, as indicated in Figure 21. Since, 2004 the number of total
business in the Business Register Database has remained virtually unchanged. In fact the number of business in the
“Subtotal” category which includes only those businesses with employees increased, increased without interruption from
839 to 959 businesses. The largest concentrations of total business activity were in:
Construction (465 establishments) – 17.6%
Professional Scientific and technical services (374 establishments – 14.1%
Real estate and rental and leasing (295 establishments) – 11.1%
Finance and insurance (210 establishments) – 7.9%
Administrative and support, waste management and remediation services (169 establishments) - 6.4%
When the indeterminate sector businesses are removed, the sectors with the highest proportion of business are:
Construction (217 locations) – 22.6%
Professional scientific and technical services (117 establishments) – 12.2%
Other services (except public administration) (104 establishments) – 10.8%
Administrative and support, waste management and remediation services (78 establishments) – 8.1%
Retail trade (64 establishments) – 6.7%

26 Millier Dickinson Blais: King Township Economic Development Strategy – Final Report -Appendices
FIGURE 21: KING TOWNSHIP BUSINESS PATTERNS DATA, 2004, 2009, 2012
Industry (NAICS) 2004 2009 2012
Total Indeterminate Subtotal Total Indeterminate Subtotal Total Indeterminate Subtotal
All Industries 2,653 1,814 839 2,585 1,673 912 2,646 1,687 959
Agriculture, forestry, fishing and hunting 188 113 75 132 78 54 146 84 62
Mining and oil and gas extraction 4 3 1 4 2 2 5 2 3
Utilities 1 0 1 2 1 1 2 1 1
Construction 444 277 167 466 264 202 465 248 217
Manufacturing 113 73 40 94 58 36 92 45 47
Wholesale trade 133 94 39 104 55 49 96 54 42
Retail trade 166 105 61 127 73 54 145 81 64
Transportation and warehousing 92 61 31 81 52 29 74 47 27
Information and cultural industries 25 12 13 57 37 20 50 37 13
Finance and insurance 190 159 31 214 179 35 210 171 39
Real estate and rental and leasing 216 194 22 230 205 25 295 265 30
Professional, scientific and technical services 419 299 120 383 267 116 374 257 117
Management of companies and enterprises 188 165 23 199 178 21 184 170 14
Administrative and support, waste management and remediation services
160 96 64 160 91 69 169 91 78
Educational services 28 20 8 30 23 7 27 18 9
Health care and social assistance 44 12 32 41 10 31 61 17 44
Arts, entertainment and recreation 66 41 25 55 31 24 44 24 20
Accommodation and food services 58 27 31 48 19 29 50 23 27
Other services (except public administration) 117 63 54 157 50 107 156 52 104
Public administration 1 0 1 1 0 1 1 - 1
Source: Canadian Business Patterns, Statistics Canada, 2004, 2009 and 2012
An important consideration in understanding King Township`s economic base is to examine the size of businesses by
employment size (Figure 22). King Township`s business base is overwhelmingly oriented towards small and medium
sized businesses with 626 business having between 1-4 employees and 145 business having between 5-9 employees. In
King Township there are 17 businesses with over 100 employees and only 15 with 50-99 employees. These findings
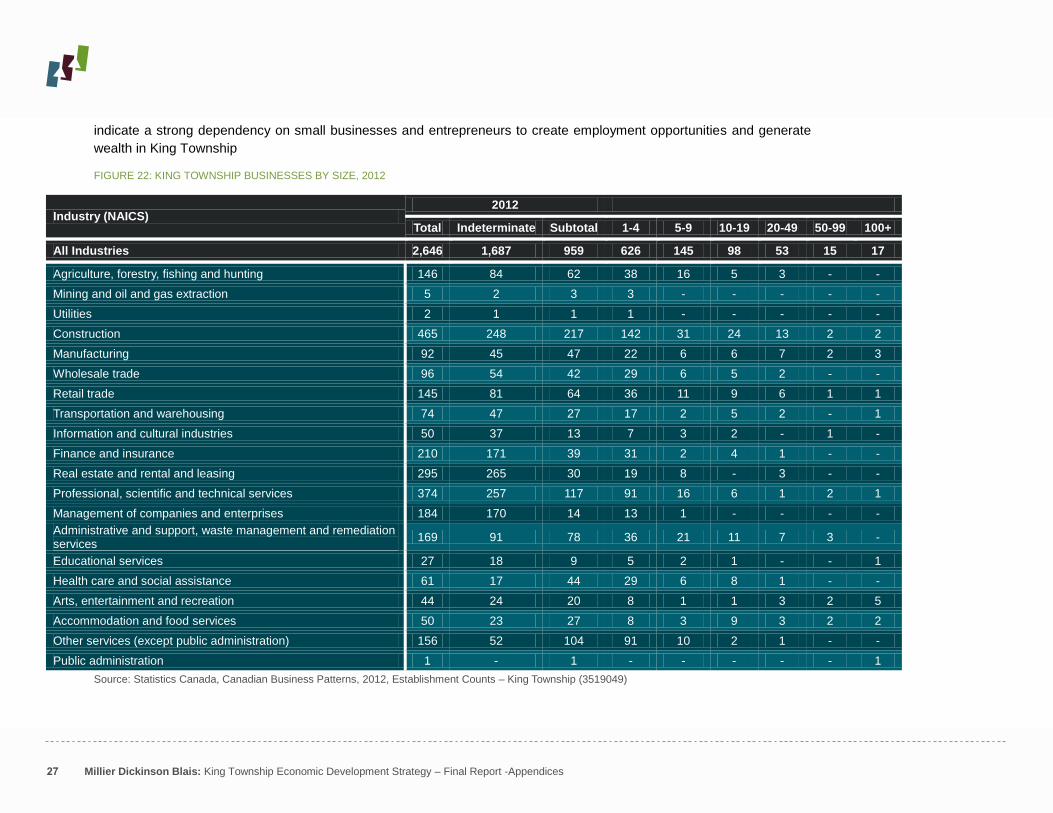
27 Millier Dickinson Blais: King Township Economic Development Strategy – Final Report -Appendices
indicate a strong dependency on small businesses and entrepreneurs to create employment opportunities and generate
wealth in King Township
FIGURE 22: KING TOWNSHIP BUSINESSES BY SIZE, 2012
Industry (NAICS) 2012
Total Indeterminate Subtotal 1-4 5-9 10-19 20-49 50-99 100+
All Industries 2,646 1,687 959 626 145 98 53 15 17
Agriculture, forestry, fishing and hunting 146 84 62 38 16 5 3 - -
Mining and oil and gas extraction 5 2 3 3 - - - - -
Utilities 2 1 1 1 - - - - -
Construction 465 248 217 142 31 24 13 2 2
Manufacturing 92 45 47 22 6 6 7 2 3
Wholesale trade 96 54 42 29 6 5 2 - -
Retail trade 145 81 64 36 11 9 6 1 1
Transportation and warehousing 74 47 27 17 2 5 2 - 1
Information and cultural industries 50 37 13 7 3 2 - 1 -
Finance and insurance 210 171 39 31 2 4 1 - -
Real estate and rental and leasing 295 265 30 19 8 - 3 - -
Professional, scientific and technical services 374 257 117 91 16 6 1 2 1
Management of companies and enterprises 184 170 14 13 1 - - - -
Administrative and support, waste management and remediation services
169 91 78 36 21 11 7 3 -
Educational services 27 18 9 5 2 1 - - 1
Health care and social assistance 61 17 44 29 6 8 1 - -
Arts, entertainment and recreation 44 24 20 8 1 1 3 2 5
Accommodation and food services 50 23 27 8 3 9 3 2 2
Other services (except public administration) 156 52 104 91 10 2 1 - -
Public administration 1 - 1 - - - - - 1
Source: Statistics Canada, Canadian Business Patterns, 2012, Establishment Counts – King Township (3519049)
28 Millier Dickinson Blais: King Township Economic Development Strategy – Final Report -Appendices
Given these findings, supporting future business growth and investment in King Township will be based on understanding
and supporting the needs of small to medium businesses which have maintained business growth despite the
performance of some sectors of the economy. This is particularly relevant in light of existing research and trends which
suggest that an overwhelming percentage of new business investment in a community is derived from companies already
located there.
In order to determine the level and degree of industrial specialization that has developed in King Township, and thus the diversity of the regional economy, location quotients (LQs) have been calculated using the number of businesses to measure the relative concentration of industry/business activity by major industrial sector relative to the province.
King Township exhibited higher than average estimated concentrations of business location in a number of other sectors
relative to Ontario in 2012 (See Figure 23):
Agriculture, Forestry, Fishing and Hunting –2.62 LQ
Construction – 2.20 LQ
Administrative & Support, Waste Management & Remediation Services – 1.71 LQ
Arts, Entertainment and Recreation – 1.50 LQ
These sectors combined make up 41% of all businesses in King Township compared to only 20.3% for the Province of
Ontario`s economy as a whole.
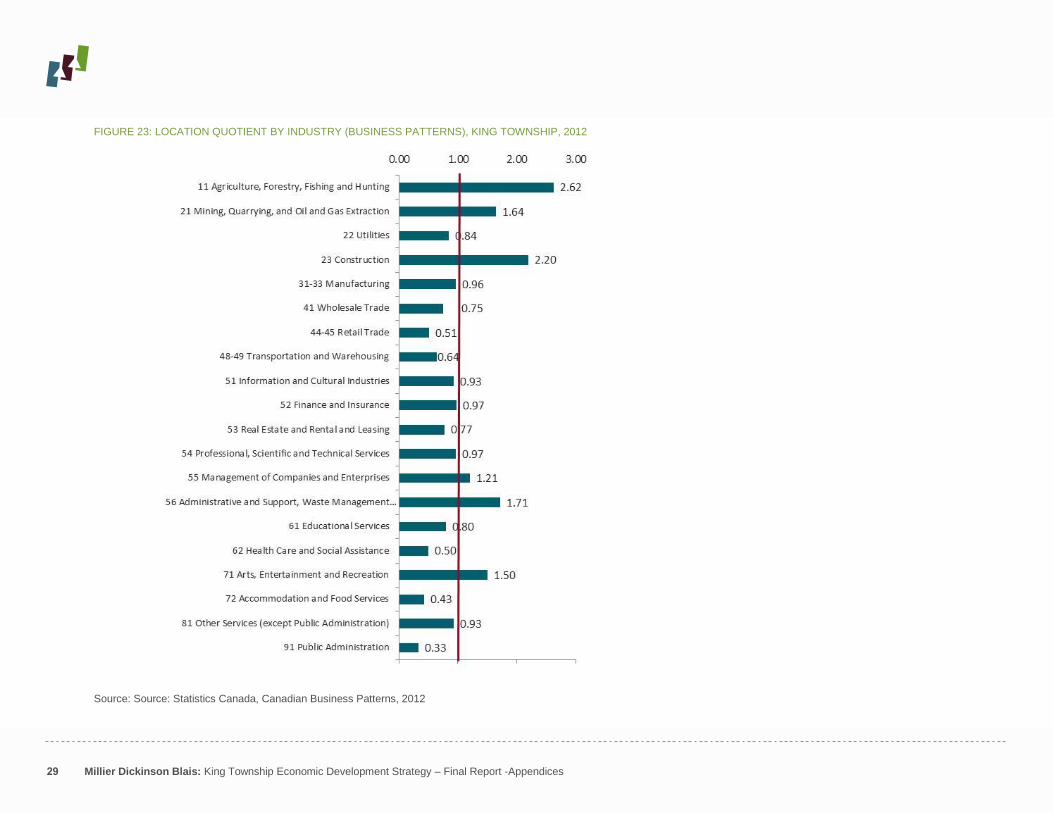
29 Millier Dickinson Blais: King Township Economic Development Strategy – Final Report -Appendices
FIGURE 23: LOCATION QUOTIENT BY INDUSTRY (BUSINESS PATTERNS), KING TOWNSHIP, 2012
Source: Source: Statistics Canada, Canadian Business Patterns, 2012

30 Millier Dickinson Blais: King Township Economic Development Strategy – Final Report -Appendices
1.2.3.3 Creative Businesses and Enterprises
Creative businesses in King were analyzed using 2004 and 2012 Canadian Business Patterns. Based on past research
into the creative economy the enterprises within the following industries can be classified as creative businesses:
Advertising Architecture Artists Business Consulting
Design Education Engineering Film
Games Heritage Marketing Museums Music
Performing Arts Photographic Services Web + Software Public Relations
Publishing Radio + Television
Between 2004 and 2012 the number of creative business in King decreased by 8.5% from 388 to 355 firms. As shown in
Figure 16, the largest creative industry sub-sector in King in 2012 were Business Consulting (117 businesses),
Engineering (54 businesses) and Film (33 businesses).
Due to the size of the creative business sub-industries the net change in the total and subtotal of businesses has been
reported instead of the percentage change. The sub-sector that grew the most between 2004 and 2012 was Film which
increased by a total of 20 businesses. The business consulting sub-sector experienced the largest decline with a net
decrease of 29 businesses.
The decline in creative business over the period is a troubling trend for a community where the total number of business
has remained relatively stable. The loss of creative businesses is a missed opportunity for King. Creative businesses
generate employment opportunities and often work across all sectors of the economy providing marketing, promotion,
consulting and other creative services. Having a strong and growing creative business sector is seen as a source of
innovation that can help propel the local economy into emerging sectors.
FIGURE 24: CREATIVE INDUSTRIES, KING TOWNSHIP, 2004 AND 2012
Industry (NAICS) 2004 2012 Net
Change Total
Net Change Subtotal Total Indeterminate Subtotal Total Indeterminate Subtotal
Creative Businesses 388 270 118 355 250 105 -33.0 -13.0
Advertising 29 24 5 20 13 7 -9.0 2.0
Architecture 6 3 3 9 5 4 3.0 1.0
Artists 11 11 0 6 4 2 -5.0 2.0
Business Consulting 146 112 34 117 89 28 -29.0 -6.0
Design 26 18 8 24 19 5 -2.0 -3.0
Education 11 6 5 9 6 3 -2.0 -2.0
Engineering 51 30 21 54 35 19 3.0 -2.0
Film 13 5 8 33 26 7 20.0 -1.0
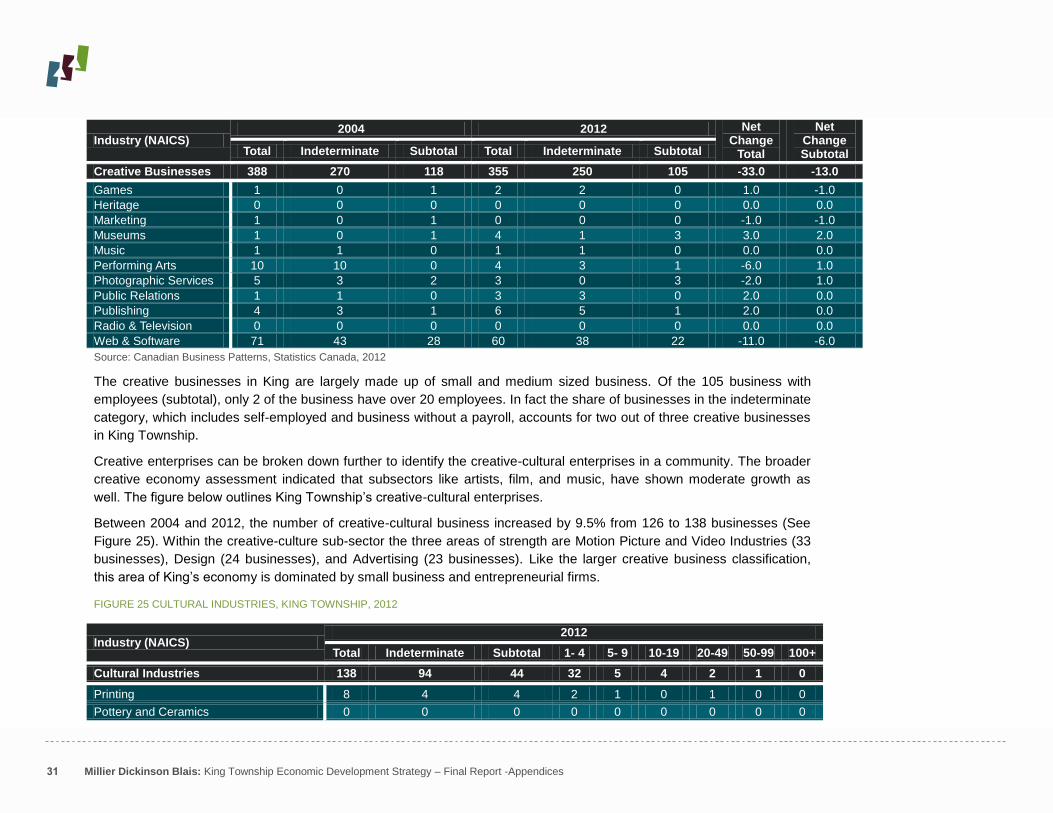
31 Millier Dickinson Blais: King Township Economic Development Strategy – Final Report -Appendices
Industry (NAICS) 2004 2012 Net
Change Total
Net Change Subtotal Total Indeterminate Subtotal Total Indeterminate Subtotal
Creative Businesses 388 270 118 355 250 105 -33.0 -13.0
Games 1 0 1 2 2 0 1.0 -1.0
Heritage 0 0 0 0 0 0 0.0 0.0
Marketing 1 0 1 0 0 0 -1.0 -1.0
Museums 1 0 1 4 1 3 3.0 2.0
Music 1 1 0 1 1 0 0.0 0.0
Performing Arts 10 10 0 4 3 1 -6.0 1.0
Photographic Services 5 3 2 3 0 3 -2.0 1.0
Public Relations 1 1 0 3 3 0 2.0 0.0
Publishing 4 3 1 6 5 1 2.0 0.0
Radio & Television 0 0 0 0 0 0 0.0 0.0
Web & Software 71 43 28 60 38 22 -11.0 -6.0
Source: Canadian Business Patterns, Statistics Canada, 2012
The creative businesses in King are largely made up of small and medium sized business. Of the 105 business with
employees (subtotal), only 2 of the business have over 20 employees. In fact the share of businesses in the indeterminate
category, which includes self-employed and business without a payroll, accounts for two out of three creative businesses
in King Township.
Creative enterprises can be broken down further to identify the creative-cultural enterprises in a community. The broader
creative economy assessment indicated that subsectors like artists, film, and music, have shown moderate growth as
well. The figure below outlines King Township‟s creative-cultural enterprises.
Between 2004 and 2012, the number of creative-cultural business increased by 9.5% from 126 to 138 businesses (See
Figure 25). Within the creative-culture sub-sector the three areas of strength are Motion Picture and Video Industries (33
businesses), Design (24 businesses), and Advertising (23 businesses). Like the larger creative business classification,
this area of King‟s economy is dominated by small business and entrepreneurial firms.
FIGURE 25 CULTURAL INDUSTRIES, KING TOWNSHIP, 2012
Industry (NAICS) 2012
Total Indeterminate Subtotal 1- 4 5- 9 10-19 20-49 50-99 100+
Cultural Industries 138 94 44 32 5 4 2 1 0
Printing 8 4 4 2 1 0 1 0 0
Pottery and Ceramics 0 0 0 0 0 0 0 0 0

32 Millier Dickinson Blais: King Township Economic Development Strategy – Final Report -Appendices
Industry (NAICS) 2012
Total Indeterminate Subtotal 1- 4 5- 9 10-19 20-49 50-99 100+
Cultural Industries 138 94 44 32 5 4 2 1 0
Motion Pictures and Video Industries 33 26 7 5 0 1 0 1 0
Music Stores 1 0 1 1 0 0 0 0 0
Book Stores 0 0 0 0 0 0 0 0 0
Sound Recording 1 1 0 0 0 0 0 0 0
Antiques 3 3 0 0 0 0 0 0 0
Art Dealers 1 1 0 0 0 0 0 0 0
Publishing Industries 7 6 1 0 1 0 0 0 0
Software Publishers 1 1 0 0 0 0 0 0 0
Radio and Television 0 0 0 0 0 0 0 0 0
Internet Publishing 0 0 0 0 0 0 0 0 0
Libraries and Archives 1 0 1 0 0 1 0 0 0
Architecture 9 5 4 3 0 1 0 0 0
Design 24 19 5 4 1 0 0 0 0
Advertising 23 14 9 8 0 0 1 0 0
Photography 3 0 3 1 1 1 0 0 0
Culture Support Services 15 9 6 5 1 0 0 0 0
Performing Arts 3 2 1 1 0 0 0 0 0
Independent Artists, Writers and Performers
5 3 2 2 0 0 0 0 0
Museums and Heritage Sites 0 0 0 0 0 0 0 0 0
Source: Canadian Business Patterns, Statistics Canada, 2012
1.2.4 Agricultural Profile
The agricultural profile examines King Township`s farming operations using data from the 2011 Agricultural Census of
Canada.
1.2.4.1 Type of Farm
Farming can and does take on many different forms in King Township (See Figure 26). The five dominant types of farms
in King Township are: other vegetable and melon farms (52); horse and other equine production (51); nursery and tree

33 Millier Dickinson Blais: King Township Economic Development Strategy – Final Report -Appendices
production (20); other grain farming (18) and hay farming (16). These five types of farms account for 66% of all
agricultural activity in King Township. A more detailed description of other vegetable and melon farms and horse and
other equine production is provided below due to their prominence in the community.
Other Vegetable and Melon Farms – There are 52 operations in King that are classified as other vegetable and
melon farms representing 21.3% of all farms in the community. This is significantly above the regional share of 12.7%
and the provincial share of 2.6%. The trend towards local food represents an opportunity for continued growth. To
take advantage of greater regional demand, operators require access to more farmers‟ market and support from other
local initiatives.
Horse and other Equine Production – One third of all horse and other equine production in York Region occurs in
King Township. There are 51 operational farms in the community. The decision by the Government of Ontario to
cancel the Slots at Racetracks Program is expected to have serious consequences for the entire industry and many
municipalities. Studies of the horse racing and breeding industry in Ontario have found that it supports 55,000-60,000
jobs in the Province. In addition, more than $2 billion is spent annually by the industry of which an estimated 80%
flows to rural communities.9 The pending change is expected to result in job loss in many rural communities that
depend on the horse racing and breeding industry.
9 Ontario Horse Racing Industry Association, Briefing Note: Cancelation of the Slots at Racetracks Program for Municipalities, February 22, 2013
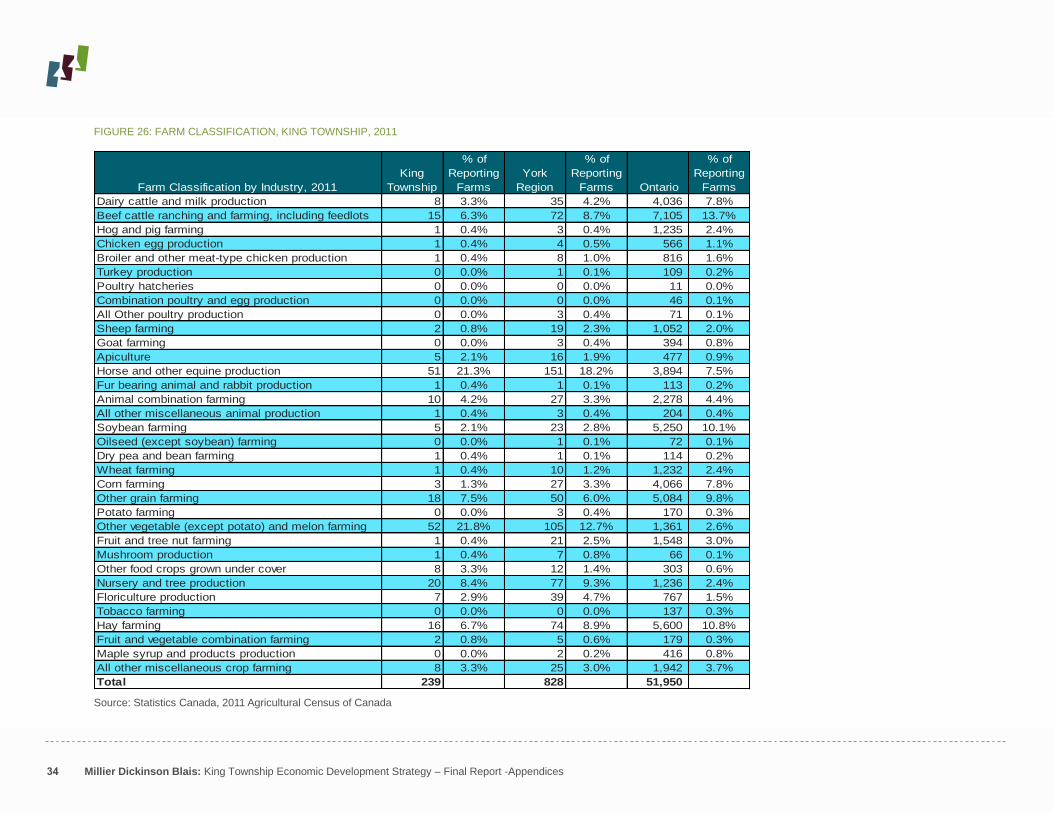
34 Millier Dickinson Blais: King Township Economic Development Strategy – Final Report -Appendices
FIGURE 26: FARM CLASSIFICATION, KING TOWNSHIP, 2011
Source: Statistics Canada, 2011 Agricultural Census of Canada
Farm Classification by Industry, 2011
King
Township
% of
Reporting
Farms
York
Region
% of
Reporting
Farms Ontario
% of
Reporting
Farms
Dairy cattle and milk production 8 3.3% 35 4.2% 4,036 7.8%
Beef cattle ranching and farming, including feedlots 15 6.3% 72 8.7% 7,105 13.7%
Hog and pig farming 1 0.4% 3 0.4% 1,235 2.4%
Chicken egg production 1 0.4% 4 0.5% 566 1.1%
Broiler and other meat-type chicken production 1 0.4% 8 1.0% 816 1.6%
Turkey production 0 0.0% 1 0.1% 109 0.2%
Poultry hatcheries 0 0.0% 0 0.0% 11 0.0%
Combination poultry and egg production 0 0.0% 0 0.0% 46 0.1%
All Other poultry production 0 0.0% 3 0.4% 71 0.1%
Sheep farming 2 0.8% 19 2.3% 1,052 2.0%
Goat farming 0 0.0% 3 0.4% 394 0.8%
Apiculture 5 2.1% 16 1.9% 477 0.9%
Horse and other equine production 51 21.3% 151 18.2% 3,894 7.5%
Fur bearing animal and rabbit production 1 0.4% 1 0.1% 113 0.2%
Animal combination farming 10 4.2% 27 3.3% 2,278 4.4%
All other miscellaneous animal production 1 0.4% 3 0.4% 204 0.4%
Soybean farming 5 2.1% 23 2.8% 5,250 10.1%
Oilseed (except soybean) farming 0 0.0% 1 0.1% 72 0.1%
Dry pea and bean farming 1 0.4% 1 0.1% 114 0.2%
Wheat farming 1 0.4% 10 1.2% 1,232 2.4%
Corn farming 3 1.3% 27 3.3% 4,066 7.8%
Other grain farming 18 7.5% 50 6.0% 5,084 9.8%
Potato farming 0 0.0% 3 0.4% 170 0.3%
Other vegetable (except potato) and melon farming 52 21.8% 105 12.7% 1,361 2.6%
Fruit and tree nut farming 1 0.4% 21 2.5% 1,548 3.0%
Mushroom production 1 0.4% 7 0.8% 66 0.1%
Other food crops grown under cover 8 3.3% 12 1.4% 303 0.6%
Nursery and tree production 20 8.4% 77 9.3% 1,236 2.4%
Floriculture production 7 2.9% 39 4.7% 767 1.5%
Tobacco farming 0 0.0% 0 0.0% 137 0.3%
Hay farming 16 6.7% 74 8.9% 5,600 10.8%
Fruit and vegetable combination farming 2 0.8% 5 0.6% 179 0.3%
Maple syrup and products production 0 0.0% 2 0.2% 416 0.8%
All other miscellaneous crop farming 8 3.3% 25 3.0% 1,942 3.7%
Total 239 828 51,950

35 Millier Dickinson Blais: King Township Economic Development Strategy – Final Report -Appendices
1.2.4.2 Farm Size
Farms in King Township range in size from less than 10 acres to between 1,600 – 2,239 acres in size. Of the 239 farms
captured in the 2011 agricultural census, 40.1% were between 10 and 69 acres in size which is also the most common
acreage range in Ontario. The size of farms in Ontario and King runs counter to the trend across Canada. The 2011
Census of Agriculture showed a long-term trend towards larger farms. With farm size growing and machinery and
equipment rising in price, the cost of entry into commercial agricultural is difficult. Overall there are three factors impacting
the trend toward larger sizes10
. First, technology (auto-steering technology, GPS, mechanical harvesters, robotics
equipment, etc.) is enabling farmers to do more and handle large amounts of products. Second, better tools are attracting
more entrepreneurial and accomplished farmers who can handle larger acreage. Finally, there are economies of scale
that come with larger farms. The utilization of more modern tools and technologies are only attainable at certain scales.
FIGURE 27: FARM SIZE, KING TOWNSHIP, YORK REGION AND ONTARIO, 2011
King
Township
% of Reporting
Farms
York
Region
% of Reporting
Farms Ontario
% of Reporting
Farms
Total number of farms 239 828 51,950
Under 10 acres 22 9.2% 91 11.0% 2,741 5.3%
10 to 69 acres 95 39.7% 332 40.1% 12,681 24.4%
70 to 129 acres 55 23.0% 157 19.0% 11,779 22.7%
130 to 179 acres 19 7.9% 60 7.2% 4,969 9.6%
180 to 239 acres 11 4.6% 40 4.8% 4,801 9.2%
240 to 399 acres 15 6.3% 70 8.5% 6,460 12.4%
400 to 559 acres 4 1.7% 13 1.6% 3,359 6.5%
560 to 759 acres 5 2.1% 20 2.4% 2,026 3.9%
760 to 1,119 acres 9 3.8% 22 2.7% 1,587 3.1%
1,120 to 1,599 acres 1 0.4% 9 1.1% 788 1.5%
1,600 to 2,239 acres 3 1.3% 8 1.0% 436 0.8%
2,240 to 2,879 acres 0 0.0% 2 0.2% 152 0.3%
2,880 to 3,519 acres 0 0.0% 1 0.1% 79 0.2%
3,520 acres and over 0 0.0% 3 0.4% 92 0.2%
Source: Statistics Canada, 2011 Agricultural Census of Canada
10 http://www.georgemorris.org/publications/file.aspx?id=144b3403-54ae-4c65-951c-68fb3093929f
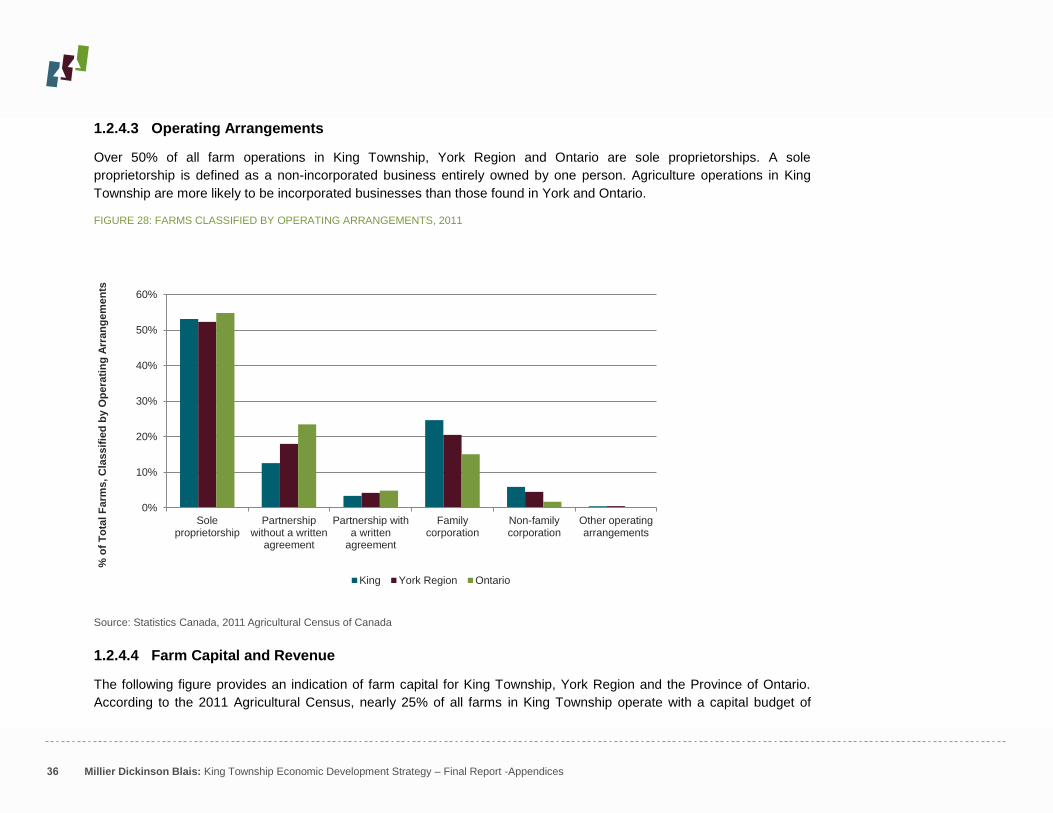
36 Millier Dickinson Blais: King Township Economic Development Strategy – Final Report -Appendices
1.2.4.3 Operating Arrangements
Over 50% of all farm operations in King Township, York Region and Ontario are sole proprietorships. A sole
proprietorship is defined as a non-incorporated business entirely owned by one person. Agriculture operations in King
Township are more likely to be incorporated businesses than those found in York and Ontario.
FIGURE 28: FARMS CLASSIFIED BY OPERATING ARRANGEMENTS, 2011
Source: Statistics Canada, 2011 Agricultural Census of Canada
1.2.4.4 Farm Capital and Revenue
The following figure provides an indication of farm capital for King Township, York Region and the Province of Ontario.
According to the 2011 Agricultural Census, nearly 25% of all farms in King Township operate with a capital budget of
0%
10%
20%
30%
40%
50%
60%
Soleproprietorship
Partnershipwithout a written
agreement
Partnership witha written
agreement
Familycorporation
Non-familycorporation
Other operatingarrangements
% o
f T
ota
l F
arm
s, C
lassif
ied
by O
pera
tin
g A
rran
ge
men
ts
King York Region Ontario

37 Millier Dickinson Blais: King Township Economic Development Strategy – Final Report -Appendices
between $500,000 and $999,999. Interestingly, 42% of all farms in King Township have capital budgets of over $2 million,
which is a significantly higher share than York Region (34%) and the province (20%).
FIGURE 29: FARM CAPITAL, 2011
Source: Statistics Canada, 2011 Agricultural Census of Canada
Figure 30, shows the gross farm receipts for King Township compared to York Region and the Province of Ontario. In
King Township 45.0% of all farms are earning less than $50,000 (105 farms) compared to 54.0% across York Region and
0.0% 5.0% 10.0% 15.0% 20.0% 25.0% 30.0% 35.0%
Under $100,000
$100,000 to $199,999
$200,000 to $349,999
$350,000 to $499,999
$500,000 to $999,999
$1,000,000 to $1,499,999
$1,500,000 to $1,999,999
$2,000,000 to $3,499,999
$3,500,000 and over
Under $100,000$100,000 to$199,999
$200,000 to$349,999
$350,000 to$499,999
$500,000 to$999,999
$1,000,000 to$1,499,999
$1,500,000 to$1,999,999
$2,000,000 to$3,499,999
$3,500,000 andover
Ontario 1.3% 3.6% 11.4% 13.6% 29.4% 13.5% 7.0% 10.1% 10.1%
York 1.4% 2.3% 4.8% 7.5% 26.6% 14.1% 9.4% 15.2% 18.6%
King 1.3% 2.1% 4.6% 5.9% 23.8% 10.0% 10.5% 20.5% 21.3%
Ontario York King
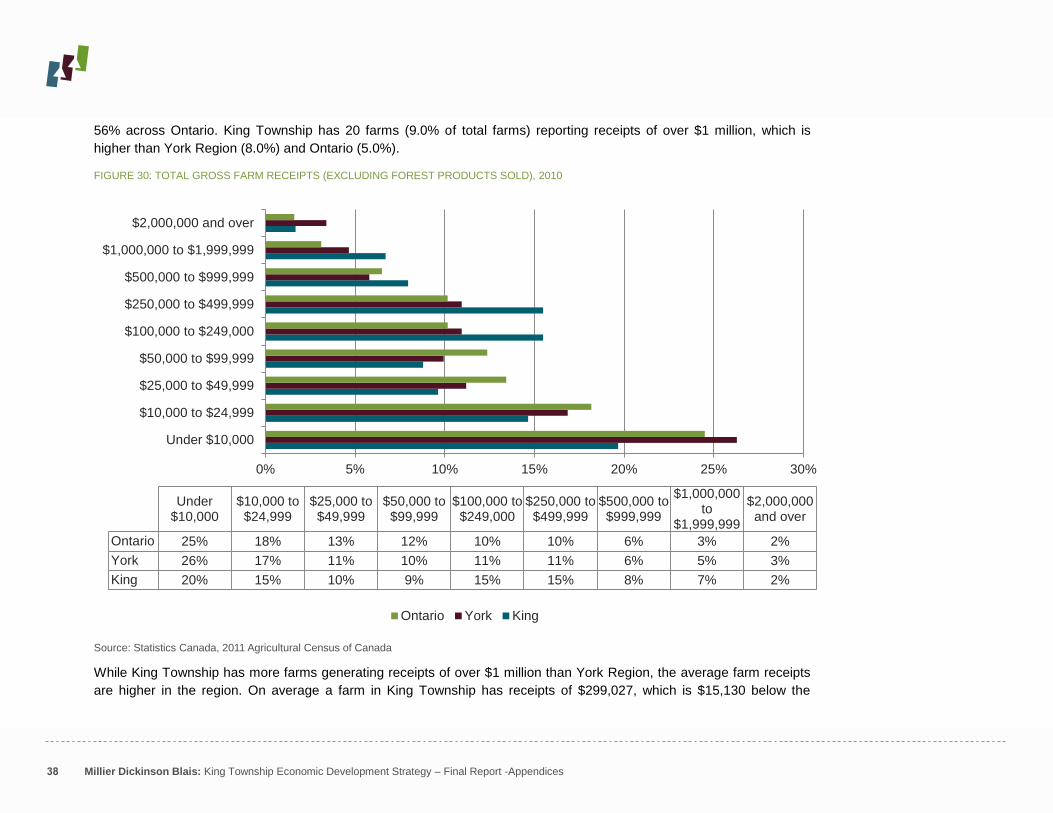
38 Millier Dickinson Blais: King Township Economic Development Strategy – Final Report -Appendices
56% across Ontario. King Township has 20 farms (9.0% of total farms) reporting receipts of over $1 million, which is
higher than York Region (8.0%) and Ontario (5.0%).
FIGURE 30: TOTAL GROSS FARM RECEIPTS (EXCLUDING FOREST PRODUCTS SOLD), 2010
Source: Statistics Canada, 2011 Agricultural Census of Canada
While King Township has more farms generating receipts of over $1 million than York Region, the average farm receipts
are higher in the region. On average a farm in King Township has receipts of $299,027, which is $15,130 below the
0% 5% 10% 15% 20% 25% 30%
Under $10,000
$10,000 to $24,999
$25,000 to $49,999
$50,000 to $99,999
$100,000 to $249,000
$250,000 to $499,999
$500,000 to $999,999
$1,000,000 to $1,999,999
$2,000,000 and over
Under$10,000
$10,000 to$24,999
$25,000 to$49,999
$50,000 to$99,999
$100,000 to$249,000
$250,000 to$499,999
$500,000 to$999,999
$1,000,000to
$1,999,999
$2,000,000and over
Ontario 25% 18% 13% 12% 10% 10% 6% 3% 2%
York 26% 17% 11% 10% 11% 11% 6% 5% 3%
King 20% 15% 10% 9% 15% 15% 8% 7% 2%
Ontario York King

39 Millier Dickinson Blais: King Township Economic Development Strategy – Final Report -Appendices
average across York Region. However, when compared to Ontario, the average farm receipts are $70,137 higher in King
Township.
FIGURE 31: AVERAGE FARM RECEIPTS, 2010
Source: Statistics Canada, 2011 Agricultural Census of Canada
1.2.5 Land Use & Physical Infrastructure Assessment
1.2.5.1 Land Use
York Region`s Planning and Development Services Department divides employment growth into three distinct types
which have implications for land use. These types are employment land, major office and population related employment.
For King Township, the estimated employment growth by type is 2,330 jobs for employment land employment and 2,530
jobs for population-related employment by 2031.11
No forecasted jobs in King Township are classified as Major Office
employment. The projected job growth is further divided by built-up area and designated Greenfield area. The results are
presented in Figure 32.
11 York Region 2031 Land Budget, York Region Planning and Development Services Department, 2010, p. 12.
$228,890
$299,027 $314,157
Ontario King York Region

40 Millier Dickinson Blais: King Township Economic Development Strategy – Final Report -Appendices
FIGURE 32: KING TOWNSHIP EMPLOYMENT GROWTH, 2006-2031
.
Source: York Region 2031 Land Budget, York Region Planning and Development Services Department, 2010, pp.15 & 20.
Employment areas are an important part of King‟s and York Region‟s regional economy. Typically home to a high
proportion of a municipality‟s more stable and higher paying economic activity, the development and long-term protection
of employment areas in needed to create sustainable live-work communities. Employment areas are defined in Provincial
Policy Statement (2005) as:
"Areas designated in an official plan for clusters of business and economic activities including, but not
limited to, manufacturing, warehousing, offices and associated retail and ancillary facilities”
It is estimated that 50 jobs could be accommodated in the built-up area and that 2,250 jobs could be accommodated in
the designated greenfield areas of King Township. The York Region 2031 Land Budget states that an assumed density of
25 jobs per net hectare is consistent with existing densities for employment land in King Township. This indicates that
future job growth can be accommodated in the built-up area and designated greenfield areas.
As of 2007, King only had 45 hectares of occupied employment lands with an average density of 23 jobs per hectare.
Amongst all the municipalities in York Region, the 45 hectares was the second lowest total and the Township ranked last
in terms of employment density. The 1,036 people working in King Township‟s employment areas account for
approximately one in six jobs in the municipality. Figure 33, also suggests that the attraction of a major office to King may
be a challenge. Of the nine municipalities in York Region only four have a major office and the majority of the major office
activity is located in Markham, Richmond Hill and Vaughan. Only Aurora, with 5 hectares occupied, has been able to
attract major office development to its employment areas.
Job Potential in
Built-up Area Job Potential in Designated
Greenfield Area Total
Employment Land Employment 50 2,250 2,300 Population-Related Employment 390 2,140 2,530 Total 440 4,390 4,830

41 Millier Dickinson Blais: King Township Economic Development Strategy – Final Report -Appendices
FIGURE 33: EMPLOYMENT LAND AREA, YORK REGION MUNICIPAL SUMMARY, 2007
Employment LandOccupied
Area (Ha)
Employment
Land
Employment
Employment
Density
(Jobs/Ha)
Occupied
Area (Ha)
(w/out Major Office
Employment Land
Employment
(w/out Major Office)
Employment
Density (Jobs/Ha)
(w/out Major Office)
York Region 4,318 258,313 60 4,014 199,674 50
Aurora 187 8,968 48 182 7,914 43
East Gwillimbury 119 1,362 11 119 1,362 11
Georgina 31 911 29 31 911 29
King 45 1,036 23 45 1,036 23
King City 8 360 47 8 360 47
Schomberg 38 674 18 38 674 18
Markham 1,058 93,514 88 850 49,574 58
Newmarket 212 14,354 68 212 14,354 68
Richmond Hill 369 28,487 77 333 21,748 65
Vaughan 2,133 104,880 49 2,077 97,973 47
Whitchurch-Stouffville 153 4,801 32 153 4,801 31 Source: York Region Planning and Development Services Department, 2007
*Please note the data excluding employment density has been rounded and therefore, some totals may be affected.
1.2.5.2 Telecommunications
The long term strategy for York Region, Vision 2051, describes a region that is driven by the creative and entrepreneurial
spirit of the business owners and labour force. The strategy describes an advanced telecommunications infrastructure
that enables quick adaptation to changing technologies and attracts global investment. Enhanced communications limit
the need for people in York Region to travel and facilitate efficiencies that allow councillors and business owners to make
more informed decisions about infrastructure investments, business services and hiring.
Using data supplied by Ontario Ministry of Economic Development and Innovation, it is possible to begin to assess the
quality of broadband in King Township. Based on 2119 tests performed over the past 12 months, the average download
speed in King Township was 12.2 Mbps (See Figure 34) and the average upload speed was 2.9 Mbps, and the latency
was 100 milliseconds.

42 Millier Dickinson Blais: King Township Economic Development Strategy – Final Report -Appendices
FIGURE 34: HISTOGRAM OF BROADBAND SPEED TESTS
Source: Ontario Ministry of Economic Development and Innovation. Data from Ookla Speedtest, 2013
Overall, 73% of tests gave speeds less than 5 Mbps. Only 17% of tests gave results greater than 20 Mbps.
Technologies are limited in the area. For example, Bell Canada, a major ISP, only offers up to 5 Mbps DSL service in
King Township, explaining a large part of what is seen above in Figure 34 .
Furthermore, the average download speed result (12.2 Mbps) is skewed by a few tests giving speeds greater than 100
Mbps. These were likely not residential tests and therefore the residential-only average speed would be lower than 12.2
Mbps.
The following internet service providers are active in King Township:
ACN
Atria Networks LP
Bell Canada
Bell Mobility
Colosseum Online
35
253
656 610
146
50 100
269
0
100
200
300
400
500
600
700
Nu
mb
er
of
Tests
Download Speed (Mbps)

43 Millier Dickinson Blais: King Township Economic Development Strategy – Final Report -Appendices
Data Centers Canada
Look Communications
Rogers Cable
Rogers Wireless
Seneca College
TeraGo Networks
Zing Networks
Routcom
1.2.6 Taxes
Economists generally agree that residential property taxes are an appropriate means of funding local governments.
First, by applying the taxes at the local level, those that directly benefit from services (schools, access to road, transit,
etc.) are asked to directly pay for their consumption of shared resources. In the assessment of property values, both the
benefits derived from local services and the taxes are factored into the financial evaluations. Secondly, in levying property
taxes, local governments gain autonomy and control of future growth. Finally, residential property taxes are a highly
visible form of taxation compared to income tax. Unlike income taxes, property taxes are not withheld at the source
(employer). Instead, property owners are required to pay defined amounts directly to the municipality throughout the year.
While, residential property taxes may benefit local municipalities, non-residential property taxes are in theory not a good
tax for local governments but may be necessary in reality. Non-residential property taxes include a variety of uses
including industrial (manufacturing) and commercial (offices, retail and accommodations). In most instances where non-
residential tax are levied they exceed residential tax rates. However, the differential tax rates do not always properly
reflect the usage of services and could result in businesses deciding to move12
. Being in general, more mobile than
residents, business are more likely to relocate when faced with higher taxes. As a result it may be advisable to apply
higher property taxes on residents who are less responsive to tax increases. At this time as Figure 35 shows, King
Township and other municipalities in the Greater Toronto Area elect to tax commercial and industrial property at a higher
rate than residential property.
12 http://www.munkschool.utoronto.ca/imfg/uploads/2/property_tax_paperwithlogos.pdf
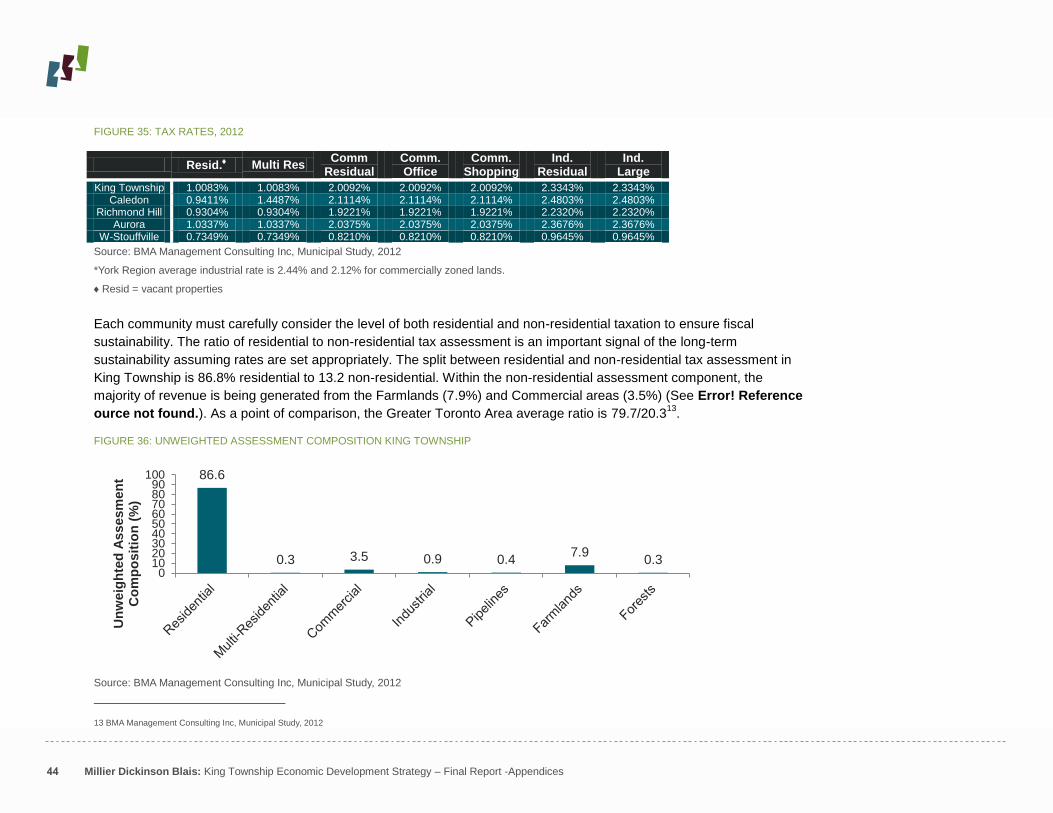
44 Millier Dickinson Blais: King Township Economic Development Strategy – Final Report -Appendices
FIGURE 35: TAX RATES, 2012
Resid. Multi Res Comm
Residual Comm. Office
Comm. Shopping
Ind. Residual
Ind. Large
King Township 1.0083% 1.0083% 2.0092% 2.0092% 2.0092% 2.3343% 2.3343% Caledon 0.9411% 1.4487% 2.1114% 2.1114% 2.1114% 2.4803% 2.4803%
Richmond Hill 0.9304% 0.9304% 1.9221% 1.9221% 1.9221% 2.2320% 2.2320% Aurora 1.0337% 1.0337% 2.0375% 2.0375% 2.0375% 2.3676% 2.3676%
W-Stouffville 0.7349% 0.7349% 0.8210% 0.8210% 0.8210% 0.9645% 0.9645%
Source: BMA Management Consulting Inc, Municipal Study, 2012
*York Region average industrial rate is 2.44% and 2.12% for commercially zoned lands.
Resid = vacant properties
Each community must carefully consider the level of both residential and non-residential taxation to ensure fiscal
sustainability. The ratio of residential to non-residential tax assessment is an important signal of the long-term
sustainability assuming rates are set appropriately. The split between residential and non-residential tax assessment in
King Township is 86.8% residential to 13.2 non-residential. Within the non-residential assessment component, the
majority of revenue is being generated from the Farmlands (7.9%) and Commercial areas (3.5%) (See Error! Reference
ource not found.). As a point of comparison, the Greater Toronto Area average ratio is 79.7/20.313
.
FIGURE 36: UNWEIGHTED ASSESSMENT COMPOSITION KING TOWNSHIP
Source: BMA Management Consulting Inc, Municipal Study, 2012
13 BMA Management Consulting Inc, Municipal Study, 2012
86.6
0.3 3.5 0.9 0.4 7.9
0.3 0
102030405060708090
100
Un
weig
hte
d A
ssesm
en
t C
om
po
sit
ion
(%
)
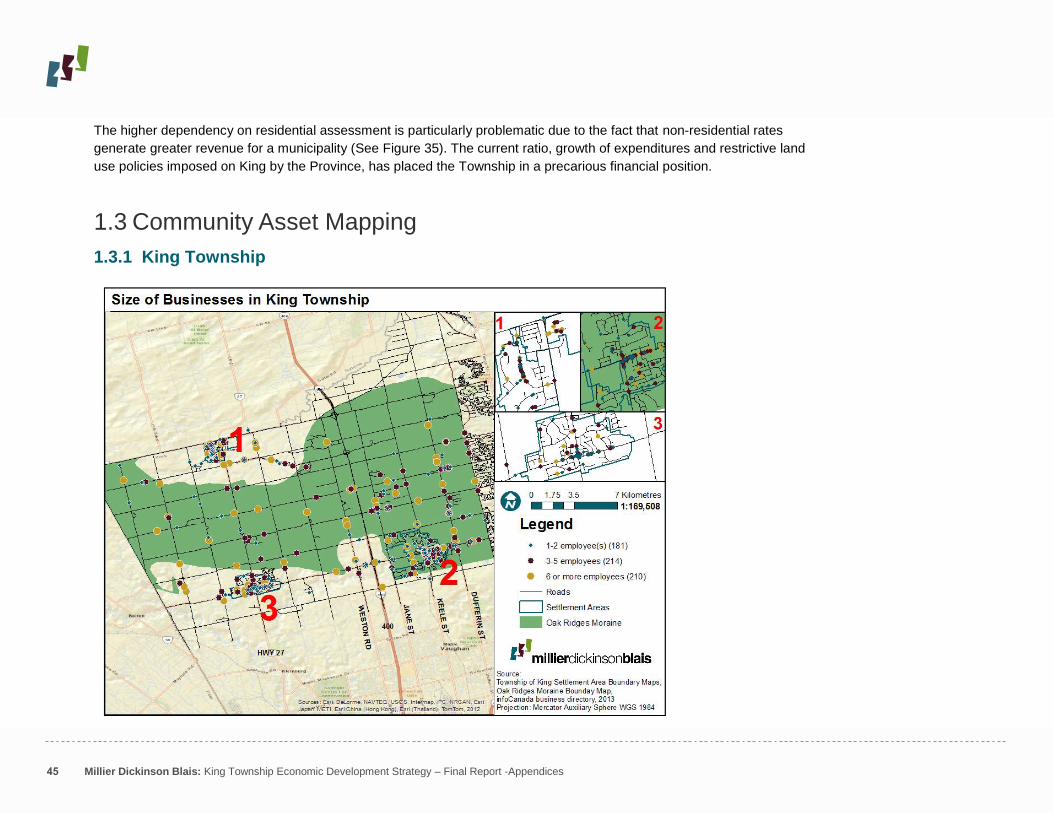
45 Millier Dickinson Blais: King Township Economic Development Strategy – Final Report -Appendices
The higher dependency on residential assessment is particularly problematic due to the fact that non-residential rates
generate greater revenue for a municipality (See Figure 35). The current ratio, growth of expenditures and restrictive land
use policies imposed on King by the Province, has placed the Township in a precarious financial position.
1.3 Community Asset Mapping
1.3.1 King Township

46 Millier Dickinson Blais: King Township Economic Development Strategy – Final Report -Appendices
1.3.2 King City
King City is located just north of the City of Vaughan. The major arterial roads running through King City are King Rd and
Keele St. With a population of approximately 7,350 residents, King City is one of the three major built-up areas in the
Township. Home to the municipal government offices, homes, international corporate and small business, King City is a
center of economic activity and stands out as a location that can support further development.
Incorporated in 1890, King City was formed from the amalgamation of the hamlets of Spring Hill, Eversley, Kingham and
Laskay. Remaining in King City from the 19th century are Hogan‟s Inn (1855) and Crawford Wells (1863). Throughout
this time period, King City supported local services including a local general store, bakery, harness shop, shoe store, iron
foundry and furniture store. By 1924, King City had grown to support 2 local banks, a post office, horse-drawn bus
service, medical care and one of the two inns.
Despite a population of over 7,000 residents, the majority of people living in King City are employed outside of the area
and the municipality. Many people who are employed in Management, Business, Finance and Administration and Sales
and Services Trades commute to Toronto on a daily basis.
The InfoCanada data shows that there are approximately 120 businesses in King City (See Figure 38). The majority of
the businesses are located east of Keele St on King Rd. King City is a full service community with everything from
financial institutions, graphic designers, dentists to veterinarians. Figure 37, highlights the top five employers in King City
who combined employ 748 people in a variety of sectors. Based on the InfoCanada data, the major industries in King City
are construction, other services and retail trade.
FIGURE 37: TOP EMPLOYERS IN KING CITY
Business Name Sector Number of Employees
Seneca College Education 292
Clublink Corporate Head Office 161
Kingbridge Centre Hospitality 100
Robert B. Sommerville Construction 100
LGL Limited Environmental Research 95

47 Millier Dickinson Blais: King Township Economic Development Strategy – Final Report -Appendices
FIGURE 38: KING CITY BUSINESS MAP
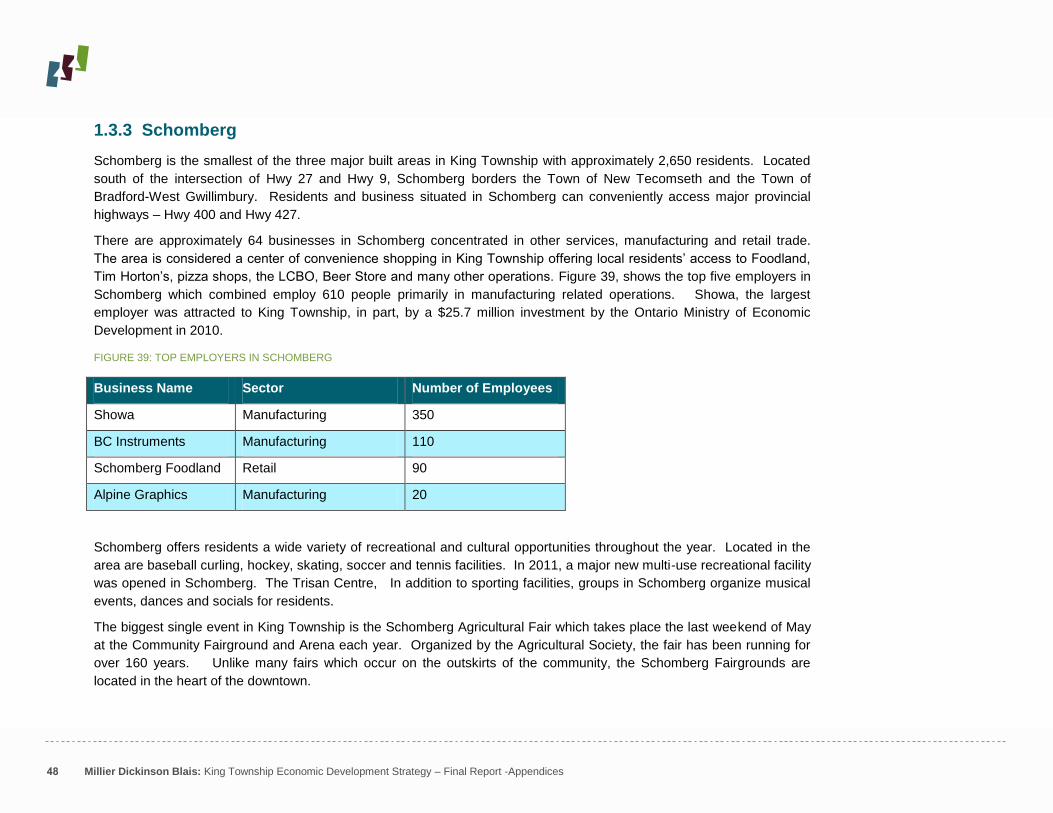
48 Millier Dickinson Blais: King Township Economic Development Strategy – Final Report -Appendices
1.3.3 Schomberg
Schomberg is the smallest of the three major built areas in King Township with approximately 2,650 residents. Located
south of the intersection of Hwy 27 and Hwy 9, Schomberg borders the Town of New Tecomseth and the Town of
Bradford-West Gwillimbury. Residents and business situated in Schomberg can conveniently access major provincial
highways – Hwy 400 and Hwy 427.
There are approximately 64 businesses in Schomberg concentrated in other services, manufacturing and retail trade.
The area is considered a center of convenience shopping in King Township offering local residents‟ access to Foodland,
Tim Horton‟s, pizza shops, the LCBO, Beer Store and many other operations. Figure 39, shows the top five employers in
Schomberg which combined employ 610 people primarily in manufacturing related operations. Showa, the largest
employer was attracted to King Township, in part, by a $25.7 million investment by the Ontario Ministry of Economic
Development in 2010.
FIGURE 39: TOP EMPLOYERS IN SCHOMBERG
Business Name Sector Number of Employees
Showa Manufacturing 350
BC Instruments Manufacturing 110
Schomberg Foodland Retail 90
Alpine Graphics Manufacturing 20
Schomberg offers residents a wide variety of recreational and cultural opportunities throughout the year. Located in the
area are baseball curling, hockey, skating, soccer and tennis facilities. In 2011, a major new multi-use recreational facility
was opened in Schomberg. The Trisan Centre, In addition to sporting facilities, groups in Schomberg organize musical
events, dances and socials for residents.
The biggest single event in King Township is the Schomberg Agricultural Fair which takes place the last weekend of May
at the Community Fairground and Arena each year. Organized by the Agricultural Society, the fair has been running for
over 160 years. Unlike many fairs which occur on the outskirts of the community, the Schomberg Fairgrounds are
located in the heart of the downtown.

49 Millier Dickinson Blais: King Township Economic Development Strategy – Final Report -Appendices
FIGURE 40: SCHOMBERG BUSINESS MAP

50 Millier Dickinson Blais: King Township Economic Development Strategy – Final Report -Appendices
1.3.4 Nobleton
Nobleton has a population of approximately 3,100 residents. Located south of the Oak Ridges Moraine, the village is at
the intersection of Highway 27 and King Rd. There is easy access to major, north/south and east/west highways. There
is also GO Transit services provided to the community. A GO bus stops at Hwy 27 and King Rd twice daily.
The population of Nobleton has increased slowly overtime as new subdivisions have been approved and built. To
accommodate future growth the following new development has been approved:
Fandor Homes, East side of the 8th Concession, North of King Rd, South of Hamley‟s Development, 86 singles
Hamley‟s Development by Metrus Property Limited, East side of Hwy 27, 698 homes
In Nobleton there are over 120 local businesses. The major industries in the community based on the InfoCanada data
are retail trade, other services and wholesale trade. Major services providers in the Nobleton area include: insurance
brokers, real estate, King Print & Design and graphic designers. The largest employers in the village employ 375 people.
The community is also home to the Nobleton Feed Mill which supplies most of the thoroughbred farms in King Township
and the Woodbine Racetrack.
FIGURE 41: TOP 5 EMPLOYERS IN NOBLETON
Business Name Sector Number of Employees
John‟s No Frills Retail 130 Nobleton Plaza Retail & Personal Services 115
Nobleton Lakes Golf Course Recreation & Hospitality 80 Montessori Country School Education 25
Nobleton Farm Services Retail & Services 25 Nobleton is seen as an attractive destination for people wanting a more rural and small town atmosphere. The village
offers a variety of recreational and cultural activities. One of the major assets found in the Nobleton area is the Cold
Creek Conservation Area. The 190 hectare Conservation Area offers 6.5 KM of trails within the Humber River
watershed. . Cold Creek Conservation Area is an ecologically diverse and sustainable natural area. It provides outdoor
education, cultural and heritage experiences and recreation.
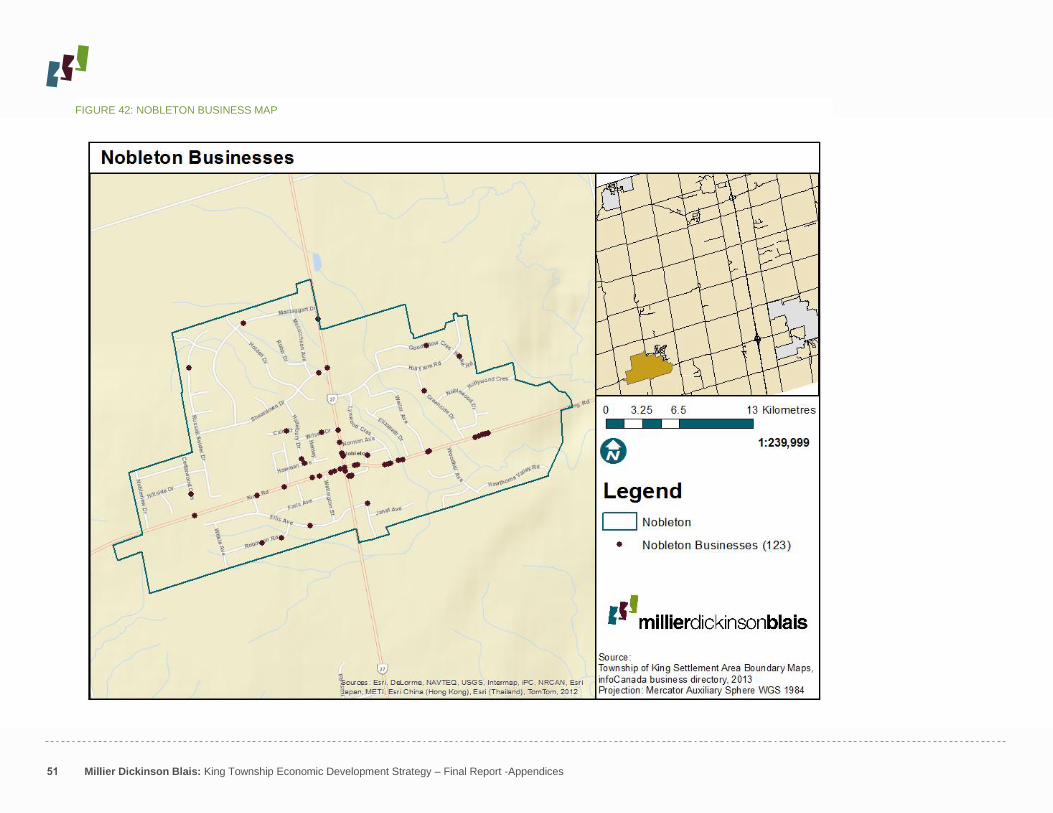
51 Millier Dickinson Blais: King Township Economic Development Strategy – Final Report -Appendices
FIGURE 42: NOBLETON BUSINESS MAP

52 Millier Dickinson Blais: King Township Economic Development Strategy – Final Report -Appendices

53 Millier Dickinson Blais: King Township Economic Development Strategy – Final Report -Appendices
Appendix II: Stakeholder Consultations
The development and implementation of a successful economic development strategy must be firmly grounded in the
unique and specific context of the community, and guided by the input of local stakeholders. To solicit input from the
community, the project team conducted 29 one-on-one stakeholder interviews and organized four focus groups to better
understand the strengths and weakness, as well as the opportunities and challenges related to economic growth and
investment in King Township.
The stakeholder interviewed included:
Robin Beamish, Beamish Construction
Lucy Belperio, President of King Chamber of Commerce and King Print
Doug Bower, Ministry of Economic Development & Innovation
Bill Cober, Councillor King Township
Tina DiSimone, Seneca College
John Dunlap, Equine/Real Estate Broker
Jim Dyment, Meridian Planning Consultants
Avia Eek, Councillor King Township
Chris Fasciano, Director of Parks and Recreation and Culture Township of King
Peter Grandilli, Councilor King Township
Lisa Gilbert, The Kingbridge Centre
Michele Harris, Hills of Headwater Tourism Association
Stephen Kitchen, Director of Planning King Township
Steven Lebfield, Tribute Commercial
Ian Middleton, Alpine Graphics
Cleve Mortelitti, Councillor King Township
Roland Nerysian, Holland Marsh Winery
Liz Nield, CEO Lura Consulting
Linda Pabst, Councillor King Township
Mark Pavilions, King Weekly Sentinel

54 Millier Dickinson Blais: King Township Economic Development Strategy – Final Report -Appendices
Steven Pellgrini, Mayor King Township
Chris Rickett, York Region Economic Development
Jim Rout, Routcom Internet Service Provider
Frank Samiffanni, Bradford Inn
Angelo Santorelli, Trisan Construction
Debbie Schaefer, Councillor King Township
Robert Uterman, York Region Economic Development
Bryan Watts, King Brewery
In addition to the one-on-one stakeholder interviews over 50 members of the community, municipal council, municipal
staff and the sustainability committee participated in a series of sessions held at the Kingbridge Centre. Led by Millier
Dickinson Blais and the Queens Executive Decision Centre, the four sessions helped to identify the economic
development priorities for King Township and were an opportunity to discuss a vision for what the community can be in 5
years.

55 Millier Dickinson Blais: King Township Economic Development Strategy – Final Report -Appendices
56 Millier Dickinson Blais: King Township Economic Development Strategy – Final Report -Appendices
Appendix III: Preliminary Cultural Asset
Inventory
Cultural mapping is increasingly being embraced as an essential planning and economic development tool in cities
internationally. The Province of Ontario has defined it as: „A systematic approach to identifying, recording, classifying and
analyzing a community‟s cultural resources14
. Our own understanding of cultural mapping and assessment is illustrated in
the following diagram.
The key to effective and sustainable cultural mapping is establishing a clear understanding and consensus among all
partners regarding a consistent set of categories of cultural resources – known as a Cultural Resource Framework (CRF)
- with which a wide range of existing information can be effectively consolidated. The CRF illustrated in Figure 43 was
developed by AuthentiCity and is promoted by the Province of Ontario as a guide for municipalities undertaking cultural
mapping and municipal cultural planning. Sub-categories of types of assets illustrated for each of the 8 major categories
are not comprehensive but rather chosen to illustrate a range of types of assets in each area.
14 Municipal Cultural Planning Inc. (2011). Cultural Resource Mapping; A Guide for Municipalities. http://www.ontariomcp.ca/toolkits/CulturalResourceMapping_digital.pdf

57 Millier Dickinson Blais: King Township Economic Development Strategy – Final Report -Appendices
FIGURE 43: CULTURAL RESOURCE FRAMEWORK
The assets identified as part of the cultural mapping exercise below is a preliminary list.

58 Millier Dickinson Blais: King Township Economic Development Strategy – Final Report -Appendices
Community Cultural Organizations
Category Company / Organization
Arts Groups Arts Society King
Arts Groups Kingcrafts
Cultural Facilities and Venues
Category Company / Organization
Community Centre YMCA, Cedar Glen Outdoor Centre
Community Centre King City Community Centre
Community Centre Nobleton Community Centre
Community Hall Kettleby Pottageville Lions
Community Hall Laskay Community Hall
Community Hall Nobleton Community Hall
Cultural Heritage Assets
Category Company / Organization
Built Heritage Properties Christian Church Cemetery
Built Heritage Properties Glenville Methodist Church
Built Heritage Properties Hambly House
Built Heritage Properties King City Cemetery
Built Heritage Properties King Immanel Baptist Church
Built Heritage Properties King Railway Station
Built Heritage Properties Laskay Womens Institute Hall

59 Millier Dickinson Blais: King Township Economic Development Strategy – Final Report -Appendices
Category Company / Organization
Built Heritage Properties Lloydtown Pioneer Cemetery
Built Heritage Properties Octagonal Deadhouse
Built Heritage Properties Sproule House
Religious Institutions All Saints Anglican Church
Religious Institutions Christ Church - Anglican
Religious Institutions Christian's Meeting Room
Religious Institutions King Bible Church
Religious Institutions King City United Church
Religious Institutions King Sacred Heart Parish Church
Religious Institutions Marylake Retreat Ctr
Religious Institutions Nobleton United Church
Religious Institutions Sacred Heart Church
Religious Institutions St Andrew's Presbyterian Chr
Religious Institutions St Mary Magdalene Church
Religious Institutions St Paul's Presbyterian Church
Religious Institutions St. Patrick's Roman Catholic Church
Religious Institutions York Pines United Church
Cultural Industries
Category Company / Organization
Adventure Farms Country Apple Orchard
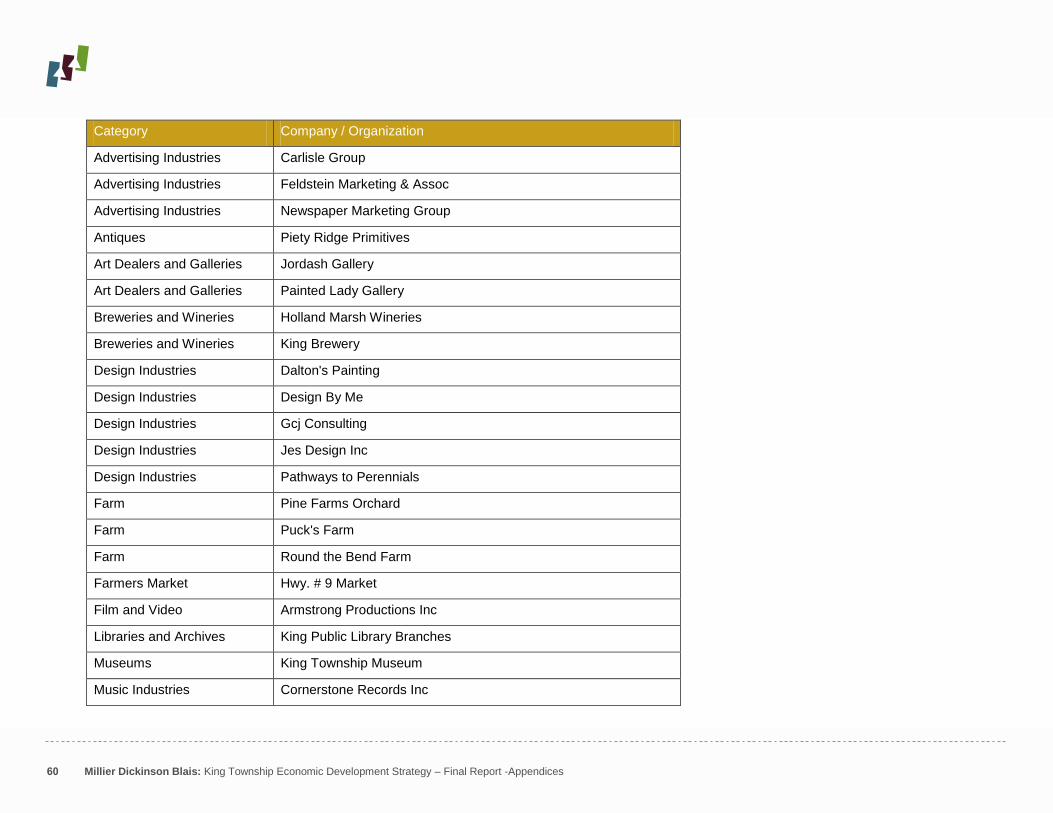
60 Millier Dickinson Blais: King Township Economic Development Strategy – Final Report -Appendices
Category Company / Organization
Advertising Industries Carlisle Group
Advertising Industries Feldstein Marketing & Assoc
Advertising Industries Newspaper Marketing Group
Antiques Piety Ridge Primitives
Art Dealers and Galleries Jordash Gallery
Art Dealers and Galleries Painted Lady Gallery
Breweries and Wineries Holland Marsh Wineries
Breweries and Wineries King Brewery
Design Industries Dalton's Painting
Design Industries Design By Me
Design Industries Gcj Consulting
Design Industries Jes Design Inc
Design Industries Pathways to Perennials
Farm Pine Farms Orchard
Farm Puck's Farm
Farm Round the Bend Farm
Farmers Market Hwy. # 9 Market
Film and Video Armstrong Productions Inc
Libraries and Archives King Public Library Branches
Museums King Township Museum
Music Industries Cornerstone Records Inc
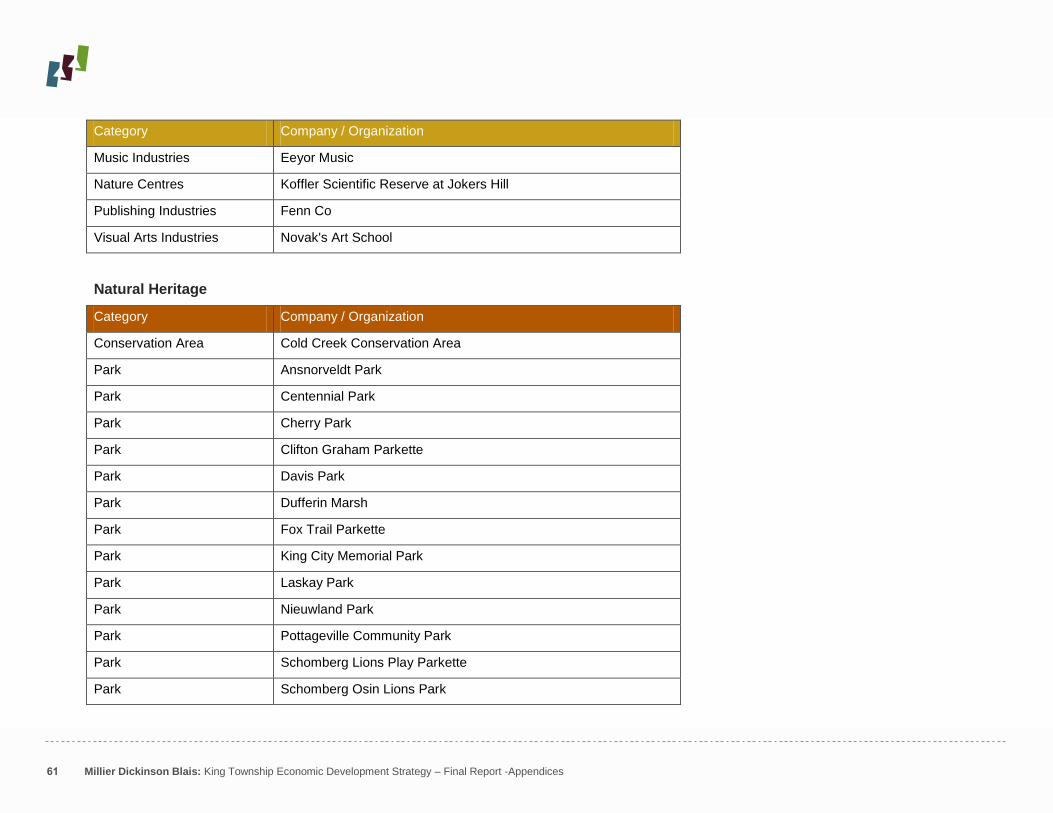
61 Millier Dickinson Blais: King Township Economic Development Strategy – Final Report -Appendices
Category Company / Organization
Music Industries Eeyor Music
Nature Centres Koffler Scientific Reserve at Jokers Hill
Publishing Industries Fenn Co
Visual Arts Industries Novak's Art School
Natural Heritage
Category Company / Organization
Conservation Area Cold Creek Conservation Area
Park Ansnorveldt Park
Park Centennial Park
Park Cherry Park
Park Clifton Graham Parkette
Park Davis Park
Park Dufferin Marsh
Park Fox Trail Parkette
Park King City Memorial Park
Park Laskay Park
Park Nieuwland Park
Park Pottageville Community Park
Park Schomberg Lions Play Parkette
Park Schomberg Osin Lions Park

62 Millier Dickinson Blais: King Township Economic Development Strategy – Final Report -Appendices
Category Company / Organization
Park St. Andrews Park
Park Tyrwhitt Park
Park Wellesley Park
Recreational Industries
Category Company / Organization
Equestrian Industries Epstein Equestrian Enterprises
Equestrian Industries Spruce Meadows
Equestrian Industries Standalone Farms
Equestrian Industries Venture Valley Farm
Equestrian Industries WGM Stables
Golf Courses Carrying Place Golf & Country Club
Golf Courses King Valley Golf Club
Golf Courses King's Riding Golf Club
Golf Courses Nobleton Lakes Golf Club Hwy
Golf Courses Redcrest Golf Course
Recreational Centre Trisan Centre
Recreational Clubs King City Figure Skating Club
Recreational Clubs Maple Leaf Cricket Club
Recreational Clubs Nobleton Skating Club
Recreational Industries George Jacobson Swim School
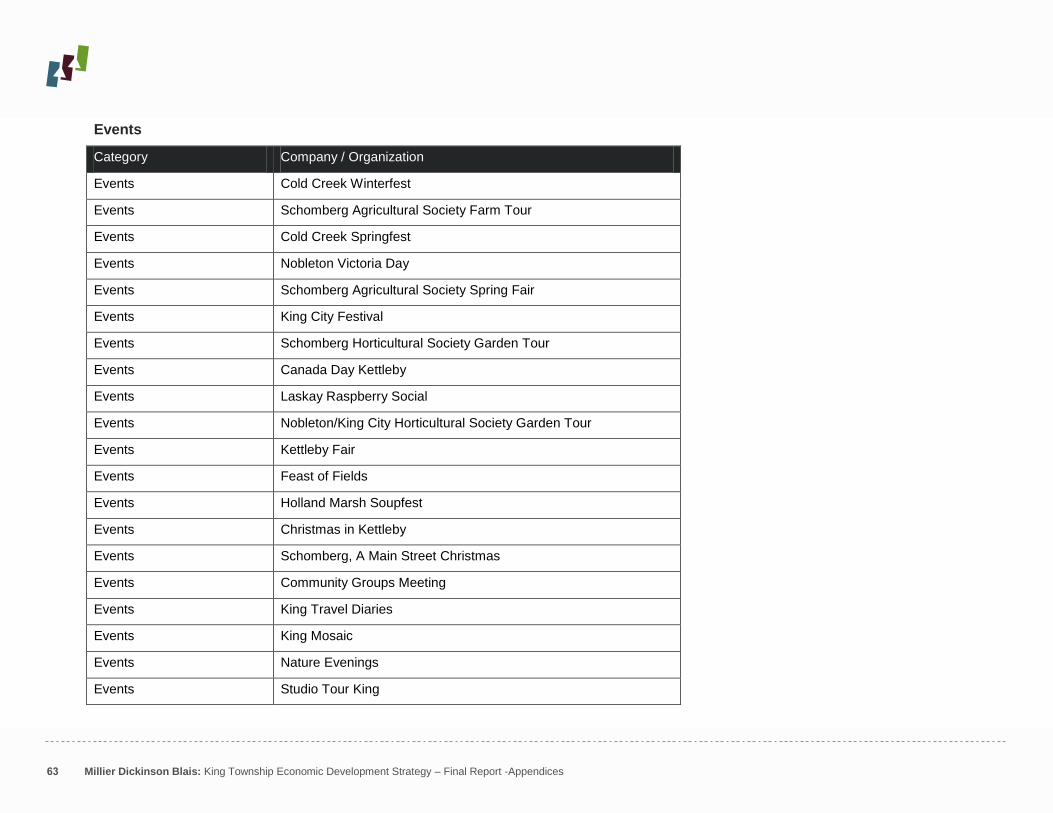
63 Millier Dickinson Blais: King Township Economic Development Strategy – Final Report -Appendices
Events
Category Company / Organization
Events Cold Creek Winterfest
Events Schomberg Agricultural Society Farm Tour
Events Cold Creek Springfest
Events Nobleton Victoria Day
Events Schomberg Agricultural Society Spring Fair
Events King City Festival
Events Schomberg Horticultural Society Garden Tour
Events Canada Day Kettleby
Events Laskay Raspberry Social
Events Nobleton/King City Horticultural Society Garden Tour
Events Kettleby Fair
Events Feast of Fields
Events Holland Marsh Soupfest
Events Christmas in Kettleby
Events Schomberg, A Main Street Christmas
Events Community Groups Meeting
Events King Travel Diaries
Events King Mosaic
Events Nature Evenings
Events Studio Tour King
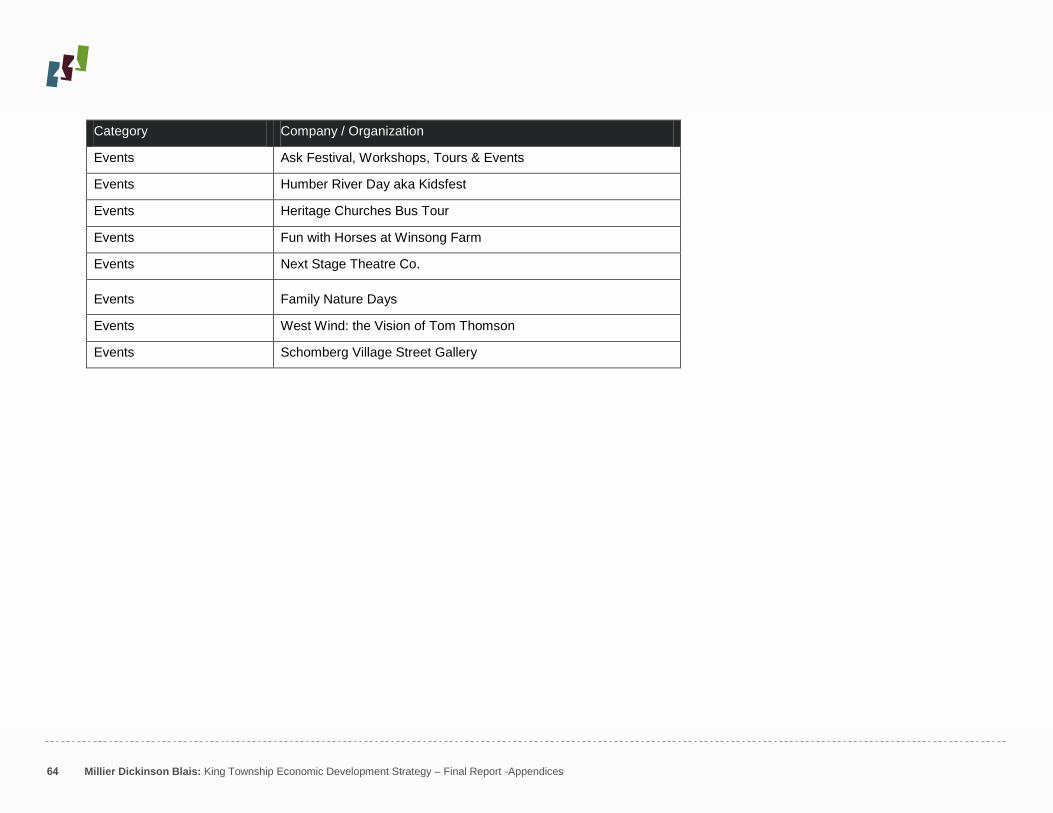
64 Millier Dickinson Blais: King Township Economic Development Strategy – Final Report -Appendices
Category Company / Organization
Events Ask Festival, Workshops, Tours & Events
Events Humber River Day aka Kidsfest
Events Heritage Churches Bus Tour
Events Fun with Horses at Winsong Farm
Events Next Stage Theatre Co.
Events Family Nature Days
Events West Wind: the Vision of Tom Thomson
Events Schomberg Village Street Gallery

65 Millier Dickinson Blais: King Township Economic Development Strategy – Final Report -Appendices
.