kinetics food quality review - washington state university
TRANSCRIPT
1 23
Food and Bioprocess TechnologyAn International Journal ISSN 1935-5130Volume 8Number 2 Food Bioprocess Technol (2015)8:343-358DOI 10.1007/s11947-014-1398-3
Kinetics of Food Quality Changes DuringThermal Processing: a Review
B. Ling, J. Tang, F. Kong, E. J. Mitcham& S. Wang

1 23
Your article is protected by copyright and all
rights are held exclusively by Springer Science
+Business Media New York. This e-offprint is
for personal use only and shall not be self-
archived in electronic repositories. If you wish
to self-archive your article, please use the
accepted manuscript version for posting on
your own website. You may further deposit
the accepted manuscript version in any
repository, provided it is only made publicly
available 12 months after official publication
or later and provided acknowledgement is
given to the original source of publication
and a link is inserted to the published article
on Springer's website. The link must be
accompanied by the following text: "The final
publication is available at link.springer.com”.

ORIGINAL PAPER
Kinetics of Food Quality Changes During ThermalProcessing: a Review
B. Ling & J. Tang & F. Kong & E. J. Mitcham & S. Wang
Received: 28 November 2013 /Accepted: 25 August 2014 /Published online: 18 September 2014# Springer Science+Business Media New York 2014
Abstract Thermal treatments are extensively used in the foodindustry for control of pathogenic and spoilage microorgan-isms and spoilage enzymes. Food quality degradation duringthose treatments can be a major concern for consumer accep-tance. Kinetic studies and mathematical models on qualitychanges of foods are essential in proper design of thermaltreatments to ensure consumer satisfaction. This study pro-vides a comprehensive review of recent progresses on qualitykinetics for thermal treatments to inactivate microorganismsand enzymes in foods of both plant and animal origins. Thispaper mainly covers the theoretical basis for studying qualitykinetics, common and special kinetic models to describe ma-jor quality attributes, such as appearance, texture, and nutri-ents, and potential applications of quality kinetic models todeveloping thermal treatment protocols. Finally, this reviewdescribes the challenges in quality kinetic studies and pro-poses recommendations for future research to maintain foodquality and extend shelf life.
Keywords Thermal processing . Color . Texture . Nutrients .
Kinetic model
Introduction
Thermal sterilization, pasteurization, and blanching tech-niques have been extensively used in the food industry tocontrol bacteria, fungi, and other microorganisms as well asundesirable enzymes in foods. To meet the food safety andshelf life-stable requirements, however, thermal processingmay involve long time heating at high temperatures, promot-ing chemical and physical reactions in foods, and renderingthe product unwholesome or causing quality degradation(Fellows 2009). For example, color changes, development ofoff-odors or off-taste, and loss of freshness or nutrients occurfrequently during and after thermal processing (Liaotrakoonet al. 2013; Song et al. 2003; Wen et al. 2010; Zabbia et al.2011). It is particularly true for prepackaged solid or semi-solid foods in which heat transfer is slow and the centertemperature is difficult to raise when using conventional sur-face heating methods.
Novel thermal processing techniques hold potential in im-proving the heating efficiency and reducing quality losses.Electro-heating, such as ohmic (OH), microwave (MW), andradio frequency (RF) heating, has been considered to replaceconventional heating for developing better foods (Liu et al.2011; Pereira et al. 2008; Wang et al. 2012). Microwaveenergy has been used to control molds, yeasts, pathogens,and spores in foods. For example, microwave systems oper-ating at 896 or 2,450 MHz are commercially used in Europefor production of a wide range of packaged foods, such ascakes, breads, pasta, and refrigerated ready-to-eat meals (Tanget al. 2002). In the USA, 915-MHz microwave systems havebeen used in the food industry since 1980. Recently, new 915-MHz microwave-assisted thermal processes received accep-tance from the US Food and Drug Administration (FDA) forproduction of low acid shelf-stable foods (Knights 2013).Compared with the conventional convection, conduction,and radiation heating, the electro-heating is generated
B. Ling : S. Wang (*)College of Mechanical and Electronic Engineering, Northwest A&FUniversity, Yangling 712100, Shaanxi, Chinae-mail: [email protected]
J. Tang : S. WangDepartment of Biological Systems Engineering, Washington StateUniversity, 213 L.J. Smith Hall, Pullman, WA 99164-6120, USA
F. KongDepartment of Food Science & Technology, University of Georgia,100 Cedar Street, Athens, GA 30602-2610, USA
E. J. MitchamDepartment of Plant Sciences, Mail Stop 2, University of California,One Shields Ave., Davis, CA 95616, USA
Food Bioprocess Technol (2015) 8:343–358DOI 10.1007/s11947-014-1398-3
Author's personal copy

volumetrically by converting the electrical energy to thermalone inside the food materials, which greatly reduces theheating time, and increases the heating rate so as to avoidthe quality loss caused by slow overheating (Marra et al.2009).
Proper design of conventional or novel thermal processesrequires comprehensive understanding of thermal propertiesof foods and quantitative changes of target microorganisms,enzymes, or quality attributes in thermal processes (Stoforos1995; Holdsworth and Simpson 2008; Simpson 2010). It isdesirable to select optimal process conditions to control mi-croorganisms and enzymes while minimizing food qualitydegradations. Kinetic studies on thermal inactivation of mi-croorganisms and enzymes have been extensively reportedand reviewed in the literature (FDA 2000; IFT 2003; VanBoekel 1996).
According to Haefner (2005), principles and applicationsof kinetic models developed for biological systems can pro-vide valuable insights into understanding, predicting, andcontrolling the food quality changes that occur during thethermal processing. Comprehensive kinetic models on thethermodynamics and chemical kinetics at the molecular levelmay reveal the quality change mechanism. Fundamental ki-netic parameters, such as activation energy, enthalpy, andentropy obtained from well-planned experiments, may beused to estimate the quality changes of foods in variousthermal processes and ultimately lead to the optimal designof thermal processing conditions.
Numerous studies have been reported on different modelsfor foods in thermal processing. Literature reviews are alsoavailable on estimation of kinetic parameters for non-isothermal conditions (Dolan 2003), thermal inactivation ki-netics of microorganisms under conventional and emergingthermal treatments (Bermudez-Aguirre and Corradini 2012),enzyme inactivation in the thermal processing (Adams 1991),kinetics of quality changes in the food frying (Hindra and Baik2006), and modeling of the temperature effect on the rate ofchemical reactions and biological processes in foods (Barsaet al. 2012). No recent comprehensive review of progresses is,however, available on kinetics of quality changes duringthermal inactivation of microorganisms and enzymes in foods.
This paper aims to provide a review of the literature onfood quality changes during the thermal inactivation ofmicroorganisms and enzymes. These include theories andexperimental methods to obtain quality kinetic models,common reactions and special kinetic models in foodprocessing, and recommendations for the future researchto enhance practical applications of quality kineticmodels. The quality parameters of interests in this paperinclude color, texture, and nutrient content. It is our intentto cover temperature and processing time ranges applica-ble to both lengthy conventional thermal processes andshort-time microwave or RF processes.
Theoretical Basis and Experimental Methods of FoodQuality Kinetics
Theoretical Background
Foods are generally complex biological systems. A number ofreactions take place during thermal processing, either in seriesor in parallel, and competing. The final quality loss may be theresults of many interacting and complex reactions rather thana single elementary step. An effective first-step kinetic model-ing is to study simple food systems rather than real foods(Wedzicha et al. 1993). Chemical reaction kinetics can beapplied to quantify individual attribute of an ideal food systemin form of the general rate law (Van Boekel 1996; Steinfeldet al. 1998; FDA 2000):
dP
dt¼ �kPn ð1Þ
where k is the rate constant (1/min), t the reaction time (min),and n the reaction order. In general, P represents a quantitativevalue for a quality attribute, enzymes activity, or population ofmicroorganisms.
The core of kinetic studies on food quality changes inthermal processing is to quantify a quality attribute as afunction of heating time at a certain temperature usingtemperature-dependant reaction rate constants after the orderof reactions is decided. The order of kinetics is determinedbased on the goodness of fit of the observations to apreselected reaction order model. Kinetics of food qualitychanges generally follows zero-, first-, or second-order reac-tions as follows:
P ¼ P0−kt for zero−order reactions n ¼ 0ð Þ ð2Þ
P ¼ P0e− kt for first−order reactions n ¼ 1ð Þ ð3Þ
1
P¼ kt þ 1
P0for second−order reactions n ¼ 2ð Þ ð4Þ
where P0 is the initial value of the food quality attribute at t=0.In thermal processing, D-value (min) is used for con-
venience and defined as the heating time in minutes togive 90 % or one-log change of food quality in a semi-logscale at a constant temperature. The D-value is directlyrelated to the first-order reaction rate constant k by Eq. 5(Anthon and Barrett 2002; Awuah et al. 2007; Van Boekel2008):
D ¼ 2:303
kð5Þ
344 Food Bioprocess Technol (2015) 8:343–358
Author's personal copy
To explore the temperature-dependent quality, theArrhenius equation is the most common method to describethe temperature (T) effect on the reaction rate constant (k) asfollows:
k ¼ k0e�Ea
RT ð6Þ
where k0 is the rate constant, R is the ideal gas constant(8.314 J/mol·K), and T is the absolute temperature (K). Ea isthe activation energy (J/mol) and defined as the minimumenergy needed to start a chemical reaction (sometimes calledthe energy barrier). A chemical reaction at a reasonable ratetakes places when an appreciable number of molecules withenergy equal to or greater than the activation energy. Whentemperature increases, the number of molecules increases withenergy greater than the activation energy, thus improving therate of reaction. Therefore, the activation energy is a parameterthat indicates the sensitivity of the reaction rate to temperature.For greater activation energy, the rate of reaction is moresensitive to temperature changes and vice versa.
When conducting an analysis to estimate kinetic parame-ters for the Arrhenius relationship, it is recommended that thefollowing alternative form can be used (Theodore et al. 1997;Peleg et al. 2012):
k ¼ kref e− Ea
R1T −
1T ref
� �ð7Þ
where Tref stands for a reference temperature (K) correspond-ing to the mean of the temperature range in consideration andkref is the reaction rate at the reference temperature.
The Q10-value is another concept to describe the rate ofquality changes with temperature. It is defined as follows(Lund 1977; Fu and Labuza 1993):
Q10 ¼k Tþ10�Cð Þ
kTð8Þ
where T is in degree Celsius (°C).If the Arrhenius relationship holds, Q10-value can be relat-
ed to activation energy Ea by the following relationship(Buransompob et al. 2003):
logQ10 ¼4:34Ea
RT T þ 10oCð Þ ð9Þ
The Q10-value is commonly used to predict the storageperiod at lower temperatures based on the shelf life testsconducted at higher temperatures. Since dependent stronglyon temperature, Q10-value is applied in a small temperaturerange of 10 to 20 °C to avoid possible physical and chemicalchanges (Labuza 1984). The Q10 concept is successfully usedto design the accelerated shelf life tests for thermally
processed products, such as walnuts, almonds, powderedgabiroba pulp, fresh cut pineapple slices, and low acid foods(Breda et al. 2012; Gao et al. 2010; Riva and Torri 2009;Wanget al. 2006; Yoon et al. 2009).
The z-value (°C) indicates the temperature increment toreduceD-value by 90 % or results in a one-log change, whichpresents sensitivity to temperature changes. For the first-orderreaction, z-value can be calculated as a function of temperaturebelow:
z ¼ T 2−T 1
logD1−logD2ð10Þ
where D1 and D2 are the decimal reduction times at temper-atures T1 and T2, respectively.
The interconversion of factors (Ea and z-values) from oneconcept to the other can, however, lead to discrepancies ifexperimental data are obtained outside the temperature limits.If the Arrhenius relationship holds, z-values can also be relat-ed to the activation energy Ea by the following relationship ina given temperature range T1∼T2 (T1<T2) (Ramaswamy et al.1989):
z ¼ 2:303RT1T2
Eað11ÞÞ
If the rate constant could be described well by both theArrhenius equation and the z-value model, Eq. 11 can bewritten as follows (Saguy et al. 1978):
z ¼ 2:303RT 2
Eað12Þ
where T stands for a temperature corresponding to the meanover the temperature range T1∼T2 in experiments.
The correlation between z-value and Q10 can also be prov-en as follows:
z ¼ 10
logQ10ð13Þ
Among D-value, z-value, Ea, k, Q10, and T, each parametercan be easily converted by the two of known model parame-ters. It is worth noting that there are not only correlations butalso distinctions between the Arrhenius equation and the z-value model. They are nearly the same within a certain tem-perature range, but z-value model gives a higher predicted kvalue than Arrhenius equation when using extrapolation dataat high temperatures (Fujikawa and Itoh 1998; Jonsson et al.1977; Saguy et al. 1978).
Food Bioprocess Technol (2015) 8:343–358 345
Author's personal copy
Experimental Determination of Kinetic Parameters
Although the most practical thermal processes are non-iso-thermal, kinetic models are developed under isothermal con-ditions, which can be easily integrated into accumulated ef-fects under a given temperature-time history of a heatingprocess to estimate the quality changes (Dolan 2003). It isrecommendable that preliminary tests are conducted to selecttest conditions, in which adequate extent of quality changescould be observed over the maximum span of the time at anygiven temperature. This may ensure that the developed kineticmodels cover desired range of quality changes. Precautionarymeasures should also be taken to reduce or eliminate theinfluence of the time that it would take for the sample to reachthe set elevated temperatures (Chung et al. 2007).
Two experimental methods are widely used for kineticstudies, which include the direct and indirect heating. Forthe direct heating method, prepackaged samples are im-mersed directly into the heating media, such as water bath(<95 °C) or oil bath (>95 °C). This method works well asa confirmation for conventional heat treatments but is notsuited for kinetic studies because the heat transfer startsfrom the surface and non-uniform temperatures betweenthe food surface and the centre are usually observed inlarge-size samples. Due to taking long time for wholeprepackaged samples to reach the target temperature, thismethod fails to provide isothermal conditions. The kineticparameters obtained by this method can only be applied tothe same heating conditions.
Indirect heating methods commonly use a small volume orthin product or samples so as to achieve an applicable isother-mal condition. The instrumentation and device used for thosetests include thermal death time (TDT) cans for vegetable(Van Loey et al. 1995), glass beakers for vegetable puree(Ahmed et al. 2002; Nisha et al. 2011), glass tubes for fruitextract or vegetable puree (Rudra et al. 2008; Suh et al. 2003),screw-cap test tubes for fruit juice (Dhuique-Mayer et al.2007; Kechinski et al. 2010), Pyrex glass vials for fruit puree(Avila and Silva 1999), hermetically metal cells or tubes forfruit juice, vegetable extract and fruit tissue particles (Jimenezet al. 2010; Lemmens et al. 2011; Nayak et al. 2011; Verbeystet al. 2010), and capillary tubes for fruit paste (Barreiro et al.1997). The device employed depends on the type of prod-uct being tested and the purpose of research since some ofthese sample holders are only suitable for determining thethermal tolerance of quality properties at a certain condi-tion. For instance, large glass tubes and beakers are fragileand not suited to hold samples for heating beyond 100 °Cwithout losing water. In addition, capillary tubes are con-sidered as the best method for characterizing thermal tol-erance of quality properties in liquid samples, but they arenot suitable for solid samples due to the difficulty of fittingsamples in a narrow space.
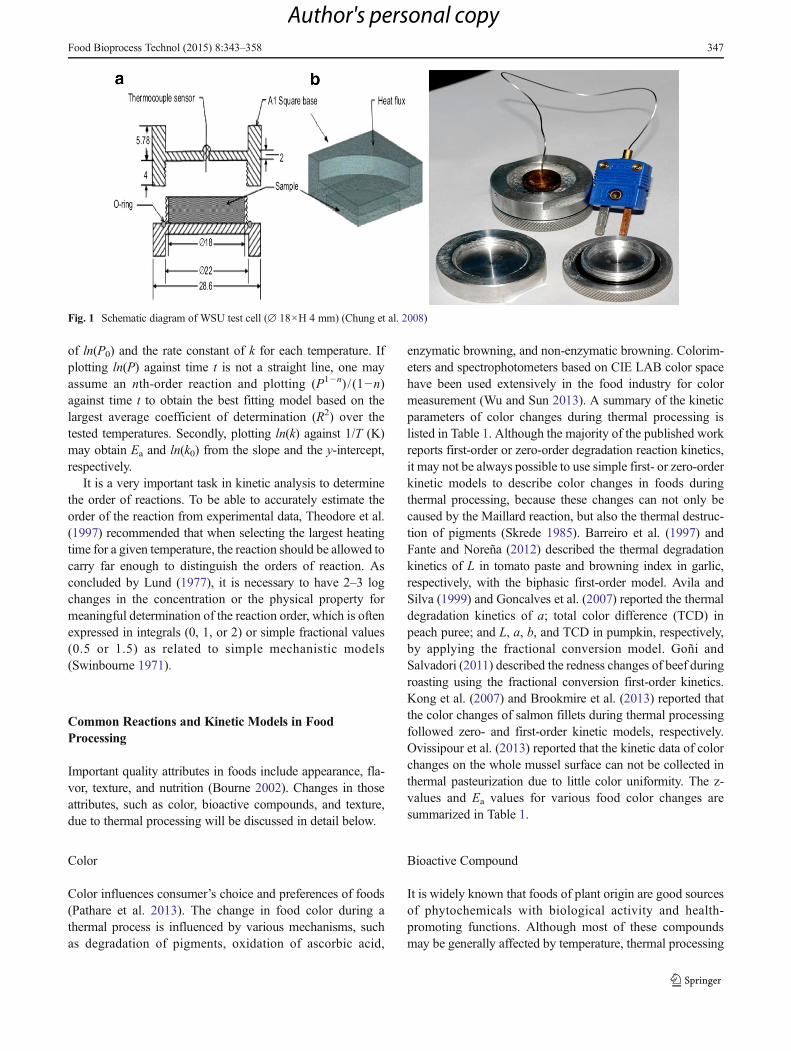
Hermetically sealed test cells are suitable for thermal ki-netic test of liquid, semi-solid, and solid foods beyond 100 °C.A custom-designed thermal kinetic test (TKT) cell developedat theWashington State University is shown in Fig. 1. This testcell, made from two pieces of aluminum alloy lids with arubber o-ring on the top lid, can provide adequate strength andhermetic seal when a food sample is heated at temperatures upto 130 °C. A precalibrated type-T thermocouple is insertedthrough a rubber gland in the top lid to record the temperature-time history of the sample core using a data logger. Because ofthe high aspect ratios (diameter/height) and the high thermalconductivity (180Wm−1 K−1) of aluminum alloy, the come-uptime (CUT: the time needed for the geometric center of asample temperature to reach 0.5 °C less than the set temper-ature) of this test cell is small (e.g., less than 60 s), resulting ina close-to-ideal isothermal condition (Chung et al. 2008).Moreover, the aluminum alloy has a good corrosionresistance and machinability, so the test cell can beprocessed into different sizes used in kinetic studies for avariety of foods. For example, Nayak et al. (2011) use theTKT cells (∅ 20 mm×H 4.5 mm) to evaluate the thermalkinetic parameters of purified anthocyanins from purple pota-to over 100∼150 °C and determine the antioxidant potenciesof degradation products from the anthocyanins. Kong et al.(2008) used a TKTcell (∅ 30mm×H 6mm) to investigate thekinetics parameters of salmon fillets quality included cookloss, area shrinkage, and deteriorations of color and texturein the high temperature range of 100∼131 °C.
To minimize the influence of slow heat transfer and obtainaccurate determination of a quality’s thermal tolerance, lagtime (LT) and come-up time (CUT) for the target temperaturesare main concerns in design of experiments and analyses ofexperimental data (Chung et al. 2007, 2008; Gondo et al.1972; Jin et al. 2008). As a rule of thumb, if P/P0≥25 % whenLT or CUT ends for first-order reactions (Beck and Arnold1977), the heating time can be considered as zero at the end ofLT or CUT (Dolan 2003).
Kinetic data can be analyzed using one-step or two-stepregression. The one-step method is to regress all data non-linearly to acquire Ea, k, and n simultaneously. But, the con-fidence intervals for the parametersEa and k0 would be narrowdue to the increased number of degrees of freedom (VanBoekel 1996). The equation for the non-linear regression isobtained by combining Eqs. 1 and 6:
dP
dt¼ �k0P
ne−EaRT ð14Þ
The two-step method is commonly used due to its mathe-matical simplicity and intuitive appeal when plotted. For thefirst-order of reaction, plotting ln(P) against time t shouldresult in a straight line, with a negative slope when the sumof residual squares is minimized, resulting in the interception
346 Food Bioprocess Technol (2015) 8:343–358
Author's personal copy
of ln(P0) and the rate constant of k for each temperature. Ifplotting ln(P) against time t is not a straight line, one mayassume an nth-order reaction and plotting (P1−n) / (1−n)against time t to obtain the best fitting model based on thelargest average coefficient of determination (R2) over thetested temperatures. Secondly, plotting ln(k) against 1/T (K)may obtain Ea and ln(k0) from the slope and the y-intercept,respectively.
It is a very important task in kinetic analysis to determinethe order of reactions. To be able to accurately estimate theorder of the reaction from experimental data, Theodore et al.(1997) recommended that when selecting the largest heatingtime for a given temperature, the reaction should be allowed tocarry far enough to distinguish the orders of reaction. Asconcluded by Lund (1977), it is necessary to have 2–3 logchanges in the concentration or the physical property formeaningful determination of the reaction order, which is oftenexpressed in integrals (0, 1, or 2) or simple fractional values(0.5 or 1.5) as related to simple mechanistic models(Swinbourne 1971).
Common Reactions and Kinetic Models in FoodProcessing
Important quality attributes in foods include appearance, fla-vor, texture, and nutrition (Bourne 2002). Changes in thoseattributes, such as color, bioactive compounds, and texture,due to thermal processing will be discussed in detail below.
Color
Color influences consumer’s choice and preferences of foods(Pathare et al. 2013). The change in food color during athermal process is influenced by various mechanisms, suchas degradation of pigments, oxidation of ascorbic acid,
enzymatic browning, and non-enzymatic browning. Colorim-eters and spectrophotometers based on CIE LAB color spacehave been used extensively in the food industry for colormeasurement (Wu and Sun 2013). A summary of the kineticparameters of color changes during thermal processing islisted in Table 1. Although the majority of the published workreports first-order or zero-order degradation reaction kinetics,it may not be always possible to use simple first- or zero-orderkinetic models to describe color changes in foods duringthermal processing, because these changes can not only becaused by the Maillard reaction, but also the thermal destruc-tion of pigments (Skrede 1985). Barreiro et al. (1997) andFante and Noreña (2012) described the thermal degradationkinetics of L in tomato paste and browning index in garlic,respectively, with the biphasic first-order model. Avila andSilva (1999) and Goncalves et al. (2007) reported the thermaldegradation kinetics of a; total color difference (TCD) inpeach puree; and L, a, b, and TCD in pumpkin, respectively,by applying the fractional conversion model. Goñi andSalvadori (2011) described the redness changes of beef duringroasting using the fractional conversion first-order kinetics.Kong et al. (2007) and Brookmire et al. (2013) reported thatthe color changes of salmon fillets during thermal processingfollowed zero- and first-order kinetic models, respectively.Ovissipour et al. (2013) reported that the kinetic data of colorchanges on the whole mussel surface can not be collected inthermal pasteurization due to little color uniformity. The z-values and Ea values for various food color changes aresummarized in Table 1.
Bioactive Compound
It is widely known that foods of plant origin are good sourcesof phytochemicals with biological activity and health-promoting functions. Although most of these compoundsmay be generally affected by temperature, thermal processing
Fig. 1 Schematic diagram of WSU test cell (∅ 18×H 4 mm) (Chung et al. 2008)
Food Bioprocess Technol (2015) 8:343–358 347
Author's personal copy

Tab
le1
Publishedkinetic
parametersforthethermaldegradationof
colorof
differentp
roducts
Product
Heatin
gmethods
Color
parameter
Kineticmodel
Kineticparameters
Reference
k(m
in−1)
Ea(kJmol−1)
D(m
in)
z(°C)
Tomatopaste
Glass
vialsin
waterbath
LBiphasicfirsto
rder
7.7×10
−3T=85°C
(HLF)
48–
–Barreiroetal.(1997)
1.1×10
−3T=85°C
(HRF)
24–
–
aFirsto
rder
9.4×10
−3T=85°C
41245 T
=85°C
62.4a
b1.3×10
−3T=85°C
861,735 T
=85°C
29.8a
TCD
Zeroorder
0.2 T
=85°C
43–
–
Peachpuree
Glass
vialsin
oilb
ath
LFirsto
rder
2.9×10
−3T=122.5
°C107
794 T
=122.5
°C28.0a
AvilaandSilva(1999)
b4.0×10
−3T=122.5
°C109
576 T
=122.5
°C27.5a
aFractionalfirstorder
0.0 T
=122.5
°C106
––
TCD
8.5×10
−3T=122.5
°C119
––
Green
asparagus
Water
bath
aFirsto
rder
6.4×10
−3T=84°C
(Bud)
54350 T
=84°C
45.2a
Lau
etal.(2000)
6.8×10
−3T=84°C
(Butt)
55339 T
=84°C
44.4a
Mulberryfruitextract
Testtube
inwater
bath
BI
Zeroorder
6.7×10
−4T=90°C
pH=2.0
31–
–Su
hetal.(2003)
Orangejuice
Ohm
icheating
a×b
Firsto
rder
0.6 T
=90°C
804 T
=90°C
12.3
Vikram
etal.(2005)
Infrared
heating
0.6 T
=90°C
534 T
=90°C
18.4
Beefmuscle
Waterbath
aFractionalfirstorder
1.2×10
−3T=100°C
81–
–Goñiand
Salvadori(2011)
Pink
salm
on(O
ncorhynchusgorbuscha)
TKTcellin
oilb
ath
LZeroorder
1.2×10
−3T=121°C
88–
–Kongetal.(2007)
b3.8×10
−4T=121°C
74–
–
TCD
3.1×10
−3T=121°C
99–
–
Pumpkin
(Cucurbita
maximaL.)
Water
bath
LFractionalfirstorder
0.1 T
=85°C
120
––
Goncalves
etal.(2007)
a0.1 T
=85°C
118
––
b0.2 T
=85°C
111
––
TCD
0.1 T
=85°C
99–
–
Pineapplepuree
Glass
flaskin
oilb
ath
LFirsto
rder
2.1×10
−3T=110°C
129
1,097
T=110°C
21.7a
Chutin
trasriandNoomhorm
(2007)
b6.1×10
−3T=110°C
109
378 T
=110°C
25.7a
TCD
Zeroorder
12.9×10
−3T=110°C
94–
–
BI*
2.0×10
−3T=110°C
109
––
Cashewapples
Hermetically
sealed
test
cellin
oilb
ath
LFirsto
rder
1.9×10
−2T=140°C
98116 T
=140°C
33.0a
Lim
aetal.(2010)
Reconstitu
tedblackberry
juice
Hermetically
sealed
test
cellin
oilb
ath
BI
Firsto
rder
9.7×10
−2T=140°C
107
24T=140°C
30.5a
Jimenez
etal.(2010)
Seedless
guava
(Psidium
guajavaL.)
Water
bath
LFirsto
rder
9.0×10
−2T=85°C
123
26T=85°C
20.0a
Ganjlo
oetal.(2011)
a0.3
T=85°C
8810
T=85°C
27.7a
TCD
Zeroorder
6.6
T=85°C
113
––
Garlic
(Allium
sativum
L.)
Water
bath
BI**
Biphasicfirsto
rder
1.9 T
=80°C(H
LF)
67–
–FanteandNoreña(2012)
1.0×10
−2T=80°C(H
RF)
203
––
Betacyanins
from
redbeet
Pobeltubein
water
bath
TCD
Firsto
rder
3.2×10
−3T=70°C
35727 T
=70°C
63.6a
Fernandez-Lopez
etal.(2013)
HLFheatlabilefractio
n;HRFheatresistance
fractio
n;BIbrow
ning
index,A510/A
420;B
I*brow
ning
index,A420;B
I**[100(X−0
.31)]/0.172,X=(a+1.75L)/(5.645L+a−3
.012b)
aValue
estim
ated
byEq.11
or12
348 Food Bioprocess Technol (2015) 8:343–358
Author's personal copy

remains the most commonly used technology for inactivatingmicroorganisms and enzymes in food industry (Oms-Oliuet al. 2012). On the other hand, thermal treatments of indus-trial concerns had little adverse or even positive effects onthese active compounds. Czerwonka et al. (2014) reported thatthe process of roasting and grilling had little effect on thevitamin B12 content in the final product as compared to theraw meat. It is also reported that availability of active com-pounds may increase after thermal treatments, and thus, theindustrial process may enhance nutritional levels, such asincreases β-carotene content in the heated ivy gourd andamaranth (Sungpuag et al. 1999), which could be interestingto develop thermal release kinetics of active compounds.However, heat processing under extreme conditions maycause chemical or physical changes and reduce the contentor bioavailability of some bioactive compounds (Rawsonet al. 2011). Table 2 presents kinetic data for health-relatedcompounds and functions of foods in thermal processing.Similar to the color degradation, the first-order kinetic modelis commonly used to study the kinetics of changes in thesecompounds. Some data fit well to the classical first-ordermodels, but the second-order reaction model is well used forthe decay of thiamin of salmon during high temperaturethermal processes (Kong et al. 2007). Hadjal et al. (2013) alsoreported that a second-order model best fitted the thermaldegradation curves of lutein of blood orange juice over atemperature range of 45–90 °C. Harbourne et al. (2008)investigated thermal degradation of blackcurrant anthocya-nins in a model juice system over 4–140 °C. They suggestedpseudo-first-order reaction kinetics for anthocyanin degrada-tion. Zanoni et al. (2003) reported that the antioxidant activityof hydrophilic extract followed a pseudo-zero-order reactionduring thermal sterilization. The biphasic first-order and frac-tional conversion models are also found to be suitable forthermal degradation of health-related compounds and func-tions (Hiwilepo-van Hal et al. 2012; Jaiswal et al. 2012; Vieiraet al. 2000).
Texture
Texture can be characterized as a series of physical character-istics that arise from the composition and structure of the food,sensed by the feeling ofmouth or some other parts of the body.It measures forces required for certain levels of deformation,disintegration, or flow of the food (Bourne 2002). Compres-sion and puncture tests are the two most common methods tomeasure food texture properties. They are often conductedusing a texture analyzer or an Instron testing machine (Chenand Opara 2013). Hardness, springness, and firmness havebeen most used in quantifying kinetics of texture thermaldegradation, especially for firmness, which is best related tothe thermal softening of food of plant origin (Jaiswal et al.2012; Lau et al. 2000; Nisha et al. 2006). Limited information
is available on texture kenitics for food of animal origin.Ovissipour et al. (2013) reported that the compression forceof whole mussel during thermal pasteurization follows zero-order kinetic model. Kong et al. (2007) and Brookmire et al.(2013) reported that the shear force of salmon fillets duringthermal processing follows first-order kinetic model. Otherkinetic models, such as biphasic first-order model, fractionalconversion model, and Weibull-log-logistic model, also fitwell to the thermal degradation of texture (De Roeck et al.2010; Ko et al. 2007; Vu et al. 2004; Yu et al. 2011). Table 3summarizes kinetic modeling of texture changes of foodsduring thermal processing.
Special Kinetic Models
A majority of kinetic models used for food quality changesduring thermal processing employ simple and traditional zero-or first- and second-order kinetics. But, Hiwilepo-van Halet al. (2012) reported that a simple first-order model wasinadequate to describe the thermal degradation of vitamin Cin some tropical fruit because of the occurrence of biphasicbehaviors. Similar observations are about of the biphasicbehaviors in the texture degradation during thermal process-ing (Ko et al. 2007). Several alternative models have beenproposed to improve description of thermal degradations.Those models include the biphasic first-order kinetic modeland Weibull-log-logistic model, which will also be discussedin detail below.
The biphasic model is proposed by Liing and Lund (1978)to describe the inactivation thermal kinetics of an enzymesystem formed by heat labile and resistant fractions, both withfirst-order inactivation kinetics as follows:
P ¼ P01e‐ k1t þ P02e
‐ k2t ð15Þ
where indexes 1 and 2 are indicative quality properties for heatlabile and resistant fractions, respectively. When plotting thelogarithm of the quality property against time, a dual mecha-nism first-order kinetic model reveals a linear relationshipwith a steep slope for heat labile fractions followed by anotherlinear function with a shallow slope for heat-resistant frac-tions. The rate constant and activation energy are calculatedseparately for each mechanism. For example, Barreiro et al.(1997) suggested that several reactions leading to the colorchanges of foods can take place simultaneously. Those reac-tions can be parallel or sequential; their contributions to theoverall color changes vary, depending on the quality attributesin questions.
Instead of using an absolute measurement value toindicate quality changes, the concept of fractional conver-sion is commonly used in chemical engineering. It mea-sures the extent of a reaction as an indication of qualitychange (Hill 1977; Levenspiel 1999). When using the
Food Bioprocess Technol (2015) 8:343–358 349
Author's personal copy

Tab
le2
Publishedkinetic
parametersforthethermaldegradationof
health-related
compounds
andfunctio
nsof
differentp
roducts
Nutrient
Product
Heatin
gmethods
Kineticmodel
Kineticparameters
Reference
k(m
in−1)
Ea(kJmol−1)
D(m
in)
z(°C)
Vitamin
CCupuacu
nectar
TDTtubesin
water
bath
Fractio
nalfirstorder
3.2×10
−2T=80°C
(AA)
74–
–Vieiraetal.(2000)
Firsto
rder
1.3×10
−2T=80°C
(DHAA)
65177 T
=80°C
36.7a
Orangejuice
Ohm
icheating
Firsto
rder
1.6×10
−1T=90°C
4715
T=90°C
20.7
Vikram
etal.(2005)
Microwaveheating
5.0×10
−2T=100°C
6546
T=100°C
19.2
Water
bath
1.8×10
−1T=90°C
4013
T=100°C
24.4
Citrus
juice
Sealed
Pyrextubesin
oilb
ath
Firsto
rder
1.9×10
−3T=80°C
361,212 T
=80°C
64.0
Dhuique-M
ayer
etal.(2007)
Guava
pulp
Cappedsteeltubes
inheatingblock
Biphasicfirsto
rder
1.2×10
−1T=100°C
b58
––
Hiwilepo-van
Hal
etal.(2012)
5.3×10
−5T=100°C
c190
––
Thiam
inPinksalm
on(O
ncorhync
husgorbuscha)
TKTcellin
oilb
ath
Second-order
0.1
T=121°C
105
––
Kongetal.(2007)
Weibull
b(121°C
)=32.6
min−n
k=0.078(°C
−1)
Tc(°C)=
165
–
Folicacid
Folicacid
dissolving
insodium
borate
(0.05M,pH9.22)
Sealed
Pyrex
tubesin
water
bath
Firsto
rder
1.0×10
−3T=120°C
522,214 T
=120°C
–Nguyenetal.(2003)
Carotenoids
Citrus
juice
Sealed
Pyrextubesin
oilb
ath
Firsto
rder
5.3×10
−3T=90°C
β-carotene
110
435 T
=90°C
22.9a
Dhuique-M
ayer
etal.(2007)
Blood
orange
juice
Second
order
3.0×10
−3T=67.5
°Clutein
65–
–Hadjaletal.(2013)
Anthocyanin
Blackcurrantjuices
CappedPyrex
tubesin
water
bath
Pseudo-firstorder
3.5×10
−4T=60°C
73–
–Harbourne
etal.
(2008)
Raspberries
Testtubesin
oilb
ath
Firsto
rder
2.06
×10
−2T=110°C
cyanidin
3-sophoroside
75112 T
=110°C
37.4
Verbeystetal.(2011)
Reconstitu
ted
blackberry
juice
Hermetically
sealed
test
cellin
oilb
aths
5.4×10
−2T=120°C
9243
T=120°C
–Jimenez
etal.(2010)
1.2
T=160°C
442 T
=160°C
–
Purplepotato
TKTcellin
oilb
ath
7.1×10
−2T=120°C
7332
T=120°C
47.9
Nayak
etal.(2011)
Totalp
henolic
Cabbage
(Brassica
oleracea
capitata)
Water
bath
Fractio
nalfirstorder
4.2×10
−1T=90°C
12–
–Jaiswaletal.(2012)
Totalflavonoid
3.5×10
−1T=90°C
9–
–
Tomatopuree
Batch-sterilizationplant
Pseudo-zeroorder
1.9×10
−2T=95°C
149
––
Zanonietal.(2003)
Antioxidant
activ
ityMulberryfruitextract
Testtubesin
water
bath
Zeroorder
2.2×10
−2T=90°C
pH=2.0
82–
–Suh
etal.(2003)
0.38
T=90°C
pH=4.0
41–
–
Cabbage
(Brassica
oleracea
capitata)
Water
bath
Fractio
nalfirstorder
3.5×10
−1T=90°C
(DPPH)
22–
–Jaiswaletal.(2012)
3.0×10
−1T=90°C
(FRAP)
9–
–
AAascorbicacid;D
HAAdehydroascorbicacid;F
RAPferricreducing
ability
power;D
PPH2,2-diphenyl-1-picrylhydrazylfreeradicalscavengingcapacity
aValue
estim
ated
byEq.11
or12
bHeatlabile
fractio
nof
texture
cHeatresistancefractio
nof
texture
350 Food Bioprocess Technol (2015) 8:343–358
Author's personal copy
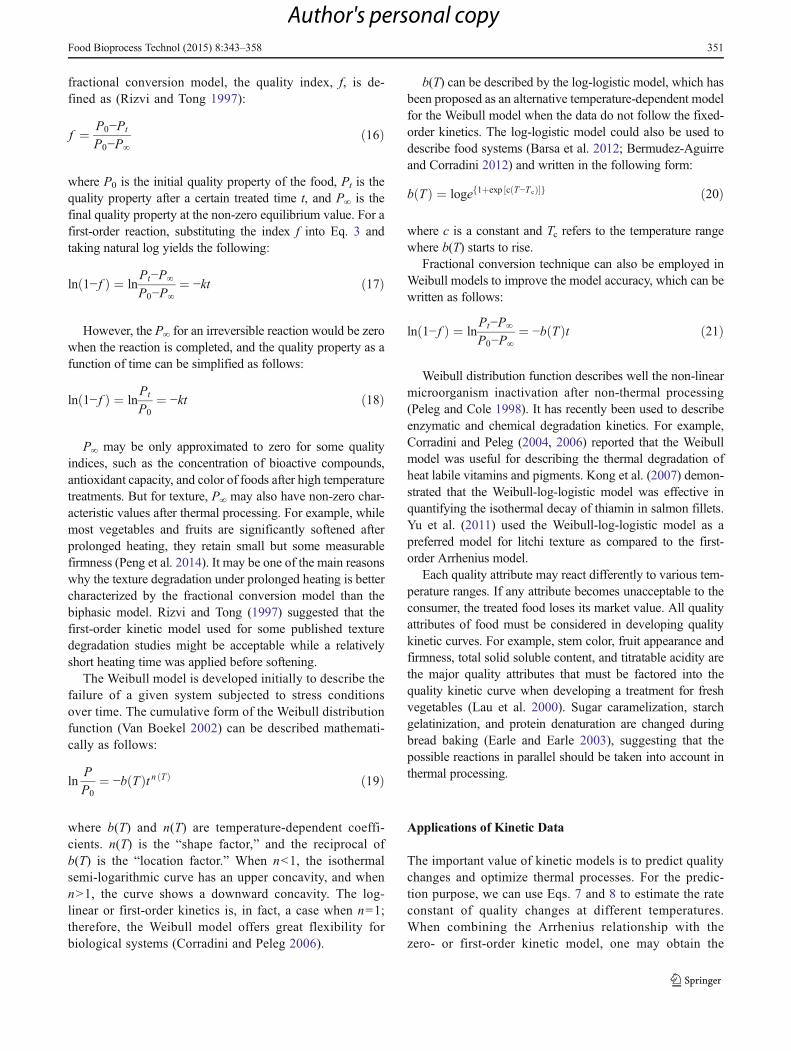
fractional conversion model, the quality index, f, is de-fined as (Rizvi and Tong 1997):
f ¼ P0−Pt
P0−P∞ð16Þ
where P0 is the initial quality property of the food, Pt is thequality property after a certain treated time t, and P∞ is thefinal quality property at the non-zero equilibrium value. For afirst-order reaction, substituting the index f into Eq. 3 andtaking natural log yields the following:
ln 1− fð Þ ¼ lnPt−P∞
P0−P∞¼ −kt ð17Þ
However, the P∞ for an irreversible reaction would be zerowhen the reaction is completed, and the quality property as afunction of time can be simplified as follows:
ln 1− fð Þ ¼ lnPt
P0¼ −kt ð18Þ
P∞ may be only approximated to zero for some qualityindices, such as the concentration of bioactive compounds,antioxidant capacity, and color of foods after high temperaturetreatments. But for texture, P∞ may also have non-zero char-acteristic values after thermal processing. For example, whilemost vegetables and fruits are significantly softened afterprolonged heating, they retain small but some measurablefirmness (Peng et al. 2014). It may be one of the main reasonswhy the texture degradation under prolonged heating is bettercharacterized by the fractional conversion model than thebiphasic model. Rizvi and Tong (1997) suggested that thefirst-order kinetic model used for some published texturedegradation studies might be acceptable while a relativelyshort heating time was applied before softening.
The Weibull model is developed initially to describe thefailure of a given system subjected to stress conditionsover time. The cumulative form of the Weibull distributionfunction (Van Boekel 2002) can be described mathemati-cally as follows:
lnP
P0¼ −b Tð Þt n Tð Þ ð19Þ
where b(T) and n(T) are temperature-dependent coeffi-cients. n(T) is the “shape factor,” and the reciprocal ofb(T) is the “location factor.” When n<1, the isothermalsemi-logarithmic curve has an upper concavity, and whenn>1, the curve shows a downward concavity. The log-linear or first-order kinetics is, in fact, a case when n=1;therefore, the Weibull model offers great flexibility forbiological systems (Corradini and Peleg 2006).
b(T) can be described by the log-logistic model, which hasbeen proposed as an alternative temperature-dependent modelfor the Weibull model when the data do not follow the fixed-order kinetics. The log-logistic model could also be used todescribe food systems (Barsa et al. 2012; Bermudez-Aguirreand Corradini 2012) and written in the following form:
b Tð Þ ¼ loge 1þexp c T−T cð Þ½ �f g ð20Þ
where c is a constant and Tc refers to the temperature rangewhere b(T) starts to rise.
Fractional conversion technique can also be employed inWeibull models to improve the model accuracy, which can bewritten as follows:
ln 1− fð Þ ¼ lnPt−P∞
P0−P∞¼ −b Tð Þt ð21Þ
Weibull distribution function describes well the non-linearmicroorganism inactivation after non-thermal processing(Peleg and Cole 1998). It has recently been used to describeenzymatic and chemical degradation kinetics. For example,Corradini and Peleg (2004, 2006) reported that the Weibullmodel was useful for describing the thermal degradation ofheat labile vitamins and pigments. Kong et al. (2007) demon-strated that the Weibull-log-logistic model was effective inquantifying the isothermal decay of thiamin in salmon fillets.Yu et al. (2011) used the Weibull-log-logistic model as apreferred model for litchi texture as compared to the first-order Arrhenius model.
Each quality attribute may react differently to various tem-perature ranges. If any attribute becomes unacceptable to theconsumer, the treated food loses its market value. All qualityattributes of food must be considered in developing qualitykinetic curves. For example, stem color, fruit appearance andfirmness, total solid soluble content, and titratable acidity arethe major quality attributes that must be factored into thequality kinetic curve when developing a treatment for freshvegetables (Lau et al. 2000). Sugar caramelization, starchgelatinization, and protein denaturation are changed duringbread baking (Earle and Earle 2003), suggesting that thepossible reactions in parallel should be taken into account inthermal processing.
Applications of Kinetic Data
The important value of kinetic models is to predict qualitychanges and optimize thermal processes. For the predic-tion purpose, we can use Eqs. 7 and 8 to estimate the rateconstant of quality changes at different temperatures.When combining the Arrhenius relationship with thezero- or first-order kinetic model, one may obtain the
Food Bioprocess Technol (2015) 8:343–358 351
Author's personal copy

Tab
le3
Publishedkinetic
parametersforthethermaldegradationof
textureof
differentp
roducts
Product
Heatin
gmethods
Textureparameter
Kineticmodel
Kineticparameters
Reference
k(m
in−1)
Ea(kJmol−1)
D(m
in)
z(°C)
Green
asparagus
Water
baths
Shearstress
Firstorder
1.6×10
−2T=84°C
(butt)
25143
99.6a
Lau
etal.(2000)
2.3×10
−2T=84°C
(middle)
25100
99.6a
2.7×10
−2T=84°C
(bud)
2485
104.0a
Carrots(D
aucus
carota
L.)
Water
bath
(≤95
°C)
andoilb
ath
(≥95
°C)
Hardness
Fractio
nalfirst
order
1.5×10
−1T=95°C
(with
outp
reheating)
118
––
Vuetal.(2004)
7.0×10
−2T=100°C
(preheating60
°C30
min)
99–
–
Potatocubes(Solanum
tuberosumL.)
Water
bath
The
forceresisting
theprobe
Firsto
rder
8.9×10
−2T=90°C
926
T=90°C
256.0a
Nisha
etal.(2006)
Green
gram
(Vigna
radiateL.)
3.3×10
−2T=90°C
770
T=90°C
338.0a
Pink
salm
onTKTcellin
oilb
ath
Shear
force
Firstorder
1.9×10
−2T=111°C
(rapid
tenderization)
100
121 T
=111°C
28.1a
Kongetal.(2007)
2.3×10
−3T=121°C
(slowtoughening)
761,001 T
=121°C
39.1a
Wholeblue
mussel
TKTcellin
oilb
ath
Com
pression
force
Zeroorder
2.6×10
−2T=90°C
65–
–Ovissipouretal.
(2013)
Pumpkin
(Cucurbita
maximaL.)
Water
bath
Firmness
Fractionalfirst
order
3.9×10
−1T=85°C
72–
–Goncalves
etal.
(2007)
Energy
1.8×10
−1T=85°C
102
––
Wintermushrooms
(Flammulinavelutip
es)
Water
bath
Hardness
Biphasicfirst
order
2.7×10
−1T=100°C
Capb
159 T
=100°C
Capb
0.1
Koetal.(2007)
1.4×10
−2T=100°C
Capc
10165 T
=100°C
Capc
0.2
Springiness
1.5×10
−1T=100°C
Capb
815
T=100°C
Capb
4.3
7.7 T
=100°C
Capc
160 T
=100°C
Capc
0.0
Fracturability
2.9×10
−1T=100°C
Stipesb
188 T
=100°C
Stipesb
0.1
7.4×10
−2T=100°C
Stipesc
2231
T=100°C
Stipesc
83.3
Carrot(Daucus
carota
var.Nerac)
Stainlesssteeltubes
inoilb
ath
Hardness
Fractio
nalfirst
order
3.0×10
−1T=100°C
152
––
DeRoeck
etal.
(2010)
Litchi
Water
bath
Firmness
Firstorder
5.4×10
−3T=90°C
59–
R2=0.920
Yuetal.(2011)
Fractio
nalfirstorder
1.5×10
−2T=90°C
80–
R2=0.996
Weibull-log-logistic
b(90
°C)=
2.7×10
−2min−n
k=0.26
(°C−1)
Tc(°C)=
105
R2=0.999
Fractio
nalW
eibull
b(90
°C)=
8.7×10
−3min−n
k=0.19
(°C−1)
Tc(°C)=
113
R2=0.999
Cabbage
(Brassica
oleracea
capitata)
Water
bath
Firmness
Firstorder
9×10
−2T=90°C
3426
T=90°C
74.6a
Jaiswaletal.(2012)
aValue
estim
ated
byEq.11
or12
bHeatlabile
fractio
nof
texture
cHeatresistancefractio
nof
texture
352 Food Bioprocess Technol (2015) 8:343–358
Author's personal copy

equations that directly relate quality properties to heatingtime at various temperatures:
Zero order under isotherm conditions : P ¼ P0−tk0e−Ea=RT
ð22Þ
Zero order under transient conditions : P ¼ P0−Z
0
t
k0e−Ea=RT tð Þdt
ð23Þ
First order under isotherm conditions : lnP
P0¼ −tk0e−Ea=RT
ð24Þ
First order under transient conditions : lnP
P0¼ −
Z
0
t
k0e−Ea=RT tð Þdt
ð25Þ
The activation energy is 63–126, 209–418, and 8–63 kJ/mole for a food quality loss, microbial inactivation, and en-zymatic reactions or oxidation reactions, respectively (Nelson2010). If we assume that the activation energy for food qualityloss and microbial inactivation is 90 and 300 kJ/mole, respec-tively, for a temperature increase of 20 °C to 121 °C(394.12 K), the change in reaction rates is estimated as followsusing the Arrhenius relationship (Eq. 7):
Quality loss : k141oC ¼ k121o C e90�1;000
8:314�394:12�414:12 141−121ð Þ
¼ 3:77� k121o C ð26Þ
Microbial inactivation : k141o C¼ k121oC e300�1;000
8:314�394:12�414:12 141−121ð Þ
¼ 83:2 � k121oCð27Þ
Thus, for 20 °C increase from 121 °C, the rate of qualityloss increases by 3.77 times, while the rate for microbialinactivation increases 83.2 times. When a thermal process isdesigned at 141 °C to deliver the same lethality to microor-ganism at 121 °C, the holding time can be reduced by a factorof 83.2, and the quality loss can be reduced by a factor of 83.2/3.77=22.1 during holding periods. Figure 2 illustrates thisdifference in temperature sensitivity between microbial con-trol and quality loss and demonstrates the advantage of high-temperature short-time heating (HTST) or ultra-high-temperature treatment (UHT).
Total quality loss and microbial or enzyme inactivation aredependent on the cumulative thermal exposure during thecourse of the non-isothermal treatment. From the z-valueand the time-temperature data recorded from the samplesduring heating, the cumulated lethal time model can be
established, and then, the sterilizing value (F0, min) and cookvalues (C, min) are calculated below (Hansen et al. 2004;Wang et al. 2003).
F0 ¼Z t
010
T−T refzM
h idt ð28Þ
where Tref is a reference temperature and commonly used at121.1 °C. F0 indicates the cumulative thermal effect on mi-crobial reduction in a thermal process. A z-value of 10 °C isused for Clostridium botulinum spores. F0 for commercialsterilization of canned foods ranges from 2 to 15 min, butmost commercial processes are designed for a F0 of less orequal to 6 min (Stumbo 1973; FDA 2000).
C ¼Z t
010
T−T refzQ
h idt ð29Þ
where zQ and Tref represent the z-value and reference temper-ature, respectively, for the most heat labile components. Gen-erally, the reference cook value is characterized by zQ=33.1 °C and Tref=100 °C. The cook value, C100, relates thequality loss during a high-temperature thermal process to anequivalent cooking process at 100 °C (Lund 1977).
From the temperature-time history (heat penetration pro-file), one can calculate heating time required to obtain a targetpasteurization unit (PU). Figure 3 illustrates a typicaltemperature-time history for RF heated meat products com-pared to the temperature-time profile for a steam-cookedsample heated at 80 °C. When the similar lethality to micro-organism is achieved both by steam (PU=3389) and RF (PU=3393) heating, a significant reduction in cooking time (110 vs.30 min) and quality loss (C100=6.445 vs. 1.582) could beachieved using steam heating compared with RF heating(Zhang et al. 2004). The similar results on F0 and C100 havebeen reported in RF-treated macaroni and cheese (Wang et al.
Fig. 2 The ultra-high-temperature treatment (UHT) region characterizedby temperature-time combinations
Food Bioprocess Technol (2015) 8:343–358 353
Author's personal copy
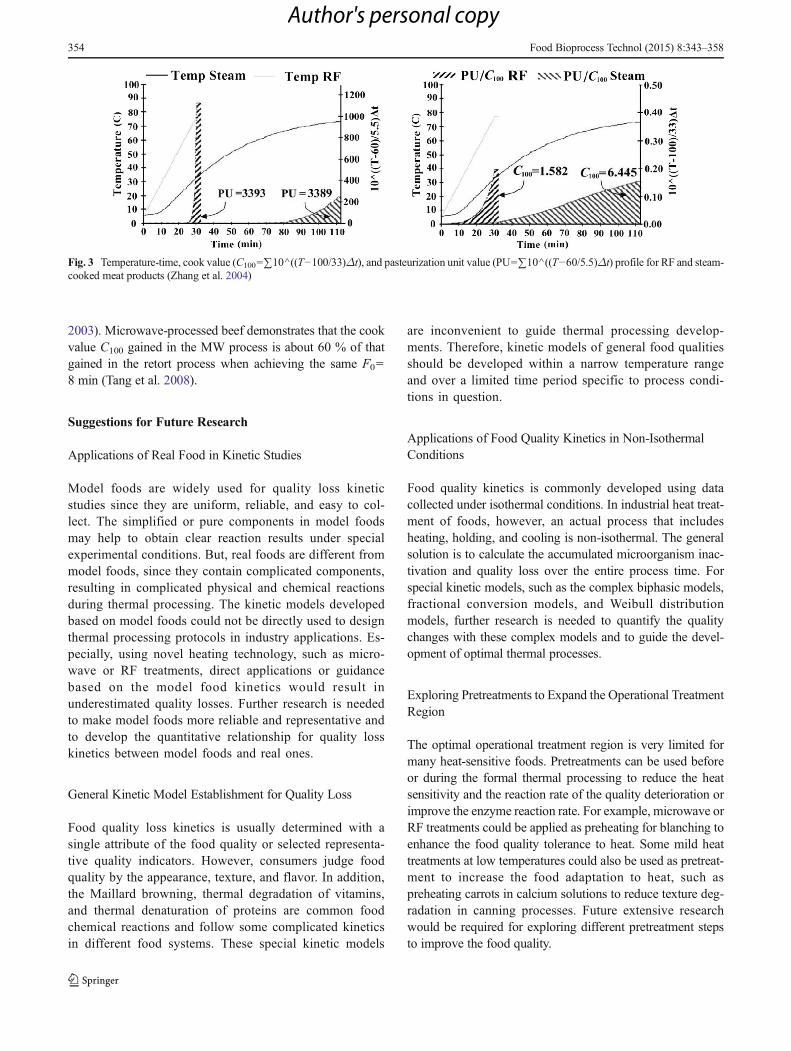
2003). Microwave-processed beef demonstrates that the cookvalue C100 gained in the MW process is about 60 % of thatgained in the retort process when achieving the same F0=8 min (Tang et al. 2008).
Suggestions for Future Research
Applications of Real Food in Kinetic Studies
Model foods are widely used for quality loss kineticstudies since they are uniform, reliable, and easy to col-lect. The simplified or pure components in model foodsmay help to obtain clear reaction results under specialexperimental conditions. But, real foods are different frommodel foods, since they contain complicated components,resulting in complicated physical and chemical reactionsduring thermal processing. The kinetic models developedbased on model foods could not be directly used to designthermal processing protocols in industry applications. Es-pecially, using novel heating technology, such as micro-wave or RF treatments, direct applications or guidancebased on the model food kinetics would result inunderestimated quality losses. Further research is neededto make model foods more reliable and representative andto develop the quantitative relationship for quality losskinetics between model foods and real ones.
General Kinetic Model Establishment for Quality Loss
Food quality loss kinetics is usually determined with asingle attribute of the food quality or selected representa-tive quality indicators. However, consumers judge foodquality by the appearance, texture, and flavor. In addition,the Maillard browning, thermal degradation of vitamins,and thermal denaturation of proteins are common foodchemical reactions and follow some complicated kineticsin different food systems. These special kinetic models
are inconvenient to guide thermal processing develop-ments. Therefore, kinetic models of general food qualitiesshould be developed within a narrow temperature rangeand over a limited time period specific to process condi-tions in question.
Applications of Food Quality Kinetics in Non-IsothermalConditions
Food quality kinetics is commonly developed using datacollected under isothermal conditions. In industrial heat treat-ment of foods, however, an actual process that includesheating, holding, and cooling is non-isothermal. The generalsolution is to calculate the accumulated microorganism inac-tivation and quality loss over the entire process time. Forspecial kinetic models, such as the complex biphasic models,fractional conversion models, and Weibull distributionmodels, further research is needed to quantify the qualitychanges with these complex models and to guide the devel-opment of optimal thermal processes.
Exploring Pretreatments to Expand the Operational TreatmentRegion
The optimal operational treatment region is very limited formany heat-sensitive foods. Pretreatments can be used beforeor during the formal thermal processing to reduce the heatsensitivity and the reaction rate of the quality deterioration orimprove the enzyme reaction rate. For example, microwave orRF treatments could be applied as preheating for blanching toenhance the food quality tolerance to heat. Some mild heattreatments at low temperatures could also be used as pretreat-ment to increase the food adaptation to heat, such aspreheating carrots in calcium solutions to reduce texture deg-radation in canning processes. Future extensive researchwould be required for exploring different pretreatment stepsto improve the food quality.
Fig. 3 Temperature-time, cook value (C100=∑10^((T−100/33)Δt), and pasteurization unit value (PU=∑10^((T−60/5.5)Δt) profile for RF and steam-cooked meat products (Zhang et al. 2004)
354 Food Bioprocess Technol (2015) 8:343–358
Author's personal copy

Applications of Non-linear Scientific Theories in FoodQuality Modeling
Since food processing, quality control, and component analy-sis are usually identified as non-linear and non-steady statesystems, traditional kinetic models may no longer be applica-ble to the actual situations. Artificial neural network (ANN)and fuzzy logic (fuzzy Logic) methods would be applied inquality kinetic studies for process optimization, control, andprediction. Applications of the above method are very limitedin food science fields, and the non-linear modeling may beable to provide more reliable predictions and control meansfor complex food quality changes during thermal processing.
Conclusions
This review has shown that the step functional temperatureprofile is required for food samples to achieve the isothermalconditions in conducting TKTs. Significant progresses havebeen made in developing quality loss kinetic models, fromcommonly used zero- and first-order reaction models to so-phisticated biphasic and Weibull ones. This study also dem-onstrates that using the kinetic models to estimate processsterilizing value and cook value based on the measuredtemperature-time history of the heated food leads to the con-clusions that HTST processes are able to reduce food qualitydegradation while achieving food safety. But, physical andchemical reactions for the complex chemical compositions offoods during thermal processing are complicated. Future re-searches should be focused on applying kinetic models to realfoods and non-isothermal conditions, optimizing food qualitymodeling using non-linear scientific theories, establishinggeneral kinetic model for quality loss, and exploring pretreat-ments to increase the operational treatment region.
Acknowledgments This research was supported by grants from Ph.D.Programs Foundation of Ministry of Education of China(20120204110022) and the general program of the National NaturalScience Foundation of China (No. 31371853).
References
Adams, J. (1991). Review: enzyme inactivation during heat processing offood-stuffs. International Journal of Food Science & Technology,26(1), 1–20.
Ahmed, J., Shivhare, U. S., & Ramaswamy, H. S. (2002). A fractionconversion kinetic model for thermal degradation of color in redchilli puree and paste. LWT—Food Science and Technology, 35(6),497–503.
Anthon, G. E., & Barrett, D. M. (2002). Kinetic parameters for thethermal inactivation of quality-related enzymes in carrots and
potatoes. Journal of Agricultural and Food Chemistry, 50(14),4119–4125.
Avila, I., & Silva, C. L. M. (1999). Modelling kinetics of thermaldegradation of colour in peach puree. Journal of FoodEngineering, 39(2), 161–166.
Awuah, G., Ramaswamy, H., & Economides, A. (2007). Thermal pro-cessing and quality: principles and overview. Chemical Engineeringand Processing: Process Intensification, 46(6), 584–602.
Barreiro, J. A., Milano, M., & Sandoval, A. J. (1997). Kinetics of colourchange of double concentrated tomato paste during thermal treat-ment. Journal of Food Engineering, 33(3–4), 359–371.
Barsa, C. S., Normand, M. D., & Peleg, M. (2012). On models of thetemperature effect on the rate of chemical reactions and biologicalprocesses in foods. Food Engineering Reviews, 4(4), 191–202.
Beck, J.V. & Arnold, K.J. (1977). Parameter estimation in engineeringand science. New York: John Wiley & Sons, 495pp.
Bermudez-Aguirre, D., & Corradini, M. G. (2012). Inactivation kineticsof Salmonella spp. under thermal and emerging treatments: a review.Food Research International, 45(2), 700–712.
Bourne, M. (2002). Food texture and viscosity: concept and measure-ment. Elsevier Science.
Breda, C. A., Sanjinez-Argandoña, E. J., & Correia, C. A. C. (2012).Shelf life of powdered Campomanesia adamantium pulp in con-trolled environments. Food Chemistry, 135(4), 2960–2964.
Brookmire, L., Mallikarjunan, P., Jahncke, M., & Grisso, R. (2013).Optimum cooking conditions for shrimp and Atlantic salmon.Journal of Food Science, 78(2), S303–S313.
Buransompob, A., Tang, J., Mao, R., & Swanson, B. G. (2003). Rancidityof walnuts and almonds affected by short time heat treatments forinsect control. Journal of Food Processing and Preservation, 27(6),445–464.
Chen, L., & Opara, U. L. (2013). Texture measurement approaches infresh and processed foods—a review. Food Research International,51(2), 823–835.
Chung, H., Wang, S., & Tang, J. (2007). Influence of heat transfer in testtubes on measured thermal inactivation parameters for Escherichiacoli. Journal of Food Protection, 70(4), 851–859.
Chung, H. J., Birla, S., & Tang, J. (2008). Performance evaluation ofaluminum test cell designed for determining the heat resistance ofbacterial spores in foods. LWT—Food Science and Technology,41(8), 1351–1359.
Chutintrasri, B., & Noomhorm, A. (2007). Color degradation kinetics ofpineapple puree during thermal processing. LWT—Food Scienceand Technology, 40(2), 300–306.
Corradini, M. G., & Peleg, M. (2004). A model of non-isothermaldegradation of nutrients, pigments and enzymes. Journal of theScience of Food and Agriculture, 84(3), 217–226.
Corradini, M. G., & Peleg, M. (2006). Prediction of vitamins loss duringnon-isothermal heat processes and storage with non-linear kineticmodels. Trends in Food Science & Technology, 17(1), 24–34.
Czerwonka, M., Szterk, A., & Waszkiewicz-Robak, B. (2014). VitaminB12 content in raw and cooked beef. Meat Science, 96(3), 1371–1375.
De Roeck, A., Mols, J., Duvetter, T., Van Loey, A., & Hendrickx, M.(2010). Carrot texture degradation kinetics and pectin changes dur-ing thermal versus high-pressure/high-temperature processing: acomparative study. Food Chemistry, 120(4), 1104–1112.
Dhuique-Mayer, C., Tbatou, M., Carail, M., Caris-Veyrat, C., Dornier,M., & Amiot, M. J. (2007). Thermal degradation of antioxidantmicronutrients in citrus juice: kinetics and newly formed com-pounds. Journal of Agricultural and Food Chemistry, 55(10),4209–4216.
Dolan, K. D. (2003). Estimation of kinetic parameters for nonisothermalfood processes. Journal of Food Science, 68(3), 728–741.
Earle, R. L., & Earle, M. D. (2003). Fundamentals of food reactiontechnology. Surrey: Leatherhead Food International Limited. 187pp.
Food Bioprocess Technol (2015) 8:343–358 355
Author's personal copy

Fante, L., & Noreña, C. P. Z. (2012). Enzyme inactivation kinetics andcolour changes in Garlic (Allium sativum L.) blanched under differ-ent conditions. Journal of Food Engineering, 108(3), 436–443.
FDA (2000). Kinetics of microbial inactivation for alternative food pro-c e s s i n g t e c h n o l o g i e s . h t t p : / /www. f d a . g o v / F o o d /FoodScienceResearch/SafePracticesforFoodProcesses/ucm100158.htm. Last accessed on May 2, 2014.
Fellows, P.J. (2009). Food processing technology: principles and practice,Third Edition. Boca Raton: CRC Press, 895pp.
Fernandez-Lopez, J. A., Angosto, J. M., Gimenez, P. J., & Leon, G.(2013). Thermal stability of selected natural red extracts used asfood colorants. Plant Foods for Human Nutrition, 68(1), 11–17.
Fu, B., & Labuza, T. P. (1993). Shelf-life prediction: theory and applica-tion. Food Control, 4(3), 125–133.
Fujikawa, H., & Itoh, T. (1998). Thermal inactivation analysis ofmesophiles using the Arrhenius and z-value models. Journal ofFood Protection, 61(7), 910–912.
Ganjloo, A., Rahman, R. A., Osman, A., Bakar, J., & Bimakr, M. (2011).Kinetics of crude peroxidase inactivation and color changes ofthermally treated seedless guava (Psidium guajava L.). Food andBioprocess Technology, 4(8), 1442–1449.
Gao, M., Tang, J., Wang, Y., Powers, J., & Wang, S. (2010). Almondquality as influenced by radio frequency heat treatments for disin-festation. Postharvest Biology and Technology, 58(3), 225–231.
Goncalves, E. M., Pinheiro, J., Abreu, M., Brandao, T. R. S., &Silva, C. L. M. (2007). Modelling the kinetics of peroxidaseinactivation, colour and texture changes of pumpkin (Cucurbitamaxima L.) during blanching. Journal of Food Engineering,81(4), 693–701.
Gondo, S., Sato, R., & Kusunoki, K. (1972). Iterative method ofcorrecting the effect of temperature changes on evaluating the rateconstant of the first order chemical reaction. Chemical EngineeringScience, 27, 1609–1611.
Goñi, S. M., & Salvadori, V. O. (2011). Kinetic modelling of colourchanges during beef roasting. Procedia Food Science, 1, 1039–1044.
Hadjal, T., Dhuique-Mayer, C., Madani, K., Dornier, M., & Achir, N.(2013). Thermal degradation kinetics of xanthophylls from bloodorange in model and real food systems. Food Chemistry, 138(4),2442–2450.
Haefner, J.W. (2005). Modeling biological systems: principles and appli-cations. New York: Springer, 463pp.
Hansen, J. D., Wang, S., & Tang, J. (2004). A cumulated lethal timemodel to evaluate efficacy of heat treatments for codlingmothCydiapomonella (L.) (Lepidoptera: Tortricidae) in cherries. PostharvestBiology and Technology, 33(3), 309–317.
Harbourne, N., Jacquier, J. C., Morgan, D. J., & Lyng, J. G. (2008).Determination of the degradation kinetics of anthocyanins in amodel juice system using isothermal and non-isothermal methods.Food Chemistry, 111(1), 204–208.
Hill, C.G. (1977). An introduction to chemical engineering kinetics &reactor design. New York: John Wiley & Sons, 584pp.
Hindra, F., & Baik, O. D. (2006). Kinetics of quality changes during foodfrying. Critical Reviews in Food Science and Nutrition, 46(3), 239–258.
Hiwilepo-van Hal, P., Bosschaart, C., van Twisk, C., Verkerk, R., &Dekker, M. (2012). Kinetics of thermal degradation of vitamin Cin marula fruit (Sclerocarya birrea subsp. caffra) as compared toother selected tropical fruits. LWT–Food Science and Technology,49(2), 188–191.
Holdsworth, D. & Simpson, R. (2008). Thermal processing of packagedfoods. London: Blackie Academic and Professional, 427 pp.
IFT (2003). Kinetic models for microbial survival during process-ing. ht tp: / /www.i f t .org/Knowledge-Center /Read-IFT-Publications/Science-Reports/Research-Summits/Kinetic-Models.aspx. Last accessed on June 20, 2014.
Jaiswal, A. K., Gupta, S., & Abu-Ghannam, N. (2012). Kinetic evaluationof colour, texture, polyphenols and antioxidant capacity of Irish Yorkcabbage after blanching treatment. Food Chemistry, 131(1), 63–72.
Jimenez, N., Bohuon, P., Lima, J., Dornier, M., Vaillant, F., & Perez, M.(2010). Kinetics of anthocyanin degradation and browning inreconstituted blackberry juice treated at high temperatures (100–180 degrees C). Journal of Agricultural and Food Chemistry,58(4), 2314–2322.
Jin, T., Zhang, H., Boyd, G., & Tang, J. M. (2008). Thermal resistance ofSalmonella enteritidis and Escherichia coli K12 in liquid egg deter-mined by thermal-death-time disks. Journal of Food Engineering,84(4), 608–614.
Jonsson, U., Snygg, B. G., HäNulv, B. G., & Zachrisson, T. (1977).Testing two models for the temperature dependence of the heatinactivation rate of Bacillus stearothermophilus spores. Journal ofFood Science, 42(5), 1251–1252.
Kechinski, C. P., Guimaraes, P. V. R., Norena, C. P. Z., Tessaro, I. C., &Marczak, L. D. F. (2010). Degradation kinetics of anthocyanin inblueberry juice during thermal treatment. Journal of Food Science,75(2), C173–C176.
Knights, M. (2013). Microwave sterilization for packaged meals. FoodEngineering, 10, 159–160.
Ko, W. C., Liu, W. C., Tsang, Y. T., & Hsieh, C. W. (2007). Kinetics ofwinter mushrooms (Flammulina velutipes) microstructure and qual-ity changes during thermal processing. Journal of FoodEngineering, 81(3), 587–598.
Kong, F. B., Tang, J. M., Rasco, B., & Crapo, C. (2007). Kinetics ofsalmon quality changes during thermal processing. Journal of FoodEngineering, 83(4), 510–520.
Kong, F., Tang, J., Lin, M., & Rasco, B. (2008). Thermal effects onchicken and salmon muscles: tenderness, cook loss, area shrinkage,collagen solubility and microstructure. LWT - Food Science andTechnology, 41, 1210–1222.
Labuza, T. P. (1984). Application of chemical kinetics to deterioration offoods. Journal of Chemical Education, 61(4), 348.
Lau, M. H., Tang, J., & Swanson, B. G. (2000). Kinetics of textural andcolor changes in green asparagus during thermal treatments. Journalof Food Engineering, 45(4), 231–236.
Lemmens, L., Colle, I. J. P., Van Buggenhout, S., Van Loey, A. M., &Hendrickx, M. E. (2011). Quantifying the influence of thermalprocess parameters on in vitro beta-carotene bioaccessibility: a casestudy on carrots. Journal of Agricultural and Food Chemistry,59(7), 3162–3167.
Levenspiel, O. (1999). Chemical reaction engineering. New York: JohnWiley & Sons, 665pp.
Liaotrakoon, W., Clercq, N., Hoed, V., Walle, D., Lewille, B., &Dewettinck, K. (2013). Impact of thermal teatment on physicochem-ical, antioxidative and rheological properties of white-flesh and red-flesh dragon fruit (Hylocereus spp.) purees. Food and BioprocessTechnology, 6(2), 416–430.
Liing, A. C., & Lund, D. B. (1978). Determining kinetic parameters forthermal inactivation of heat resistant and heat-labile isozymes fromthermal destruction curves. Journal of Food Science, 43(4), 1307–1310.
Lima, J. R., Elizondo, N. J., & Bohuon, P. (2010). Kinetics of ascorbicacid degradation and colour change in ground cashew apples treatedat high temperatures (100–180°C). International Journal of FoodScience & Technology, 45(8), 1724–1731.
Liu, Y., Tang, J., Mao, Z.,Mah, J.-H., Jiao, S., &Wang, S. (2011). Qualityand mold control of enriched white bread by combined radio fre-quency and hot air treatment. Journal of Food Engineering, 104(4),492–498.
Lund, D. B. (1977). Design of thermal processes for minimizing nutrientretention. Food Technology, 71–78.
Marra, F., Zhang, L., & Lyng, J. G. (2009). Radio frequency treatment offoods: review of recent advances. Journal of Food Engineering,91(4), 497–508.
356 Food Bioprocess Technol (2015) 8:343–358
Author's personal copy
Nayak, B., Berrios, J. D. J., Powers, J. R., & Tang, J. M. (2011). Thermaldegradation of anthocyanins from purple potato (cv.PurpleMajesty)and impact on antioxidant capacity. Journal of Agricultural andFood Chemistry, 59(20), 11040–11049.
Nelson, P.E. (2010). Principles of aseptic processing and packaging.Purdue University Press.
Nguyen, M. T., Indrawati, & Hendrickx, M. (2003). Model studies on thestability of folic acid and 5-methyltetrahydrofolic acid degradationduring thermal treatment in combination with high hydrostatic pres-sure. Journal of Agricultural and Food Chemistry, 51(11), 3352–3357.
Nisha, P., Singhal, R. S., & Pandit, A. B. (2006). Kinetic modelling oftexture development in potato cubes (Solanum tuberosum L.), greengram whole (Vigna radiate L.) and red gram splits (Cajanus cajanL.). Journal of Food Engineering, 76(4), 524–530.
Nisha, P., Singhal, R., & Pandit, A. (2011). Kinetic modelling of colourdegradation in tomato puree (Lycopersicon esculentum L.). Foodand Bioprocess Technology, 4(5), 781–787.
Oms-Oliu, G., Odriozola-Serrano, I., Soliva-Fortuny, R., Elez-Martínez,P., & Martín-Belloso, O. (2012). Stability of health-related com-pounds in plant foods through the application of non thermal pro-cesses. Trends in Food Science & Technology, 23(2), 111–123.
Ovissipour, M., Rasco, B., Tang, J., & Sablani, S. S. (2013).Kinetics of quality changes in whole blue mussel (Mytilusedulis) during pasteurization. Food Research International,53(1), 141–148.
Pathare, P. B., Opara, U. L., &Al-Said, F. A. (2013). Colour measurementand analysis in fresh and processed foods: a review. Food andBioprocess Technology, 6(1), 36–60.
Peleg, M., & Cole, M. B. (1998). Reinterpretation of microbial survivalcurves. Critical Reviews in Food Science, 38(5), 353–380.
Peleg, M., Normand, M. D., & Corradini, M. G. (2012). The Arrheniusequation revisited. Critical Reviews in Food Science and Nutrition,52(9), 830–851.
Peng, J., Tang, J., Barrett, D. M., Sablani, S. S., & Powers, J. R. (2014).Kinetics of carrot texture degradation under pasteurization condi-tions. Journal of Food Engineering, 122, 84–91.
Pereira, R., Martins, R., & Vicente, A. (2008). Goat milk free fatty acidcharacterization during conventional and ohmic heating pasteuriza-tion. Journal of Dairy Science, 91(8), 2925–2937.
Ramaswamy, H., Fvd, V., & Ghazala, S. (1989). An analysis of TDT andArrhenius methods for handling process and kinetic data. Journal ofFood Science, 54(5), 1322–1326.
Rawson, A., Patras, A., Tiwari, B. K., Noci, F., Koutchma, T., & Brunton,N. (2011). Effect of thermal and non thermal processing technolo-gies on the bioactive content of exotic fruits and their products:review of recent advances. Food Research International, 44(7),1875–1887.
Riva, M., & Torri, L. (2009). Pineapple shelf life evaluation using anelectronic nose. Italian Journal of Food Science, 21, 242–246.
Rizvi, A. F., & Tong, C. H. (1997). Fractional conversion for determiningtexture degradation kinetics of vegetables. Journal of Food Science,62(1), 1–7.
Rudra, S. G., Sarkar, B. C., & Shivhare, U. S. (2008). Thermal degrada-tion kinetics of chlorophyll in pureed coriander leaves. Food andBioprocess Technology, 1(1), 91–99.
Saguy, I., Kopelman, I. J., & Mizrahi, S. (1978). Simulation of ascorbicacid stability during heat processing and concentration of grapefruitjuice. Journal of Food Process Engineering, 2(3), 213–225.
Simpson, R. (2010). Engineering aspects of thermal food processing.Boca Raton: CRC Press, 522 pp.
Skrede, G. (1985). Color quality of blackcurrant syrups during storageevaluated by hunter L', a', b'values. Journal of Food Science, 50(2),514–517.
Song, J. Y., An, G. H., & Kim, C. J. (2003). Color, texture, nutrientcontents, and sensory values of vegetable soybeans [Glycine max
(L.) Merrill] as affected by blanching. Food Chemistry, 83(1), 69–74.
Steinfeld, J.I., Francisco, J.S. &Hase,W.L. (1998). Chemical kinetics anddynamics. Upper Saddle River: Prentice Hall, 560pp.
Stoforos, N. G. (1995). Thermal process design. Food Control, 6(2), 81–94.
Stumbo, C.R. (1973) Thermobacteriology in food processing. NewYork:Academic Press, 327pp.
Suh, H. J., Noh, D. O., Kang, C. S., Kim, J. M., & Lee, S. W. (2003).Thermal kinetics of color degradation of mulberry fruit extract.Food / Nahrung, 47(2), 132–135.
Sungpuag, P., Tangchitpianvit, S., Chittchang, U., & Wasantwisut, E.(1999). Retinol and beta carotene content of indigenous raw andhome-prepared foods in Northeast Thailand.Food Chemistry, 64(2),163–167.
Swinbourne, E.S. (1971) Analysis of kinetic data. London: Nelson,125pp.
Tang, J., Feng, H., & Lau, M. (2002). Microwave heating in food process-ing. In X. Young & J. Tang (Eds.), Advances in bioprocessingengineering (pp. 1–43). New Jersey: World Scientific Publisher.
Tang, Z., Mikhaylenko, G., Liu, F., Mah, J. H., Tang, J., Pandit, R., &Younce, F. (2008). Microwave sterilization of sliced beef in gravy in7-Oz trays. Journal of Food Engineering, 89(4), 375–383.
Theodore, L., Saguy, I.S. & Petros, T. (1997). Kinetics of food deteriora-tion and shelf-life prediction. In: Handbook of food engineeringpractice. New York: CRC Press.
Van Boekel, M. A. J. S. (1996). Statistical aspects of kinetic model-ing for food science problems. Journal of Food Science, 61(3),477–486.
Van Boekel, M. A. J. S. (2002). On the use of the Weibull model todescribe thermal inactivation of microbial vegetative cells.International Journal of Food Microbiology, 74(1–2), 139–159.
Van Boekel, M. A. J. S. (2008). Kinetic modeling of food quality: acritical review. Comprehensive Reviews in Food Science and FoodSafety, 7(1), 144–158.
Van Loey, A., Fransis, A., Hendrickx, M., Maesmans, G., & Tobback, P.(1995). Kinetics of quality changes of green peas and white beansduring thermal processing. Journal of Food Engineering, 24(3),361–377.
Verbeyst, L., Oey, I., Van der Plancken, I., Hendrickx, M., & VanLoey, A. (2010). Kinetic study on the thermal and pressuredegradation of anthocyanins in strawberries. Food Chemistry,123(2), 269–274.
Verbeyst, L., Van Crombruggen, K., Van der Plancken, I., Hendrickx, M.,& Van Loey, A. (2011). Anthocyanin degradation kinetics duringthermal and high pressure treatments of raspberries. Journal of FoodEngineering, 105(3), 513–521.
Vieira, M. C., Teixeira, A. A., & Silva, C. L. M. (2000). Mathematicalmodeling of the thermal degradation kinetics of vitamin C incupuaçu (Theobroma grandiflorum) nectar. Journal of FoodEngineering, 43(1), 1–7.
Vikram, V. B., Ramesh, M. N., & Prapulla, S. G. (2005). Thermaldegradation kinetics of nutrients in orange juice heated by electro-magnetic and conventional methods. Journal of Food Engineering,69(1), 31–40.
Vu, T. S., Smout, C., Sila, D. N., LyNguyen, B., Van Loey, A. M. L., &Hendrickx, M. E. G. (2004). Effect of preheating on thermal degra-dation kinetics of carrot texture. Innovative Food Science &Emerging Technologies, 5(1), 37–44.
Wang, Y., Wig, T., Tang, J., & Hallberg, L. (2003). Sterilization offoodstuffs using radio frequency heating. Journal of Food Science,68(2), 539–544.
Wang, S., Tang, J., Sun, T., Mitcham, E. J., Koral, T., & Birla, S. L.(2006). Considerations in design of commercial radio frequencytreatments for postharvest pest control in in-shell walnuts. Journalof Food Engineering, 77(2), 304–312.
Food Bioprocess Technol (2015) 8:343–358 357
Author's personal copy

Wang, J., Luechapattanaporn, K., Wang, Y., & Tang, J. (2012). Radio-frequency heating of heterogeneous food—meat lasagna. Journal ofFood Engineering, 108(1), 183–193.
Wedzicha, B. L., Goddard, S. J., & Zeb, A. (1993). Approach to thedesign of model systems for food additive-food component interac-tions. Food Chemistry, 47(2), 129–132.
Wen, T. N., Prasad, K. N., Yang, B., & Ismail, A. (2010). Bioactivesubstance contents and antioxidant capacity of raw and blanchedvegetables. Innovative Food Science & Emerging Technologies,11(3), 464–469.
Wu, D., & Sun, D.-W. (2013). Colour measurements by computer visionfor food quality control—a review. Trends in Food Science &Technology, 29(1), 5–20.
Yoon, Y., Cho, W. J., Park, J. G., Park, J. N., Song, B. S., Kim, J. H.,Byun, M.W., Kim, C. J., Sharma, A. K., & Lee, J. W. (2009). Effectof gamma irradiation on shelf-life extension and sensory
characteristics of Dak-galbi (marinated diced chicken) during accel-erated storage. Korean Journal for Food Science of AnimalResource, 29(5), 573–578.
Yu, K., Wu, Y., Hu, Z., Cui, S., & Yu, X. (2011). Modeling thermaldegradation of litchi texture: comparison of WeLL model and con-ventional methods. Food Research International, 44(7), 1970–1976.
Zabbia, A., Buys, E. M., & De Kock, H. L. (2011). Undesirable sulphurand carbonyl flavor compounds in UHT milk: a review. CriticalReviews in Food Science and Nutrition, 52(1), 21–30.
Zanoni, B., Pagliarini, E., Giovanelli, G., & Lavelli, V. (2003). Modellingthe effects of thermal sterilization on the quality of tomato puree.Journal of Food Engineering, 56(2–3), 203–206.
Zhang, L., Lyng, J. G., & Brunton, N. P. (2004). Effect of radio frequencycooking on the texture, colour and sensory properties of a largediameter comminuted meat product.Meat Science, 68(2), 257–268.
358 Food Bioprocess Technol (2015) 8:343–358
Author's personal copy