kinematics physics of motion kinematics kinematics is the science of describing the motion of...
TRANSCRIPT
Kinematics
Physics of Motion


kinematics
• Kinematics is the science of describing the motion of objects using words, diagrams, numbers, graphs, and equations.
Speed
• How fast something moves
• Distance/time
• Miles PER hour
• Meters PER second
Fast Thinking
• 1. Which of the following represents a speed?
• a. 6 m• b. 4 hr/km sec• c. 2 m/sec2
• d. 8 m/sec
Velocity
• Speed plus a direction
• Example: 10 m/s heading north east
• 4 m/s heading vertically
Vector Quantities
• Properties that have magnitude (size) and direction
• Example: velocity
Scalar quantities
• Properties that only have magnitude
• Examples:
• Speed
• Temperature
definitions
• 1. A ________________ quantity is completely described by its magnitude.
• 2. A _________________ quantity has both magnitude and direction.
• 3. The velocity of an object at any given instant in time is known as the _________________ velocity.
• 4. The rate at which the velocity changes is known as the __________________.
Acceleration
• Rate of change of velocity
• Vector
• Can be + or –
• Speeding up or slowing down
• Slowing is – acceleration or deceleration
• (celer = latin for speed)
• m/s/s meters per second per second (m/s2)
Acceleration due to gravity (g)
• g = 9.8m/s/s
• You can round it up to 10 m/s/s
• In freefall, every second you are travelling 10m/s more than the previous second
On your marks…get set…go!
• 2. Which of the following represents an acceleration?
• a. 16 m2/sec2
• b. 4 hr/km sec• c. 8 km/hr• d. 2 m/s2
Displacement
• Defined as NET distance traveled.
• (you can walk to school 3miles, walk home 3miles…you have traveled 6 miles, but your displacement is zero
• Vector
• Compare to “distance” a scalar quantity
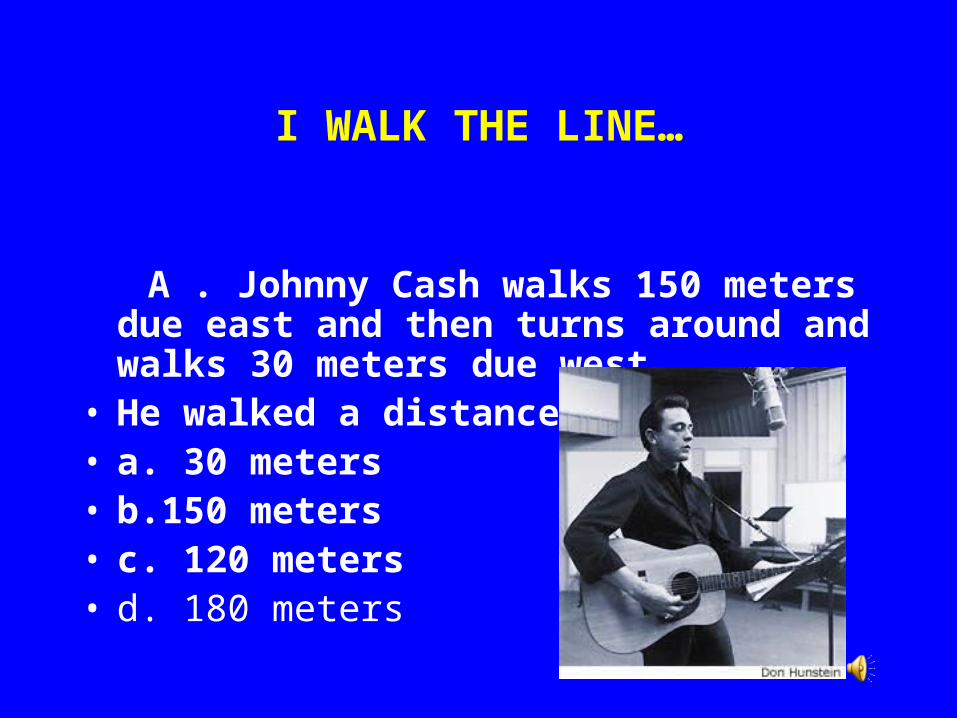
I WALK THE LINE…
A . Johnny Cash walks 150 meters due east and then turns around and walks 30 meters due west.
• He walked a distance of• a. 30 meters• b.150 meters• c. 120 meters• d. 180 meters
• B.• 4. Johnny’s displacement is• a. 30 meters east• b.150 meters east• c. 120 meters east• d. 180 meters west
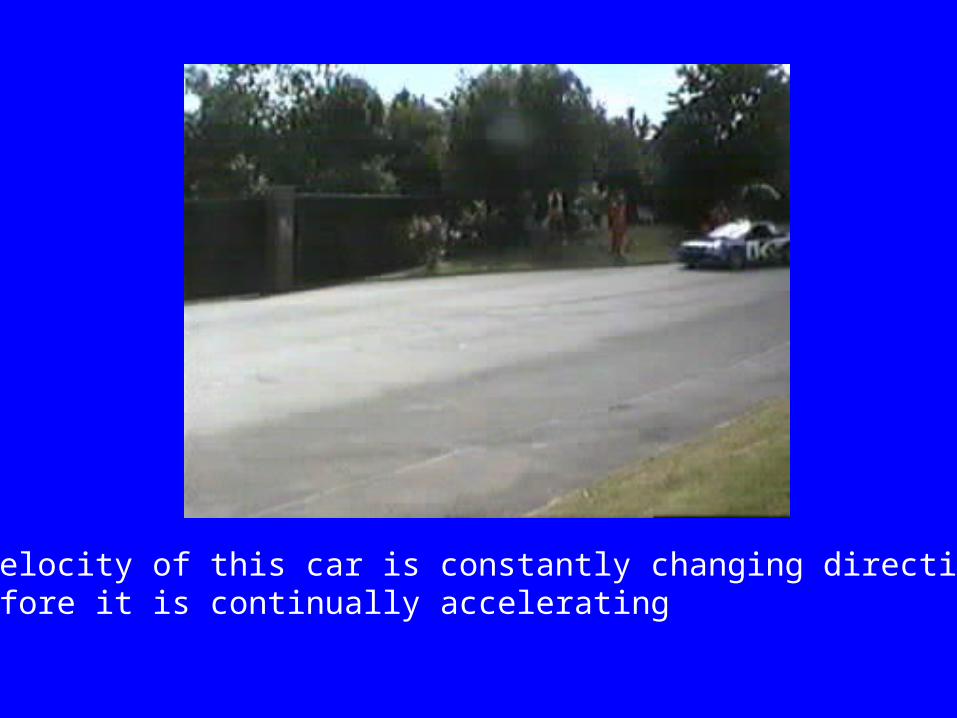
The velocity of this car is constantly changing direction…Therefore it is continually accelerating
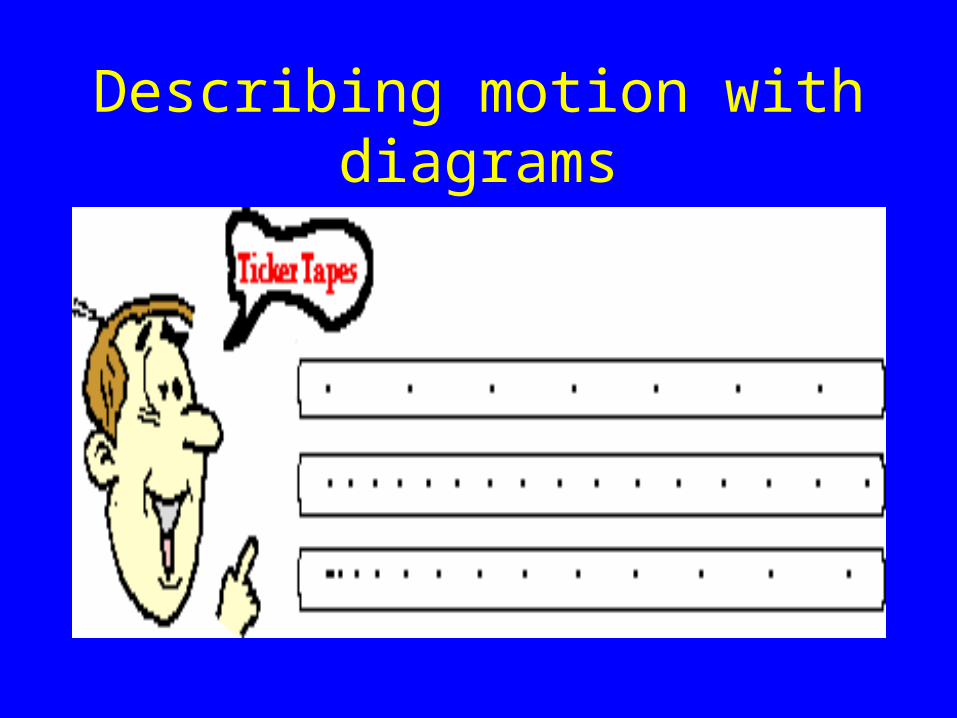
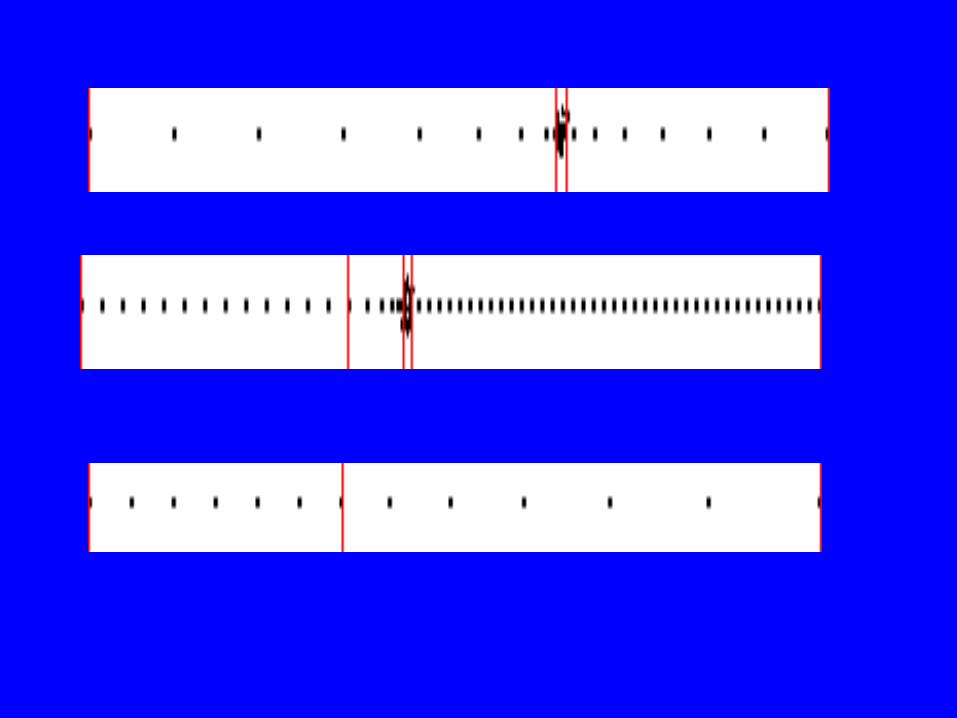
Describing motion with diagrams
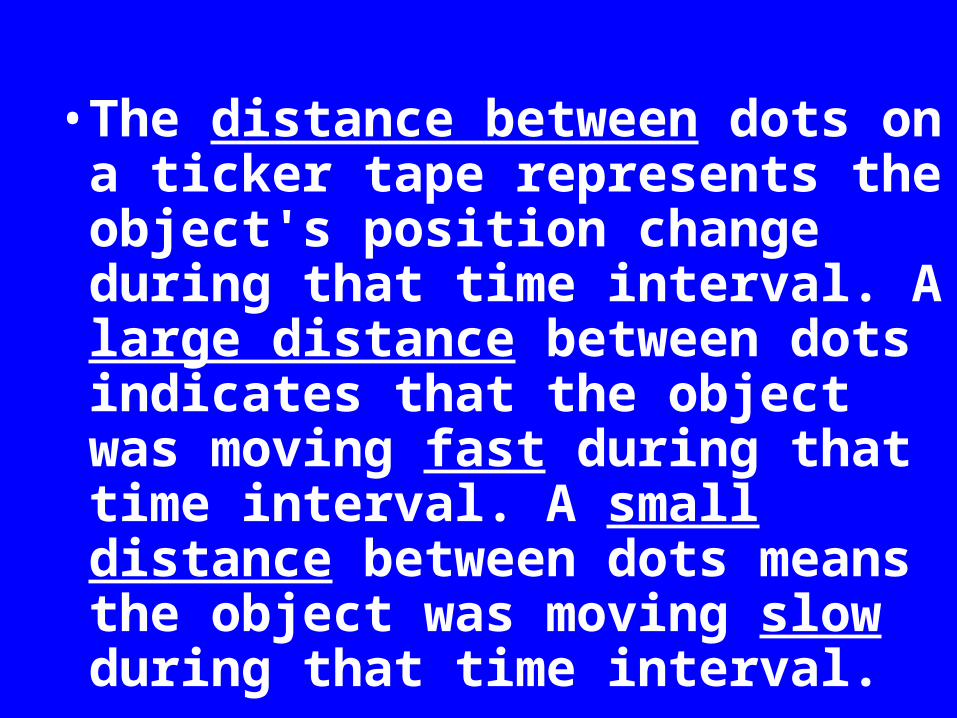
• The distance between dots on a ticker tape represents the object's position change during that time interval. A large distance between dots indicates that the object was moving fast during that time interval. A small distance between dots means the object was moving slow during that time interval.
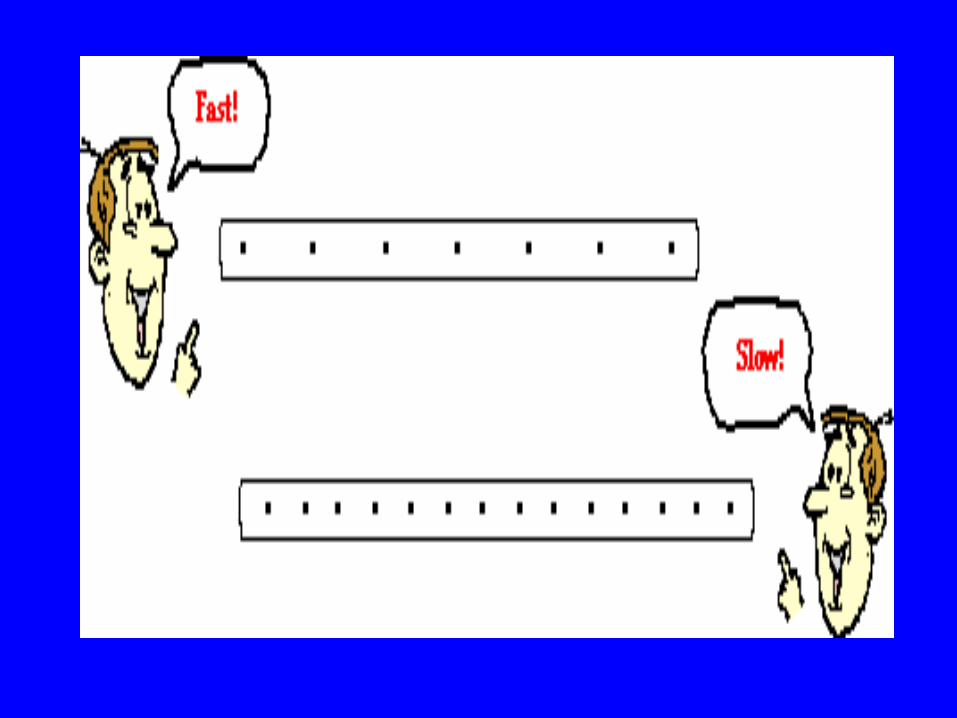
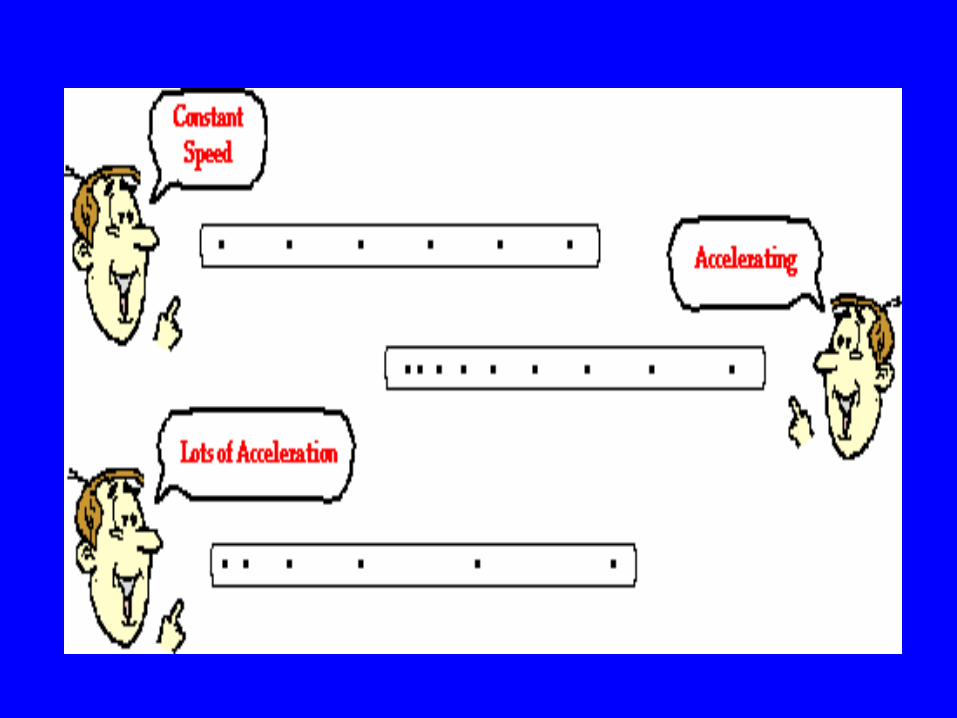

For the following tickertapes
• Describe the motion occuring
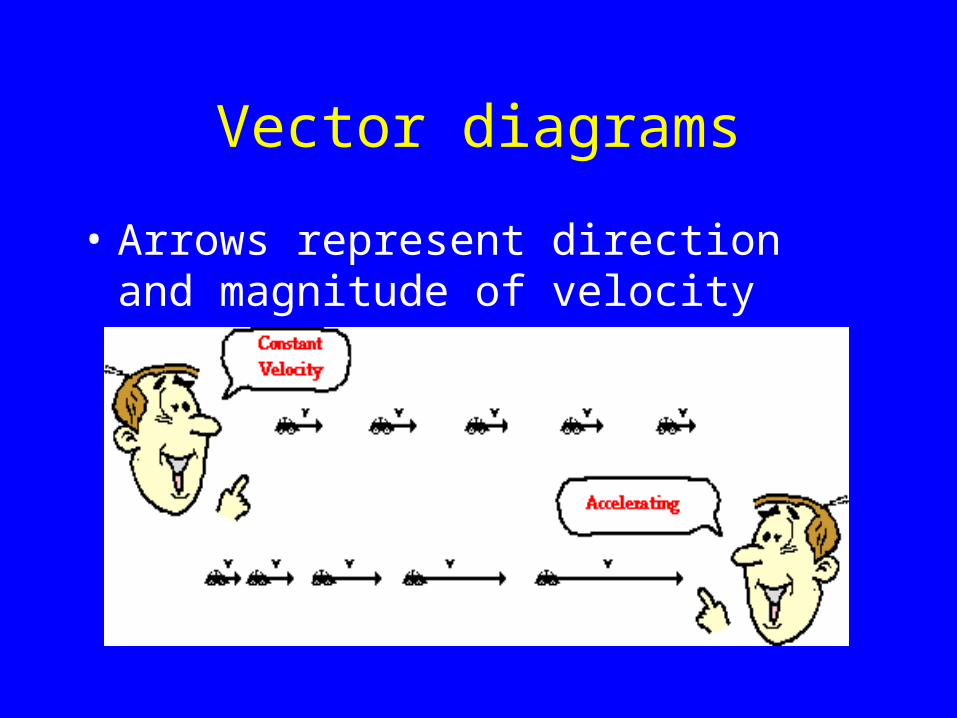
Vector diagrams
• Arrows represent direction and magnitude of velocity
Using graphs to describe motion
• Position / time graph
• The Meaning of Shape for a p-t Graph
• Look at the following graphs…
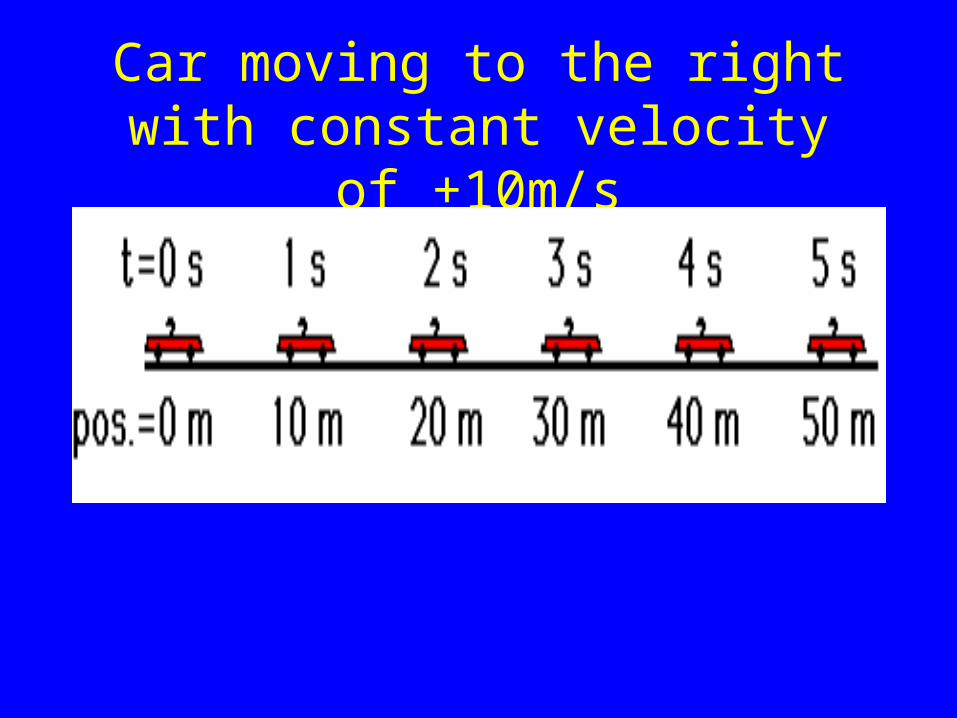
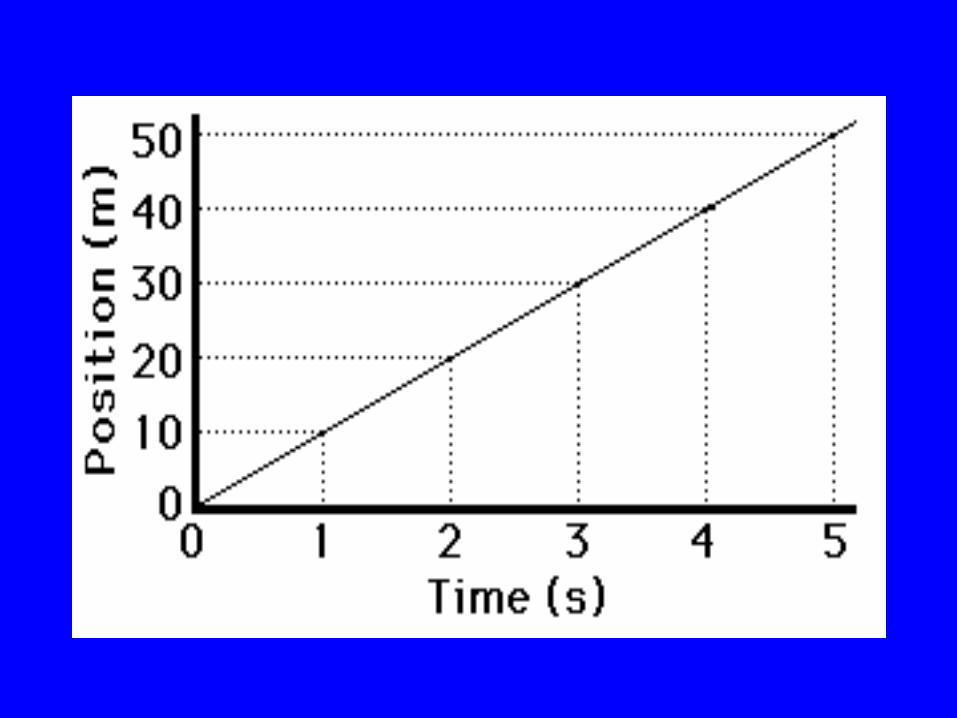
Car moving to the right with constant velocity of +10m/s
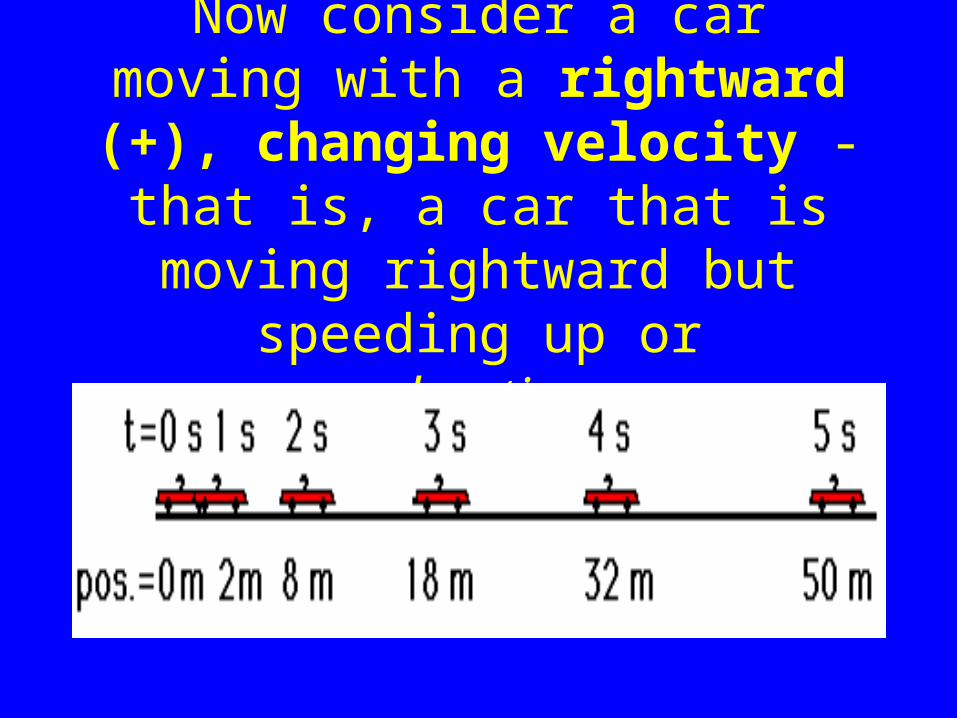
Now consider a car moving with a rightward (+), changing velocity -
that is, a car that is moving rightward but speeding up or
accelerating.
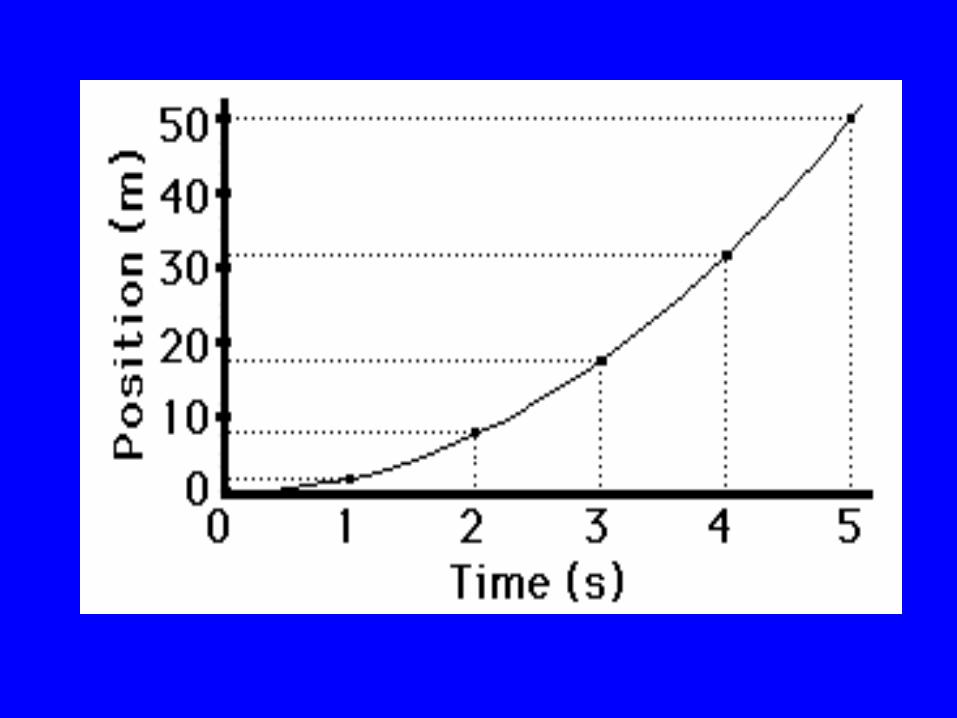
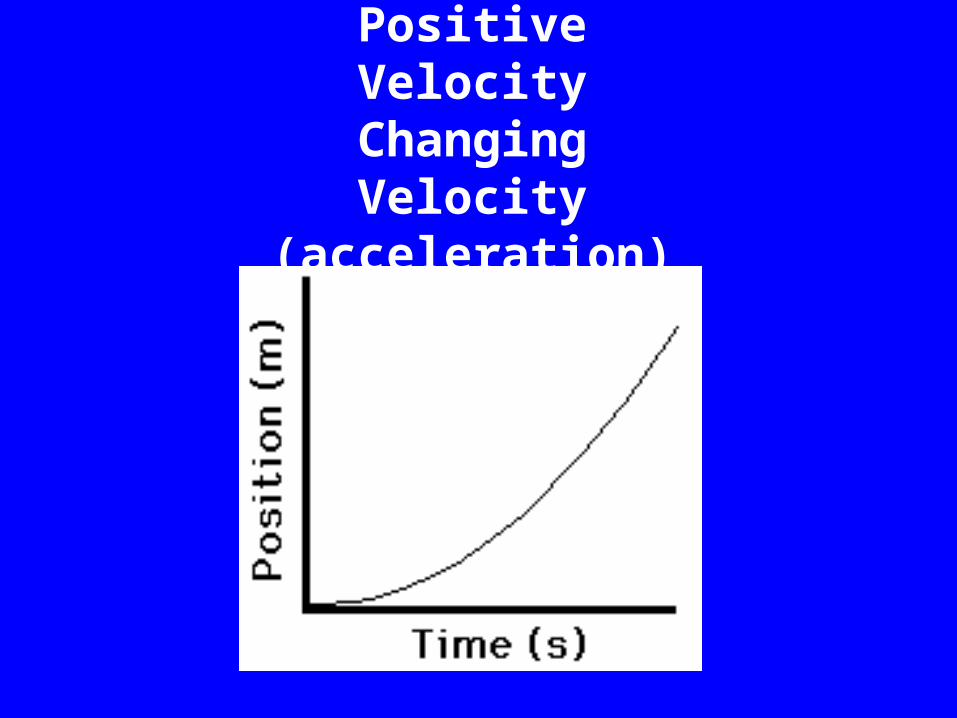
Positive VelocityChanging Velocity
(acceleration)
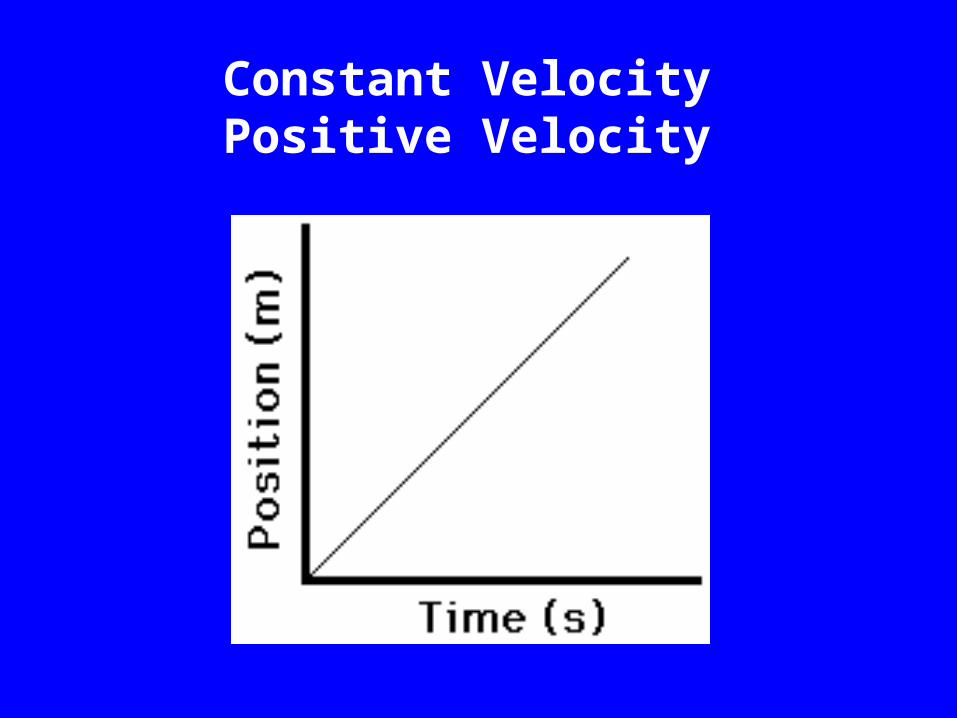
Constant VelocityPositive Velocity
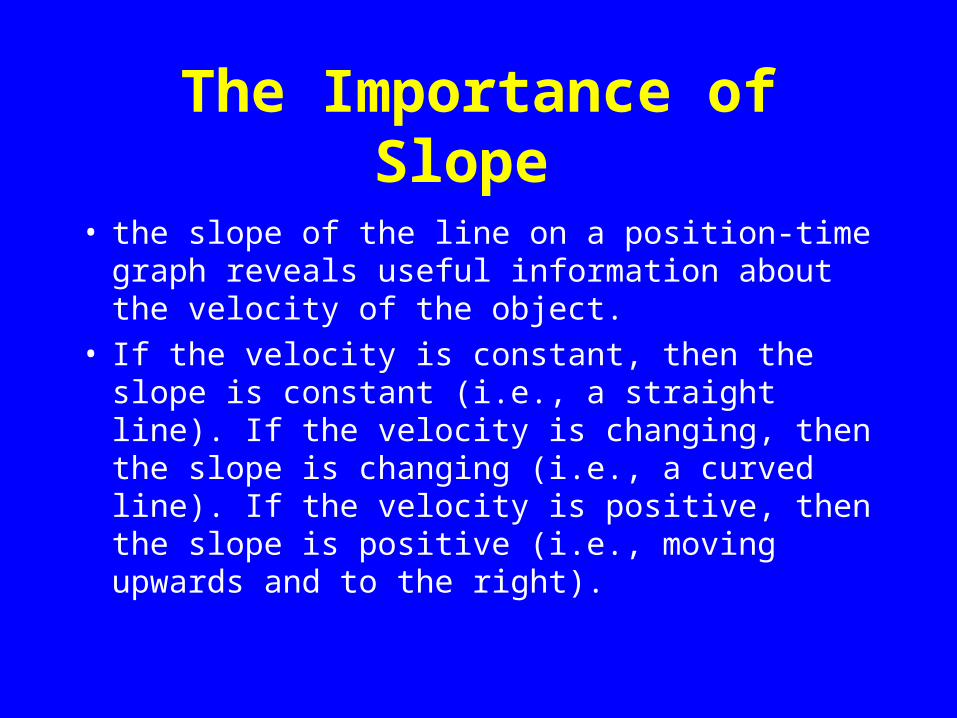
The Importance of Slope
• the slope of the line on a position-time graph reveals useful information about the velocity of the object.
• If the velocity is constant, then the slope is constant (i.e., a straight line). If the velocity is changing, then the slope is changing (i.e., a curved line). If the velocity is positive, then the slope is positive (i.e., moving upwards and to the right).
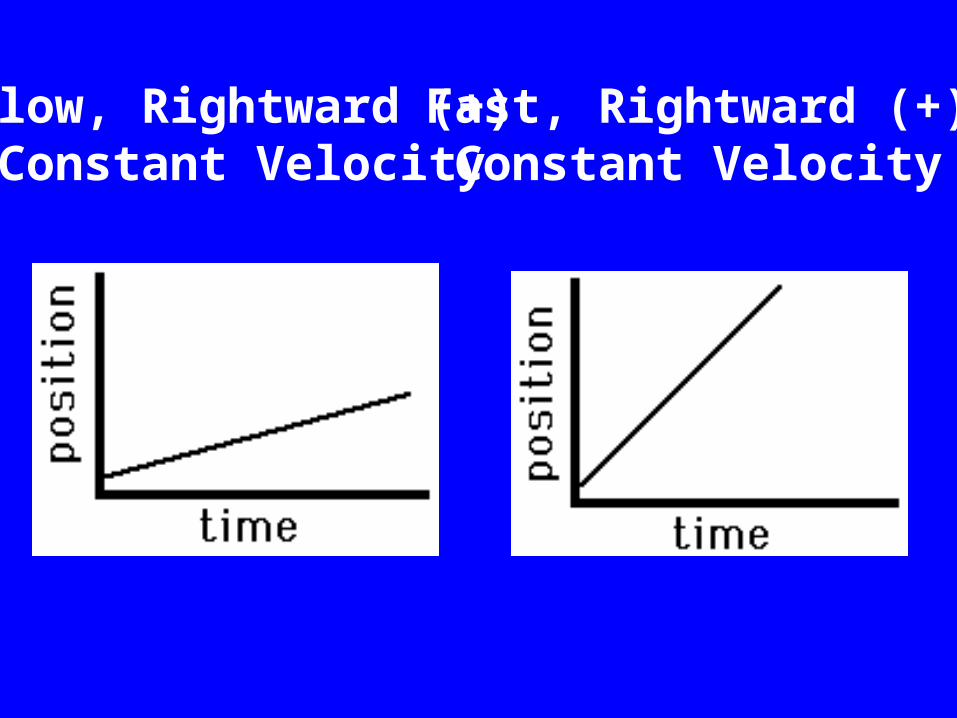
Slow, Rightward (+)Constant Velocity
Fast, Rightward (+)Constant Velocity
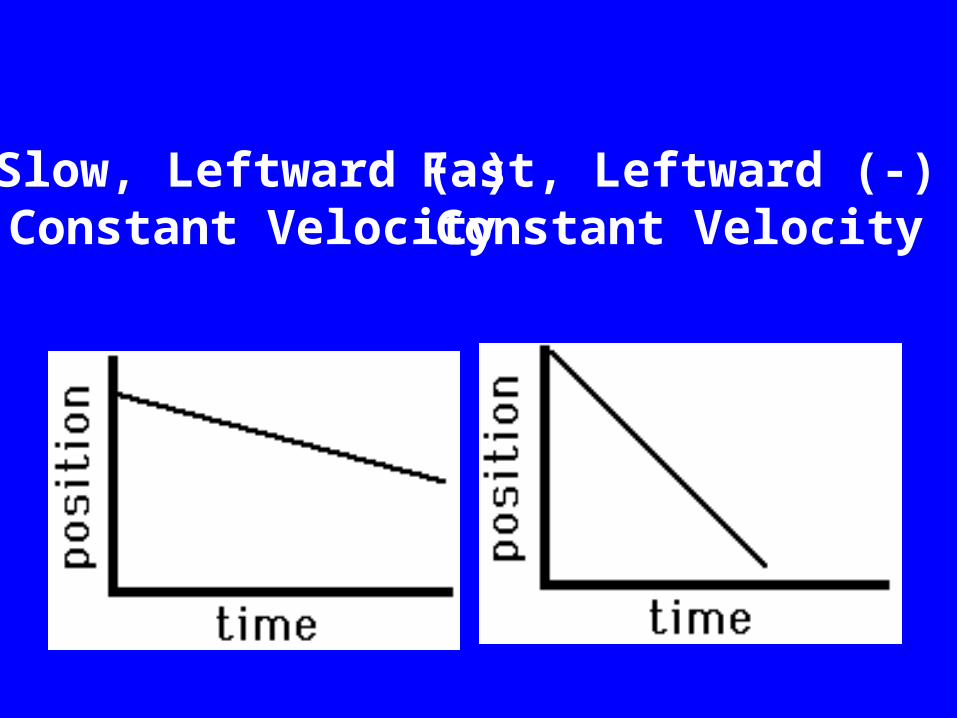
Slow, Leftward (-)Constant Velocity
Fast, Leftward (-)Constant Velocity
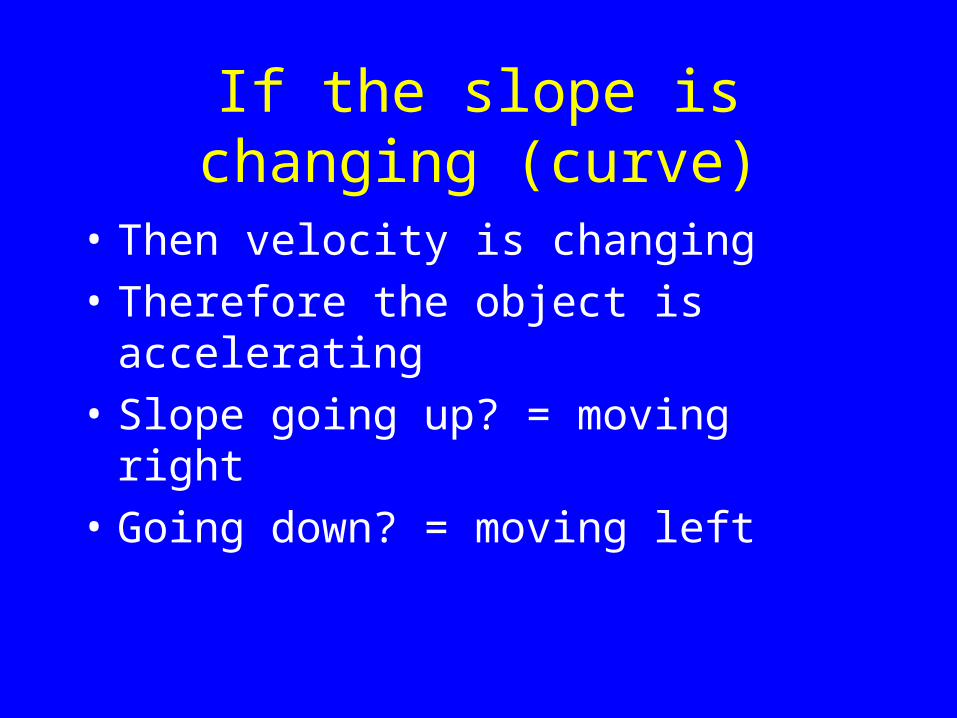
If the slope is changing (curve)
• Then velocity is changing
• Therefore the object is accelerating
• Slope going up? = moving right
• Going down? = moving left
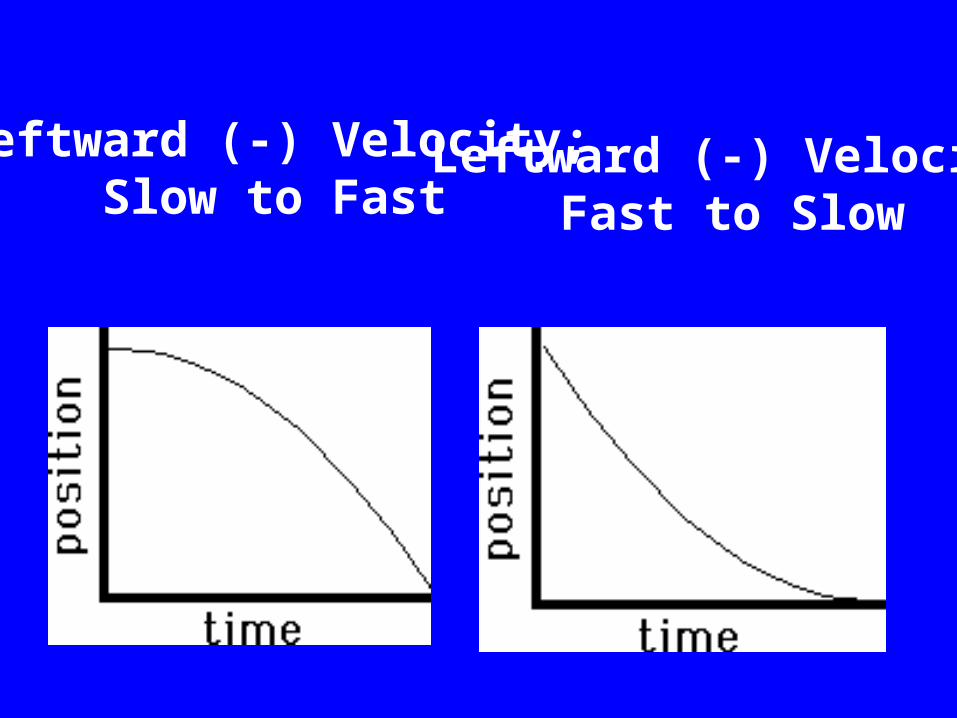
Leftward (-) Velocity;Slow to Fast
Leftward (-) VelocityFast to Slow
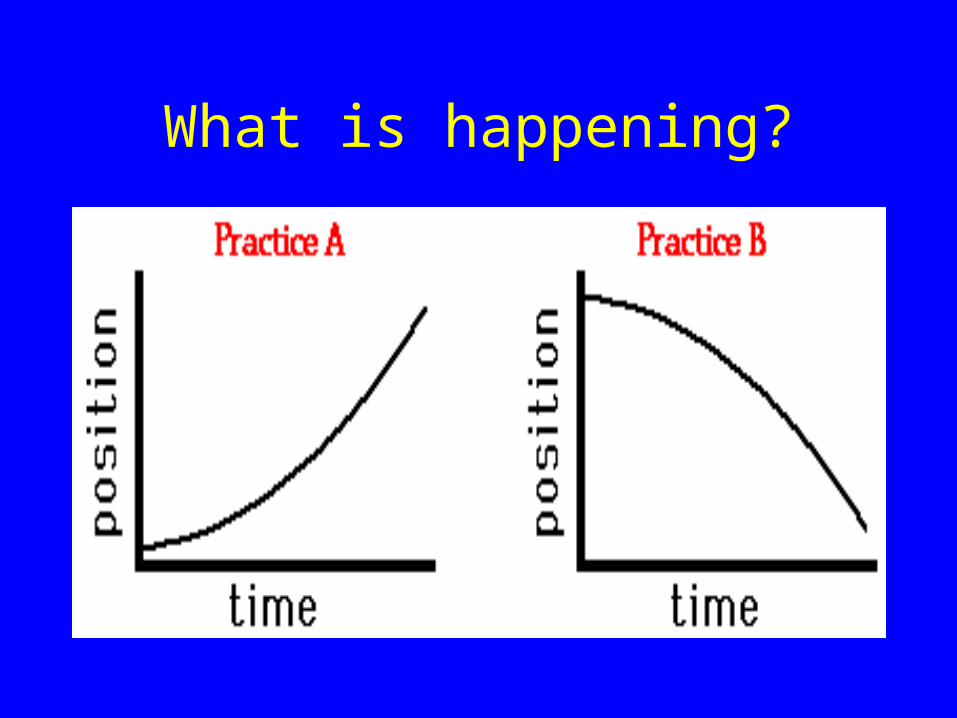
What is happening?
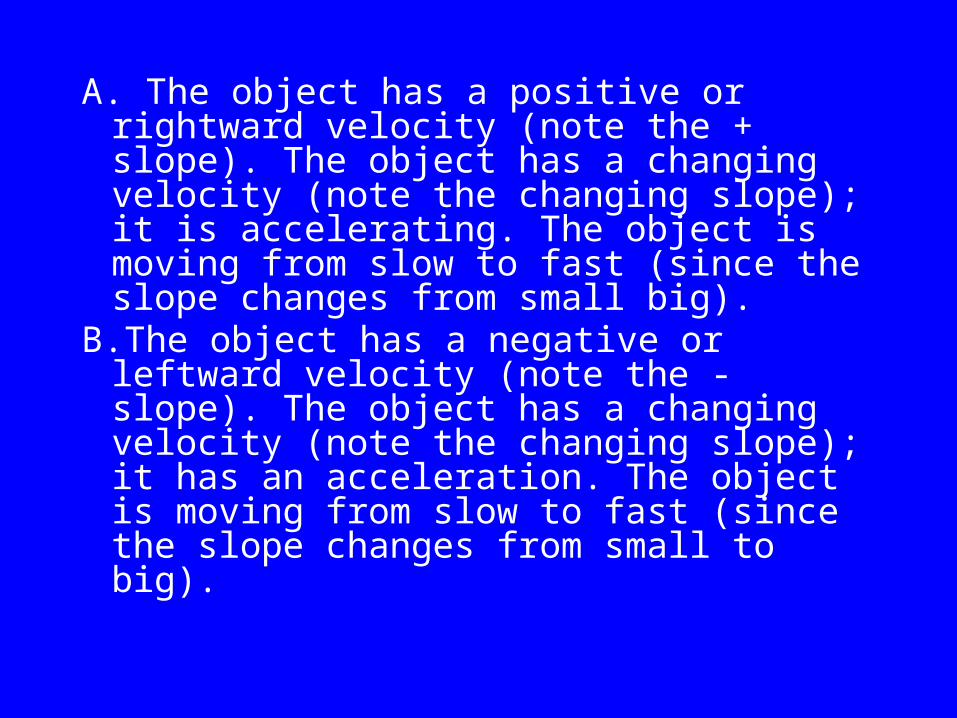
A. The object has a positive or rightward velocity (note the + slope). The object has a changing velocity (note the changing slope); it is accelerating. The object is moving from slow to fast (since the slope changes from small big).
B.The object has a negative or leftward velocity (note the - slope). The object has a changing velocity (note the changing slope); it has an acceleration. The object is moving from slow to fast (since the slope changes from small to big).
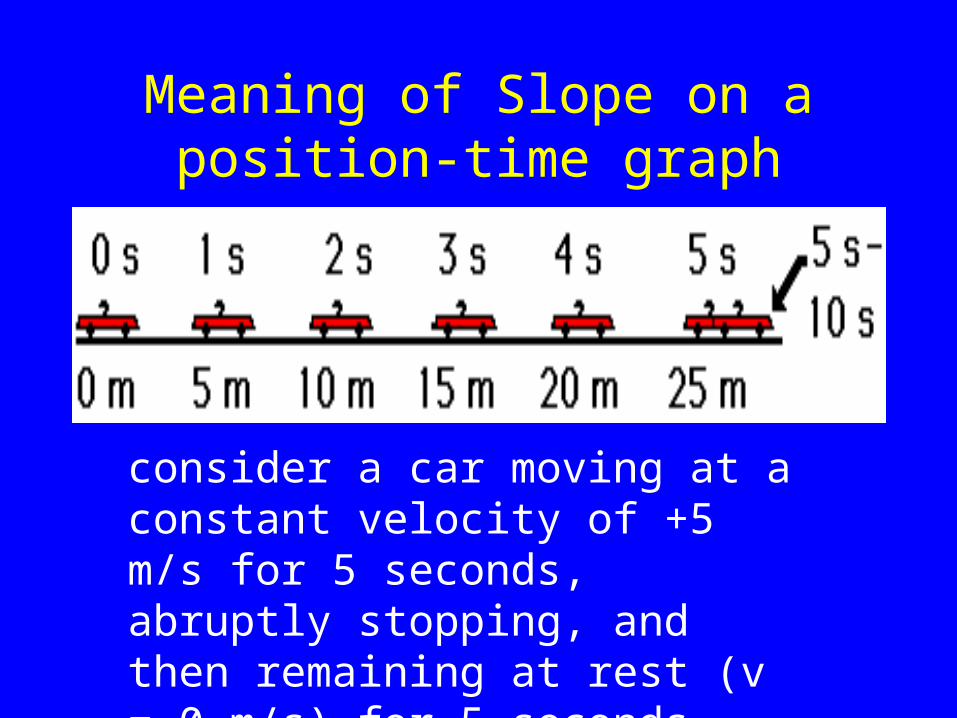
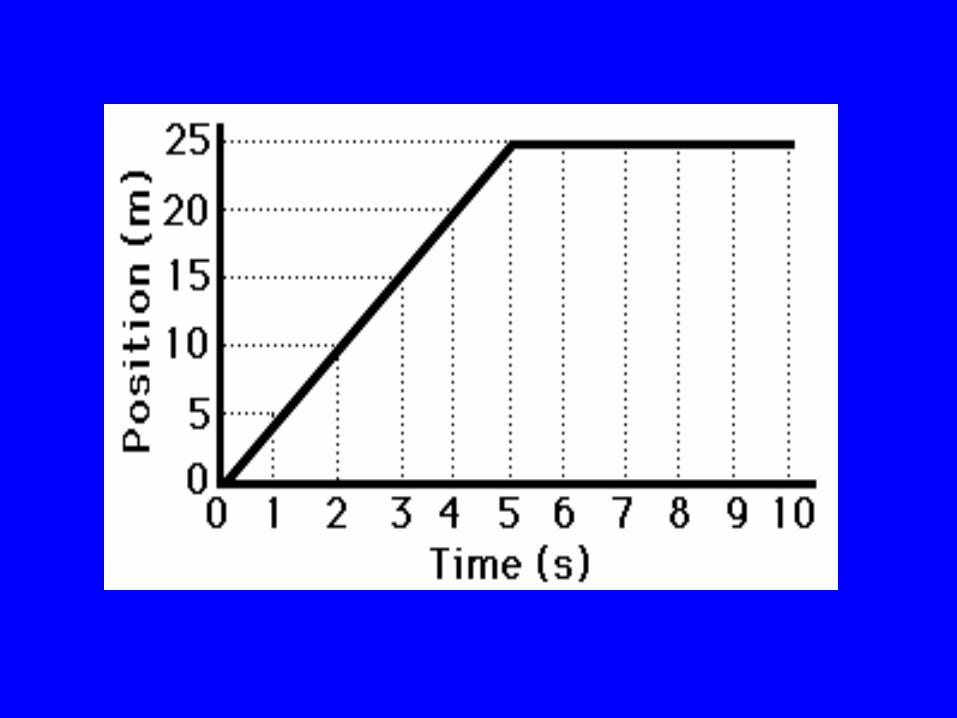
Meaning of Slope on a position-time graph
consider a car moving at a constant velocity of +5 m/s for 5 seconds, abruptly stopping, and then remaining at rest (v = 0 m/s) for 5 seconds.
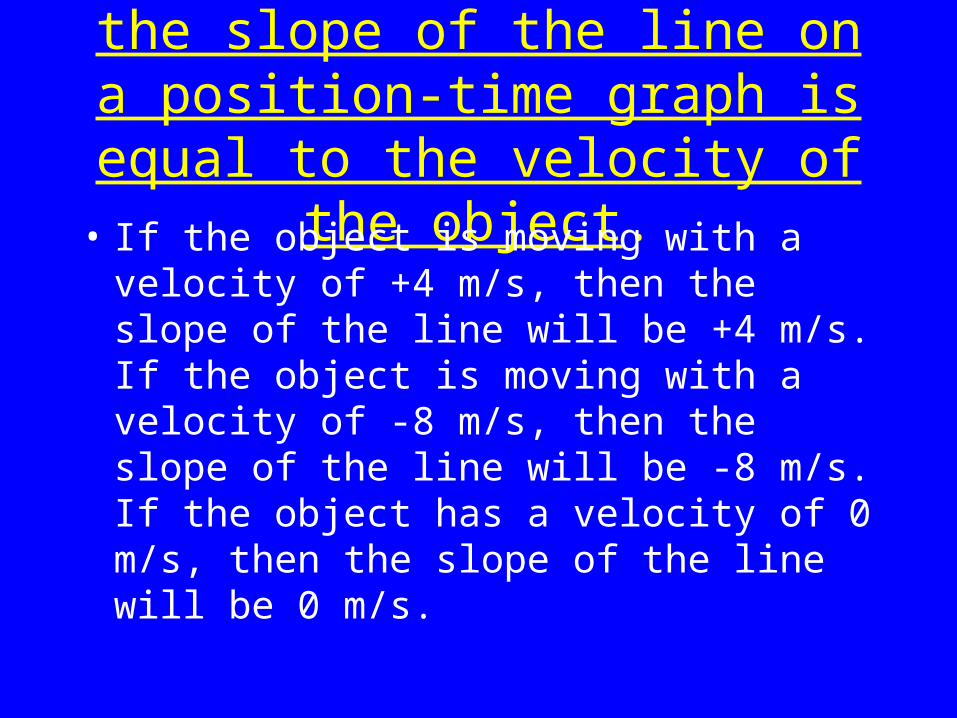
the slope of the line on a position-time graph is equal to the velocity of
the object.• If the object is moving with a velocity of +4
m/s, then the slope of the line will be +4 m/s. If the object is moving with a velocity of -8 m/s, then the slope of the line will be -8 m/s. If the object has a velocity of 0 m/s, then the slope of the line will be 0 m/s.
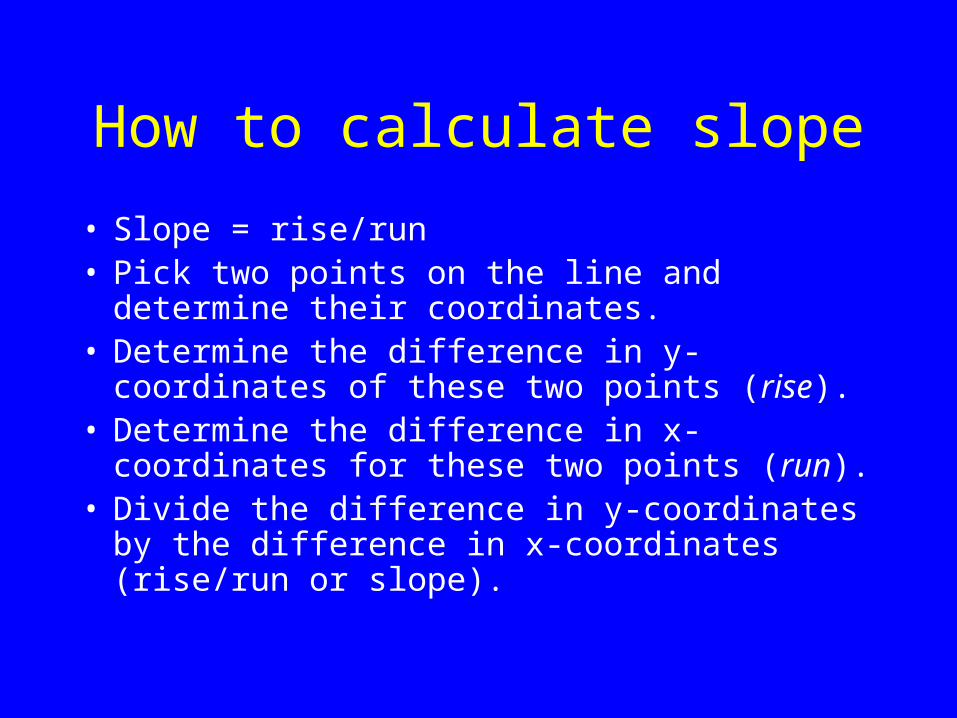
How to calculate slope
• Slope = rise/run• Pick two points on the line and determine their
coordinates. • Determine the difference in y-coordinates of these
two points (rise). • Determine the difference in x-coordinates for
these two points (run). • Divide the difference in y-coordinates by the
difference in x-coordinates (rise/run or slope).
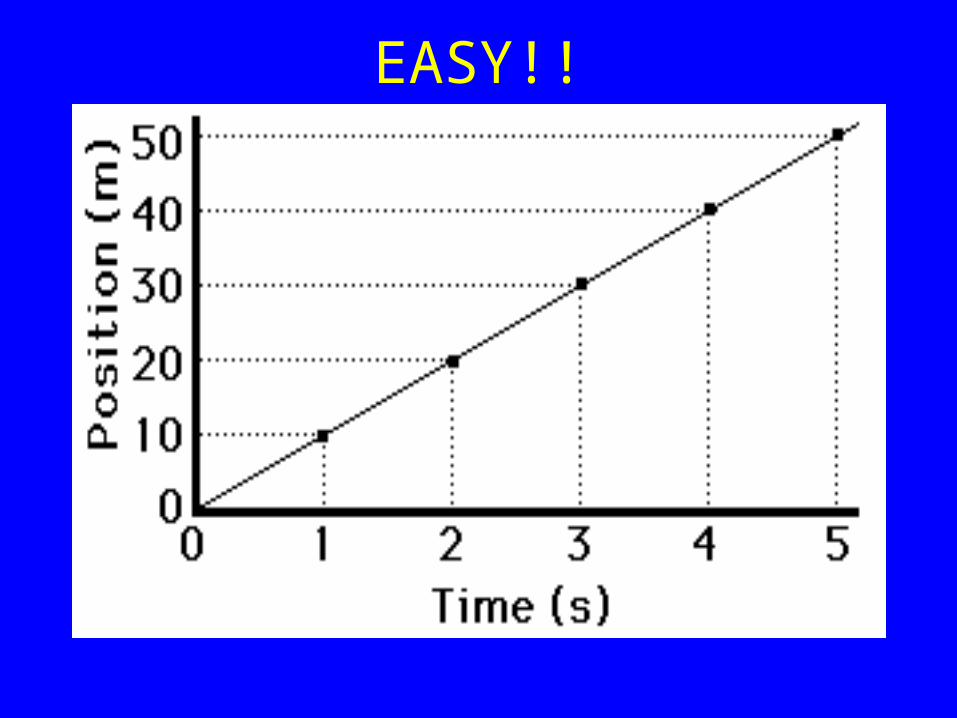
EASY!!
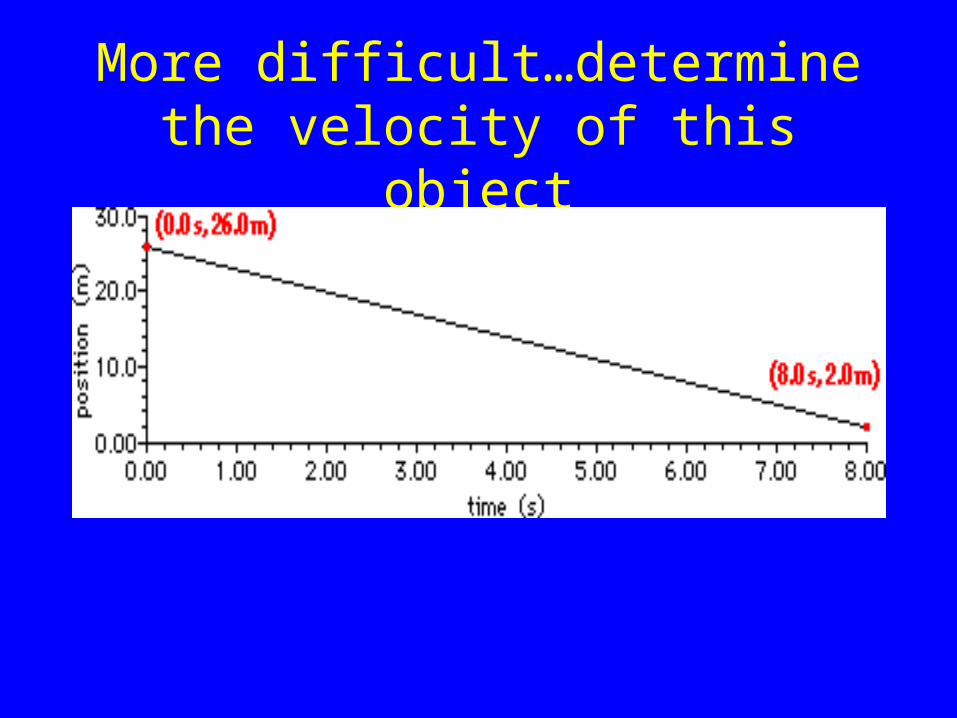
More difficult…determine the velocity of this object
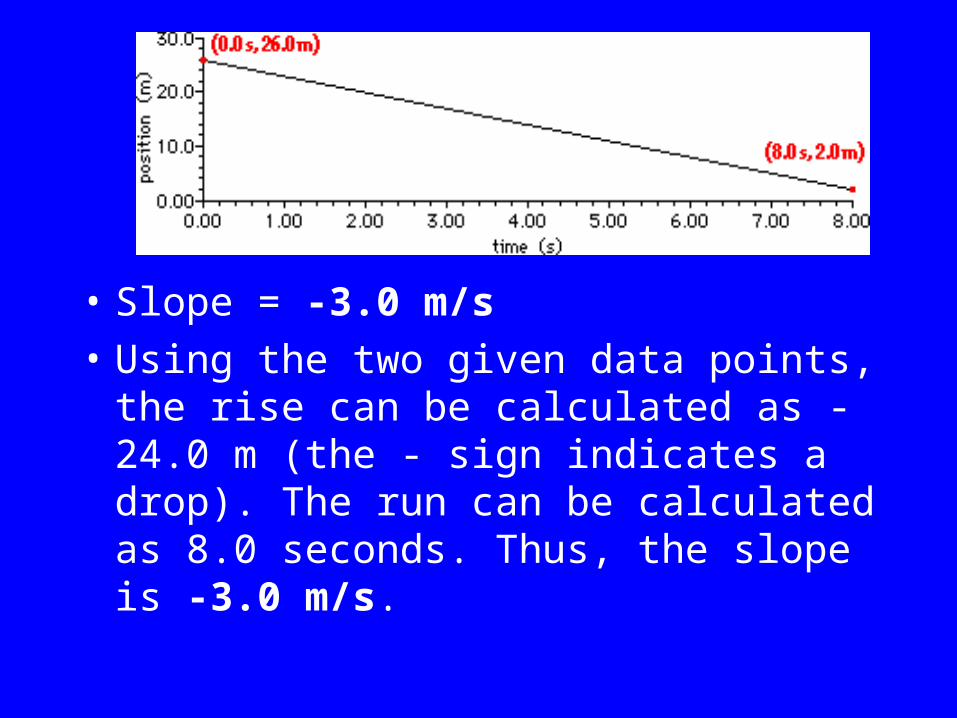
• Slope = -3.0 m/s
• Using the two given data points, the rise can be calculated as -24.0 m (the - sign indicates a drop). The run can be calculated as 8.0 seconds. Thus, the slope is -3.0 m/s.
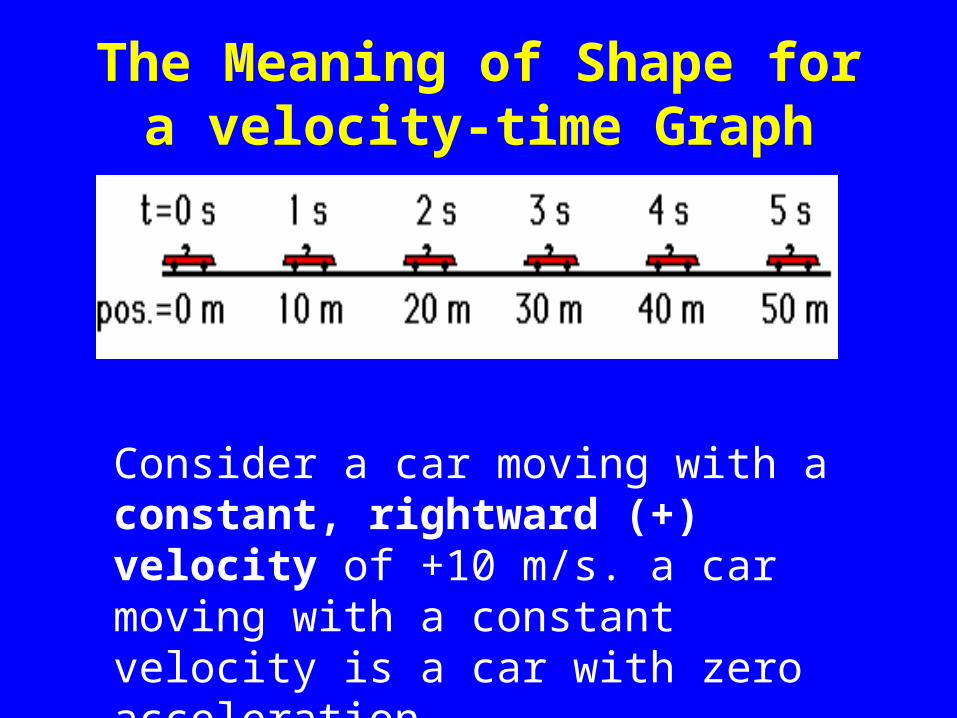
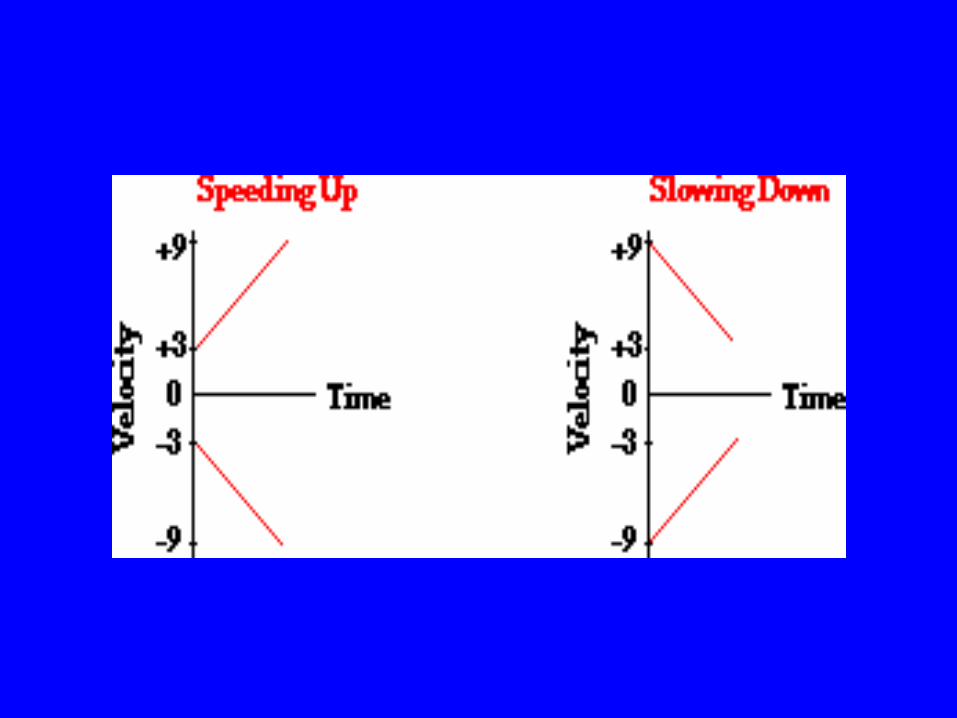
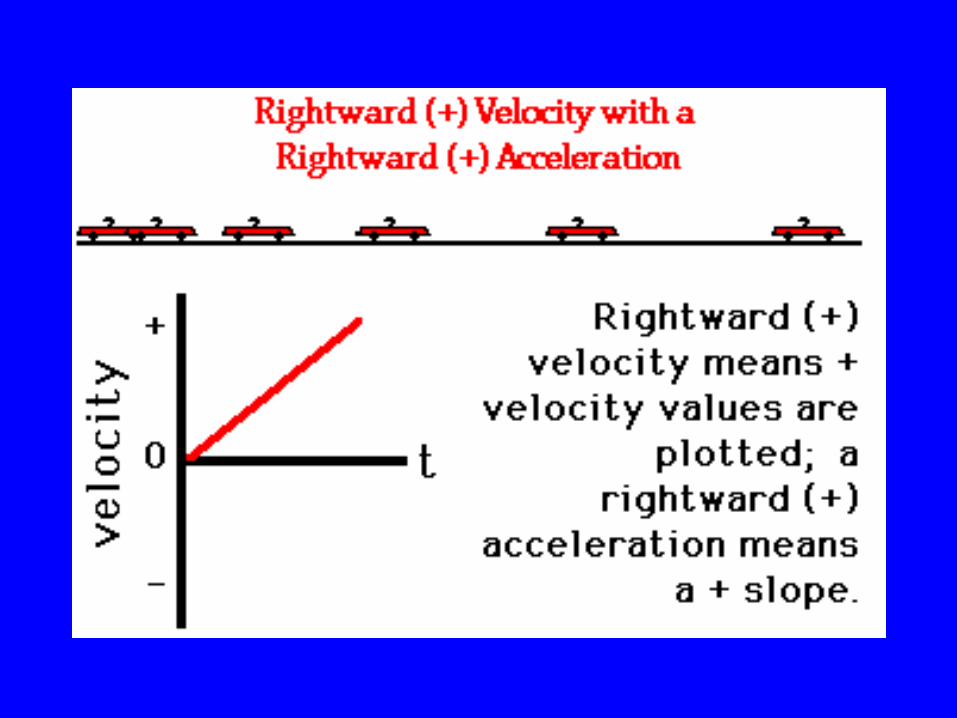
The Meaning of Shape for a velocity-time Graph
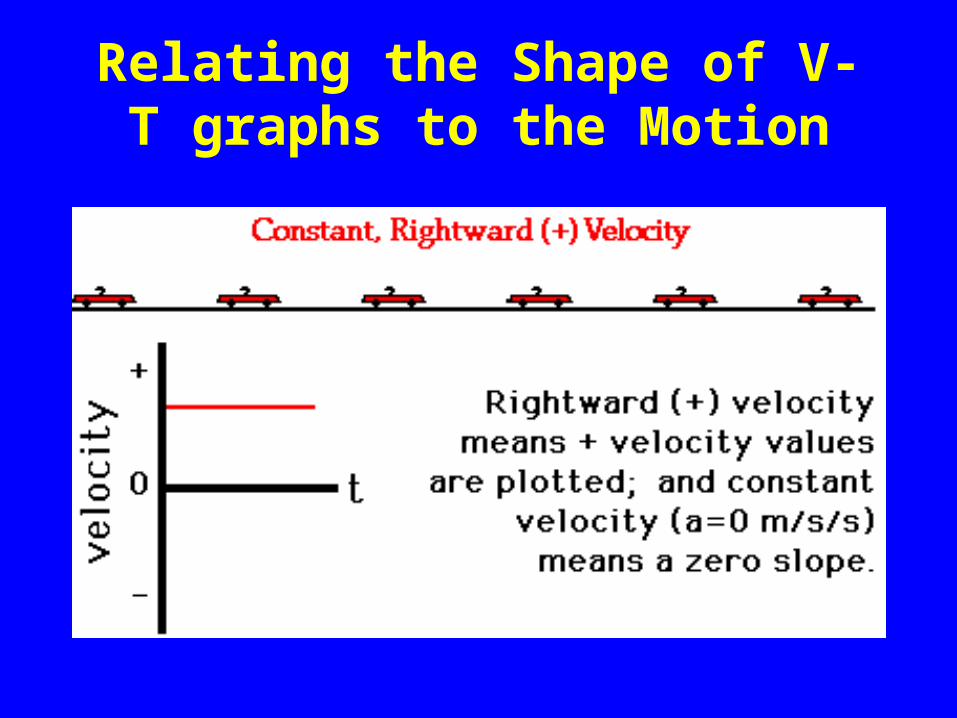
Consider a car moving with a constant, rightward (+) velocity of +10 m/s. a car moving with a constant velocity is a car with zero acceleration.
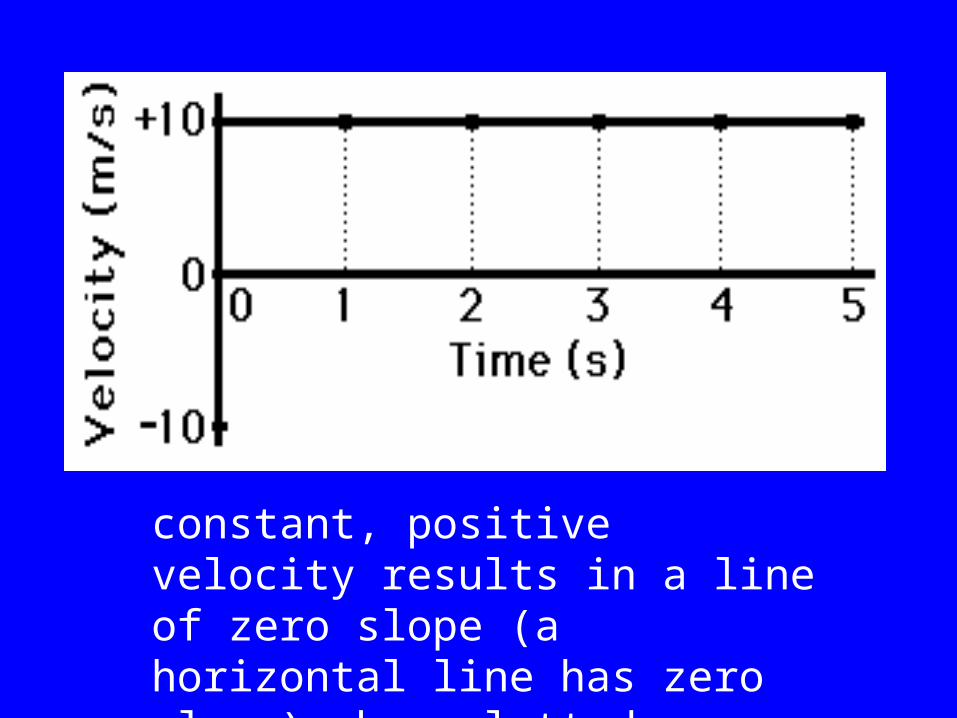
constant, positive velocity results in a line of zero slope (a horizontal line has zero slope) when plotted as a velocity-time graph
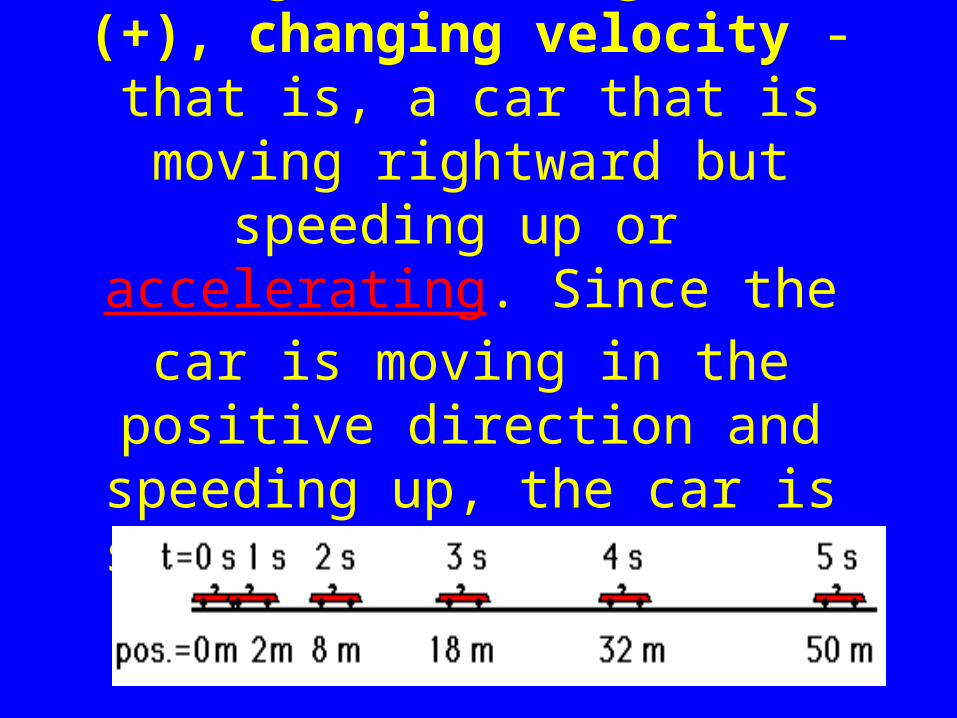
Now consider a car moving with a rightward (+), changing velocity -
that is, a car that is moving rightward but speeding up or
accelerating. Since the car is moving in the positive direction and
speeding up, the car is said to have a positive acceleration.
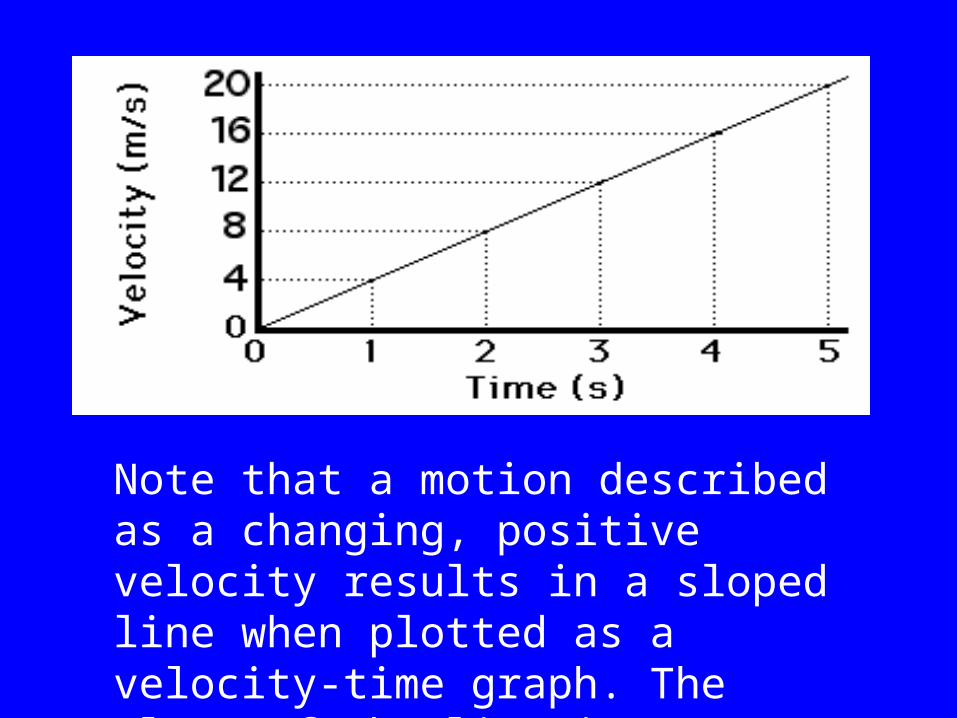
Note that a motion described as a changing, positive velocity results in a sloped line when plotted as a velocity-time graph. The slope of the line is positive, corresponding to the positive acceleration.
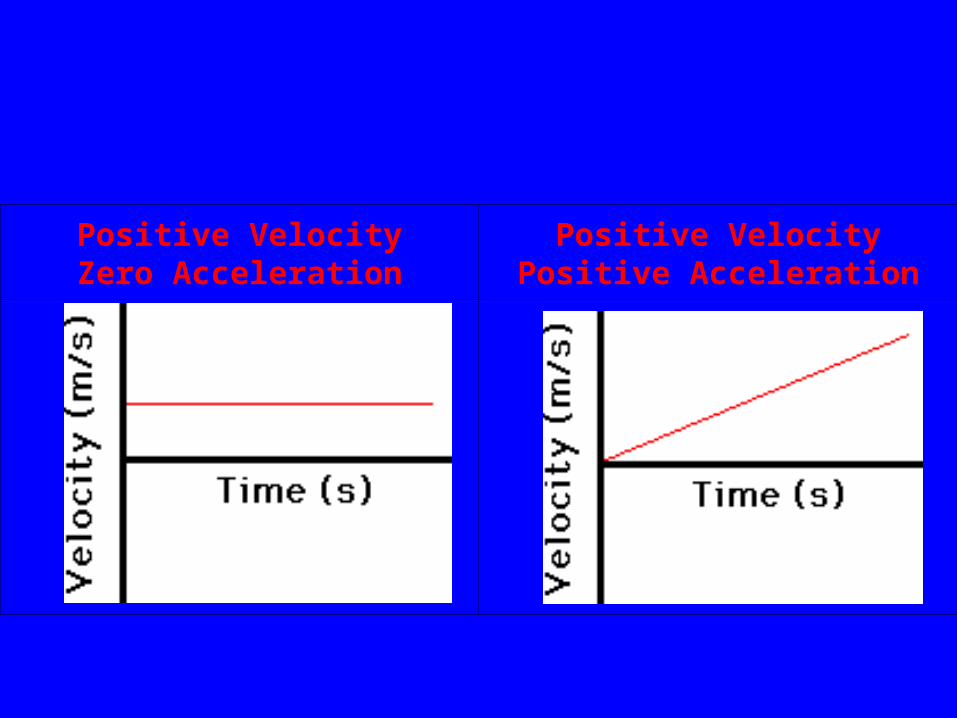
Positive VelocityZero Acceleration
Positive VelocityPositive Acceleration
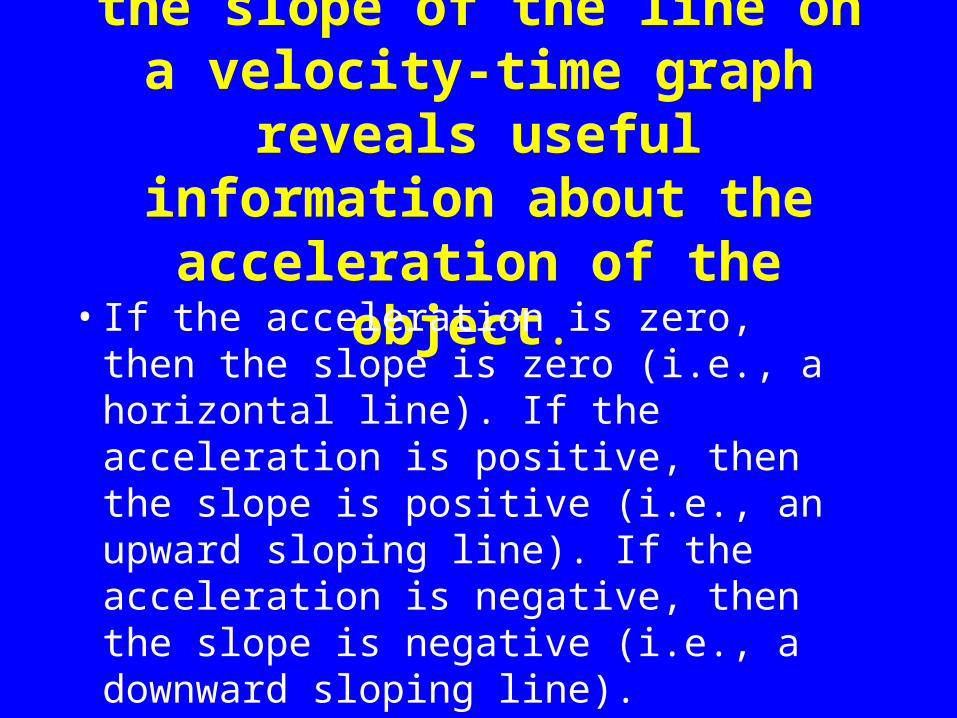
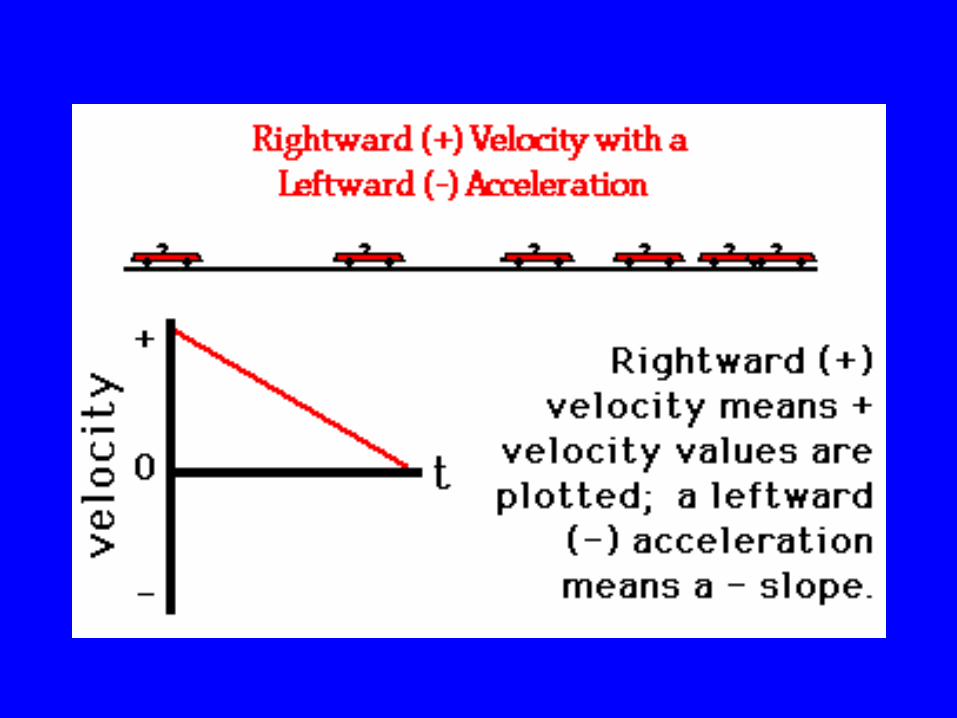
the slope of the line on a velocity-time graph reveals useful
information about the acceleration of the object.
• If the acceleration is zero, then the slope is zero (i.e., a horizontal line). If the acceleration is positive, then the slope is positive (i.e., an upward sloping line). If the acceleration is negative, then the slope is negative (i.e., a downward sloping line).
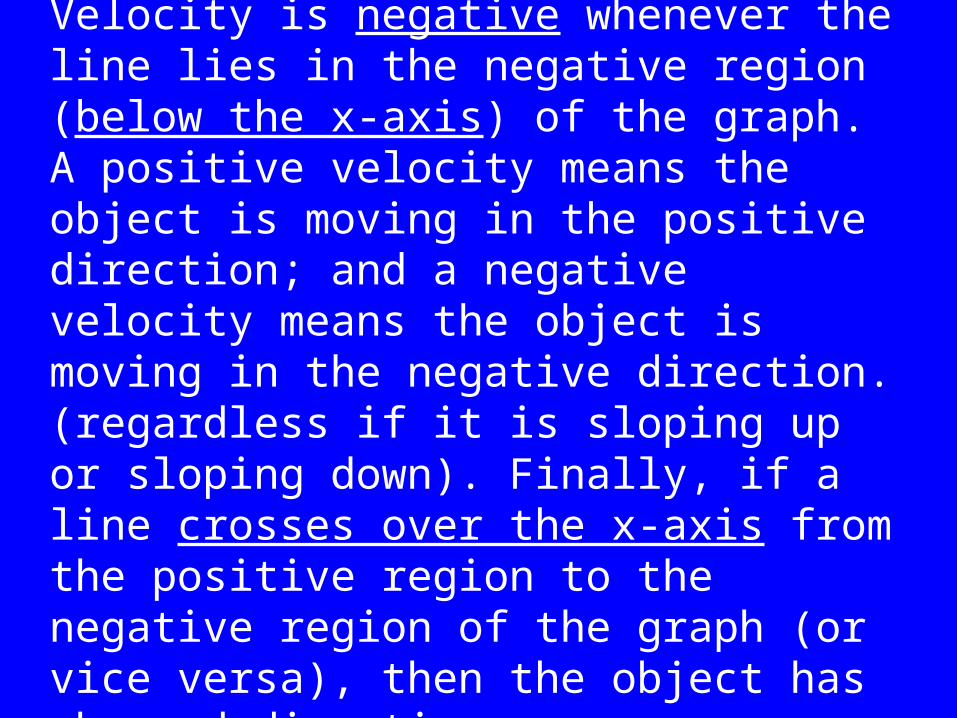
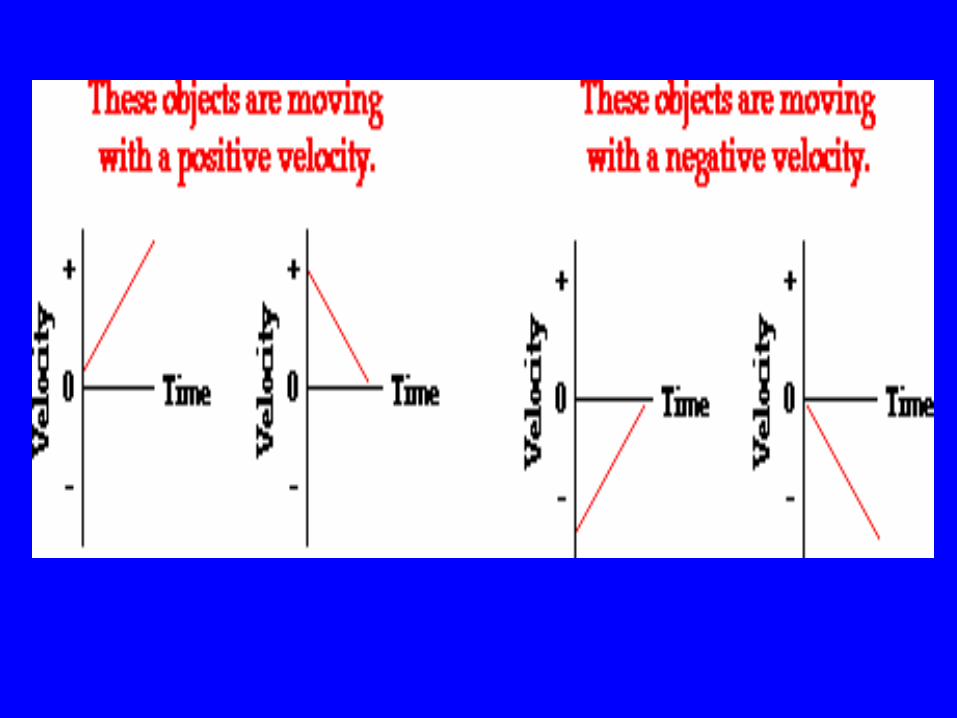
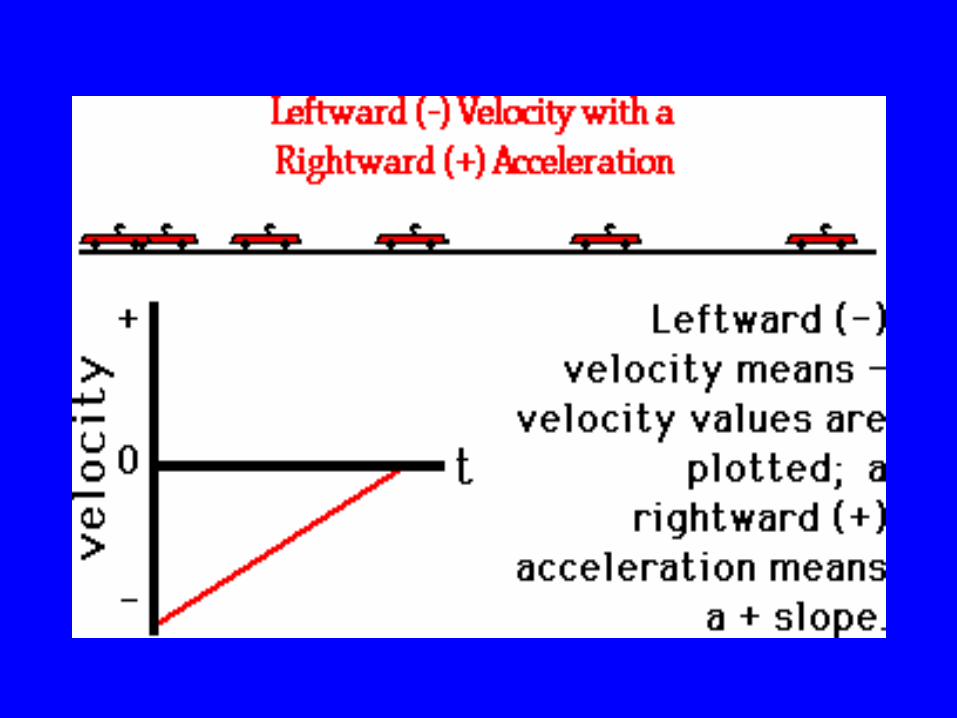
velocity is positive whenever the line lies in the positive region (above the x-axis) of the graph. Velocity is negative whenever the line lies in the negative region (below the x-axis) of the graph. A positive velocity means the object is moving in the positive direction; and a negative velocity means the object is moving in the negative direction. (regardless if it is sloping up or sloping down). Finally, if a line crosses over the x-axis from the positive region to the negative region of the graph (or vice versa), then the object has changed directions.
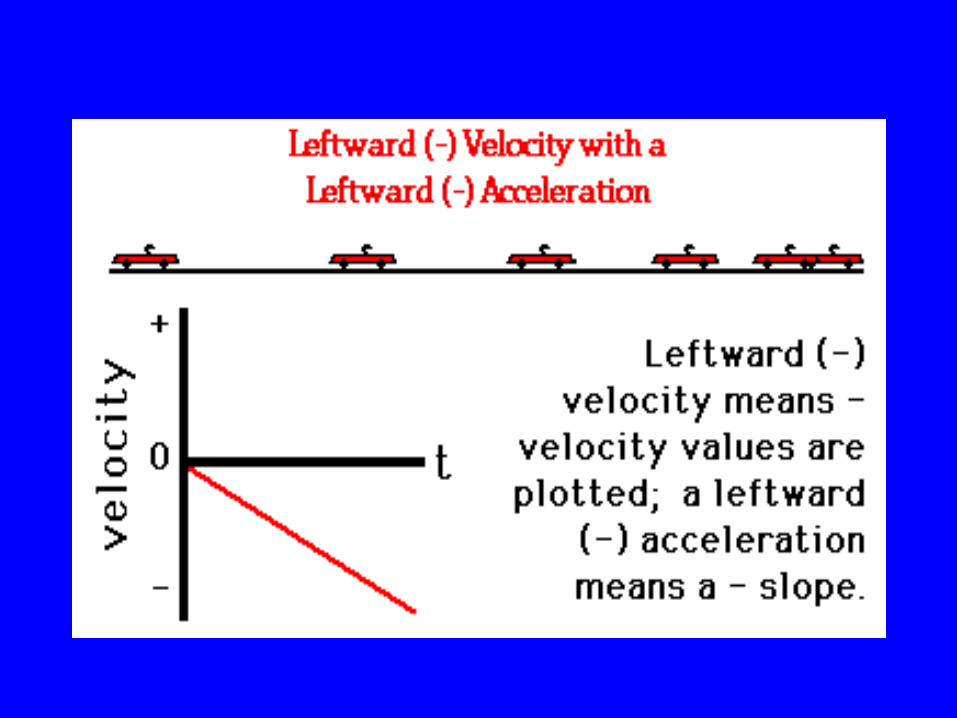
Slowing down?/Speeding up?
• if the line is moving away from the x-axis (the 0-velocity point), then the object is speeding up. If the line is moving towards the x-axis, then the object is slowing down.
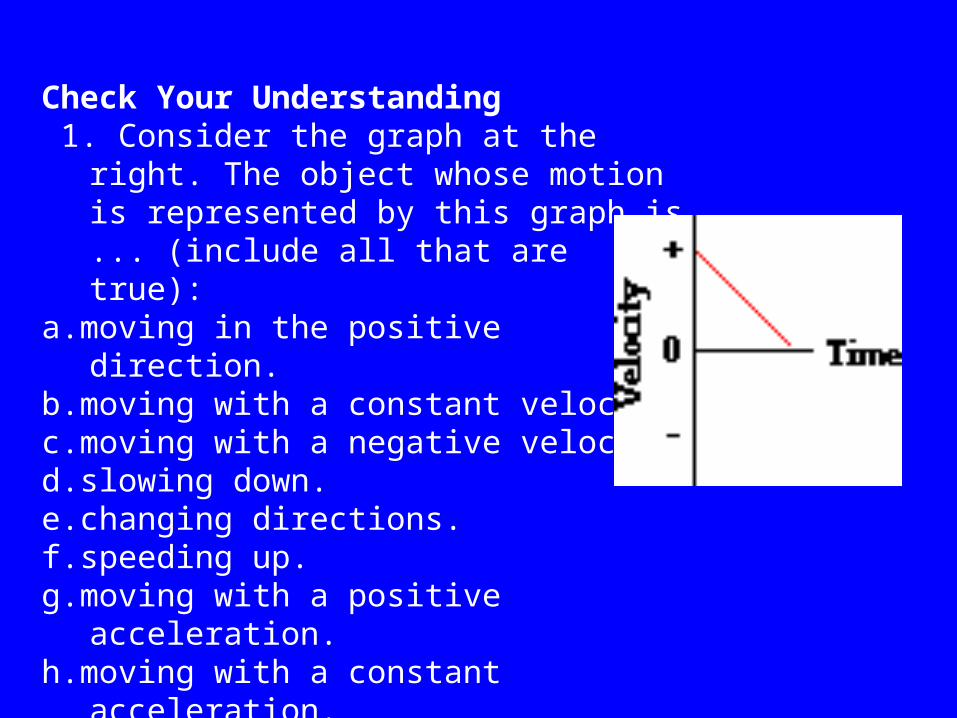
Check Your Understanding 1. Consider the graph at the right. The object
whose motion is represented by this graph is ... (include all that are true):
a.moving in the positive direction. b.moving with a constant velocity. c.moving with a negative velocity. d.slowing down. e.changing directions. f.speeding up. g.moving with a positive acceleration. h.moving with a constant acceleration.
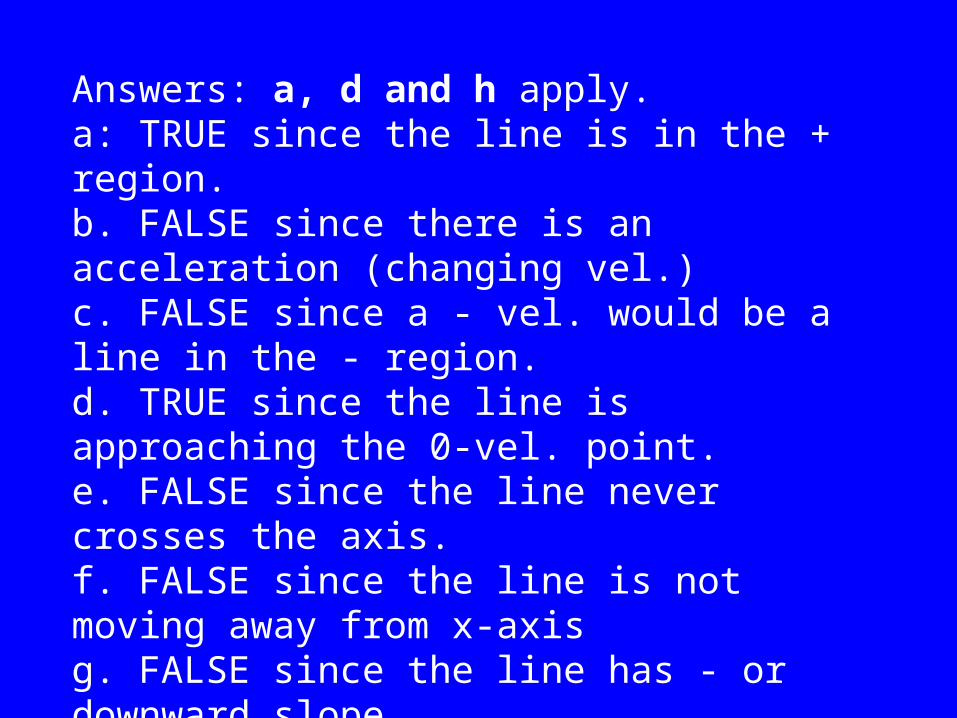
Answers: a, d and h apply.a: TRUE since the line is in the + region.b. FALSE since there is an acceleration (changing vel.)c. FALSE since a - vel. would be a line in the - region.d. TRUE since the line is approaching the 0-vel. point.e. FALSE since the line never crosses the axis.f. FALSE since the line is not moving away from x-axisg. FALSE since the line has - or downward slope.h. TRUE since the line is straight (has constant slope)
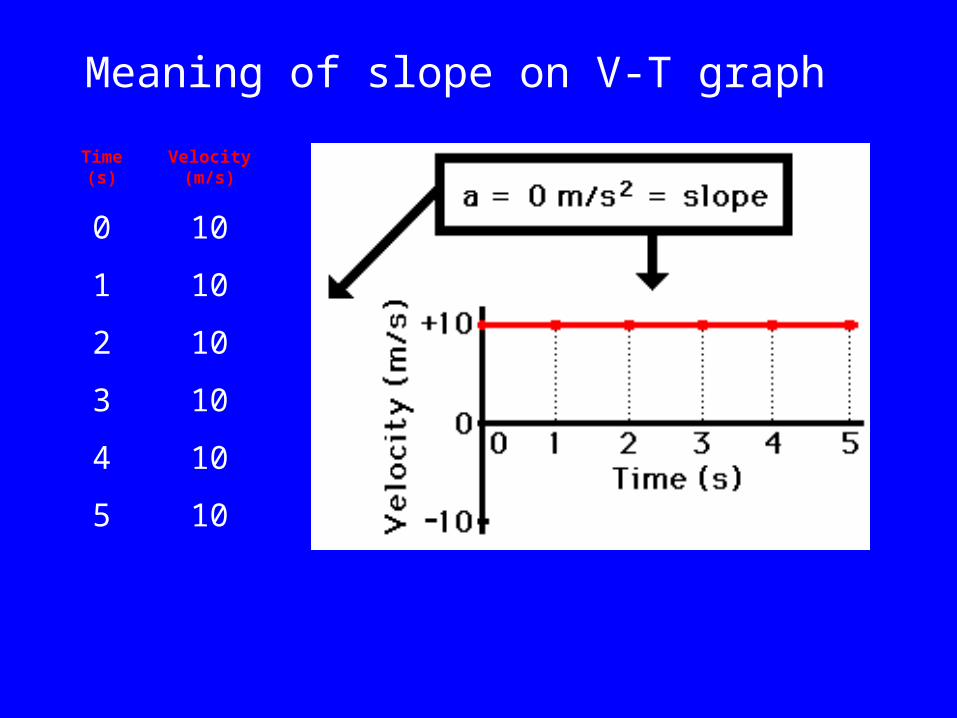
Time(s)
Velocity(m/s)
0 10
1 10
2 10
3 10
4 10
5 10
Meaning of slope on V-T graph
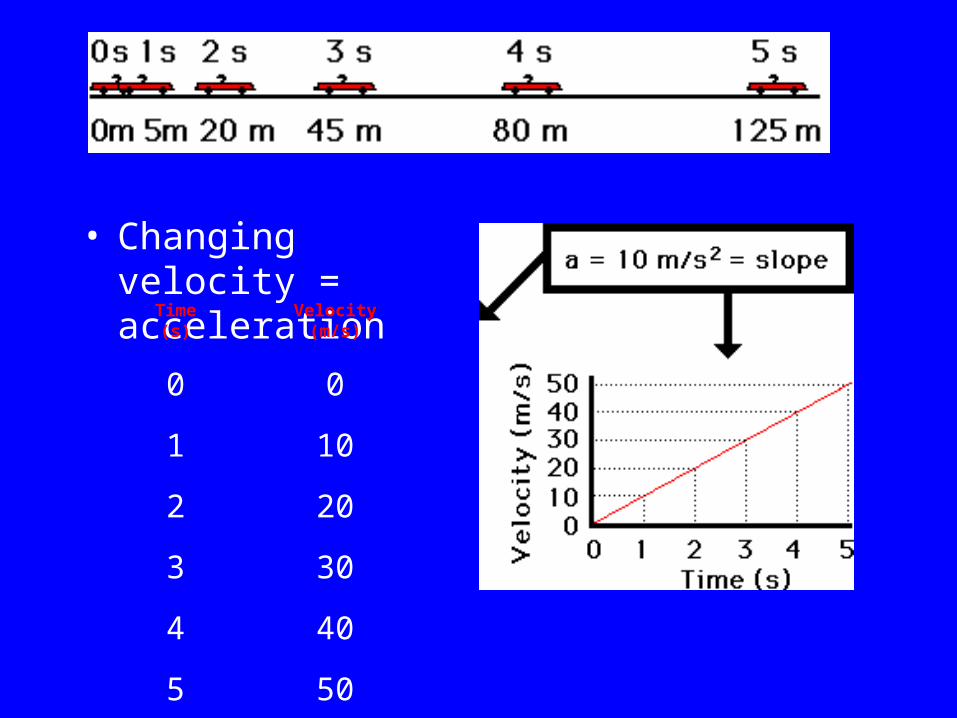
• Changing velocity = acceleration
Time(s)
Velocity(m/s)
0 0
1 10
2 20
3 30
4 40
5 50
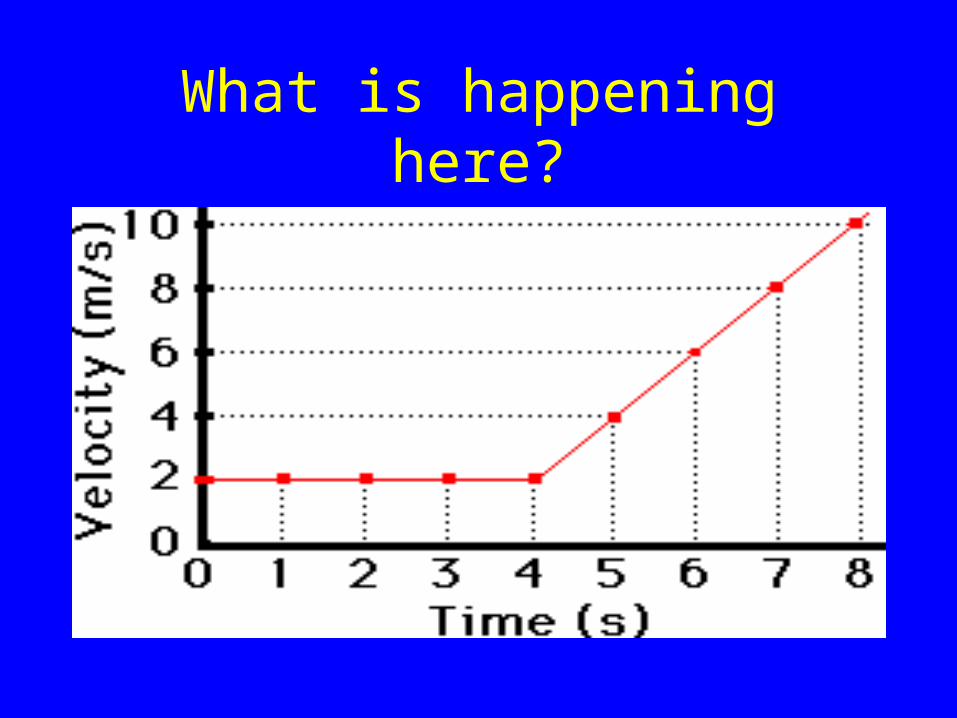
What is happening here?
• in the first four seconds, the car is not changing its velocity (the velocity remains at 2 m/s) and then the car increases its velocity by 2 m/s per second over the next four seconds
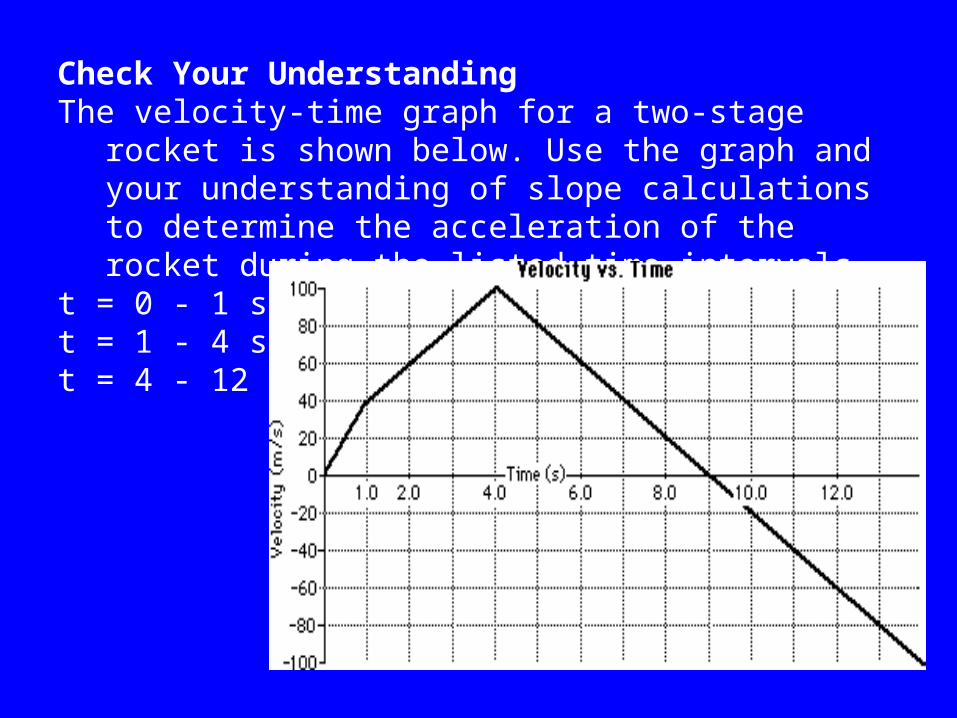
Check Your UnderstandingThe velocity-time graph for a two-stage rocket is shown below.
Use the graph and your understanding of slope calculations to determine the acceleration of the rocket during the listed time intervals.
t = 0 - 1 second t = 1 - 4 second t = 4 - 12 second
answers
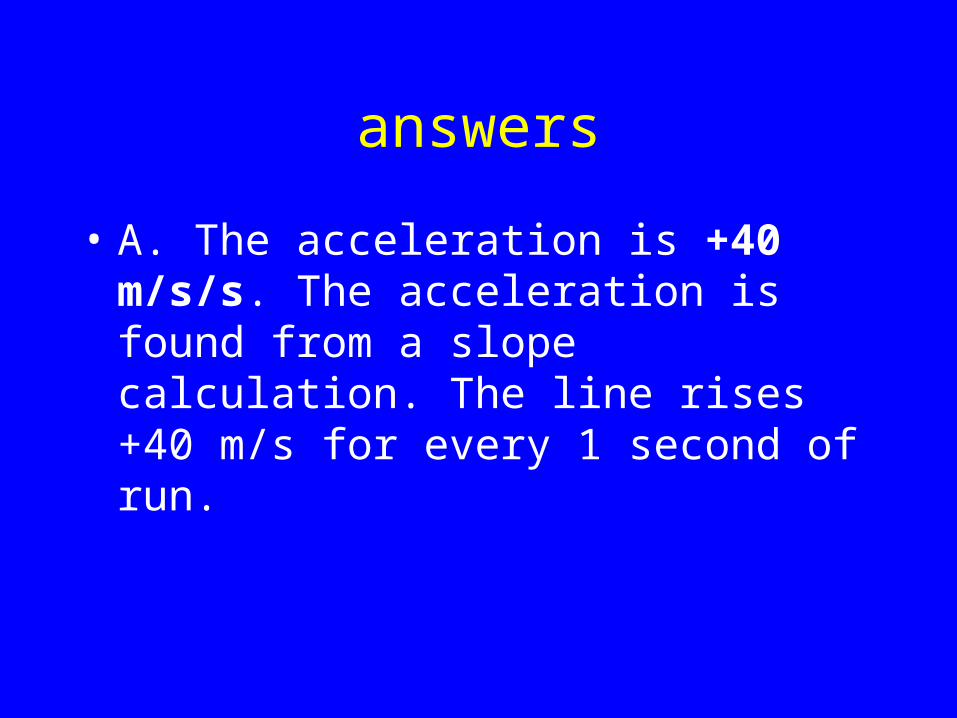
• A. The acceleration is +40 m/s/s. The acceleration is found from a slope calculation. The line rises +40 m/s for every 1 second of run.
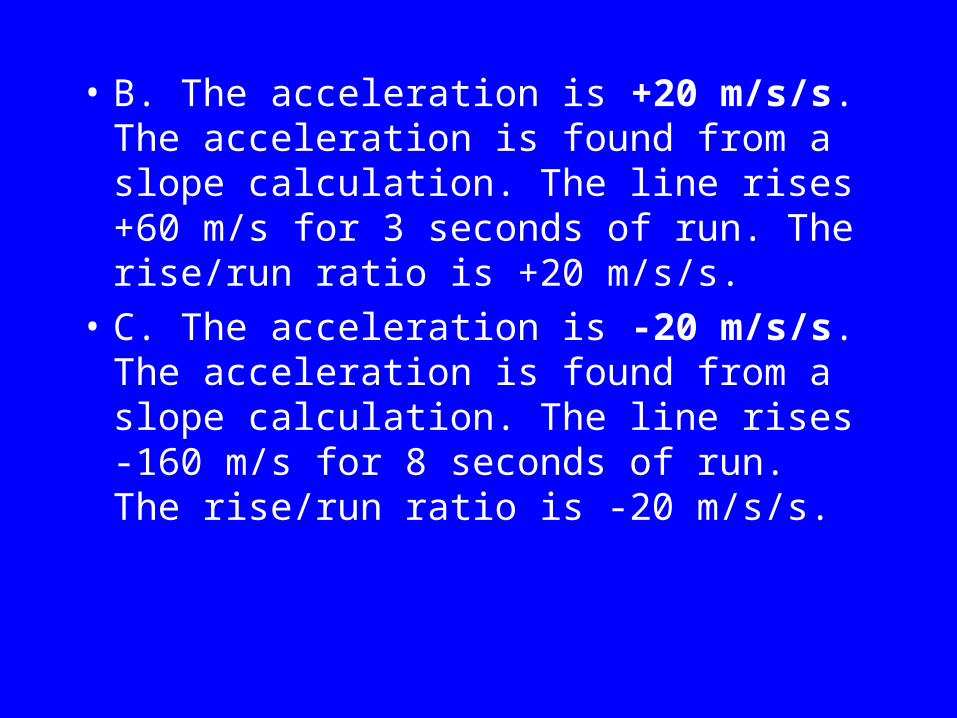
• B. The acceleration is +20 m/s/s. The acceleration is found from a slope calculation. The line rises +60 m/s for 3 seconds of run. The rise/run ratio is +20 m/s/s.
• C. The acceleration is -20 m/s/s. The acceleration is found from a slope calculation. The line rises -160 m/s for 8 seconds of run. The rise/run ratio is -20 m/s/s.
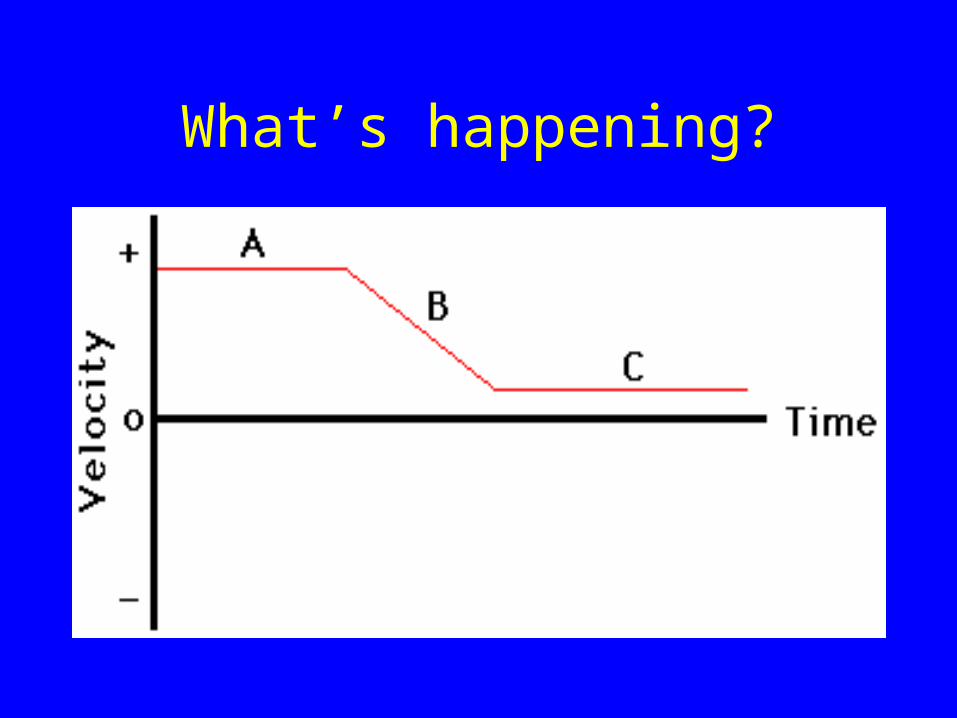
Relating the Shape of V-T graphs to the Motion
What’s happening?
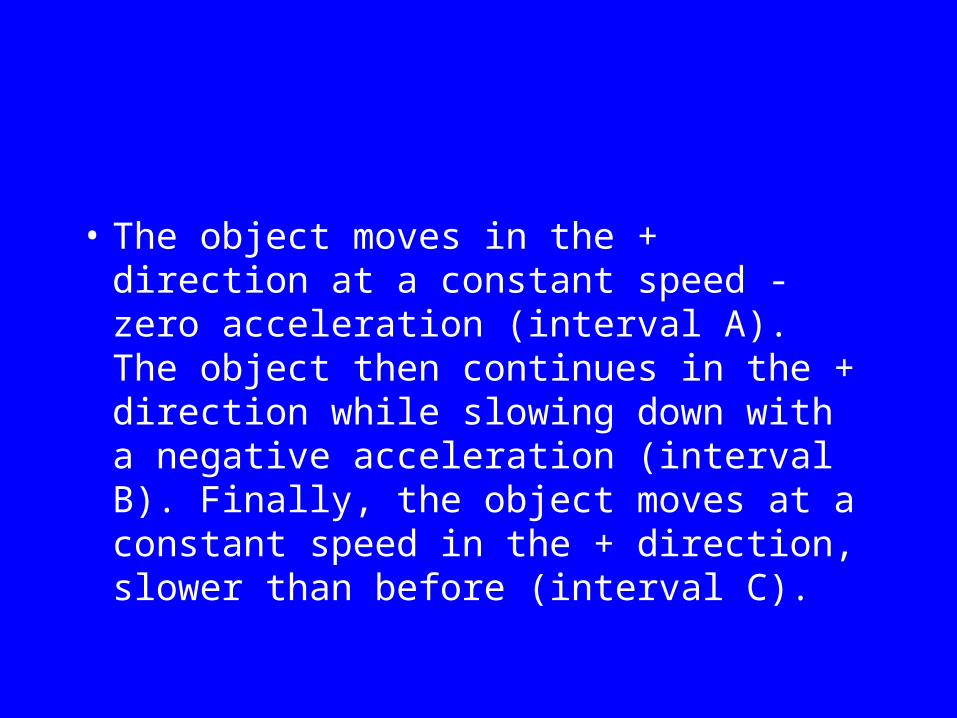
• The object moves in the + direction at a constant speed - zero acceleration (interval A). The object then continues in the + direction while slowing down with a negative acceleration (interval B). Finally, the object moves at a constant speed in the + direction, slower than before (interval C).
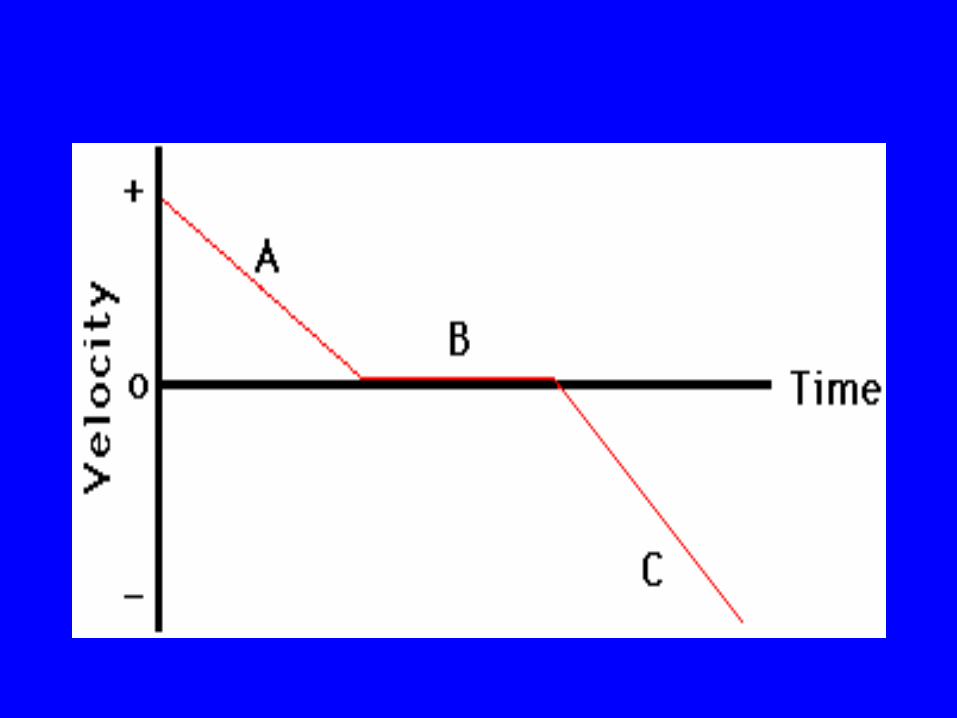
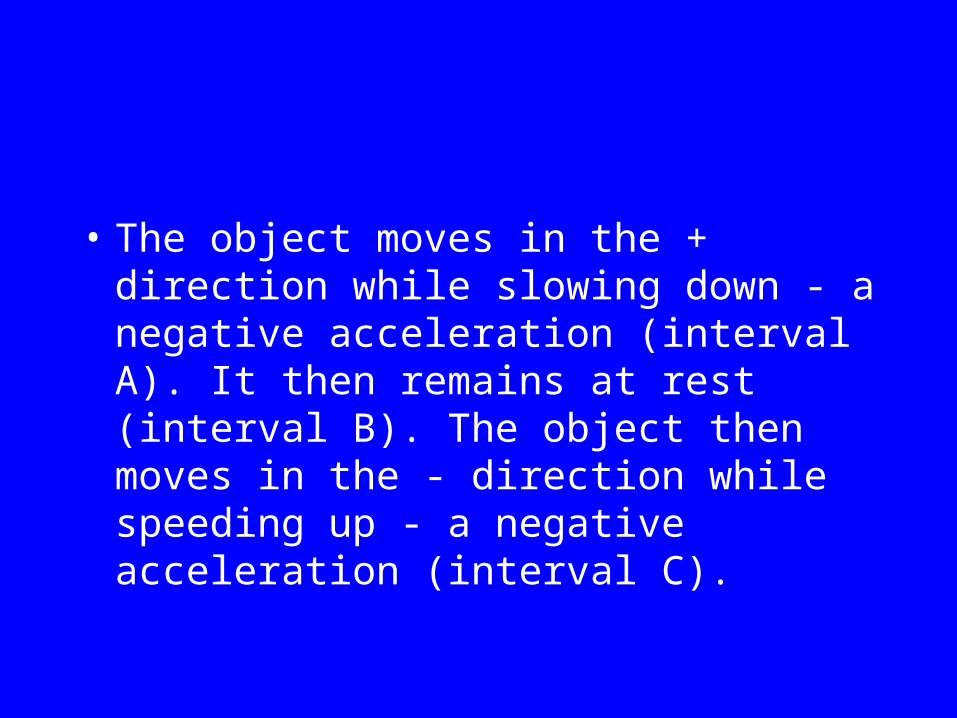
• The object moves in the + direction while slowing down - a negative acceleration (interval A). It then remains at rest (interval B). The object then moves in the - direction while speeding up - a negative acceleration (interval C).
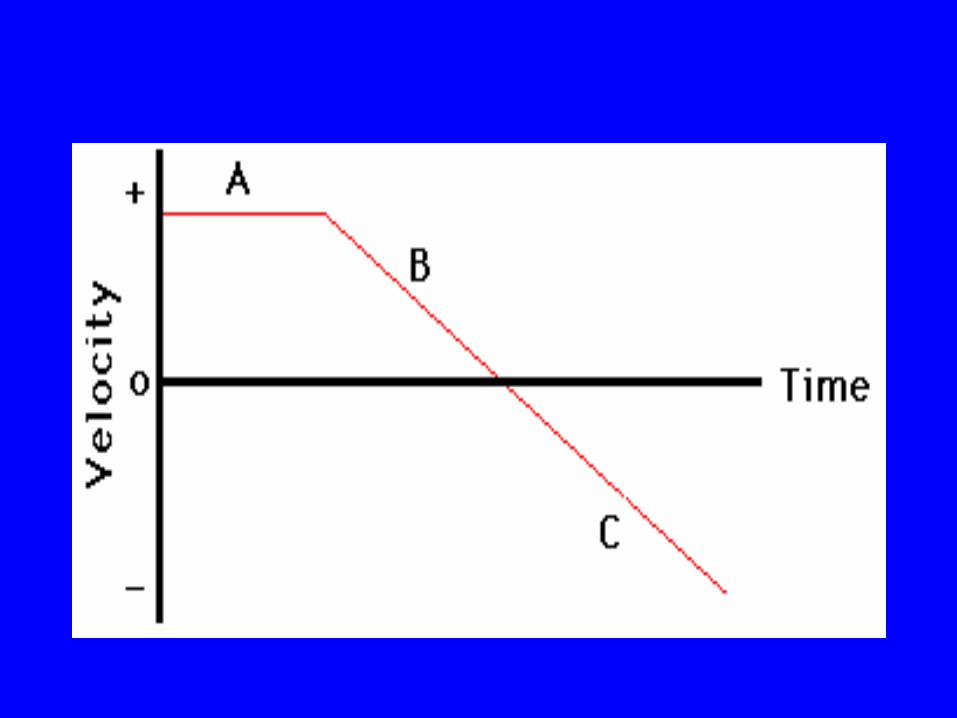
• The object moves in the + direction with a constant velocity and zero acceleration (interval A). The object then slows down while moving in the + direction - a neg. acceleration until it finally reaches a 0 velocity (stops) (interval B). Then the object moves in the - direction while speeding up - a neg. acceleration (interval C).
Area under graph=displacement
• For velocity vs. time graphs, the area bound by the line and the axes represents the distance.
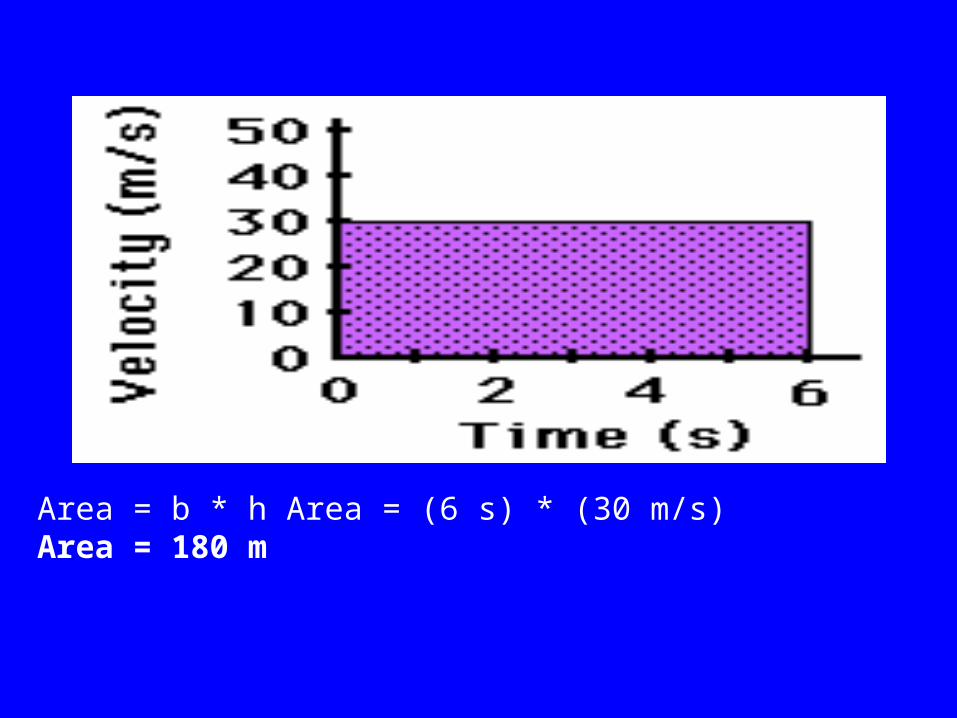
Area = b * h Area = (6 s) * (30 m/s)Area = 180 m
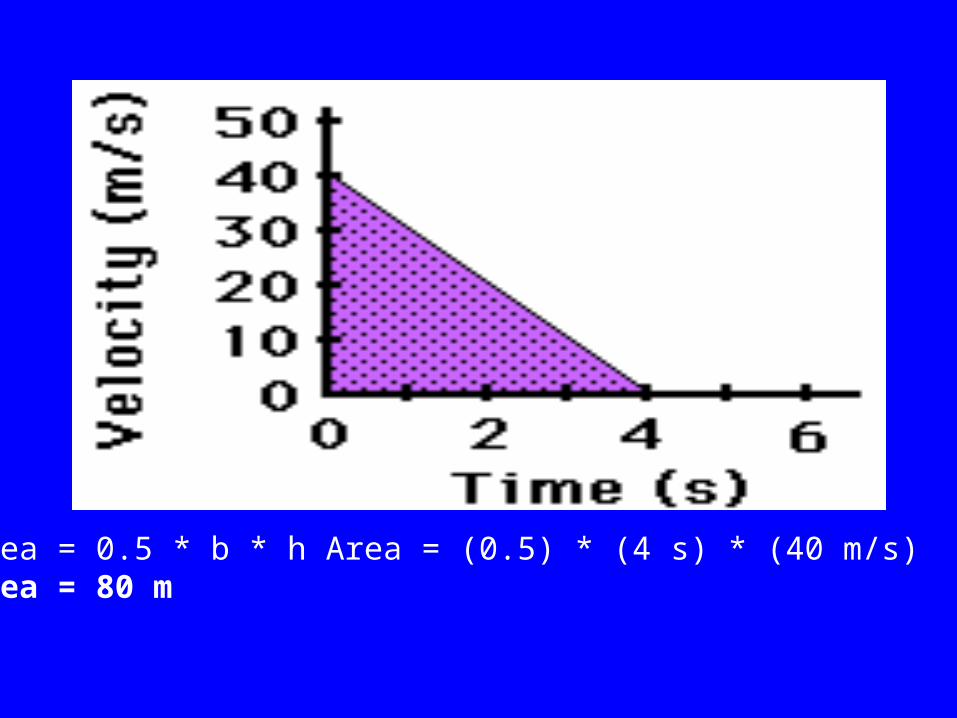
Area = 0.5 * b * h Area = (0.5) * (4 s) * (40 m/s)Area = 80 m
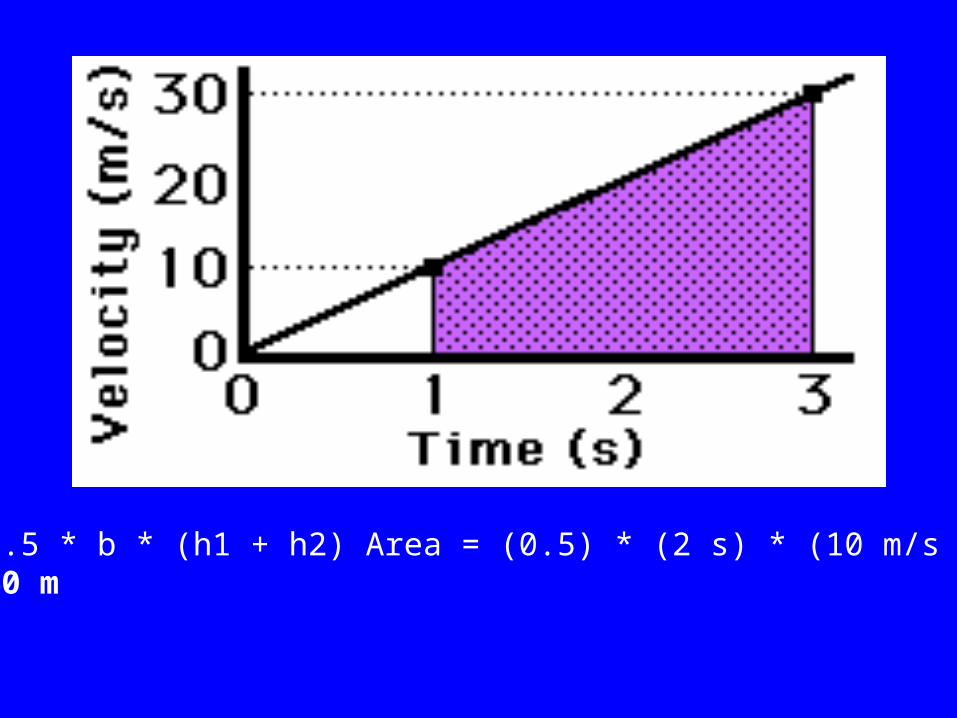
Area = 0.5 * b * (h1 + h2) Area = (0.5) * (2 s) * (10 m/s + 30 m/s)Area = 40 m
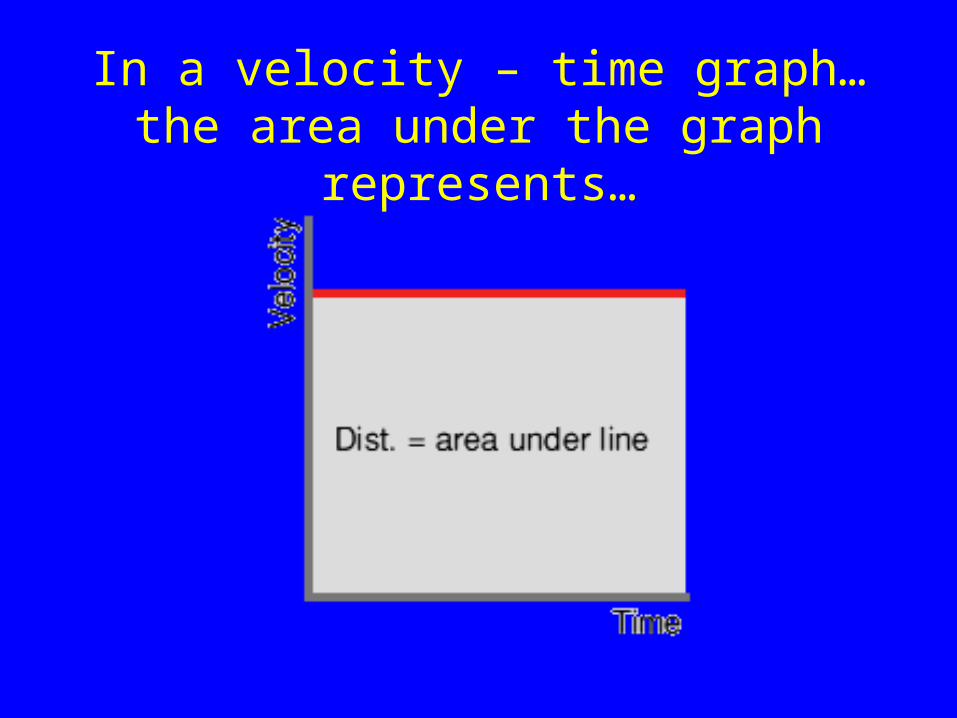
In a velocity – time graph…the area under the graph
represents…
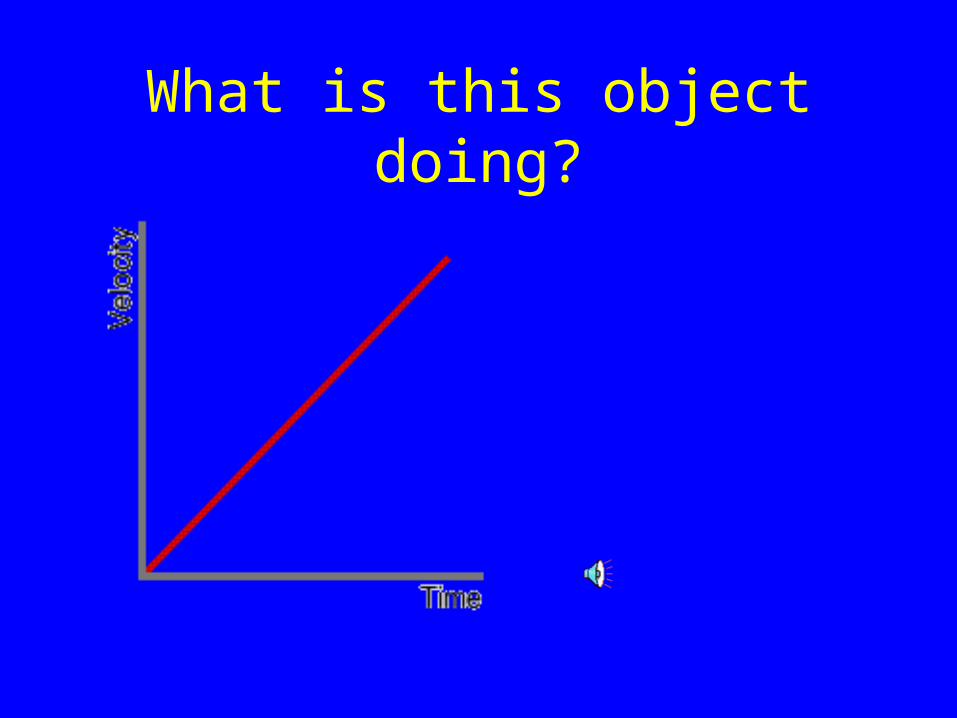
What is this object doing?
Moving with constant acceleration - velocity increasing at a steady
rate from rest (0) example: car accelerating from 0 to 60 mph - typical
car test trial
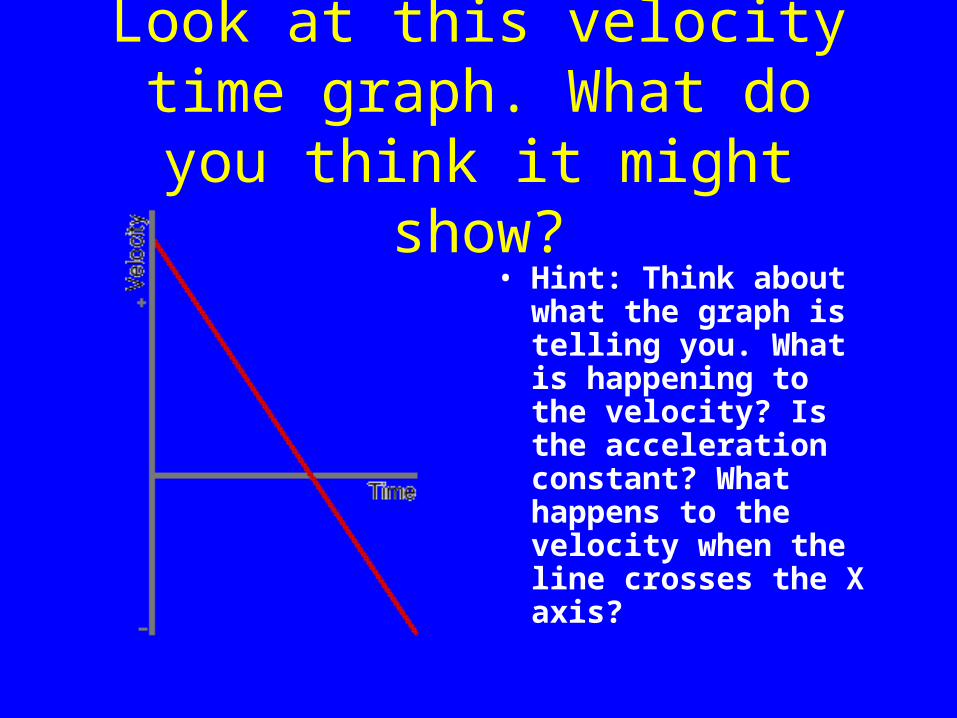
Look at this velocity time graph. What do you think
it might show?• Hint: Think about
what the graph is telling you. What is happening to the velocity? Is the acceleration constant? What happens to the velocity when the line crosses the X axis?
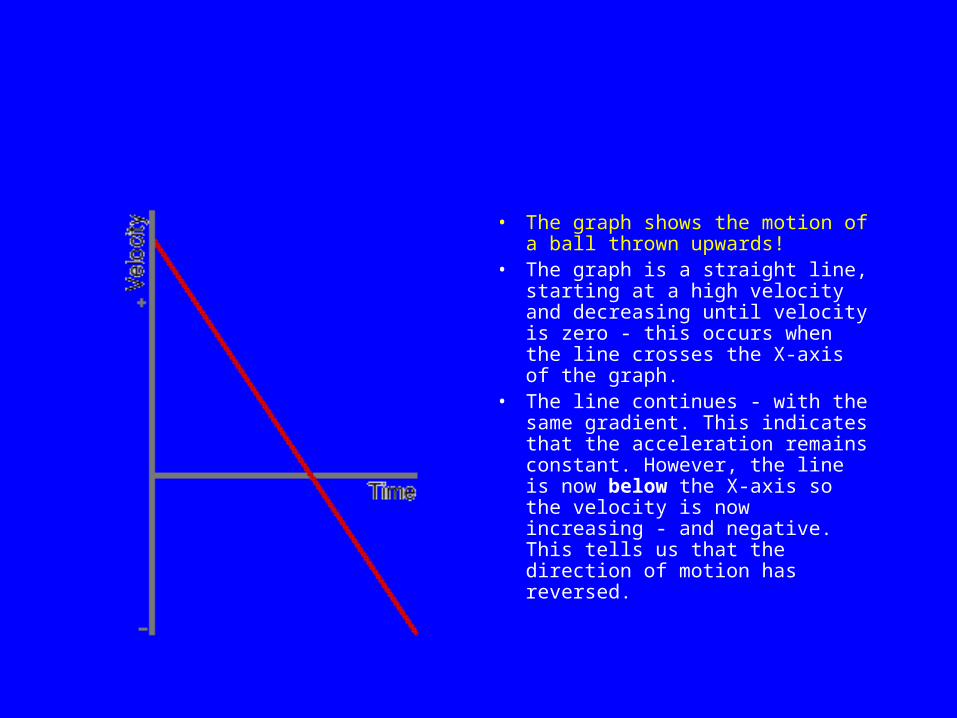
• The graph shows the motion of a ball thrown upwards!
• The graph is a straight line, starting at a high velocity and decreasing until velocity is zero - this occurs when the line crosses the X-axis of the graph.
• The line continues - with the same gradient. This indicates that the acceleration remains constant. However, the line is now below the X-axis so the velocity is now increasing - and negative. This tells us that the direction of motion has reversed.

Think about This Clue…
...now think about this
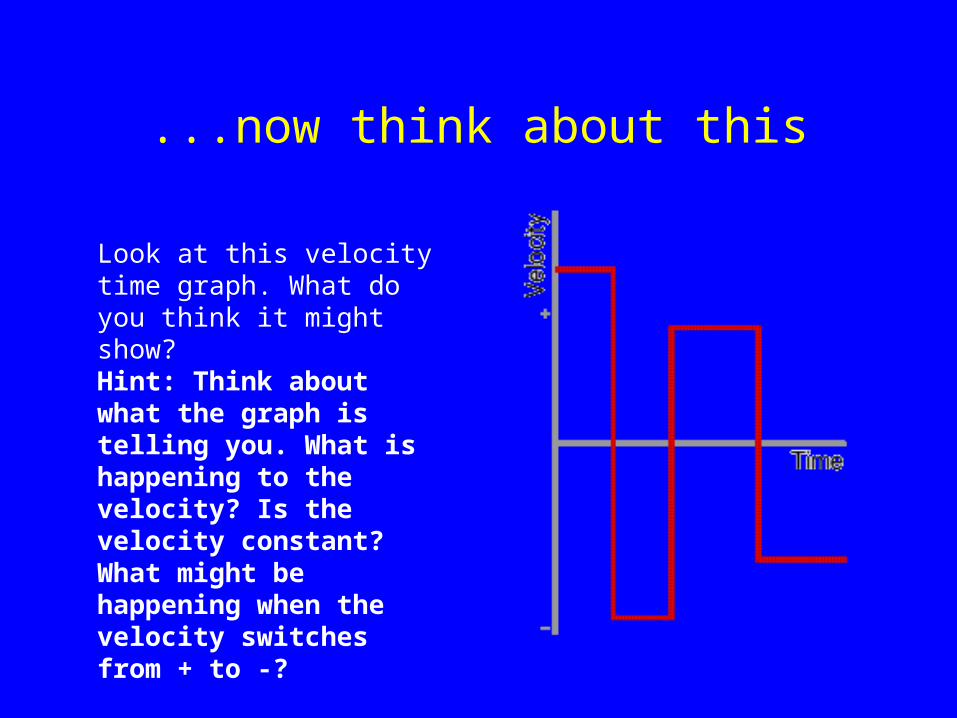
Look at this velocity time graph. What do you think it might show? Hint: Think about what the graph is telling you. What is happening to the velocity? Is the velocity constant? What might be happening when the velocity switches from + to -?
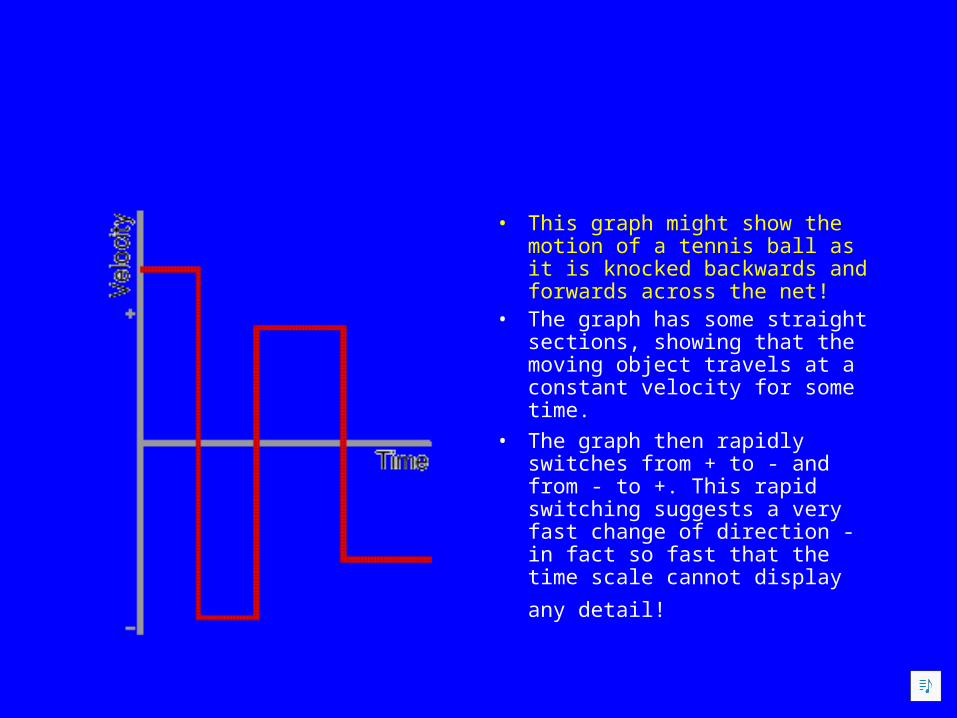
• This graph might show the motion of a tennis ball as it is knocked backwards and forwards across the net!
• The graph has some straight sections, showing that the moving object travels at a constant velocity for some time.
• The graph then rapidly switches from + to - and from - to +. This rapid switching suggests a very fast change of direction - in fact so fast that the time scale cannot
display any detail!
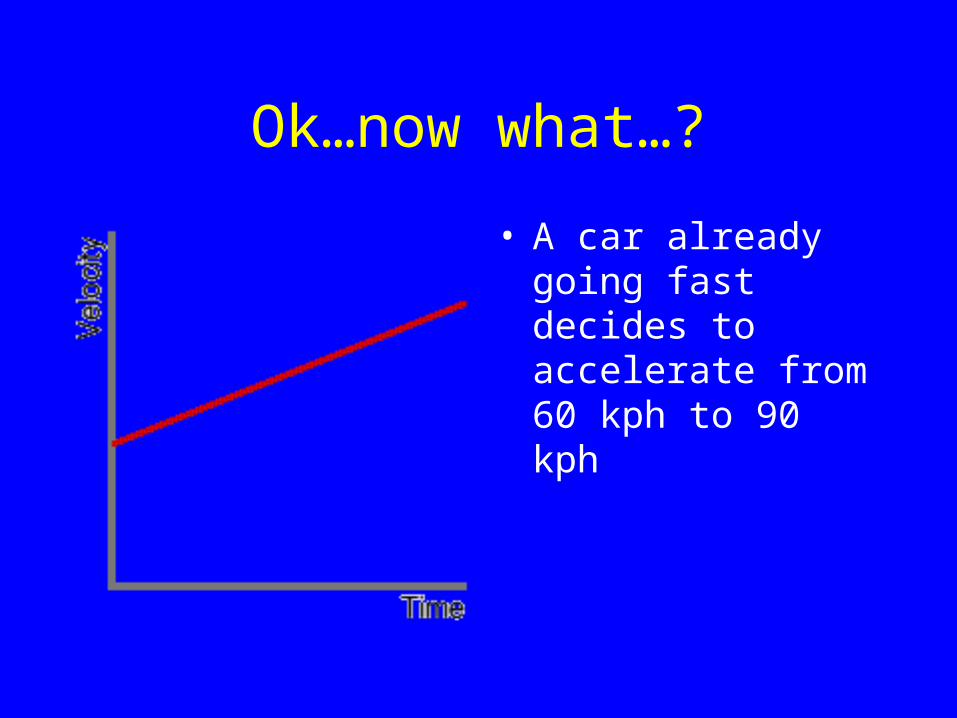
Ok…now what…?
• A car already going fast decides to accelerate from 60 kph to 90 kph
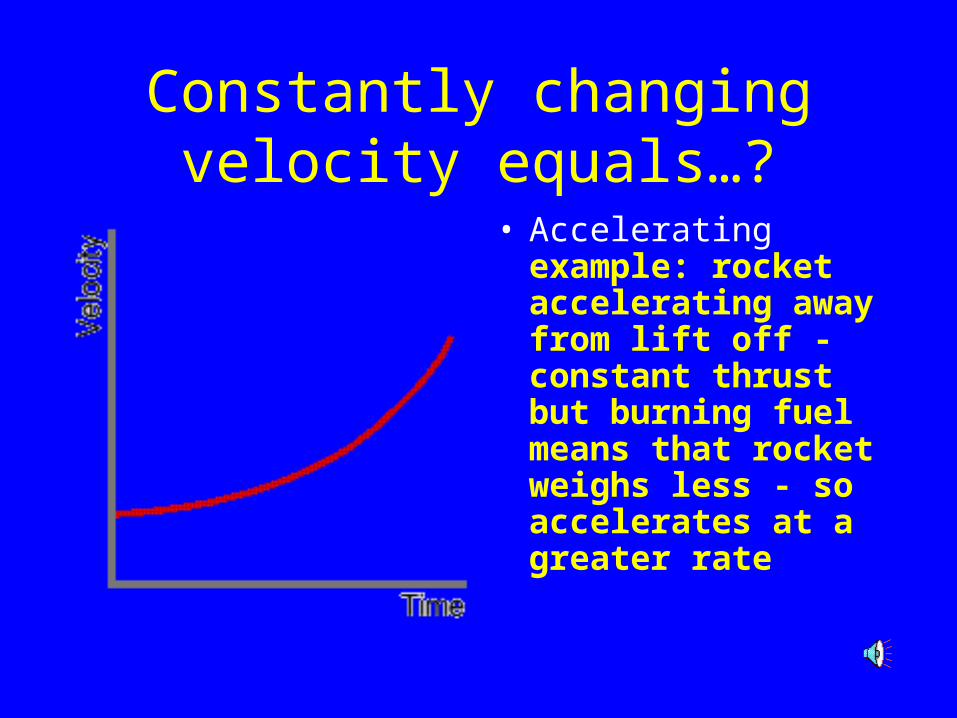
Constantly changing velocity equals…?
• Accelerating example: rocket accelerating away from lift off - constant thrust but burning fuel means that rocket weighs less - so accelerates at a greater rate

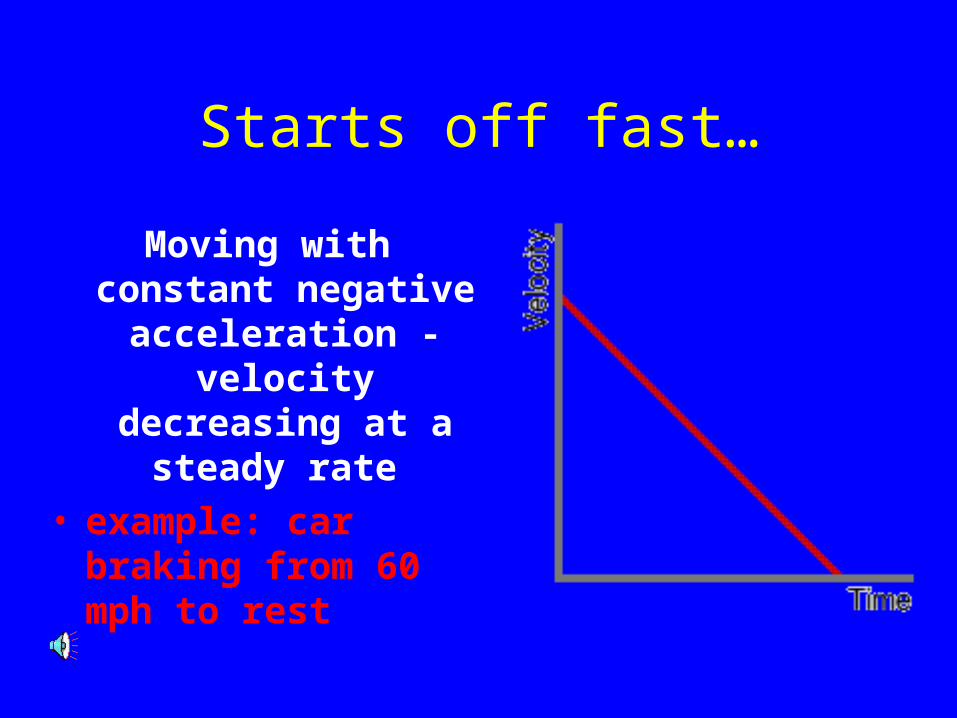
Starts off fast…
Moving with constant negative
acceleration - velocity
decreasing at a steady rate
• example: car braking from 60 mph to rest
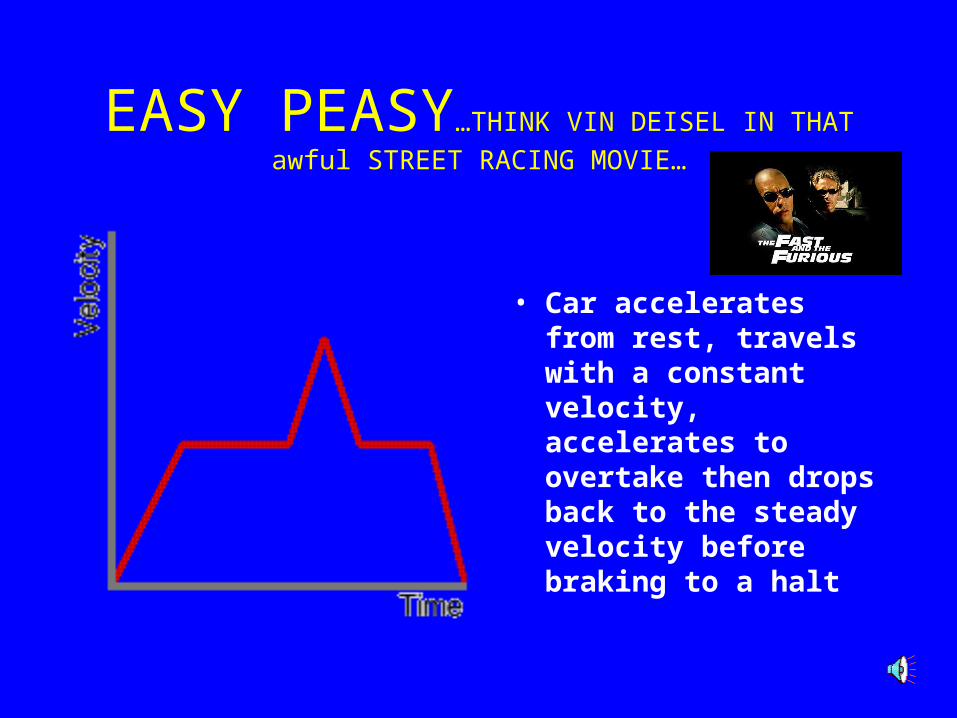
EASY PEASY…THINK VIN DEISEL IN THAT awful STREET RACING MOVIE…
• Car accelerates from rest, travels with a constant velocity, accelerates to overtake then drops back to the steady velocity before braking to a halt
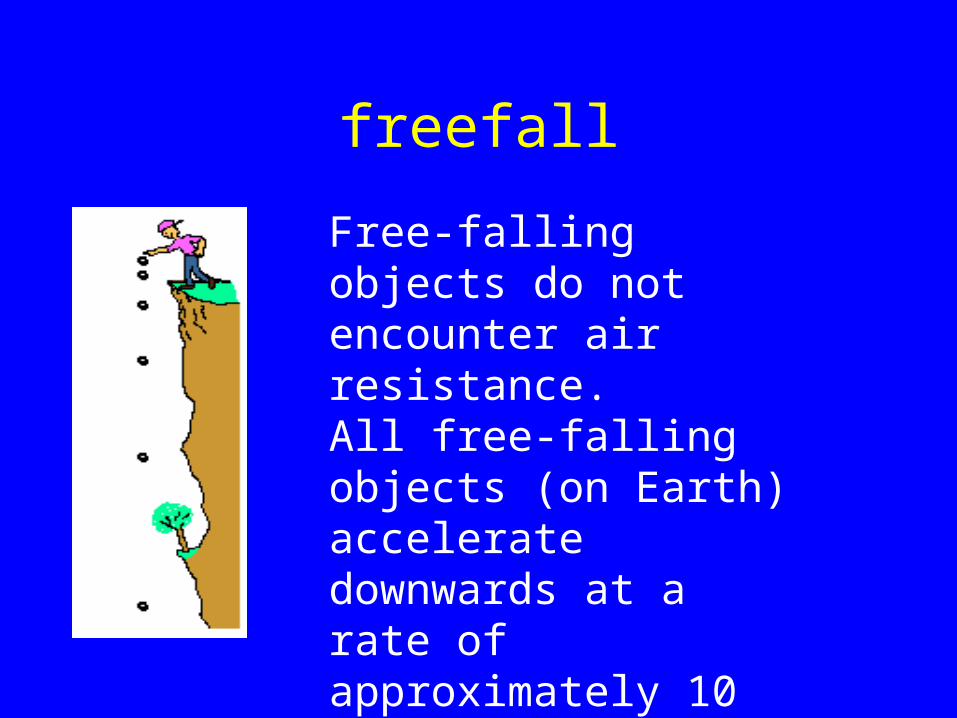
freefall
Free-falling objects do not encounter air resistance. All free-falling objects (on Earth) accelerate downwards at a rate of approximately 10 m/s/s (to be exact, 9.8 m/s/s)
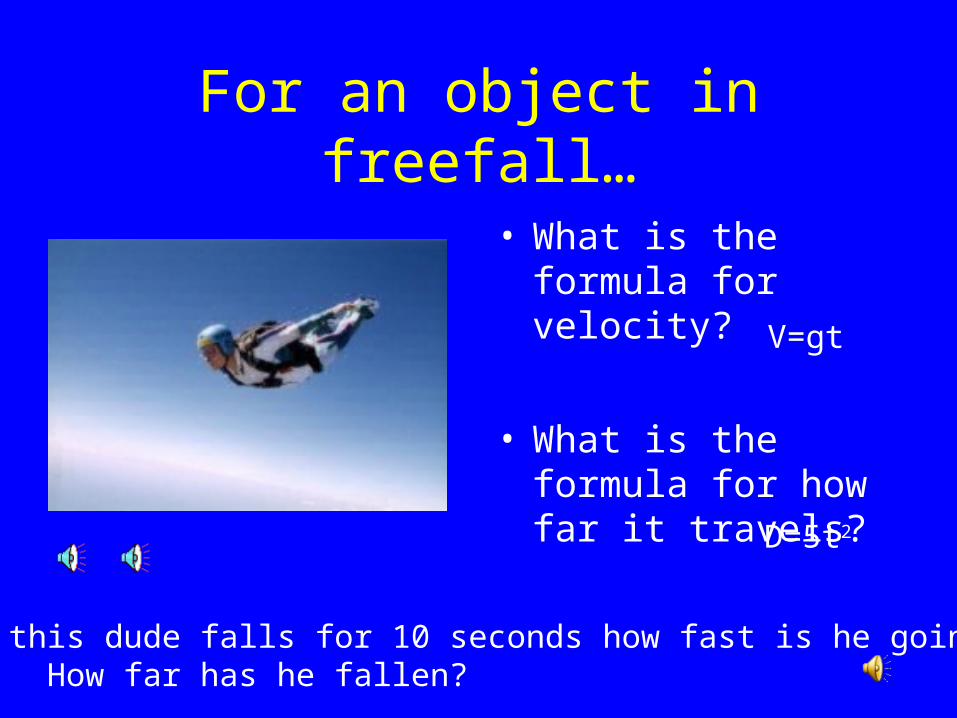
For an object in freefall…
• What is the formula for velocity?
• What is the formula for how far it travels?
So…if this dude falls for 10 seconds how fast is he going? How far has he fallen?
V=gt
D=5t2