kind report - kidney health...
TRANSCRIPT

KinD Report (Kidneys in Diabetes)
Temporal trends in the epidemiology of diabetic kidney disease and the associated health care burden in Australia
Sarah White and Steve ChadbanKidney Research NodeRoyal Prince Alfred Hospital and Charles Perkins Centre, University of Sydney
April 2014
KIDNEY HEALTH AUSTRALIA125 Cecil Street,
South Melbourne, VIC 3205Phone: +61 3 9674 4300 Freecall: 1800 454 363
www.kidney.org.au
Kidney Health Australia is a national health care charity with a vision ‘to save and improve the lives of Australians affected by kidney
disease’. As the national peak body, Kidney Health Australia promotes good kidney health through delivery of programs in education,
advocacy, research and support.

Acknowledgements
This report was produced by Dr Sarah White and Professor Steve Chadban at the Kidney Research Node, Royal Prince Alfred Hospital and University of Sydney for Kidney Health Australia. Funding for this report was provided as an unconditional education grant from Boehringer Ingelheim. In no way has Boehringer Ingelheim had any part in the direction, analysis or findings contained within this report.

Contents Key Points
Abbreviations and Definitions
Executive Summary
1. The current and potential future burden of DKD in Australia
1.1. Prevalence of DKD in Australian adults: the AusDiab study
1.2. National trends in rates of DM-ESKD
1.3. Predicting the future burden of DM-ESKD in Australia
2. Morbidity and mortality in DKD
2.1. The effects of kidney disease on diabetes outcomes
2.2. Trends in diabetes attributable deaths and the contribution of kidney failure
3. The costs of treating DKD and DM-ESKD
3.1. The costs of treating pre-end stage DKD
3.2. International trends in costs of DM-ESKD
4. International trends in the incidence of DM-ESKD
5. Conclusions and policy recommendations
References
1
2
3
6
6
7
11
14
14
15
17
17
17
20
23
26
1
Key Points Diabetes mellitus is the leading cause of end-stage kidney disease in Australia
Diabetes mellitus is the most common cause of new cases of end-stage kidney diseasetreated with kidney replacement therapy: nearly 5000 Australians with end-stage kidney disease due to diabetes are currently dependent upon a kidney transplant or dialysis for survival. In addition, the number of Australian’s who die from untreated end-stage kidney disease due to diabetes each year far exceeds the number commencing treatment.
Early stage diabetic kidney disease is extremely common in Australia
Approximately 250,000 Australian adults have early-stage diabetic kidney disease that does not yet require dialysis or transplantation. For every Australian receiving kidney replacement therapy due to diabetes, over 60 others have earlier stages of diabetic kidney disease. The prevalence of Type 2 diabetes is projected to increase from 1 million in 2000 to over 2 million by 2025. Of this number, approximately 25% will develop diabetic kidney disease. Thus the prevalence of diabetic kidney disease will potentially double over this interval.
Diabetic kidney disease is associated with a large and costly disease burden in Australia
People with diabetic kidney disease are at significant risk of developing end-stage kidney disease, but are at much greater risk of premature cardiovascular morbidity and all-cause mortality. Higher rates of hospitalization, utilisation of specialist services and prescription drugs mean that those with diabetic kidney disease incur significantly greater health care costs compared to those with diabetes or chronic kidney disease alone. Costs increase with increasing severity of diabetic kidney disease; for those that reach end-stage kidney disease, dialysis and transplantation are extremely costly therapies - particularly when complicated by diabetes. The direct health care cost of providing kidney replacement therapy to people with end-stage kidney disease due to diabetes in Australia is approximately $300 million per annum. However, due to the much higher prevalence of earlier stages of diabetic kidney disease, the total associated direct health care costs approach $1 billion per annum.
Early detection and better management of diabetic kidney disease has reduced the incidence of treated end-stage kidney disease due to diabetes internationally
In the United States, whilst the prevalence of diabetic kidney disease continues to increase in parallel with the rising prevalence of type 2 diabetes mellitus, the incidence of treated end-stage kidney disease due to diabetes has stabilised. Simultaneous improvements in use of renin-angiotensin inhibitors and improved glycaemic control have likely contributed to this trend. Primary prevention, maximising early detection of diabetic kidney disease and optimal management of diabetes and kidney disease hold great potential to attenuate the future health burden attributable to diabetic kidney disease in Australia.

2
Abbreviations and Definitions
ACR urinary albumin:creatinine ratio
ACE-I Angiotensin converting enzyme inhibitor
ARB Angiotensin receptor blocker
Albuminuria ACR >2.5mg/mmol (for men) or >3.5mg/mmol (for women)
CKD Chronic kidney disease, defined as albuminuria, proteinuria and/or eGFR<60mL/min/1.73m² present for at least 3 months
DKD Diabetic kidney disease: defined as persistent albuminuria (urinary albumin:creatinine ratio >3.5mg/mmol) and/or eGFR<60mL/min/1.73m²
DM-ESKD End-stage kidney disease caused by diabetes mellitus
ESKD End-stage kidney disease, defined by eGFR <15mL/min/1.73m², which is generally inadequate to sustain life beyond several months without use of KRT. Also referred to as Stage 5 CKD.
HbA1c Glycosylated haemoglobin concentration
KRT Kidney replacement therapy, via dialysis or kidney transplantation
T1DM Type 1 Diabetes Mellitus
T2DM Type 2 Diabetes Mellitus
KinD Report 2014
3
Executive Summary
In Australia, as is the case in an increasing number of countries internationally, diabetes is now the leading cause of incident end-stage kidney disease (DM-ESKD).People with ESKD require kidney-replacement therapy (KRT) with either dialysis or transplantation, or will otherwise die from the effects of kidney failure (untreated ESKD). The number of individuals who die in Australia from untreated ESKD caused by diabetes mellitus (DM-ESKD) almost certainly exceeds the number commencing KRT for this condition each year.
DM-ESKD is the most obvious manifestation of diabetic kidney disease (DKD), however a much larger number of people with diabetes have lesser degrees of DKD, manifested by albuminuria, reduced kidney function (eGFR<60mL/min/1.73m²), or both. In 2012, 4727 Australians with DM-ESKD were receiving dialysis or living witha functioning transplant. At the same time, an estimated 250,000 Australians had earlier stages of DKD. This population is at high risk not only of ESKD, but also of cardiovascular events and premature death.
The management of ESKD is extremely expensive: direct health care costs associated with the management of ESKD in Australia, based on in-centre haemodialysis (the treatment modality for 63% of DM-ESKD patients), were estimated to be approximately $80,000 per person in 2010. People with diabetes typically exhibit a greater burden of comorbidities and, for this and other reasons, incur greater costs compared to non-diabetic KRT recipients. We estimate that direct health care costs related to the management of DM-ESKD with dialysis or transplantation in Australia exceed $300 million per annum in total, based on a current DM-ESKD population of close to 5000 individuals. Furthermore, recent Canadian, US and Australian data have demonstrated that the management of earlier stages of kidney disease also incurs higher costs when diabetes is present, compared to the non-diabetic population with chronic kidney disease (CKD). As the prevalence of DKD vastly exceeds DM-ESKD prevalence, total direct costs associated with the management of pre-end-stage DKD actually exceed those associated with the provision of KRT.
Internationally, distinct temporal trends are emerging with respect to the epidemiology of DKD. Globally, the prevalence of Type 2 diabetes (T2DM) continues to grow dramatically. Data from successive waves of the United States National Health and Nutrition Examination Survey have demonstrated: (i) ongoing increases in diabetes prevalence; (ii) corresponding increases in the total number of adults with DKD; and, (iii) significant improvements in diabetes management (specifically greater use of ACE-inhibitors and ARBs and improved glycaemic control). Data simultaneously reported by the United States Renal Data System have demonstrated a significant and progressive reduction in the incidence of treated DM-ESKD in the diabetes population.

Similar data exist for multiple European countries. The most likely explanation for these trends is that better management of diabetes and the primary and secondary prevention of diabetes-related kidney disease have been successful in delaying the progression of disease to DKD and DM-ESKD. Recent trends toward the stabilization of DM-ESKD incidence in Australia suggest that improved diabetes management may be beginning to have a similar impact here.
In summary, the health care burden associated with DKD and DM-ESKD in Australia is significant and expanding, driven primarily by the steady growth in T2DM prevalence over the past three decades. The contribution of pre-ESKD DKD to this health care burden has been under-appreciated; total per annum costs to the health system are likely to exceed those associated with KRT provision by approximately three-fold. Although the incidence of DM-ESKD may be slowing, the predicted doubling in the prevalence of T2DM in Australia between 2000 and 2025 indicate that, in absolute terms, the number of Australian adults living with DKD will continue to grow substantially. Minimising the health care burden associated with this population, and maximizing health outcomes, will depend on the success of primary and secondary prevention strategies. Preventing the progression of diabetes to DKD and then to DM-ESKD through glycaemic control, blood pressure control, and renin-angiotensin blockade will be critical in addressing the health burden attributable to DKD in Australia.
4
Nearly 5,000 Australians with end-stage kidney disease due to diabetes are currently dependent upon dialysis or a kidney transplant for survival. By comparison, an estimated 250,000 Australians are living with earlier stages of diabetic kidney
disease and are at high risk not only of end-stage kidney disease, but also cardiovascular events and death.
KinD Report 2014

5
Figure 1: Flow chart of the burden of diabetes-related chronic and end-stage kidney disease in Australia, with approximate costings at each stage of disease severity
a Walls H et al. Projected progression of the prevalence of Obesity in Australia. Obesity, 2012; 20:872-878b Population Projections,. Australian Bureau of Statistics, data series 3222.0, release 26 Nov 2013. Canberra,.c Magliano D et al. Lifetime risk and projected population prevalence of diabetes. Diabetologia, 2008; 51,: 2179-2186d Wyld M, unpublished datae McBrien K et al. Diabetes Care, 2013; 36:1172-1180f Adapted from NSW dialysis costing study, New South Wales Health, 2008, and The Economic Impact of End-Stage Kidney Disease in Australia: Projections to 2020. Report to Kidney Health Australia, 2010

6
1. The current and potential future burden of DKD in Australia
1.1. Prevalence of DKD in Australian adults: the AusDiab study
DKD may be defined as the presence of persistent albuminuria, proteinuria and/or eGFR<60 mL/min/1.73m² in a person with diabetes. As is the case in the non-diabetic population, both albuminuria and reduced eGFR are independently associated with increased risk of premature cardiovascular and all-cause mortality and risk of progression to ESKD. The magnitude of risk is proportional to the magnitude of the abnormality for both parameters and is significantly greater in those with diabetes compared to those without (1).
The baseline AusDiab Study conducted in 1999/2000 found that among Australian adults (25 years and older) with diabetes, 27% had evidence of DKD (Table 1).Confining this result to individuals with albuminuria alone (excluding isolated eGFR <60 mL/min/1.73m²) gave a similar result (25%). These data suggest that approximately a quarter of a million Australians have DKD, and because of this are at high risk of progression to DM-ESKD, cardiovascular events and premature death By comparison, the prevalence of DKD in the United States diabetic population was 40%, according to the results of the 2005-2010 NHANES survey (2).
Table 1: Estimated prevalence of CKD and albuminuria in the Australian adult population aged 25 years and older, stratified by presence of diabetes (known and unknown) and age group.
Based on AusDiab data, the vast majority (94%) of the adult diabetes population with evidence of kidney damage exhibited albuminuria, either alone or in combination with a low estimated eGFR. Only an estimated 6% of diabetic nephropathy was indicated by a low eGFR alone, where eGFR was calculated according to the CKD-EPI equation. By comparison, of the CKD population without diabetes, an estimated 24% have an eGFR<60 mL/min/1.73m² in the absence of albuminuria. The proportion of the diabetes population with normoalbuminuric CKD, however,
7
1. The current and potential future burden of DKD in Australia
1.1. Prevalence of DKD in Australian adults: the AusDiab study
DKD may be defined as the presence of persistent albuminuria, proteinuria and/or eGFR<60
ml/min/1.72m2 in a person with diabetes. As is the case in the non-diabetic population, both albuminuria
and reduced eGFR are independently associated with increased risk of premature cardiovascular and all-
cause mortality and risk of progression to ESKD. The magnitude of risk is proportional to the magnitude of
the abnormality for both parameters and is significantly greater in those with diabetes compared to those
without (1).
The baseline AusDiab Study conducted in 1999/2000 found that among Australian adults (25
years and older) with diabetes, 27% had evidence of DKD (Table 1). Confining this result to individuals
with albuminuria alone (excluding isolated eGFR <60 ml/min/1.73m2) gave a similar result (25%). These
data suggest that approximately a quarter of a million Australians have DKD, and because of this are at
high risk of progression to DM-ESKD, cardiovascular events and premature death. By comparison, the
prevalence of DKD in the United States diabetic population was 40%, according to the results of the 2005-
2010 NHANES survey (2).
Table 1: Estimated prevalence of CKD and albuminuria in the Australian adult population aged 25 years and older, stratified by presence of diabetes (known and unknown) and age group.
Estimated prevalence of CKDa Estimated prevalence of albuminuriab
N % (95% CI) N % (95% CI) Diabetes
25-44 years 16,600* 22.2 (10.5-41.0)* 16,300* 22.0 (10.2-40.9)* 45-64 years 67,500 18.9 (14.3-24.5) 65,500 18.3 (14.2-23.4) 65+ years 151,000 34.9 (27.3-43.2) 137,000 31.1 (23.8-39.6) All (25+) 235,000 27.2 (22.5-32.5) 219,000 25.1 (20.3-30.6)
No Diabetes 25-44 years 166,000 2.9 (2.4-3.6) 157,000 2.8 (2.2-3.4) 45-64 years 217,000 5.9 (4.5-7.7) 183,000 5.0 (3.9-6.4) 65+ years 475,000 26.9 (22.2-30.2) 290,000 15.9 (12.9-19.5) All (25+) 858,000 7.7 (6.4-9.3) 631,000 5.7 (4.7-6.8)
a CKD defined as an eGFR<60 mL/min/1.73m² (estimated according to the CKD-EPI equation) OR presence of albuminuria (albumin to creatinine ratio >2.5 mg/mmol in males, >3.5 mg/mmol in females) OR presence of proteinuria (protein to creatinine ratio >200 mg/g) bAlbuminuria defined as albumin to creatinine ratio >2.5 mg/mmol in males, >3.5 mg/mmol in females *Estimate unreliable
Based on AusDiab data, the vast majority (94%) of the adult diabetes population with evidence of
kidney damage exhibited albuminuria, either alone or in combination with a low estimated eGFR. Only an
estimated 6% of diabetic nephropathy was indicated by a low eGFR alone, where eGFR was calculated
according to the CKD-EPI equation. By comparison, of the CKD population without diabetes, an estimated
KinD Report 2014

7
increases with older age and will be affected by the proportion of patients receiving treatment with ACE inhibitors and ARBs as these drugs directly reduce albuminuria (3,4).
This distribution of markers of kidney damage in the diabetic and non-diabetic population was consistent with data for the United States population (5). Comparing the 1988-1994 and 2005-2010 waves of the NHANES survey, albuminuria prevalence declined in the United States diabetes population from 36% to 30% over this interval, whilst the prevalence of eGFR<60mL/min/1.73m² increased from 16% in 1998-1994 to 19% in 2005-2010. These two observations are indicative of competing trends with respect to DKD that may have important implications for the future burden of DKD in the Australian population: (i) the aging of the diabetes population due to increasing incidence of late onset T2DM and improved survival among the diabetes population, increasing the prevalence of low eGFR, and (ii) the impact of increased use of ACE inhibitors and ARB’s on albuminuria prevalence. The distribution of markers of CKD in the population with diabetes has important implications for approaches to screening and disease prevention, and therefore an understanding of temporal trends in the prevalence of albuminuria and low eGFR is necessary to guide approaches to detection and management of DKD.
1.2. National trends in rates of DM-ESKD
Of approximately 250,000 Australians with DKD, 913 commenced treatment for ESKD with aprimary diagnosis of diabetic nephropathy in 2012. By comparison,the numbers of patients commencing treatment with a primary diagnosis of glomerulonephritis or hypertensive renal disease, the next two leading causes of kidney failure, were 490 and 303 respectively. These figures correspond to an annual incidence of treated DM-ESKD among Australian adults 25 years and older with diabetes (diagnosed and undiagnosed) of approximately 1 case per thousand.
Over the past two decades, DKD has rapidly emerged as the single leading cause of ESKD among patients commencing kidney replacement therapy (KRT) in Australia.
8
24% have an eGFR<60 ml/min/1.73m2 in the absence of albuminuria. The proportion of the diabetes
population with normoalbuminuric CKD, however, increases with older age and will be affected by the
proportion of patients receiving treatment with ACE inhibitors and ARBs as these drugs directly reduce
albuminuria (3,4).
This distribution of markers of kidney damage in the diabetic and non-diabetic population was
consistent with data for the United States population (5). Compared to the 1988-1994 NHANES survey,
albuminuria prevalence declined in the United States diabetes population from 36% to 30% over this
interval, whilst the prevalence of eGFR<60 ml/min/1.72m2 increased from 16% in 1988-1994 to 19% in
2005-2010. These two observations are indicative of competing trends with respect to DKD that may have
important implications for the future burden of DKD in the Australian population: (i) the aging of the
diabetes population due to increasing incidence of late onset T2DM and improved survival among the
diabetes population, increasing the prevalence of low eGFR, and (ii) the impact of increased use of ACE
inhibitors and ARB’ s on albuminuria prevalence. The distribution of markers of CKD in the population
with diabetes has important implications for approaches to screening and disease prevention, and
therefore an understanding of temporal trends in the prevalence of albuminuria and low eGFR is necessary
to guide approaches to detection and management of DKD.
CKD with diabetes CKD without diabetes
Figure 2: Prevalence of albuminuria and eGFR<60 mL/min/1.73m2 in the adult population with CKD, by diabetes status.
1.2. National trends in rates of DM-ESKD
Of approximately 250,000 Australians with DKD, 913 commenced treatment for ESKD with a
primary diagnosis of diabetic nephropathy in 2012. By comparison, the numbers of patients commencing
treatment with a primary diagnosis of glomerulonephritis or hypertensive renal disease, the next two
leading causes of kidney failure, were 490 and 303 respectively. These figures correspond to an annual
Albuminuria 79%
eGFR <6015% 6%
Albuminuria 67%
eGFR <609% 24%

8
Of all incident KRT patients in 2012, 38% had a primary diagnosis of DM-ESKD, compared to 13% in 1991. Indeed most of the overall increase in the annual number of patients commencing
KRT, from 979 new patients in 1991 to 2379 patients in 2012, is due to the more than 600% increase in the number of incident patients with DM-ESKD over this period (Figure 3). This growth cannot be explained by demographic factors: after adjusting for age, sex and race, the incidence of KRT due to DM-ESKD still increased by 7% per annum. Instead, incidence trends with respect to DM-ESKD are predominantly due to the increased prevalence of T2DM in the Australian population, improved survival among those with diabetes, and a greater willingness to treat older and sicker ESKD patients (6). This is consistent with international trends; for example one-third of the growth in ESKD cases overall in the United States over the period from 1978-1991 is estimated to be attributable to increased diabetes prevalence (7).
As of 2012, the prevalence of DM-ESKD in Australia was 208 per million population (Figure 4). This follows a growth of 130% in the rate of DM-ESKD over the past decade a rate of growth similar to the UK but substantially higher than has been observed in the United States and several countries in Europe (Table 2).
10
Table 2: International comparison of the increasing rate of DM-ESKD, from 2000 to 2010
Crude rate of DM-ESKD (pmp)a Diabetes prevalence (crude %)b
Obesity prevalence (adult, crude %)c
Population over 60 years (%)c 2000 2010 % change
Australia 80.6 196.6 +130.0% 10.0% 26.8% 19.5%
United States 556.2 710.3 +27.7% 10.9% 33.0% 18.9%
Austria 130.5 210.6 +61.3% 9.3% 20.9% 23.5%
Norway 52.1 105.3 +102% 5.9% 21.5% 21.4%
The Netherlands 54.6 100.6 +84.2% 7.5% 18.8% 23.0%
Spain, Catalonia 104.9 157.7 +50.3% 10.8% 26.6% 22.9%
United Kingdom 53.1 119.1 +124.2% 6.6% 26.9% 23.1%
aUSRDS 2013 Annual Report and ERA-EDTA Annual Reports 2000 and 2010. bIDF Diabetes Atlas 6th Edition. International Diabetes Federation, 2013. c World Health Organization Global Health Observatory.
Figure 3: Trends in the incidence of ESKD in Australia by primary cause
0
5
10
15
20
25
30
35
40
45
Inci
denc
e (p
mp)
Diabetic nephropathy
Glomerulonephritis
Hypertension
Polycystic disease
Reflux
Uncertain
The rate of end-stage diabetic kidney disease treated withdialysis or kidney transplantation in Australia more than
doubled (130 per cent) between 2000 and 2010 – one of the largest increases of any developed country.
KinD Report 2014

9
11
Figure 4: Growth in the prevalence of ESKD by primary renal disease in Australia, 1982-2011
Compounding the health system burden of treating a growing prevalence of DM-ESKD is the fact
that the proportion of this population being treated with KRT in the presence of multiple comorbidities is
also increasing: currently 70% of treated DM-ESKD patients in Australia have two or more comorbidities
(6). In the absence of successful secondary prevention, increasing diabetes prevalence in the Australian
population will drive a growing burden of DM-ESKD that is likely to be progressively more complex and
costly to treat on a per person per year basis, with significantly worse expected outcomes.
However, it must also be noted that the observed incidence of DM-ESKD in Australia appears to potentially be stabilizing at ~40 cases per million population per annum (
0
50
100
150
200
250
300
350
Prev
alen
ce (
pmp)
Diabetic nephropathyGlomerulonephritisHypertensionRefluxPolycystic diseaseOtherUncertain
0
5
10
15
20
25
30
35
40
45
Inci
denc
e (p
mp)
Diabetic nephropathy
Glomerulonephritis
Hypertension
Polycystic disease
Reflux
Uncertain
10
United States 556.2 710.3 +27.7% 10.9% 33.0% 18.9%
Austria 130.5 210.6 +61.3% 9.3% 20.9% 23.5%
Norway 52.1 105.3 +102% 5.9% 21.5% 21.4%
The Netherlands 54.6 100.6 +84.2% 7.5% 18.8% 23.0%
Spain, Catalonia 104.9 157.7 +50.3% 10.8% 26.6% 22.9%
United Kingdom 53.1 119.1 +124.2% 6.6% 26.9% 23.1%
aUSRDS 2013 Annual Report and ERA-EDTA Annual Reports 2000 and 2010. bIDF Diabetes Atlas 6th Edition. International Diabetes Federation, 2013. c World Health Organization Global Health Observatory.
Figure 3: Trends in the incidence of ESKD in Australia by primary cause
0
5
10
15
20
25
30
35
40
45
Inci
denc
e (p
mp)
Diabetic nephropathyGlomerulonephritisHypertensionPolycystic diseaseRefluxOtherUncertain

10
Compounding the health system burden of treating a growing prevalence of DM-ESKD is the fact that the proportion of this population being treated with KRT in the presence of multiple comorbidities is also increasing: currently 70% of treated DM-ESKD patients in Australian have two or more comorbidities (6). In the absence of successful secondary prevention, increasing diabetes prevalence in the Australian population will drive a growing burden of DM-ESKD that is likely to be progressively more complex and costly to treat on a per person per year basis, with significantly worse expected outcomes.
However, it must also be noted that the observed incidence of DM-ESKD in Australia appears to potentially be stabilizing at ~40 cases per million population per annum (Figure 3). In addition, the relative risk of commencing KRT due to DM-ESKD has been decreasing for indigenous Australians over the period from 1990 to 2010,despite rates of DM-ESKD that are vastly higher than those of the non-indigenous population (6). The reasons for these recent trends with respect to the incidence of DM-ESKD are likely to be two-fold. First, diagnosis is increasingly occurring later in life, with less time to develop DKD, as well as earlier in the course of disease, introducing lead-time bias. Thus, the proportion of the prevalent diabetes population at risk of DKD may be diminishing over time, while overall diabetes prevalence increases. Secondly, as noted in the previous section, significant gains have been made with respect to the primary and secondary prevention of DKD since the mid-1990’s, reducing the risk of developing DKD and the rate at which DKD progresses to ESKD. Understanding these trends is critical to projecting the future burden of DM-ESKD in Australia. Currently, longitudinal data describing trends in the incidence and prevalence of CKD in the Australian diabetes population are not available.
KinD Report 2014

11
1.3. Predicting the future burden of DM-ESKD in Australia
The natural history of DKD
The United Kingdom Prospective Diabetes Study (UKPDS), conducted between 1977 and 1997, found that one-quarter of patients with T2DM develop evidence of kidney damage (albuminuria) within 10 years of diagnosis (8). This is consistent with earlier studies of the development of DKD in T1DM patients, showing onset at approximately 5-10 years post-diagnosis and peaking at 10-19 years diabetes duration (9,10). Younger age at diagnosisincreases the probability of developing DKD over the life course, whereas the risk of ESKD for those diagnosed with diabetes later in life may be relatively low (8). This is particularly the case in T2DM: a study of Japanese patients with early onset T1DM or T2DM (diagnosed before the age of 30), found that, after 30 years, the cumulative onset of DKD was more than two-times higher among T2DM than T1DM patients (11).
Geographic differences in patient demographics, such as racial mix and age, and health care practice patterns, including approaches to diagnosis and management of diabetes and DKD, are critical elements in considering the implications of such research. Understanding trends with respect to age of diabetes onset, prevalence of obesity, population age and longevity, diagnostic approaches including use of HbA1c and ACR, and health practice patterns including use of ACE-I and ARBs, are therefore critical in considering the future burden of diabetes-related CKD and ESKD in Australia.
The likely future burden of DM-ESKD in Australia
The linear growth in the incidence of DM-ESKD in the Australian population observed between 1990 and 2005 was driven by three main factors: (i) increased prevalence of T2DM;(ii) improved survival in the diabetes population; (iii) increased access to KRT for DM-ESKD patients. Specifically, the baseline AusDiab study estimated a diabetes prevalence in the Australian population in 2000 of 7.6%, which represents a doubling in the diabetes prevalence rate over the two decades from 1981 to 2000 (12,13). Secondly, between 1997 and 2010, deaths from diabetes-related causes in Australia fell by 20% after standardization for age. Thirdly, acceptance of patients aged 65+ onto KRT expanded rapidly between 1995 and 2001. The goal of future diabetes management will be to consolidate survival gains, while trends with respect to access to KRT for older patients are unlikely to be reversed; therefore minimizing the future burden of DM-ESKD in the Australian population will be dependent on the success of primary and secondary prevention of diabetes and DKD. Future DM-ESKD prevalence will be determined primarily by: (i) trends with respect to diabetes prevalence; (ii) the impact of improved diabetes management and primary prevention of DKD; and (iii) the impact of early detection and secondary prevention of the progression of DKD.
13
1.3. Predicting the future burden of DM-ESKD in Australia
The natural history of DKD
The United Kingdom Prospective Diabetes Study (UKPDS), conducted between 1977 and 1997,
found that one-quarter of patients with T2DM develop evidence of kidney damage (albuminuria) within 10
years of diagnosis (8). This is consistent with earlier studies of the development of DKD in T1DM patients,
showing onset at approximately 5-10 years post-diagnosis and peaking at 10-19 years diabetes duration
(9,10). Younger age at diagnosis increases the probability of developing DKD over the life course, whereas
the risk of ESKD for those diagnosed with diabetes later in life may be relatively low (8). This is
particularly the case in T2DM: a study of Japanese patients with early onset T1DM or T2DM (diagnosed
before the age of 30), found that, after 30 years, the cumulative onset of DKD was more than two-times
higher among T2DM than T1DM patients (11).
Geographic differences in patient demographics, such as racial mix and age, and health care
practice patterns, including approaches to diagnosis and management of diabetes and DKD, are critical
elements in considering the implications of such research. Understanding trends with respect to age of
diabetes onset, prevalence of obesity, population age and longevity, diagnostic approaches including use
of HbA1c and ACR, and health practice patterns including use of ACE-I and ARBs, are therefore critical in
considering the future burden of diabetes-related CKD and ESKD in Australia.
The likely future burden of DM-ESKD in Australia
The linear growth in the incidence of DM-ESKD in the Australian population observed between
1990 and 2005 was driven by three main factors: (i) increased prevalence of T2DM; (ii) improved survival
in the diabetes population; (iii) increased access to KRT for DM-ESKD patients. Specifically, the baseline
AusDiab study estimated a diabetes prevalence in the Australian population in 2000 of 7.6%, which
represents a doubling in the diabetes prevalence rate over the two decades from 1981 to 2000 (12,13).
Secondly, between 1997 and 2010, deaths from diabetes-related causes in Australia fell by 20% after
standardization for age.i Thirdly, acceptance of patients aged 65+ onto KRT expanded rapidly between
1995 and 2001.ii The goal of future diabetes management will be to consolidate survival gains, while trends
with respect to access to KRT for older patients are unlikely to be reversed; therefore minimizing the future
burden of DM-ESKD in the Australian population will be dependent on the success of primary and
secondary prevention of diabetes and DKD. Future DM-ESKD prevalence will be determined primarily by:
(i) trends with respect to diabetes prevalence; (ii) the impact of improved diabetes management and
primary prevention of DKD; and (iii) the impact of early detection and secondary prevention of the
progression of DKD.
i http://www.aihw.gov.au/aihw-national-mortality-database/ ii http://www.anzdata.org.au/v1/annual_reports_download.html

12
On the basis of population aging and current trends with respect to obesity, diabetes prevalence among Australian adults is expected to continue to rise. Assuming that the diabetes incidence and mortality rates observed between 2000 and 2005 are maintained, the prevalence of diabetes among Australian adults aged 25 years and older is projected to reach 11.4% by 2025. However, if obesity trends continue upwards and mortality in the diabetes population continues to decline, then prevalence of diabetes in the population 25 years and older may be as high as 17% by 2025. Taking into account population projections, this means that, compared to an adult diabetes population of ~950,000 in 2000, the number of Australian adults aged 25 years and older with diabetes is predicted to reach between 2-3 million by 2025(14). Magliano et al estimate that, if rates of mortality and diabetes incidence observed over the period from 2000 to 2005 continue, 38% of 25-year-olds can be expected to develop diabetes at some time during their lifetime; if mortality in the diabetes population were to decrease at 2.2% per year and incidence increased by 20% over 5 years, then the lifetime risk of diabetes increased to 66.6%(12).
Based on high-range projections of future diabetes prevalence (decreasing mortality and increasing incidence), the number of patients commencing KRT with a primary diagnosis of DM-ESKD in the Australian population can be expected to triple by 2025, compared to 2010 numbers, assuming that the trends observed over the past decade with respect to the onset and progression of DN are maintained (Table 3). These estimates correspond to an incidence of DM-ESKD in the population over 25 years of age of 121 per million population in 2025, compared to 53 per million population in 2010 – an increase of 128%. Given that the incidence of DM-ESKD in the USA currently exceeds 160 per million population, this figure is biologically plausible. The vast majority of this increase in DM-ESKD incidence is likely to occur in over 65-year-olds, whereas the number of 25-44 year olds developing DM-ESKD will likely remain steady. Therefore, in a scenario of increasing diabetes incidence and decreasing mortality, DM-ESKD incidence in the Australian population will more than double by 2025, unless early detection and intervention in DKD are able to alter these trends.
If the incidence of diabetes stabilizes, and progression to DM-ESKD also remains steady at 2010 rates, then the absolute number of adults aged 25 years and over commencing KRT with a primary diagnosis of DM-ESKD will increase by closer to 50% between 2010 and 2025, reaching an incidence rate of approximately 65 cases per million population (Table 4). In terms of the most likely future scenario, all indicators with respect to diabetes trends suggest high-range estimates of future diabetes prevalence are the most probable. On the basis of trends in the incidence of DM-ESKD between 2005 and 2010, it seems probable that rates of progression of DKD have already stablised or may even be declining; however, without accurate historical estimates of the population prevalence of diabetes (diagnosed and undiagnosed) in Australia it is not possible to demonstrate this definitively. The range of these projections is necessarily broad, but given the magnitude of the possible
KinD Report 2014

13 15
Table 3: High-range estimates of the incidence of DM-ESKD in the Australian adult population (25 years and older) to 2025 based on high-range projections of diabetes prevalence, growth in the rate of disease progression (following trends from 2000-2010), and mid-range population projections.
2000 2005 2010 2015 2020 2025 Diabetes prevalencea:
25-44 1.3% 2.6% 3.0% 3.9% 4.5% 5.4% 45-64 8.7% 9.3% 11.5% 13.6% 16.1% 19.3% 65+ 19.3% 20.7% 21.2% 22.9% 26.3% 29.6% All adults (25+) 7.6% 8.6% 10.1% 12.1% 14.3% 17.0%
DM-ESKD, Nb: 25-44 65 80 88 92 85 82 45-64 187 269 350 468 630 838 65+ 167 225 358 579 919 1439 All adults (25+) 419 574 796 1146 1608 2252
DM-ESKD, annual rate per 1000 adults 25+ with diabetesc: 25-44 0.86 0.52 0.46 0.34 0.26 0.19 45-64 0.48 0.57 0.55 0.58 0.63 0.67 65+ 0.36 0.40 0.56 0.71 0.90 1.13 All adults (25+) 0.43 0.49 0.53 0.58 0.64 0.71
a Diabetes prevalence from projections by Magliano et al based on the AusDiab study. Diabetes is defined as FPG >=7.0 mmol/l OR 2h plasma glucose >=11.1 mmol/l OR current treatment with insulin and/or oral hypoglycaemic agents. Mortality rates are adjusted by applying a decline of 2.2% per year. Diabetes incidence rates are adjusted by applying an increase of 20% for every 5 years. b Based on ABS Series B population projections, which assume that the TFR will decrease to 1.8 babies per woman by 2026 and then remain constant, life expectancy at birth will continue to increase each year until 2061, though at a declining rate (reaching 85.2 years for males and 88.3 years for females), NOM will remain constant at 240,000 per year throughout the projection period, and medium interstate migration flows. The number of incident DM-ESKD cases calculated as the product of age-specific population, diabetes prevalence, and estimated rate of progression to ESKD in each specified year. c Annual rate of progression to DM-ESKD per 1000 adults 25+ with diabetes was calculated as the number of incident DM-ESKD cases reported to the ANZDATA registry in 2000, 2005, and 2010, divided by the projected diabetes population (in thousands) in each of these years. Future rates were estimated by extrapolating trends observed over the interval from 2000 to 2010 (i.e. the average percentage increase/decrease in progression rates) forward to 2015, 2020 and 2025.
16
Table 4: Low-range estimates of the incidence of DM-ESKD in the Australian adult population (25 years and older) to 2025 based on low-range projections of diabetes prevalence, steady rate of disease progression (2010 rate maintained), and mid-range population projections.
2000 2005 2010 2015 2020 2025 Diabetes prevalencea:
25-44 1.3% 2.6% 2.9% 3.2% 3.1% 3.1% 45-64 8.7% 9.3% 10.6% 11.5% 12.3% 13.1% 65+ 19.3% 20.7% 19.9% 19.8% 20.6% 20.9% All adults (25+) 7.6% 8.6% 9.4% 10.1% 10.8% 11.4%
DM-ESKD, Nb: 25-44 65 80 88 104 108 117 45-64 187 269 350 400 454 500 65+ 167 225 358 422 482 537 All adults (25+) 419 574 796 931 1069 1203
DM-ESKD, annual rate per 1000 adults 25+ with diabetesc:25-44 0.86 0.52 0.46 0.46 0.46 0.46 45-64 0.48 0.57 0.55 0.55 0.55 0.55 65+ 0.36 0.40 0.56 0.56 0.56 0.56 All adults (25+) 0.43 0.49 0.53 0.53 0.53 0.53
a Diabetes incidence and mortality rates observed between 2000 and 2005 are held constant time (Magliano et al). b See Table 3 c Annual rate of progression to DM-ESKD per 1000 adults 25+ with diabetes was calculated as the number of incident DM-ESKD cases reported to the ANZDATA registry in 2000, 2005, and 2010, divided by the projected diabetes population (in thousands) in each of these years. Future rates were estimated by carrying forward the rate in 2010.
increase in rates of DM-ESKD, and its potential to be modified by changes in policy and practice, there is a need to understand these trends in more detail.

14
2. Morbidity and mortality in DKD
2.1. The effects of kidney disease on diabetes outcomes
It is well established that proteinuria is a major risk factor for cardiovascular mortality in both T1DM and T2DM (15,16). CKD and diabetes are both independently associated with increased risks of cardiovascular morbidity and all cause mortality, and in patients with both conditions the risks of adverse outcomes are extremely high compared to the general population (17,18). For example, in a United States Veterans cohort the cumulative incidence of myocardial infarction over a ten-year period was approximately 5% for the sub-group with diabetes alone; however, for the group with both diabetes and CKD, the risk of myocardial infarction over ten-years increased to 20% (19). Similarly, examination of a large population-based cohort from Alberta, Canada, found rates of hospital admission for myocardial infarction 2-fold higher in the population with diabetes, versus 3-fold higher in the population with both diabetes and CKD, when compared to the population without diabetes or CKD (18). This additive risk is also observed with respect to all-cause mortality: from the United States NHANES study, a ten-year cumulative all-cause mortality of 11.5% was observed for the population with diabetes and no kidney disease, compared to a standardised mortality of 31.1% in the population with both diabetes and kidney disease (5). In this study, diabetes was not in fact associated with a significant increase in all-cause mortality unless kidney disease was also present. Moreover, survival in the diabetes population deteriorates dramatically with worsening DKD (Figure 5). Ten-year survival for patients with diabetes commencing dialysis is 12%; 10-year survival for the minority of DM-ESKD patients who receive a kidney transplant, however, is 65% (unpublished communication, P Clayton). Therefore the presence of CKD in diabetes is a profound determinant of patient outcomes.
17
2. Morbidity and mortality in DKD
2.1. The effects of kidney disease on diabetes outcomes
It is well established that proteinuria is a major risk factor for cardiovascular mortality in both
T1DM and T2DM (15,16). CKD and diabetes are both independently associated with increased risks of
cardiovascular morbidity and all cause mortality, and in patients with both conditions the risks of adverse
outcomes are extremely high compared to the general population (17,18). For example, in a United States
Veterans cohort the cumulative incidence of myocardial infarction over a ten-year period was
approximately 5% for the sub-group with diabetes alone; however, for the group with both diabetes and
CKD, the risk of myocardial infarction over ten-years increased to 20% (19). Similarly, examination of a
large population-based cohort from Alberta, Canada, found rates of hospital admission for myocardial
infarction 2-fold higher in the population with diabetes, versus 3-fold higher in the population with both
diabetes and CKD, when compared to the population without diabetes or CKD (18). This additive risk is
also observed with respect to all-cause mortality: from the United States NHANES study, a ten-year
cumulative all-cause mortality of 11.5% was observed for the population with diabetes and no kidney
disease, compared to a standardised mortality of 31.1% in the population with both diabetes and kidney
disease (5). In this study, diabetes was not in fact associated with a significant increase in all-cause
mortality unless kidney disease was also present. Moreover, survival in the diabetes population
deteriorates dramatically with worsening DKD (Figure 5). Ten-year survival for patients with diabetes
commencing dialysis is 12%; 10-year survival for the minority of DM-ESKD patients who receive a kidney
transplant, however, is 65% (unpublished communication, P Clayton). Therefore the presence of CKD in
diabetes is a profound determinant of patient outcomes.
Figure 5: Proportion of patients alive in the ten years following onset of each stage of diabetic nephropathy, in the United Kingdom Prospective Diabetes Study (UKPDS 64: Adler et al. Kidney International, 2003;63:225)
0%
25%
50%
75%
100%
Surv
ival
KinD Report 2014

15
2.2. Trends in diabetes attributable deaths and the contribution of kidney failure
Although still a significant contributor to the burden of diabetes-associated disease, rates of treated ESKD are relatively low compared to rates of other complications in the diabetes population (Table 5). Contributing to this observation is the high rate of death from kidney failure, or from associated causes, prior to receiving treatment for ESKD. That is, a large proportion of diabetes patients will die from ESKD as an underlying or associated cause without ever having commenced KRT, and this number is likely to vastly exceed the number that receive treatment for ESKD.
In Australia in 2007, among deaths attributed to diabetes as the underlying cause, kidney failure was the third most common associated cause of death (27% of deaths attributed to diabetes), after coronary heart disease (52%), and hypertensive diseases (31%). For diabetes reported as any cause of death (underlying or associated), the most common contributing causes of death were coronary heart disease (47%), hypertensive diseases (30%), heart failure (21%), kidney failure (21%) and cerebrovascular disease (20%) (20). This corresponds to approximately 3000 deaths listing diabetes as a cause of death in association with kidney failure. An examination of temporal trends in ABS-reported multiple cause of death data indicated that the number and proportion of diabetes deaths (underlying cause) reported with kidney failure as an associated cause rose steadily between 1998 and 2008, but that in recent years there has been a downturn in the reporting of kidney failure as a cause of death in association with diabetes (Figure 6). These observed trends are influenced by changing policies/trends with regards to cause of death reporting and, as such, the upward from 1998 to 2008 trend may be attributed to greater recognition of kidney failure or a range of other factors. If these trends are accurate, however, then this indicates that in the ten years from 1998 to 2008 the proportion of diabetes-attributed deaths involving renal complications increased by between ~20% and ~30%. It may be postulated that earlier detection and better management of DKD, particularly the use of ACE inhibitors, has now begun to reverse this trend.
18
2.2. Trends in diabetes attributable deaths and the contribution of kidney failure
Although still a significant contributor to the burden of diabetes-associated disease, rates of
treated ESKD are relatively low compared to rates of other complications in the diabetes population (Table
5). Contributing to this observation is the high rate of death from kidney failure, or from associated causes,
prior to receiving treatment for ESKD. That is, a large proportion of diabetes patients will die from ESKD
as an underlying or associated cause without ever having commenced KRT, and this number is likely to
vastly exceed the number that receive treatment for ESKD.
Table 5: Average event rate observed, and simulation percentage of patients with events at ten years,for the UKPDS cohort (n=5,102) with newly diagnosed type 2 diabetes (Hayes et al. Diabetologia, 2013; 56:1925-1933).
Crude observed event rate, per 1000 person years
Simulated percentage of patients with events at 10 years post-diagnosis
Death 25.2 22.5%First MI 11.3 9.9%Second MI 1.9 1.0%First stroke 5.6 6.2%Second stroke 0.9 0.7%CHF 3.9 4.0%IHD 8.3 7.8%First amputation 1.9 1.5%Second amputation 0.6 0.4%Blindness 3.0 2.9%Renal failurea 1.3 0.5% Ulcer 1.1 1.8%aRenal failure defined as serum creatinine>250 umol/L.
In Australia in 2007, among deaths attributed to diabetes as the underlying cause, kidney failure
was the third most common associated cause of death (27% of deaths attributed to diabetes), after coronary
heart disease (52%), and hypertensive diseases (31%). For diabetes reported as any cause of death
(underlying or associated), the most common contributing causes of death were coronary heart disease
(47%), hypertensive diseases (30%), heart failure (21%), kidney failure (21%) and cerebrovascular disease
(20%) (20). This corresponds to approximately 3000 deaths listing diabetes as a cause of death in
association with kidney failure. An examination of temporal trends in ABS-reported multiple cause of
death data indicated that the number and proportion of diabetes deaths (underlying cause) reported with
kidney failure as an associated cause rose steadily between 1998 and 2008, but that in recent years there
has been a downturn in the reporting of kidney failure as a cause of deaths in association with diabetes
(Figure 6). These observed trends are influenced by changing policies/trends with regards to cause of
death reporting and, as such, the upward from 1998 to 2008 trend may be attributed to greater recognition
of kidney failure or a range of other factors. If these trends are accurate, however, then this indicates that in
the ten years from 1998 to 2008 the proportion of diabetes-attributed deaths involving renal complications
increased by between ~ 20% and ~ 30%. It may be postulated that earlier detection and better management
of DKD, particularly the use of ACE inhibitors, has now begun to reverse this trend.

16 19
Figure 6: Number and proportion of deaths attributed to diabetes as the underlying cause with renal failure listed as an associated cause of death. Australian Bureau of Statistics 3303.0 Causes of Death.
An additional point to make with respect to the mortality burden associated with DKD: although
the number of deaths from diabetes in connection with DKD has been increasing over time, a similar trend
is not observed with respect to the age-standardised mortality rate (Figure 7). This means that crude
mortality trends are largely being driven by demographic trends in the population with diabetes,
specifically by the rapid growth in the diabetes population aged 65 years and older. Therefore,
encouraging indications of a reduction in the mortality burden in the Australian diabetes population due to
improved disease management will be offset by increasing absolute mortality due to population aging.
Figure 7: Mortality rates in Australia attributable to diabetes and chronic kidney disease due to diabetes, in 1990 versus 2010. Source: Global Burden of Disease database, Institute for Health Metrics and Evaluation: (http://ghdx.healthmetricsandevaluation.org/global-burden-disease-study-2010-gbd-2010-data-downloads)
10
15
20
25
30
35
400
600
800
1000
1200
1400
PercentNum
ber
Number Proportion
0
5
10
15
20
1990 2010
Rat
e pe
r 10
0,00
0
Death from diabetes ( rate per 100,000)
CrudeAge-standardised
0
1
2
3
4
1990 2010
Rat
e pe
r 10
0,00
0
Death from chronic kidney disease due to diabetes (rate per 100,000)
CrudeAge-standardised
An additional point to make with respect to the mortality burden associated with DKD: although the number of deaths from diabetes in connection with DKD has been increasing over time, a similar trend is not observed with respect to the age-standardised mortality rate (Figure 7). This means that crude mortality trends are largely being driven by demographic trends in the population with diabetes, specifically by the rapid growth in the diabetes population aged 65 years and older. Therefore, encouraging indications of a reduction in the mortality burden in the Australian diabetes population due to improved disease management will be offset by increasing absolute mortality due to population aging.
19
Figure 6: Number and proportion of deaths attributed to diabetes as the underlying cause with renal failure listed as an associated cause of death. Australian Bureau of Statistics 3303.0 Causes of Death.
An additional point to make with respect to the mortality burden associated with DKD: although
the number of deaths from diabetes in connection with DKD has been increasing over time, a similar trend
is not observed with respect to the age-standardised mortality rate (Figure 7). This means that crude
mortality trends are largely being driven by demographic trends in the population with diabetes,
specifically by the rapid growth in the diabetes population aged 65 years and older. Therefore,
encouraging indications of a reduction in the mortality burden in the Australian diabetes population due to
improved disease management will be offset by increasing absolute mortality due to population aging.
Figure 7: Mortality rates in Australia attributable to diabetes and chronic kidney disease due to diabetes, in 1990 versus 2010. Source: Global Burden of Disease database, Institute for Health Metrics and Evaluation: (http://ghdx.healthmetricsandevaluation.org/global-burden-disease-study-2010-gbd-2010-data-downloads)
10
15
20
25
30
35
400
600
800
1000
1200
1400
PercentNum
ber
Number Proportion
0
5
10
15
20
1990 2010
Rat
e pe
r 10
0,00
0
Death from diabetes ( rate per 100,000)
CrudeAge-standardised
0
1
2
3
4
1990 2010
Rat
e pe
r 10
0,00
0
Death from chronic kidney disease due to diabetes (rate per 100,000)
CrudeAge-standardised
KinD Report 2014

17
3. The costs of treating DKD and DM-ESKD 3.1. The costs of treating pre-end stage DKD
Per person health care costs for patients with diabetes increase dramatically with successive stages of diabetic nephropathy. Analysis of the Alberta Kidney Disease Network (Canada) found that the cumulative 5-year costs of caring for patients with diabetes varied from CA$25,316 for patients with eGFR>90 mL/min to $115,348 for patients not on dialysis with eGFR<15 mL/min. Patients with no proteinuria incurred an adjusted mean 5-year cost of CA$24,531 per patient, compared to CA$28,435 for a patient with mild proteinuria, and $46,836 for a patient with heavy proteinuria (21).
Data from the AusDiab study have similarly shown that people with diabetes incur substantially greater health care costs than those without, and that costs are further increased among those with complications such as DKD (22). Analysis of the AusDiab cohort has also shown that the health care costs associated with CKD are higher for people with DKD than other types of CKD (Table 6). Stage 1-2 DKD was associated with annual direct heath care costs of approximately $3,700 pa, rising to $4,900 for stage 3-4 DKD, implying an annual direct health care cost for people with pre-ESKD DKD of nearly $1 billion AUD (M. Wyld and S.Chadban, unpublished).
3.2. International trends in costs of DM-ESKD
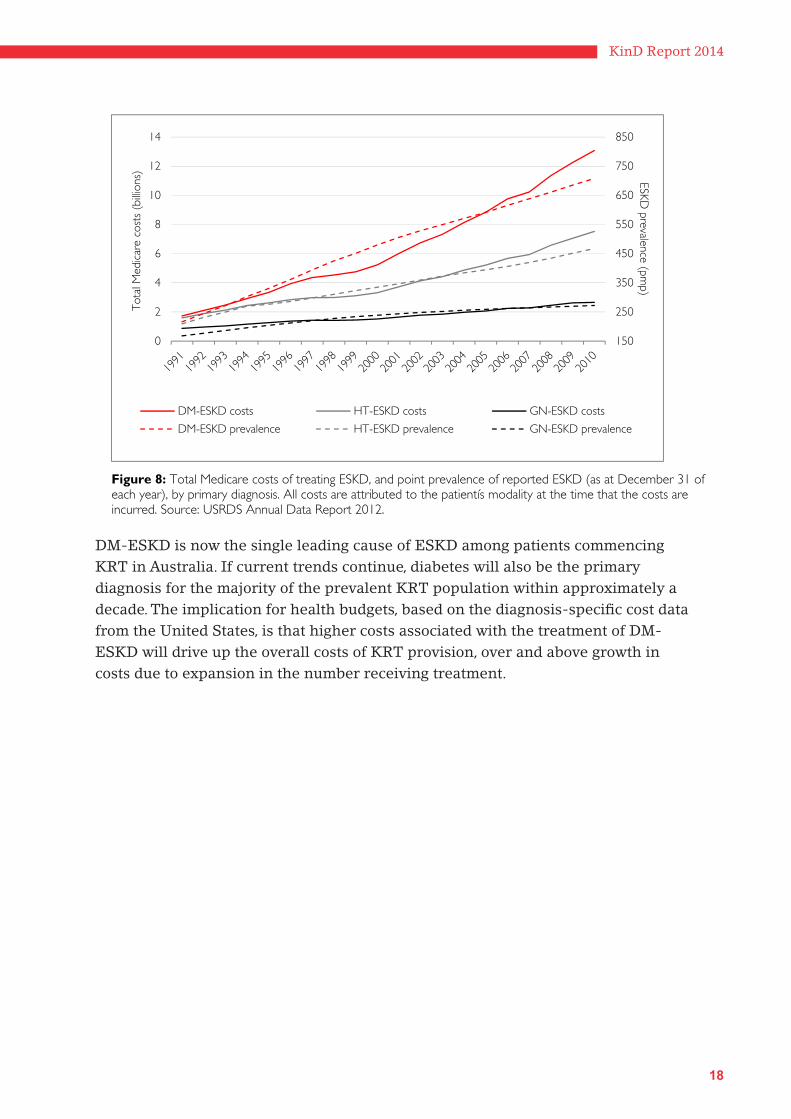
United States Medicare cost data demonstrate that DM-ESKD costs more to treat with dialysis or transplantation, both on a cumulative and per person basis, than any other primary cause of ESKD (Figure 8 and Figure 9). Medicare costs associated with the treatment of DM-ESKD in the United States increased by 150% over the ten years from 2000 to 2010, from 5.2 to 13.1 billion USD: in 2010, the treatment of DM-ESKD accounted from nearly 50% of all Medicare expenditure on KRT. This trend is of course driven by the increasing prevalence of DM-ESKD in the United States population; however, not only is diabetes the most common primary diagnosis among the prevalent ESKD population, it is also the most expensive form of ESKD to treat on a per person basis (Figure 9). For example, DM-ESKD costs on average 30% more to treat with dialysis and 50% more to treat with transplantation (per patient per year) than ESKD with a primary diagnosis of glomerulonephritis.
20
3. The costs of treating DKD and DM-ESKD
3.1. The costs of treating pre-end stage DKD
Per person health care costs for patients with diabetes increase dramatically with successive
stages of diabetic nephropathy. Analysis of the Alberta Kidney Disease Network (Canada) found that the
cumulative 5-year costs of caring for patients with diabetes varied from CA$25,316 for patients with
eGFR>90 ml/min to $115,348 for patients not on dialysis with eGFR<15 ml/min. Patients with no
proteinuria incurred an adjusted mean 5-year cost of CA$24,531 per patient, compared to CA$ 28,435 for a
patient with mild proteinuria, and $46,836 for a patient with heavy proteinuria (21).
Data from the AusDiab study have similarly shown that people with diabetes incur substantially
greater health care costs than those without, and that costs are further increased among those with
complications such as DKD (22). Further analysis of the AusDiab cohort has shown that CKD is also
associated with higher health care costs and that these are greater for those with DKD than other types of
CKD (Table 6). Stage 1-2 DKD was associated with annual direct heath care costs of approximately $3,700
pa, rising to $4,900 for stage 3-4 DKD, implying an annual direct health care cost for people with pre-ESKD
DKD of nearly $1 billion AUD (M. Wyld and S.Chadban, unpublished).
Table 6: Ratio of annual per person health care costs for persons with compared to without diabetes, by CKD status (M Wylde, unpublished data).
CKD Status Ratio of estimated per person costs with diabetes versus without diabetes Direct health care costsa Government subsidiesb No CKD 1.8:1.0 1.4:1.0Stages 1 and 2 CKD 1.6:1.0 1.6:1.0Stage 3/4/5 CKD 1.2:1.0 1.5:1.0a Direct health care costs in this analysis include: ambulatory service (GP, medical specialists, and or health care professionals, hospital emergency admission), hospitalization, insulin, aspirin, prescription meds and medically related consumables. b Government subsidies included age pension, disability pension, Veteranís Affairs pension, mobility allowance, sickness allowance and unemployment benefits.
3.2. International trends in costs of DM-ESKD
United States Medicare cost data demonstrate that DM-ESKD costs more to treat with dialysis or
transplantation, both on a cumulative and per person basis, than any other primary cause of ESKD (Figure
8 and Figure 9). Medicare costs associated with the treatment of DM-ESKD in the United States increased
by 150% over the ten years from 2000 to 2010, from 5.2 to 13.1 billion USD: in 2010, the treatment of DM-
ESKD accounted from nearly 50% of all Medicare expenditure on KRT. This trend is of course driven by
the increasing prevalence of DM-ESKD in the United States population; however, not only is diabetes the
most common primary diagnosis among the prevalent ESKD population, it is also the most expensive form
of ESKD to treat on a per person basis (Figure 9). For example, DM-ESKD costs on average 30% more to
18
21
treat with dialysis and 50% more to treat with transplantation (per patient per year) than ESKD with a
primary diagnosis of glomerulonephritis.
Figure 8: Total Medicare costs of treating ESKD, and point prevalence of reported ESKD (as at December 31 of each year), by primary diagnosis. All costs are attributed to the patientís modality at the time that the costs are incurred. Source: USRDS Annual Data Report 2012.
DM-ESKD is now the single leading cause of ESKD among patients commencing KRT in
Australia. If current trends continue, diabetes will also be the primary diagnosis for the majority of the
prevalent KRT population within approximately a decade. The implication for health budgets, based on
the diagnosis-specific cost data from the United States, is that higher costs associated with the treatment of
DM-ESKD will drive up the overall costs of KRT provision, over and above growth in costs due to
expansion in the number receiving treatment.
150
250
350
450
550
650
750
850
0
2
4
6
8
10
12
14ESKD
prevalence (pmp)
Tot
al M
edic
are
cost
s (b
illion
s)
DM-ESKD costs HT-ESKD costs GN-ESKD costs
DM-ESKD prevalence HT-ESKD prevalence GN-ESKD prevalence
DM-ESKD is now the single leading cause of ESKD among patients commencing KRT in Australia. If current trends continue, diabetes will also be the primary diagnosis for the majority of the prevalent KRT population within approximately a decade. The implication for health budgets, based on the diagnosis-specific cost data from the United States, is that higher costs associated with the treatment of DM-ESKD will drive up the overall costs of KRT provision, over and above growth in costs due to expansion in the number receiving treatment.
KinD Report 2014

19 22
Figure 9: Per person costs and prevalence of ESKD in the United States, by primary diagnosis. Source, USRDS Annual Data report.
0
20,000
40,000
60,000
80,000
100,000Pe
r pe
rson
per
yea
r co
sts
($)
Primary cause: diabetes
Primary cause: hypertension
Primary diagnosis: glomerulonephritis
Primary diagnosis: other
Primary diagnosis: unknown
0
200
400
600
800
Prev
alen
ce r
epor
ted
ESKD
(pm
p)
Primary cause: diabetes
Primary cause: hypertension
Primary diagnosis: glomerulonephritis
Primary diagnosis: cystic kidney
Primary diagnosis: other urologic
Primary cause: other cause

20
4. International trends in the incidence of DM-ESKD
Internationally, wide variation exists in the observed rates of vascular complications associated with diabetes, including DKD, which can only be partially explained by biological factors (23,24). For example, across high-income countries there is as much as an eight-fold difference in the incidence of treated DM-ESKD that cannot be fully accounted for by variation in diabetes prevalence (Figure 10). Other factors that are likely to affect the incidence of DM-ESKD include local eligibility criteria affecting uptake of KRT, characteristics of the diabetes population (average diabetes duration, age at onset, comorbidity burden), and variation in mortality rates (25). Comparing the predominantly Caucasian populations of Canada, Australia and selected European countries, the ESRD Incidence Study Group found 5-fold differences in the incidence of ESRD due to diabetes of any type, with the highest rates in Canada and Austria and the lowest rates in Norway and the Basque region of Spain (26). Whereas variation in population prevalence of childhood onset diabetes largely account for differences in the incidence of ESKD due to T1DM, variation in the incidence of ESKD attributable to T2DM is not explained by differences in underlying prevalence of disease in these racially and economically similar countries, but was instead attributed to factors affecting the rate of progression of DKD. Much of the international variation in diabetes complication rates is believed to relate to regional variation in diabetes management, evidence that the health burden of diabetes can be mitigated through best practices with respect to disease prevention (27).
In addition to wide international variation in the incidence of treated DM-ESKD, Figure 10 also shows significant variation in temporal trends. Whereas the incidence of DM-ESKD has increased steadily in Japan and the Republic of Korea over the pastdecade, incidence rates have recently leveled-off in the United States, Canada, the Netherlands, Australia, Norway, Sweden and Denmark, and declined in Austria and Finland. These trends are even more pronounced when calculated relative to the size of the diabetes population, particularly where the underlying diabetes population is growing rapidly. For example, among the diagnosed diabetes population in the United States, the age-adjusted incidence of DM-ESKD increased steadily until 1996 but declined thereafter, with this shift postulated to be attributable to significant improvements in glycaemic control in the TIDM population, and improved detection and better management of the T2DM population, in particular via the renoprotective effects of ACE-I and ARBs (28). However it is also the case that there has been a sustained increase in new diabetes cases in the United States since the 1990s, as well as changes to diagnostic criteria, which may have produced a surge in cases with milder disease and/or shorter diabetes duration and therefore lower risk of developing ESKD, and this may partially explain the rapid decline in incidence relative to the size of the diagnosed diabetes population (Figure 11).
KinD Report 2014

21
24
therefore lower risk of developing ESKD, and this may partially explain the rapid decline in
incidence relative to the size of the diagnosed diabetes population (Figure 11).
Figure 10: International trends in incidence of DM-ESKD per million population. Source: USRDS Annual Report 2012
Austria
Canada
DenmarkFinland
Japan
Rep. of Korea
Netherlands
New Zealand
Norway
Sweden
United States
Australia
0
20
40
60
80
100
120
140
160
180
1999 2000 2001 2002 2003 2004 2005 2006 2007 2008 2009 2010 2011
Inci
denc
e ra
te (
per
milli
on p
opul
atio
n)

22
It must also be remembered, however, that although secondary prevention with ACE-I and ARBss appears to be having an impact on the incidence of DM-ESKD, steady increases in diabetes prevalence and improved survival outcomes over time will necessarily yield an increasingly large number with DKD, who are at significantly elevated risk of myocardial infarction and all-cause mortality. For example in the United States between 1999 and 2008, the prevalence of DKD increased in direct proportion to increases in diabetes prevalence, and the overall prevalence of DKD within the diabetes population remained steady (3). However, analysis of successive waves of the United States National Health and Nutrition Examination Survey (NHANES) has also indicated a decline in albuminuria over this interval, particularly among younger persons with diabetes, while simultaneously observing an increasing prevalence of eGFR <60 mL/min/1.73m². These two observations are indicative of competing trends with respect to DKD that will similarly have important implications for the future burden of diabetes-related chronic and end-stage kidney disease in the Australian population: (i) the aging of the diabetes population due to greater incidence of late onset T2DM and improved survival in the diabetes population, resulting in increased prevalence of low eGFR, and (ii) the impact of increased use of glucose lowering medication, ACE-I and ARBs in preventing albuminuria onset. Reducing the burden of kidney disease-related morbidity and mortality in the diabetes population will therefore not only require consolidation of gains with respect to the prevention of DM-ESKD, but also upstream prevention: prevention of diabetes onset, early detection of diabetes, effective glycaemic and blood pressure control.
25
Figure 11: Trends in the incidence of DM-ESKD and in population prevalence of diagnosed diabetes in the United. Sources: USRDS Annual Report 2012, and United States Centers for Disease Control and Prevention.
It must also be remembered, however, that although secondary prevention with ACE
inhibitors and ARBs appears to be having an impact on the incidence of DM-ESKD, steady
increases in diabetes prevalence and improved survival outcomes over time will necessarily yield
an increasingly large number with DKD, who are at significantly elevated risk of myocardial
infarction and all-cause mortality. For example in the United States between 1999 and 2008, the
prevalence of DKD increased in direct proportion to increases in diabetes prevalence, and the
overall prevalence of DKD within the diabetes population remained steady (3). However, analysis
of successive waves of the United States National Health and Nutrition Examination Survey
(NHANES) has also indicated a decline in albuminuria over this interval, particularly among
younger persons with diabetes, while simultaneously observing an increasing prevalence of eGFR
<60 ml/min/1.73m2. These two observations are indicative of competing trends with respect to
DKD that will similarly have important implications for the future burden of diabetes-related
chronic and end-stage kidney disease in the Australian population: (i) the aging of the diabetes
population due to greater incidence of late onset T2DM and improved survival in the diabetes
population, resulting in increased prevalence of low eGFR, and (ii) the impact of increased use of
glucose lowering medication, ACE inhibitors and ARB’ s in preventing albuminuria onset.
Reducing the burden of kidney disease-related morbidity and mortality in the diabetes
population will therefore not only require consolidation of gains with respect to the prevention of
DM-ESKD, but also upstream prevention: prevention of diabetes onset, early detection of
diabetes, effective glycaemic and blood pressure control.
0
2
4
6
0
1000
2000
3000
4000
1980 1982 1984 1986 1988 1990 1992 1994 1996 1998 2000 2002 2004 2006 2008 2010
Prevalence of diabetes (%)D
M-E
SRD
rat
e (p
mp)
Incidence of DM-ESRD (per million persons diagnosed with diabetes)Crude population prevalence of diagnosed diabetes (%)
KinD Report 2014

23
5. Conclusions and policy recommendations
Pharmacological intervention in DKD is stabilizing the incidence of ESKD at the population level
The efficacy of ACE inhibitors and ARBs in slowing the progression of DKD, regardless of type or duration of diabetes, is now firmly established (29), and we appear to be seeing the impact of increasing usage of these agents on trends in the incidence of DM-ESKD in Australia and internationally. Screening the diabetes population for DKD and intervening with ACE inhibitors and ARBs as indicated, together with appropriate glycaemic control and management of lifestyle-related risk factors, must be a key health priority in responding to the health burden of diabetes in Australia.
The first priority in screening for DKD should be the detection of microalbuminuriaSince the vast majority of DKD is associated with the presence of albuminuria, testing for microalbuminuria is key to screening strategies for the detection of DKD. Numerous studies have evaluated the cost-effectiveness of screening for albuminuria in the diabetes population, concluding that screening in diabetics based on dipstick urinalysis and/or measurement of urinary albumin to creatinine ratio, followed by intervention with an ACE inhibitor or ARB, is cost-effective across all age groups (30-32). Screening the diabetes population for DKD on the basis of eGFR has also been shown to be cost-effective (33), however screening for low eGFR becomes more favourable above 50-60 years of age (34); thus these two markers potentially have complementary roles in screening different age groups (35).
The underlying burden of DKD will increase as long as diabetes prevalence is increasing, and this challenge must be met with lifestyle changeDespite recent trends suggesting stabilized incidence of DM-ESKD in Australia and international trends pointing to the impact of pharmacological intervention on progression rates, the underlying burden of DKD in Australia is rising and will continue to do so as an inevitable result of increasing diabetes prevalence, driven by rates of obesity and population aging. Therefore, averting the burden of DKD in Australia requires engagement with lifestyle change and healthy aging. In Japan, for example, which has one of the highest rates of DM-ESKD in the world, it has been estimated that nearly half of the incidence of proteinuria in adults can be attributed to lack of adherence to a healthy lifestyle (non-smoker, BMI <25kg/m², alcohol consumption <20g/day, regular exercise, regular meals) (36). A 2012 review from the American Heart Association of interventions to promote healthy lifestyles concluded that, whereas interventions oriented around the individual were unlikely to have significant impact, population-based multicomponent interventions involving government mandated economic incentives and changes to the physical environment were able to effect changein lifestyle behaviours and health outcomes (37). Nephrologists should consider themselves stakeholders in these types of population interventions for the primary prevention of diabetes and DKD.

24
Health services planning requires accurate projections of the future burden of DKD and ESKDThere is an urgent need to gather Australian data on longitudinal trends in the incidence and prevalence of diabetes and DKD, and more accurate information regarding attributable costs. Predicting future rates of DM-ESKD for the purposes of health services planning is complex and requires data on the current and future population at risk, longitudinal data on disease incidence trends and rates of progression, mortality data indicating trends in competing risks, and information on changing demographics of the diabetes population. These data are largely unavailable for the Australian population, and should be a priority in population health research.
Surveillance of the DKD population would support outcomes improvement over the long termA system for the monitoring and surveillance of DKD should be established, to enable reporting of the number of Australians with DKD over time, markers of disease in this population, changing treatment patterns, and patient outcomes. Such disease monitoring would enable the generation of relevant clinical practice guidelines and facilitate their evolution over time to ensure currency and maximize impact. CKD surveillance systems are currently being established in the United States under the leadership of the CDC, and this initiative may inform Australian efforts.
Final commentsMultiple opportunities exist for prevention along the entire disease continuum – from the population at risk of diabetes onset to the population with established diabetic nephropathy. Over the past two decades, medical advances in the management of diabetes and diabetic nephropathy have produced significant improvements in the rate of progression of diabetic nephropathy internationally, such that a patients diagnosed with diabetes today are significantly less likely to develop ESKD across the life-course than a patient diagnosed twenty years ago. Although we estimate that the number of Australians with DKD will likely double by 2025, the outcomes that this population will experience are highly modifiable.
Monitoring for kidney disease must be made a high priority for all people with type 2 diabetes and more effort needs to
be made to ensure that glucose control is optimised and other issues such as blood pressure and lipids targets are met. This
means better control of diabetes in the first instance.
KinD Report 2014

25

26
29
References
1. Fox CS, Matsushita K, Woodward M, Bilo HJG, Chalmers J, Heerspink HJL, et al. Associations of kidney disease measures with mortality and end-stage renal disease in individuals with and without diabetes: a meta-analysis. Lancet. 2012 Nov 10;380(9854):1662–73.
2. Collins AJ, Foley RN, Herzog C, Chavers B, Gilbertson D, Ishani A, et al. US Renal Data System 2012 Annual Data Report. Am J Kidney Dis. 2013 Jan;61(1 Suppl 1):A7–e1–476.
3. de Boer IH, Rue TC, Hall YN, Heagerty PJ, Weiss NS, Himmelfarb J. Temporal trends in the prevalence of diabetic kidney disease in the United States. JAMA: The Journal of the American Medical Association. American Medical Association; 2011 Jun 22;305(24):2532–9.
4. MacIsaac RJ, Jerums G. Diabetic kidney disease with and without albuminuria. Current Opinion in Nephrology and Hypertension. 2011 May;20(3):246–57.
5. Afkarian M, Sachs MC, Kestenbaum B, Hirsch IB, Tuttle KR, Himmelfarb J, et al. Kidney Disease and Increased Mortality Risk in Type 2 Diabetes. Journal of the American Society of Nephrology. 2013 Jan 31;24(2):302–8.
6. Grace BS, Clayton P, McDonald SP. Increases in renal replacement therapy in Australia and New Zealand: understanding trends in diabetic nephropathy. Nephrology (Carlton). Blackwell Publishing Asia; 2012 Jan;17(1):76–84.
7. Muntner P, Coresh J, Powe NR, Klag MJ. The contribution of increased diabetes prevalence and improved myocardial infarction and stroke survival to the increase in treated end-stage renal disease. J Am Soc Nephrol. 2003 Jun;14(6):1568–77.
8. Adler AI, Stevens RJ, Manley SE, Bilous RW, Cull CA, Holman RR, et al. Development and progression of nephropathy in type 2 diabetes: the United Kingdom Prospective Diabetes Study (UKPDS 64). Kidney Int. 2003 Jan;63(1):225–32.
9. Finne P, Reunanen A, Stenman S, Groop P-H, Grönhagen-Riska C. Incidence of end-stage renal disease in patients with type 1 diabetes. JAMA: The Journal of the American Medical Association. American Medical Association; 2005 Oct 12;294(14):1782–7.
10. Nordwall M, Bojestig M, Arnqvist HJ, Ludvigsson J, Linköping Diabetes Complications Study. Declining incidence of severe retinopathy and persisting decrease of nephropathy in an unselected population of Type 1 diabetes-the Linköping Diabetes Complications Study. Diabetologia. Springer-Verlag; 2004 Jul;47(7):1266–72.
11. Yokoyama H, Okudaira M, Otani T, Sato A, Miura J, Takaike H, et al. Higher incidence of diabetic nephropathy in type 2 than in type 1 diabetes in early-onset diabetes in Japan. Kidney Int. 2000 Jul;58(1):302–11.
12. Magliano DJ, Shaw JE, Shortreed SM, Nusselder WJ, Liew D, Barr ELM, et al. Lifetime risk and projected population prevalence of diabetes. Diabetologia. 2008 Dec;51(12):2179–86.
13. Dunstan DW, Zimmet PZ, Welborn TA, De Courten MP, Cameron AJ, Sicree RA, et al. The rising prevalence of diabetes and impaired glucose tolerance: the Australian Diabetes, Obesity and Lifestyle Study. Diabetes Care. 2002 May;25(5):829–34.
KinD Report 2014
27
30
14. Magliano DJ, Peeters A, Vos T, Sicree R, Shaw J, Sindall C, et al. Projecting the burden of diabetes in Australia--what is the size of the matter? Australian and New Zealand Journal of Public Health. 2009 Dec;33(6):540–3.
15. Gall MA, Borch-Johnsen K, Hougaard P, Nielsen FS, Parving HH. Albuminuria and poor glycemic control predict mortality in NIDDM. Diabetes. 1995 Nov;44(11):1303–9.
16. Fuller JH, Stevens LK, Wang SL. Risk factors for cardiovascular mortality and morbidity: the WHO Mutinational Study of Vascular Disease in Diabetes. Diabetologia. 2001 Sep;44 Suppl 2:S54–64.
17. Go A, Chertown GM, Fan D, McCulloch C, Hsu C. Chronic Kidney Disease and the Risks of Death, Cardiovascular Events, and Hospitalization. N Engl J Med. 2004 Sep 11;351:1296–305.
18. Tonelli M, Muntner P, Lloyd A, Manns BJ, Klarenbach S, Pannu N, et al. Risk of coronary events in people with chronic kidney disease compared with those with diabetes: a population-level cohort study. The Lancet. 2012 Sep;380(9844):807–14.
19. Debella YT, Giduma HD, Light RP, Agarwal R. Chronic kidney disease as a coronary disease equivalent--a comparison with diabetes over a decade. Clinical Journal of the American Society of Nephrology. 2011 Jun;6(6):1385–92.
20. Multiple Causes of Death: An analysis of all natural and selected chronic disease causes of death, 1997-2007. Australian Institute of Health and Welfare Bulletin 105, August 2012, Canberra, Australia.
21. McBrien KA, Manns BJ, Chui B, Klarenbach SW, Rabi D, Ravani P, et al. Health Care Costs in People With Diabetes and Their Association With Glycemic Control and Kidney Function. Diabetes Care. 2013 Apr 23;36(5):1172–80.
22. Lee CMY, Colagiuri R, Magliano DJ, Cameron AJ, Shaw J, Zimmet P, et al. The cost of diabetes in adults in Australia. Diabetes Research and Clinical Practice. 2013 Mar;99(3):385–90.
23. Bennett PH, Lee ET, Lu M, Keen H, Fuller JH. Increased urinary albumin excretion and its associations in the WHO Multinational Study of Vascular Disease in Diabetes. Diabetologia. 2001 Sep;44 Suppl 2:S37–45.
24. Lee ET, Keen H, Bennett PH, Fuller JH, Lu M. Follow-up of the WHO Multinational Study of Vascular Disease in Diabetes: general description and morbidity. Diabetologia. 2001 Sep;44 Suppl 2:S3–13.
25. Morrish NJ, Wang SL, Stevens LK, Fuller JH, Keen H. Mortality and causes of death in the WHO multinational study of vascular disease in diabetes. Diabetologia. Springer-Verlag; 2001;44(2):S14–S21.
26. ESRD Incidence Study Group, Stewart JH, McCredie MRE, Williams SM. Divergent trends in the incidence of end-stage renal disease due to Type 1 and Type 2 diabetes in Europe, Canada and Australia during 1998-2002. Diabet Med. Blackwell Publishing Ltd; 2006 Dec;23(12):1364–9.
27. Keen H. The WHO Multinational Study of Vascular Disease in Diabetes. Diabetologia. 2001 Sep;44 Suppl 2:S1–2.
28. Burrows NR, Li Y, Geiss LS. Incidence of treatment for end-stage renal disease among individuals with diabetes in the U.S. continues to decline. Diabetes Care. American Diabetes Association; 2010 Jan;33(1):73–7.

28
31
29. Strippoli GFM, Craig M, Deeks JJ, Schena FP, Craig JC. Effects of angiotensin converting enzyme inhibitors and angiotensin II receptor antagonists on mortality and renal outcomes in diabetic nephropathy: systematic review. BMJ. BMJ; 2004 Oct 9;329(7470):828.
30. Palmer AJ, Valentine WJ, Chen R, Mehin N, Gabriel S, Bregman B, et al. A health economic analysis of screening and optimal treatment of nephropathy in patients with type 2 diabetes and hypertension in the USA. Nephrology Dialysis Transplantation. Oxford University Press; 2008 Apr;23(4):1216–23.
31. Boulware LE, Jaar BG, Tarver-Carr ME, Brancati FL, Powe NR. Screening for proteinuria in US adults: a cost-effectiveness analysis. JAMA: The Journal of the American Medical Association. American Medical Association; 2003 Dec 17;290(23):3101–14.
32. Hoerger TJ, Wittenborn JS, Segel JE, Burrows NR, Imai K, Eggers P, et al. A health policy model of CKD: 2. The cost-effectiveness of microalbuminuria screening. Am J Kidney Dis. 2010 Mar;55(3):463–73.
33. Manns B, Hemmelgarn B, Tonelli M, Au F, Chiasson TC, Dong J, et al. Population based screening for chronic kidney disease: cost effectiveness study. BMJ. 2010;341:c5869.
34. Hallan SI, Dahl K, Oien CM, Grootendorst DC, Aasberg A, Holmen J, et al. Screening strategies for chronic kidney disease in the general population: follow-up of cross sectional health survey. BMJ. BMJ; 2006 Nov 18;333(7577):1047.
35. James MT, Hemmelgarn BR, Tonelli M. Early recognition and prevention of chronic kidney disease. Lancet. 2010 Apr 10;375(9722):1296–309.
36. Wakasugi M, Kazama JJ, Yamamoto S, Kawamura K, Narita I. A combination of healthy lifestyle factors is associated with a decreased incidence of chronic kidney disease: a population-based cohort study. Hypertens Res. 2013 Apr;36(4):328–33.
37. Mozaffarian D, Afshin A, Benowitz NL, Bittner V, Daniels SR, Franch HA, et al. Population approaches to improve diet, physical activity, and smoking habits: a scientific statement from the American Heart Association. Circulation. Lippincott Williams & Wilkins; 2012. pp. 1514–63.
KinD Report 2014

29

KinD Report (Kidneys in Diabetes)
Temporal trends in the epidemiology of diabetic kidney disease and the associated health care burden in Australia
Sarah White and Steve ChadbanKidney Research NodeRoyal Prince Alfred Hospital and Charles Perkins Centre, University of Sydney
April 2014
KIDNEY HEALTH AUSTRALIA125 Cecil Street,
South Melbourne, VIC 3205Phone: +61 3 9674 4300 Freecall: 1800 454 363
www.kidney.org.au
Kidney Health Australia is a national health care charity with a vision ‘to save and improve the lives of Australians affected by kidney
disease’. As the national peak body, Kidney Health Australia promotes good kidney health through delivery of programs in education,
advocacy, research and support.