kim peacock, m.ed. yvonne norton michael carbonaro, ph.d. university of alberta
DESCRIPTION
The Aboriginal Teacher Education Program Technology Initiative: Current Progress in a One-to-One Laptop Program to Support Blended Delivery. Kim Peacock, M.Ed. Yvonne Norton Michael Carbonaro, Ph.D. University of Alberta. The ATEP Program. Established in 2001 - PowerPoint PPT PresentationTRANSCRIPT

The Aboriginal Teacher Education Program
Technology Initiative: Current Progress in a One-to-One Laptop Program to Support Blended Delivery
Kim Peacock, M.Ed.Yvonne Norton Michael Carbonaro, Ph.D.University of Alberta

The ATEP Program
Established in 2001 ATEP pre-service education programs to
Aboriginal students in partnership with First Nations colleges and/or local school authorities across Northern Alberta
Provides access to teacher education programs for individuals in remote areas
Students receive a B.Ed. From the University of Alberta

The ATEP Philosophy
Seeks to deliver community based education that is reflective of:› Community culture› Local concerns and aspirations› Feeling “at home”
while learning Students can continue
to live and work in their home communities

Institutional Collaboration
The University works with the First Nations colleges to:› Identify and hire instructors› Develop curricular materials› Plan individual course delivery› Secure resources
A site coordinator also assists students with their individual program planning
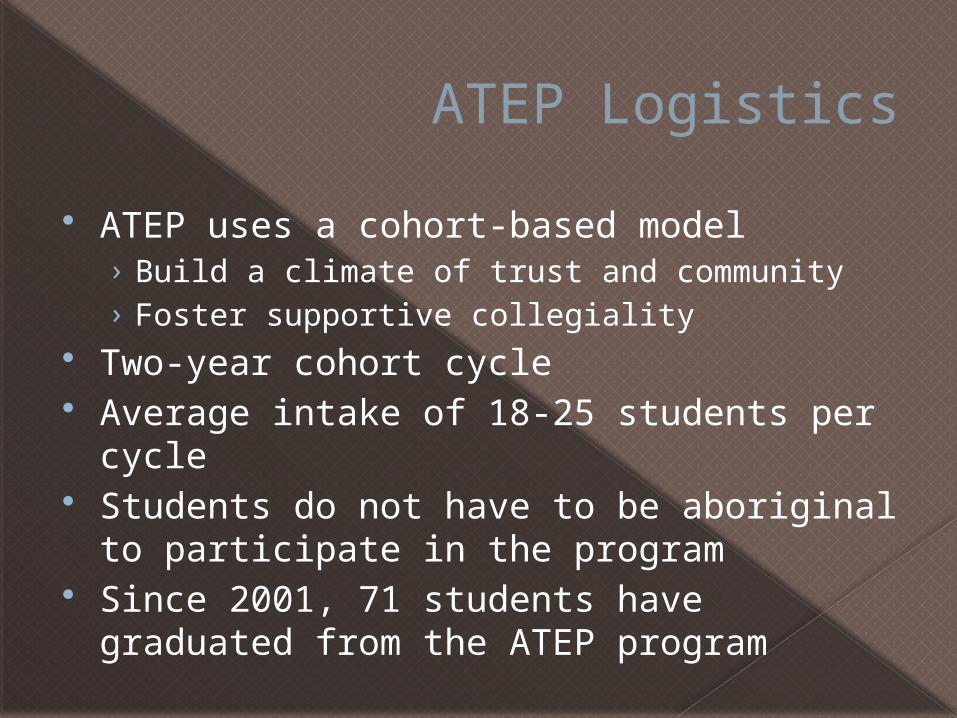
ATEP Logistics
ATEP uses a cohort-based model› Build a climate of trust and community› Foster supportive collegiality
Two-year cohort cycle Average intake of 18-25 students per
cycle Students do not have to be aboriginal to
participate in the program Since 2001, 71 students have graduated
from the ATEP program

The ATEP Technology Initiative
In conjunction with Blue Quills First Nations College in St. Paul, Alberta
Approximately 140 miles (220 KM) north-east of Edmonton.
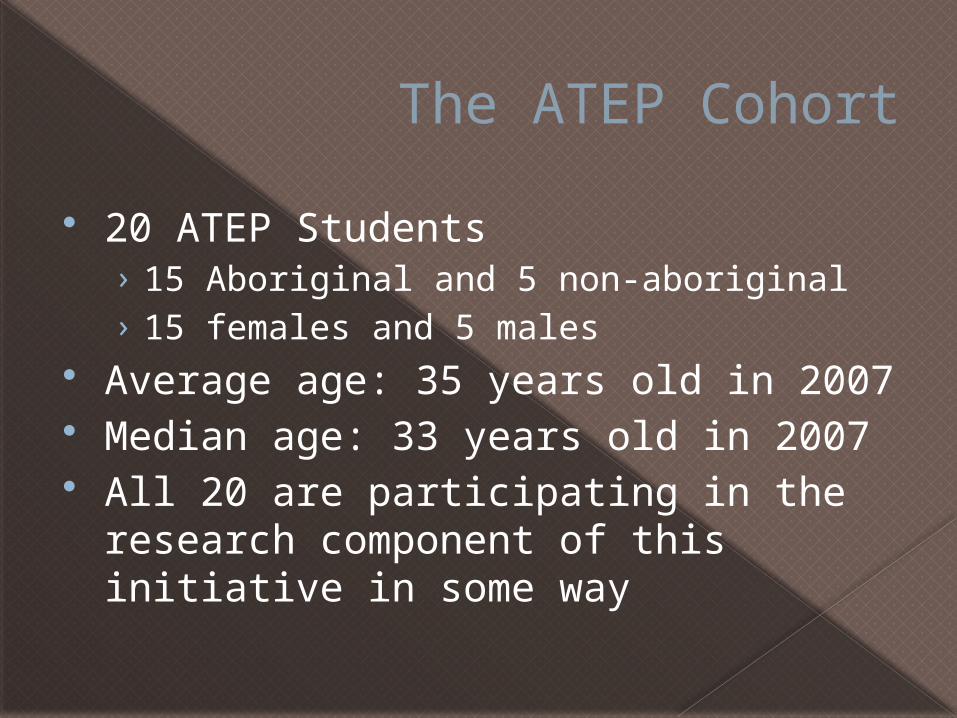
The ATEP Cohort
20 ATEP Students› 15 Aboriginal and 5 non-aboriginal› 15 females and 5 males
Average age: 35 years old in 2007 Median age: 33 years old in 2007 All 20 are participating in the research
component of this initiative in some way

Rationale
Previous experiences with ATEP have indicated that participation and retention are directly linked to issues surrounding:› Commuting› Communication› Financial resources› Access to resources (library, classroom,
etc...)› Increases in blended-learning opportunities

Project Purpose
Increase access Increase integration
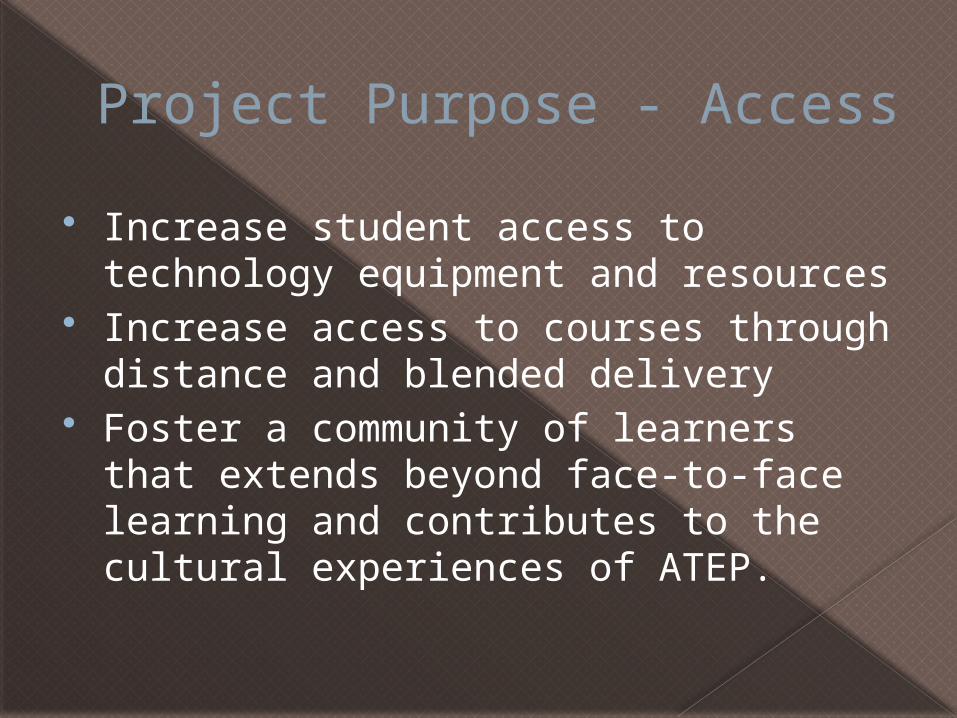
Project Purpose - Access
Increase student access to technology equipment and resources
Increase access to courses through distance and blended delivery
Foster a community of learners that extends beyond face-to-face learning and contributes to the cultural experiences of ATEP.

Access
Through the generous support of the University of Alberta TLEF program, the TELUS Community Foundation and Hewlett-Packard, each student received:› An HP laptop computer› Microsoft Office 2007› EVDO satellite Internet card› Unlimited Internet access for
the duration of their program

Project Purpose - Integration
Increase levels of technology integration in the program
Develop students’ technology skills Develop students’ knowledge of
classroom technology integration to:› Promote student problem-solving› Promote critical thinking› Support learners with special needs
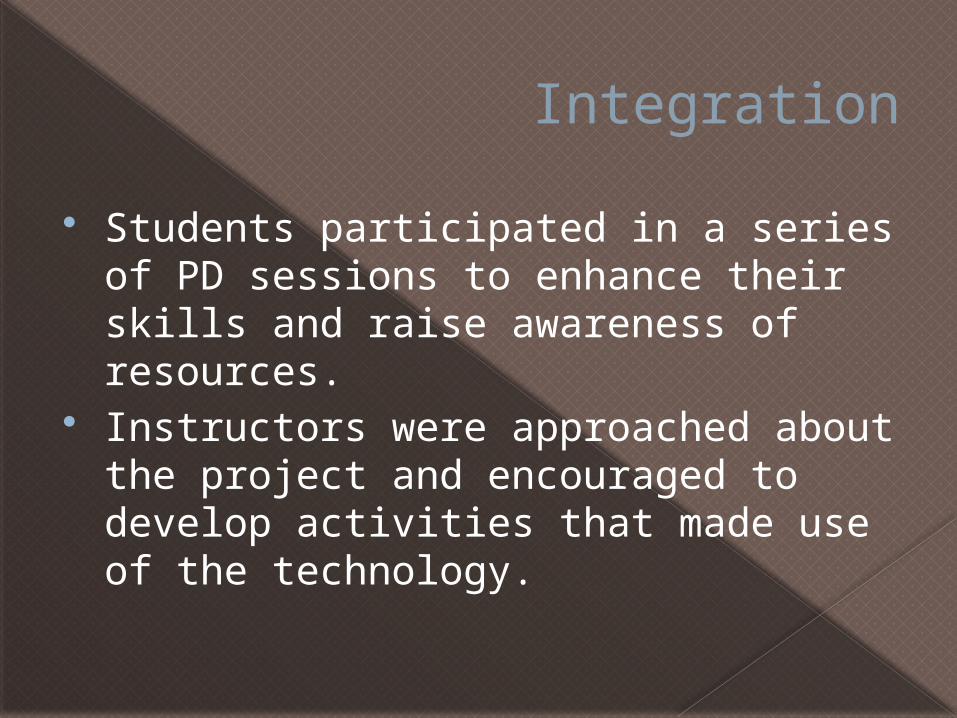
Integration
Students participated in a series of PD sessions to enhance their skills and raise awareness of resources.
Instructors were approached about the project and encouraged to develop activities that made use of the technology.

Methodology

Research Questions
The research team developed a set of research questions that included examining:› Student and instructor skills› Attitudes towards technology› Instructor best practices› Student integration levels› Overall effectiveness of our model
Examining Student Progress
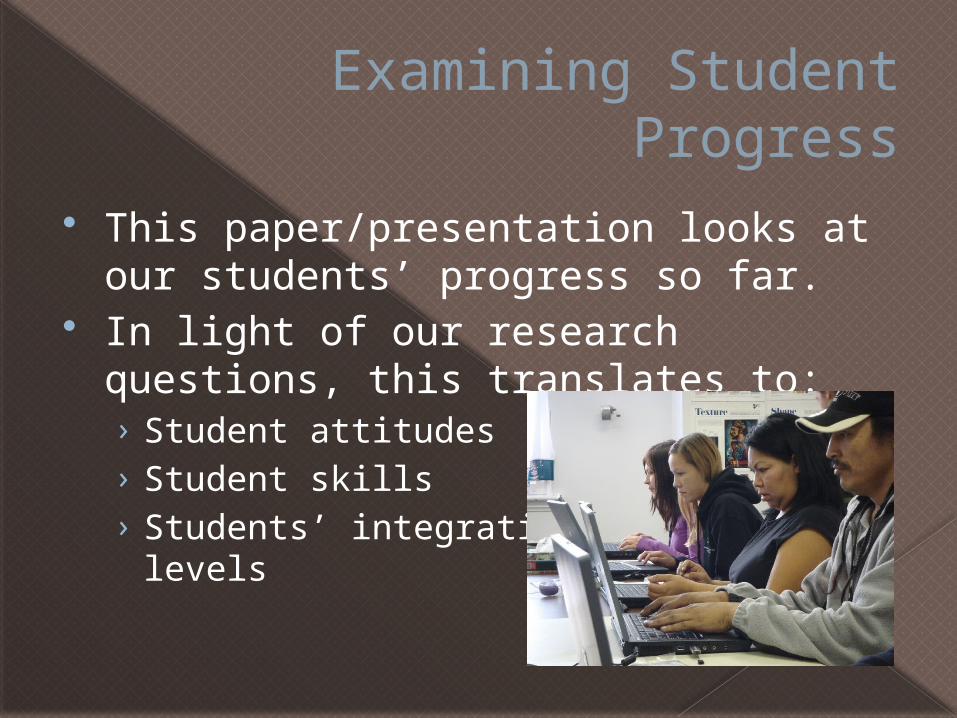
This paper/presentation looks at our students’ progress so far.
In light of our research questions, this translates to:› Student attitudes› Student skills› Students’ integration
levels

Methodology
Both qualitative and quantitative Qualitative:
› Student reflections› Student interviews› Student focus groups› Sharing circles› Artifacts› Concept maps
Quantitative:› Numerous instruments delivered pre-mid-post
(pre and mid only at this time)

Methodology –Attitudes
Instruments administered:› Survey of Teachers’ Attitudes Towards
Information Technology (TAT) (Knezek & Christenses, 1998)
› Attitudes section of the Fordham University Regional Technology Center Technology Skills Self-Assessment Profile (D’Agustino, Imbimbo & King, 2004)
Student reflections Interviews, focus groups and sharing
circles

Methodology - Skill
Skill self-assessment only Instruments administered:
› Technology Proficiency Self-Assessment (TPSA) (Ropp, 1999) to examine competencies
› University of Alberta Faculty of Education Technology Survey to examine how independently students and faculty can complete technology tasks
Student reflections Interviews, focus groups and sharing
circles

Methodology - Integration
Analysis of artifacts: final unit plans from their final methods course (Social Studies).
Concept maps Interviews with mentor
teachers after student teaching.
Student reflections Interviews, focus groups and sharing
circles
Learning Styles
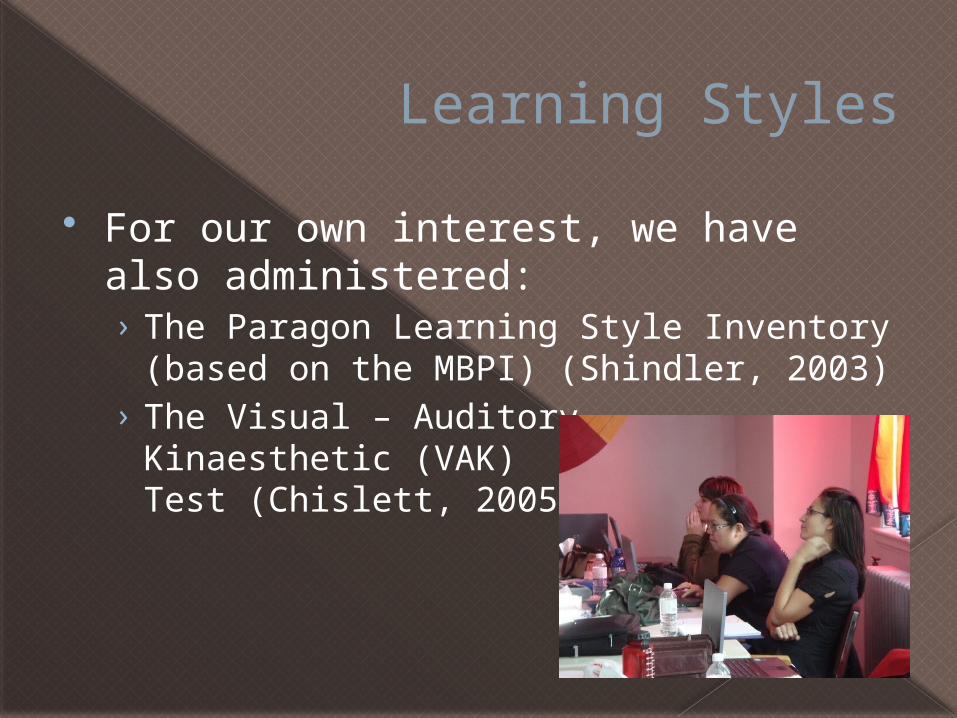
For our own interest, we have also administered:› The Paragon Learning Style Inventory
(based on the MBPI) (Shindler, 2003)› The Visual – Auditory –
Kinaesthetic (VAK) Test (Chislett, 2005)

Results and Discussion

Student Attitude Influences
High average age of the cohort.› Normal distribution with a mean of 35 and
a medium of 33 at the onset of the program in 2007.
› Some millennial learners, some baby boomers and some from generation X.

Student Attitude Influences
Hardware difficulties› Late arrival› OS issues› Internet access
issues› Hardware
failures

Student Attitude Results
FURETCTSSA Instrument Students moved towards a more
positive attitude towards computers on 17 out of 18 questions
The remaining question had no change. Moved from pre-point averages of 4.00
to mid-point averages of 4.35 (n=13).

Student Attitude ResultsPre Mid Change
1. I enjoy doing things on a computer. 4.308 4.615 0.308
2. I avoid using computers as much as possible. 2.231 1.615 - 0.615
3. I think using computers for classroom instruction involves too much time. 2.385 1.923 - 0.462
4. I know that computers give me opportunities to learn many new things. 4.385 4.538 0.154
5. Computers intimidate and threaten me. 2.231 2.000 - 0.231
6. Spending school funds on computer technology is not worth it. 1.462 1.462 0
7. Teachers should know how to use computers in their classrooms. 4.308 4.769 0.462
8. I feel computers are necessary tools in both educational and work settings. 4.385 4.769 0.385
9. I believe that I am /would be a better teacher if I knew how to use the computers in my classroom.
4.154 4.538 0.385
10. I have a lot of self-confidence when it comes to working with computers. 3.462 4.231 0.769
11. I believe using computers can improve communication with my students’ families. 3.923 4.308 0.385
12. I want to learn a lot about how to use computers for instruction. 4.308 4.385 0.077
13. I believe that the Internet can dramatically change teaching. 4.154 4.231 0.077
14. Changing the curriculum to integrate technology requires too much training. 3.077 2.308 - 0.769
15. Computers can be used successfully with courses that demand creative activity. 4.154 4.462 0.308
16. Computers can be a useful instructional aid in almost all subject areas. 4.385 4.462 0.077
17. Computers break down too much to be of very much use. 2.615 2.000 - 0.615
18. Computers can enhance remedial (low-achieving student) instruction 4.077 4.231 0.154
(n=13)

Student Attitude Results
The Survey of Teachers’ Attitudes Towards Technology (TAT) also showed consistent motion towards more positive attitudes.
The formal TAT scoring analysis will be conducted when the post data has been collected (Knezek & Christiensen, 1998).

Student Attitude Results Average changes of more than .5 points on a 5 point Likert
scale between pre and mid point administration of the Teacher Attitudes Towards Instructional Technology (TAT) instrument.1. I think that it takes a long time to finish when I learn the computer. 0.50 towards disagree
2. Working with a computer makes me nervous. 0.67 towards disagree3. Using a computer is very frustrating. 0.67 towards disagree4. Computers do not scare me at all. 0.75 towards agree5. I can learn more from books than from a computer. 0.67 towards agree6. Computers do not scare me at all. 0.75 towards disagree7. I have a lot of self-confidence when it comes to working with computers. 0.50 towards agree8. Computer lessons are a favorite subject for me. 0.83 towards agree9. A computer test would scare me. 0.75 towards disagree10. I see the computer as something I will rarely use in my daily life as an adult. 0.67 towards agree11. Use of computers in education almost always reduces the personal
treatment of students. 0.67 towards disagree12. I feel at ease when I am around computers. 0.58 towards agree13. Learning about computers is boring to me. 0.67 towards disagree14. I am afraid that if I begin to use computers I will become dependent upon
them and lose some of my reasoning skills. 0.58 towards disagree
(n=13)

Student Attitude Results
Average changes of more than .5 points on a 7 point semantic scale between pre and mid point administration of the Teacher Attitudes Towards Instructional Technology (TAT) instrument. Pre Mid ChangeComputers: Bad vs. Good 5.67 6.58 0.92 towards goodComputers: Empty vs. Full 5.00 5.83 0.83 towards fullComputers: Dull vs. Exciting 5.43 6.17 0.75 towards excitingComputers: Suffocating vs. Fresh 5.25 6.08 0.83 towards fresheMail: Boring vs. Interesting 5.42 6.00 0.58 towards interestingeMail: Exciting vs. Unexciting 2.83 2.33 0.50 towards excitingWWW: Worthless vs. Valuable 5.75 6.25 0.50 towards valuableWWW: Not needed vs. Needed 5.58 6.25 0.67 towards neededMultimedia: Important vs. Unimportant 2.25 1.67 0.58 towards importantMultimedia: Boring vs. Interesting 5.50 6.25 0.75 towards interestingMultimedia: Means nothing vs. Means a lot 5.58 6.08 0.50 towards means a lotMultimedia: Appealing vs. Unappealing 2.25 1.67 0.58 towards appealingMultimedia: Fascinating vs. Mundane 2.33 1.58 0.75 towards fascinatingMultimedia: Worthless vs. Valuable 5.50 6.33 0.83 towards valuableMultimedia: Involving vs. Uninvolving 2.25 1.67 0.58 towards involvingMultimedia: Not needed vs. Needed 5.50 6.25 0.75 towards needed
(n=13)
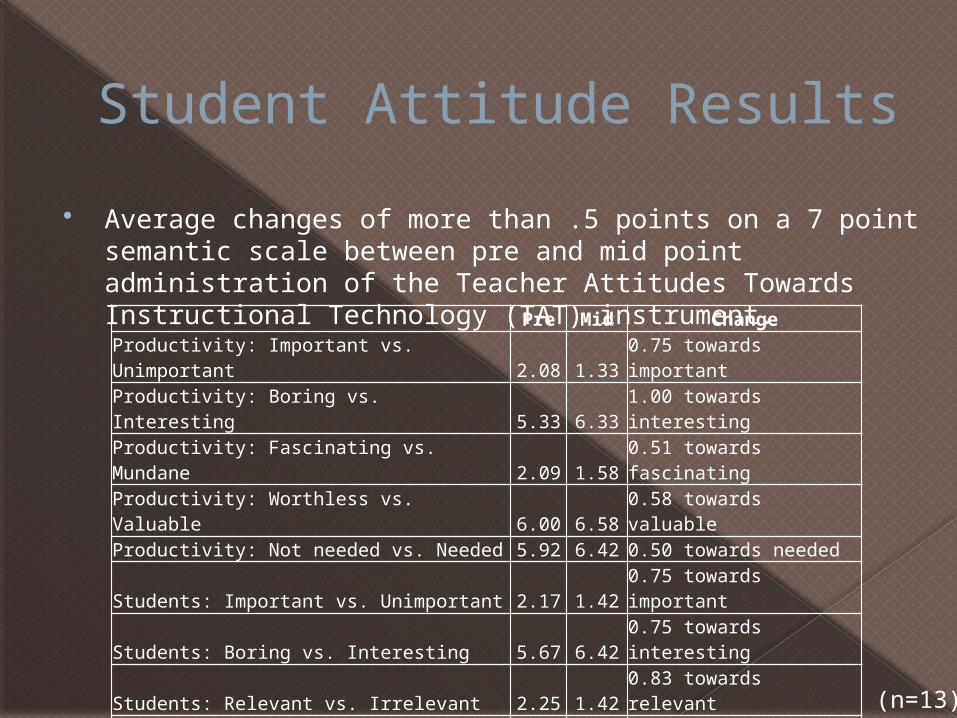
Student Attitude Results
Average changes of more than .5 points on a 7 point semantic scale between pre and mid point administration of the Teacher Attitudes Towards Instructional Technology (TAT) instrument. Pre Mid ChangeProductivity: Important vs. Unimportant 2.08 1.33 0.75 towards importantProductivity: Boring vs. Interesting 5.33 6.33 1.00 towards interestingProductivity: Fascinating vs. Mundane 2.09 1.58 0.51 towards fascinatingProductivity: Worthless vs. Valuable 6.00 6.58 0.58 towards valuableProductivity: Not needed vs. Needed 5.92 6.42 0.50 towards neededStudents: Important vs. Unimportant 2.17 1.42 0.75 towards importantStudents: Boring vs. Interesting 5.67 6.42 0.75 towards interestingStudents: Relevant vs. Irrelevant 2.25 1.42 0.83 towards relevantStudents: Exciting vs. Unexciting 2.08 1.42 0.67 towards excitingStudents: Means nothing vs. Means a lot 5.75 6.58 0.83 towards means a lotStudents: Appealing vs. Unappealing 2.17 1.50 0.67 towards appealingStudents: Fascinating vs. Mundane 2.17 1.33 0.83 towards fascinatingStudents: Worthless vs. Valuable 5.75 6.75 1.00 towards valuableStudents: Involving vs. Uninvolving 2.00 1.50 0.50 towards involvingStudents: Not needed vs. Needed 5.42 6.33 0.92 towards needed
(n=13)

Student Attitude Results
Initial qualitative data supports these findings.› In student reflections about the use of
Elluminate for online courses, 12 responses were predominantly positive, 3 were neutral and 3 were predominantly negative.
› Mid-point reflections on the project overall had 10 students with predominantly positive responses and 1 student who was neutral.
› Our focus group data has similar ratios, though the data is hard to quantify.

Student Skill Influences
Students were not starting on the even playing field that was anticipated.› Initial skill-self assessments showed that
students did not have the skills you would anticipate after an introductory computing course.
PD sessions had to be modified› Supplemental support for low end learners› Supplemental resources for high end learners› Shift of focus to pedagogy and integration over
more complex skills

Student Skill Influences
Supplemental support systems were put into place› One additional college support person› One cohort member was hired as a
temporary TA› Phone and email
support was provided by the PD coordinator

Student Skill Results
Technology Proficiency Self- Assessment› 20 skills self-assessed on a Likert scale› Students moved from an average of 3.88 to
4.12 on pre to mid-point measures (n=12)› Of the twenty items, students moved more
towards disagree on one of the skills, three remained the same and moved towards agree on the remaining 16 items.
We have substantial amounts of qualitative data that support these findings.
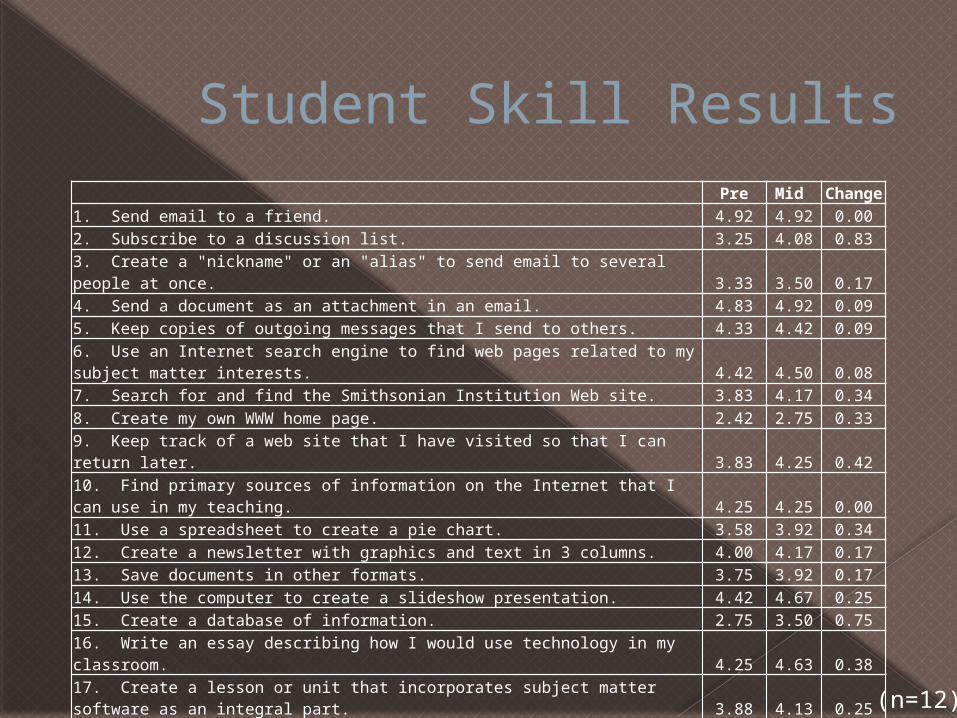
Student Skill ResultsPre Mid Change
1. Send email to a friend. 4.92 4.92 0.002. Subscribe to a discussion list. 3.25 4.08 0.833. Create a "nickname" or an "alias" to send email to several people at once. 3.33 3.50 0.174. Send a document as an attachment in an email. 4.83 4.92 0.095. Keep copies of outgoing messages that I send to others. 4.33 4.42 0.096. Use an Internet search engine to find web pages related to my subject matter interests. 4.42 4.50 0.087. Search for and find the Smithsonian Institution Web site. 3.83 4.17 0.348. Create my own WWW home page. 2.42 2.75 0.339. Keep track of a web site that I have visited so that I can return later. 3.83 4.25 0.4210. Find primary sources of information on the Internet that I can use in my teaching. 4.25 4.25 0.0011. Use a spreadsheet to create a pie chart. 3.58 3.92 0.3412. Create a newsletter with graphics and text in 3 columns. 4.00 4.17 0.1713. Save documents in other formats. 3.75 3.92 0.1714. Use the computer to create a slideshow presentation. 4.42 4.67 0.2515. Create a database of information. 2.75 3.50 0.7516. Write an essay describing how I would use technology in my classroom. 4.25 4.63 0.3817. Create a lesson or unit that incorporates subject matter software as an integral part. 3.88 4.13 0.2518. Use technology to collaborate with other teachers or students from a distance. 4.00 4.38 0.3819. Describe 5 software programs that I would use in my teaching. 3.50 3.38 -0.1220. Write a plan with a budget to buy technology for my classroom. 4.00 4.00 0.00
Average 3.88 4.12
(n=12)

Student Skill Results
We will compare the students on our own University of Alberta Faculty of Education Technology Survey which was only administered at pre and post points because of length.
The instrument has students gauge their skill level on a five point scale of:› I am totally confident that I can do this on my own. › I am pretty sure that I can do this on my own. › I could do this with a bit of help. › I can’t do this but would like to learn how.› I can’t do this and don’t really care to learn how.

Integration Challenges
Instructors did not always respond to the initiative in the way we had hoped.
Some instructors made extensive use of the available technology while...
Others opted not to make use of it at all.› Another reason why pedagogy and
integration became an important focus of the PD sessions

Integration Experiences
Despite these challenges, students were able to experience a number of technologies in their courses, including:› Taking a synchronous online course› Taking an asynchronous online course› Recording a podcast› Completing digital scavenger hunts› Creating multimedia storybooks› Creating concept maps with Inspiration› Authoring spreadsheets› Blogging› Using Ning as a CMS

Integration Experiences
Students were also able to explore a wide range of tools and software in the PD sessions, even though they didn’t have a chance to apply them in the classroom:› Read and Write Gold› BoardMaker Plus!› Google Earth› Community Walk› Google Sites› Blogger› VoiceThread› And more..

Technology Integration Results
Results to follow... Students have just begun their final round
of student teaching. Students will complete the second round
of concept maps at the call-back day in April.
We do currently have the students’ final unit plans from their last methods course and are beginning to analyze them for technology integration activities.

Conclusion
Despite many challenges, we have seen evidence of positive growth in terms of student attitudes towards technology and self-assessed skill.
We are currently beginning to examine evidence of enhanced student technology integration in their teaching and planning.

Conclusion
We will be publishing further results after we gather post data at the end of the project.
We will also publish best practices and lessons learned for organizations who may be seeking to implement similar programs.
This initiative has provided us with a great deal of guidance about future endeavours and will inform many future decisions about technology use in our off-site programs.

Thank You!
ATEP Web Sitehttp://atep.ualberta.ca
ATEP Technology Initiative Web Sitehttp://atep.ualberta.ca/technology/