keystone exams: algebra i -...
TRANSCRIPT

Keystone Exams: Algebra IAssessment Anchors and Eligible Content
with Sample Questions and Glossary
Pennsylvania Department of Education
www.education.state.pa.us
April 2012
Pennsylvania Department of Education—Assessment Anchors and Eligible Content Page 2
PENNSYLVANIA DEPARTMENT OF EDUCATION
General Introduction to the Keystone Exam Assessment Anchors
Introduction
Since the introduction of the Keystone Exams, the Pennsylvania Department of Education (PDE) has been working to create a set of tools designed to help educators improve instructional practices and better understand the Keystone Exams. The Assessment Anchors, as defined by the Eligible Content, are one of the many tools the Department believes will better align curriculum, instruction, and assessment practices throughout the Commonwealth. Without this alignment, it will not be possible to significantly improve student achievement across the Commonwealth.
How were Keystone Exam Assessment Anchors developed?
Prior to the development of the Assessment Anchors, multiple groups of PA educators convened to create a set of standards for each of the Keystone Exams. Enhanced standards, derived from a review of existing standards, focused on what students need to know and be able to do in order to be college and career ready. (Note: Since that time, PA Common Core Standards have replaced the enhanced standards and reflect the college and career ready focus.) Additionally, the Assessment Anchors and Eligible Content statements were created by other groups of educators charged with the task of clarifying the standards assessed on the Keystone Exams. The Assessment Anchors, as defined by the Eligible Content, have been designed to hold together, or anchor, the state assessment system and the curriculum/instructional practices in schools. Assessment Anchors, as defined by the Eligible Content, were created with the following design parameters:
¾ Clear: The Assessment Anchors are easy to read and are user friendly; they clearly detail which standards are assessed on the Keystone Exams.
¾ Focused: The Assessment Anchors identify a core set of standards that could be reasonably assessed on a large-scale assessment; this will keep educators from having to guess which standards are critical.
¾ Rigorous: The Assessment Anchors support the rigor of the state standards by assessing higher-order and reasoning skills.
¾ Manageable: The Assessment Anchors define the standards in a way that can be easily incorporated into a course to prepare students for success.
How can teachers, administrators, schools, and districts use these Assessment Anchors?
The Assessment Anchors, as defined by the Eligible Content, can help focus teaching and learning because they are clear, manageable, and closely aligned with the Keystone Exams. Teachers and administrators will be better informed about which standards will be assessed. The Assessment Anchors and Eligible Content should be used along with the Standards and the Curriculum Framework of the Standards Aligned System (SAS) to build curriculum, design lessons, and support student achievement.
The Assessment Anchors and Eligible Content are designed to enable educators to determine when they feel students are prepared to be successful in the Keystone Exams. An evaluation of current course offerings, through the lens of what is assessed on those particular Keystone Exams, may provide an opportunity for an alignment to ensure student preparedness.
Pennsylvania Department of Education—Assessment Anchors and Eligible Content Page 3
How are the Assessment Anchors organized?
The Assessment Anchors, as defined by the Eligible Content, are organized into cohesive blueprints, each structured with a common labeling system that can be read like an outline. This framework is organized first by module, then by Assessment Anchor, followed by Anchor Descriptor, and then finally, at the greatest level of detail, by an Eligible Content statement. The common format of this outline is followed across the Keystone Exams.
Here is a description of each level in the labeling system for the Keystone Exams:
¾ Module: The Assessment Anchors are organized into two thematic modules for each of the Keystone Exams. The module title appears at the top of each page. The module level is important because the Keystone Exams are built using a module format, with each of the Keystone Exams divided into two equal-sized test modules. Each module is made up of two or more Assessment Anchors.
¾ Assessment Anchor: The Assessment Anchor appears in the shaded bar across the top of each Assessment Anchor table. The Assessment Anchors represent categories of subject matter that anchor the content of the Keystone Exams. Each Assessment Anchor is part of a module and has one or more Anchor Descriptors unified under it.
¾ Anchor Descriptor: Below each Assessment Anchor is a specific Anchor Descriptor. The Anchor Descriptor level provides further details that delineate the scope of content covered by the Assessment Anchor. Each Anchor Descriptor is part of an Assessment Anchor and has one or more Eligible Content unified under it.
¾ Eligible Content: The column to the right of the Anchor Descriptor contains the Eligible Content statements. The Eligible Content is the most specific description of the content that is assessed on the Keystone Exams. This level is considered the assessment limit and helps educators identify the range of the content covered on the Keystone Exams.
¾ PA Common Core Standard: In the column to the right of each Eligible Content statement is a code representing one or more PA Common Core Standards that correlate to the Eligible Content statement. Some Eligible Content statements include annotations that indicate certain clarifications about the scope of an Eligible Content.
{ “e.g.” (“for example”)—sample approach, but not a limit to the Eligible Content.
{ “i.e.” (“that is”)—specific limit to the Eligible Content.
{ “Note”—content exclusions or definable range of the Eligible Content.
How do the K–12 Pennsylvania Common Core Standards affect this document?
Assessment Anchor and Eligible Content statements are aligned to the PA Common Core Standards; thus, the former enhanced standards no longer are necessary. Within this document, all standard references reflect the PA Common Core Standards.
Standards Aligned System—www.pdesas.org
Pennsylvania Department of Education—www.education.state.pa.us
Pennsylvania Department of Education—Assessment Anchors and Eligible Content Page 4
Keystone Exams: Algebra I
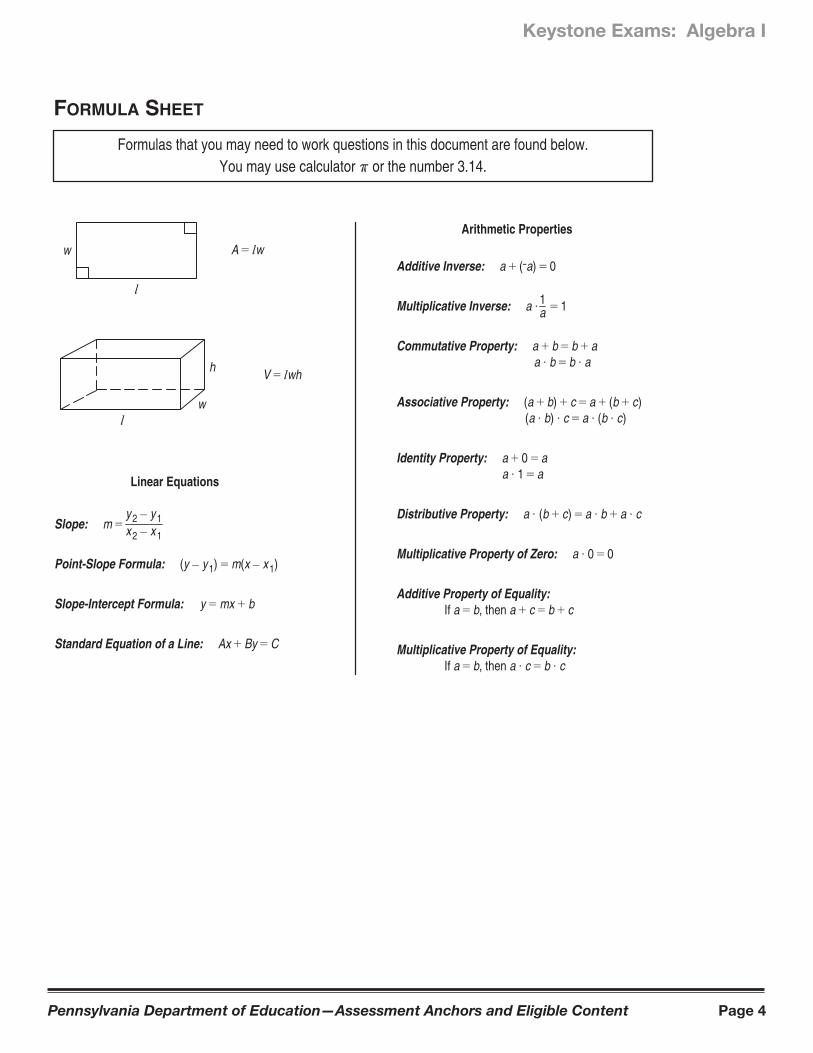
FORMULA SHEET
Formulas that you may need to work questions in this document are found below.You may use calculator π or the number 3.14.
A = lw
l
w
V = lwh
lw
h
Arithmetic Properties
Additive Inverse: a + (ˉa) = 0
Multiplicative Inverse: a · = 1
Commutative Property: a + b = b + a a · b = b · a
Associative Property: (a + b) + c = a + (b + c) (a · b) · c = a · (b · c)
Identity Property: a + 0 = a a · 1 = a
Distributive Property: a · (b + c) = a · b + a · c
Multiplicative Property of Zero: a · 0 = 0
Additive Property of Equality: If a = b, then a + c = b + c
Multiplicative Property of Equality: If a = b, then a · c = b · c
1a
Linear Equations
Slope: m =
Point-Slope Formula: (y – y 1) = m(x – x 1)
Slope-Intercept Formula: y = mx + b
Standard Equation of a Line: Ax + By = C
y 2 – y 1x 2 – x 1
Pennsylvania Department of Education—Assessment Anchors and Eligible Content Page 5
Keystone Exams: Algebra I
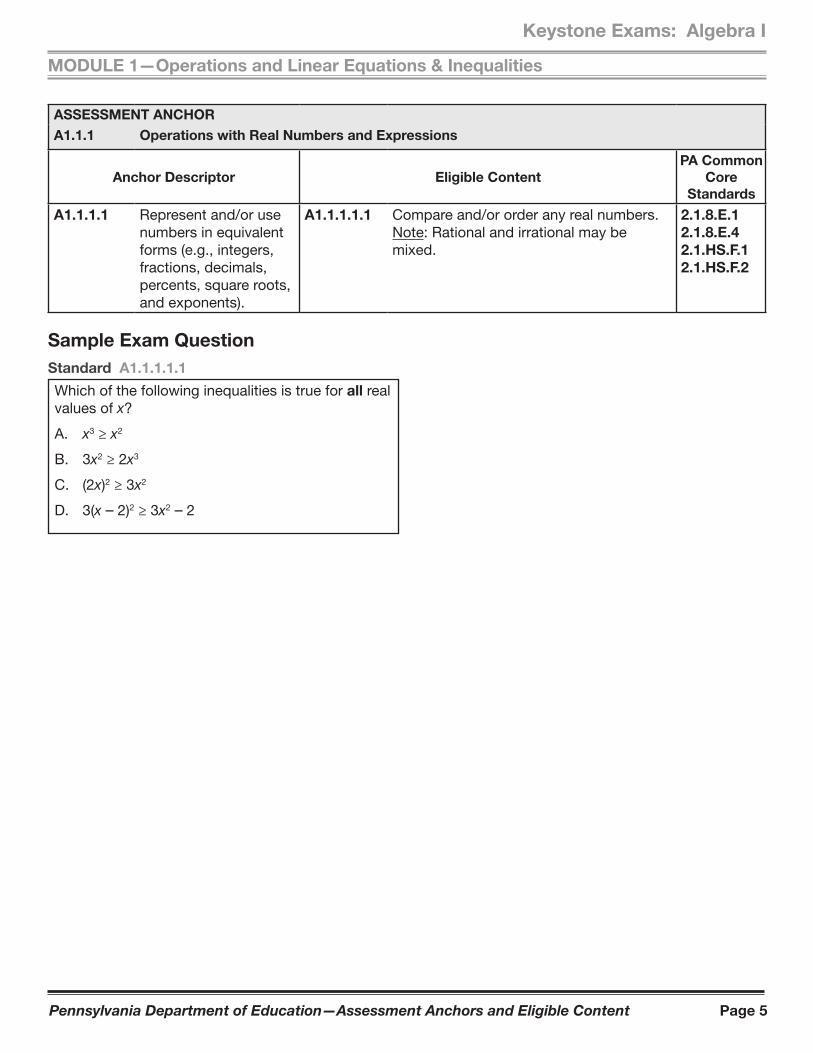
MODULE 1—Operations and Linear Equations & Inequalities
ASSESSMENT ANCHORA1.1.1 Operations with Real Numbers and Expressions
Anchor Descriptor Eligible ContentPA Common
Core Standards
A1.1.1.1 Represent and/or use numbers in equivalent forms (e.g., integers, fractions, decimals, percents, square roots, and exponents).
A1.1.1.1.1 Compare and/or order any real numbers.Note: Rational and irrational may be mixed.
2.1.8.E.1 2.1.8.E.4 2.1.HS.F.1 2.1.HS.F.2
Sample Exam QuestionStandard A1.1.1.1.1
Which of the following inequalities is true for all real values of x?
A. x3 ≥ x2
B. 3x2 ≥ 2x3
C. (2x)2 ≥ 3x2
D. 3(x – 2)2 ≥ 3x2 – 2
Pennsylvania Department of Education—Assessment Anchors and Eligible Content Page 6
MODULE 1—Operations and Linear Equations & Inequalities
Keystone Exams: Algebra I
ASSESSMENT ANCHORA1.1.1 Operations with Real Numbers and Expressions
Anchor Descriptor Eligible ContentPA Common
Core Standards
A1.1.1.1 Represent and/or use numbers in equivalent forms (e.g., integers, fractions, decimals, percents, square roots, and exponents).
A1.1.1.1.2 Simplify square roots (e.g., Ï}
24 = 2 Ï}
6 ). 2.1.8.E.1 2.1.8.E.4 2.1.HS.F.1 2.1.HS.F.2
Sample Exam QuestionsStandard A1.1.1.1.2
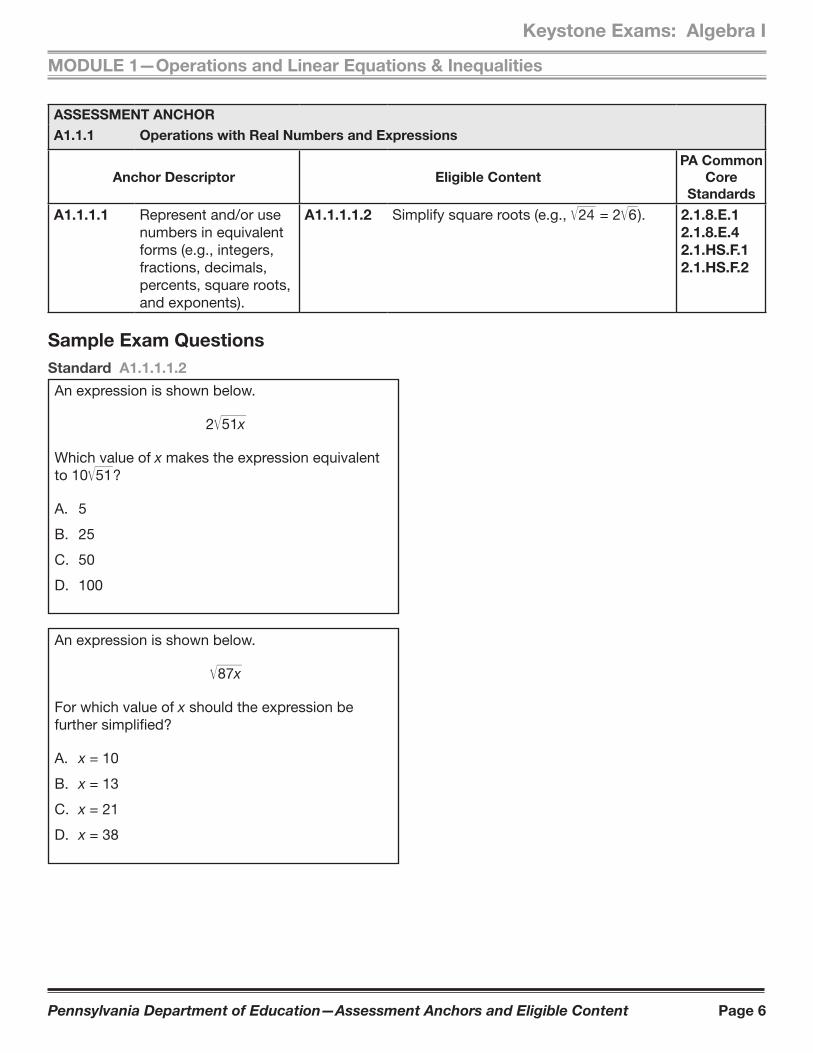
An expression is shown below.
2 Ï}
51x
Which value of x makes the expression equivalent to 10 Ï
} 51 ?
A. 5
B. 25
C. 50
D. 100
An expression is shown below.
Ï}
87x
For which value of x should the expression be further simplified?
A. x = 10
B. x = 13
C. x = 21
D. x = 38
Pennsylvania Department of Education—Assessment Anchors and Eligible Content Page 7
Keystone Exams: Algebra I
MODULE 1—Operations and Linear Equations & Inequalities
ASSESSMENT ANCHORA1.1.1 Operations with Real Numbers and Expressions
Anchor Descriptor Eligible ContentPA Common
Core Standards
A1.1.1.2 Apply number theory concepts to show relationships between real numbers in problem-solving settings.
A1.1.1.2.1 Find the Greatest Common Factor (GCF) and/or the Least Common Multiple (LCM) for sets of monomials.
2.1.6.E.3
Sample Exam QuestionStandard A1.1.1.2.1
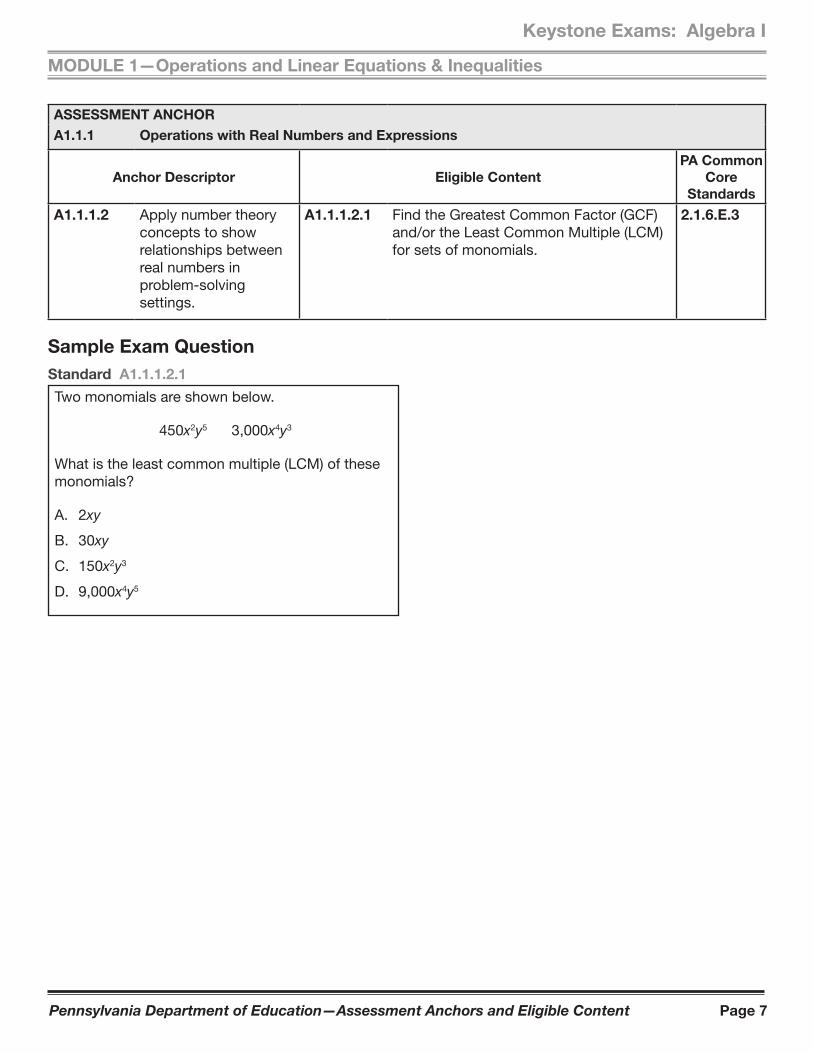
Two monomials are shown below.
450x2y5 3,000x4y3
What is the least common multiple (LCM) of these monomials?
A. 2xy
B. 30xy
C. 150x2y3
D. 9,000x4y5
Pennsylvania Department of Education—Assessment Anchors and Eligible Content Page 8
MODULE 1—Operations and Linear Equations & Inequalities
Keystone Exams: Algebra I
ASSESSMENT ANCHORA1.1.1 Operations with Real Numbers and Expressions
Anchor Descriptor Eligible ContentPA Common
Core Standards
A1.1.1.3 Use exponents, roots, and/or absolute values to solve problems.
A1.1.1.3.1 Simplify/evaluate expressions involving properties/laws of exponents, roots, and/or absolute values to solve problems. Note: Exponents should be integers from -10 to 10.
2.1.HS.F.1 2.1.HS.F.2 2.2.8.B.1
Sample Exam QuestionStandard A1.1.1.3.1
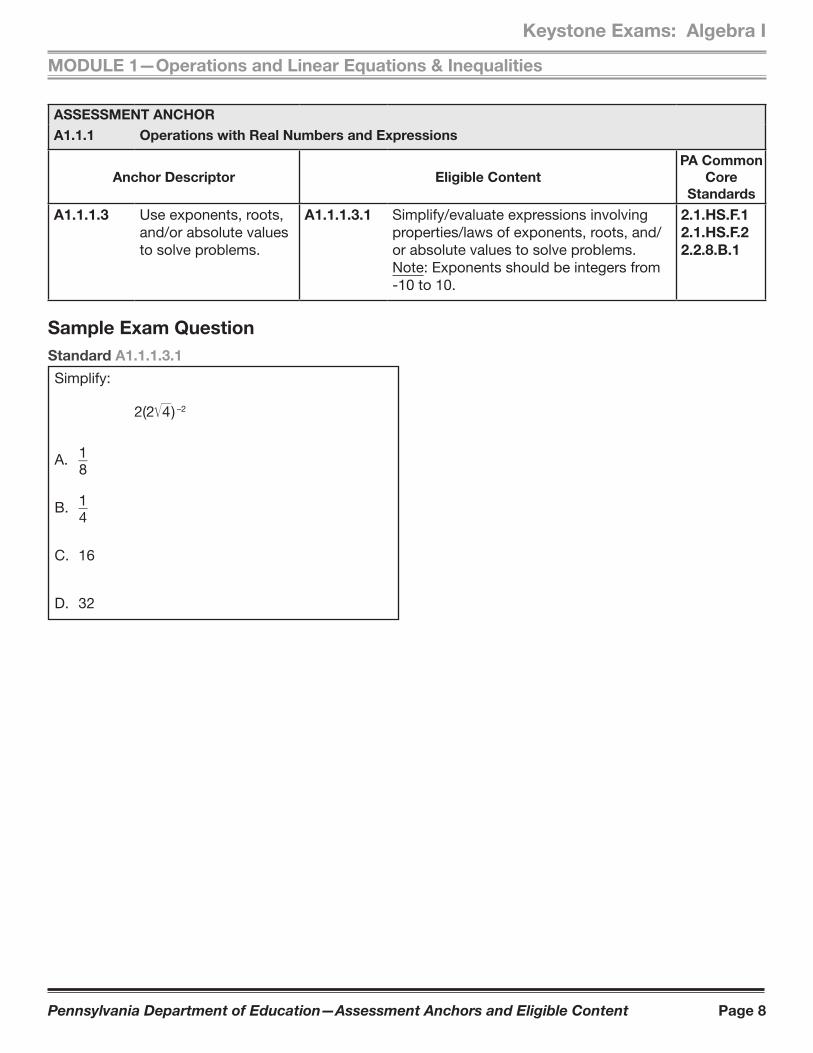
Simplify:
2(2 Ï}
4 ) –2
A. 1 __ 8
B. 1 __ 4
C. 16
D. 32
Pennsylvania Department of Education—Assessment Anchors and Eligible Content Page 9
Keystone Exams: Algebra I
MODULE 1—Operations and Linear Equations & Inequalities
ASSESSMENT ANCHORA1.1.1 Operations with Real Numbers and Expressions
Anchor Descriptor Eligible ContentPA Common
Core Standards
A1.1.1.4 Use estimation strategies in problem-solving situations.
A1.1.1.4.1 Use estimation to solve problems. 2.2.7.B.3 2.2.HS.D.9
Sample Exam QuestionStandard A1.1.1.4.1
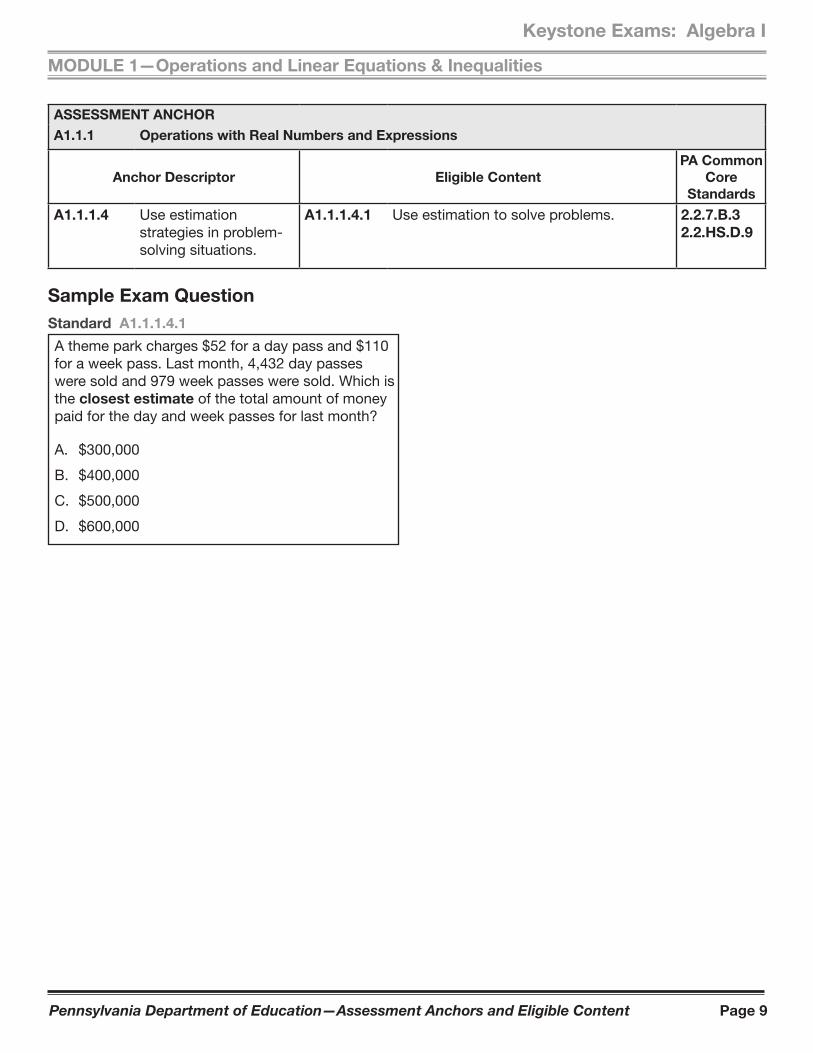
A theme park charges $52 for a day pass and $110 for a week pass. Last month, 4,432 day passes were sold and 979 week passes were sold. Which is the closest estimate of the total amount of money paid for the day and week passes for last month?
A. $300,000
B. $400,000
C. $500,000
D. $600,000
Pennsylvania Department of Education—Assessment Anchors and Eligible Content Page 10
MODULE 1—Operations and Linear Equations & Inequalities
Keystone Exams: Algebra I
ASSESSMENT ANCHORA1.1.1 Operations with Real Numbers and Expressions
Anchor Descriptor Eligible ContentPA Common
Core Standards
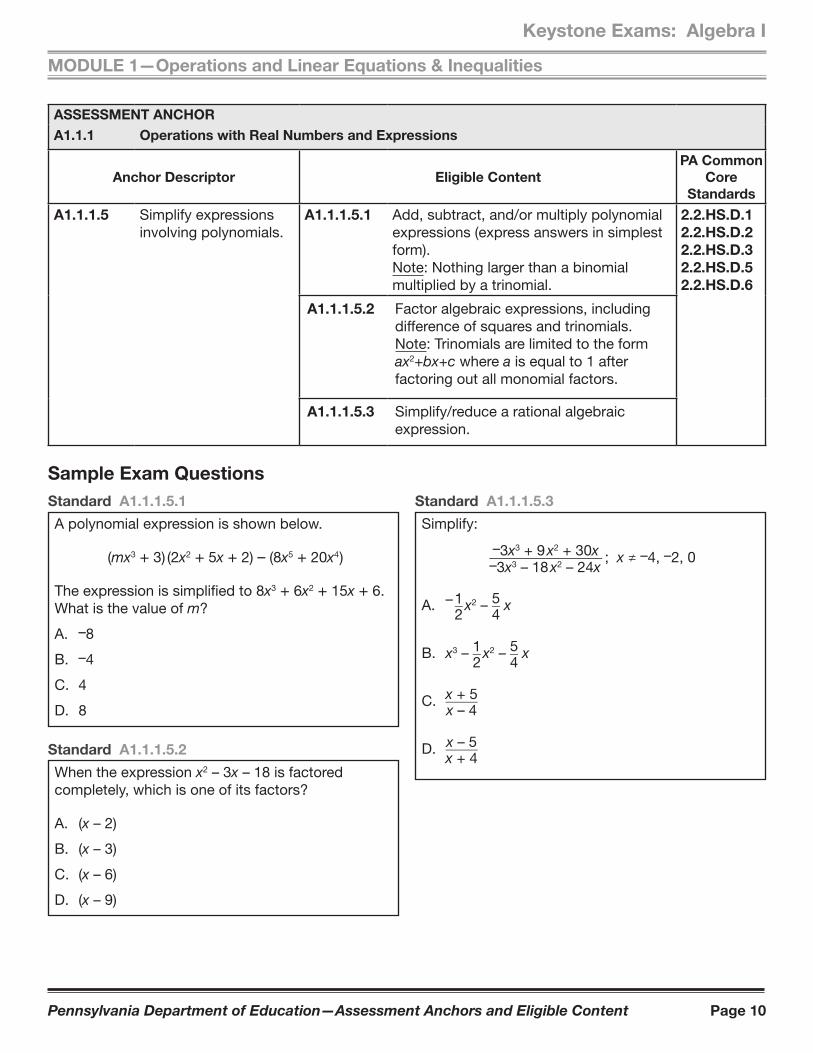
A1.1.1.5 Simplify expressions involving polynomials.
A1.1.1.5.1 Add, subtract, and/or multiply polynomial expressions (express answers in simplest form). Note: Nothing larger than a binomial multiplied by a trinomial.
2.2.HS.D.1 2.2.HS.D.2 2.2.HS.D.32.2.HS.D.52.2.HS.D.6
A1.1.1.5.2 Factor algebraic expressions, including difference of squares and trinomials.Note: Trinomials are limited to the form ax2+bx+c where a is equal to 1 after factoring out all monomial factors.
A1.1.1.5.3 Simplify/reduce a rational algebraic expression.
Sample Exam Questions Standard A1.1.1.5.1
A polynomial expression is shown below.
(mx3 + 3) (2x2 + 5x + 2) – (8x5 + 20x4 )
The expression is simplified to 8x3 + 6x2 + 15x + 6. What is the value of m?
A. –8
B. –4
C. 4
D. 8
Standard A1.1.1.5.2
When the expression x2 – 3x – 18 is factored completely, which is one of its factors?
A. (x – 2)
B. (x – 3)
C. (x – 6)
D. (x – 9)
Standard A1.1.1.5.3
Simplify:
–3x3 + 9 x2 + 30x }} –3x3 – 18 x2 – 24x ; x ≠ –4, –2, 0
A. – 1 } 2 x2 – 5 }
4 x
B. x3 – 1 } 2 x2 – 5 }
4 x
C. x + 5 } x – 4
D. x – 5 } x + 4
Pennsylvania Department of Education—Assessment Anchors and Eligible Content Page 11
Keystone Exams: Algebra I
MODULE 1—Operations and Linear Equations & Inequalities
Standard A1.1.1
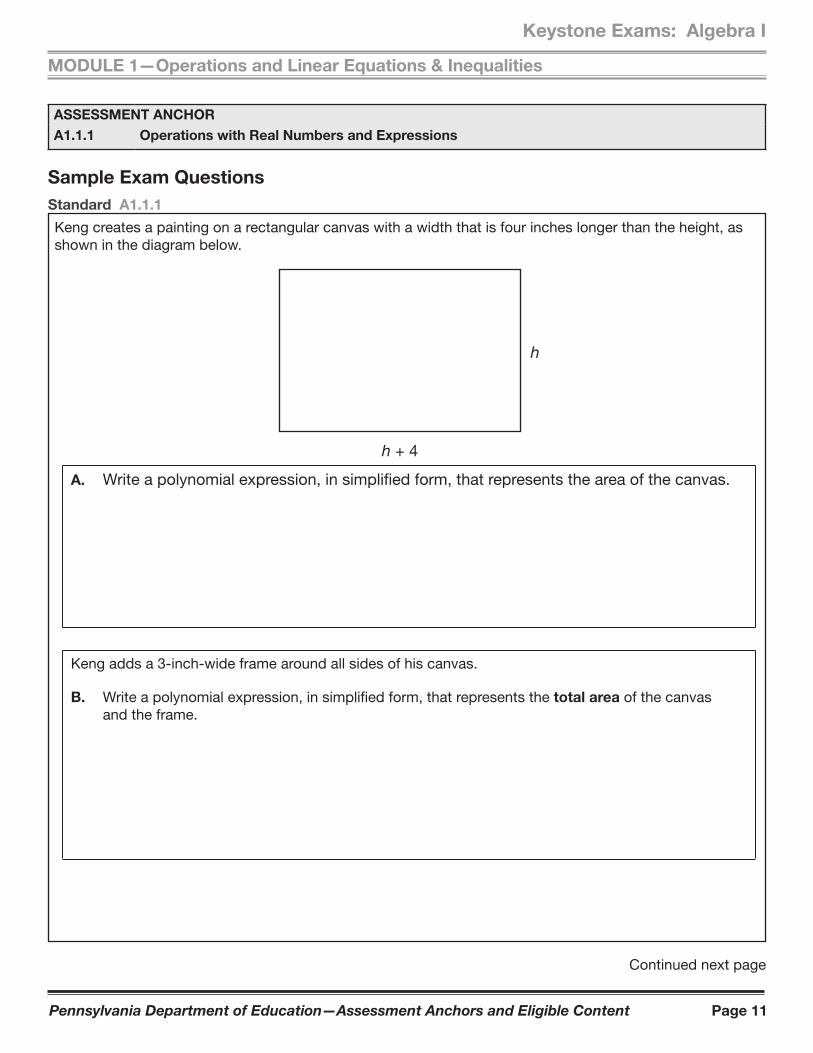
Keng creates a painting on a rectangular canvas with a width that is four inches longer than the height, as shown in the diagram below.
h
h + 4
A. Write a polynomial expression, in simplified form, that represents the area of the canvas.
Keng adds a 3-inch-wide frame around all sides of his canvas.
B. Write a polynomial expression, in simplified form, that represents the total area of the canvas and the frame.
Continued next page
ASSESSMENT ANCHORA1.1.1 Operations with Real Numbers and Expressions
Sample Exam Questions
Pennsylvania Department of Education—Assessment Anchors and Eligible Content Page 12
MODULE 1—Operations and Linear Equations & Inequalities
Keystone Exams: Algebra I
Continued. Please refer to the previous page for task explanation.
Keng is unhappy with his 3-inch-wide frame, so he decides to put a frame with a different width around his canvas. The total area of the canvas and the new frame is given by the polynomial h2 + 8h + 12, where h represents the height of the canvas.
C. Determine the width of the new frame. Show all your work. Explain why you did each step.
Pennsylvania Department of Education—Assessment Anchors and Eligible Content Page 13
Keystone Exams: Algebra I
MODULE 1—Operations and Linear Equations & Inequalities
Standard A1.1.1
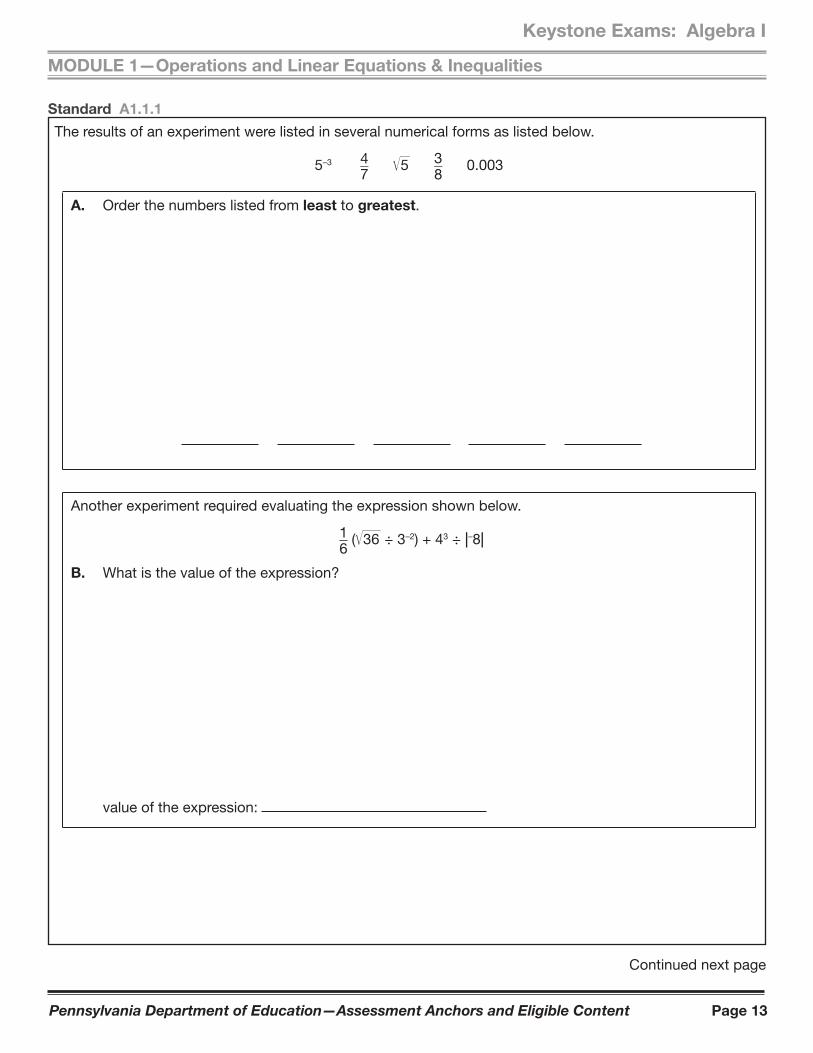
The results of an experiment were listed in several numerical forms as listed below.
5–3 4 } 7 Ï
} 5 3 }
8 0.003
A. Order the numbers listed from least to greatest.
Another experiment required evaluating the expression shown below.
1 } 6 ( Ï
} 36 ÷ 3–2) + 43 ÷ z–8z
B. What is the value of the expression?
value of the expression:
Continued next page
Pennsylvania Department of Education—Assessment Anchors and Eligible Content Page 14
MODULE 1—Operations and Linear Equations & Inequalities
Keystone Exams: Algebra I
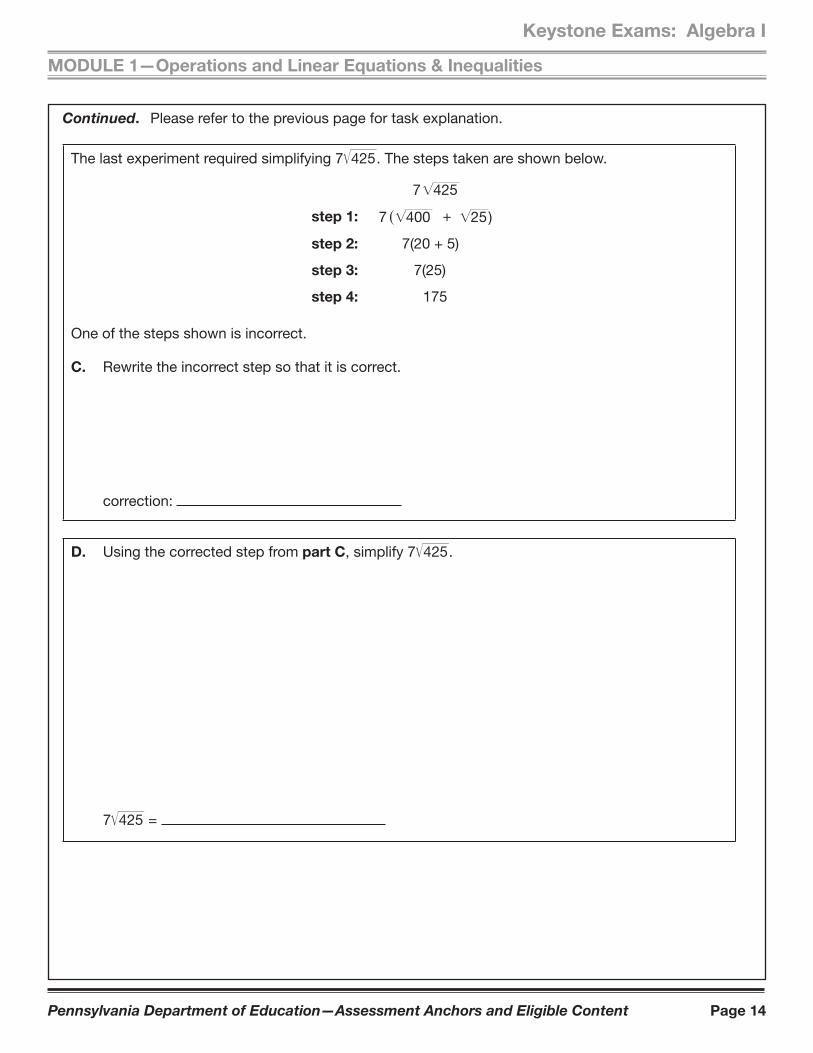
Continued. Please refer to the previous page for task explanation.
The last experiment required simplifying 7 Ï}
425 . The steps taken are shown below.
7 425
step 1: 7 400 25)
step 2: 7(20 + 5)
step 3: 7(25)
step 4: 175
+
One of the steps shown is incorrect.
C. Rewrite the incorrect step so that it is correct.
correction:
D. Using the corrected step from part C, simplify 7 Ï}
425 .
7 Ï}
425 =
Pennsylvania Department of Education—Assessment Anchors and Eligible Content Page 15
Keystone Exams: Algebra I
MODULE 1—Operations and Linear Equations & Inequalities
ASSESSMENT ANCHORA1.1.2 Linear Equations
Anchor Descriptor Eligible ContentPA Common
Core Standards
A1.1.2.1 Write, solve, and/or graph linear equations using various methods.
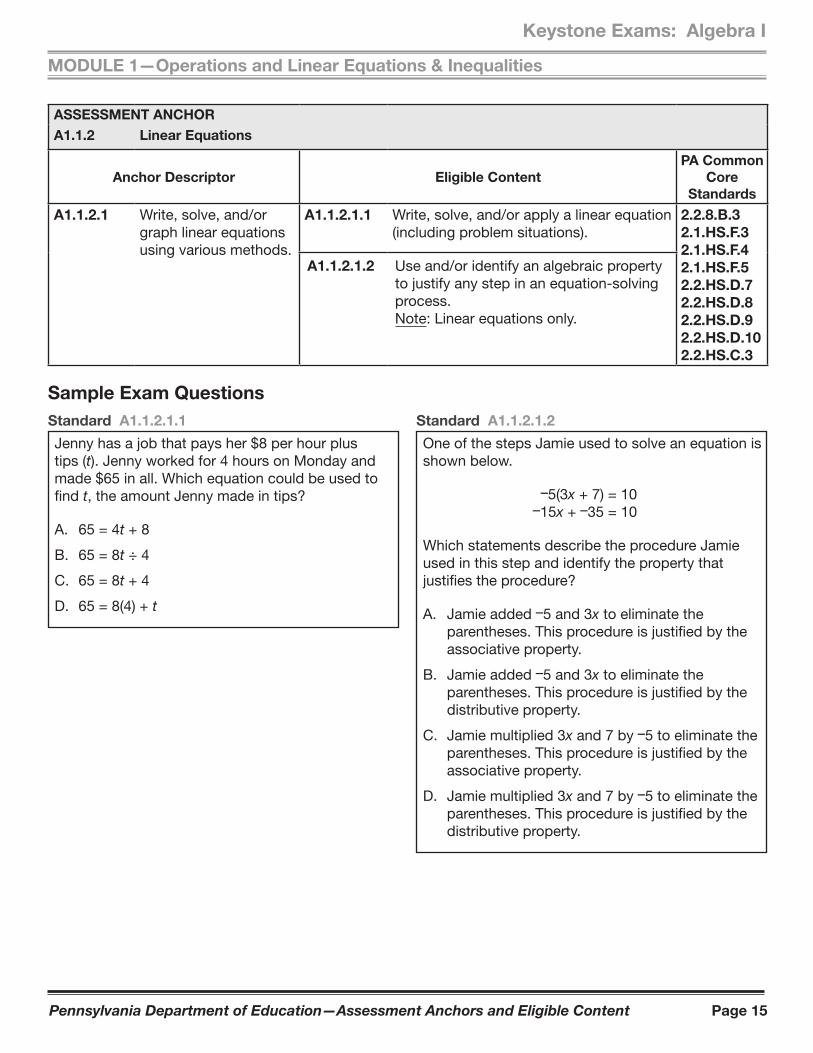
A1.1.2.1.1 Write, solve, and/or apply a linear equation (including problem situations).
2.2.8.B.32.1.HS.F.32.1.HS.F.42.1.HS.F.52.2.HS.D.72.2.HS.D.82.2.HS.D.92.2.HS.D.102.2.HS.C.3
A1.1.2.1.2 Use and/or identify an algebraic property to justify any step in an equation-solving process.Note: Linear equations only.
Sample Exam QuestionsStandard A1.1.2.1.1
Jenny has a job that pays her $8 per hour plus tips (t). Jenny worked for 4 hours on Monday and made $65 in all. Which equation could be used to find t, the amount Jenny made in tips?
A. 65 = 4t + 8
B. 65 = 8t ÷ 4
C. 65 = 8t + 4
D. 65 = 8(4) + t
Standard A1.1.2.1.2
One of the steps Jamie used to solve an equation is shown below.
–5(3x + 7) = 10 –15x + –35 = 10
Which statements describe the procedure Jamie used in this step and identify the property that justifies the procedure?
A. Jamie added –5 and 3x to eliminate the parentheses. This procedure is justified by the associative property.
B. Jamie added –5 and 3x to eliminate the parentheses. This procedure is justified by the distributive property.
C. Jamie multiplied 3x and 7 by –5 to eliminate the parentheses. This procedure is justified by the associative property.
D. Jamie multiplied 3x and 7 by –5 to eliminate the parentheses. This procedure is justified by the distributive property.
Pennsylvania Department of Education—Assessment Anchors and Eligible Content Page 16
MODULE 1—Operations and Linear Equations & Inequalities
Keystone Exams: Algebra I
ASSESSMENT ANCHORA1.1.2 Linear Equations
Anchor Descriptor Eligible ContentPA Common
Core Standards
A1.1.2.1 Write, solve, and/or graph linear equations using various methods.
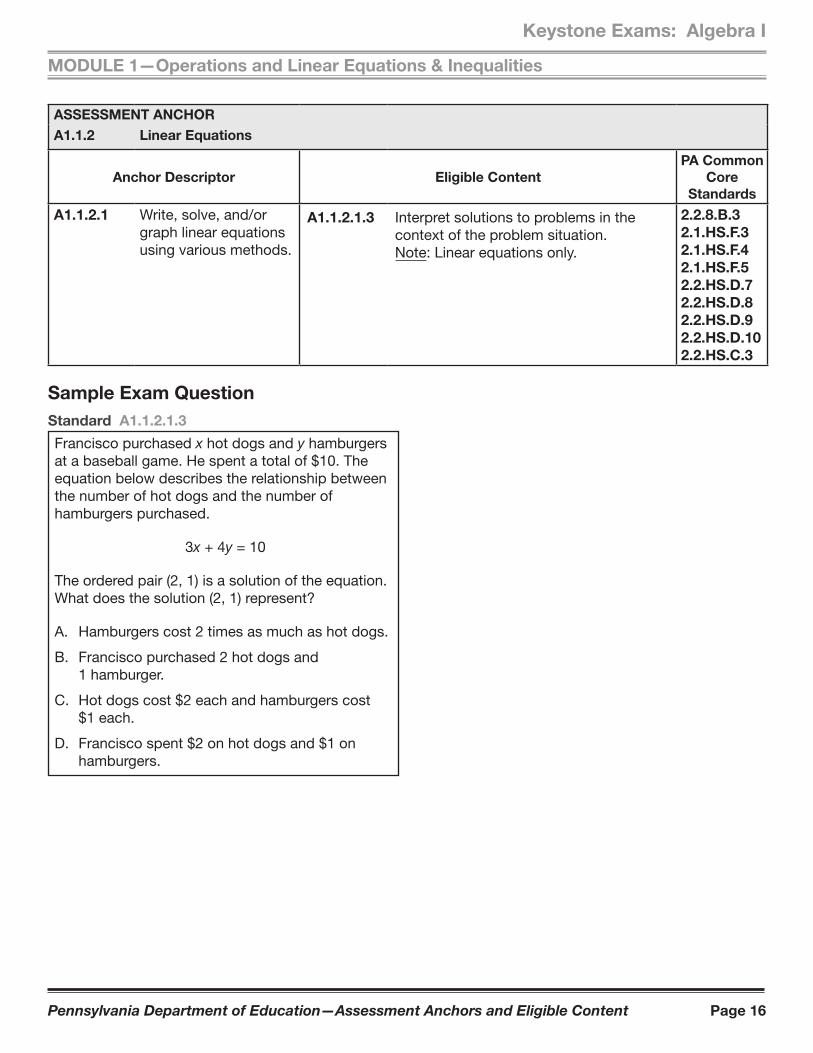
A1.1.2.1.3 Interpret solutions to problems in the context of the problem situation.Note: Linear equations only.
2.2.8.B.32.1.HS.F.32.1.HS.F.42.1.HS.F.52.2.HS.D.72.2.HS.D.82.2.HS.D.92.2.HS.D.102.2.HS.C.3
Sample Exam QuestionStandard A1.1.2.1.3
Francisco purchased x hot dogs and y hamburgers at a baseball game. He spent a total of $10. The equation below describes the relationship between the number of hot dogs and the number of hamburgers purchased.
3x + 4y = 10
The ordered pair (2, 1) is a solution of the equation. What does the solution (2, 1) represent?
A. Hamburgers cost 2 times as much as hot dogs.
B. Francisco purchased 2 hot dogs and 1 hamburger.
C. Hot dogs cost $2 each and hamburgers cost $1 each.
D. Francisco spent $2 on hot dogs and $1 on hamburgers.
Pennsylvania Department of Education—Assessment Anchors and Eligible Content Page 17
Keystone Exams: Algebra I
MODULE 1—Operations and Linear Equations & Inequalities
ASSESSMENT ANCHORA1.1.2 Linear Equations
Anchor Descriptor Eligible ContentPA Common
Core Standards
A1.1.2.2 Write, solve, and/or graph systems of linear equations using various methods.
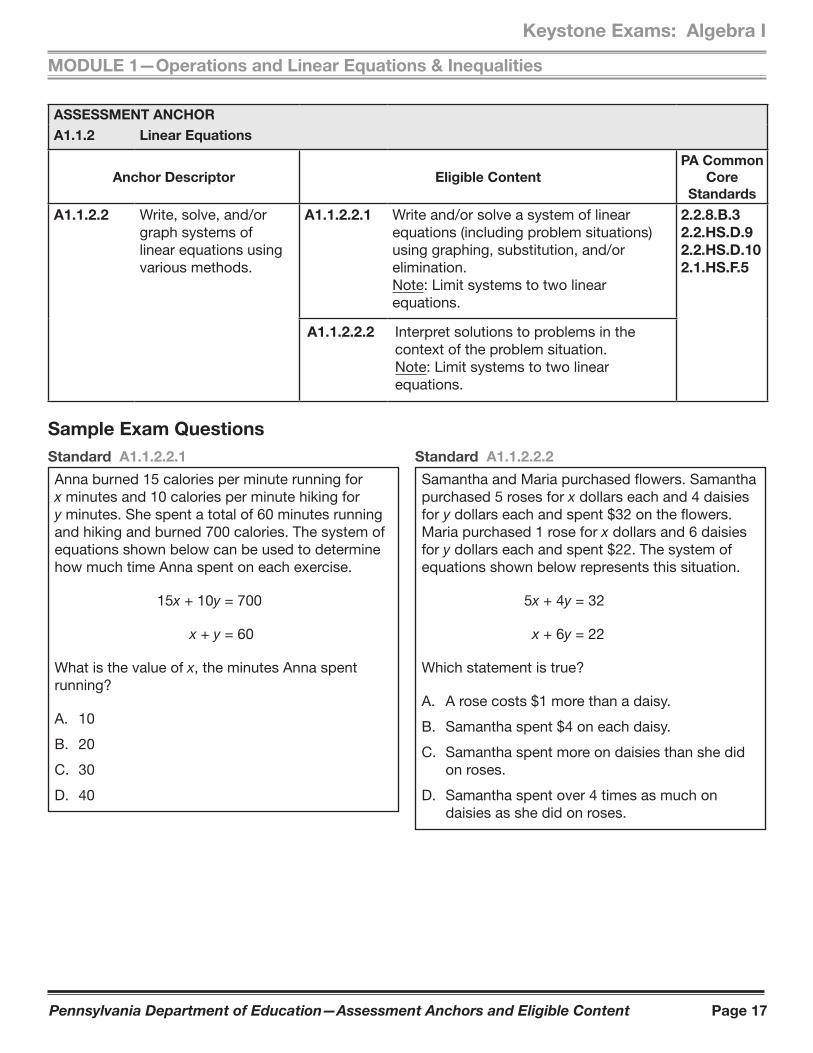
A1.1.2.2.1 Write and/or solve a system of linear equations (including problem situations) using graphing, substitution, and/or elimination.Note: Limit systems to two linear equations.
2.2.8.B.32.2.HS.D.92.2.HS.D.102.1.HS.F.5
A1.1.2.2.2 Interpret solutions to problems in the context of the problem situation.Note: Limit systems to two linear equations.
Sample Exam QuestionsStandard A1.1.2.2.1
Anna burned 15 calories per minute running for x minutes and 10 calories per minute hiking for y minutes. She spent a total of 60 minutes running and hiking and burned 700 calories. The system of equations shown below can be used to determine how much time Anna spent on each exercise.
15x + 10y = 700
x + y = 60
What is the value of x, the minutes Anna spent running?
A. 10
B. 20
C. 30
D. 40
Standard A1.1.2.2.2
Samantha and Maria purchased flowers. Samantha purchased 5 roses for x dollars each and 4 daisies for y dollars each and spent $32 on the flowers. Maria purchased 1 rose for x dollars and 6 daisies for y dollars each and spent $22. The system of equations shown below represents this situation.
5x + 4y = 32
x + 6y = 22
Which statement is true?
A. A rose costs $1 more than a daisy.
B. Samantha spent $4 on each daisy.
C. Samantha spent more on daisies than she did on roses.
D. Samantha spent over 4 times as much on daisies as she did on roses.
Pennsylvania Department of Education—Assessment Anchors and Eligible Content Page 18
MODULE 1—Operations and Linear Equations & Inequalities
Keystone Exams: Algebra I
Standard A1.1.2
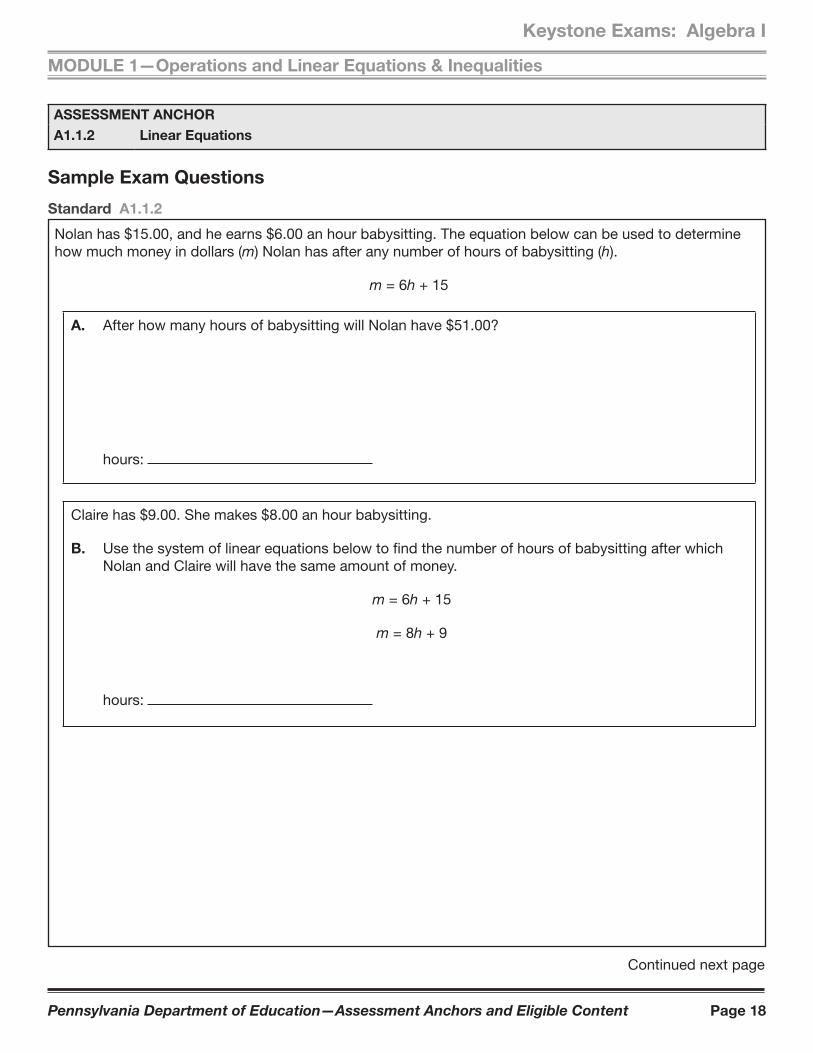
Nolan has $15.00, and he earns $6.00 an hour babysitting. The equation below can be used to determine how much money in dollars (m) Nolan has after any number of hours of babysitting (h).
m = 6h + 15
A. After how many hours of babysitting will Nolan have $51.00?
hours:
Claire has $9.00. She makes $8.00 an hour babysitting.
B. Use the system of linear equations below to find the number of hours of babysitting after which Nolan and Claire will have the same amount of money.
m = 6h + 15
m = 8h + 9
hours:
Continued next page
ASSESSMENT ANCHORA1.1.2 Linear Equations
Sample Exam Questions
Pennsylvania Department of Education—Assessment Anchors and Eligible Content Page 19
Keystone Exams: Algebra I
MODULE 1—Operations and Linear Equations & Inequalities
Continued. Please refer to the previous page for task explanation.
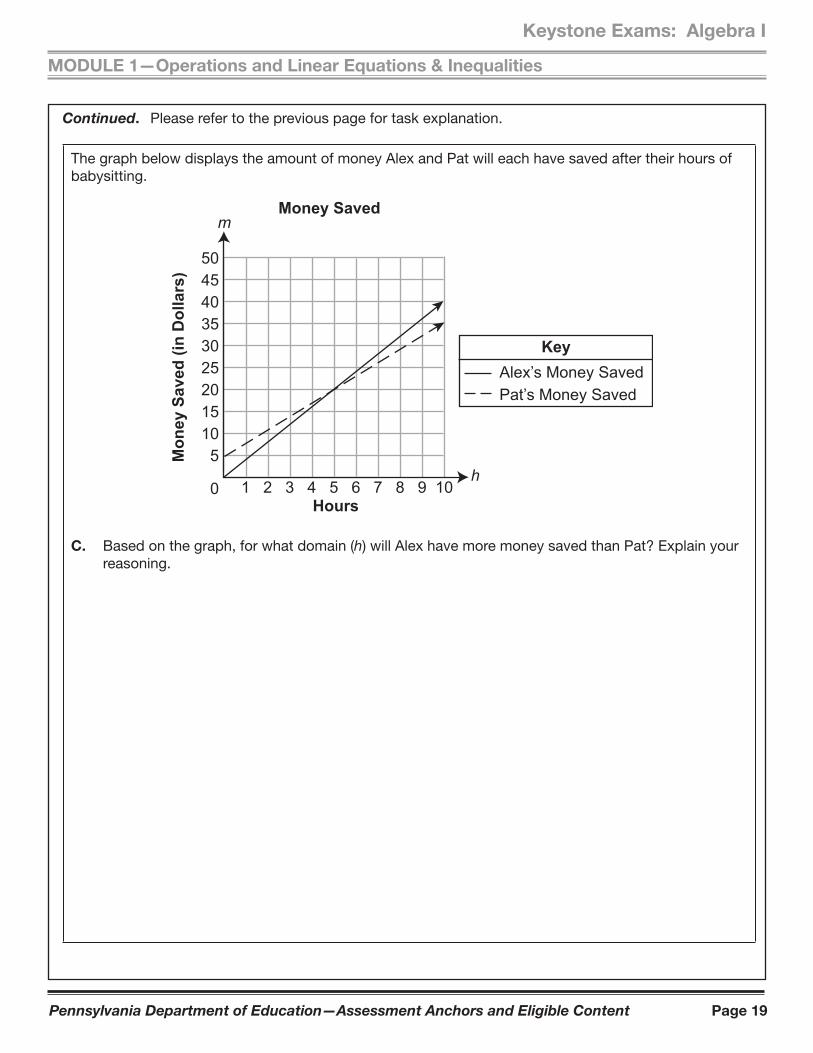
The graph below displays the amount of money Alex and Pat will each have saved after their hours of babysitting.
0Hours
Mon
ey S
aved
(in
Dol
lars
)
h
m
5045403530252015105
1 2 3 4 5 6 7 8 9 10
Money Saved
KeyAlex’s Money SavedPat’s Money Saved
C. Based on the graph, for what domain (h) will Alex have more money saved than Pat? Explain your reasoning.
Pennsylvania Department of Education—Assessment Anchors and Eligible Content Page 20
MODULE 1—Operations and Linear Equations & Inequalities
Keystone Exams: Algebra I
Standard A1.1.2
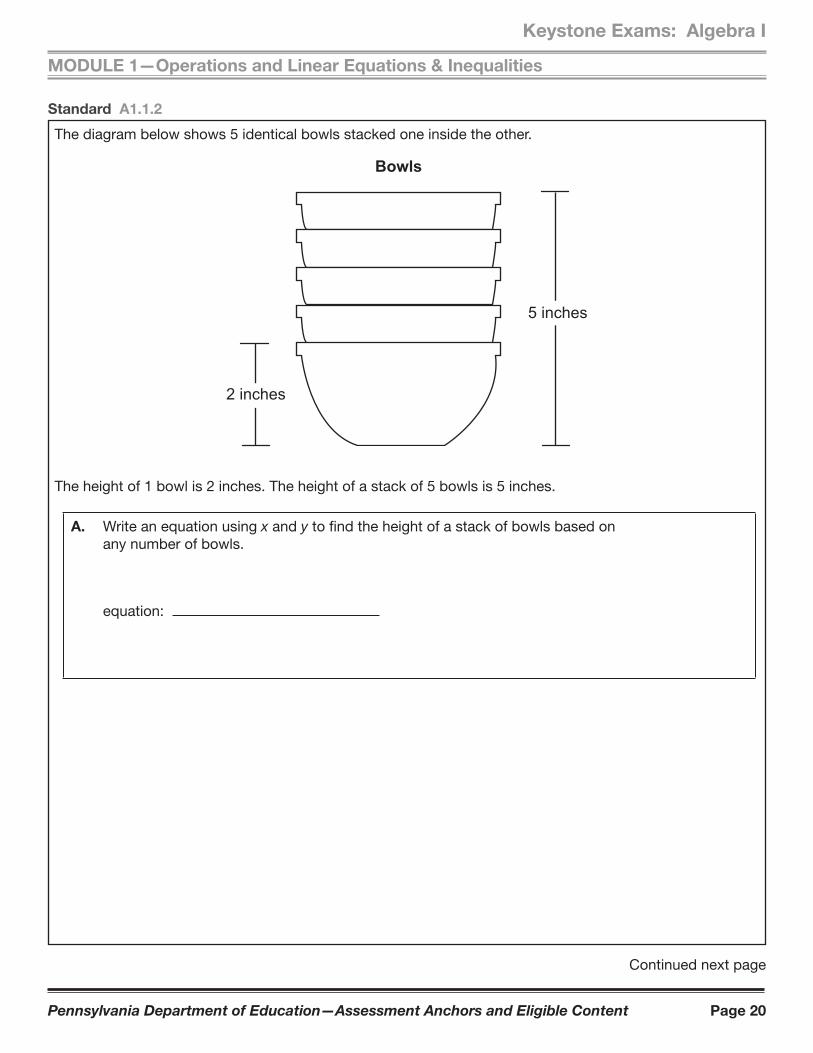
The diagram below shows 5 identical bowls stacked one inside the other.
2 inches
5 inches
Bowls
The height of 1 bowl is 2 inches. The height of a stack of 5 bowls is 5 inches.
A. Write an equation using x and y to find the height of a stack of bowls based on any number of bowls.
equation:
Continued next page
Pennsylvania Department of Education—Assessment Anchors and Eligible Content Page 21
Keystone Exams: Algebra I
MODULE 1—Operations and Linear Equations & Inequalities
Continued. Please refer to the previous page for task explanation.
B. Describe what the x and y variables represent.
x-variable:
y-variable:
C. What is the height, in inches, of a stack of 10 bowls?
height: inches
Pennsylvania Department of Education—Assessment Anchors and Eligible Content Page 22
MODULE 1—Operations and Linear Equations & Inequalities
Keystone Exams: Algebra I
ASSESSMENT ANCHORA1.1.3 Linear Inequalities
Anchor Descriptor Eligible ContentPA Common
Core Standards
A1.1.3.1 Write, solve, and/or graph linear inequalities using various methods.
A1.1.3.1.1 Write or solve compound inequalities and/or graph their solution sets on a number line (may include absolute value inequalities).
2.2.HS.D.72.2.HS.D.92.2.HS.D.102.1.HS.F.5
A1.1.3.1.2 Identify or graph the solution set to a linear inequality on a number line.
A1.1.3.1.3 Interpret solutions to problems in the context of the problem situation.Note: Limit to linear inequalities.
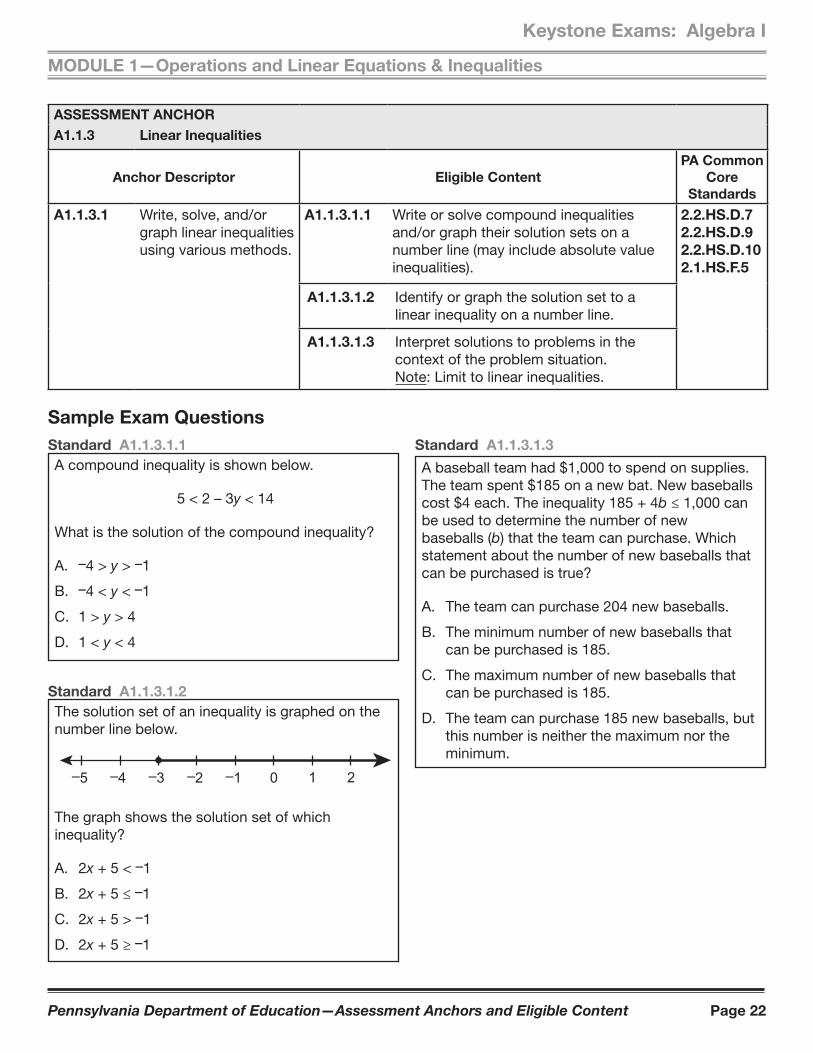
Sample Exam QuestionsStandard A1.1.3.1.1 A compound inequality is shown below.
5 < 2 – 3y < 14
What is the solution of the compound inequality?
A. –4 > y > –1
B. –4 < y < –1
C. 1 > y > 4
D. 1 < y < 4
Standard A1.1.3.1.3
A baseball team had $1,000 to spend on supplies. The team spent $185 on a new bat. New baseballs cost $4 each. The inequality 185 + 4b ≤ 1,000 can be used to determine the number of new baseballs (b) that the team can purchase. Which statement about the number of new baseballs that can be purchased is true?
A. The team can purchase 204 new baseballs.
B. The minimum number of new baseballs that can be purchased is 185.
C. The maximum number of new baseballs that can be purchased is 185.
D. The team can purchase 185 new baseballs, but this number is neither the maximum nor the minimum.
Standard A1.1.3.1.2 The solution set of an inequality is graphed on the number line below.
–4–5 –3 –2 –1 0 1 2
The graph shows the solution set of which inequality?
A. 2x + 5 < –1
B. 2x + 5 ≤ –1
C. 2x + 5 > –1
D. 2x + 5 ≥ –1
Pennsylvania Department of Education—Assessment Anchors and Eligible Content Page 23
Keystone Exams: Algebra I
MODULE 1—Operations and Linear Equations & Inequalities
ASSESSMENT ANCHORA1.1.3 Linear Inequalities
Anchor Descriptor Eligible ContentPA Common
Core Standards
A1.1.3.2 Write, solve, and/or graph systems of linear inequalities using various methods.
A1.1.3.2.1 Write and/or solve a system of linear inequalities using graphing.Note: Limit systems to two linear inequalities.
2.2.HS.D.102.1.HS.F.5
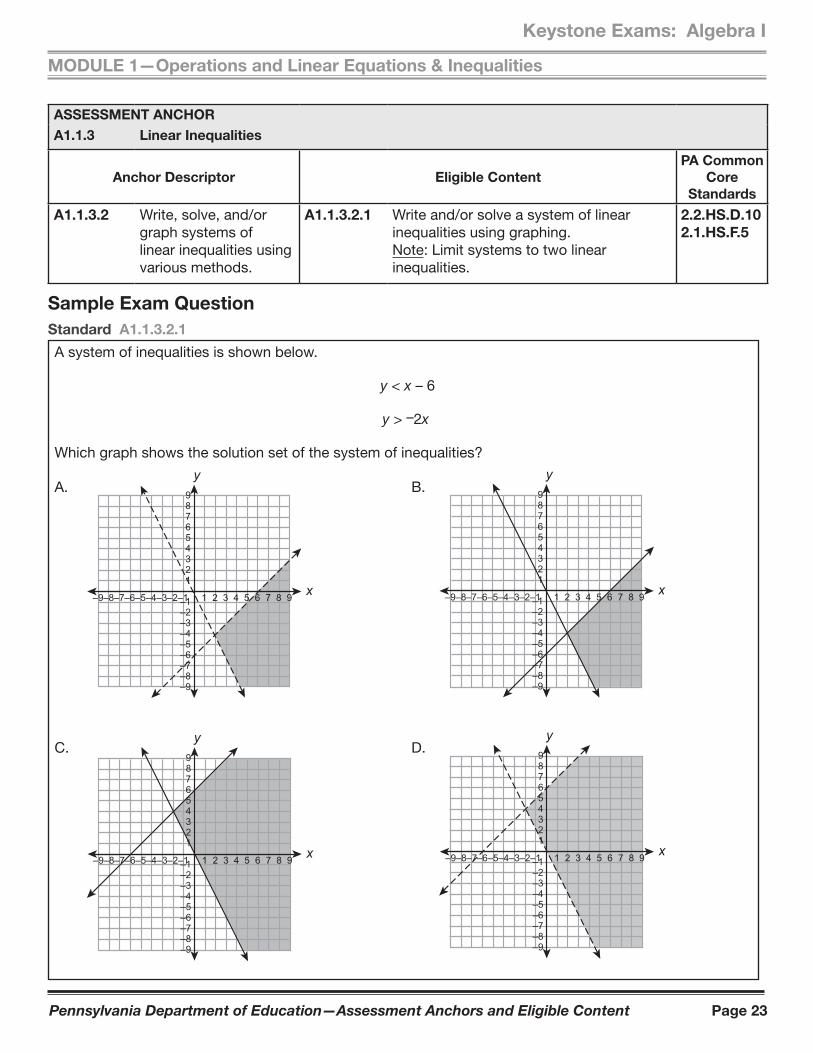
Sample Exam QuestionStandard A1.1.3.2.1
A system of inequalities is shown below.
y < x – 6
y > –2x
Which graph shows the solution set of the system of inequalities?
987654321
–1–2–3–4–5–6–7–8–9
1 2 3 4 5 6 7 8 9–9–8–7–6–5–4–3–2–1
y
x
987654321
–1–2–3–4–5–6–7–8–9
1 2 3 4 5 6 7 8 9–9–8–7–6–5–4–3–2–1
y
x
987654321
–1–2–3–4–5–6–7–8–9
1 2 3 4 5 6 7 8 9–9–8–7–6–5–4–3–2–1
y
x
987654321
–1–2–3–4–5–6–7–8–9
1 2 3 4 5 6 7 8 9–9–8–7–6–5–4–3–2–1
y
x
A. B.
C. D.
Pennsylvania Department of Education—Assessment Anchors and Eligible Content Page 24
MODULE 1—Operations and Linear Equations & Inequalities
Keystone Exams: Algebra I
ASSESSMENT ANCHORA1.1.3 Linear Inequalities
Anchor Descriptor Eligible ContentPA Common
Core Standards
A1.1.3.2 Write, solve, and/or graph systems of linear inequalities using various methods.
A1.1.3.2.2 Interpret solutions to problems in the context of the problem situation.Note: Limit systems to two linear inequalities.
2.2.HS.D.102.1.HS.F.5
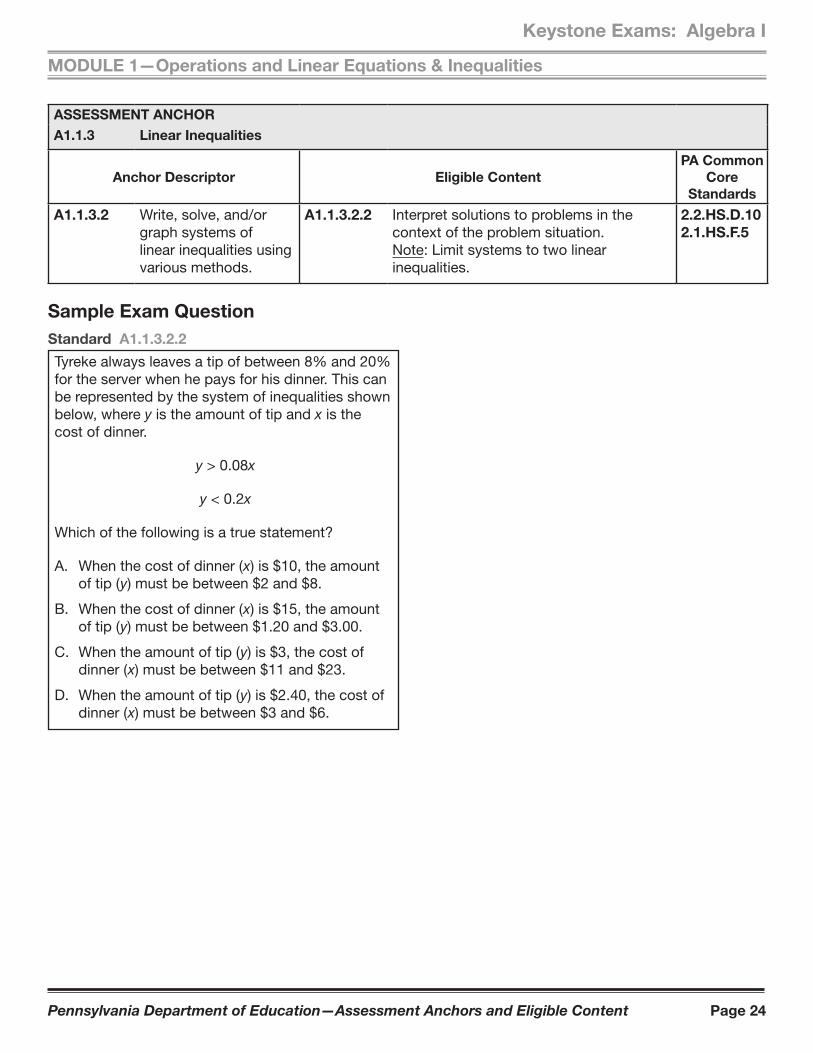
Sample Exam QuestionStandard A1.1.3.2.2
Tyreke always leaves a tip of between 8% and 20% for the server when he pays for his dinner. This can be represented by the system of inequalities shown below, where y is the amount of tip and x is the cost of dinner.
y > 0.08x
y < 0.2x
Which of the following is a true statement?
A. When the cost of dinner ( x) is $10, the amount of tip ( y) must be between $2 and $8.
B. When the cost of dinner ( x) is $15, the amount of tip ( y) must be between $1.20 and $3.00.
C. When the amount of tip ( y) is $3, the cost of dinner ( x) must be between $11 and $23.
D. When the amount of tip ( y) is $2.40, the cost of dinner ( x) must be between $3 and $6.
Pennsylvania Department of Education—Assessment Anchors and Eligible Content Page 25
Keystone Exams: Algebra I
MODULE 1—Operations and Linear Equations & Inequalities
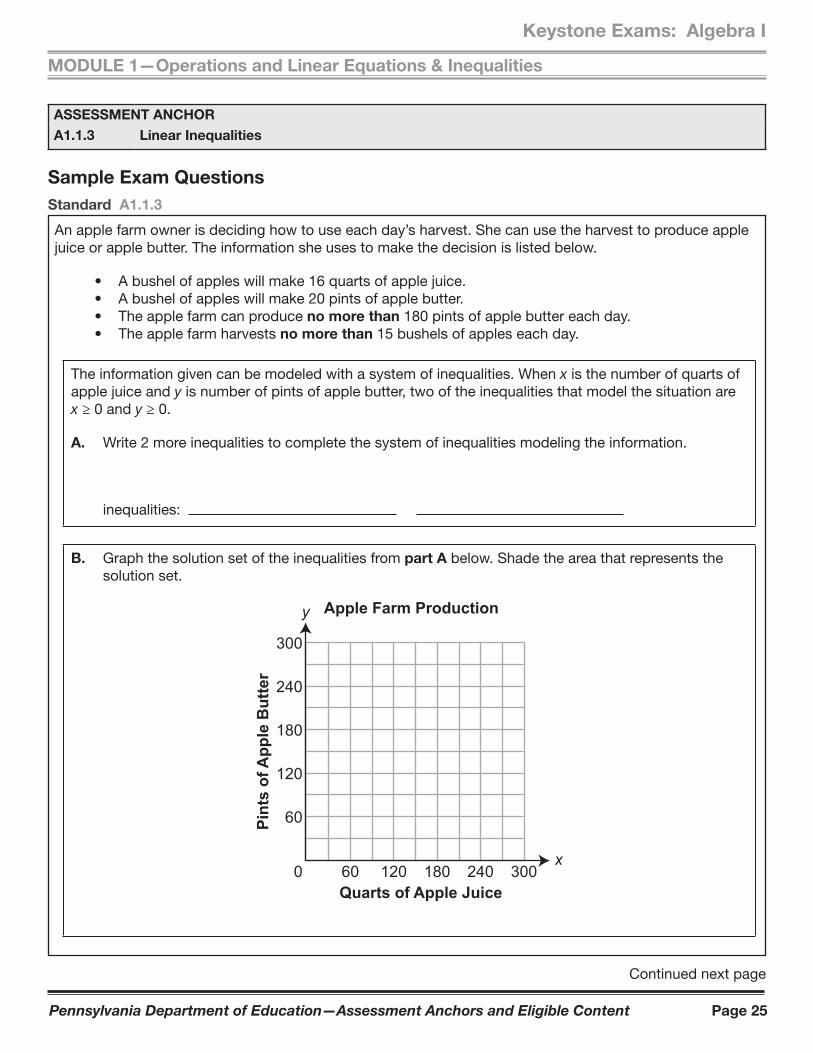
Standard A1.1.3
An apple farm owner is deciding how to use each day’s harvest. She can use the harvest to produce apple juice or apple butter. The information she uses to make the decision is listed below.
• A bushel of apples will make 16 quarts of apple juice. • A bushel of apples will make 20 pints of apple butter. • The apple farm can produce no more than 180 pints of apple butter each day. • The apple farm harvests no more than 15 bushels of apples each day.
The information given can be modeled with a system of inequalities. When x is the number of quarts of apple juice and y is number of pints of apple butter, two of the inequalities that model the situation are x ≥ 0 and y ≥ 0.
A. Write 2 more inequalities to complete the system of inequalities modeling the information.
inequalities:
B. Graph the solution set of the inequalities from part A below. Shade the area that represents the solution set.
0Quarts of Apple Juice
Pint
s of
App
le B
utte
r
300
240
180
120
60
60 120 180 240 300
Apple Farm Production
x
y
Continued next page
ASSESSMENT ANCHORA1.1.3 Linear Inequalities
Sample Exam Questions
Pennsylvania Department of Education—Assessment Anchors and Eligible Content Page 26
MODULE 1—Operations and Linear Equations & Inequalities
Keystone Exams: Algebra I
Continued. Please refer to the previous page for task explanation.
The apple farm makes a profit of $2.25 on each pint of apple butter and $2.50 on each quart of apple juice.
C. Explain how you can be certain the maximum profit will be realized when the apple farm produces 96 quarts of apple juice and 180 pints of apple butter.
Pennsylvania Department of Education—Assessment Anchors and Eligible Content Page 27
Keystone Exams: Algebra I
MODULE 1—Operations and Linear Equations & Inequalities
Standard A1.1.3
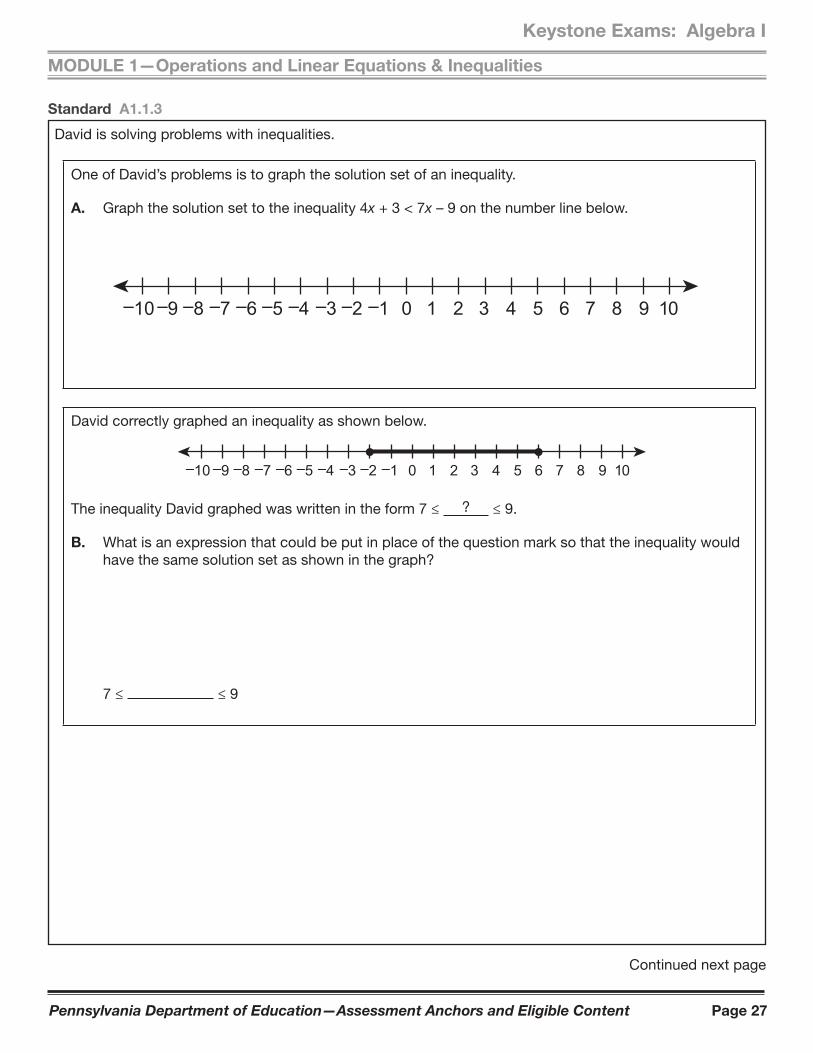
David is solving problems with inequalities.
One of David’s problems is to graph the solution set of an inequality.
A. Graph the solution set to the inequality 4x + 3 < 7x – 9 on the number line below.
–8–10 –9 –7 –6 104–5 7–2 –1 0 1 2 3 5 6 8 9–4 –3
David correctly graphed an inequality as shown below.
104 71 2 3 5 6 8 9–8–10 –9 –7 –6 –5 –2 –1 0–4 –3
The inequality David graphed was written in the form 7 ≤ ? ≤ 9.
B. What is an expression that could be put in place of the question mark so that the inequality would have the same solution set as shown in the graph?
7 ≤ ≤ 9
Continued next page
Pennsylvania Department of Education—Assessment Anchors and Eligible Content Page 28
MODULE 1—Operations and Linear Equations & Inequalities
Keystone Exams: Algebra I
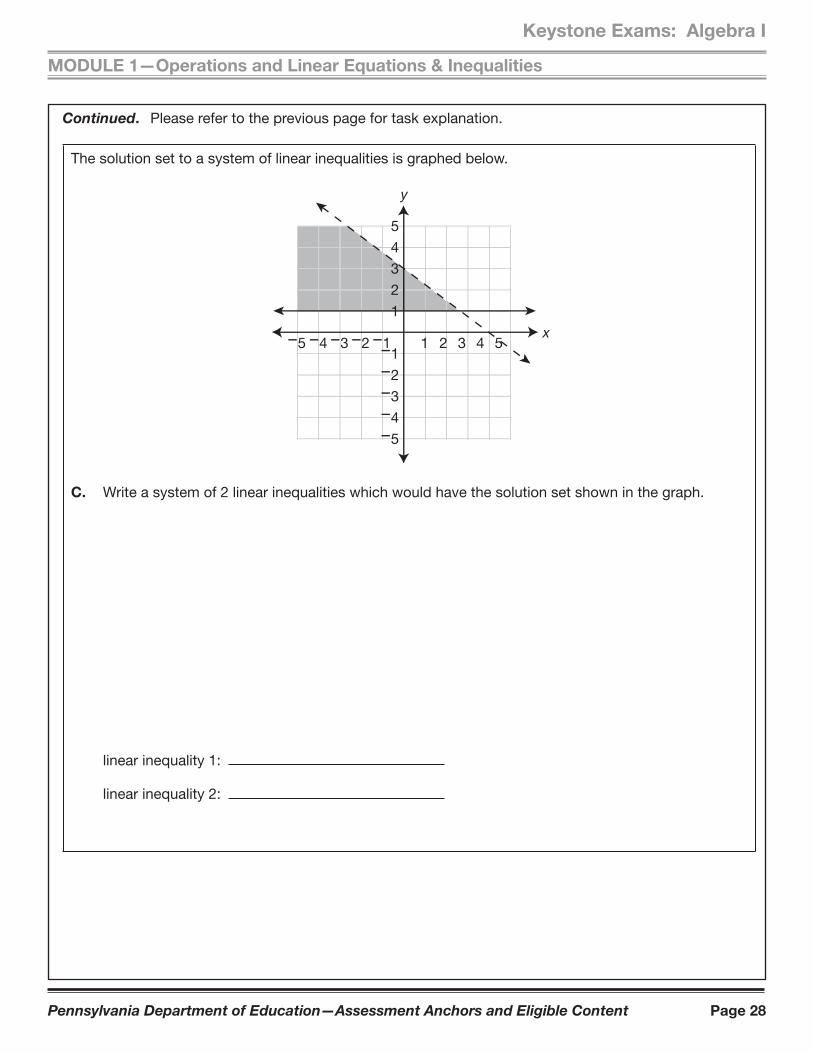
Continued. Please refer to the previous page for task explanation.
The solution set to a system of linear inequalities is graphed below.
x
y
1 2 3 4 5–5 –4 –3 –2 –1
54321
–1–2–3–4–5
C. Write a system of 2 linear inequalities which would have the solution set shown in the graph.
linear inequality 1:
linear inequality 2:
Pennsylvania Department of Education—Assessment Anchors and Eligible Content Page 29
Keystone Exams: Algebra I
MODULE 2—Linear Functions and Data Organizations
ASSESSMENT ANCHORA1.2.1 Functions
Anchor Descriptor Eligible ContentPA Common
Core Standards
A1.2.1.1 Analyze and/or use patterns or relations.
A1.2.1.1.1 Analyze a set of data for the existence of a pattern and represent the pattern algebraically and/or graphically.
2.2.HS.C.22.2.HS.C.12.2.HS.C.32.4.HS.B.2
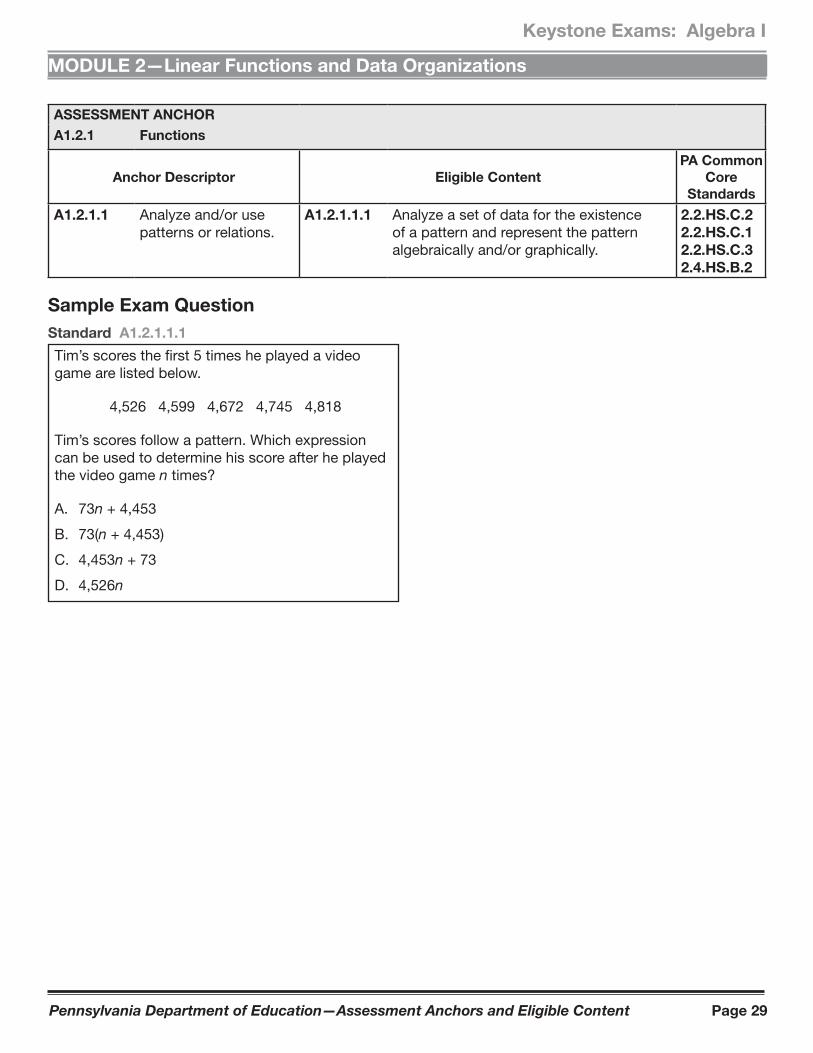
Sample Exam QuestionStandard A1.2.1.1.1
Tim’s scores the first 5 times he played a video game are listed below.
4,526 4,599 4,672 4,745 4,818
Tim’s scores follow a pattern. Which expression can be used to determine his score after he played the video game n times?
A. 73n + 4,453
B. 73(n + 4,453)
C. 4,453n + 73
D. 4,526n
Pennsylvania Department of Education—Assessment Anchors and Eligible Content Page 30
Keystone Exams: Algebra I
MODULE 2—Linear Functions and Data Organizations
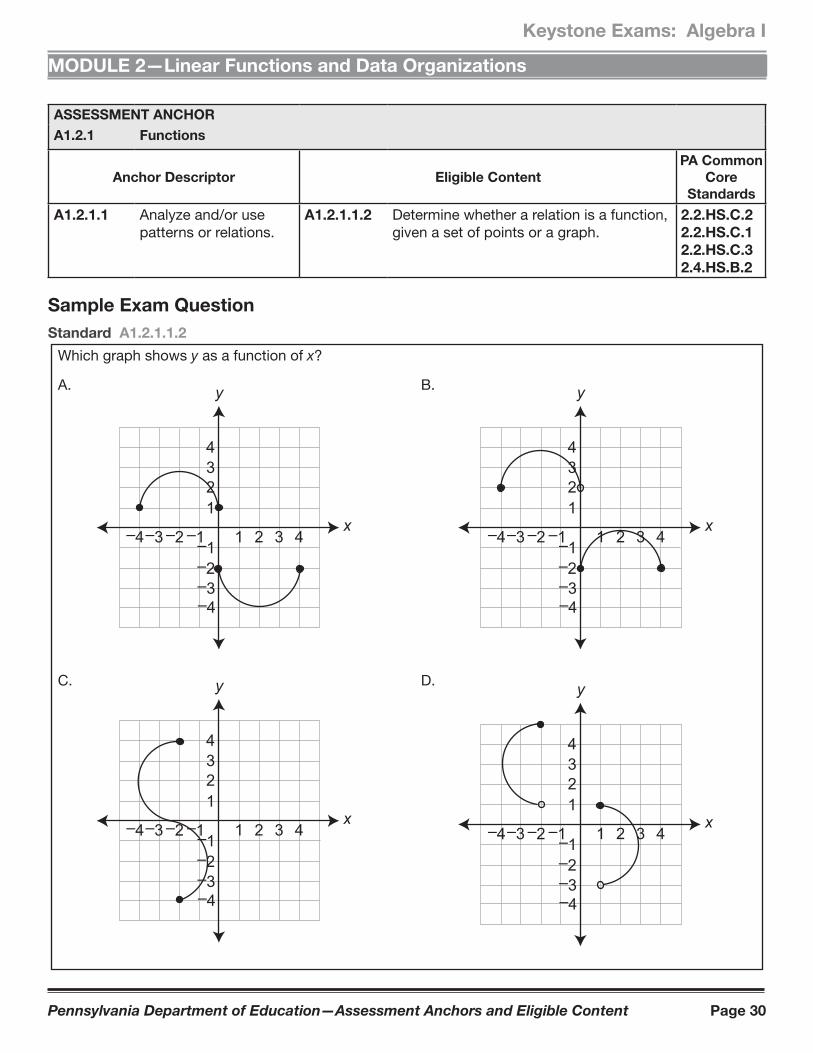
Standard A1.2.1.1.2
Which graph shows y as a function of x?
x
y
21 3 4–2–3–4
–4–3–2
1234
–1–1
x
y
21 3 4–2–3–4
–4–3–2
1234
–1–1
x
y
21 3 4–2–3–4
–4–3–2
1234
–1–1 x
y
21 3 4–2–3–4
–4–3–2
1234
–1–1
A. B.
C. D.
ASSESSMENT ANCHORA1.2.1 Functions
Anchor Descriptor Eligible ContentPA Common
Core Standards
A1.2.1.1 Analyze and/or use patterns or relations.
A1.2.1.1.2 Determine whether a relation is a function, given a set of points or a graph.
2.2.HS.C.22.2.HS.C.12.2.HS.C.32.4.HS.B.2
Sample Exam Question
Pennsylvania Department of Education—Assessment Anchors and Eligible Content Page 31
Keystone Exams: Algebra I
MODULE 2—Linear Functions and Data Organizations
ASSESSMENT ANCHORA1.2.1 Functions
Anchor Descriptor Eligible ContentPA Common
Core Standards
A1.2.1.1 Analyze and/or use patterns or relations.
A1.2.1.1.3 Identify the domain or range of a relation (may be presented as ordered pairs, a graph, or a table).
2.2.HS.C.22.2.HS.C.12.2.HS.C.32.4.HS.B.2
Sample Exam Question
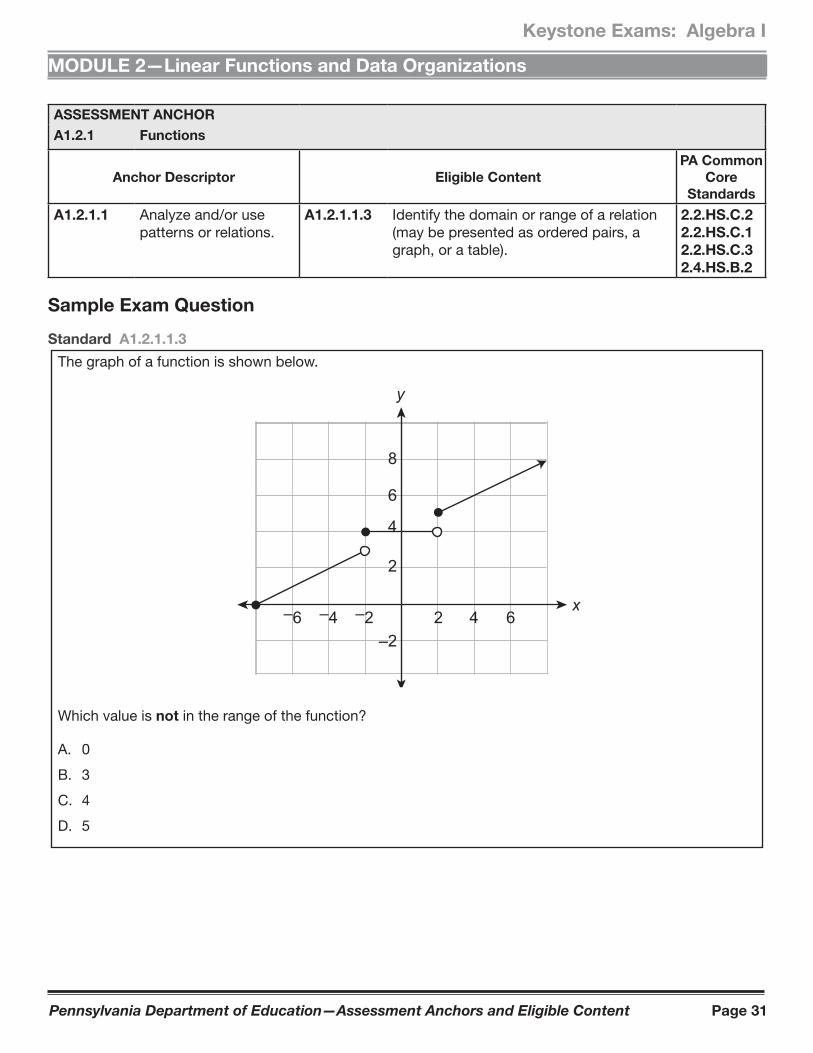
Standard A1.2.1.1.3
The graph of a function is shown below.
x2 4 6–6 –4 –2
8
6
4
2
–2
y
Which value is not in the range of the function?
A. 0
B. 3
C. 4
D. 5
Pennsylvania Department of Education—Assessment Anchors and Eligible Content Page 32
Keystone Exams: Algebra I
MODULE 2—Linear Functions and Data Organizations
ASSESSMENT ANCHORA1.2.1 Functions
Anchor Descriptor Eligible ContentPA Common
Core Standards
A1.2.1.2 Interpret and/or use linear functions and their equations, graphs, or tables.
A1.2.1.2.1 Create, interpret, and/or use the equation, graph, or table of a linear function.
2.2.8.B.2 2.4.HS.B.2 2.1.HS.F.3 2.1.HS.F.4 2.2.HS.C.2 2.2.HS.C.3 2.2.HS.C.4 2.2.HS.C.6
A1.2.1.2.2 Translate from one representation of a linear function to another (i.e., graph, table, and equation).
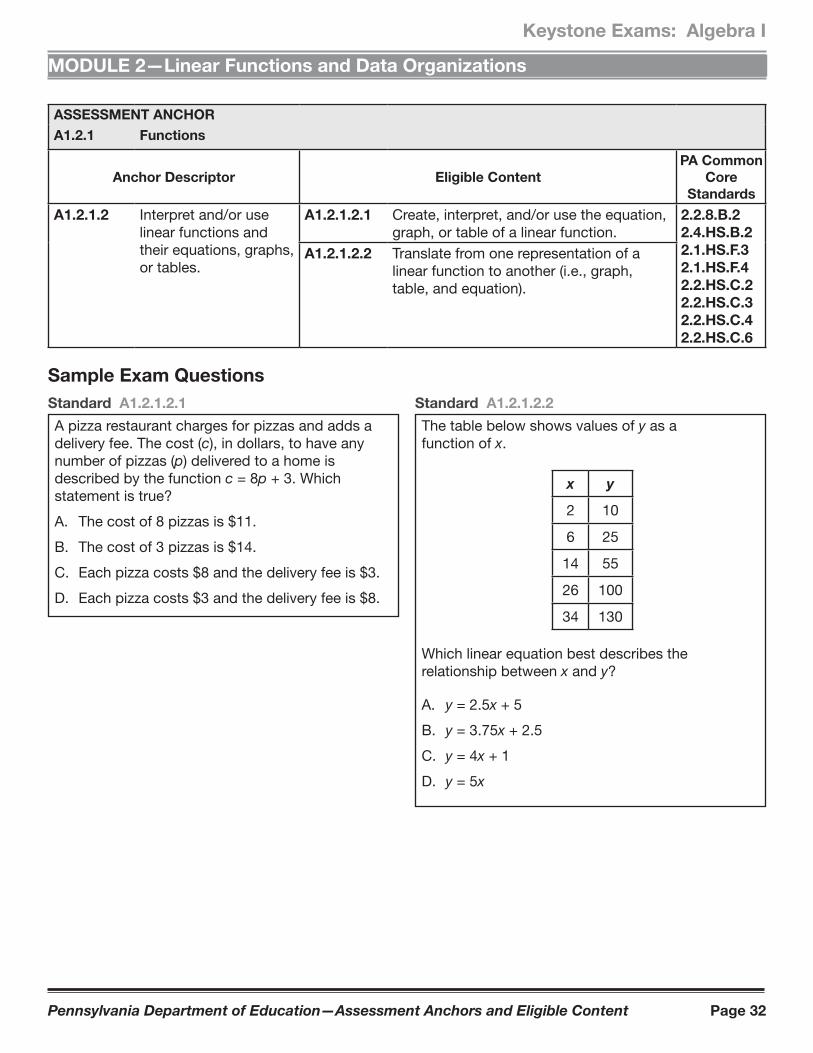
Sample Exam QuestionsStandard A1.2.1.2.1
A pizza restaurant charges for pizzas and adds a delivery fee. The cost (c), in dollars, to have any number of pizzas (p) delivered to a home is described by the function c = 8p + 3. Which statement is true?
A. The cost of 8 pizzas is $11.
B. The cost of 3 pizzas is $14.
C. Each pizza costs $8 and the delivery fee is $3.
D. Each pizza costs $3 and the delivery fee is $8.
Standard A1.2.1.2.2
The table below shows values of y as a function of x.
x y
2 10
6 25
14 55
26 100
34 130
Which linear equation best describes the relationship between x and y?
A. y = 2.5x + 5
B. y = 3.75x + 2.5
C. y = 4x + 1
D. y = 5x
Pennsylvania Department of Education—Assessment Anchors and Eligible Content Page 33
Keystone Exams: Algebra I
MODULE 2—Linear Functions and Data Organizations
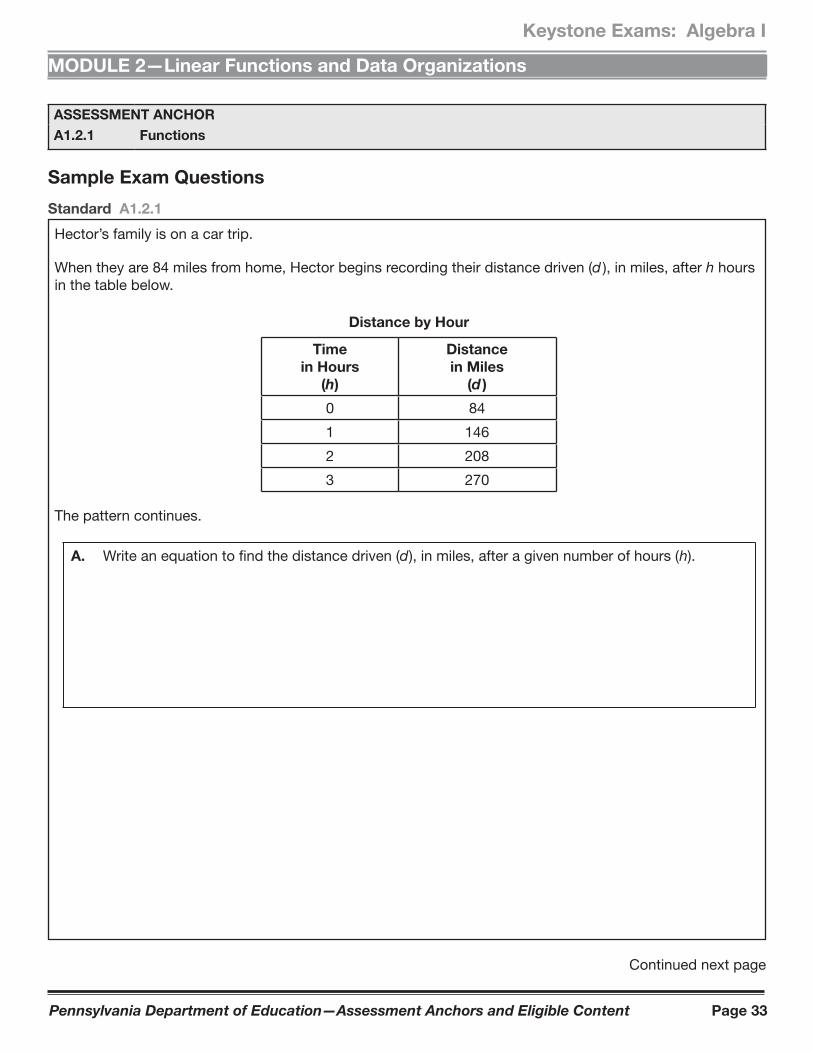
Standard A1.2.1
Hector’s family is on a car trip.
When they are 84 miles from home, Hector begins recording their distance driven (d ), in miles, after h hours in the table below.
Distance by Hour
Time in Hours
(h)
Distance in Miles
(d )
0 84
1 146
2 208
3 270
The pattern continues.
A. Write an equation to find the distance driven (d ), in miles, after a given number of hours ( h).
Continued next page
ASSESSMENT ANCHORA1.2.1 Functions
Sample Exam Questions
Pennsylvania Department of Education—Assessment Anchors and Eligible Content Page 34
Keystone Exams: Algebra I
MODULE 2—Linear Functions and Data Organizations
Continued. Please refer to the previous page for task explanation.
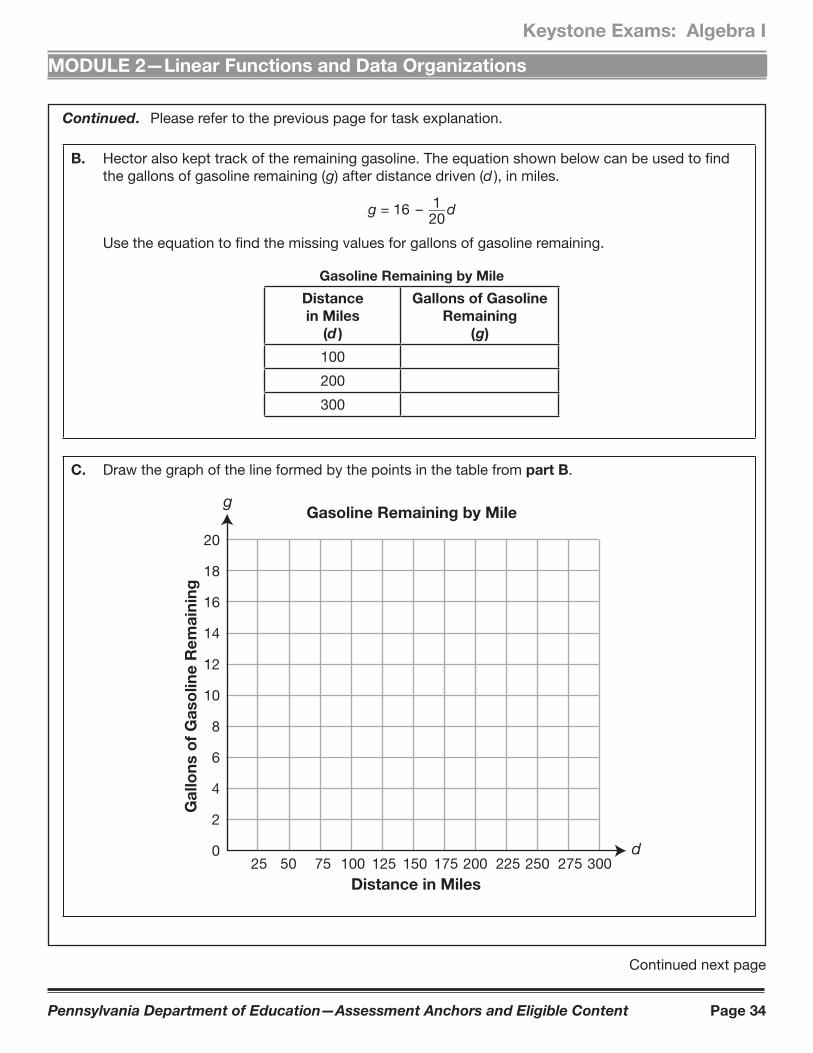
B. Hector also kept track of the remaining gasoline. The equation shown below can be used to find the gallons of gasoline remaining ( g) after distance driven (d ), in miles.
g = 16 – 1 } 20
d
Use the equation to find the missing values for gallons of gasoline remaining.
Gasoline Remaining by Mile
Distance in Miles
(d )
Gallons of Gasoline Remaining
( g)
100
200
300
C. Draw the graph of the line formed by the points in the table from part B.
g
d25 50 75 100 125 150 175 200 225 250 275 300
20
18
16
14
12
10
8
6
4
2
0
Gasoline Remaining by Mile
Gal
lons
of
Gas
olin
e R
emai
ning
Distance in Miles
Continued next page
Pennsylvania Department of Education—Assessment Anchors and Eligible Content Page 35
Keystone Exams: Algebra I
MODULE 2—Linear Functions and Data Organizations
Continued. Please refer to the previous page for task explanation.
D. Explain why the slope of the line drawn in part C must be negative.
Pennsylvania Department of Education—Assessment Anchors and Eligible Content Page 36
Keystone Exams: Algebra I
MODULE 2—Linear Functions and Data Organizations
Standard A1.2.1
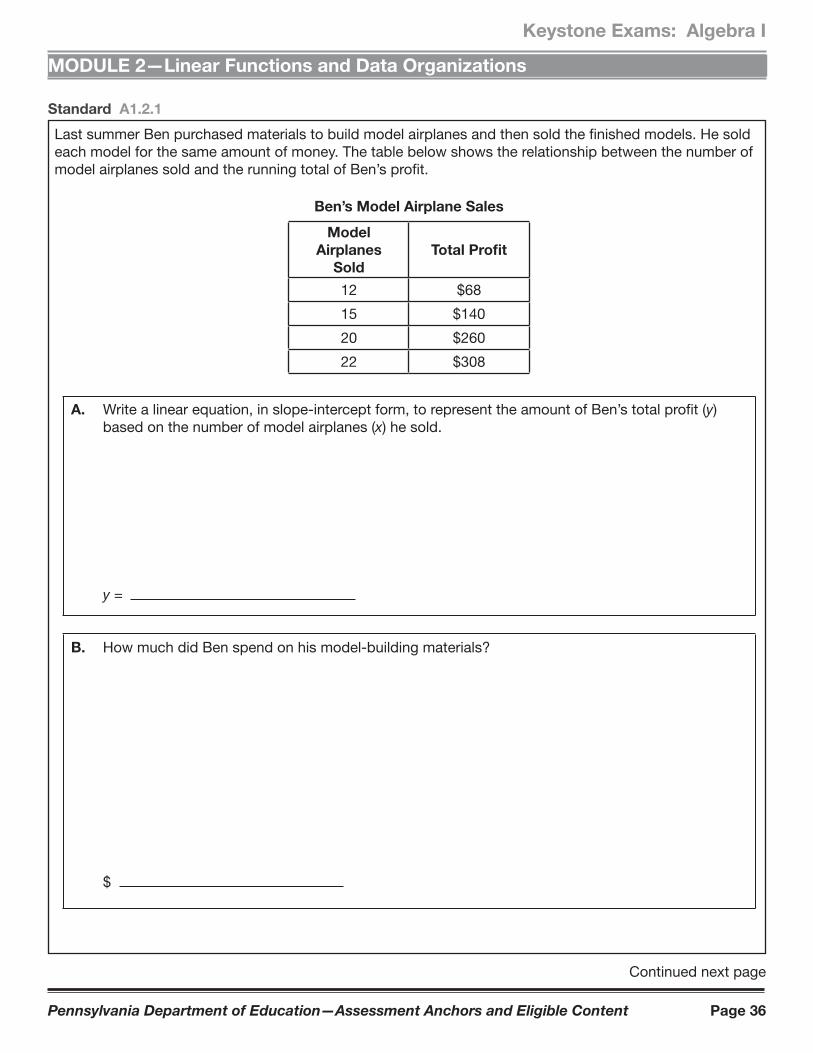
Last summer Ben purchased materials to build model airplanes and then sold the finished models. He sold each model for the same amount of money. The table below shows the relationship between the number of model airplanes sold and the running total of Ben’s profit.
Ben’s Model Airplane Sales
Model Airplanes
SoldTotal Profit
12 $68
15 $140
20 $260
22 $308
A. Write a linear equation, in slope-intercept form, to represent the amount of Ben’s total profit (y) based on the number of model airplanes (x) he sold.
y =
B. How much did Ben spend on his model-building materials?
$
Continued next page
Pennsylvania Department of Education—Assessment Anchors and Eligible Content Page 37
Keystone Exams: Algebra I
MODULE 2—Linear Functions and Data Organizations
Continued. Please refer to the previous page for task explanation.
C. What is the fewest number of model airplanes Ben needed to sell in order to make a profit?
fewest number:
D. What is a reasonable value in the range that would be a negative number?
range value:
Pennsylvania Department of Education—Assessment Anchors and Eligible Content Page 38
Keystone Exams: Algebra I
MODULE 2—Linear Functions and Data Organizations
ASSESSMENT ANCHORA1.2.2 Coordinate Geometry
Anchor Descriptor Eligible ContentPA Common
Core Standards
A1.2.2.1 Describe, compute, and/or use the rate of change (slope) of a line.
A1.2.2.1.1 Identify, describe, and/or use constant rates of change.
2.2.8.C.12.2.8.C.22.2.HS.C.12.2.HS.C.32.2.HS.C.5
A1.2.2.1.2 Apply the concept of linear rate of change (slope) to solve problems.
Sample Exam Questions Standard A1.2.2.1.1
Jeff’s restaurant sells hamburgers. The amount charged for a hamburger ( h) is based on the cost for a plain hamburger plus an additional charge for each topping (t ) as shown in the equation below.
h = 0.60t + 5
What does the number 0.60 represent in the equation?
A. the number of toppings
B. the cost of a plain hamburger
C. the additional cost for each topping
D. the cost of a hamburger with 1 topping
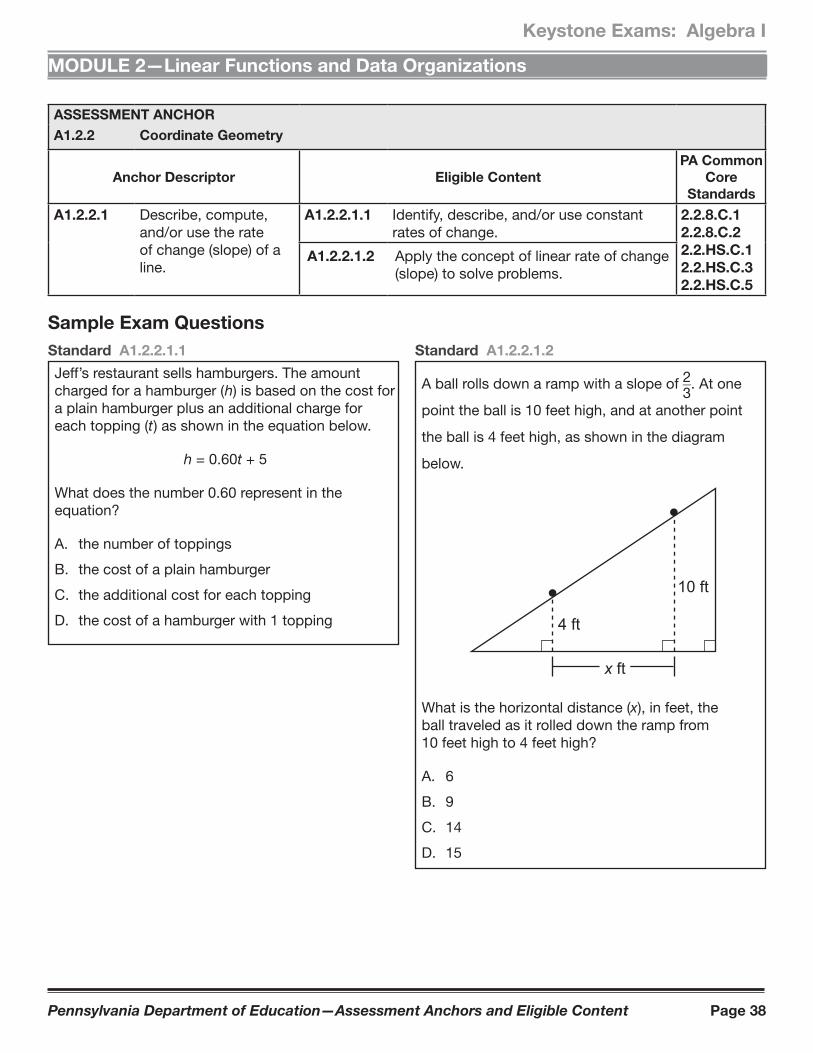
Standard A1.2.2.1.2
A ball rolls down a ramp with a slope of 2 } 3
. At one
point the ball is 10 feet high, and at another point
the ball is 4 feet high, as shown in the diagram
below.
x ft
4 ft
10 ft
What is the horizontal distance (x), in feet, the ball traveled as it rolled down the ramp from 10 feet high to 4 feet high?
A. 6
B. 9
C. 14
D. 15
Pennsylvania Department of Education—Assessment Anchors and Eligible Content Page 39
Keystone Exams: Algebra I
MODULE 2—Linear Functions and Data Organizations
ASSESSMENT ANCHORA1.2.2 Coordinate Geometry
Anchor Descriptor Eligible ContentPA Common
Core Standards
A1.2.2.1 Describe, compute, and/or use the rate of change (slope) of a line.
A1.2.2.1.3 Write or identify a linear equation when given • the graph of the line, • two points on the line, or • the slope and a point on the line.
Note: Linear equation may be in point-slope, standard, and/or slope-intercept form.
2.2.8.C.12.2.8.C.22.2.HS.C.12.2.HS.C.32.2.HS.C.5
A1.2.2.1.4 Determine the slope and/or y-intercept represented by a linear equation or graph.
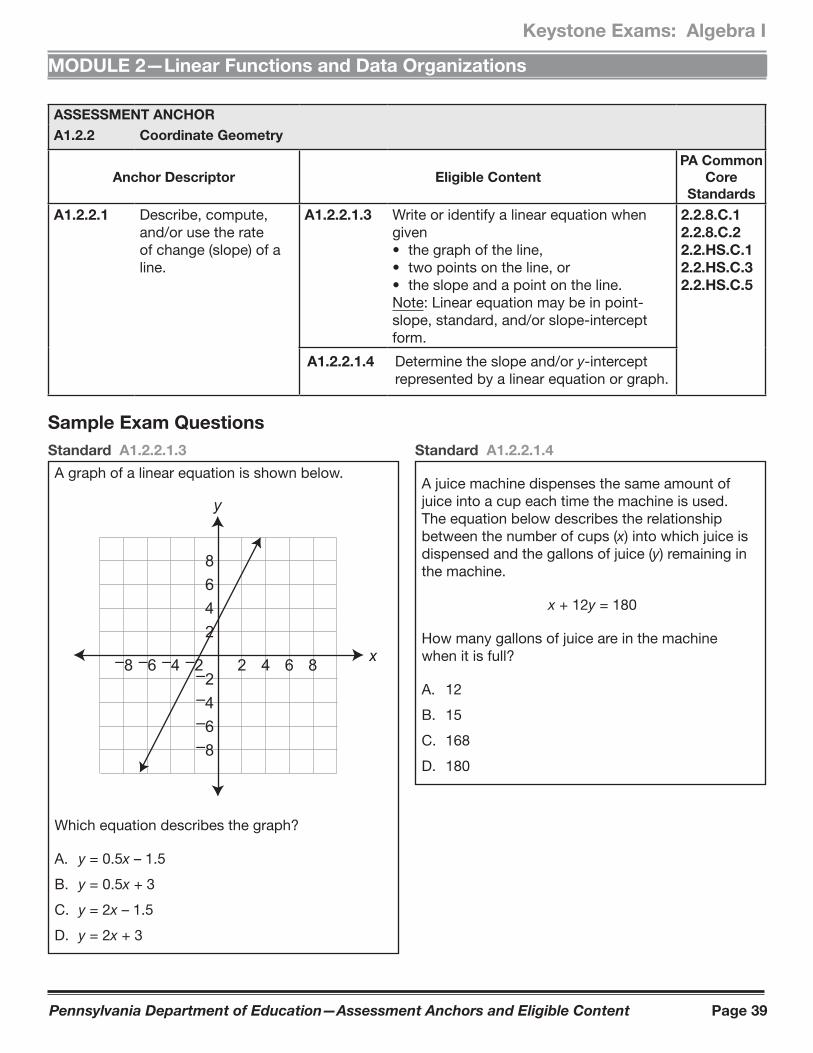
Sample Exam Questions Standard A1.2.2.1.3
A graph of a linear equation is shown below.
x
y
8642
–2–4–6–8
2 4 6 8–8 –6 –4 –2
Which equation describes the graph?
A. y = 0.5x – 1.5
B. y = 0.5x + 3
C. y = 2x – 1.5
D. y = 2x + 3
Standard A1.2.2.1.4
A juice machine dispenses the same amount of juice into a cup each time the machine is used. The equation below describes the relationship between the number of cups (x) into which juice is dispensed and the gallons of juice (y) remaining in the machine.
x + 12y = 180
How many gallons of juice are in the machine when it is full?
A. 12
B. 15
C. 168
D. 180
Pennsylvania Department of Education—Assessment Anchors and Eligible Content Page 40
Keystone Exams: Algebra I
MODULE 2—Linear Functions and Data Organizations
ASSESSMENT ANCHORA1.2.2 Coordinate Geometry
Anchor Descriptor Eligible ContentPA Common
Core Standards
A1.2.2.2 Analyze and/or interpret data on a scatter plot.
A1.2.2.2.1 Draw, identify, find, and/or write an equation for a line of best fit for a scatter plot.
2.4.HS.B.22.4.HS.B.32.2.HS.C.6
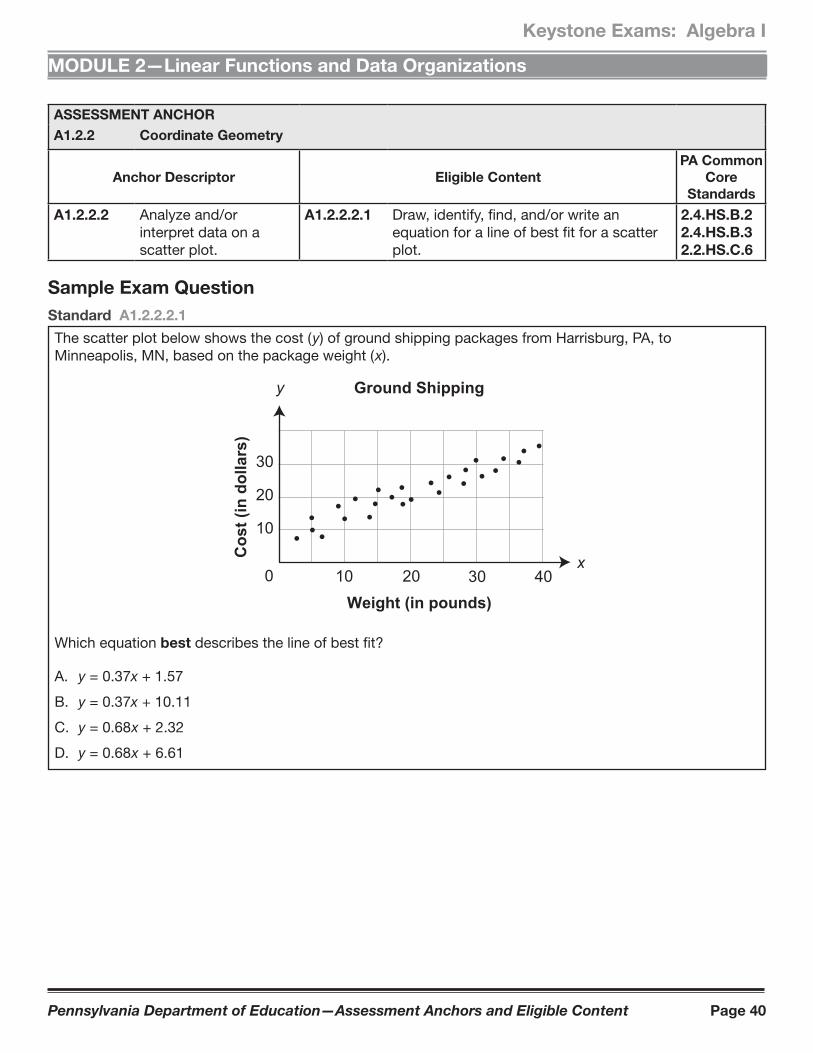
Sample Exam Question Standard A1.2.2.2.1
The scatter plot below shows the cost ( y) of ground shipping packages from Harrisburg, PA, to Minneapolis, MN, based on the package weight ( x).
x
y
Weight (in pounds)
Cos
t (in
dol
lars
)
10 20 30 40
Ground Shipping
0
30
20
10
Which equation best describes the line of best fit?
A. y = 0.37x + 1.57
B. y = 0.37x + 10.11
C. y = 0.68 x + 2.32
D. y = 0.68 x + 6.61
Pennsylvania Department of Education—Assessment Anchors and Eligible Content Page 41
Keystone Exams: Algebra I
MODULE 2—Linear Functions and Data Organizations
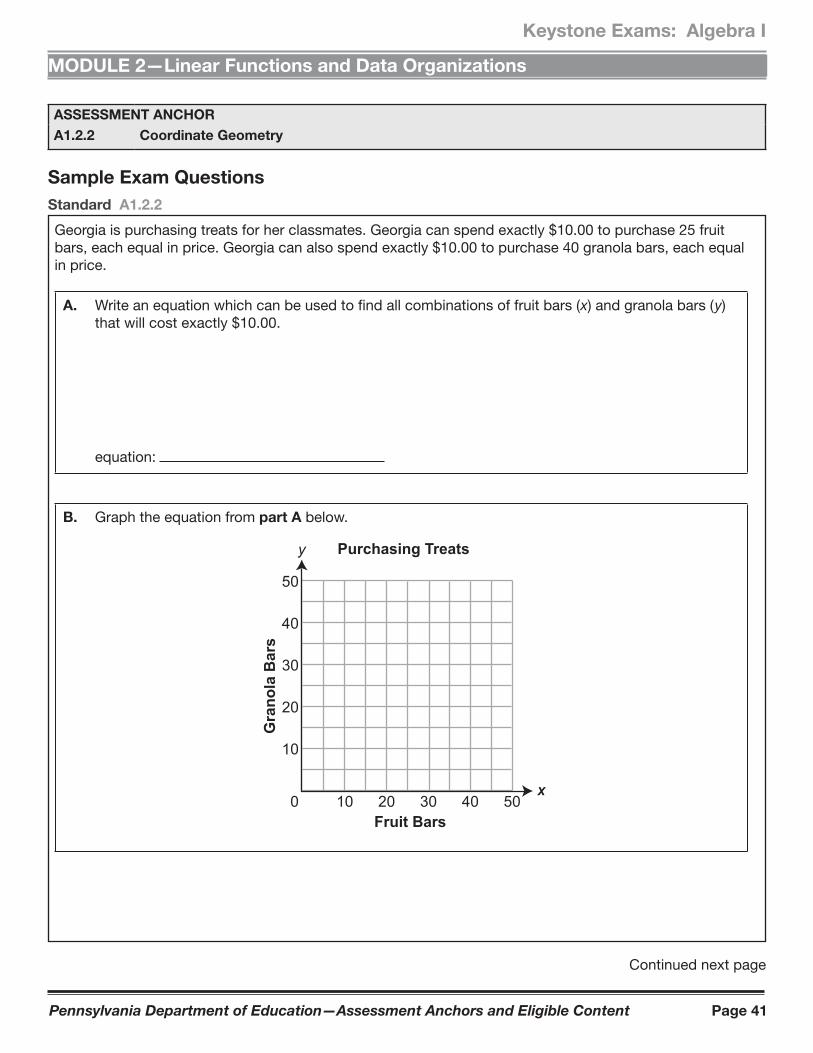
Standard A1.2.2
Georgia is purchasing treats for her classmates. Georgia can spend exactly $10.00 to purchase 25 fruit bars, each equal in price. Georgia can also spend exactly $10.00 to purchase 40 granola bars, each equal in price.
A. Write an equation which can be used to find all combinations of fruit bars ( x) and granola bars ( y) that will cost exactly $10.00.
equation:
B. Graph the equation from part A below.
Fruit Bars0
Gra
nola
Bar
s
50
40
30
20
10
10 20 30 40 50
Purchasing Treats
xx
y
Continued next page
ASSESSMENT ANCHORA1.2.2 Coordinate Geometry
Sample Exam Questions
Pennsylvania Department of Education—Assessment Anchors and Eligible Content Page 42
Keystone Exams: Algebra I
MODULE 2—Linear Functions and Data Organizations
Continued. Please refer to the previous page for task explanation.
C. What is the slope of the line graphed in part B?
slope:
D. Explain what the slope from part C means in the context of Georgia purchasing treats.
Pennsylvania Department of Education—Assessment Anchors and Eligible Content Page 43
Keystone Exams: Algebra I
MODULE 2—Linear Functions and Data Organizations
Standard A1.2.2
Ahava is traveling on a train.
The train is going at a constant speed of 80 miles per hour.
A. How many hours will it take for the train to travel 1,120 miles?
hours:
Ahava also considered taking an airplane. The airplane can travel the same 1,120 miles in 12 hours less time than the train.
B. What is the speed of the airplane in miles per hour (mph)?
speed of the airplaine: mph
Continued next page
Pennsylvania Department of Education—Assessment Anchors and Eligible Content Page 44
Keystone Exams: Algebra I
MODULE 2—Linear Functions and Data Organizations
Continued. Please refer to the previous page for task explanation.
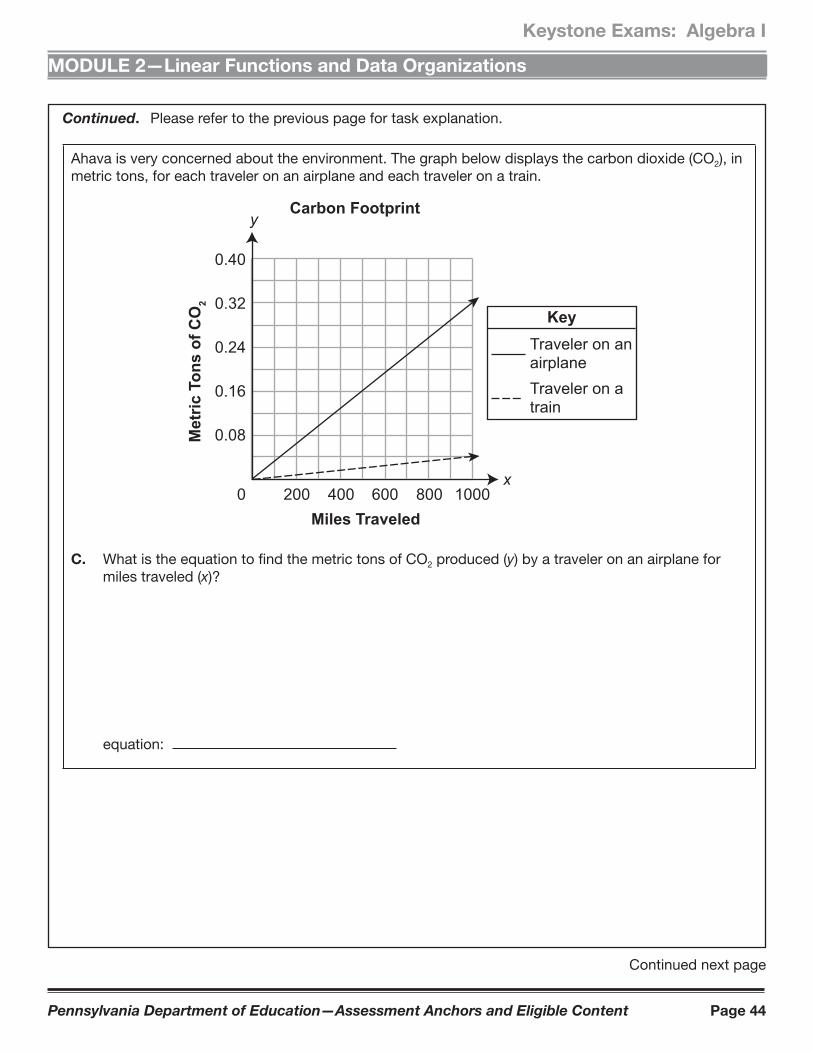
Ahava is very concerned about the environment. The graph below displays the carbon dioxide (CO2), in metric tons, for each traveler on an airplane and each traveler on a train.
0Miles Traveled
Met
ric T
ons
of C
O2
x
y
0.40
0.32
0.24
0.16
0.08
200 400 600 800 1000
Carbon Footprint
KeyTraveler on anairplaneTraveler on atrain
C. What is the equation to find the metric tons of CO2 produced (y) by a traveler on an airplane for miles traveled (x)?
equation:
Continued next page
Pennsylvania Department of Education—Assessment Anchors and Eligible Content Page 45
Keystone Exams: Algebra I
MODULE 2—Linear Functions and Data Organizations
Continued. Please refer to the previous page for task explanation.
On another trip, Ahava traveled to her destination on a train and returned home on an airplane. Her total carbon footprint for the trip was 0.42 metric tons of CO2 produced.
D. How far, in miles, is Ahava’s destination from her home?
miles:
Pennsylvania Department of Education—Assessment Anchors and Eligible Content Page 46
Keystone Exams: Algebra I
MODULE 2—Linear Functions and Data Organizations
ASSESSMENT ANCHORA1.2.3 Data Analysis
Anchor Descriptor Eligible ContentPA Common
Core Standards
A1.2.3.1 Use measures of dispersion to describe a set of data.
A1.2.3.1.1 Calculate and/or interpret the range, quartiles, and interquartile range of data.
2.4.HS.B.12.4.HS.B.3
Sample Exam Question Standard A1.2.3.1.1
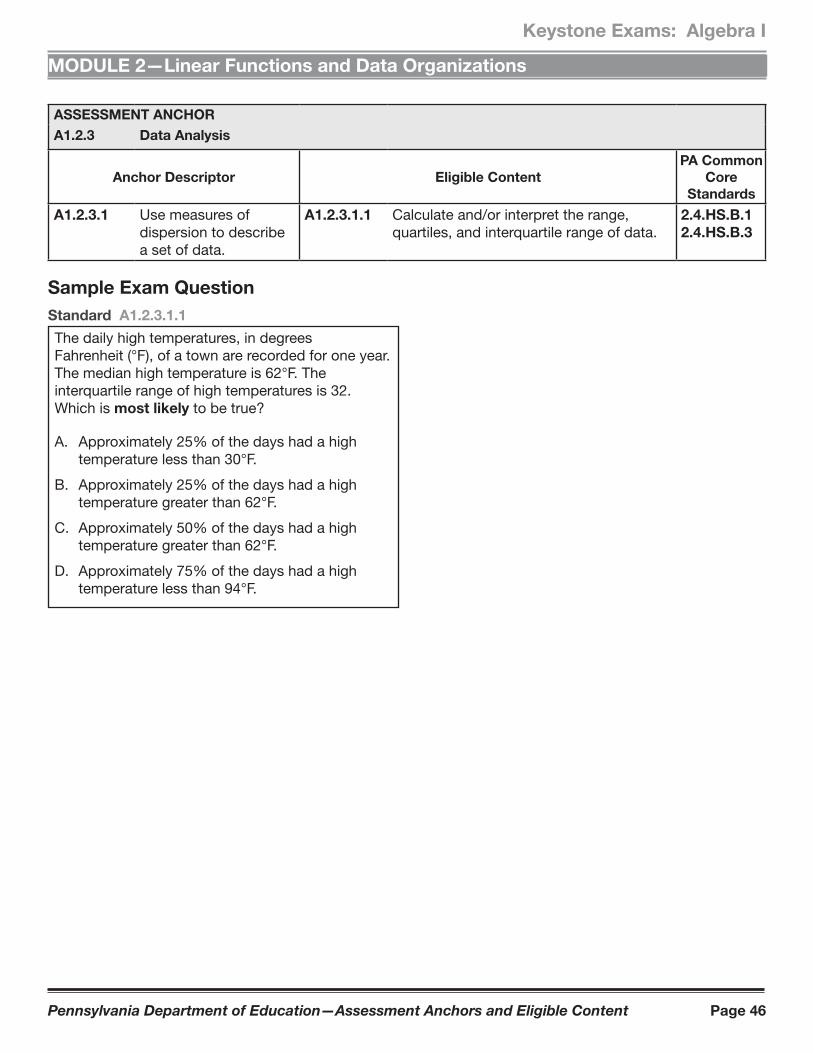
The daily high temperatures, in degrees Fahrenheit (°F), of a town are recorded for one year. The median high temperature is 62°F. The interquartile range of high temperatures is 32. Which is most likely to be true?
A. Approximately 25% of the days had a high temperature less than 30°F.
B. Approximately 25% of the days had a high temperature greater than 62°F.
C. Approximately 50% of the days had a high temperature greater than 62°F.
D. Approximately 75% of the days had a high temperature less than 94°F.
Pennsylvania Department of Education—Assessment Anchors and Eligible Content Page 47
Keystone Exams: Algebra I
MODULE 2—Linear Functions and Data Organizations
ASSESSMENT ANCHORA1.2.3 Data Analysis
Anchor Descriptor Eligible ContentPA Common
Core Standards
A1.2.3.2 Use data displays in problem-solving settings and/or to make predictions.
A1.2.3.2.1 Estimate or calculate to make predictions based on a circle, line, bar graph, measures of central tendency, or other representations.
2.4.HS.B.12.4.HS.B.32.4.HS.B.5
Sample Exam QuestionStandard A1.2.3.2.1
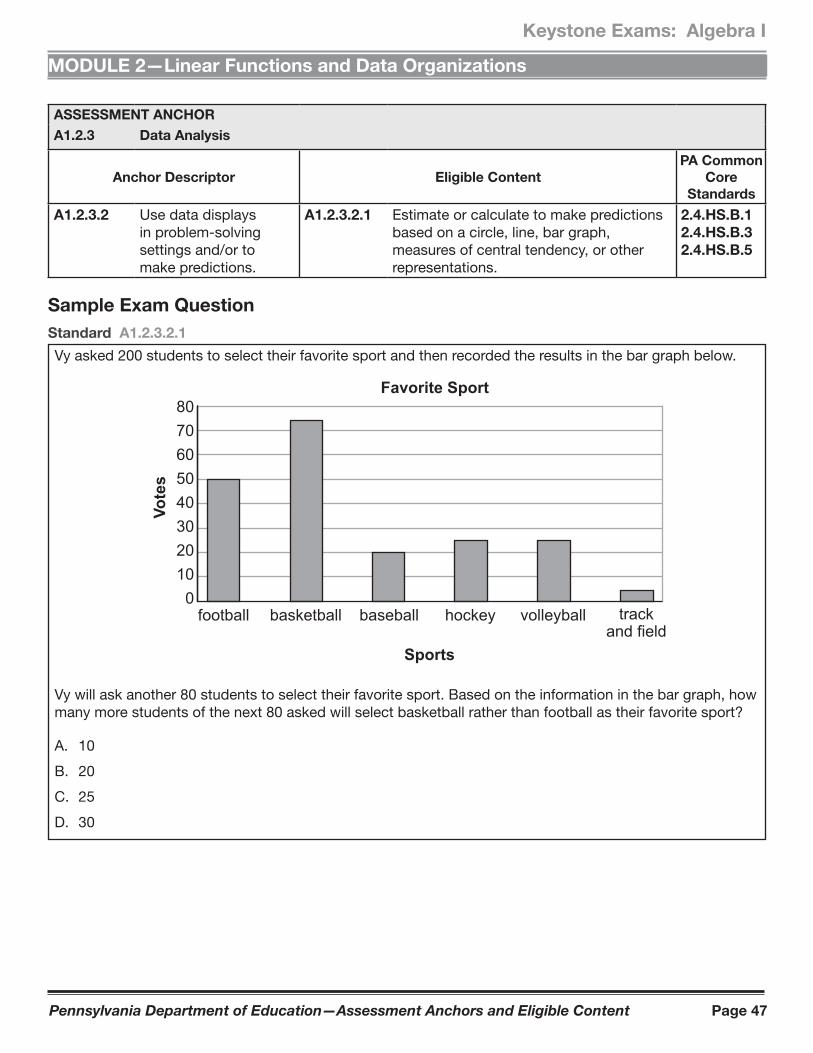
Vy asked 200 students to select their favorite sport and then recorded the results in the bar graph below.
Favorite Sport
Sports
Vote
s
80706050403020100
football basketball baseball hockey volleyball trackand field
Vy will ask another 80 students to select their favorite sport. Based on the information in the bar graph, how many more students of the next 80 asked will select basketball rather than football as their favorite sport?
A. 10
B. 20
C. 25
D. 30
Pennsylvania Department of Education—Assessment Anchors and Eligible Content Page 48
Keystone Exams: Algebra I
MODULE 2—Linear Functions and Data Organizations
ASSESSMENT ANCHORA1.2.3 Data Analysis
Anchor Descriptor Eligible ContentPA Common
Core Standards
A1.2.3.2 Use data displays in problem-solving settings and/or to make predictions.
A1.2.3.2.2 Analyze data, make predictions, and/or answer questions based on displayed data (box-and-whisker plots, stem-and-leaf plots, scatter plots, measures of central tendency, or other representations).
2.4.HS.B.12.4.HS.B.32.4.HS.B.5
Sample Exam QuestionStandard A1.2.3.2.2
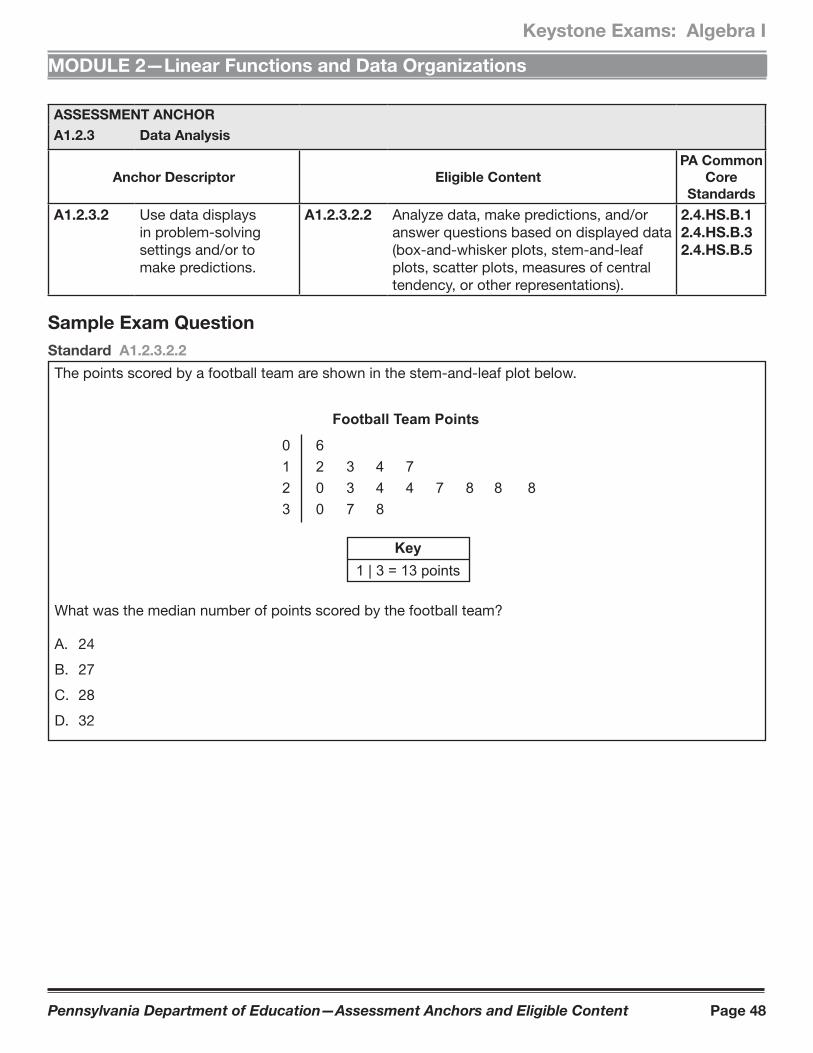
The points scored by a football team are shown in the stem-and-leaf plot below.
Football Team Points
0123
6 2 3 4 7 0 3 4 4 7 8 8 80 7 8
Key1 | 3 = 13 points
What was the median number of points scored by the football team?
A. 24
B. 27
C. 28
D. 32
Pennsylvania Department of Education—Assessment Anchors and Eligible Content Page 49
Keystone Exams: Algebra I
MODULE 2—Linear Functions and Data Organizations
ASSESSMENT ANCHORA1.2.3 Data Analysis
Anchor Descriptor Eligible ContentPA Common
Core Standards
A1.2.3.2 Use data displays in problem-solving settings and/or to make predictions.
A1.2.3.2.3 Make predictions using the equations or graphs of best-fit lines of scatter plots.
2.4.HS.B.12.4.HS.B.32.4.HS.B.5
Sample Exam QuestionStandard A1.2.3.2.3
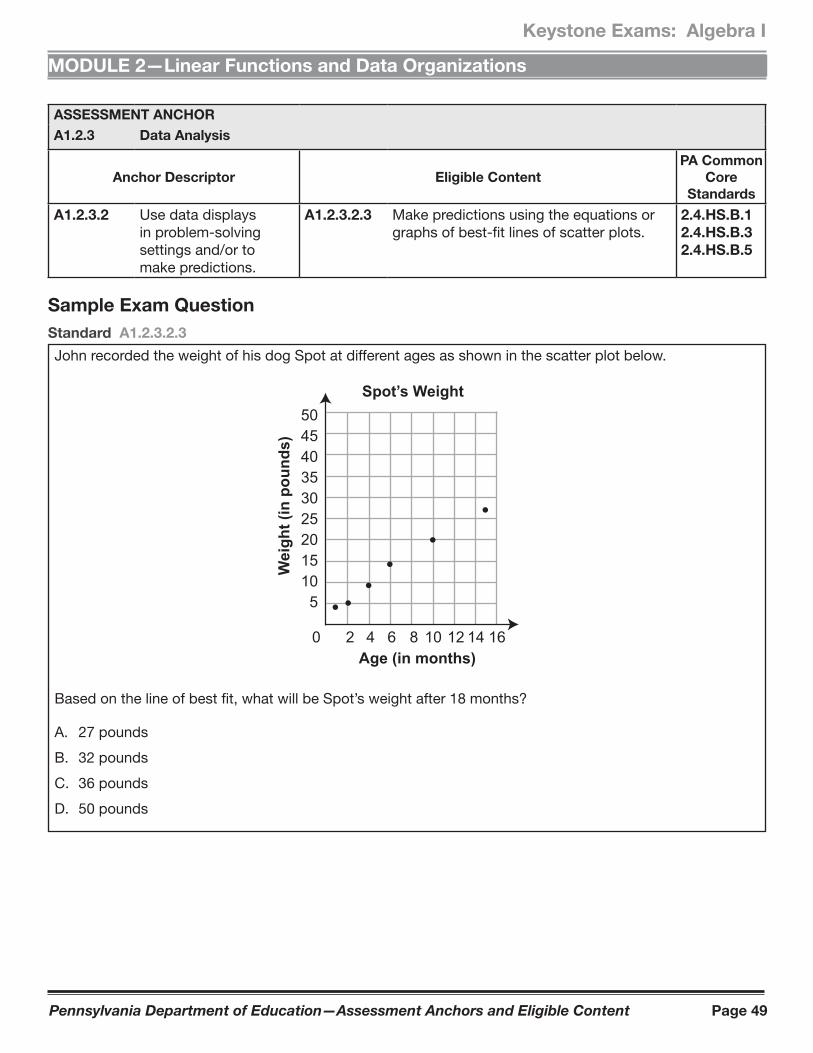
John recorded the weight of his dog Spot at different ages as shown in the scatter plot below.
Spot’s Weight
Age (in months)
Wei
ght (
in p
ound
s)
504540353025201510
5
20 4 6 8 1210 14 16
Based on the line of best fit, what will be Spot’s weight after 18 months?
A. 27 pounds
B. 32 pounds
C. 36 pounds
D. 50 pounds
Pennsylvania Department of Education—Assessment Anchors and Eligible Content Page 50
Keystone Exams: Algebra I
MODULE 2—Linear Functions and Data Organizations
ASSESSMENT ANCHORA1.2.3 Data Analysis
Anchor Descriptor Eligible ContentPA Common
Core Standards
A1.2.3.3 Apply probability to practical situations.
A1.2.3.3.1 Find probabilities for compound events (e.g., find probability of red and blue, find probability of red or blue) and represent as a fraction, decimal, or percent.
2.4.HS.B.42.4.HS.B.7
Sample Exam QuestionStandard A1.2.3.3.1
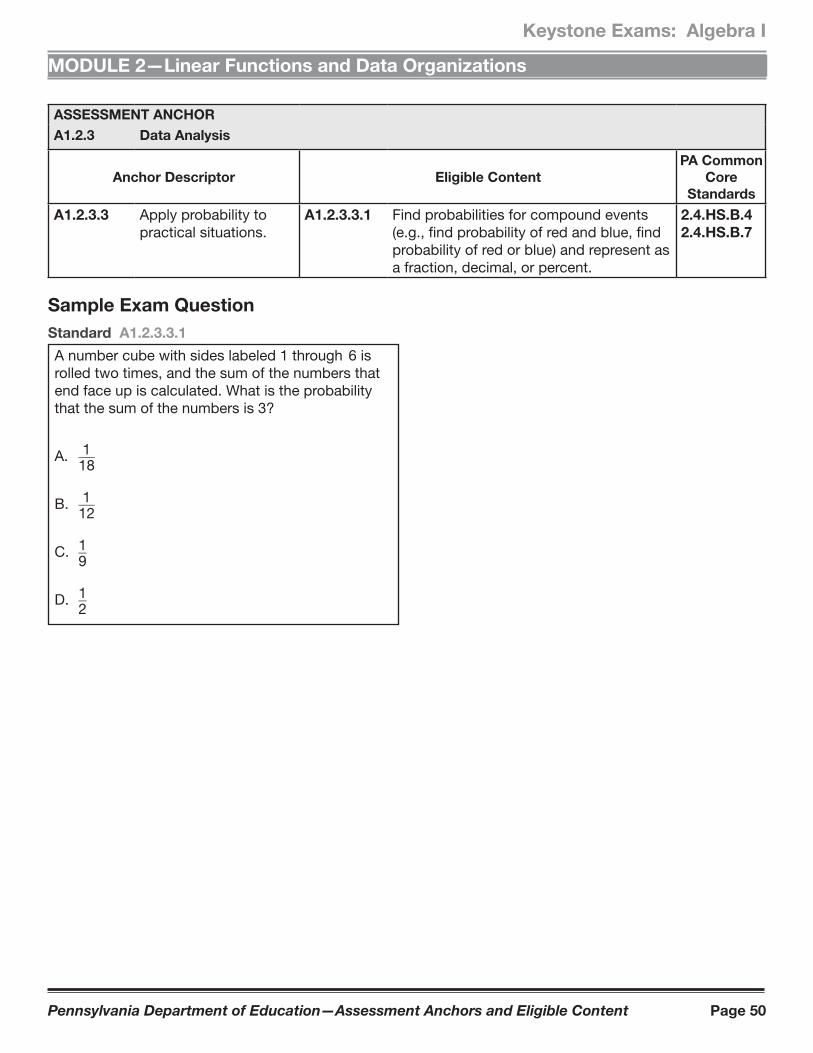
A number cube with sides labeled 1 through 6 is rolled two times, and the sum of the numbers that end face up is calculated. What is the probability that the sum of the numbers is 3?
A. 1 } 18
B. 1 } 12
C. 1 } 9
D. 1 } 2
Pennsylvania Department of Education—Assessment Anchors and Eligible Content Page 51
Keystone Exams: Algebra I
MODULE 2—Linear Functions and Data Organizations
Standard A1.2.3
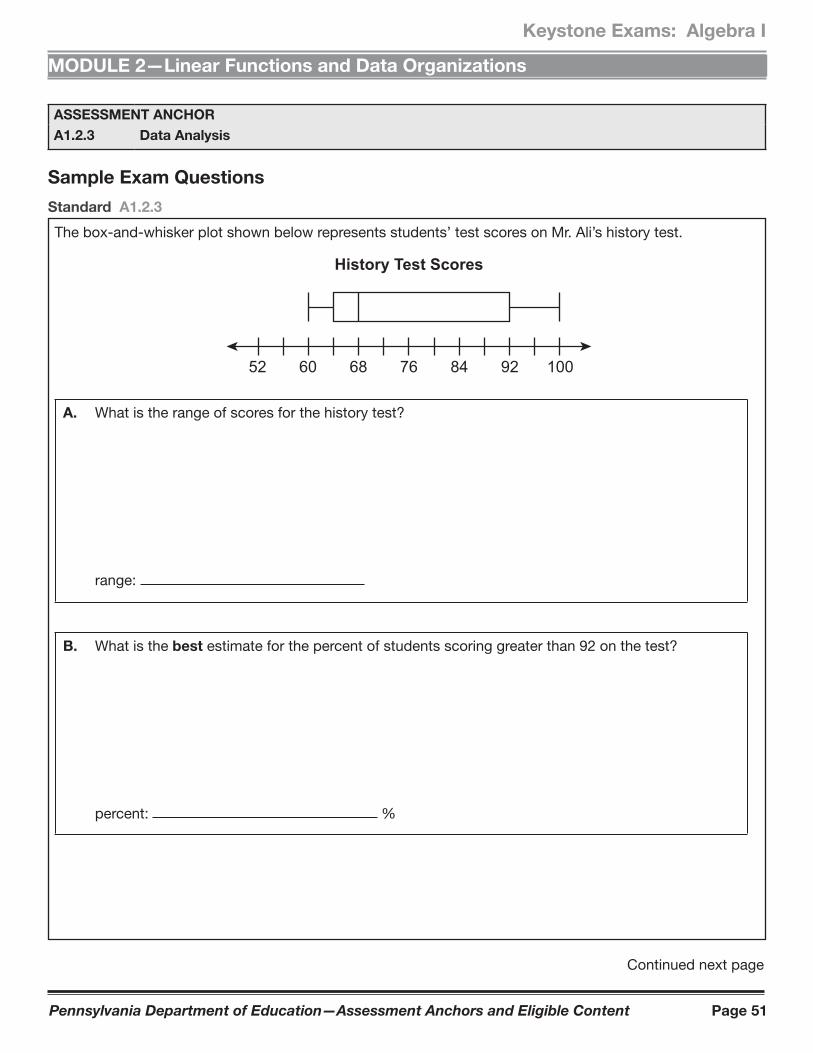
The box-and-whisker plot shown below represents students’ test scores on Mr. Ali’s history test.
52 60 68 76 84 92 100
History Test Scores
A. What is the range of scores for the history test?
range:
B. What is the best estimate for the percent of students scoring greater than 92 on the test?
percent: %
Continued next page
ASSESSMENT ANCHORA1.2.3 Data Analysis
Sample Exam Questions
Pennsylvania Department of Education—Assessment Anchors and Eligible Content Page 52
Keystone Exams: Algebra I
MODULE 2—Linear Functions and Data Organizations
Continued. Please refer to the previous page for task explanation.
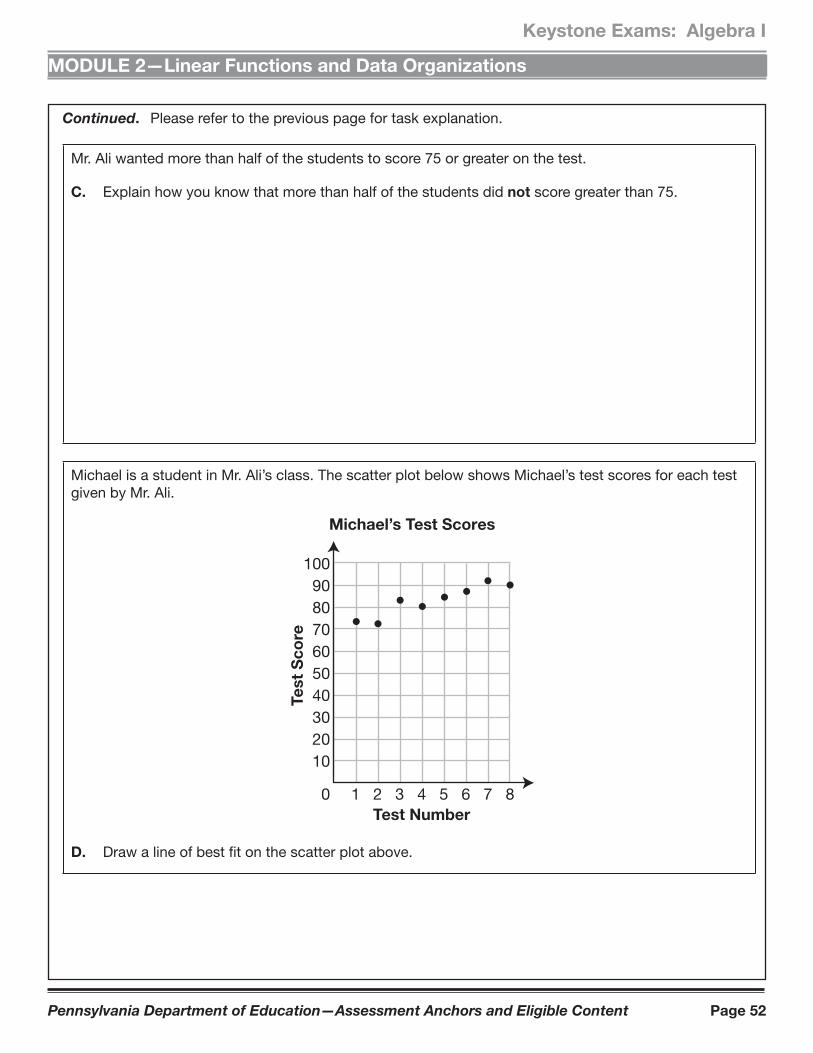
Mr. Ali wanted more than half of the students to score 75 or greater on the test.
C. Explain how you know that more than half of the students did not score greater than 75.
Michael is a student in Mr. Ali’s class. The scatter plot below shows Michael’s test scores for each test given by Mr. Ali.
0Test Number
Test
Sco
re
100908070605040302010
1 2 3 4 5 6 7 8
Michael’s Test Scores
D. Draw a line of best fit on the scatter plot above.
Pennsylvania Department of Education—Assessment Anchors and Eligible Content Page 53
Keystone Exams: Algebra I
MODULE 2—Linear Functions and Data Organizations
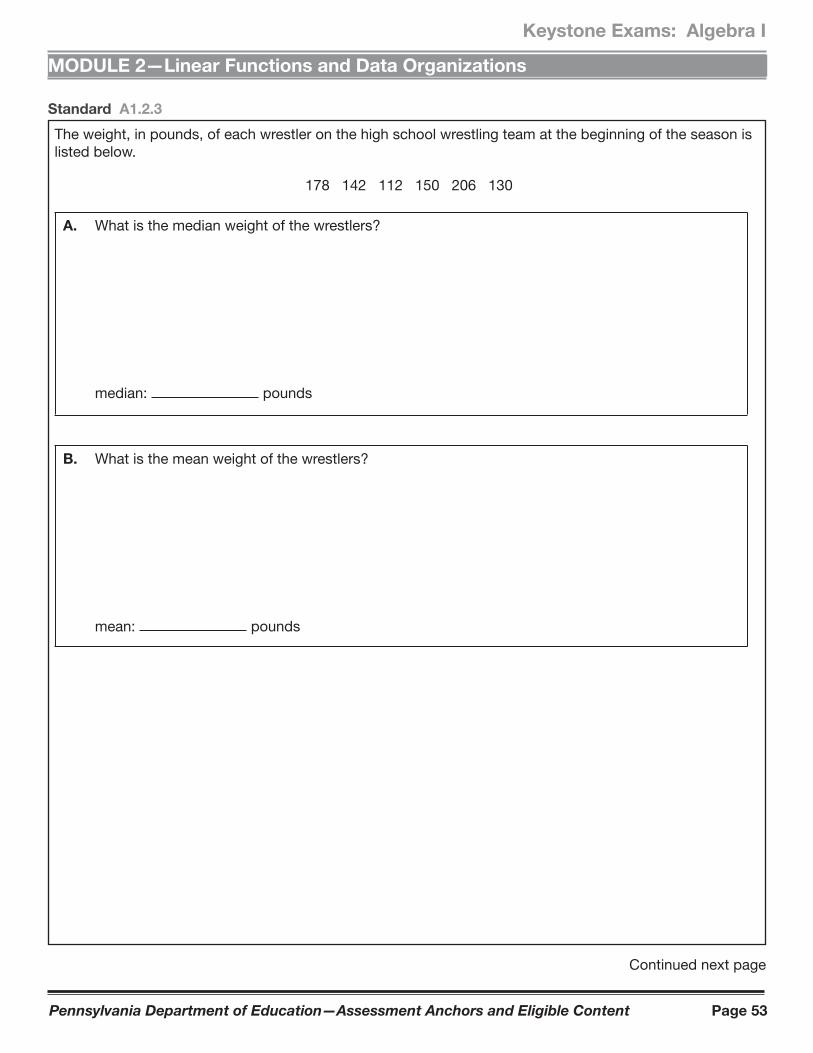
Standard A1.2.3
The weight, in pounds, of each wrestler on the high school wrestling team at the beginning of the season is listed below.
178 142 112 150 206 130
A. What is the median weight of the wrestlers?
median: pounds
B. What is the mean weight of the wrestlers?
mean: pounds
Continued next page
Pennsylvania Department of Education—Assessment Anchors and Eligible Content Page 54
Keystone Exams: Algebra I
MODULE 2—Linear Functions and Data Organizations
Continued. Please refer to the previous page for task explanation.
Two more wrestlers join the team during the season. The addition of these wrestlers has no effect on the mean weight of the wrestlers, but the median weight of the wrestlers increases 3 pounds.
C. Determine the weights of the two new wrestlers.
new wrestlers: pounds and pounds
Keystone Exams: Algebra Glossary to the
Assessment Anchor & Eligible Content
The Keystone Glossary includes terms and definitions associated with the Keystone Assessment Anchors and Eligible Content. The terms and definitions included in the glossary are intended to assist Pennsylvania educators in better understanding the Keystone Assessment Anchors and Eligible Content. The glossary does not define all possible terms included on an actual Keystone Exam, and it is not intended to define terms for use in classroom instruction for a particular grade level or course.
Pennsylvania Department of Education
www.education.state.pa.us April 2011
Keystone Exams: Algebra
Assessment Anchor & Eligible Content Glossary 2011
Pennsylvania Department of Education Page 2 April 2011
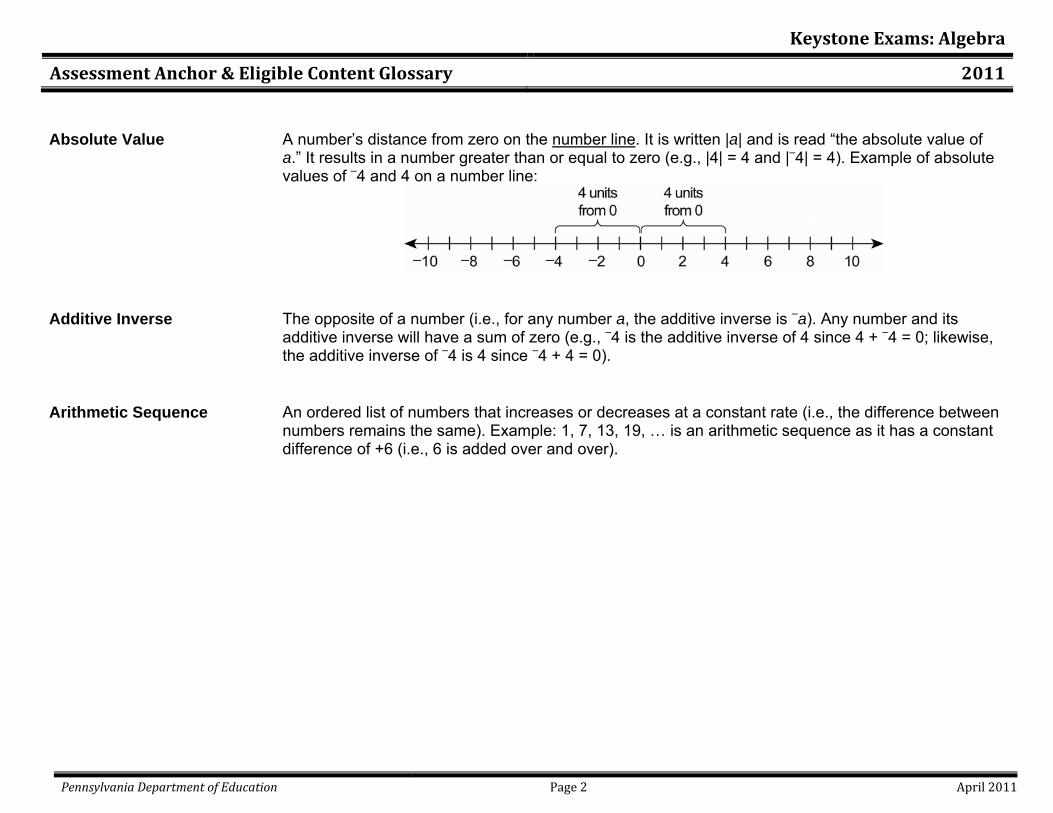
Absolute Value A number’s distance from zero on the number line. It is written |a| and is read “the absolute value of a.” It results in a number greater than or equal to zero (e.g., |4| = 4 and |–4| = 4). Example of absolute values of –4 and 4 on a number line:
Additive Inverse The opposite of a number (i.e., for any number a, the additive inverse is –a). Any number and its additive inverse will have a sum of zero (e.g., –4 is the additive inverse of 4 since 4 + –4 = 0; likewise, the additive inverse of –4 is 4 since –4 + 4 = 0).
Arithmetic Sequence An ordered list of numbers that increases or decreases at a constant rate (i.e., the difference between numbers remains the same). Example: 1, 7, 13, 19, … is an arithmetic sequence as it has a constant difference of +6 (i.e., 6 is added over and over).
Keystone Exams: Algebra
Assessment Anchor & Eligible Content Glossary 2011
Pennsylvania Department of Education Page 3 April 2011
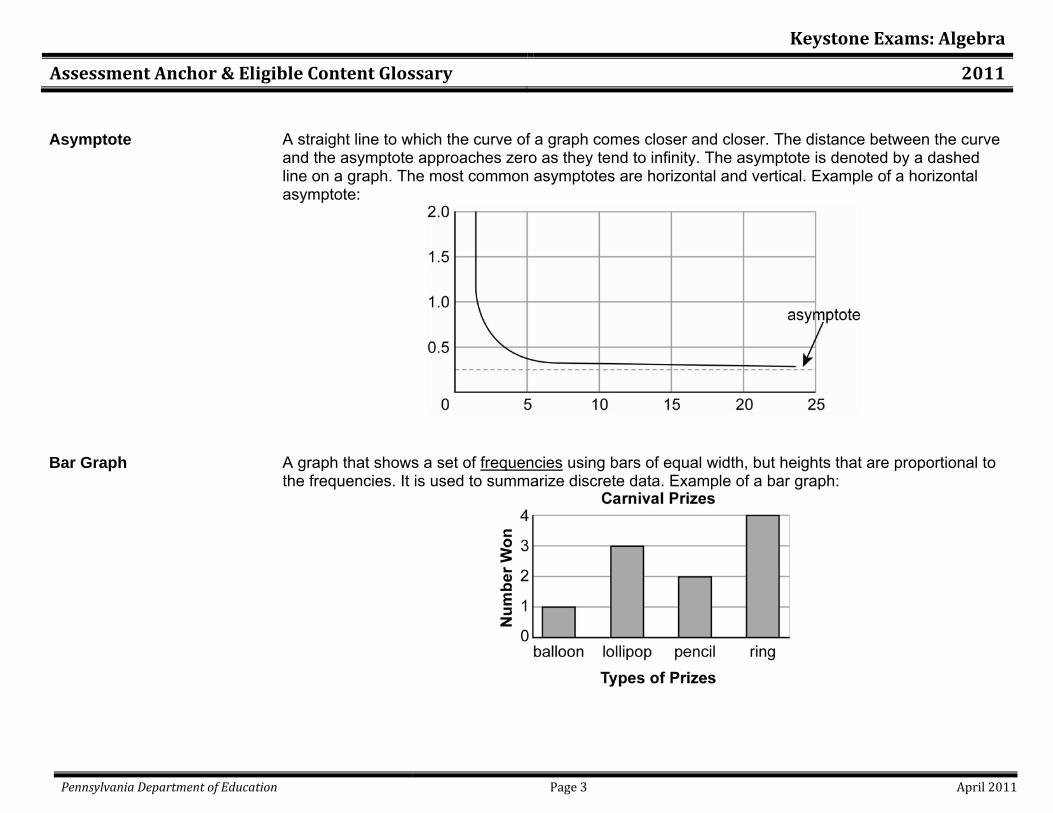
Asymptote A straight line to which the curve of a graph comes closer and closer. The distance between the curve and the asymptote approaches zero as they tend to infinity. The asymptote is denoted by a dashed line on a graph. The most common asymptotes are horizontal and vertical. Example of a horizontal asymptote:
Bar Graph A graph that shows a set of frequencies using bars of equal width, but heights that are proportional to the frequencies. It is used to summarize discrete data. Example of a bar graph:
Keystone Exams: Algebra
Assessment Anchor & Eligible Content Glossary 2011
Pennsylvania Department of Education Page 4 April 2011
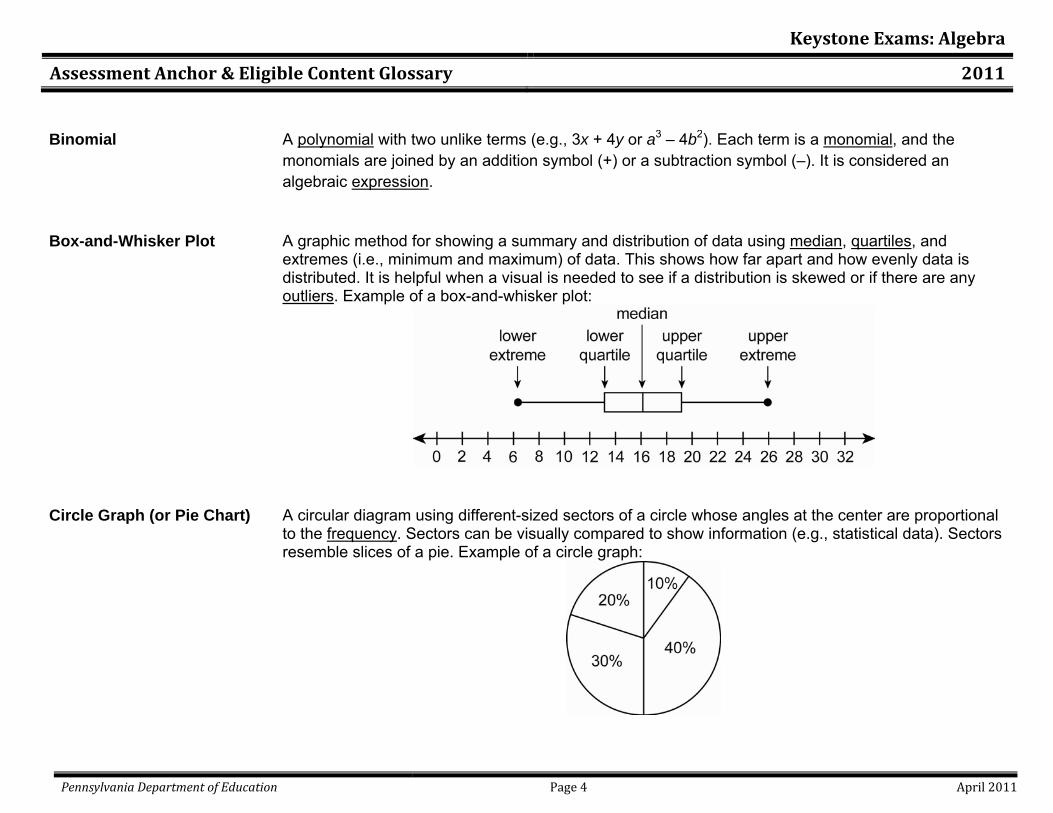
Binomial A polynomial with two unlike terms (e.g., 3x + 4y or a3 – 4b2). Each term is a monomial, and the monomials are joined by an addition symbol (+) or a subtraction symbol (–). It is considered an algebraic expression.
Box-and-Whisker Plot A graphic method for showing a summary and distribution of data using median, quartiles, and extremes (i.e., minimum and maximum) of data. This shows how far apart and how evenly data is distributed. It is helpful when a visual is needed to see if a distribution is skewed or if there are any outliers. Example of a box-and-whisker plot:
Circle Graph (or Pie Chart) A circular diagram using different-sized sectors of a circle whose angles at the center are proportional to the frequency. Sectors can be visually compared to show information (e.g., statistical data). Sectors resemble slices of a pie. Example of a circle graph:
Keystone Exams: Algebra
Assessment Anchor & Eligible Content Glossary 2011
Pennsylvania Department of Education Page 5 April 2011
Coefficient The number, usually a constant, that is multiplied by a variable in a term (e.g., 35 is the coefficient of 35x2y); the absence of a coefficient is the same as a 1 being present (e.g., x is the same as 1x).
Combination An unordered arrangement, listing or selection of objects (e.g., two-letter combinations of the three letters X, Y, and Z would be XY, XZ, and YZ; XY is the same as YX and is not counted as a different combination). A combination is similar to, but not the same as, a permutation.
Common Logarithm A logarithm with base 10. It is written log x. The common logarithm is the power of 10 necessary to equal a given number (i.e., log x = y is equivalent to 10y = x).
Complex Number The sum or difference of a real number and an imaginary number. It is written in the form a + bi,
where a and b are real numbers and i is the imaginary unit (i.e., i = 1− ). The a is called the real part,
and the bi is called the imaginary part.
Composite Number Any natural number with more than two factors (e.g., 6 is a composite number since it has four factors: 1, 2, 3, and 6). A composite number is not a prime number.
Compound (or Combined) Event
An event that is made up of two or more simple events, such as the flipping of two or more coins.
Compound Inequality When two or more inequalities are taken together and written with the inequalities connected by the words and or or (e.g., x > 6 and x < 12, which can also be written as 6 < x < 12).
Keystone Exams: Algebra
Assessment Anchor & Eligible Content Glossary 2011
Pennsylvania Department of Education Page 6 April 2011
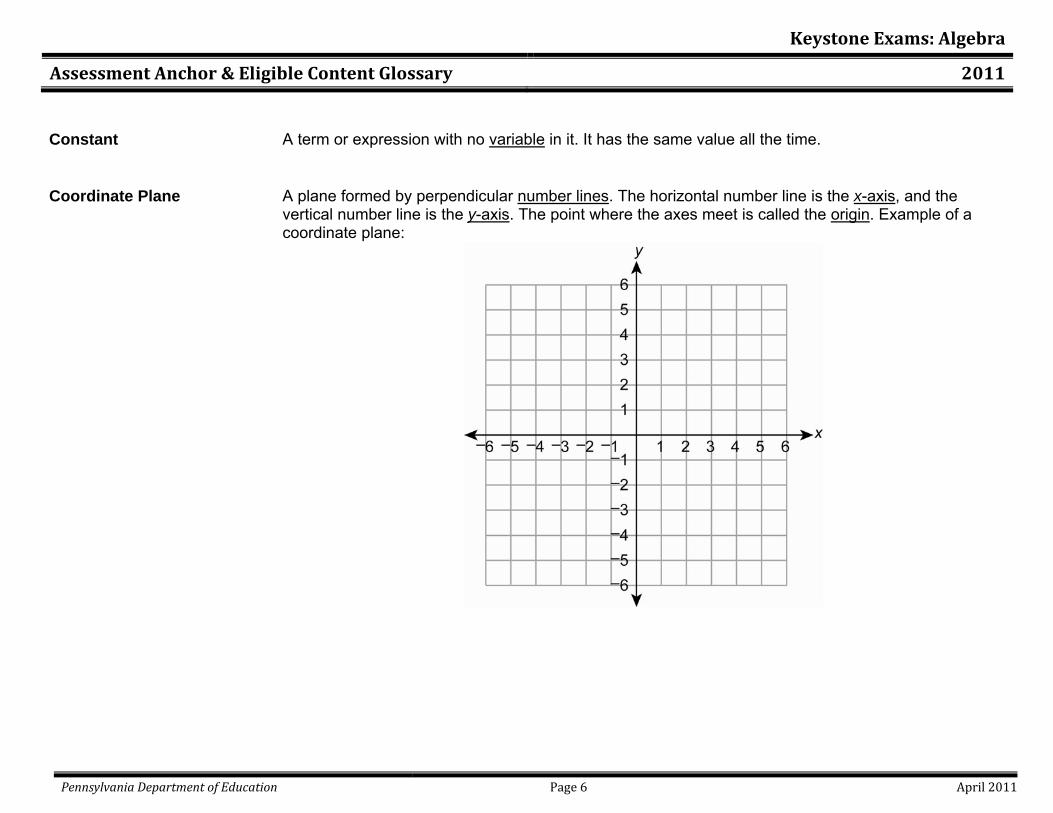
Constant A term or expression with no variable in it. It has the same value all the time.
Coordinate Plane A plane formed by perpendicular number lines. The horizontal number line is the x-axis, and the vertical number line is the y-axis. The point where the axes meet is called the origin. Example of a coordinate plane:
Keystone Exams: Algebra
Assessment Anchor & Eligible Content Glossary 2011
Pennsylvania Department of Education Page 7 April 2011
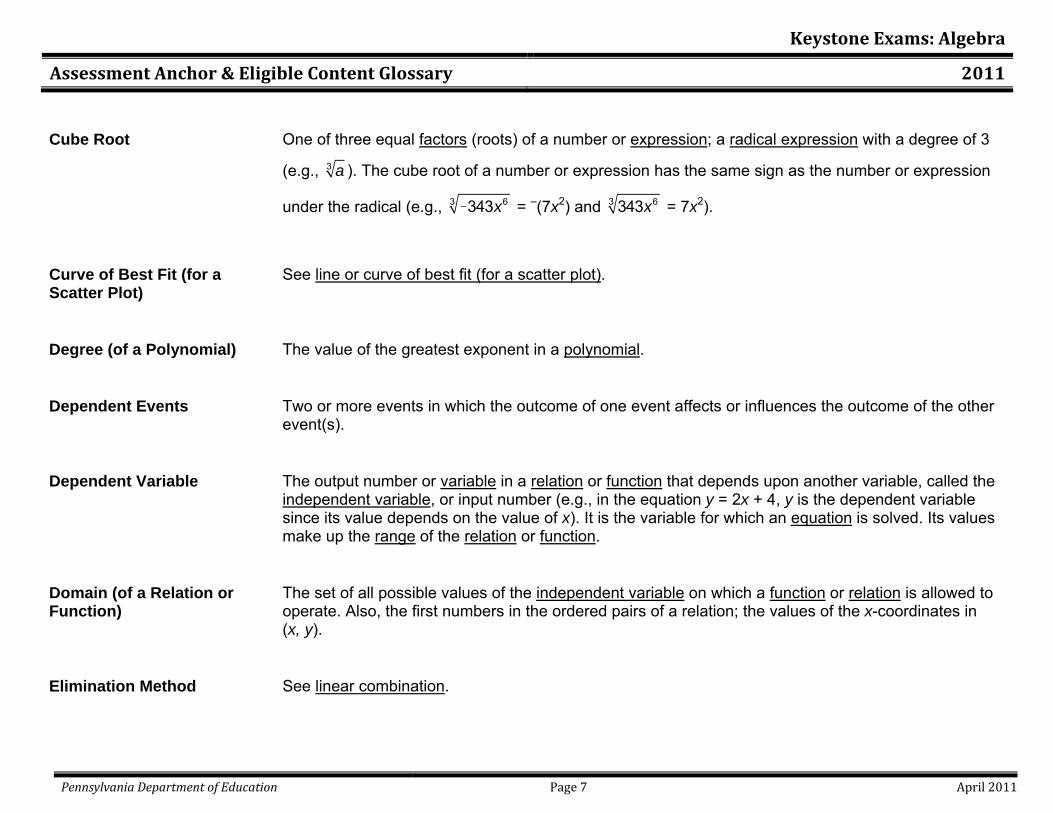
Cube Root One of three equal factors (roots) of a number or expression; a radical expression with a degree of 3
(e.g., 3 a ). The cube root of a number or expression has the same sign as the number or expression
under the radical (e.g., 3 _ 6343x = –(7x2) and 3 6343x = 7x2).
Curve of Best Fit (for a Scatter Plot)
See line or curve of best fit (for a scatter plot).
Degree (of a Polynomial) The value of the greatest exponent in a polynomial.
Dependent Events Two or more events in which the outcome of one event affects or influences the outcome of the other event(s).
Dependent Variable The output number or variable in a relation or function that depends upon another variable, called the independent variable, or input number (e.g., in the equation y = 2x + 4, y is the dependent variable since its value depends on the value of x). It is the variable for which an equation is solved. Its values make up the range of the relation or function.
Domain (of a Relation or Function)
The set of all possible values of the independent variable on which a function or relation is allowed to operate. Also, the first numbers in the ordered pairs of a relation; the values of the x-coordinates in (x, y).
Elimination Method See linear combination.
Keystone Exams: Algebra
Assessment Anchor & Eligible Content Glossary 2011
Pennsylvania Department of Education Page 8 April 2011
Equation A mathematical statement or sentence that says one mathematical expression or quantity is equal to another (e.g., x + 5 = y – 7). An equation will always contain an equal sign (=).
Estimation Strategy An approximation based on a judgment; may include determining approximate values, establishing the reasonableness of answers, assessing the amount of error resulting from estimation, and/or determining if an error is within acceptable limits.
Exponent The power to which a number or expression is raised. When the exponent is a fraction, the number or
expression can be rewritten with a radical sign (e.g., x3/4 = 4 3x ). See also positive exponent and
negative exponent.
Exponential Equation An equation with variables in its exponents (e.g., 4x = 50). It can be solved by taking logarithms of both sides.
Exponential Expression An expression in which the variable occurs in the exponent (such as 4x rather than x4). Often it occurs when a quantity changes by the same factor for each unit of time (e.g., “doubles every year” or “decreases 2% each month”).
Exponential Function (or Model)
A function whose general equation is y = a • bx where a and b are constants.
Exponential Growth/Decay A situation where a quantity increases or decreases exponentially by the same factor over time; it is used for such phenomena as inflation, population growth, radioactivity or depreciation.
Keystone Exams: Algebra
Assessment Anchor & Eligible Content Glossary 2011
Pennsylvania Department of Education Page 9 April 2011
Expression A mathematical phrase that includes operations, numbers, and/or variables (e.g., 2x + 3y is an algebraic expression, 13.4 – 4.7 is a numeric expression). An expression does not contain an equal sign (=) or any type of inequality sign.
Factor (noun) The number or expression that is multiplied by another to get a product (e.g., 6 is a factor of 30, and 6x is a factor of 42x2).
Factor (verb) To express or write a number, monomial, or polynomial as a product of two or more factors.
Factor a Monomial To express a monomial as the product of two or more monomials.
Factor a Polynomial To express a polynomial as the product of monomials and/or polynomials (e.g., factoring the polynomial x2 + x – 12 results in the product (x – 3)(x + 4)).
Frequency How often something occurs (i.e., the number of times an item, number, or event happens in a set of data).
Function A relation in which each value of an independent variable is associated with a unique value of a dependent variable (e.g., one element of the domain is paired with one and only one element of the range). It is a mapping which involves either a one-to-one correspondence or a many-to-one correspondence, but not a one-to-many correspondence.
Keystone Exams: Algebra
Assessment Anchor & Eligible Content Glossary 2011
Pennsylvania Department of Education Page 10 April 2011
Fundamental Counting Principle
A way to calculate all of the possible combinations of a given number of events. It states that if there are x different ways of doing one thing and y different ways of doing another thing, then there are xy different ways of doing both things. It uses the multiplication rule.
Geometric Sequence An ordered list of numbers that has the same ratio between consecutive terms (e.g., 1, 7, 49, 343, … is a geometric sequence that has a ratio of 7/1 between consecutive terms; each term after the first term can be found by multiplying the previous term by a constant, in this case the number 7 or 7/1).
Greatest Common Factor (GCF)
The largest factor that two or more numbers or algebraic terms have in common. In some cases the GCF may be 1 or one of the actual numbers (e.g., the GCF of 18x3 and 24x5 is 6x3).
Imaginary Number The square root of a negative number, or the opposite of the square root of a negative number. It is
written in the form bi, where b is a real number and i is the imaginary root (i.e., i = 1− or i2 = –1).
Independent Event(s) Two or more events in which the outcome of one event does not affect the outcome of the other event(s) (e.g., tossing a coin and rolling a number cube are independent events). The probability of two independent events (A and B) occurring is written P(A and B) or P(A I B) and equals P(A) • P(B) (i.e., the product of the probabilities of the two individual events).
Independent Variable The input number or variable in a relation or function whose value is subject to choice. It is not dependent upon any other values. It is usually the x-value or the x in f(x). It is graphed on the x-axis. Its values make up the domain of the relation or function.
Keystone Exams: Algebra
Assessment Anchor & Eligible Content Glossary 2011
Pennsylvania Department of Education Page 11 April 2011
Inequality A mathematical sentence that contains an inequality symbol (i.e., >, <, ≥, ≤, or ≠). It compares two quantities. The symbol > means greater than, the symbol < means less than, the symbol ≥ means greater than or equal to, the symbol ≤ means less than or equal to, and the symbol ≠ means not equal to.
Integer A natural number, the additive inverse of a natural number, or zero. Any number from the set of numbers represented by {…, –3, –2, –1, 0, 1, 2, 3, …}.
Interquartile Range (of Data) The difference between the first (lower) and third (upper) quartile. It represents the spread of the middle 50% of a set of data.
Inverse (of a Relation) A relation in which the coordinates in each ordered pair are switched from a given relation. The point (x, y) becomes (y, x), so (3, 8) would become (8, 3).
Irrational Number A real number that cannot be written as a simple fraction (i.e., the ratio of two integers). It is a non-terminating (infinite) and non-repeating decimal. The square root of any prime number is irrational, as are π and e.
Least (or Lowest) Common Multiple (LCM)
The smallest number or expression that is a common multiple of two or more numbers or algebraic terms, other than zero.
Like Terms Monomials that contain the same variables and corresponding powers and/or roots. Only the coefficients can be different (e.g., 4x3 and 12x3). Like terms can be added or subtracted.
Keystone Exams: Algebra
Assessment Anchor & Eligible Content Glossary 2011
Pennsylvania Department of Education Page 12 April 2011
Line Graph A graph that uses a line or line segments to connect data points, plotted on a coordinate plane, usually to show trends or changes in data over time. More broadly, a graph to represent the relationship between two continuous variables.
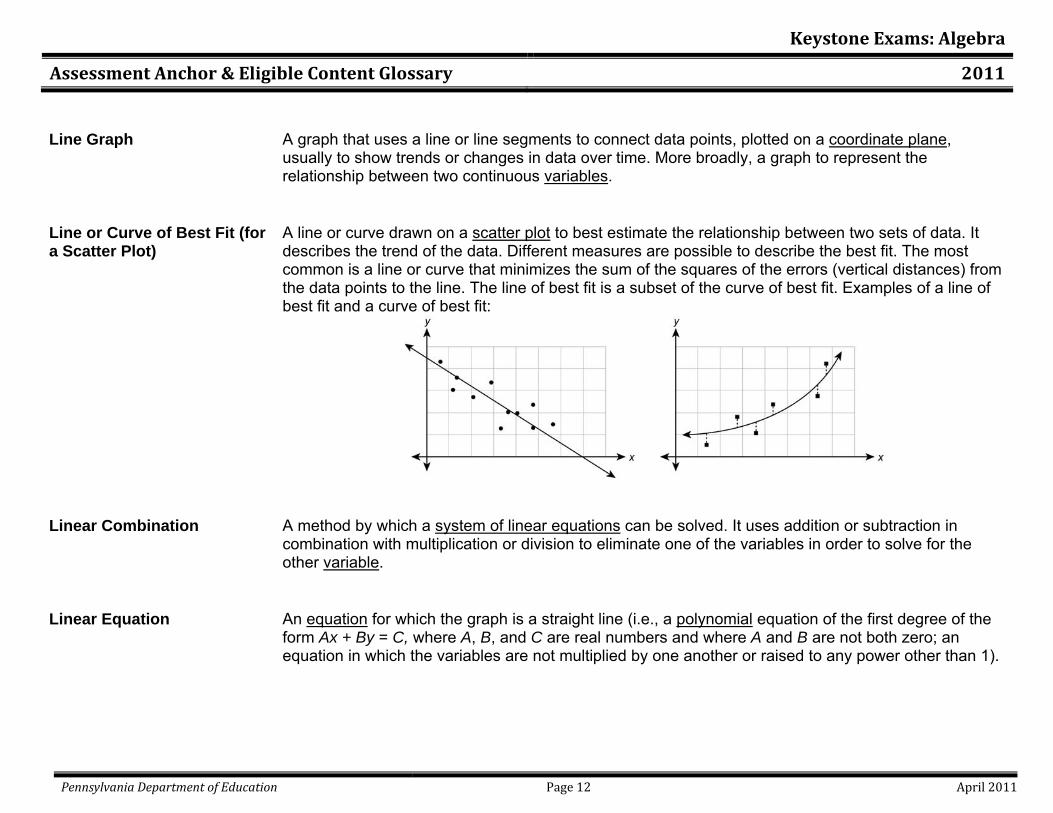
Line or Curve of Best Fit (for a Scatter Plot)
A line or curve drawn on a scatter plot to best estimate the relationship between two sets of data. It describes the trend of the data. Different measures are possible to describe the best fit. The most common is a line or curve that minimizes the sum of the squares of the errors (vertical distances) from the data points to the line. The line of best fit is a subset of the curve of best fit. Examples of a line of best fit and a curve of best fit:
Linear Combination A method by which a system of linear equations can be solved. It uses addition or subtraction in combination with multiplication or division to eliminate one of the variables in order to solve for the other variable.
Linear Equation An equation for which the graph is a straight line (i.e., a polynomial equation of the first degree of the form Ax + By = C, where A, B, and C are real numbers and where A and B are not both zero; an equation in which the variables are not multiplied by one another or raised to any power other than 1).
Keystone Exams: Algebra
Assessment Anchor & Eligible Content Glossary 2011
Pennsylvania Department of Education Page 13 April 2011
Linear Function A function for which the graph is a non-vertical straight line. It is a first degree polynomial of the common form f(x) = mx + b, where m and b are constants and x is a real variable. The constant m is called the slope and b is called the y-intercept. It has a constant rate of change.
Linear Inequality: The relation of two expressions using the symbols <, >, ≤, ≥, or ≠ and whose boundary is a straight line. The line divides the coordinate plane into two parts. If the inequality is either ≤ or ≥, then the boundary is solid. If the inequality is either < or >, then the boundary is dashed. If the inequality is ≠, then the solution contains everything except for the boundary.
Logarithm The exponent required to produce a given number (e.g., since 2 raised to a power of 5 is 32, the logarithm base 2 of 32 is 5; this is written as log2 32 = 5). Two frequently used bases are 10 (common logarithm) and e (natural logarithm). When a logarithm is written without a base, it is understood to be base 10.
Logarithmic Equation An equation which contains a logarithm of a variable or number. Sometimes it is solved by rewriting the equation in exponential form and solving for the variable (e.g., log2 32 = 5 is the same as 25 = 32). It is an inverse function of the exponential function.
Mapping The matching or pairing of one set of numbers to another by use of a rule. A number in the domain is matched or paired with a number in the range (or a relation or function). It may be a one-to-one correspondence, a one-to-many correspondence, or a many-to-one correspondence.
Maximum Value (of a Graph) The value of the dependent variable for the highest point on the graph of a curve.
Keystone Exams: Algebra
Assessment Anchor & Eligible Content Glossary 2011
Pennsylvania Department of Education Page 14 April 2011
Mean A measure of central tendency that is calculated by adding all the values of a set of data and dividing that sum by the total number of values. Unlike median, the mean is sensitive to outlier values. It is also called “arithmetic mean” or “average”.
Measure of Central Tendency
A measure of location of the middle (center) of a distribution of a set of data (i.e., how data clusters). The three most common measures of central tendency are mean, median, and mode.
Measure of Dispersion A measure of the way in which the distribution of a set of data is spread out. In general the more spread out a distribution is, the larger the measure of dispersion. Range and interquartile range are two measures of dispersion.
Median A measure of central tendency that is the middle value in an ordered set of data or the average of the two middle values when the set has two middle values (occurs when the set of data has an even number of data points). It is the value halfway through the ordered set of data, below and above which there are an equal number of data values. It is generally a good descriptive measure for skewed data or data with outliers.
Minimum Value (of a Graph) The value of the dependent variable for the lowest point on the graph of a curve.
Mode A measure of central tendency that is the value or values that occur(s) most often in a set of data. A set of data can have one mode, more than one mode, or no mode.
Monomial A polynomial with only one term; it contains no addition or subtraction. It can be a number, a variable,
or a product of numbers and/or more variables (e.g., 2 • 5 or x3y4 or 243
rπ ).
Keystone Exams: Algebra
Assessment Anchor & Eligible Content Glossary 2011
Pennsylvania Department of Education Page 15 April 2011
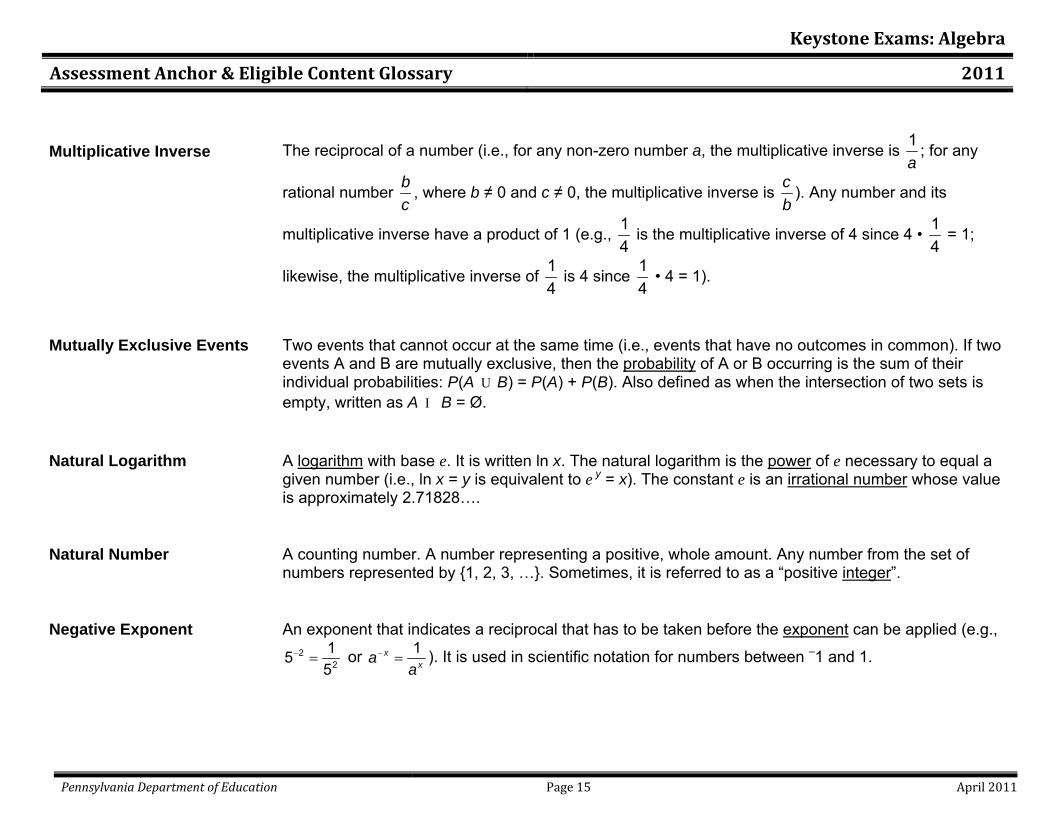
Multiplicative Inverse The reciprocal of a number (i.e., for any non-zero number a, the multiplicative inverse is 1a
; for any
rational number bc
, where b ≠ 0 and c ≠ 0, the multiplicative inverse is cb
). Any number and its
multiplicative inverse have a product of 1 (e.g., 14
is the multiplicative inverse of 4 since 4 • 14
= 1;
likewise, the multiplicative inverse of 14
is 4 since 14
• 4 = 1).
Mutually Exclusive Events Two events that cannot occur at the same time (i.e., events that have no outcomes in common). If two events A and B are mutually exclusive, then the probability of A or B occurring is the sum of their individual probabilities: P(A U B) = P(A) + P(B). Also defined as when the intersection of two sets is empty, written as A I B = Ø.
Natural Logarithm A logarithm with base e. It is written ln x. The natural logarithm is the power of e necessary to equal a given number (i.e., ln x = y is equivalent to e y = x). The constant e is an irrational number whose value is approximately 2.71828….
Natural Number A counting number. A number representing a positive, whole amount. Any number from the set of numbers represented by {1, 2, 3, …}. Sometimes, it is referred to as a “positive integer”.
Negative Exponent An exponent that indicates a reciprocal that has to be taken before the exponent can be applied (e.g., 2
2155
− = or 1xxa
a− = ). It is used in scientific notation for numbers between –1 and 1.
Keystone Exams: Algebra
Assessment Anchor & Eligible Content Glossary 2011
Pennsylvania Department of Education Page 16 April 2011
Number Line A graduated straight line that represents the set of all real numbers in order. Typically, it is marked showing integer values.
Odds A comparison, in ratio form (as a fraction or with a colon), of outcomes. “Odds in favor” (or simply “odds”) is the ratio of favorable outcomes to unfavorable outcomes (e.g., the odds in favor of picking a red hat when there are 3 red hats and 5 non-red hats is 3:5). “Odds against” is the ratio of unfavorable outcomes to favorable outcomes (e.g., the odds against picking a red hat when there are 3 red hats and 5 non-red hats is 5:3).
Order of Operations Rules describing what order to use in evaluating expressions: (1) Perform operations in grouping symbols (parentheses and brackets), (2) Evaluate exponential expressions and radical expressions from left to right, (3) Multiply or divide from left to right, (4) Add or subtract from left to right.
Ordered Pair A pair of numbers used to locate a point on a coordinate plane, or the solution of an equation in two variables. The first number tells how far to move horizontally, and the second number tells how far to move vertically; written in the form (x-coordinate, y-coordinate). Order matters: the point (x, y) is not the same as (y, x).
Origin The point (0, 0) on a coordinate plane. It is the point of intersection for the x-axis and the y-axis.
Outlier A value that is much greater or much less than the rest of the data. It is different in some way from the general pattern of data. It directly stands out from the rest of the data. Sometimes it is referred to as any data point more than 1.5 interquartile ranges greater than the upper (third) quartile or less than the lower (first) quartile.
Keystone Exams: Algebra
Assessment Anchor & Eligible Content Glossary 2011
Pennsylvania Department of Education Page 17 April 2011
Pattern (or Sequence) A set of numbers arranged in order (or in a sequence). The numbers and their arrangement are determined by a rule, including repetition and growth/decay rules. See arithmetic sequence and geometric sequence.
Perfect Square A number whose square root is a whole number (e.g., 25 is a perfect square since 25 = 5). A perfect square can be found by raising a whole number to the second power (e.g., 52 = 25).
Permutation An ordered arrangement of objects from a given set in which the order of the objects is significant (e.g., two-letter permutations of the three letters X, Y, and Z would be XY, YX, XZ, ZX, YZ, and ZY). A permutation is similar to, but not the same as, a combination.
Point-Slope Form (of a Linear Equation)
An equation of a straight, non-vertical line written in the form y – y1 = m(x – x1), where m is the slope of the line and (x1, y1) is a given point on the line.
Polynomial An algebraic expression that is a monomial or the sum or difference of two or more monomials (e.g., 6a or 5a2 + 3a – 13 where the exponents are natural numbers).
Polynomial Function A function of the form f(x) = anxn + an–1xn–1 + … + a1x + a0, where an ≠ 0 and natural number n is the degree of the polynomial.
Positive Exponent Indicates how many times a base number is multiplied by itself. In the expression xn, n is the positive exponent, and x is the base number (e.g., 23 = 2 • 2 • 2).
Keystone Exams: Algebra
Assessment Anchor & Eligible Content Glossary 2011
Pennsylvania Department of Education Page 18 April 2011
Power The value of the exponent in a term. The expression an is read “a to the power of n.” To raise a number, a, to the power of another whole number, n, is to multiply a by itself n times (e.g., the number 43 is read “four to the third power” and represents 4 • 4 • 4).
Power of a Power An expression of the form (am)n. It can be found by multiplying the exponents (e.g., (23)4 = 23•4 = 212 = 4,096).
Powers of Products An expression of the form am • an. It can be found by adding the exponents when multiplying powers that have the same base (e.g., 23 • 24 = 23+4 = 27 = 128).
Prime Number Any natural number with exactly two factors, 1 and itself (e.g., 3 is a prime number since it has only two factors: 1 and 3). [Note: Since 1 has only one factor, itself, it is not a prime number.] A prime number is not a composite number.
Probability A number from 0 to 1 (or 0% to 100%) that indicates how likely an event is to happen. A very unlikely event has a probability near 0 (or 0%) while a very likely event has a probability near 1 (or 100%). It is written as a ratio (fraction, decimal, or equivalent percent). The number of ways an event could happen (favorable outcomes) is placed over the total number of events (total possible outcomes) that could happen. A probability of 0 means it is impossible, and a probability of 1 means it is certain.
Probability of a Compound (or Combined) Event
There are two types: 1. The union of two events A and B, which is the probability of A or B occurring. This is
represented as P(A U B) = P(A) + P(B) – P(A) • P(B). 2. The intersection of two events A and B, which is the probability of A and B occurring. This is
represented as P(A I B) = P(A) • P(B).
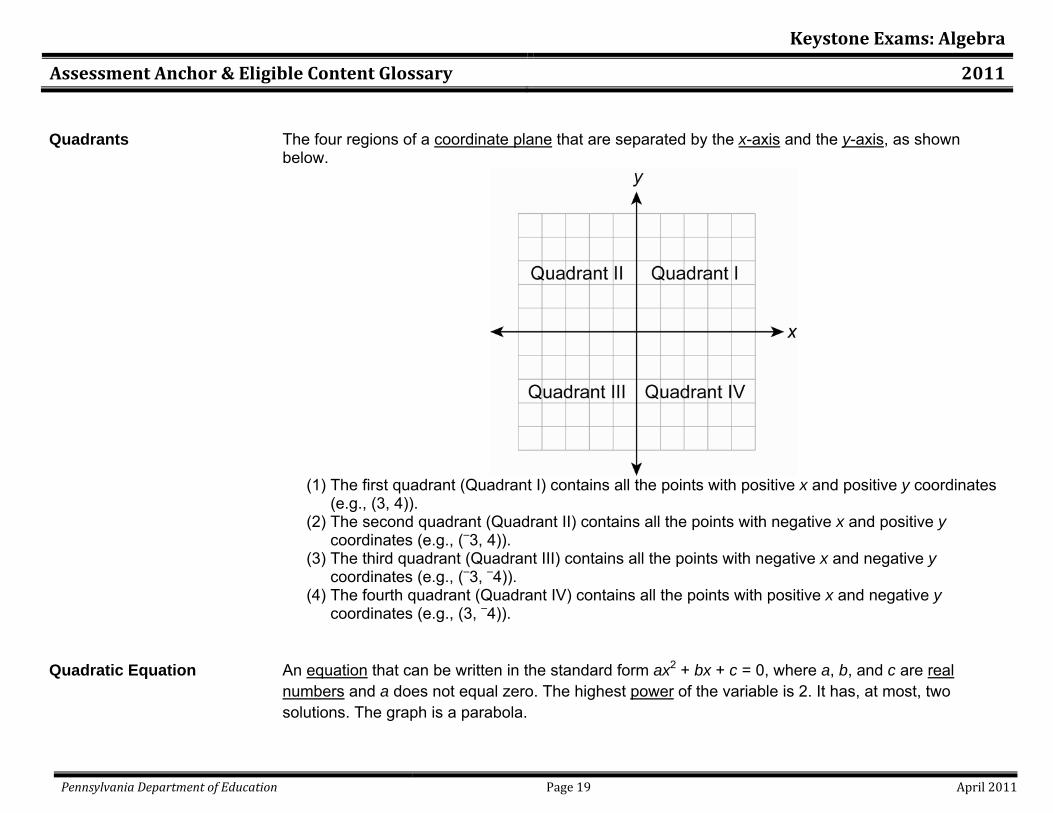
Keystone Exams: Algebra
Assessment Anchor & Eligible Content Glossary 2011
Pennsylvania Department of Education Page 19 April 2011
Quadrants The four regions of a coordinate plane that are separated by the x-axis and the y-axis, as shown below.
(1) The first quadrant (Quadrant I) contains all the points with positive x and positive y coordinates
(e.g., (3, 4)). (2) The second quadrant (Quadrant II) contains all the points with negative x and positive y
coordinates (e.g., (–3, 4)). (3) The third quadrant (Quadrant III) contains all the points with negative x and negative y
coordinates (e.g., (–3, –4)). (4) The fourth quadrant (Quadrant IV) contains all the points with positive x and negative y
coordinates (e.g., (3, –4)).
Quadratic Equation An equation that can be written in the standard form ax2 + bx + c = 0, where a, b, and c are real numbers and a does not equal zero. The highest power of the variable is 2. It has, at most, two solutions. The graph is a parabola.
Keystone Exams: Algebra
Assessment Anchor & Eligible Content Glossary 2011
Pennsylvania Department of Education Page 20 April 2011
Quadratic Formula The solutions or roots of a quadratic equation in the form ax2 + bx + c = 0, where a ≠ 0, are given by
the formula 2 4
2b b acx
a− ± −
= .
Quadratic Function A function that can be expressed in the form f(x) = ax2 + bx + c, where a ≠ 0 and the highest power of the variable is 2. The graph is a parabola.
Quartile One of three values that divides a set of data into four equal parts: 1. Median divides a set of data into two equal parts. 2. Lower quartile (25th percentile) is the median of the lower half of the data. 3. Upper quartile (75th percentile) is the median of the upper half of the data.
Radical Expression An expression containing a radical symbol ( n a ). The expression or number inside the radical (a) is called the radicand, and the number appearing above the radical (n) is the degree. The degree is always a positive integer. When a radical is written without a degree, it is understood to be a degree of 2 and is read as “the square root of a.” When the degree is 3, it is read as “the cube root of a.” For any other degree, the expression n a is read as “the nth root of a.” When the degree is an even number, the radical expression is assumed to be the principal (positive) root (e.g., although (–7)2 = 49,
49 = 7).
Range (of a Relation or Function)
The set of all possible values for the output (dependent variable) of a function or relation; the set of second numbers in the ordered pairs of a function or relation; the values of the y-coordinates in (x, y).
Keystone Exams: Algebra
Assessment Anchor & Eligible Content Glossary 2011
Pennsylvania Department of Education Page 21 April 2011
Range (of Data) In statistics, a measure of dispersion that is the difference between the greatest value (maximum value) and the least value (minimum value) in a set of data.
Rate A ratio that compares two quantities having different units (e.g., 168 miles3.5 hours
or 122.5 calories5 cups
). When
the rate is simplified so that the second (independent) quantity is 1, it is called a unit rate (e.g.,
48 miles per hour or 24.5 calories per cup).
Rate (of Change) The amount a quantity changes over time (e.g., 3.2 cm per year). Also the amount a function’s output changes (increases or decreases) for each unit of change in the input. See slope.
Rate (of Interest) The percent by which a monetary account accrues interest. It is most common for the rate of interest to be measured on an annual basis (e.g., 4.5% per year), even if the interest is compounded periodically (i.e., more frequently than once per year).
Ratio A comparison of two numbers, quantities or expressions by division. It is often written as a fraction,
but not always (e.g., 23
, 2:3, 2 to 3, 2 ÷ 3 are all the same ratios).
Rational Expression An expression that can be written as a polynomial divided by a polynomial, defined only when the latter is not equal to zero.
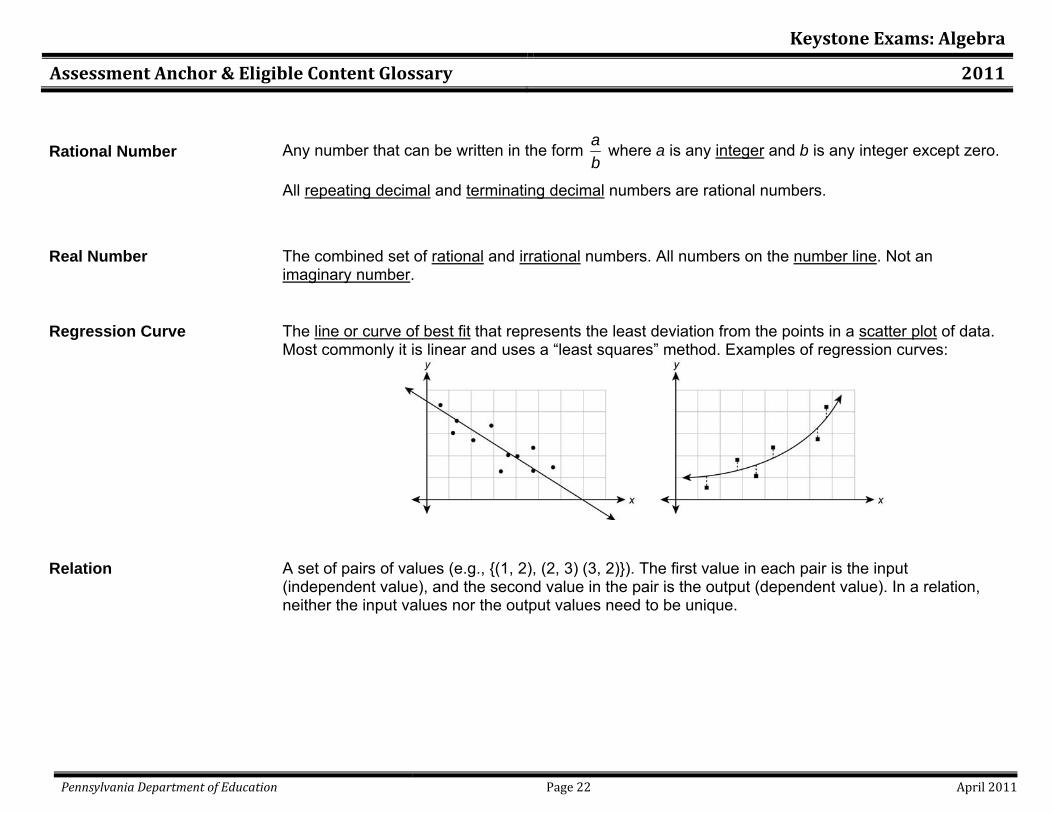
Keystone Exams: Algebra
Assessment Anchor & Eligible Content Glossary 2011
Pennsylvania Department of Education Page 22 April 2011
Rational Number Any number that can be written in the form ab
where a is any integer and b is any integer except zero.
All repeating decimal and terminating decimal numbers are rational numbers.
Real Number The combined set of rational and irrational numbers. All numbers on the number line. Not an imaginary number.
Regression Curve The line or curve of best fit that represents the least deviation from the points in a scatter plot of data. Most commonly it is linear and uses a “least squares” method. Examples of regression curves:
Relation A set of pairs of values (e.g., {(1, 2), (2, 3) (3, 2)}). The first value in each pair is the input (independent value), and the second value in the pair is the output (dependent value). In a relation, neither the input values nor the output values need to be unique.
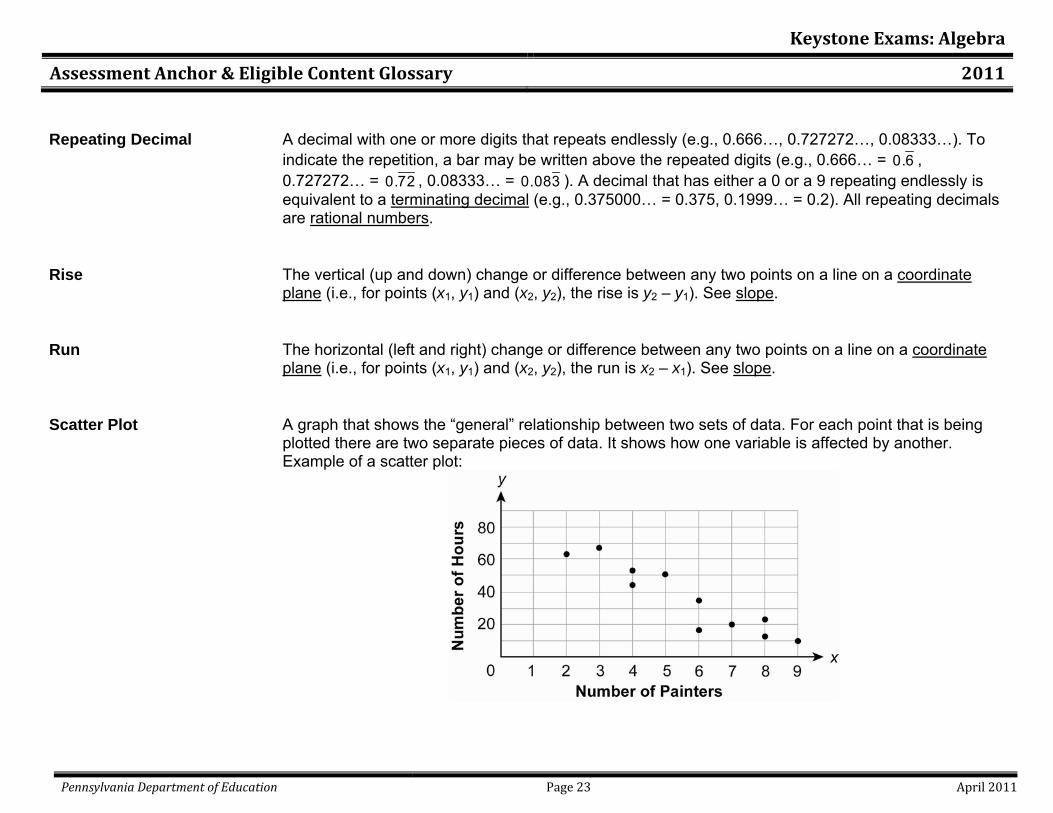
Keystone Exams: Algebra
Assessment Anchor & Eligible Content Glossary 2011
Pennsylvania Department of Education Page 23 April 2011
Repeating Decimal A decimal with one or more digits that repeats endlessly (e.g., 0.666…, 0.727272…, 0.08333…). To indicate the repetition, a bar may be written above the repeated digits (e.g., 0.666… = 0.6 , 0.727272… = 0.72 , 0.08333… = 0.083 ). A decimal that has either a 0 or a 9 repeating endlessly is equivalent to a terminating decimal (e.g., 0.375000… = 0.375, 0.1999… = 0.2). All repeating decimals are rational numbers.
Rise The vertical (up and down) change or difference between any two points on a line on a coordinate plane (i.e., for points (x1, y1) and (x2, y2), the rise is y2 – y1). See slope.
Run The horizontal (left and right) change or difference between any two points on a line on a coordinate plane (i.e., for points (x1, y1) and (x2, y2), the run is x2 – x1). See slope.
Scatter Plot A graph that shows the “general” relationship between two sets of data. For each point that is being plotted there are two separate pieces of data. It shows how one variable is affected by another. Example of a scatter plot:
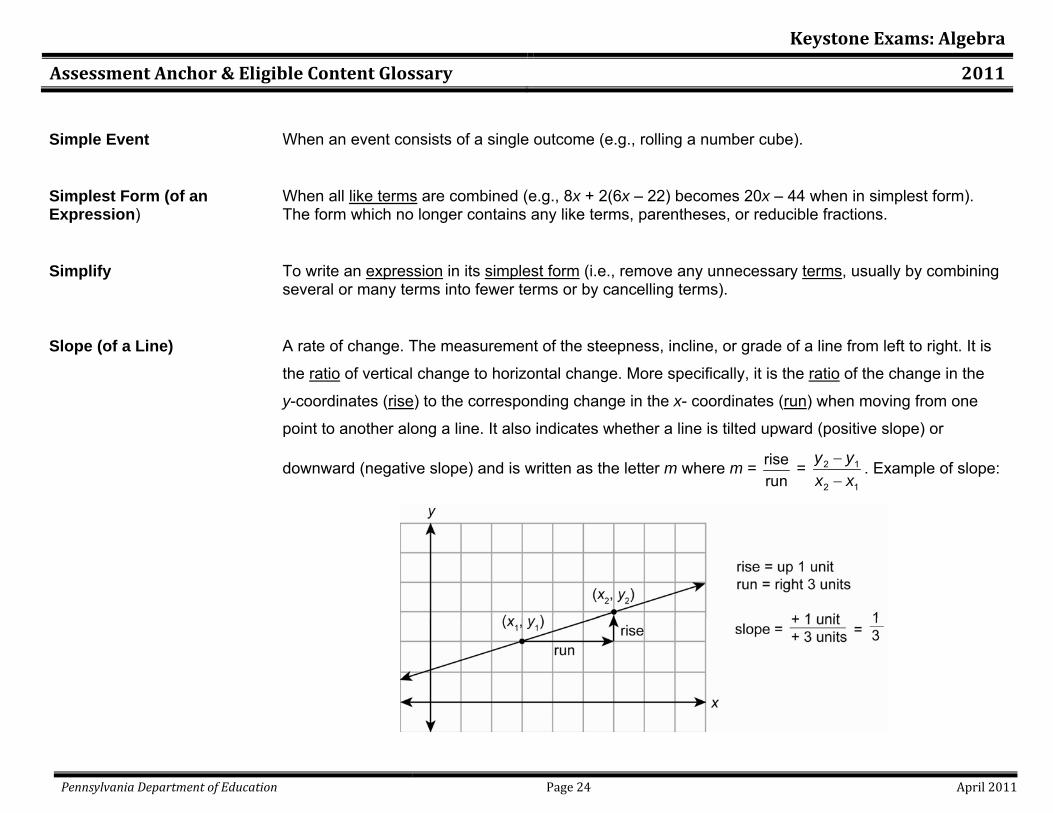
Keystone Exams: Algebra
Assessment Anchor & Eligible Content Glossary 2011
Pennsylvania Department of Education Page 24 April 2011
Simple Event When an event consists of a single outcome (e.g., rolling a number cube).
Simplest Form (of an Expression)
When all like terms are combined (e.g., 8x + 2(6x – 22) becomes 20x – 44 when in simplest form). The form which no longer contains any like terms, parentheses, or reducible fractions.
Simplify To write an expression in its simplest form (i.e., remove any unnecessary terms, usually by combining several or many terms into fewer terms or by cancelling terms).
Slope (of a Line) A rate of change. The measurement of the steepness, incline, or grade of a line from left to right. It is
the ratio of vertical change to horizontal change. More specifically, it is the ratio of the change in the
y-coordinates (rise) to the corresponding change in the x- coordinates (run) when moving from one
point to another along a line. It also indicates whether a line is tilted upward (positive slope) or
downward (negative slope) and is written as the letter m where m = riserun
= 2 1
2 1
y yx x
−−
. Example of slope:
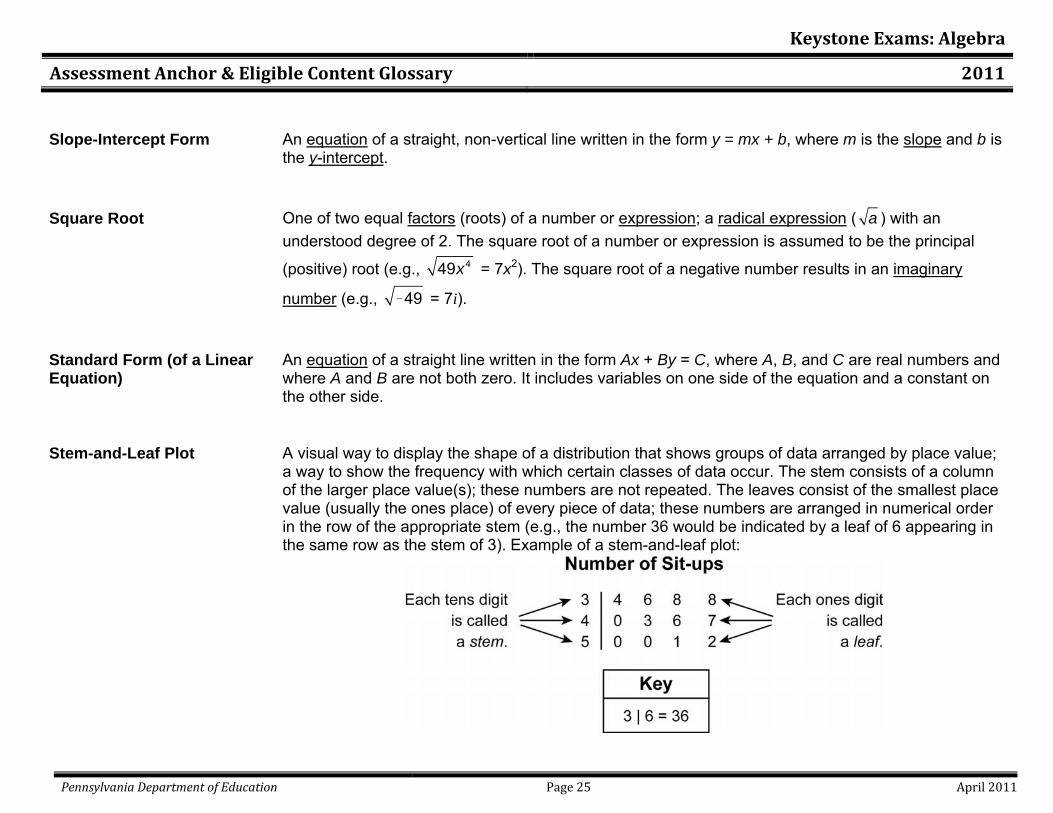
Keystone Exams: Algebra
Assessment Anchor & Eligible Content Glossary 2011
Pennsylvania Department of Education Page 25 April 2011
Slope-Intercept Form An equation of a straight, non-vertical line written in the form y = mx + b, where m is the slope and b is the y-intercept.
Square Root One of two equal factors (roots) of a number or expression; a radical expression ( a ) with an understood degree of 2. The square root of a number or expression is assumed to be the principal
(positive) root (e.g., 449x = 7x2). The square root of a negative number results in an imaginary
number (e.g., _ 49 = 7i).
Standard Form (of a Linear Equation)
An equation of a straight line written in the form Ax + By = C, where A, B, and C are real numbers and where A and B are not both zero. It includes variables on one side of the equation and a constant on the other side.
Stem-and-Leaf Plot A visual way to display the shape of a distribution that shows groups of data arranged by place value; a way to show the frequency with which certain classes of data occur. The stem consists of a column of the larger place value(s); these numbers are not repeated. The leaves consist of the smallest place value (usually the ones place) of every piece of data; these numbers are arranged in numerical order in the row of the appropriate stem (e.g., the number 36 would be indicated by a leaf of 6 appearing in the same row as the stem of 3). Example of a stem-and-leaf plot:
Keystone Exams: Algebra
Assessment Anchor & Eligible Content Glossary 2011
Pennsylvania Department of Education Page 26 April 2011
Substitution The replacement of a term or variable in an expression or equation by another that has the same value in order to simplify or evaluate the expression or equation.
System of Linear Equations A set of two or more linear equations with the same variables. The solution to a system of linear equations may be found by linear combination, substitution, or graphing. A system of two linear equations will either have one solution, infinitely many solutions, or no solutions.
System of Linear Inequalities
Two or more linear inequalities with the same variables. Some systems of inequalities may include equations as well as inequalities. The solution region may be closed or bounded because there are lines on all sides, while other solutions may be open or unbounded.
Systems of Equations A set of two or more equations containing a set of common variables.
Term A part of an algebraic expression. Terms are separated by either an addition symbol (+) or a subtraction symbol (–). It can be a number, a variable, or a product of a number and one or more variables (e.g., in the expression 4x2+ 6y, 4x2 and 6y are both terms).
Terminating Decimal A decimal with a finite number of digits. A decimal for which the division operation results in either repeating zeroes or repeating nines (e.g., 0.375000… = 0.375, 0.1999… = 0.2). It is generally written to the last non-zero place value, but can also be written with additional zeroes in smaller place values as needed (e.g., 0.25 can also be written as 0.2500). All terminating decimals are rational numbers.
Trinomial A polynomial with three unlike terms (e.g., 7a + 4b + 9c). Each term is a monomial, and the monomials are joined by an addition symbol (+) or a subtraction symbol (–). It is considered an algebraic expression.
Keystone Exams: Algebra
Assessment Anchor & Eligible Content Glossary 2011
Pennsylvania Department of Education Page 27 April 2011
Unit Rate A rate in which the second (independent) quantity of the ratio is 1 (e.g., 60 words per minute, $4.50 per pound, 21 students per class).
Variable A letter or symbol used to represent any one of a given set of numbers or other objects (e.g., in the equation y = x + 5, the y and x are variables). Since it can take on different values, it is the opposite of a constant.
Whole Number A natural number or zero. Any number from the set of numbers represented by {0, 1, 2, 3, …}. Sometimes it is referred to as a “non-negative integer”.
x-Axis The horizontal number line on a coordinate plane that intersects with a vertical number line, the y-axis; the line whose equation is y = 0. The x-axis contains all the points with a zero y-coordinate (e.g., (5, 0)).
x-Intercept(s) The x-coordinate(s) of the point(s) at which the graph of an equation crosses the x-axis (i.e., the value(s) of the x-coordinate when y = 0). The solution(s) or root(s) of an equation that is set equal to 0.
y-Axis The vertical number line on a coordinate plane that intersects with a horizontal number line, the x-axis; the line whose equation is x = 0. The y-axis contains all the points with a zero x-coordinate (e.g., (0, 7)).
y-Intercept(s) The y-coordinate(s) of the point(s) at which the graph of an equation crosses the y- axis (i.e., the value(s) of the y-coordinate when x = 0). For a linear equation in slope-intercept form (y = mx + b), it is indicated by b.
Cover photo © Hill Street Studios/Harmik Nazarian/Blend Images/Corbis.
Copyright © 2012 by the Pennsylvania Department of Education. The materials contained in this publication may be duplicated by Pennsylvania educators for local classroom use. This permission does not extend to the duplication of materials for commercial use.
Keystone Exams: Algebra I
Assessment Anchors and Eligible Contentwith Sample Questions and Glossary
April 2012