keysight technologies making 802.11g transmitter...
TRANSCRIPT

Keysight Technologies Making 802.11G Transmitter Measurements
Application Note

802.11g is the latest standard in wireless computer networking. It follows on the developments of 802.11a and 802.11b, combining the speed of 802.11a with the low cost and installed base of 802.11b devices. The aim of 802.11g – to be interoperable with 802.11b and have acceptable performance, cost, and design time – leads to some unique measurement challenges.
Over the last few years, 802.11b-based wireless networking has been an enormous success, with sales growing at about 10% per quarter. This growth has been driven by the immense growth in affordable high-speed Internet access at home as well as the office. 802.11b provides an excellent wireless channel for Internet connections, but it often lacks the speed required for transferring files and performing other large dataset networking tasks within the intranet. 802.11g expects to fix this by offering data rates as high as 54 Mbps while maintaining compatibility with legacy 11-Mbps 802.11b devices and networks.
802.11g will get increased data transfer rates by using the orthogonal frequency division multiplexing (OFDM) modulation technique that is used in 802.11a, while maintaining the timing and frequency arrange-ments from 802.11b. This application note outlines the transmitter measurements required for 802.11g and examines how they relate to measurements needed for 802.11a and 802.11b testing.
Introduction

3 | Keysight | Making 802.11G Transmitter Measurements - Application Note
802.11g Basics
802.11g is best understood as the merging of two existing 802.11 wireless networking standards, 802.11a and 802.11b. 802.11g will use the two different modulation tech-niques of the a and b systems at 2.4 GHz, the current frequency of the 802.11b standard. This will allow interoperability with 802.11b systems while utilizing the data rate of the 802.11a standard.
To better understand 802.11g, a quick overview of the modulation techniques used by 802.11a and 802.11b is useful background.
802.11a and OFDM
802.11a uses an orthogonal frequency division multiplexed (OFDM) multi-carrier signal. In traditional frequency division multiplex (FDM) systems, the spacing between channels is greater than the symbol rate to avoid overlapping the spectrums. However, in OFDM systems, the carriers overlap, which conserves bandwidth. Keeping the carriers orthogonal to each other controls sub-carrier interference. Orthogonality means there is a mathematical relationship between the sub-carriers. The 802.11a sub-carriers are bursted giving them a sinX/X spectral contour (see figure 1). As long as each sub-carrier is placed in a null of the sinX/X shape, the sub-carrier and its side-lobes will not interfere with any other sub-carrier.
In 802.11a, all the sub-carriers are spaced 312.5 kHz apart. This spacing is determined by dividing the Fast Fourier Transforms (FFT) sampling rate, 20 MHz, by the total number of bins required in the FFT, which is 64 points. One 802.11a symbol is comprised of 48 data sub-carriers, four pilot sub-carriers, and one nulled sub-carrier (zero sub-carrier). The remaining 11 sub-carriers are discarded. Thus the occupied bandwidth is 53 sub-carriers multiplied by the spacing of 312.5 kHz, which is 16.56 MHz. The 802.11a standard specifies that the occupied bandwidth is 16.6 MHz.
The high rate data OFDM signal is divided equally across the 48 carry data carriers. This reduces the data rate and increases the symbol duration for the sub-carriers, thus the relative amount of dispersion in time caused by multi-path delay spread is reduced. Phase noise and non-linear distortion contribute the most to loss of orthogonality, which results in inter-carrier interference (ICI). A guard interval is added to help prevent ICI, as well as inter-symbol interference (ISI). ICI will cause ISI. However, ISI will not cause ICI. A signal with a slower data rate is more resistant to multi-path fading and interference.
Figure 1. OFDM carriers and IM components do not overlap

4 | Keysight | Making 802.11G Transmitter Measurements - Application Note
802.11b and BPSK, QPSK, CCK, and Barker Codes
802.11b has extended the generic 802.11 standard by adding physical layer support of two speeds, 5.5 Mbps and 11 Mbps. Frequency hopping (FHSS) signaling was dropped and direct sequence spread spectrum (DSSS) signaling was retained. Frequency hopping could not support the higher data rates without violating FCC regulations. This means that 802.11b systems will interoperate with DSSS systems, but will not work with the older 1-Mbps and 2-Mbps 802.11 FHSS systems.
The original 802.11 DSSS standard specifies an 11-bit chipping—called a Barker se-quence—to encode all data sent over the air. Each 11-chip sequence covers a single data bit (1 or 0) and is converted to a waveform, called a symbol, that can be sent over the air. These symbols are transmitted at a 1 MSps (1 million symbols per second) symbol rate using binary phase shift keying (BPSK) modulation. BPSK simply switches a carrier between two different phases to represent a binary 1 or 0. This technique represents one bit per symbol transmitted.
In the case of 2 Mbps, quadrature phase shift keying (QPSK) is used, doubling the data rate available in BPSK. QPSK also modulates the phase of the signal, but uses four phases instead of two. This increases the efficiency of the spectrum used by transmitting two bits per symbol transmitted, but it reduces the system’s immunity to noise and other interference. As more information is placed in a symbol, the states of the symbol become closer together allowing noise and other interference to “push” the signal into the wrong state and cause bit errors.
To increase the data rate in the 802.11b standard beyond 2 Mbps, advanced coding techniques are employed. Rather than the 11-bit Barker sequence, 802.11b specifies complementary code keying (CCK), which consists of a set of 64 eight-chip code words for the 5.5 Mbps and 11 Mbps data rates. As a set, these code words have unique mathematical properties that allow them to be correctly distinguished from one another by a receiver even in the presence of substantial noise and multi-path interference (e.g. interference caused by receiving multiple radio reflections within a building). The 5.5 Mbps rate uses CCK to encode four bits per symbol, while the 11 Mbps rate encodes eight bits per symbol. Both speeds use QPSK as the modulation technique and signal at 1.375 MSps. This is how the higher data rates are obtained.
Data rate Code length Modulation Symbol rate Bits/Symbol
1 Mbps 11 (Barker sequence) BPSK 1 MSps 1
2 Mbps 11 (Barker sequence) QPSK 1 MSps 2
5.5 Mbps 8 (CCK) QPSK 1.375 MSps 4
11 Mbps 8 (CCK) QPSK 1.375 MSps 8
Figure 2. 802.11b data rate versus modulation type

5 | Keysight | Making 802.11G Transmitter Measurements - Application Note
bits In 11 complex chips out
Modulation:BPSK/QPSK
Barker sequence+1, -1, +1, +1, -1, +1, +1, +1, -1, -1, -1, -1
Map
1 of 4/648-chip sequence
selector
DQPSKrotate
8 complexchips out
d2-d7
d0, d1
4/8 bitsd0-d3/d7
Probe request
Scanning
Beacons
Association Distributed IFS
Extended IFSRTS
Shor
t IFS CTS
Shor
t IFS
Shor
t IFS
ACK
Is anybody there?
Frame with user data
Can be OFDM, CCK, PBCC,depending on NIC capability
RTS & CTS skipped ifminimal network impact
IFS = inter-frame space
802.11g packet under access point control
Beacon carries OFDMcapability information
Figure 3. 802.11b Barker modulator block diagram
Figure 4. 802.11b CCK modulator block diagram
Figure 5. Example 802.11g packet under AP control
How 802.11band 802.11g will Coexist
It is important for a mixed 802.11b/g system to use the available spectrum as effectively as possible. The new problem introduced by 802.11g is that an 802.11b network interface card (NIC) cannot read information from an OFDM signal. Therefore it would be treated like an interferer, not as part of a network, which is less efficient. To understand the approach taken with 802.11g, we should remember that an 802.11b system already uses a combination of techniques such as clear channel assessment, RTS/CTS, random backoff, and virtual carrier sense to operate successfully in the 2.4 GHz ISM band. The access point (AP) is a key point in the management of RF transmis-sions to avoid packet collisions. In 802.11g, the AP will transmit extra data bits on the Beacon signals, which will tell the NICs when they can use OFDM. In general, OFDM is likely to be used in conjunction with the RTS/CTS process. If the AP considers there will be minimal impact on 802.11b systems, RTS/CTS may not be used. In this situation the user will see the full benefit of the higher data rates available.

6 | Keysight | Making 802.11G Transmitter Measurements - Application Note
Figure 7. Example 802.11g modulation types (right to left: BPSK, QPSK, 8PSK, and 64QAM)
802.11g and PBCC
The final modulation and encoding type allowed in 802.11g is packet binary convolutional coding (PBCC). This method has recently been used in 802.11b systems to increase the data rate from 11 Mbps to 22 Mbps. PBCC is basically a more complex version of CCK, allowing twice as much data to be encoded for a given bandwidth. Normally, a doubling of the data rate within a given bandwidth requires the signal-to-noise ratio of the channel to increase by 3 dB. By using PBCC, only a 0.5 dB increase is required for this data rate increase. In PBCC, the real data rate increase comes from moving from QPSK to 8PSK as the modulation technique, while the reduction in required signal-to-noise ratio comes from using PBCC over CCK.
In 802.11g, PBCC is an optional mode. It is allowed by the standard, but not required in any implementation. If implemented, it works exactly like the OFDM mode of 802.11g; an 802.11b-compatible header is transmitted, then the PBCC section is transmitted.
Function Specification Notes
Carrier frequency 2.400 to 2.4835 GHz(ISM radio band)
25 MHz channel spacing, 3 non-overlapping channels
Modulation type OFDM – orthogonal frequency division multiplexingDivision multiplexing CCK – complementary code keyingPBCC – packet binary convolutional coding
PBCC is optional
Data rate 1, 2, 5.5, 6, 9, 11, 12, 18, 24, 36, 54 Mbps 11 Mbps CCK and 24 Mbps#OFDM are required
Output power Normally up to 100 mW, 1 W allowed Power level dependant on modulation used
Figure 6. 802.11g WLAN standard specifications
7 | Keysight | Making 802.11G Transmitter Measurements - Application Note
Transmitter Measurements
This section describes some of the common tests used when designing and manufactur-ing 802.11g transmitters and modulators. As 802.11g is a system designed for low cost and high data rates, care must be taken in the design to ensure interoperability with other 802.11g and 802.11b equipment, while also minimizing part cost and count. Much of the complexity in 802.11g systems comes in the realm of modulation and amplifica-tion, and this section will describe how to test these characteristics.
With these concerns in mind, the most powerful measurement device for 802.11g transmitters will be a vector signal analyzer (VSA). A VSA deals with a signal in the time domain, measuring signals’ timing and amplitude. A VSA can also apply Fast Fourier Transforms (FFTs) to analyze the signal in the frequency domain or it can apply advanced digital signal processing (DSP) techniques to provide modulation analysis capabilities. By analyzing the 802.11g signal in the time, frequency, and modulation domain, you can be sure that your design will perform as you expect it to.1
Time Domain Tests
As a bursted and digitally modulated signal, 802.11g has a range of timing issues to handle. These issues range from transmitter turn-on time to symbol timing.
Transmitter turn-on transientMeasuring the turn-on transient is crucial in a rapidly bursted signal such as 802.11g. Design issues such as the linearity of the amplifier, stability of the voltage-controlled oscillator (VCO), slew rate of the overall system, and timing alignment of the modulator come into play here. Looking at the turn-on transient of an 802.11g burst provides insight in all these areas.
The time for a burst to go from the noise floor to a prescribed power level or percent of final output power can be easily measured using the marker functions of a VSA. This test also will quickly bring out any overshoot, undershoot, or ringing in the system by visually displaying the power versus time curve of the burst. Additionally, the VSA can measure the phase of the signal as it turns on, which is crucial to maintaining orthogonality in OFDM systems. The duration of the turn-on transient is important to 802.11g because a short transient is required to get high data throughput, while avoiding the inefficiency of waiting for the transmitter to stabilize before starting the preamble and synchronization sections of the burst.
The frequency spectrum of the signal during turn-on also is important. Sometimes even moderate over-shoot can stimulate non-linearity in the power amplifier, generating spurious emissions or a broadening of the overall spectrum of the transmitted signal.
1. All screen captures shown in this note were generated using the Keysight Technologies, Inc. 89600 VSA with the Keysight E4438C vector signal generator as the signal source.

8 | Keysight | Making 802.11G Transmitter Measurements - Application Note
The combination of FFT analysis and time gating capabilities offered in vector signal analyzers is designed for evaluating power-on/off of signal bursts. A specific time portion of a signal can be selected and analyzed in the frequency domain, showing the specific spectrum for that specific time. This capability helps the designer narrow in on spectral problems and isolate where in the burst they originate. See figure 8 for an example of time gating on a WLAN signal.
Another test of the initial portion of an 802.11g burst is determining when the modulation actually starts. 802.11g uses the very beginning portion of the burst to align the receiver with the transmitter with respect to frequency and symbol timing. If the modulation of the carrier begins before the VCO is settled, the receiver may synchronize to the wrong frequency, or it may miss the sync altogether, leading to a missed packet. If the modu-lation begins too late, time is lost and frequency spectrum is wasted reducing system efficiency.
A: Ch1 Gate Spectrum
B: Ch1 Main Time
10dBm
LogMag
10dB
/div
-90dBm
0dBVpk
LogMag
10dB
/div
-100dBVpk
Center: 2.412 GHzRBW: 811.845 kHz
Start: 0 sec
Range: -5dBm
Span: 34.375 MHzGateLen: 4.704545 uSec
Range: 177.8279 mV
Stop: 23.25 uSec
TIME GATES
Figure 8. 802.11g burst with spectrum (top) and gated time (bottom)
9 | Keysight | Making 802.11G Transmitter Measurements - Application Note
Frequency vs. Time Tests
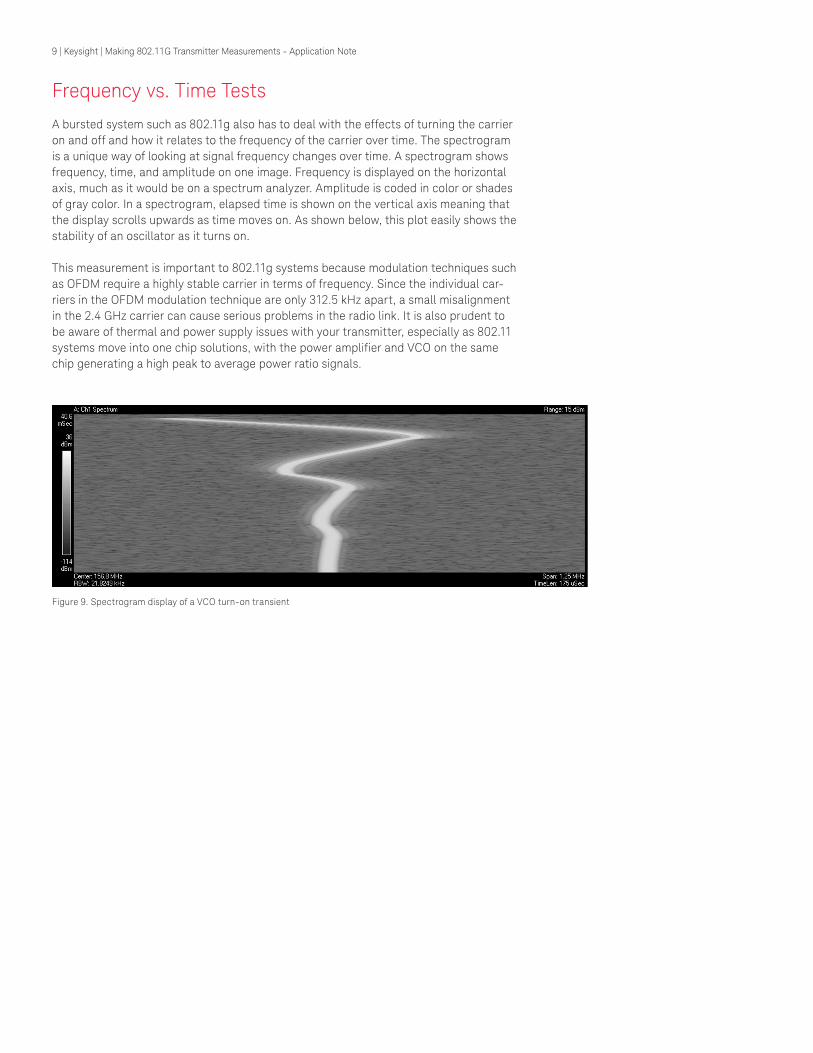
A bursted system such as 802.11g also has to deal with the effects of turning the carrier on and off and how it relates to the frequency of the carrier over time. The spectrogram is a unique way of looking at signal frequency changes over time. A spectrogram shows frequency, time, and amplitude on one image. Frequency is displayed on the horizontal axis, much as it would be on a spectrum analyzer. Amplitude is coded in color or shades of gray color. In a spectrogram, elapsed time is shown on the vertical axis meaning that the display scrolls upwards as time moves on. As shown below, this plot easily shows the stability of an oscillator as it turns on.
This measurement is important to 802.11g systems because modulation techniques such as OFDM require a highly stable carrier in terms of frequency. Since the individual car-riers in the OFDM modulation technique are only 312.5 kHz apart, a small misalignment in the 2.4 GHz carrier can cause serious problems in the radio link. It is also prudent to be aware of thermal and power supply issues with your transmitter, especially as 802.11 systems move into one chip solutions, with the power amplifier and VCO on the same chip generating a high peak to average power ratio signals.
Figure 9. Spectrogram display of a VCO turn-on transient

10 | Keysight | Making 802.11G Transmitter Measurements - Application Note
Modulation Domain Tests
As a standard that includes multiple modulation and signaling types, 802.11g requires a range of modulation tests to properly evaluate its performance.
EVMMany problems are possible in a digitally modulated signal. A good measurement to start with is error vector magnitude (EVM). EVM is a measurement of the real, transmitted signal against a perfect, theoretical signal. This measurement gives an overall view of the quality of the modulation on the signal, which in turn gives a sense of how well a receiver would be able to receive and interpret the signal. Overall, low EVM is highly correlated with a low bit-error rate (BER).
Many modulation issues will negatively impact the EVM of a signal. Anything that affects the amplitude or phase of a complex modulated signal such as OFDM or QPSK will show an increase in EVM. Some of the more common sources of elevated EVM are non-linear-ity in of the power amplifier, the overall quality of the modulator, the filtering applied to the signal, and phase noise in the VCO.
The overall OFDM signal is a large composite and any impairment to this signal will probably cause an overall composite EVM increase. Because of this, one should look at the EVM of not just each sub-carrier by itself, but the EVM of the signal as a whole. The ability of a VSA to show you EVM versus symbol or EVM versus sub-carrier can be crucial in allowing a designer to quickly locate the source of the impairment.
Figure 10. Impaired OFDM constellation and EVM

11 | Keysight | Making 802.11G Transmitter Measurements - Application Note
Constellation diagramLocating problems within a modulator is often expedited through the use of a constella-tion diagram. This display quickly shows you where all the symbols are landing, giving a visual representation of the quality of the signal.
An example of a problem a constellation diagram can help the designer identify is amplifier clipping. In single carrier modulation schemes, clipping is characterized by the outermost symbols falling short of their theoretically correct point. This indicates that the output section does not have sufficient range to meet the demands of the modulator. In OFDM, symbols are spread across many carriers. Individual carriers are independent of one another, but sometimes all of the carriers can add together and require a very high output from the power amplifier. If this brief peak is high enough, the amplifier will clip and many carriers will be affected at once. A large, transient error in the constella-tion is often indicative of amplifier clipping on OFDM systems. As figure 11 shows, this error manifests itself as random high EVM points in the EVM versus time (i.e. symbol) measurement and as an imperfect CCDF curve as well.
Clipping in QPSK-modulated systems is not as common because they typically use broad filters that limit overshoot of the constellation. However, issues such as phase noise or incorrect filtering are readily apparent in a QPSK constellation. Phase noise in a QPSK signal will spread out the constellation points around their targets and produce a line of points rather than a single point. Filtering problems often present as multiple stable points around the target point. These stable points are caused by the ISI that can be present with the wrong filtering coefficients. They are stable due to the deterministic error caused by the previous transmitted bit(s).
Figure 11. Clipped OFDM EVM and CCDF

12 | Keysight | Making 802.11G Transmitter Measurements - Application Note
Error versus frequency or timeOne of the biggest problems you have after measuring a signal is figuring out why it does not perform as expected. Often the issue turns out to be a spur in the signal or an issue that only appears during certain time periods. These problems can be very hard to spot with a traditional spectrum analyzer.
A VSA becomes a very powerful tool in finding these frequency or time related problems. By giving the designer the option to see errors versus time, or errors versus frequency, problems and their causes can be easily identified. A spurious emission in the middle of the signal may not show up much above the peak of the signal on a swept frequency measurement, but in error versus frequency it can easily be seen that most of the error in the signal comes from one specific frequency. By knowing this the designer can focus in on that problem that would have been invisible to other instruments.
Errors versus time problems can be especially hard to find. They can be serious enough to cause high bit error rates, but may not occur often enough to modify the spectrum in any serious way. By looking at error versus time, it becomes easy to spot when the errors occur and if they are periodic in any way. Knowing this allows a designer to look for issues in the circuit that may be able to cause errors during these times and start the focus in these areas. Often times these problems can be traced back to power supply noise or feedback in the system.
Capture and post-analysisAs with almost all measurements on a VSA, the above modulation domain measurements can be made on a specific segment of the burst. The capability of a VSA to capture a signal to memory and then post-analyze it means that it is possible to analyze a subset of the captured data. In the case of 802.11g device analysis, it is often very useful to look only at the turn-on transient, preamble, or data portions of the packet. 802.11g may use different modulation techniques in the preamble and data burst, and it may be prudent to examine these areas separately.
It is also worth noting that the large memory and PC-connectivity of some VSAs allows the capture of many bursts at once, and the archiving of these recordings for analysis or comparison at a later date. By applying DSP to this data, it is even possible to shift center frequencies and reduce the span of captured data to fit the analysis needed. Capturing more than is needed in the beginning and then reducing the data afterwards helps ensure that you will have the signal you want to analyze and that you will be able to do as much analysis as is needed.
Figure 12. OFDM EVM versus frequency with spur

This document was formerly known as Application Note 1380-4.
www.keysight.com/find/89600
13 | Keysight | Making 802.11G Transmitter Measurements - Application Note
This information is subject to change without notice.© Keysight Technologies, 2002 - 2017Published in USA, December 5, 20175988-7813ENwww.keysight.com
Final Analysis
In the future, wireless LAN systems may move to higher data rates, wider bandwidths, and more complex modulation techniques. When choosing a measurement system, the future developments of WLAN should be taken into account since these standards continue to evolve. 802.11g is already an extension and homologation of the previous 802.11a and 802.11b standards With the past standards already being updated, current standards being quickly deployed, and future standards requiring even more advanced measurement techniques, choosing a flexible, upgradeable measurement platform will help make WLAN measurements easy, fast, accurate, and informative today and in the future.
Note: All screen captures shown in this note were generated using the Keysight 89600 VSA with the Keysight E4438C vector signal generator as the signal source.