key trends driving fraud transformation in 2021 and beyond
TRANSCRIPT

© 2020 Aite Group LLC. All rights reserved. Reproduction of this report by any means is strictly prohibited. Photocopying or electronic distribution of this document or any of its contents without prior written consent of the publisher violates U.S. copyright law, and is punishable by statutory damages of up to US$150,000 per infringement, plus attorneys’ fees (17 USC 504 et seq.). Without advance permission, illegal copying includes regular photocopying, faxing, excerpting, forwarding electronically, and sharing of online access.
Key Trends Driving Fraud Transformation in 2021 and Beyond
DECEMBER 2020
Trace Fooshée
This report is provided compliments of NuData Security, a
Mastercard company.

Key Trends Driving Fraud Transformation in 2021 and Beyond DECEMBER 2020
© 2020 Aite Group LLC. All rights reserved. Reproduction of this report by any means is strictly prohibited. 101 Arch Street, Suite 501, Boston, MA 02110 • Tel +1.617.338.6050 • Fax +1.617.338.6078 • [email protected] • www.aitegroup.com
2
Lice
nse
d f
or
exte
rnal
dis
trib
uti
on
by:
Nu
Dat
a Se
curi
ty, a
Mas
terc
ard
co
mp
any.
TABLE OF CONTENTS IMPACT POINTS .............................................................................................................................................. 4
INTRODUCTION .............................................................................................................................................. 5
METHODOLOGY ........................................................................................................................................ 5
THE MARKET ................................................................................................................................................... 6
ATTACK PATTERNS SHAPING THE MARKET .................................................................................................... 7
MACRO-LEVEL PATTERNS AND TRAJECTORIES ......................................................................................... 7
WHAT 2020 FRAUD PATTERNS REVEAL .................................................................................................... 8
APPLICATION FRAUD .............................................................................................................................. 13
ACCOUNT TAKEOVER .............................................................................................................................. 16
INVESTMENT DYNAMICS FOR 2021 AND BEYOND ....................................................................................... 18
THE IMPACT OF THE CLIENT EXPERIENCE ............................................................................................... 18
INVESTMENT PRIORITIES ........................................................................................................................ 20
CONCLUSION ................................................................................................................................................ 23
RELATED AITE GROUP RESEARCH ................................................................................................................. 24
ABOUT AITE GROUP...................................................................................................................................... 25
AUTHOR INFORMATION ......................................................................................................................... 25
CONTACT ................................................................................................................................................. 25
LIST OF FIGURES FIGURE 1: THE PRE-EMV FRAUD VALUE CHAIN .............................................................................................. 7
FIGURE 2: THE POST-EMV FRAUD VALUE CHAIN............................................................................................ 8
FIGURE 3: OVERALL TRENDS IN FRAUD LOSSES FROM 2019 TO 2020 ........................................................... 9
FIGURE 4: RATES OF CHANGE IN FRAUD LOSSES FOR 2020 BY FRAUD TYPE ................................................. 9
FIGURE 5: RATES OF CHANGE IN CREDIT CARD FRAUD, 2019 AND 2020 ..................................................... 10
FIGURE 6: RATES OF CHANGE IN DEBIT CARD FRAUD, 2019 AND 2020 ....................................................... 10
FIGURE 7: RATES OF CHANGE IN ACH FRAUD, 2019 AND 2020 ................................................................... 11
FIGURE 8: RATES OF CHANGE IN FIRST-PARTY CHECK FRAUD, 2019 AND 2020 .......................................... 12
FIGURE 9: TRENDS IN FRAUD ATTACK METHODS IN 2020 VS. PRE-PANDEMIC PERIOD .............................. 13
FIGURE 10: RATES OF CHANGE IN MULE ACTIVITY 2020 VS. PRE-PANDEMIC PERIOD ................................ 15
FIGURE 11: IMPACT OF THE PANDEMIC ON E-COMMERCE TRANSACTIONS ............................................... 16
FIGURE 12: RATES OF CHANGE IN ATO ATTACKS 2020 VS. PRE-PANDEMIC PERIOD ................................... 17
FIGURE 13: INFLUENCE OF IMPROVING CLIENT EXPERIENCE IN GETTING INVESTMENTS FUNDED ............ 18
FIGURE 14: ROLES THAT LEADERS PLAY IN FUNDING DECISIONS FOR IDENTITY FRAUD CONTROLS ........... 19
FIGURE 15: ROLES THAT LEADERS PLAY IN FUNDING DECISIONS FOR TRANSACTION MONITORING
CONTROLS ........................................................................................................................................... 20
FIGURE 16: LIKELIHOOD OF TRANSFORMING CAPACITY TO MITIGATE RISKS IN THE NEXT TWO YEARS ..... 21
FIGURE 17: AREAS OF INVESTMENT RECEIVING THE MOST FUNDING ........................................................ 22

Key Trends Driving Fraud Transformation in 2021 and Beyond DECEMBER 2020
© 2020 Aite Group LLC. All rights reserved. Reproduction of this report by any means is strictly prohibited. 101 Arch Street, Suite 501, Boston, MA 02110 • Tel +1.617.338.6050 • Fax +1.617.338.6078 • [email protected] • www.aitegroup.com
3
Lice
nse
d f
or
exte
rnal
dis
trib
uti
on
by:
Nu
Dat
a Se
curi
ty, a
Mas
terc
ard
co
mp
any.
LIST OF TABLES TABLE A: THE MARKET .................................................................................................................................... 6
TABLE B: PRIMARY MANIFESTATIONS OF APPLICATION FRAUD .................................................................. 14

Key Trends Driving Fraud Transformation in 2021 and Beyond DECEMBER 2020
© 2020 Aite Group LLC. All rights reserved. Reproduction of this report by any means is strictly prohibited. 101 Arch Street, Suite 501, Boston, MA 02110 • Tel +1.617.338.6050 • Fax +1.617.338.6078 • [email protected] • www.aitegroup.com
4
Lice
nse
d f
or
exte
rnal
dis
trib
uti
on
by:
Nu
Dat
a Se
curi
ty, a
Mas
terc
ard
co
mp
any.
IMPACT POINTS
• Trends in fraud are often turbulent and inconsistently distributed across financial
institutions in the industry. But despite environmental conditions that have
amplified the variability in loss patterns, some notable themes have persisted and
provide useful insight into what to expect when markets enter a post-pandemic
recovery period.
• Overall patterns in the growth of fraud losses for 2020 reflect a more volatile
distribution relative to those from 2019. While most FIs report net increases in fraud
losses over 2019, fewer FIs are reporting flat rates, and more FIs are reporting
decreases in fraud losses.
• Most of the conventional forms of fraud (e.g., card fraud and check fraud) reflect a
general trend toward slowing rates of growth in 2020 because fraudsters are
targeting government stimulus payments more than banks and their clients during
the pandemic period.
• Growth rates in application fraud, mule activity, first-party fraud, synthetic identity
fraud, and account takeover (ATO) attacks (particularly automated ATO attacks) are
the exception to this slow-growth trend. Fraudsters have leveraged vast inventories
of compromised identities to expand their mule networks in an effort to launder the
proceeds of intercepted stimulus payments and to commit first-party fraud and
synthetic identity fraud.
• As stimulus programs peter out and the effects of the economic downturn resulting
from the pandemic begin to ripple through the industry, it’s reasonable to expect a
shift in priorities among the investments being considered by fraud executives.
• The emphasis on investments to plug gaps in application fraud and ATO control
frameworks will continue to remain strong, particularly in the digital and contact
center channels. These investments are more likely to survive tightening budget
restrictions primarily because they directly support strategic goals to reduce fraud
losses, improve acquisition rates, and improve the efficiency and effectiveness of
service delivery.

Key Trends Driving Fraud Transformation in 2021 and Beyond DECEMBER 2020
© 2020 Aite Group LLC. All rights reserved. Reproduction of this report by any means is strictly prohibited. 101 Arch Street, Suite 501, Boston, MA 02110 • Tel +1.617.338.6050 • Fax +1.617.338.6078 • [email protected] • www.aitegroup.com
5
Lice
nse
d f
or
exte
rnal
dis
trib
uti
on
by:
Nu
Dat
a Se
curi
ty, a
Mas
terc
ard
co
mp
any.
INTRODUCTION
Fighting fraud is a challenge on a good day, and—given the pace of change in the financial
services industry, the increasing pressures to reduce losses without proportionate increases in
investment or operating budgets, the frustrating rate of growth in the volume of financial crime,
and fraudsters’ persistent cleverness—recent history hasn’t seen too many good days. The
economic instability, social unrest, and operational disruptions stemming from the pandemic
have not improved conditions. However, it’s worth noting that the impacts of the pandemic have
not unfolded in the way that many would have guessed. Just as it was difficult to predict how the
pandemic would impact fraud, it’s equally difficult to predict how the ongoing recovery and the
long road back to “normal” will impact fraud.
Despite the exceptionally dynamic nature of the market and its volatility in the last year, a
number of fairly high-level trends provide some insight for fraud executives tasked with
preparing for 2021 and beyond. This report examines the well-established market trends that
are likely to persist as well as some environmental conditions that are likely to accelerate fraud
attacks stemming from identity theft. The market for managing fraud has always been a highly
complex system with incredibly sophisticated and fluid dynamics. In times of crisis, such as they
are in 2020, and during times of recovery, such as they may be in 2021, the market will only get
more complex, more sophisticated, and more fluid.
METHODOLOGY
Aite Group surveyed 47 U.S. financial crimes professionals who attended Aite Group’s Financial
Crime Forum in September 2020 to better understand the current and future environment for
fraud trends. With one exception (Thailand), these financial institutions are in North America,
while the nature of the participating fintech firm allows it to cover a wider geographic area.
For comparisons of data between 2019 and 2020, Aite Group conducted statistical tests of
significance at the 90% level of confidence.
Given the size and structure of the research sample, the data provide a directional indication of
conditions in the market.

Key Trends Driving Fraud Transformation in 2021 and Beyond DECEMBER 2020
© 2020 Aite Group LLC. All rights reserved. Reproduction of this report by any means is strictly prohibited. 101 Arch Street, Suite 501, Boston, MA 02110 • Tel +1.617.338.6050 • Fax +1.617.338.6078 • [email protected] • www.aitegroup.com
6
Lice
nse
d f
or
exte
rnal
dis
trib
uti
on
by:
Nu
Dat
a Se
curi
ty, a
Mas
terc
ard
co
mp
any.
THE MARKET
If 2020 was a surprise for many fraud executives, it’s likely that 2021 will be a bit more
predictable as consumers and businesses adapt to post-pandemic patterns and the economy
begins to stabilize and resume more stable, if potentially sluggish, growth trajectories. Many
trends will conform with larger, macro-level patterns that have been exerting pressure on the
market for years, but others can be expected to either accelerate or decelerate on the whole.
Table A highlights some trends likely to play a role in influencing macro-level patterns in the
market as the world slowly adjusts to the post-pandemic era in 2021 and beyond.
Table A: The Market
Market trends Market implications
Government stimulus payments will ebb, and the fraudsters will shift their focus back to targeting security vulnerabilities at banks and their clients.
Conventional fraud attacks (e.g., card fraud, check fraud, and other forms of payment fraud) will resume pre-pandemic rates and patterns, and may quickly surpass pre-pandemic levels.
Fraudsters will continue to double down on identity-related fraud as they return to the practice of defrauding FIs and their clients.
While card and check fraud attack rates will rebound to pre-pandemic levels, application fraud attacks will continue to grow. There will likely be an acceleration in ATO attacks due partly to overflowing inventories of personally identifiable information (PII) and credentials from the surge in digital adoption in 2020.
As the payments ecosystem evolves and as banks mature their security control frameworks, fraudsters will accelerate their emphasis on attacking the end user directly.
The macro-level pattern of fraud attacks’ slow migration away from the FI’s security in favor of the consumer will resume as economic patterns return to pre-pandemic forms. As new payment options and usage patterns emerge, this trend will begin accelerating. FIs will be increasingly pressured to shore up proactive security precautions to help their clients identify and prevent scam attacks.
So long as the economic recovery drags on, fraud attack volume will continue to increase.
The ranks of those who commission the attacks, as well as the mules who provide logistical support, will continue to increase at the same pace, if not more quickly, as economic conditions remain suppressed. The result will be an increase in the volume of attacks in general but with a particular emphasis on the kinds of fraud that typically accompany prolonged recessions, most notably first-party fraud.
Source: Aite Group

Key Trends Driving Fraud Transformation in 2021 and Beyond DECEMBER 2020
© 2020 Aite Group LLC. All rights reserved. Reproduction of this report by any means is strictly prohibited. 101 Arch Street, Suite 501, Boston, MA 02110 • Tel +1.617.338.6050 • Fax +1.617.338.6078 • [email protected] • www.aitegroup.com
7
Lice
nse
d f
or
exte
rnal
dis
trib
uti
on
by:
Nu
Dat
a Se
curi
ty, a
Mas
terc
ard
co
mp
any.
ATTACK PATTERNS SHAPING THE MARKET
Step one in predicting how market forces will impact investment trends is to lay out the
foundational elements upon which those market forces are based. In that spirit, it’s helpful to
start by reviewing the macro-level patterns in fraud and establishing the trajectory that these
market forces have been following. Once these are established, it is possible to break down each
market trend in the context of recent events and determine whether those recent events have
influenced (or are likely to influence) those trajectories.
MACRO-LEVEL PAT TERNS AND TRAJECTORIES
It’s fairly well-established that contemporary fraud trends follow trajectories that were
significantly altered by the deployment of EMV.1 Specifically, that the deployment of EMV in the
U.S. market forced the fraudsters to shift their revenue streams from those that prioritize stolen
instrument data (e.g., the primary account number) to those that make efficient use of what had
been, up until the mid-2010s, thought of as a byproduct of fraudsters’ industrial-scale data-
mining operations.2 Prior to the deployment of EMV, that data-mining operation focused
primarily on instrument data (Figure 1).
Figure 1: The Pre-EMV Fraud Value Chain
Source: Aite Group
In the post-EMV environment, fraudsters were forced to adopt tactics that could make more
efficient use of the PII byproduct from their existing data-mining operations (Figure 2).
1. See Aite Group’s report EMV: Issuance Trajectory and Impact on Account Takeover and CNP, May
2016.
2. See Aite Group’s report Trends in Account Takeover Fraud for 2019 and Beyond, June 2019.
Manufacturing and distribution
Compromise and theft
Money movement and cash out
Mining raw material
• Supply and demand overwhelmingly favors compromised instrument data
• PII was a byproduct
• Money movement was labor-intensive, required a lot of investment and management, and was risky relative to instrument fraud
• Few online merchants focus on anything beyond what was required for card or check fraud
• ATO attacks depend on compromise tactics that require skill and time
• Application fraud was growing but still difficult

Key Trends Driving Fraud Transformation in 2021 and Beyond DECEMBER 2020
© 2020 Aite Group LLC. All rights reserved. Reproduction of this report by any means is strictly prohibited. 101 Arch Street, Suite 501, Boston, MA 02110 • Tel +1.617.338.6050 • Fax +1.617.338.6078 • [email protected] • www.aitegroup.com
8
Lice
nse
d f
or
exte
rnal
dis
trib
uti
on
by:
Nu
Dat
a Se
curi
ty, a
Mas
terc
ard
co
mp
any.
Figure 2: The Post-EMV Fraud Value Chain
Source: Aite Group
The implications of these shifts in the post-EMV environment would be a lot easier to perceive
with a more robust industrywide fraud taxonomy, which has been a perennial challenge in and
of itself.3 Recent efforts by the Federal Reserve to create a fraud classifier model
4 are a welcome
step in the right direction. This model segments the forensic nature of the event (i.e., who, what,
and how the security compromise occurred, from the perspective of the FI seeking to classify the
event) from the product that was used to facilitate it (e.g., card, check, person-to-person
payment network). A similar approach was leveraged in surveying participants at Aite Group’s
Financial Crime Forum in September 2020, which rendered some useful insights into fraud attack
trends that help to illustrate how fraud attack patterns in the post-EMV environment are shaping
the market.5
WHAT 2020 FRAUD PATTERNS REVEAL
Most fraud executives were predicting net increases in loss in the early days of the pandemic. As
Figure 3 illustrates, compared to trends gathered from the same period last year, a larger
percentage of respondents are reporting decreases across the same range of fraud types in 2020
than in 2019.
3. See Aite Group’s report Key Trends Driving FI Fraud Investments in 2020 and Beyond, November 2019.
4. “Fraud Classifier Model,” Federal Reserve Fed Payments Improvement, accessed October 30, 2020, https://fedpaymentsimprovement.org/strategic-initiatives/payments-security/fraudclassifier-model/.
5. See Aite Group’s report Aite Group’s Third Annual Financial Crime Forum: Collaboration Amid Crisis, October 2020.
• PII is abundant• Glut of supply helps to
drive costs down• Online merchants are
proliferating, specializing, diversifying, and competing
Manufacturing and distribution
Compromise and theft
Money movement and cash out
Mining raw material
Secu
rity
pro
fess
ion
als
Fin
anci
al c
rim
inal
s
• Emphasis begins to turn toward how to overcome identity authentication and verification controls
• Growing inventory of mule accounts

Key Trends Driving Fraud Transformation in 2021 and Beyond DECEMBER 2020
© 2020 Aite Group LLC. All rights reserved. Reproduction of this report by any means is strictly prohibited. 101 Arch Street, Suite 501, Boston, MA 02110 • Tel +1.617.338.6050 • Fax +1.617.338.6078 • [email protected] • www.aitegroup.com
9
Lice
nse
d f
or
exte
rnal
dis
trib
uti
on
by:
Nu
Dat
a Se
curi
ty, a
Mas
terc
ard
co
mp
any.
Figure 3: Overall Trends in Fraud Losses From 2019 to 2020
Source: Aite Group’s survey of 30 financial services fraud executives, September 2019, and Aite Group’s survey of 47 financial services fraud executives, September 2020
Closer inspection of losses reveals that rates of change are not evenly distributed across fraud
types (Figure 4).
Figure 4: Rates of Change in Fraud Losses for 2020 by Fraud Type
Source: Aite Group’s survey of 47 financial services fraud executives, September 2020
When compared to rates of change from 2019, loss rates among aggregate credit card fraud
losses (Figure 5), debit card fraud losses (Figure 6), and ACH fraud losses (Figure 7) reflect a more
varied range of responses in 2020. While the data fail to reflect a statistically significant shift
25%
17%
27%
38%
45%
27% 9% 8%
2019 (n=18)
2020 (n=27)
Q. Please indicate the trend associated with each type of payment fraud, comparing current YTD losses to YTD losses two years ago.
Up 10%or more
Up 1%to 9.9%
Flat/no change
Down 1%to 9.9%
Down 10%or more
27%
23%
23%
17%
13%
10%
3%
33%
30%
23%
40%
33%
40%
47%
7%
17%
33%
17%
17%
10%
23%
17%
50%
7%
3%
7%
13%
10%
7%
17%
7%
7%
10%
13%
7%
10%
10%
30%
13%
20%
13%
13%
20%
ACH fraud losses
Wire fraud losses
Person-to-person fraud losses
Third-party check fraud losses
Credit card fraud losses
First-party check fraud losses
Debit card fraud losses
Internal fraud losses
Q. Please indicate the trend associated with each type of payment fraud, comparing YTD 2020 losses to YTD losses two years ago. (n=30)
Up 10%or more
Up 1%to 9.9%
Flat/no change
Down 1%to 9.9%
Down 10%or more
Notapplicable
Key Trends Driving Fraud Transformation in 2021 and Beyond DECEMBER 2020
© 2020 Aite Group LLC. All rights reserved. Reproduction of this report by any means is strictly prohibited. 101 Arch Street, Suite 501, Boston, MA 02110 • Tel +1.617.338.6050 • Fax +1.617.338.6078 • [email protected] • www.aitegroup.com
10
Lice
nse
d f
or
exte
rnal
dis
trib
uti
on
by:
Nu
Dat
a Se
curi
ty, a
Mas
terc
ard
co
mp
any.
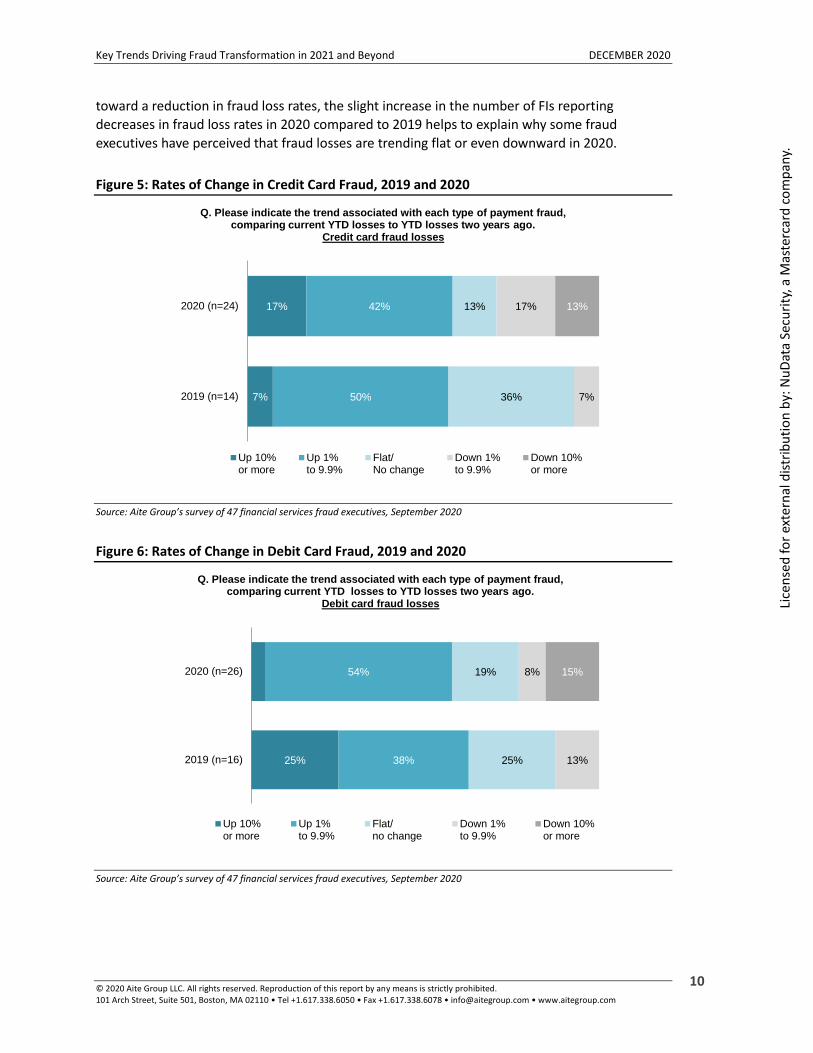
toward a reduction in fraud loss rates, the slight increase in the number of FIs reporting
decreases in fraud loss rates in 2020 compared to 2019 helps to explain why some fraud
executives have perceived that fraud losses are trending flat or even downward in 2020.
Figure 5: Rates of Change in Credit Card Fraud, 2019 and 2020
Source: Aite Group’s survey of 47 financial services fraud executives, September 2020
Figure 6: Rates of Change in Debit Card Fraud, 2019 and 2020
Source: Aite Group’s survey of 47 financial services fraud executives, September 2020
7%
17%
50%
42%
36%
13%
7%
17% 13%
2019 (n=14)
2020 (n=24)
Q. Please indicate the trend associated with each type of payment fraud, comparing current YTD losses to YTD losses two years ago.
Credit card fraud losses
Up 10%or more
Up 1%to 9.9%
Flat/No change
Down 1%to 9.9%
Down 10%or more
25% 38%
54%
25%
19%
13%
8% 15%
2019 (n=16)
2020 (n=26)
Q. Please indicate the trend associated with each type of payment fraud, comparing current YTD losses to YTD losses two years ago.
Debit card fraud losses
Up 10%or more
Up 1%to 9.9%
Flat/no change
Down 1%to 9.9%
Down 10%or more

Key Trends Driving Fraud Transformation in 2021 and Beyond DECEMBER 2020
© 2020 Aite Group LLC. All rights reserved. Reproduction of this report by any means is strictly prohibited. 101 Arch Street, Suite 501, Boston, MA 02110 • Tel +1.617.338.6050 • Fax +1.617.338.6078 • [email protected] • www.aitegroup.com
11
Lice
nse
d f
or
exte
rnal
dis
trib
uti
on
by:
Nu
Dat
a Se
curi
ty, a
Mas
terc
ard
co
mp
any.
Figure 7: Rates of Change in ACH Fraud, 2019 and 2020
Source: Aite Group’s survey of 47 financial services fraud executives, September 2020
Interestingly, the fraud segment that several fraud executives perceive to be on the increase in
2020 is first-party check fraud (Figure 8). Of all of the fraud types included in this section of the
survey, it is the only one among the bunch that’s a direct downstream result of application fraud.
First-party check fraud (also known as deposit fraud or new account fraud) involves a bad actor
who uses a stolen or synthetic identity to create a demand deposit account (DDA) into which the
fraudster deposits items drawn on accounts that are fictitious, closed, or otherwise incapable of
funding the deposited item. If the deposit goes undetected, the bad actor will draw on the credit
provided by the beneficiary bank prior to the fraudulent item returning from the bank of first
deposit.
44%
30%
25%
37%
31%
19% 7% 7%
2019 (n=16)
2020 (n=27)
Q. Please indicate the trend associated with each type of payment fraud, comparing current YTD losses to YTD losses two years ago.
ACH fraud losses
Up 10%or more
Up 1%to 9.9%
Flat/No change
Down 1%to 9.9%
Down 10%or more

Key Trends Driving Fraud Transformation in 2021 and Beyond DECEMBER 2020
© 2020 Aite Group LLC. All rights reserved. Reproduction of this report by any means is strictly prohibited. 101 Arch Street, Suite 501, Boston, MA 02110 • Tel +1.617.338.6050 • Fax +1.617.338.6078 • [email protected] • www.aitegroup.com
12
Lice
nse
d f
or
exte
rnal
dis
trib
uti
on
by:
Nu
Dat
a Se
curi
ty, a
Mas
terc
ard
co
mp
any.
Figure 8: Rates of Change in First-Party Check Fraud, 2019 and 2020
Source: Aite Group’s survey of 47 financial services fraud executives, September 2020
As most fraud executives know, the nature of the fraud risk is not always a direct reflection of
the payment method the fraudsters use to exfiltrate the fruits of their deception. For this
reason, more thoughtful approaches to fraud taxonomies (and surveys to reveal trends in fraud
activity) also include a forensic examination of points of failure. The challenge, of course, is that
these are not consistently tracked by all FIs, owing, again, to the lack of a more robust and
unified prescription for categorizing fraud events and accounting methods. Despite this problem,
and fortunately for the sake of this report, the 47 respondents (responses from the same FI were
de-duped from final results) who participated in Aite Group’s Financial Crime Forum survey were
well enough prepared to provide estimates of the trends in forensic fraud attack patterns in
2020 compared to the pre-pandemic period (Figure 9).
17%
12%
22%
46%
61%
27% 12%
2019 (n=18)
2020 (n=26)
Q. Please indicate the trend associated with each type of payment fraud, comparing current YTD losses to YTD losses two years ago.
First-party check fraud losses
Up 10%or more
Up 1%to 9.9%
Flat/no change
Down 1%to 9.9%
Down 10%or more

Key Trends Driving Fraud Transformation in 2021 and Beyond DECEMBER 2020
© 2020 Aite Group LLC. All rights reserved. Reproduction of this report by any means is strictly prohibited. 101 Arch Street, Suite 501, Boston, MA 02110 • Tel +1.617.338.6050 • Fax +1.617.338.6078 • [email protected] • www.aitegroup.com
13
Lice
nse
d f
or
exte
rnal
dis
trib
uti
on
by:
Nu
Dat
a Se
curi
ty, a
Mas
terc
ard
co
mp
any.
Figure 9: Trends in Fraud Attack Methods in 2020 vs. Pre-Pandemic Period
Source: Aite Group’s survey of 47 financial services fraud executives, September 2020
The growth rates of identity-related fraud now outstrip instrument fraud, such as card and check
fraud. While those types of fraud still account for the lion’s share of losses at most FIs and while
they are still a top priority for fraud executives, fraud attacks that stem from the compromise
and abuse of consumers’ identities are among the things that keep most fraud practitioners up
at night. Chief among the types of fraud that manifest from the swelling rates of compromise
and abuse of consumers’ identities are application fraud and ATO. Unfortunately, fraudsters are
focusing more and more of their efforts on these.
APPLICATION FRAUD
As 2020 unfolded and the effects of the pandemic came to be better understood, many were
surprised to see losses from instrument fraud attacks (e.g., card and check fraud) flatten or, for
some FIs, even recede. Closer inspection of the trends reveals that the root cause of the flat
losses in instrument fraud is less about disruptions in the fraudsters’ operating model (though
that surely plays a role in shaping the patterns of 2020) than it is about the fraudsters’
preoccupations with intercepting government stimulus payments.6 To better understand the
drivers behind the growth of application fraud (Figure 9), it’s helpful to understand its three
primary manifestations and how those types of fraud relate to the broader trends in fraud for
2020 (Table B).
6. See Aite Group’s report Application Fraud: Accelerating Attacks and Compelling Investment
Opportunities, November 2020.
29%
21%
25%
43%
32%
14%
7%
54%
57%
46%
29%
32%
39%
39%
14%
18%
21%
25%
29%
39%
43%
7%
7%
Phishing
Application fraud
Synthetic identity fraud
Mule activity
ATO
Business emailcompromise
Income tax fraud
Q. Please indicate the trend associated with each kind of fraud attack, comparing attack rates today to attack rates prior to the pandemic. (n=28)
Up 10%or more
Up 1%to 9.9%
Flat Down 1%to 9.9%
Down 10%or more

Key Trends Driving Fraud Transformation in 2021 and Beyond DECEMBER 2020
© 2020 Aite Group LLC. All rights reserved. Reproduction of this report by any means is strictly prohibited. 101 Arch Street, Suite 501, Boston, MA 02110 • Tel +1.617.338.6050 • Fax +1.617.338.6078 • [email protected] • www.aitegroup.com
14
Lice
nse
d f
or
exte
rnal
dis
trib
uti
on
by:
Nu
Dat
a Se
curi
ty, a
Mas
terc
ard
co
mp
any.
Table B: Primary Manifestations of Application Fraud
Term Definition
First-party fraud First-party fraud refers to any fraud committed against a financial institution or merchant by one of its own customers. The most common forms are first-party check fraud (commonly referred to as deposit fraud) and credit card bust-outs.
Mule activity Mules are account holders who receive money into their accounts and transfer it elsewhere for a fee. Mule activity, then, is the collective amount of illegally transferred funds.
Synthetic identity fraud A synthetic identity is not associated with an actual, real person, and fraudsters create it by using a combination of fabricated credentials. Synthetic identity fraud is when a fraudster uses such an identity to make multiple payments (usually on a line of credit) with no intention of paying it back.
Source: Aite Group
The fraud types that have conventionally garnered the greatest amount of investment dollars to
stem their growth (at least relative to mule activity and synthetic identity fraud) are the most
common types of first-party fraud. The reasons for this are relatively straightforward. It’s fairly
easy to draw a straight line from readily identifiable losses (in the form of first-party check fraud
losses and credit card bust-out losses) to failures in the application fraud control framework.
First-party fraud has been a staple of the fraudster’s operating model for decades and remains a
popular form of attack today. While some disagree, many fraud practitioners believe that attack
rates in first-party fraud correlate with economic downturns. Several fraud executives
interviewed for this report point to recent increases in “good client gone bad” scenarios as
illustrations of this implication. An example of a “good client gone bad” in a DDA scenario is
when an account holder with a well-established tenure and a positive history of account activity
begins making one or more fraudulent deposits and attempts to cash out before the suspect
deposit clears. This is frequently the result of the client falling on hard times economically and
seeing little or no options for legitimate forms of income. Regardless, first-party fraud is a
reliable source of revenue for many fraudsters. So long as it is easy and cost-effective to
purchase stolen or synthetic identities from unscrupulous marketplaces on the deep and dark
webs, losses from first-party fraud will remain positive and stable.
Synthetic identity fraud also has a demonstrably stable rate of growth for many of the same
reasons. It’s a lucrative revenue stream for the fraudsters and has multiple ways of returning
value for them. Fraudsters can use the synthetic identity to commit first-party fraud or to create
and manage mule accounts that they control directly. Many believe that this is one of the faster-
growing uses of synthetic identities, particularly given what one fraud executive described as the
“explosive growth in mule activity” that many FIs have reported in 2020 (Figure 10).

Key Trends Driving Fraud Transformation in 2021 and Beyond DECEMBER 2020
© 2020 Aite Group LLC. All rights reserved. Reproduction of this report by any means is strictly prohibited. 101 Arch Street, Suite 501, Boston, MA 02110 • Tel +1.617.338.6050 • Fax +1.617.338.6078 • [email protected] • www.aitegroup.com
15
Lice
nse
d f
or
exte
rnal
dis
trib
uti
on
by:
Nu
Dat
a Se
curi
ty, a
Mas
terc
ard
co
mp
any.
Figure 10: Rates of Change in Mule Activity 2020 vs. Pre-Pandemic Period
Source: Aite Group’s survey of 47 financial services fraud executives, September 2020
While the environmental conditions resulting from the pandemic can reasonably be considered
to be “special causes” for the acceleration in application fraud and its derivative, downstream
forms, it’s important to remember that it was trending positively as one of the areas of greatest
concern for fraud executives well prior to the events of 2020. Three noteworthy implications are
associated with the long-term trend of increasing rates of application fraud:
• There are multiple (good) reasons to prioritize application fraud control
investment: First-party fraud losses and improving and optimizing the application
process are the most tangible business-case drivers, but synthetics and mule activity
are beginning to occupy greater mindshare among those advocating for and
approving investments in the transformation of application fraud controls.
• Growth rates in fraud stemming from widespread identity theft are here to stay:
Application fraud and ATO have demonstrated that they are the fraudster’s path to
revenue expansion. As the fraudsters innovate and continue to scale their attacks
upward, FIs would be wise to continue to prioritize investments aimed at bolstering
their defenses in these areas.
• Much room for improvement remains: As details emerge about the scale of impact
from synthetic identity fraud and mule activity, it will become painfully clear to many
FIs just how much value there is in transforming their application fraud control
frameworks.
Up 10% or more
43%
Up 1% to 9.9%
29%
Flat25%
Down 1% to 9.9%
0%
Down 10% or more
3%
Trends in Mule Activity (n=28)
Key Trends Driving Fraud Transformation in 2021 and Beyond DECEMBER 2020
© 2020 Aite Group LLC. All rights reserved. Reproduction of this report by any means is strictly prohibited. 101 Arch Street, Suite 501, Boston, MA 02110 • Tel +1.617.338.6050 • Fax +1.617.338.6078 • [email protected] • www.aitegroup.com
16
Lice
nse
d f
or
exte
rnal
dis
trib
uti
on
by:
Nu
Dat
a Se
curi
ty, a
Mas
terc
ard
co
mp
any.
ACCOUNT TAKEOVER
ATO has been an increasingly significant source of anxiety among fraud executives for years. Like
application fraud, the root cause driving much of the growth has been the proliferation of the
raw material that makes the fraud accessible to bad actors. The pace of data breaches that
produce that raw material shows no sign of slowing and has also proved resistant to the
environmental conditions that have disrupted virtually every other commercial enterprise. In
fact, many fraud executives have made the argument that, if anything, the environmental
conditions brought about by the pandemic will only accelerate the output of fraudsters’
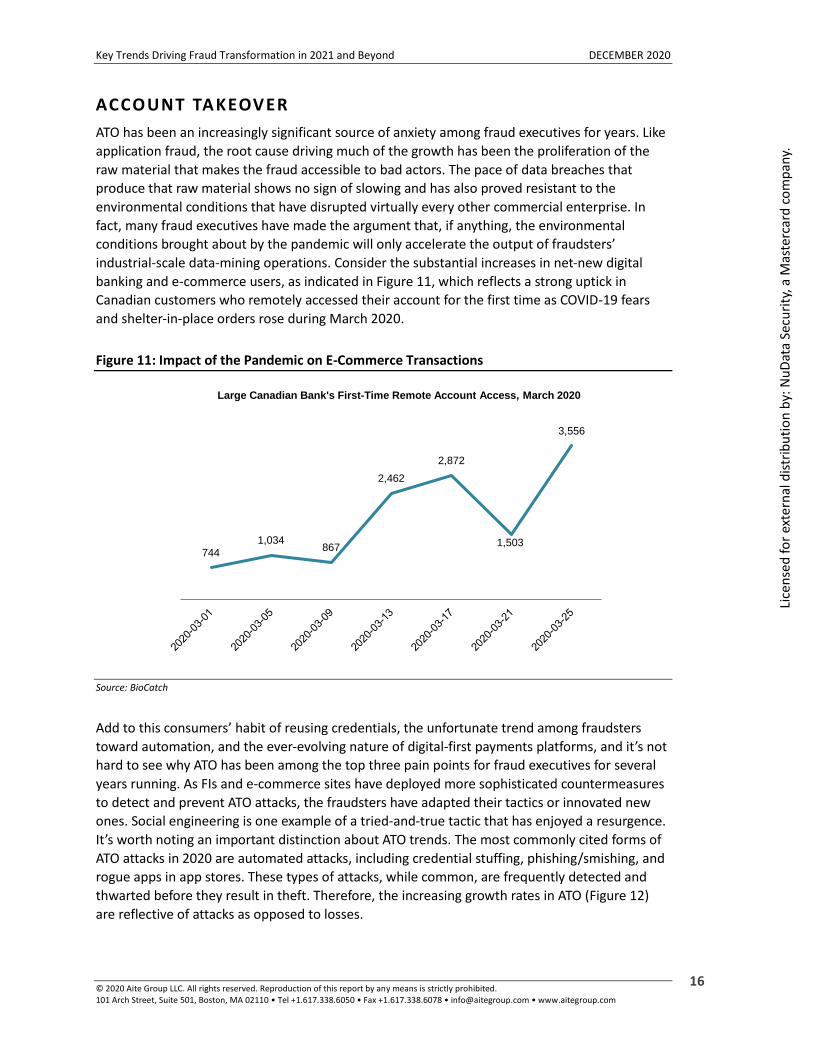
industrial-scale data-mining operations. Consider the substantial increases in net-new digital
banking and e-commerce users, as indicated in Figure 11, which reflects a strong uptick in
Canadian customers who remotely accessed their account for the first time as COVID-19 fears
and shelter-in-place orders rose during March 2020.
Figure 11: Impact of the Pandemic on E-Commerce Transactions
Source: BioCatch
Add to this consumers’ habit of reusing credentials, the unfortunate trend among fraudsters
toward automation, and the ever-evolving nature of digital-first payments platforms, and it’s not
hard to see why ATO has been among the top three pain points for fraud executives for several
years running. As FIs and e-commerce sites have deployed more sophisticated countermeasures
to detect and prevent ATO attacks, the fraudsters have adapted their tactics or innovated new
ones. Social engineering is one example of a tried-and-true tactic that has enjoyed a resurgence.
It’s worth noting an important distinction about ATO trends. The most commonly cited forms of
ATO attacks in 2020 are automated attacks, including credential stuffing, phishing/smishing, and
rogue apps in app stores. These types of attacks, while common, are frequently detected and
thwarted before they result in theft. Therefore, the increasing growth rates in ATO (Figure 12)
are reflective of attacks as opposed to losses.
744
1,034867
2,462
2,872
1,503
3,556
Large Canadian Bank's First-Time Remote Account Access, March 2020

Key Trends Driving Fraud Transformation in 2021 and Beyond DECEMBER 2020
© 2020 Aite Group LLC. All rights reserved. Reproduction of this report by any means is strictly prohibited. 101 Arch Street, Suite 501, Boston, MA 02110 • Tel +1.617.338.6050 • Fax +1.617.338.6078 • [email protected] • www.aitegroup.com
17
Lice
nse
d f
or
exte
rnal
dis
trib
uti
on
by:
Nu
Dat
a Se
curi
ty, a
Mas
terc
ard
co
mp
any.
Figure 12: Rates of Change in ATO Attacks 2020 vs. Pre-Pandemic Period
Source: Aite Group’s survey of 47 financial services fraud executives, September 2020
In summary, application fraud and automated ATO attacks are bucking the trend among
conventional types of fraud toward relatively slower growth rates. The consistently increasing
growth rates in both over the last several years are tied directly to the proliferation of
compromised identities and credentials that are, in turn, accelerating as a function of not only
environmental conditions but also the macroeconomic shift toward digital commerce. Given
these points, it’s reasonable to expect that fraudsters will continue to expand their operations
into application fraud and ATO in 2021. In fact, considering the likelihood that the government
stimulus programs will eventually give way to organic economic growth resulting from a post-
pandemic economic recovery, it’s also likely that the fraudsters’ attention will once again return
to targeting FIs and their clients. The return of bank fraud to pre-pandemic levels of attack rates
will sustain demand for stolen and synthetic identities as well as mule accounts. In addition to
this, fraudsters will be seeking to replace the void in revenue left by waning stimulus programs
and are as likely to fill that void with ATO attacks as they are with more conventional forms of
payment fraud.
Up 10% or more
32%
Up 1% to 9.9%
32%
Flat28%
Down 1% to 9.9%
4%
Down 10% or more
4%
Trends in Account Takeover (n=28)

Key Trends Driving Fraud Transformation in 2021 and Beyond DECEMBER 2020
© 2020 Aite Group LLC. All rights reserved. Reproduction of this report by any means is strictly prohibited. 101 Arch Street, Suite 501, Boston, MA 02110 • Tel +1.617.338.6050 • Fax +1.617.338.6078 • [email protected] • www.aitegroup.com
18
Lice
nse
d f
or
exte
rnal
dis
trib
uti
on
by:
Nu
Dat
a Se
curi
ty, a
Mas
terc
ard
co
mp
any.
INVESTMENT DYNAMICS FOR 2021 AND BEYOND
Market forces and environmental conditions certainly influence fraud trends, and those trends in
turn influence investment priorities among FIs looking to improve their capacity to manage
fraud. Those fraud trends are hardly alone, however, in shaping those priorities.
THE IMPACT OF THE CL IENT EXPERIENC E
Another recurring theme that is arguably as strong, if not stronger, than the fraudster’s proclivity
for fraud attacks that depend on identity theft and that has been trending as consistently is the
degree to which improving the client experience influences investment priorities. The majority
of the 26 fraud executives who attended Aite Group’s Financial Crime Forum (65%) indicate that
client experience plays a greater role in getting investments funded today than ever in the past
two years (Figure 13).
Figure 13: Influence of Improving Client Experience in Getting Investments Funded
Source: Aite Group’s survey of 47 financial services fraud executives, September 2020
The ongoing emphasis on improving the client experience affects which transformation
initiatives are prioritized. While loss prevention is the priority among fraud executives, the same
perspective is not necessarily shared by the leaders of lines of business, channel- and product-
strategy teams, and operations units, who are playing increasingly influential roles in securing
funding for investments. Leaders of these areas are sensitive to security concerns, of course, but
they prioritize investments that support their primary goals: better usability, service delivery,
and revenue generation. It’s exceptionally difficult to determine the degree to which this trend
affects investment decisions for two reasons:
65%
31%
4%
Improving client experience plays agreater role in getting investments funded
Improving client experience plays aboutthe same role that it always has in getting
investments funded
Improving client experience plays a lesserrole in getting investments funded
Q. Has your firm shifted the priority that improving the client experience plays in funding investments in fraud and security over the last two
years? (n=26)

Key Trends Driving Fraud Transformation in 2021 and Beyond DECEMBER 2020
© 2020 Aite Group LLC. All rights reserved. Reproduction of this report by any means is strictly prohibited. 101 Arch Street, Suite 501, Boston, MA 02110 • Tel +1.617.338.6050 • Fax +1.617.338.6078 • [email protected] • www.aitegroup.com
19
Lice
nse
d f
or
exte
rnal
dis
trib
uti
on
by:
Nu
Dat
a Se
curi
ty, a
Mas
terc
ard
co
mp
any.
• No two FIs are organized in the same manner, nor are the roles exactly the same
from one FI to the next.
• There is a lot of experimentation in organizational structures and leadership roles as
FIs seek to find what works best for them to meet strategic objectives, which
generally trend toward maturing digital sales and service capabilities.
Participants in Aite Group’s Financial Crime Forum survey demonstrate some consensus on these
leaders’ roles in investment decisions. Interestingly, the roles that leaders play differ depending
on the nature of the investment. However, the data are not sufficiently granular to reveal
insights into the specific business unit or the precise nature of the leader’s influence. Figure 14
illustrates the roles that generic classes of executives play in the funding process for identity
fraud control solutions.
Figure 14: Roles That Leaders Play in Funding Decisions for Identity Fraud Controls
Source: Aite Group’s survey of 47 financial services fraud executives, September 2020
Given the variability in organizational structures across FIs and the high degree of nuance not
only in the roles but in the nature of their influence, it’s difficult to draw firm conclusions from
the data. When compared to how these same roles influence investments in transaction
monitoring control, however, some basic insights emerge (Figure 15).
29%
21%
7%
7%
50%
25%
25%
18%
25%
21%
14%
11%
14%
11%
36%
39%
32%
39%
50%
32%
36%
39%
7%
14%
29%
11%
11%
32%
29%
21%
11%
11%
14%
14%
21%
14%
18%
21%
25%
Fraud risk/policy leader
Fraud operations leader
Operations risk leader
AML risk leader
Product leader
IT leader
Operations unit leader
Business unit leader (e.g.,wealth unit leader)
Channel leader
Primarysponsor
Co-sponsor Endorsementrequired
Endorsementnot required
Notapplicable
Q. What is the involvement of each of the following roles in facilitating investment funding decisions for identity fraud control solutions (e.g., authentication, identity
verification, or orchestration hub solutions)? (n=28)

Key Trends Driving Fraud Transformation in 2021 and Beyond DECEMBER 2020
© 2020 Aite Group LLC. All rights reserved. Reproduction of this report by any means is strictly prohibited. 101 Arch Street, Suite 501, Boston, MA 02110 • Tel +1.617.338.6050 • Fax +1.617.338.6078 • [email protected] • www.aitegroup.com
20
Lice
nse
d f
or
exte
rnal
dis
trib
uti
on
by:
Nu
Dat
a Se
curi
ty, a
Mas
terc
ard
co
mp
any.
Figure 15: Roles That Leaders Play in Funding Decisions for Transaction Monitoring Controls
Source: Aite Group’s survey of 47 financial services fraud executives, September 2020
Many FIs have reported a shift toward bifurcating the roles of fraud policy leader and fraud
operations leader, reflecting the trend among operational risk programs toward separating the
responsibility of managing risk from that of managing an operational unit. Business unit leaders
(i.e., those who manage the profit and loss for whole divisions, such as wealth and investment
management, consumer banking, or small-business banking) seem to have more influence in
transaction monitoring control investments. Similarly, product and channel leaders appear to
have more influence over identity fraud control investments than they do over transaction
monitoring control investments. Interestingly, neither seem to exercise as much influence over
investment decisions as would be expected, given the increasingly influential role that improving
client experience plays in security investment funding decisions as a whole.
INVESTMENT PRIORIT IES
If it is not readily apparent that the client experience influences decision-makers in the
investment process, it shows through a bit more clearly when examined through the lens of
investment priorities. All of the areas for investment listed in Figure 16 can be said to be
primarily rooted in shoring up security. Still, the top four areas (authentication solutions,
application fraud solutions, channel controls, and contact center fraud mitigation) are arguably
the most likely to deliver tangible improvements to the client experience as well as to security.
36%
32%
14%
11%
11%
7%
7%
46%
32%
7%
21%
7%
25%
7%
14%
7%
7%
25%
21%
29%
25%
36%
54%
43%
32%
36%
25%
39%
18%
18%
18%
32%
11%
11%
21%
14%
18%
14%
14%
21%
25%
Fraud risk/policy leader
Fraud operations leader
Business unit leader (e.g.,wealth unit leader)
AML risk leader
Operations unit leader
Operations risk leader
IT leader
Product leader
Channel leader
Q. What is the involvement of each of the following roles in facilitating investment funding decisions for fraud transaction monitoring solutions?
(n=28)
Primarysponsor
Co-sponsor Endorsementrequired
Endorsementnot required
Notapplicable

Key Trends Driving Fraud Transformation in 2021 and Beyond DECEMBER 2020
© 2020 Aite Group LLC. All rights reserved. Reproduction of this report by any means is strictly prohibited. 101 Arch Street, Suite 501, Boston, MA 02110 • Tel +1.617.338.6050 • Fax +1.617.338.6078 • [email protected] • www.aitegroup.com
21
Lice
nse
d f
or
exte
rnal
dis
trib
uti
on
by:
Nu
Dat
a Se
curi
ty, a
Mas
terc
ard
co
mp
any.
Figure 16: Likelihood of Transforming Capacity to Mitigate Risks in the Next Two Years
Source: Aite Group’s survey of 47 financial services fraud executives, September 2020
Viewed through the prism of which areas are getting the most funding, Figure 17 reflects the
emphasis that FIs are placing on controlling fraud attacks stemming from identity theft.
15%
18%
15%
21%
18%
24%
24%
24%
21%
21%
15%
15%
6%
24%
12%
48%
45%
30%
18%
30%
27%
33%
21%
21%
24%
12%
21%
18%
9%
12%
33%
30%
48%
45%
33%
27%
21%
27%
30%
24%
39%
30%
42%
30%
15%
6%
6%
15%
18%
21%
21%
27%
27%
30%
33%
33%
33%
36%
61%
Authentication solutions
Application fraud solutions
Channel controls (self-servicecard/payment controls, alerts, etc.)
Contact center fraud mitigation
Real-time payments fraud solutions forperson-to-person/Zelle and/or RTP
Card fraud
ACH/wire fraud solutions
Robotic process automation for fraudprocesses
Interactive voice response (IVR)monitoring solutions
Case management solutions
Elder abuse solutions
Check fraud
Mule activity detection
Internal fraud solutions
Human trafficking
Q. How likely is your firm to engage in transforming (making substantive change vs. ongoing tweaking) its capacity to mitigate the risk of the following types of challenges in
the next one to two years? (n=33)
Already has upgraded or invested Very likely Likely Not likely

Key Trends Driving Fraud Transformation in 2021 and Beyond DECEMBER 2020
© 2020 Aite Group LLC. All rights reserved. Reproduction of this report by any means is strictly prohibited. 101 Arch Street, Suite 501, Boston, MA 02110 • Tel +1.617.338.6050 • Fax +1.617.338.6078 • [email protected] • www.aitegroup.com
22
Lice
nse
d f
or
exte
rnal
dis
trib
uti
on
by:
Nu
Dat
a Se
curi
ty, a
Mas
terc
ard
co
mp
any.
Figure 17: Areas of Investment Receiving the Most Funding
Source: Aite Group’s survey of 47 financial services fraud executives, September 2020
While it’s exceptionally challenging to predict how the economic recovery will unfold in 2021
and what impacts it has in store for fraud, many fraud executives are already planning for tighter
operating and investment budgets in the coming year. This is partly the result of anticipated
increases in credit charge-offs and reductions in fee revenue, but some also point to the slowing
rates of growth in fraud losses as potential drivers for belt-tightening. If those predictions evolve
into reality, these priorities will likely be revisited. Some fraud executives have pointed out that
despite early efforts to rein in budgets, application fraud projects and authentication projects
have survived. This observation underscores the relative degree of priority that these
transformation initiatives have in terms of supporting more robust service delivery capabilities
and the compelling business cases behind them. It’s also noteworthy that investments in
channel authentication controls (particularly investments for the contact center but also
investments that can automate frequent service interactions, such as in IVR controls) can often
reduce service delivery costs by cutting handle times or shunting more interactions to digital
channels. This adds yet more credit to the notion that these areas of investment will remain
firmly in place through the next year at least.
37%
30%
27%
23%
20%
17%
13%
10%
10%
7%
Identity verification controls/application fraudcontrols
Digital identity authentication controls
Contact center identity authentication controls
Case management and/or alert management
Omnichannel identity authentication controls
Card payment transaction monitoring controls
Deposit fraud transaction monitoring controls
Noncard payment transaction monitoring controls(person-to-person, RTP, ACH, and/or wire)
Orchestration hub
Other
Q. Which two areas are getting the most funding in terms of investment/transformation? (n=30; Select up to two)

Key Trends Driving Fraud Transformation in 2021 and Beyond DECEMBER 2020
© 2020 Aite Group LLC. All rights reserved. Reproduction of this report by any means is strictly prohibited. 101 Arch Street, Suite 501, Boston, MA 02110 • Tel +1.617.338.6050 • Fax +1.617.338.6078 • [email protected] • www.aitegroup.com
23
Lice
nse
d f
or
exte
rnal
dis
trib
uti
on
by:
Nu
Dat
a Se
curi
ty, a
Mas
terc
ard
co
mp
any.
CONCLUSION
FIs:
• As government stimulus programs peter out and economic recovery gains
momentum, fraudsters will return to targeting FIs and their clients.
• At best, fraudsters’ return to targeting FIs and FI clients will translate to sustained
growth rates in application fraud and ATO attacks. At worst, this will mean even
sharper increases as fraudsters seek to fill the void in revenue left by the absence of
stimulus programs.
• Be cognizant of the potential for increased scrutiny from regulators or potential
increases in reputational risk in the event that investigations into waste and abuse of
government stimulus programs reveal widespread abuse of application fraud
controls or ATO detection controls.
Solution providers:
• Be attentive to the shifting landscape of decision-makers in investment prioritization
and various stakeholders’ unique needs.
• Be aware of shifting priorities. Loss avoidance still occupies the top spot for fraud
executives, and it still retains the top spot for decision-makers for most kinds of
investments, so your solution’s impact on loss reduction will remain the most
important dimension of the business case.
• As FIs expanding digital sales and service capacities experience growing pains, the
client experience will also remain a particularly important dimension of the business
case. This is especially true for application fraud and authentication solution
providers, and particularly when it comes to influencing stakeholders in the fraud
executive’s orbit.
• As budgets begin to tighten in the wake of the economic disruption of 2020, be
aware of increasing emphasis on how your solution can reduce costs or help to
either automate pain points or drive customers to more automated channels.

Key Trends Driving Fraud Transformation in 2021 and Beyond DECEMBER 2020
© 2020 Aite Group LLC. All rights reserved. Reproduction of this report by any means is strictly prohibited. 101 Arch Street, Suite 501, Boston, MA 02110 • Tel +1.617.338.6050 • Fax +1.617.338.6078 • [email protected] • www.aitegroup.com
24
Lice
nse
d f
or
exte
rnal
dis
trib
uti
on
by:
Nu
Dat
a Se
curi
ty, a
Mas
terc
ard
co
mp
any.
RELATED AITE GROUP RESEARCH
Application Fraud: Accelerating Attacks and Compelling Investment Opportunities, November
2020.
Aite Group’s Third Annual Financial Crime Forum: Collaboration Amid Crisis, October 2020.
Key Trends Driving FI Fraud Investments in 2020 and Beyond, November 2019.
Trends in Account Takeover Fraud for 2019 and Beyond, June 2019.

Key Trends Driving Fraud Transformation in 2021 and Beyond DECEMBER 2020
© 2020 Aite Group LLC. All rights reserved. Reproduction of this report by any means is strictly prohibited. 101 Arch Street, Suite 501, Boston, MA 02110 • Tel +1.617.338.6050 • Fax +1.617.338.6078 • [email protected] • www.aitegroup.com
25
Lice
nse
d f
or
exte
rnal
dis
trib
uti
on
by:
Nu
Dat
a Se
curi
ty, a
Mas
terc
ard
co
mp
any.
ABOUT AITE GROUP
Aite Group is a global research and advisory firm delivering comprehensive, actionable advice on
business, technology, and regulatory issues and their impact on the financial services industry.
With expertise in banking, payments, insurance, wealth management, and the capital markets,
we guide financial institutions, technology providers, and consulting firms worldwide. We
partner with our clients, revealing their blind spots and delivering insights to make their
businesses smarter and stronger. Visit us on the web and connect with us on Twitter and
LinkedIn.
AUTHOR INFORMATION
Trace Fooshée
+1.857.406.3515
Research Design & Data:
Judy Fishman
+1.617.338.6067
CONTACT
For more information on research and consulting services, please contact:
Aite Group Sales
+1.617.338.6050
For all press and conference inquiries, please contact:
Aite Group PR +1.617.398.5048
For all other inquiries, please contact: