key figures 2017 - cargotec.com · hiab. kalmar *excluding restructuring costs. key figures 2017....
TRANSCRIPT

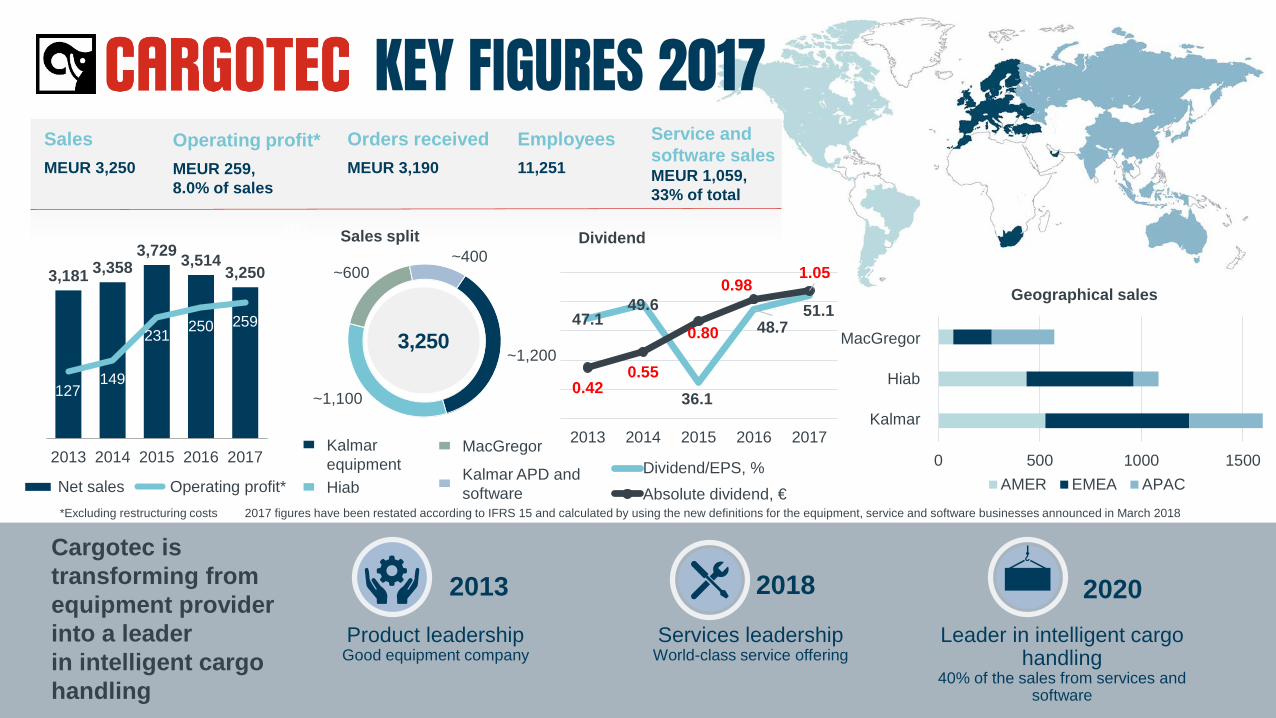
47.149.6
36.1
48.751.1
0.420.55
0.80
0.981.05
00.20.40.60.811.2
30
35
40
45
50
55
2013 2014 2015 2016 2017
Dividend/EPS, %Absolute dividend, €
Orders receivedMEUR 3,190
SalesMEUR 3,250
Operating profit*MEUR 259,8.0% of sales
Employees11,251
Product leadershipGood equipment company
Services leadershipWorld-class service offering
Leader in intelligent cargo handling
40% of the sales from services and software
20182013 2020
3,181 3,3583,729 3,514
3,250
127149
231 250 259
050100150200250300350400
2013 2014 2015 2016 2017
Net sales Operating profit*
Service and software salesMEUR 1,059,33% of total
Cargotec is transforming from equipment provider into a leaderin intelligent cargo handling
3,250
KalmarequipmentHiab
MacGregor
Kalmar APD andsoftware
~400~600
~1,100
~1,200
0 500 1000 1500
Kalmar
Hiab
MacGregor
Geographical sales
AMER EMEA APAC
MacGregor
Hiab
Kalmar
*Excluding restructuring costs
KEY FIGURES 2017
Sales split Dividend
2017 figures have been restated according to IFRS 15 and calculated by using the new definitions for the equipment, service and software businesses announced in March 2018

World-class service offering
Lead digitalisation
Build world-class leadership
Our must-wins
583 634
787840 852
18.3 18.921.1
23.926.2
2013 2014 2015 2016 2017
Gross profit MEUR Gross profit -%
578 719 622
503472
46.7 %
59.2 %
46.4 %
36.0 % 33.1 %
2013 2014 2015 2016 2017
Net debt MEUR Gearing-%
Grow faster than the market
Cargotec operating profit margin 10% in 3-5 years
Service and Software sales 40% of net sales, minimum EUR 1.5 billion in 3-5 years
Increasing dividend in the range of 30-50% of EPS, dividend paid twice a year
15% ROCE in 3-5 years
Gearing below 50%
Financial targets
181 204
315373
253
2013 2014 2015 2016 2017
Cash flow from operationsMEUR
Urbanisation Digitalisation Population growth Energy demand GDP growth per capita
Environmental awareness
Megatrends supporting our business
Gross profit
Market positionin all major segments
Net debt and gearing
766 847 931 905 907
107108
121 148 152
2013 2014 2015 2016 2017
Services Software
1,0601,0531,052955
873
Service and software* sales
*) Software sales defined as Navisbusiness unit and automation software
2017 figures have been restated according to IFRS 15 and calculated by using the new definitions for the equipment, service and software businesses announced in March 2018