key factors in profitable sheep production
DESCRIPTION
Key Factors in Profitable Sheep Production. DGM:ISU. Current Prices. Sheep Numbers are not increasing. Why ????. DGM:ISU. Basic Economics Profit = Income - Expenses. Increase Income or Decrease Expenses or DO BOTH. DGM:ISU. Critical Records for Every Operation. - PowerPoint PPT PresentationTRANSCRIPT

Key Factors in Key Factors in Profitable SheepProfitable Sheep
ProductionProduction
DGM:ISU

Current PricesCurrent Prices
Sheep Numbers are not increasing.
Why ????
DGM:ISU

Basic EconomicsProfit = Income - Expenses
Increase Incomeor
Decrease Expensesor
DO BOTH DGM:ISU

Total Number BornTotal Number Weaned% Lamb Survival% Open Ewes% Ewe Death Loss
Critical Records for Every Operation
DGM:ISU

Critical Records for Every Operation
Feed Use Feed Cost
Until one keeps track,
amount is hard to believe.DGM:ISU

Ewe Cash Costs, Pipestone
2002 39.10 27.38 66.482003 42.84 36.91 79.752004 45.38 34.65 80.032005 48.84 47.34 96.18Aver. 44.04 36.57 80.61
Utilities, Fuel, Vet, Trucking, Feed processing, Hired labor, Shearing, Maintenance and repairs, Bedding.
Feed & Other TotalPasture Oper. Casha

10 steps to reduce feed costs
1. Control feed waste
good bunks
feed what ewes need
not what ewes want
limit access to big packages
10 steps to reduce feed costs10 steps to reduce feed costs
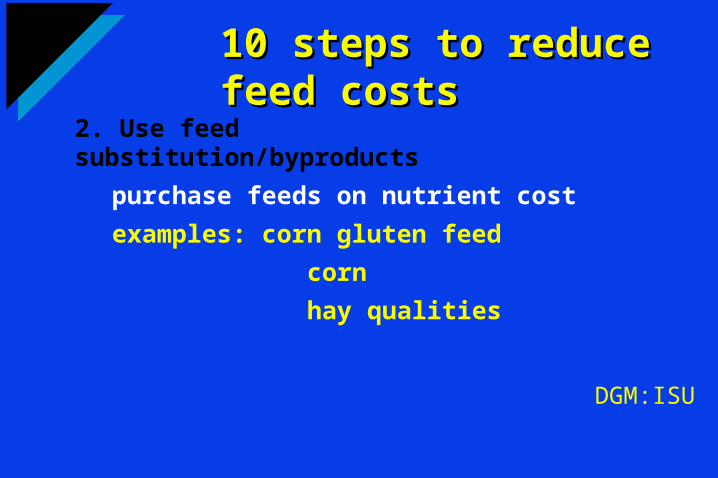
2. Use feed substitution/byproducts
purchase feeds on nutrient cost
examples: corn gluten feed
corn
hay qualities
DGM:ISU
10 steps to reduce feed costs10 steps to reduce feed costs
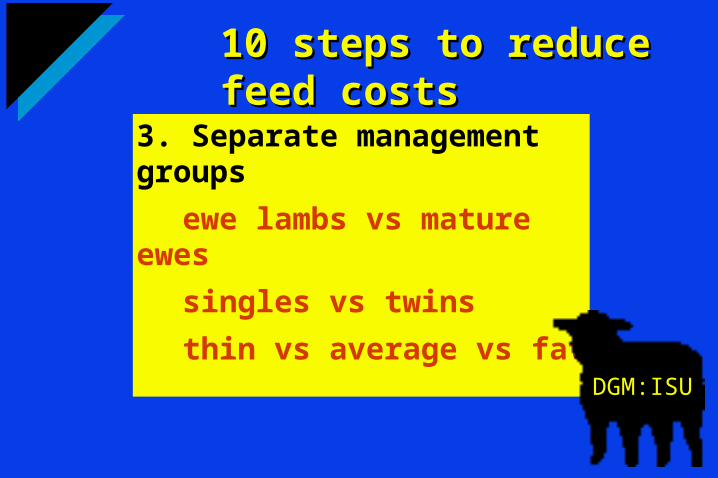
3. Separate management groups
ewe lambs vs mature ewes
singles vs twins
thin vs average vs fat
DGM:ISU

10 steps to reduce feed costs
4. Mineral cost and intake
Read label
know intake level
TM salt vs mineral
cooperative purchasingDGM:ISU

10 steps to reduce feed costs
5. Sample hays
supplement as needed
example: protein blocks
“They might need it”
DGM:ISU

10 steps to reduce feed costs10 steps to reduce feed costs
6. Pelleted protein vs. soybean meal
protein supplement @ >$300/ton
SBM @$220/ton with
more protein per pound
DGM:ISU

19871987 3.13.1 17.117.1
19881988 4.44.4 17.017.0
19891989 3.63.6 17.117.1
19901990 9.19.1 18.118.1
19911991 3.53.5 18.018.0
19921992 3.73.7 19.619.6
AverageAverage 4.64.6 17.817.8
SERPSERP DGM:ISUDGM:ISU
YearYear PasturePasture DrylotDrylot
7. Improved grazing management
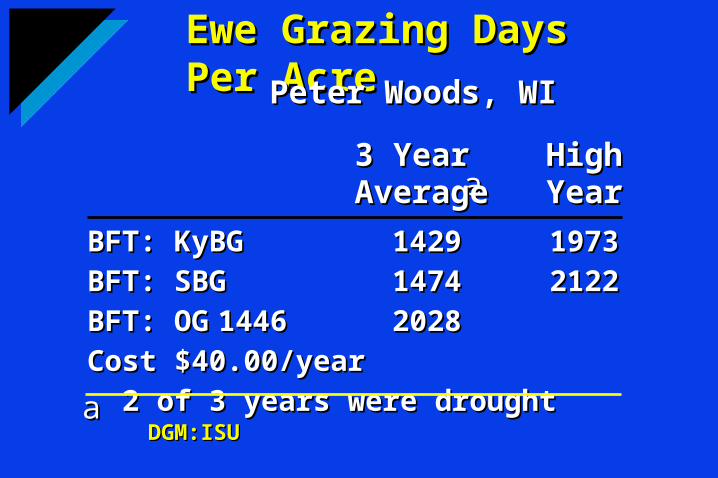
Ewe Grazing Days Per Ewe Grazing Days Per AcreAcre
BFT: KyBGBFT: KyBG 14291429 19731973
BFT: SBGBFT: SBG 14741474 21222122
BFT: OGBFT: OG 14461446 20282028
Cost $40.00/yearCost $40.00/year
2 of 3 years were drought2 of 3 years were drought DGM:ISUDGM:ISU
Peter Woods, WIPeter Woods, WI
aa
aa
3 Year 3 Year HighHighAverageAverage YearYear
10 steps to reduce feed costs10 steps to reduce feed costs
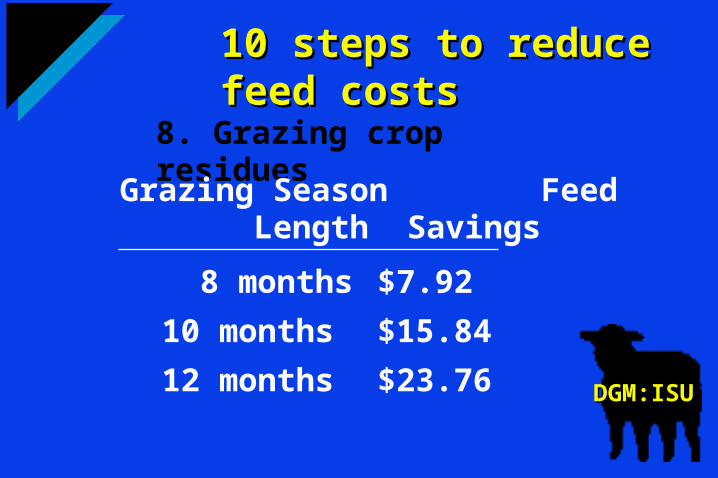
8. Grazing crop residues
8 months $7.92
10 months $15.84
12 months $23.76
Grazing Season Feed Length Savings
DGM:ISUDGM:ISU

10 steps to reduce feed costs10 steps to reduce feed costs
9. Stock piled grazing
ewes can winter outdoors?
additional benefits
flock health
reduced labor

10 steps to reduce feed costs10 steps to reduce feed costs
10. Change production systems
Late lambing
Nutrient requirements and
forage quality match
DGM:ISUDGM:ISU
Charles Parker Challenge
365 pounds of lamb marketed/ewe/year
Industry is at 50% or less
HOW ???
Increasing Income
DGM:ISU

Breeding season managementwhen to breedflushingteasers ewe age groups
Increasing Production

Genetic improvement NSIP accurate maternal selectionLifetime productionnot S vs Tw vs Tr
Pounds weaned is the trait
Increasing Production

Prolific geneticsChoose the lambing rate you want1.5 to 4.0 possible
Increasing Production
DGM:ISU
Crossbreeding Simple to complex
increase production15-50 % over straight breds
Increasing Production
DGM:ISU

DGM:ISU

Death loss from birth to weaning is the greatest inefficiency in the
sheep industry.
Increasing Production

Increased growthuse terminal sires
Heavier market weights use terminal sires
feed them longer
Increasing Production

Management Inputs
Do not have a Cash Cost Never substitute cash
inputs for management
Poor Management Inputs
Flushing fat ewes
Vaccinating for a disease because your neighbor does it.
Monthly deworming vs a strategic approach
DGM:ISU

Feeding oats when corn is 50% cheaper
Feeding dairy quality hay to minimize waste
Giving up .2-.5 lambs/ewe/year due to breeding season and death loss
DGM:ISU
Poor Management Examples

Getting/Being Profitable
Increase output without increasing inputs
Increase production via: Management
Genetics
Nutrition
Reproduction
DGM:ISU

Decrease Production CostsStep 1: Know where your at
Step 2: Develop plan to get
where you want to be
Getting/Being Profitable

Profitable Sheep Production
Must be “the” goal Sound Management Cost control Use technology
DGM:ISU