key data growth sparks coming back gradually
TRANSCRIPT

Edelweiss Research is also available on www.edelweissresearch.com, Bloomberg - EDEL, Thomson Reuters, and Factset Edelweiss Securities Limited
KEY DATA
Rating BUY Sector relative Outperformer Price (INR) 99 12 month price target (INR) 145 Market cap (INR bn/USD bn) 980/13.4 Free float/Foreign ownership (%) 49.0/11.4
What’s Changed
Target Price ⚊
Rating/Risk Rating ⚊
QUICK TAKE
Growth sparks coming back gradually
NTPC’s overall Q3FY21 performance is in line with our expectations. Highlights: i) Liquidation of overdue receivables by 15% to INR157bn is a key positive; it is likely to reduce to INR80bn by March-21. ii) The company continues to progress well on renewable diversification (won 1.2GW in last three months). iii) The CWIP ratio is down to less than 30%, indicating higher profitability going forward.
In our view, the key concern – a deteriorating balance sheet profile –has begun to recede. Furthermore, capacity commercialisation of 11GW over the next two years is likely drive a strong 15% earnings CAGR. The stock’s valuation is compelling at (0.7x P/BV). Maintain ‘BUY’ with a TP of INR145.
FINANCIALS (INR bn)
Year to March FY20A FY21E FY22E FY23E
Revenue 977 976 1,191 1,320
EBITDA 271 303 380 422
Adjusted profit 122 136 159 180
Diluted EPS (INR) 12.3 13.8 16.0 18.2
EPS growth (%) 14.7 12.0 16.3 13.6
RoAE (%) 8.9 10.4 12.3 13.0
P/E (x) 7.9 7.0 6.0 5.3
EV/EBITDA (x) 9.4 8.7 7.1 6.5
Dividend yield (%) 3.2 5.7 6.6 7.5
PRICE PERFORMANCE
Steady operational performance; dip in other income
NTPC volumes in Q3 increased 7% YoY to 65.4bn units in line with power demand,
resulting in overall revenue growth of 4% YoY to INR245bn. Lower fuel cost per unit
(down 5% YoY) resulted in EBITDA grow7h of 6% YoY. The surcharge income
continued with no substantial decline in overdue receivables. However, with a lower
interest of 1% p.m. on overdues to be settled under AatmaNirbhar Bharat, other
income dipped 44% sequentially to INR7.6bn (up 44% YoY). With payments picking
up under AatmaNirbhar, surcharge income is expected to taper gradually. Adjusted
PAT for Q3 grew 24% YoY to INR33bn.
Debtors liquidation on; march towards renewables going well
NTPC overdue receivables declined significantly from INR191bn to IRN167bn QoQ.
Debtors further declined by INR10bn in January. Management expects to close FY21
with INR80bn in overdue receivables in the wake of the liquidity scheme for discoms.
Importantly, NTPC’s collection efficiency is 100% for the bills raised July-20 onwards.
The company recently won 1.2GW of bids and has bid for another 5GW-plus projects.
Management indicated that it expects low- to mid-teens RoEs on these renewable
projects given favourable cost of debt.
Explore:
Outlook and valuation: Compelling valuations; retain ‘BUY’
NTPC has seen meaningful shift towards renewables; however, its EPS growth over
next two–three-years hinges on commercialisation of thermal capacity, post-which
renewables would take centre stage. With a 15% EPS CAGR, 6% dividend yield and
0.7x P/BV valuations on FY22E, the stock offers compelling proposition. Retain ‘BUY’.
Financials Year to March Q3FY21 Q3FY20 % Change Q2FY21 % Change
Net Revenue 2,45,093 2,34,964 4.3 2,46,771 (0.7)
EBITDA 73,671 69,764 5.6 71,834 2.6
Adjusted Profit 33,080 26,775 23.5 39,394 (16.0)
Diluted EPS (INR) 3.3 2.7 23.5 4.0 (16.0)
Above In line Below
Profit
Margins
Revenue Growth
Overall
25,000
30,200
35,400
40,600
45,800
51,000
75
85
95
105
115
125
Feb-20 May-20 Aug-20 Nov-20
NTPC IN Equity Sensex
India Equity Research Power February 4, 2021
NTPC RESULT UPDATE
Swarnim Maheshwari Ashutosh Virendra Mehta +91 (22) 4040 7418 +91 (22) 6141 2748 [email protected] [email protected]
Corporate access
Financial model Podcast
Video

NTPC
Edelweiss Securities Limited
2 Edelweiss Research is also available on www.edelweissresearch.com, Bloomberg - EDEL, Thomson Reuters, and Factset
Financial Statements
Income Statement (INR mn) Year to March FY20A FY21E FY22E FY23E
Total operating income 9,77,004 9,75,984 11,90,590 13,19,563
Energy Cost 5,70,183 5,29,258 6,65,407 7,41,779
Employee costs 49,256 52,236 53,814 56,526
Other expenses 86,638 91,061 91,337 98,912
EBITDA 2,70,927 3,03,429 3,80,033 4,22,345
Depreciation 86,229 1,01,858 1,18,426 1,30,929
Less: Interest expense 67,820 75,717 68,413 68,419
Add: Other income 27,780 34,917 19,172 18,302
Profit before tax 1,92,948 1,65,723 2,12,367 2,41,299
Prov for tax 91,820 40,286 53,729 61,049
Less: Other adj 0 0 0 0
Reported profit 1,01,128 1,25,437 1,58,638 1,80,251
Less: Excp.item (net) 20,607 10,965 0 0
Adjusted profit 1,21,735 1,36,402 1,58,638 1,80,251
Diluted shares o/s 9,895 9,895 9,895 9,895
Adjusted diluted EPS 12.3 13.8 16.0 18.2
DPS (INR) 3.2 5.5 6.4 7.3
Tax rate (%) 47.6 24.3 25.3 25.3
Important Ratios (%) Year to March FY20A FY21E FY22E FY23E
Operation cost (% of rev) 58.4 54.2 55.9 56.2
Employee cost (% of rev) 5.0 5.4 4.5 4.3
Other exp (% of rev) 8.9 9.3 7.7 7.5
EBITDA margin (%) 27.7 31.1 31.9 32.0
Net profit margin (%) 12.5 14.0 13.3 13.7
Revenue growth (% YoY) 8.2 (0.1) 22.0 10.8
EBITDA growth (% YoY) 19.0 12.0 25.2 11.1
Adj. profit growth (%) 14.7 12.0 16.3 13.6
Assumptions (%) Year to March FY20A FY21E FY22E FY23E
GDP (YoY %) 4.8 (6.0) 7.0 6.0
Repo rate (%) 4.4 3.5 3.5 4.0
USD/INR (average) 70.7 75.0 73.0 72.0
Commercial cap Cl (MW) 49,695.0 52,755.0 57,555.0 61,055.0
Reg Eq Closing (INR bn) 618.1 682.7 789.2 868.3
Implied Reg RoE (%) 17.8 16.9 19.6 20.1
Avg coal plant PLF (%) 69.2 62.5 67.7 68.0
Units produced (BUs) 259.6 263.9 311.1 337.2
Capex (INR bn) 144.7 211.1 194.8 242.7
Valuation Metrics Year to March FY20A FY21E FY22E FY23E
Diluted P/E (x) 7.9 7.0 6.0 5.3
Price/BV (x) 0.8 0.8 0.7 0.7
EV/EBITDA (x) 9.4 8.7 7.1 6.5
Dividend yield (%) 3.2 5.7 6.6 7.5
Source: Company and Edelweiss estimates
Balance Sheet (INR mn) Year to March FY20A FY21E FY22E FY23E
Share capital 98,946 98,946 98,946 98,946
Reserves 10,36,749 11,09,761 12,04,944 13,13,094
Shareholders funds 11,68,120 12,41,132 13,36,315 14,44,465
Minority interest 0 0 0 0
Borrowings 16,82,844 17,81,584 18,48,990 19,00,530
Trade payables 90,686 93,377 81,826 96,383
Other liabs & prov 3,22,145 3,13,500 2,98,457 3,07,914
Total liabilities 32,76,675 34,42,473 35,78,468 37,62,171
Net block 15,62,730 16,76,270 19,12,616 20,45,549
Intangible assets 8,308 8,308 8,308 8,308
Capital WIP 7,30,668 7,26,346 5,66,392 5,45,191
Total fixed assets 23,01,706 24,10,924 24,87,316 25,99,048
Non current inv 2,64,009 2,77,209 2,91,070 3,05,623
Cash/cash equivalent 22,091 23,115 52,183 57,634
Sundry debtors 1,56,681 2,14,026 1,78,075 1,71,928
Loans & advances 9,088 9,088 9,088 9,088
Other assets 3,97,622 3,80,122 4,19,950 4,68,063
Total assets 32,76,675 34,42,473 35,78,468 37,62,171
Free Cash Flow (INR mn) Year to March FY20A FY21E FY22E FY23E
Reported profit 1,01,128 1,25,437 1,58,638 1,80,251
Add: Depreciation 86,229 1,01,858 1,18,426 1,30,929
Interest (net of tax) 35,546 57,545 51,104 51,109
Others 42,101 20,308 17,308 17,310
Less: Changes in WC (44,861) (48,310) (43,269) (27,954)
Operating cash flow 2,20,143 2,56,839 3,02,208 3,51,645
Less: Capex (1,44,709) (2,11,076) (1,94,818) (2,42,661)
Free cash flow 75,433 45,762 1,07,390 1,08,984
Key Ratios Year to March FY20A FY21E FY22E FY23E
RoE (%) 8.9 10.4 12.3 13.0
RoCE (%) 7.9 8.1 9.0 9.5
Inventory days 60 63 42 42
Receivable days 45 69 60 48
Payable days 53 63 48 44
Working cap (% sales) 23.7 28.4 25.9 24.7
Gross debt/equity (x) 1.4 1.4 1.4 1.3
Net debt/equity (x) 1.4 1.4 1.3 1.3
Interest coverage (x) 2.7 2.7 3.8 4.3
Valuation Drivers Year to March FY20A FY21E FY22E FY23E
EPS growth (%) 14.7 12.0 16.3 13.6
RoE (%) 8.9 10.4 12.3 13.0
EBITDA growth (%) 19.0 12.0 25.2 11.1
Payout ratio (%) 30.8 43.5 40.0 40.0
Edelweiss Securities Limited
NTPC
Edelweiss Research is also available on www.edelweissresearch.com, Bloomberg - EDEL, Thomson Reuters, and Factset 3
Q3FY21 conference call highlights
Commercial highlights
Group gross generation – 65.42bn units in Q3 and for the group it was 73.56bn
units.
Commercial addition – 865MW including 800MW at Lara. Current capacity at
51,170MW on a standalone basis.
Loss due to grid restriction – 84.12bn units for 9M. 20.24bn units for gas units.
Coal - 5.75mn MT coal has been excavated (7.04mn MT YoY) in 9mFY21.
INR75.31bn has been spent on development of coal mines in FY20.
FGD – 64.85GW implementation ongoing at group level. 1,340 MW
commissioned. 58.94GW are implementation. 4.57GW balance under various
stages of tendering.
Nox – 18GW have been awarded/yet to be awarded. 43GW under process for
awards.
Capex – INR123.83bn for NTPC SA and INR88.71bn by other group companies.
Group total at INR212.5bn. Capex planned for FY21 – INR210bn for NTPC Ltd.
At most airports, management plans to install rooftop solar.
Capacity addition FY21–5,074 MW (NTPC standalone will be 3,080MW).
Completed more than 50% addition of standalone. In FY22 – Group 6,000MW
(NTPC will be 4,962MW).
MEJA unit 2 has been declared commercial.
No new thermal power plants planned for FY22.
Renewables
Renewable projects under tendering – 1,440MW.
Renewable projects won in FY21 - 200MW in Gujarat, 470MW in Rajasthan and
90MW in Kerala, 600MW in Andhra.
Equity IRR similar to that in coal-based plants, due to lower cost of debt and less
implementation time for executing this project. Equity IRR should be in 11-12%
range.
Renewables target to reach 30GW capacity by 2030.
Financial highlights
Performance of THDC and NEEPCO
In 9m, THDC – profit of INR6.51bn (versus INR6.92bn profit YoY) and NEEPCO –
loss of INR1.16bn (INR1.32bn profit YoY). Loss in NEEPCO is due to one plant loss.
In Q3, THDC – profit of INR2.14 (INR2.68bn YoY) and NEEPCO loss of INR0.83bn
(versus INR1.15bn YoY).
Standalone - CWIP is INR740bn. Total asset of INR2750bn.
Other income – Late payment surcharge, dues which are settled from
AatmaNirbhar scheme, interest at 1% (as against 1.5% for normal payments).
NTPC
Edelweiss Securities Limited
4 Edelweiss Research is also available on www.edelweissresearch.com, Bloomberg - EDEL, Thomson Reuters, and Factset
Term loan signed – INR52bn with Bank of India and INR20bn with ICICI bank.
Fixed cost under recoveries – INR5.69bn for 9mFY21, INR4.99bn for H1FY20.
Adjusted PAT for Q3 – INR33.08bn (versus INR26.77bn YoY). Previous year sales
and fuel are the main adjustments.
PAF based incentive – INR 3.55bn (INR1.64bn YoY) and for Q3 – INR0.76bn
(versus INR0.09bn YoY).
Outstanding receivables (more than 45 days) –
o INR191.64bn was outstanding as on Sep and INR167.20bn was outstanding
as on Dec end. Tranch II of Atmanirbhar should aid INR80bn of flows to
NTPC. Collections from July have been more than 100%. There are certain
conditions that discoms need to comply with.
Regulated equity – INR647.86bn as on 31st Dec 2020.
Surcharge income – For 9mFY21 - 16.9bn (versus INR12.4bn YOY). For Q3 -
INR5.65bn in Q3FY21 (versus INR4.17bn YoY).
Dividend from subsidiary - INR5.73bn
Buyback – All the activities pertaining to buyback have been completed.
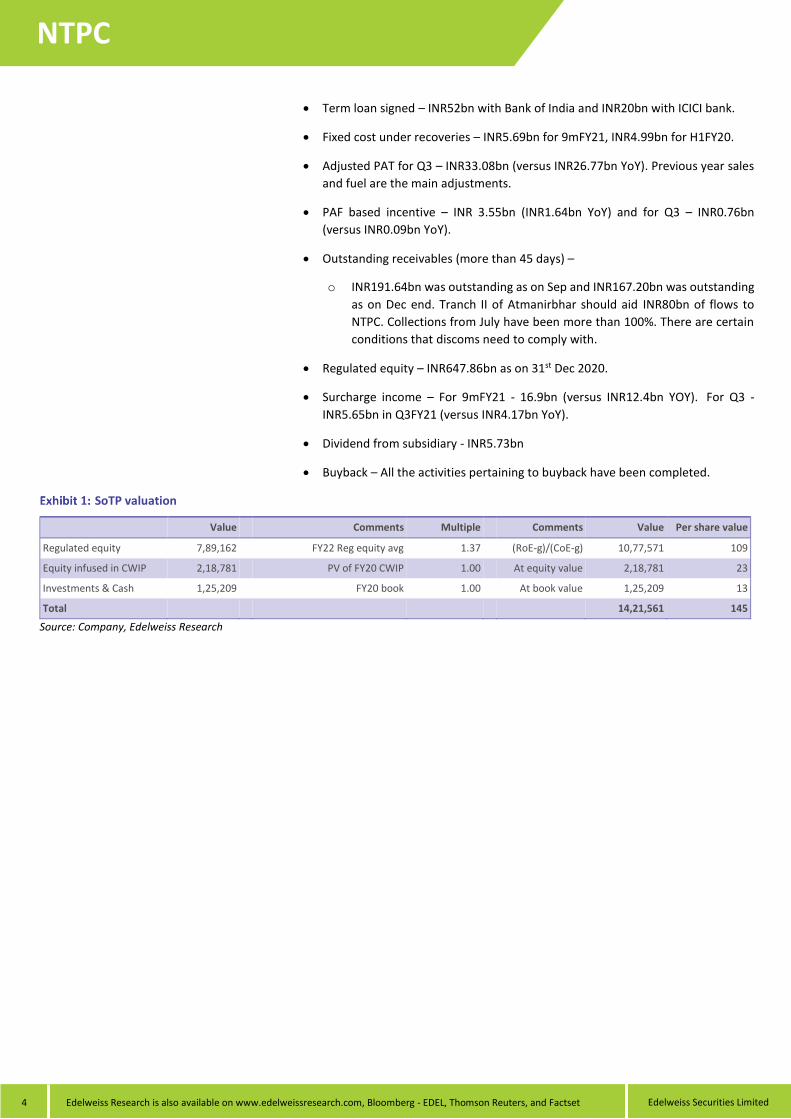
SoTP valuation
Value Comments Multiple Comments Value Per share value
Regulated equity 7,89,162 FY22 Reg equity avg 1.37 (RoE-g)/(CoE-g) 10,77,571 109
Equity infused in CWIP 2,18,781 PV of FY20 CWIP 1.00 At equity value 2,18,781 23
Investments & Cash 1,25,209 FY20 book 1.00 At book value 1,25,209 13
Total 14,21,561 145
Source: Company, Edelweiss Research
Edelweiss Securities Limited
NTPC
Edelweiss Research is also available on www.edelweissresearch.com, Bloomberg - EDEL, Thomson Reuters, and Factset 5
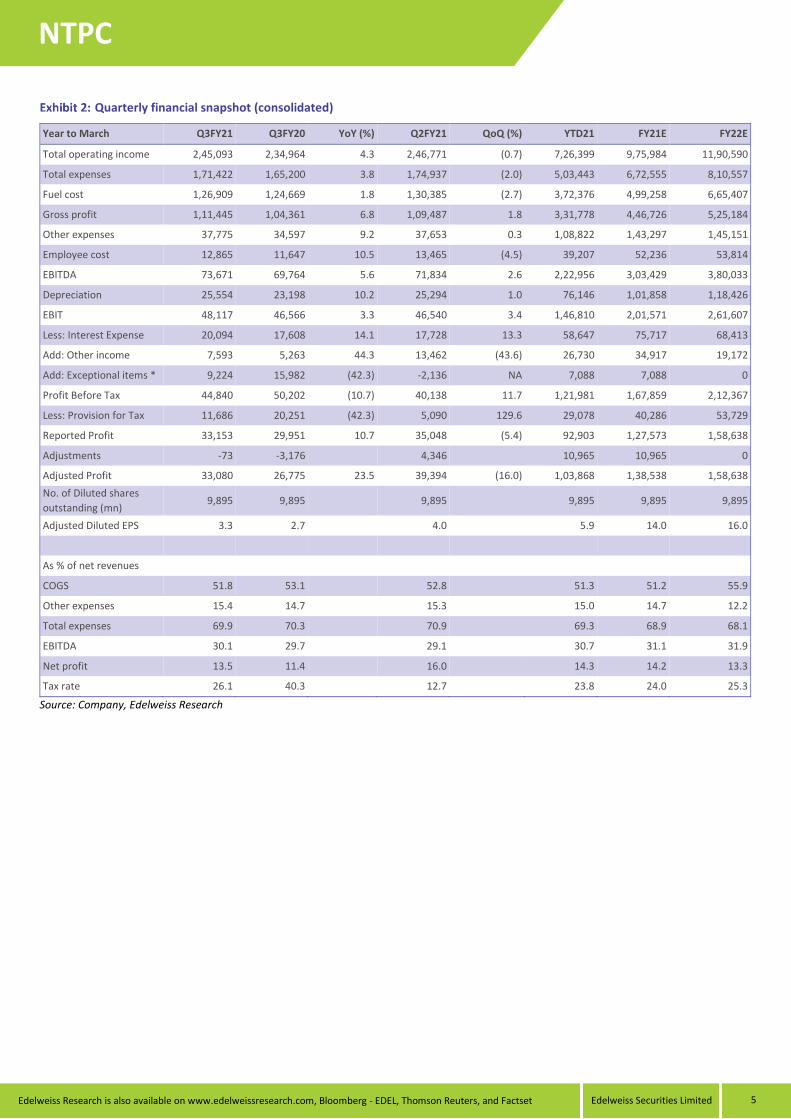
Quarterly financial snapshot (consolidated)
Year to March Q3FY21 Q3FY20 YoY (%) Q2FY21 QoQ (%) YTD21 FY21E FY22E
Total operating income 2,45,093 2,34,964 4.3 2,46,771 (0.7) 7,26,399 9,75,984 11,90,590
Total expenses 1,71,422 1,65,200 3.8 1,74,937 (2.0) 5,03,443 6,72,555 8,10,557
Fuel cost 1,26,909 1,24,669 1.8 1,30,385 (2.7) 3,72,376 4,99,258 6,65,407
Gross profit 1,11,445 1,04,361 6.8 1,09,487 1.8 3,31,778 4,46,726 5,25,184
Other expenses 37,775 34,597 9.2 37,653 0.3 1,08,822 1,43,297 1,45,151
Employee cost 12,865 11,647 10.5 13,465 (4.5) 39,207 52,236 53,814
EBITDA 73,671 69,764 5.6 71,834 2.6 2,22,956 3,03,429 3,80,033
Depreciation 25,554 23,198 10.2 25,294 1.0 76,146 1,01,858 1,18,426
EBIT 48,117 46,566 3.3 46,540 3.4 1,46,810 2,01,571 2,61,607
Less: Interest Expense 20,094 17,608 14.1 17,728 13.3 58,647 75,717 68,413
Add: Other income 7,593 5,263 44.3 13,462 (43.6) 26,730 34,917 19,172
Add: Exceptional items * 9,224 15,982 (42.3) -2,136 NA 7,088 7,088 0
Profit Before Tax 44,840 50,202 (10.7) 40,138 11.7 1,21,981 1,67,859 2,12,367
Less: Provision for Tax 11,686 20,251 (42.3) 5,090 129.6 29,078 40,286 53,729
Reported Profit 33,153 29,951 10.7 35,048 (5.4) 92,903 1,27,573 1,58,638
Adjustments -73 -3,176 4,346 10,965 10,965 0
Adjusted Profit 33,080 26,775 23.5 39,394 (16.0) 1,03,868 1,38,538 1,58,638
No. of Diluted shares
outstanding (mn) 9,895 9,895 9,895 9,895 9,895 9,895
Adjusted Diluted EPS 3.3 2.7 4.0 5.9 14.0 16.0
As % of net revenues
COGS 51.8 53.1 52.8 51.3 51.2 55.9
Other expenses 15.4 14.7 15.3 15.0 14.7 12.2
Total expenses 69.9 70.3 70.9 69.3 68.9 68.1
EBITDA 30.1 29.7 29.1 30.7 31.1 31.9
Net profit 13.5 11.4 16.0 14.3 14.2 13.3
Tax rate 26.1 40.3 12.7 23.8 24.0 25.3
Source: Company, Edelweiss Research

NTPC
Edelweiss Securities Limited
6 Edelweiss Research is also available on www.edelweissresearch.com, Bloomberg - EDEL, Thomson Reuters, and Factset
Company Description
NTPC, set up in 1975, is India’s largest power generation company with 62GW
installed capacity (including 7GW from JVs). With 18GW of under construction
projects, NTPC is looking to commercialize 4-5GW of capacity each year for the next
two years. In near term NTPC is committed to set up 10GW renewable portfolio by
2022. Over the long term NTPC plans to expand its generation portfolio to 130GW
by 2032 with 30% of the basket from non-fossil fuel based capacity. Further NTPC
has forayed into coal mining operations with multiple mines under various phases
of development.
Investment Theme
Regulated returns: NTPC currently has ~45GW of operational capacity (standalone)
under the regulated model with pipeline capacity of ~30-35GW plus signed under
the regulated model. This enables it to pass on increase in costs, limiting the impact
on profitability.
High efficiency gains: While the current regulation permits post tax RoE of 15.5%
(along with PAF based incentive), on regulated equity the company has been able to
earn RoE of ~19-20% on the regulated book due to highly efficient plants and
economies of scale.
Inorganic growth opportunities: Ensuing consolidation in thermal space at
attractive valuations provides growth opportunities for NTPC given its scale and PPA
pipeline in PPA.
Fuel security: The Company has secured fuel supplies through FSAs with CIL in the
past; incrementally, the coal blocks being developed should improve NTPC’s fuel
security.
Key Risks
Delay in execution of capex: Any delay in execution of pipeline projects could result
in downside from the estimated earnings/valuations.
SEB delays: While NTPC makes due efforts to maintain adequate LCs for sale of
power to SEBs, failure to secure timely payments is a risk to the working capital cycle
and hence earnings.
Fuel supplies: Fuel non-availability could impact PLF’s/PAF’s resulting into higher
than estimated fixed cost under-recoveries impacting RoE’s.

Edelweiss Securities Limited
NTPC
Edelweiss Research is also available on www.edelweissresearch.com, Bloomberg - EDEL, Thomson Reuters, and Factset 7
Additional Data Management
CMD Shri Gurdeep Singh
CFO Sudhir Arya
Dir (Finance) Shri Anil Kumar Gautam
Dir (Operation) Shri Ramesh Babu V
Auditor S K Mehta & Co
Holdings – Top 10* % Holding % Holding
Life Insurance 10.81 Sbi Funds Manag 1.24
Icici Prudentia 7.55 50 Sbi-Etf Nift 1.22
Hdfc Asset Mana 4.57 T Rowe Price Gr 1.12
Reliance Capita 3.14 T. Rowe Price I 1.10
Cpse Etf 3.11 Franklin Resour 0.97
*Latest public data
Recent Company Research Date Title Price Reco
02-Nov-20 A mixed bag; receivables key; Result Update
89.2 Buy
17-Aug-20 NTPC - Result Update Q1FY21 - Accelerate; Result Update
95 Buy
27-Jun-20 NTPC - Result Update Q4FY20 - Tax provis; Result Update
97 Buy
Recent Sector Research Date Name of Co./Sector Title
29-Jan-21 JSW Energy Deleveraging continues; growth awaited; Result Update
27-Jan-21 India Grid Trust Smooth sailing; rights issue cheers grow; Result Update
22-Jan-21 Indian Energy Exchange
Stellar show; high revenue visibility ; Result Update
Rating Interpretation
Source: Bloomberg, Edelweiss research
Daily Volume
Source: Bloomberg
Rating Distribution: Edelweiss Research Coverage
Buy Hold Reduce Total
Rating Distribution* 163 64 14 241
>50bn >10bn and <50bn <10bn Total
Market Cap (INR) 194 52 5 251
* stocks under review
Rating Rationale
Rating Expected absolute returns over 12 months
Buy: >15%
Hold: >15% and <-5%
Reduce: <-5%
TP190
TP155
75
100
125
150
175
200
Feb-18 Aug-18 Feb-19 Aug-19 Feb-20 Aug-20
(IN
R)
NTPC IN Equity Buy Hold Reduce0
45
90
135
180
225
Feb-18 Aug-18 Feb-19 Aug-19 Feb-20 Aug-20
(Mn
)
NTPC
Edelweiss Securities Limited
8 Edelweiss Research is also available on www.edelweissresearch.com, Bloomberg - EDEL, Thomson Reuters, and Factset
DISCLAIMER Edelweiss Securities Limited (“ESL” or “Research Entity”) is regulated by the Securities and Exchange Board of India (“SEBI”) and is licensed to carry on the business of broking, depository services and related activities. The business of ESL and its Associates (list available on www.edelweissfin.com) are organized around five broad business groups – Credit including Housing and SME Finance, Commodities, Financial Markets, Asset Management and Life Insurance.
This Report has been prepared by Edelweiss Securities Limited in the capacity of a Research Analyst having SEBI Registration No.INH200000121 and distributed as per SEBI (Research Analysts) Regulations 2014. This report does not constitute an offer or solicitation for the purchase or sale of any financial instrument or as an official confirmation of any transaction. Securities as defined in clause (h) of section 2 of the Securities Contracts (Regulation) Act, 1956 includes Financial Instruments and Currency Derivatives. The information contained herein is from publicly available data or other sources believed to be reliable. This report is provided for assistance only and is not intended to be and must not alone be taken as the basis for an investment decision. The user assumes the entire risk of any use made of this information. Each recipient of this report should make such investigation as it deems necessary to arrive at an independent evaluation of an investment in Securities referred to in this document (including the merits and risks involved), and should consult his own advisors to determine the merits and risks of such investment. The investment discussed or views expressed may not be suitable for all investors.
This information is strictly confidential and is being furnished to you solely for your information. This information should not be reproduced or redistributed or passed on directly or indirectly in any form to any other person or published, copied, in whole or in part, for any purpose. This report is not directed or intended for distribution to, or use by, any person or entity who is a citizen or resident of or located in any locality, state, country or other jurisdiction, where such distribution, publication, availability or use would be contrary to law, regulation or which would subject ESL and associates / group companies to any registration or licensing requirements within such jurisdiction. The distribution of this report in certain jurisdictions may be restricted by law, and persons in whose possession this report comes, should observe, any such restrictions. The information given in this report is as of the date of this report and there can be no assurance that future results or events will be consistent with this information. This information is subject to change without any prior notice. ESL reserves the right to make modifications and alterations to this statement as may be required from time to time. ESL or any of its associates / group companies shall not be in any way responsible for any loss or damage that may arise to any person from any inadvertent error in the information contained in this report. ESL is committed to providing independent and transparent recommendation to its clients. Neither ESL nor any of its associates, group companies, directors, employees, agents or representatives shall be liable for any damages whether direct, indirect, special or consequential including loss of revenue or lost profits that may arise from or in connection with the use of the information. Our proprietary trading and investment businesses may make investment decisions that are inconsistent with the recommendations expressed herein. Past performance is not necessarily a guide to future performance .The disclosures of interest statements incorporated in this report are provided solely to enhance the transparency and should not be treated as endorsement of the views expressed in the report. The information provided in these reports remains, unless otherwise stated, the copyright of ESL. All layout, design, original artwork, concepts and other Intellectual Properties, remains the property and copyright of ESL and may not be used in any form or for any purpose whatsoever by any party without the express written permission of the copyright holders.
ESL shall not be liable for any delay or any other interruption which may occur in presenting the data due to any reason including network (Internet) reasons or snags in the system, break down of the system or any other equipment, server breakdown, maintenance shutdown, breakdown of communication services or inability of the ESL to present the data. In no event shall ESL be liable for any damages, including without limitation direct or indirect, special, incidental, or consequential damages, losses or expenses arising in connection with the data presented by the ESL through this report.
We offer our research services to clients as well as our prospects. Though this report is disseminated to all the customers simultaneously, not all customers may receive this report at the same time. We will not treat recipients as customers by virtue of their receiving this report.
ESL and its associates, officer, directors, and employees, research analyst (including relatives) worldwide may: (a) from time to time, have long or short positions in, and buy or sell the
Securities, mentioned herein or (b) be engaged in any other transaction involving such Securities and earn brokerage or other compensation or act as a market maker in the financial
instruments of the subject company/company(ies) discussed herein or act as advisor or lender/borrower to such company(ies) or have other potential/material conflict of interest with
respect to any recommendation and related information and opinions at the time of publication of research report or at the time of public appearance. ESL may have proprietary long/short
position in the above mentioned scrip(s) and therefore should be considered as interested. The views provided herein are general in nature and do not consider risk appetite or investment
objective of any particular investor; readers are requested to take independent professional advice before investing. This should not be construed as invitation or solicitation to do business
with ESL.
ESL or its associates may have received compensation from the subject company in the past 12 months. ESL or its associates may have managed or co-managed public offering of securities for the subject company in the past 12 months. ESL or its associates may have received compensation for investment banking or merchant banking or brokerage services from the subject company in the past 12 months. ESL or its associates may have received any compensation for products or services other than investment banking or merchant banking or brokerage services from the subject company in the past 12 months. ESL or its associates have not received any compensation or other benefits from the Subject Company or third party in connection with the research report. Research analyst or his/her relative or ESL’s associates may have financial interest in the subject company. ESL and/or its Group Companies, their Directors, affiliates and/or employees may have interests/ positions, financial or otherwise in the Securities/Currencies and other investment products mentioned in this report. ESL, its associates, research analyst and his/her relative may have other potential/material conflict of interest with respect to any recommendation and related information and opinions at the time of publication of research report or at the time of public appearance.
Participants in foreign exchange transactions may incur risks arising from several factors, including the following: ( i) exchange rates can be volatile and are subject to large fluctuations; ( ii) the value of currencies may be affected by numerous market factors, including world and national economic, political and regulatory events, events in equity and debt markets and changes in interest rates; and (iii) currencies may be subject to devaluation or government imposed exchange controls which could affect the value of the currency. Investors in securities such as ADRs and Currency Derivatives, whose values are affected by the currency of an underlying security, effectively assume currency risk.
Research analyst has served as an officer, director or employee of subject Company: No
ESL has financial interest in the subject companies: No
ESL’s Associates may have actual / beneficial ownership of 1% or more securities of the subject company at the end of the month immediately preceding the date of publication of research report.
Research analyst or his/her relative has actual/beneficial ownership of 1% or more securities of the subject company at the end of the month immediately preceding the date of publication of research report: No
ESL has actual/beneficial ownership of 1% or more securities of the subject company at the end of the month immediately preceding the date of publication of research report: No
Subject company may have been client during twelve months preceding the date of distribution of the research report.
There were no instances of non-compliance by ESL on any matter related to the capital markets, resulting in significant and material disciplinary action during the last three years except that ESL had submitted an offer of settlement with Securities and Exchange commission, USA (SEC) and the same has been accepted by SEC without admitting or denying the findings in relation to their charges of non registration as a broker dealer.
A graph of daily closing prices of the securities is also available at www.nseindia.com
Analyst Certification:
The analyst for this report certifies that all of the views expressed in this report accurately reflect his or her personal views about the subject company or companies and its or their securities, and no part of his or her compensation was, is or will be, directly or indirectly related to specific recommendations or views expressed in this report.

Edelweiss Securities Limited
NTPC
Edelweiss Research is also available on www.edelweissresearch.com, Bloomberg - EDEL, Thomson Reuters, and Factset 9
Additional Disclaimers
Disclaimer for U.S. Persons
This research report is a product of Edelweiss Securities Limited, which is the employer of the research analyst(s) who has prepared the research report. The research analyst(s) preparing the research report is/are resident outside the United States (U.S.) and are not associated persons of any U.S. regulated broker-dealer and therefore the analyst(s) is/are not subject to supervision by a U.S. broker-dealer, and is/are not required to satisfy the regulatory licensing requirements of FINRA or required to otherwise comply with U.S. rules or regulations regarding, among other things, communications with a subject company, public appearances and trading securities held by a research analyst account.
This report is intended for distribution by Edelweiss Securities Limited only to "Major Institutional Investors" as defined by Rule 15a-6(b)(4) of the U.S. Securities and Exchange Act, 1934 (the Exchange Act) and interpretations thereof by U.S. Securities and Exchange Commission (SEC) in reliance on Rule 15a 6(a)(2). If the recipient of this report is not a Major Institutional Investor as specified above, then it should not act upon this report and return the same to the sender. Further, this report may not be copied, duplicated and/or transmitted onward to any U.S. person, which is not the Major Institutional Investor.
In reliance on the exemption from registration provided by Rule 15a-6 of the Exchange Act and interpretations thereof by the SEC in order to conduct certain business with Major Institutional Investors, Edelweiss Securities Limited has entered into an agreement with a U.S. registered broker-dealer, Edelweiss Financial Services Inc. ("EFSI"). Transactions in securities discussed in this research report should be effected through Edelweiss Financial Services Inc.
Disclaimer for U.K. Persons
The contents of this research report have not been approved by an authorised person within the meaning of the Financial Services and Markets Act 2000 ("FSMA"). In the United Kingdom, this research report is being distributed only to and is directed only at (a) persons who have professional experience in matters relating to investments falling within Article 19(5) of the FSMA (Financial Promotion) Order 2005 (the “Order”); (b) persons falling within Article 49(2)(a) to (d) of the Order (including high net worth companies and unincorporated associations); and (c) any other persons to whom it may otherwise lawfully be communicated (all such persons together being referred to as “relevant persons”). This research report must not be acted on or relied on by persons who are not relevant persons. Any investment or investment activity to which this research report relates is available only to relevant persons and will be engaged in only with relevant persons. Any person who is not a relevant person should not act or rely on this research report or any of its contents. This research report must not be distributed, published, reproduced or disclosed (in whole or in part) by recipients to any other person. Disclaimer for Canadian Persons
This research report is a product of Edelweiss Securities Limited ("ESL"), which is the employer of the research analysts who have prepared the research report. The research analysts preparing the research report are resident outside the Canada and are not associated persons of any Canadian registered adviser and/or dealer and, therefore, the analysts are not subject to supervision by a Canadian registered adviser and/or dealer, and are not required to satisfy the regulatory licensing requirements of the Ontario Securities Commission, other Canadian provincial securities regulators, the Investment Industry Regulatory Organization of Canada and are not required to otherwise comply with Canadian rules or regulations regarding, among other things, the research analysts' business or relationship with a subject company or trading of securities by a research analyst.
This report is intended for distribution by ESL only to "Permitted Clients" (as defined in National Instrument 31-103 ("NI 31-103")) who are resident in the Province of Ontario, Canada (an "Ontario Permitted Client"). If the recipient of this report is not an Ontario Permitted Client, as specified above, then the recipient should not act upon this report and should return the report to the sender. Further, this report may not be copied, duplicated and/or transmitted onward to any Canadian person.
ESL is relying on an exemption from the adviser and/or dealer registration requirements under NI 31-103 available to certain international advisers and/or dealers. Please be advised that (i) ESL is not registered in the Province of Ontario to trade in securities nor is it registered in the Province of Ontario to provide advice with respect to securities; (ii) ESL's head office or principal place of business is located in India; (iii) all or substantially all of ESL's assets may be situated outside of Canada; (iv) there may be difficulty enforcing legal rights against ESL because of the above; and (v) the name and address of the ESL's agent for service of process in the Province of Ontario is: Bamac Services Inc., 181 Bay Street, Suite 2100, Toronto, Ontario M5J 2T3 Canada.
Disclaimer for Singapore Persons
In Singapore, this report is being distributed by Edelweiss Investment Advisors Private Limited ("EIAPL") (Co. Reg. No. 201016306H) which is a holder of a capital markets services license and an exempt financial adviser in Singapore and (ii) solely to persons who qualify as "institutional investors" or "accredited investors" as defined in section 4A(1) of the Securities and Futures Act, Chapter 289 of Singapore ("the SFA"). Pursuant to regulations 33, 34, 35 and 36 of the Financial Advisers Regulations ("FAR"), sections 25, 27 and 36 of the Financial Advisers Act, Chapter 110 of Singapore shall not apply to EIAPL when providing any financial advisory services to an accredited investor (as defined in regulation 36 of the FAR. Persons in Singapore should contact EIAPL in respect of any matter arising from, or in connection with this publication/communication. This report is not suitable for private investors.
Disclaimer for Hong Kong persons
This report is distributed in Hong Kong by Edelweiss Securities (Hong Kong) Private Limited (ESHK), a licensed corporation (BOM -874) licensed and regulated by the Hong Kong Securities and Futures Commission (SFC) pursuant to Section 116(1) of the Securities and Futures Ordinance “SFO”. This report is intended for distribution only to “Professional Investors” as defined in Part I of Schedule 1 to SFO. Any investment or investment activity to which this document relates is only available to professional investor and will be engaged only with professional investors.” Nothing here is an offer or solicitation of these securities, products and services in any jurisdiction where their offer or sale is not qualified or exempt from registration. The report also does not constitute a personal recommendation or take into account the particular investment objectives, financial situations, or needs of any individual recipients. The Indian Analyst(s) who compile this report is/are not located in Hong Kong and is/are not licensed to carry on regulated activities in Hong Kong and does not / do not hold themselves out as being able to do so. Copyright 2009 Edelweiss Research (Edelweiss Securities Ltd). All rights reserved.
Aditya Narain
Head of Research