key concepts = “level 0” - unsd — welcome to unsd of environmental-economic accounting key...
TRANSCRIPT

System of Environmental-Economic Accounting
Key Concepts = “Level 0”
Project: Advancing the SEEA
Experimental Ecosystem Accounting

System of Environmental-Economic Accounting
Overview
1. SEEA-EEA Training (Level 0)
• Overview of training modules
• Basic concepts:
▫ Ecosystems as “Assets”
▫ Ecosystem Services Cascade
▫ Accounting Principles
▫ Ecosystem Accounting is Spatial
• Accounts
• Tools

System of Environmental-Economic Accounting
SEEA-EEA Training
• Concepts, Accounts and Tools
• Flexible and modular (don’t need all Accounts and Tools)
• Three levels:
• Level 0 (All participants)
• Level 1 (Compiling)
• Level 2 (Providing data, country examples)
• Links to related training materials:
• Secretariat for the Convention on Biological Diversity (SCBD)
• Quick Start Package (QSP): includes GIS exercises
• World Bank WAVES
3

System of Environmental-Economic Accounting
SEEA-EEA Training Level 0
• Learning objectives
• Understand the basic concepts in ecosystem
accounting
• Understand the structure, data requirements and
uses of the SEEA-EEA accounts
• Understand the basic tools used to compile the
SEEA-EEA accounts
• For technical and scientific experts, this is:
• Preparation for Levels 1 & 2
• For policy experts and supporters you will:
• Understand how to use the accounts and who to
engage in the discussion
4

System of Environmental-Economic Accounting
SEEA-EEA Training Level 0
• Basic concepts and definitions
• Ecosystems as “Assets”
• The Ecosystem Services “Cascade” • Ecosystem structure and processes, function,
services, benefits and values
• Accounting (not just “counting”) Principles • Assets, stocks and flows
• Balancing the books
• Ecosystem Accounting is Spatial • Geographic information systems (GIS)
5

System of Environmental-Economic Accounting
Ecosystem assets, a definition
Ecosystem assets are spatial areas containing
a combination of biotic and abiotic components
and other characteristics that function together
(SEEA-EEA Sections 2.31, 4.1)
A forest is an area that: • Can be located on a map (spatial)
• Contains trees, shrubs, grasses, soil biota, birds,
mammals, insects… functioning together with
• The soil, water, geology (rocks), sunlight, wind…
6
System of Environmental-Economic Accounting
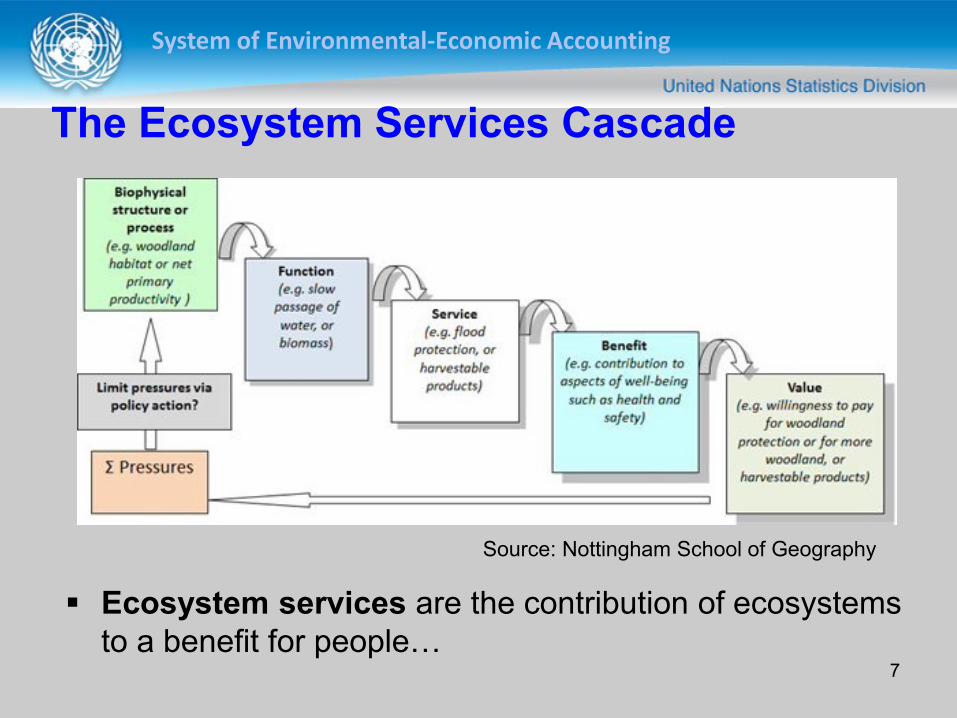
The Ecosystem Services Cascade
7
Ecosystem services are the contribution of ecosystems
to a benefit for people…
Source: Nottingham School of Geography

System of Environmental-Economic Accounting
Accounting principles…
Apply to environmental data, too… Double entry accounting:
Beginning & end of time period reconcile changes
Compare two sources reconcile and find errors
Time of recording: Referring to same time period (accounting period)
Unit of measurement: Same units (physical or monetary)
Reconciliation and aggregation
Consistent valuation rules: Market price: Basic, producer, purchaser
Consistent concepts and classifications
Stock Flow (Asset Service)
8

System of Environmental-Economic Accounting
Balancing the books of environmental assets
9
Assets Services
Waste & degradation
Economy and
well-being Regeneration
Time 1
System of Environmental-Economic Accounting
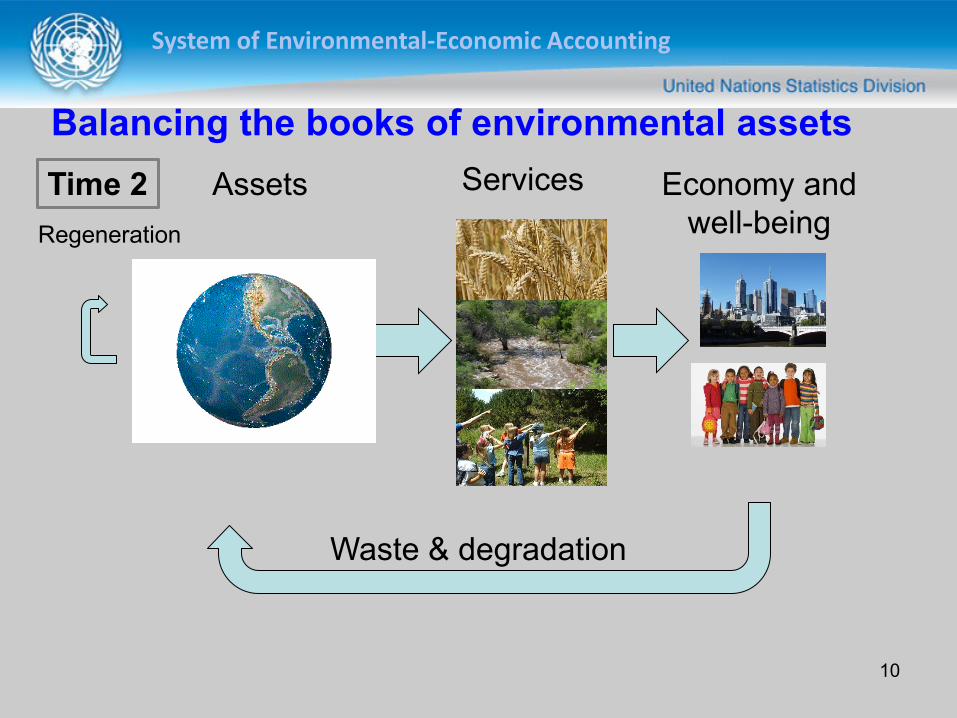
Balancing the books of environmental assets
10
Assets Services
Waste & degradation
Economy and
well-being Regeneration
Time 2
System of Environmental-Economic Accounting
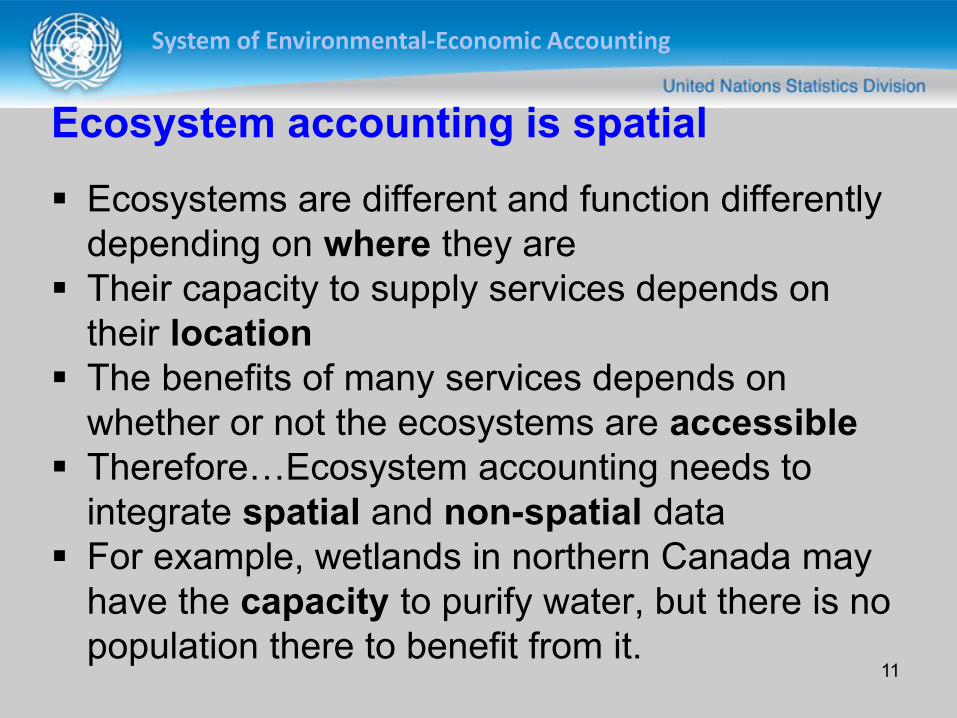
Ecosystem accounting is spatial
Ecosystems are different and function differently
depending on where they are
Their capacity to supply services depends on
their location
The benefits of many services depends on
whether or not the ecosystems are accessible
Therefore…Ecosystem accounting needs to
integrate spatial and non-spatial data
For example, wetlands in northern Canada may
have the capacity to purify water, but there is no
population there to benefit from it. 11

System of Environmental-Economic Accounting
Ecosystem accounting is spatial
Geographic information systems (GIS) • Manage spatial information as layers
• Have tools to integrate spatial information: ▫ Overlay different data where space is the common
denominator
▫ Aggregate point information (e.g., water sampling station) to
larger areas (polygons)
▫ Attribute information from larger areas to smaller ones
(downsampling)
▫ Geospatial statistics (interpolation, modelling)
• Generate tables based on common properties (e.g.,
land cover and land cover change)
12

System of Environmental-Economic Accounting
Pop quiz!
What is an important ecosystem type in your
country and what services does it provide?
What are examples of spatial data that you may
wish to integrate into ecosystem accounting?
Why is GIS a useful tool for ecosystem
accounting?
13

System of Environmental-Economic Accounting
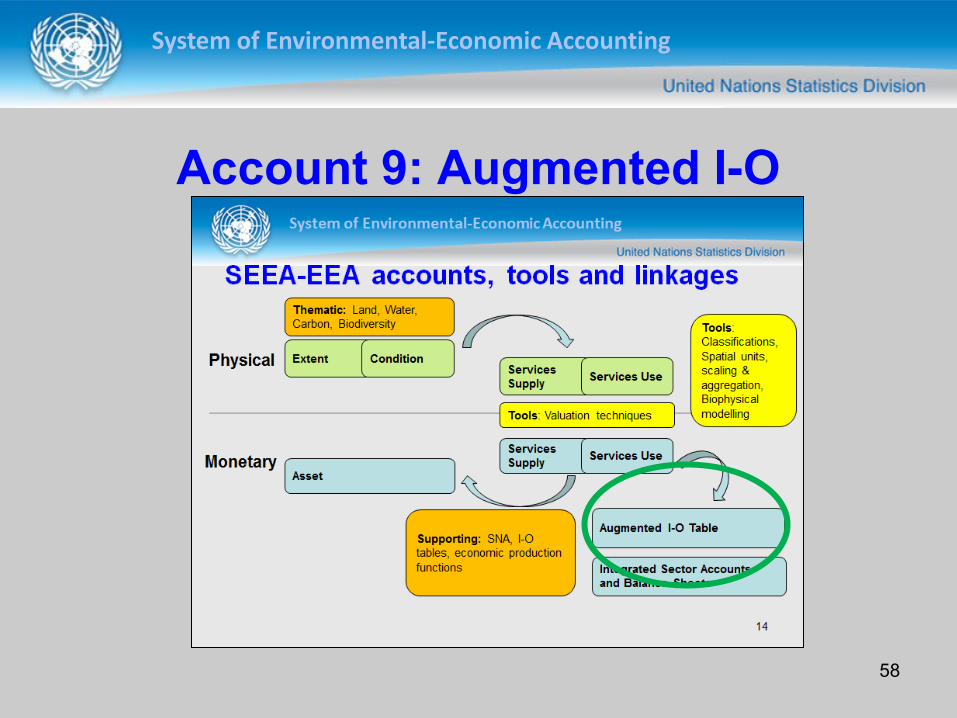
SEEA-EEA accounts, tools and linkages
14
Extent Condition Services
Supply Services Use
Services
Supply Services Use
Asset
Augmented I-O Table
Integrated Sector Accounts
and Balance Sheets
Tools:
Classifications,
Spatial units,
scaling &
aggregation,
Biophysical
modelling
Thematic: Land, Water,
Carbon, Biodiversity
Tools: Valuation techniques
Supporting: SNA, I-O
tables, economic production
functions
Physical
Monetary

System of Environmental-Economic Accounting
SEEA-EEA Accounts and Tools Today’s session presents 2-4 slides on each topic:
15
Tools • Classifications
• Spatial units, scaling and
aggregation
• Biophysical modelling
• Valuation
Accounts • Ecosystem Extent Account
• Ecosystem Condition Account
• Thematic Accounts:
• Water Account
• Carbon Account
• Biodiversity Account
• Ecosystem Services Supply Account
• Ecosystem Services Use Account
• Ecosystem Capacity
• Augmented I-O Tables
• Integrated Sector Accounts and Balance Sheet
• Supporting information

System of Environmental-Economic Accounting
Account 1: Extent
16
System of Environmental-Economic Accounting
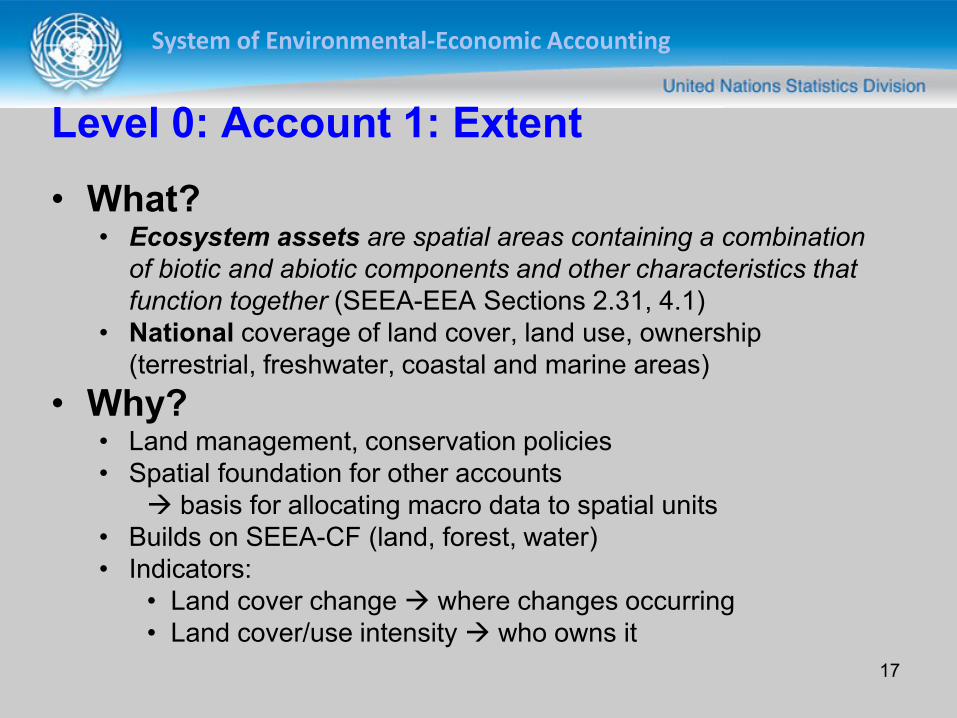
Level 0: Account 1: Extent
• What? • Ecosystem assets are spatial areas containing a combination
of biotic and abiotic components and other characteristics that
function together (SEEA-EEA Sections 2.31, 4.1)
• National coverage of land cover, land use, ownership
(terrestrial, freshwater, coastal and marine areas)
• Why? • Land management, conservation policies
• Spatial foundation for other accounts
basis for allocating macro data to spatial units
• Builds on SEEA-CF (land, forest, water)
• Indicators:
• Land cover change where changes occurring
• Land cover/use intensity who owns it
17

System of Environmental-Economic Accounting
Level 0: Account 1: Extent
What does an Extent Account look like?
18
Cover
Ownership
Use
Maps Tables
Cover
Open
wetlands Total
Use Infrastructure Residential
Permananet
crops Maintenance Forestry Protected Infrastructure Aquaculture Maintenance
Ownership Government Private Private Private Private Government Government Private Government
Units
Opening Stock
Additions to Stock
Managed expansion
Natural expansion
Reductions to stock
Managed regression
Natural regression
Closing stock
Urban and associated
Rainfed herbaceous
cropland Forest tree cover Inland water bodies
hectares
Spatial units
Classifications
System of Environmental-Economic Accounting
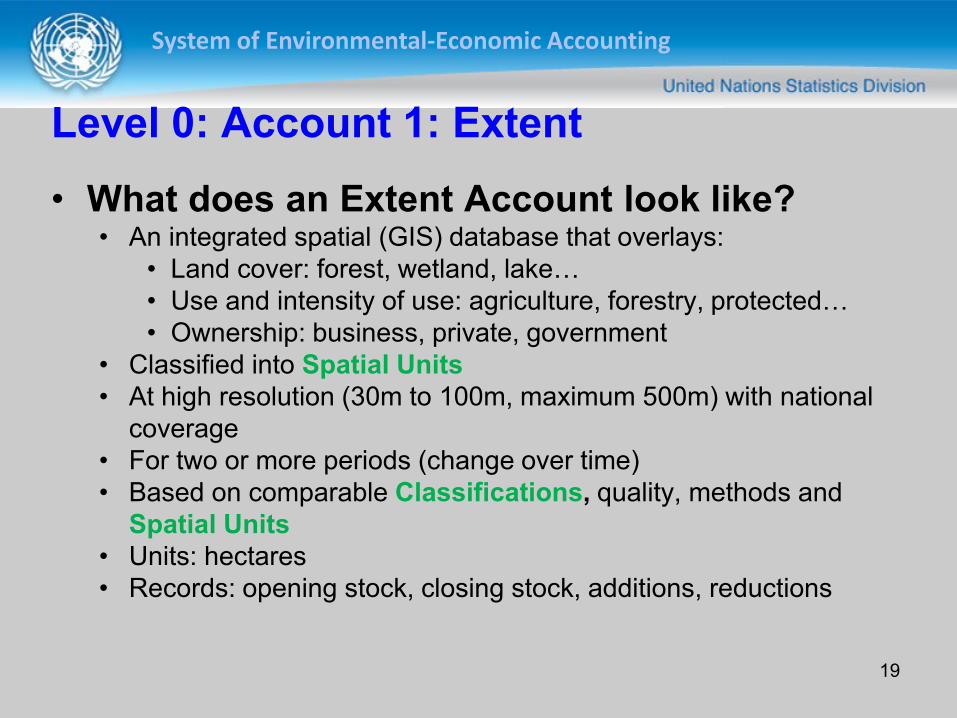
Level 0: Account 1: Extent
• What does an Extent Account look like? • An integrated spatial (GIS) database that overlays:
• Land cover: forest, wetland, lake…
• Use and intensity of use: agriculture, forestry, protected…
• Ownership: business, private, government
• Classified into Spatial Units
• At high resolution (30m to 100m, maximum 500m) with national
coverage
• For two or more periods (change over time)
• Based on comparable Classifications, quality, methods and
Spatial Units
• Units: hectares
• Records: opening stock, closing stock, additions, reductions
19

System of Environmental-Economic Accounting
Level 0: Account 1: Extent
• What do you need to compile an Extent
Account? • GIS platform: software, protocols, spatial units
• Classifications: land cover, land use, ownership
• National level data:
• Existing land account would be useful
• Satellite: land cover, aerial photography
• Census: agriculture, population, settlements
• Forest inventories
• Hydrological, topographic (rivers, drainage areas, elevation,
coastlines)
• Cadastral (ownership, tax)
• Expertise:
• Land managers, ecologists, geographers (GIS, satellite
imagery, integration)
20

System of Environmental-Economic Accounting
Account 2: Condition
21

System of Environmental-Economic Accounting
Level 0: Account 2: Condition
• What? • Ecosystem condition reflects the overall quality of an
ecosystem asset, in terms of its characteristics. (SEEA EEA
paragraph 2.34)
• Why? • Policies to limit degradation of natural heritage, rehabilitation of
degraded ecosystems
• Links to capacity to produce services (Services Supply)
• Indicators:
• Indices of condition change over time where changes
• Good/bad condition (exceeding “safe” levels) where
22
System of Environmental-Economic Accounting
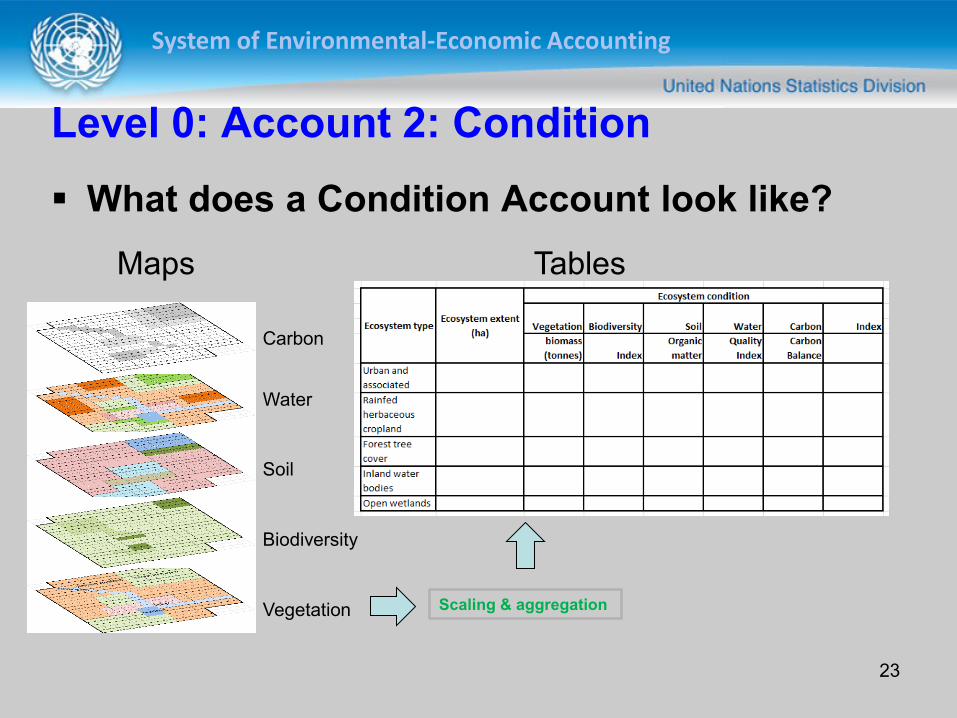
Level 0: Account 2: Condition
What does a Condition Account look like?
23
Maps Tables
Vegetation
Soil
Biodiversity
Water
Carbon
Scaling & aggregation

System of Environmental-Economic Accounting
Level 0: Account 2: Condition
• What does a Condition Account look like? • Spatially-detailed condition measures (quality or biophysical) for
each characteristic: • Vegetation
• Biodiversity (species abundance, diversity indices)
• Soil
• Water
• Carbon
• Air
• Overall measures (e.g., heterogeneity)
• Selected to reflect an area’s capacity to generate services
• Summarized in terms of an index
• Accounts for changes over time (accounting period)
• Attributes changes to drivers (natural and human) 24
System of Environmental-Economic Accounting
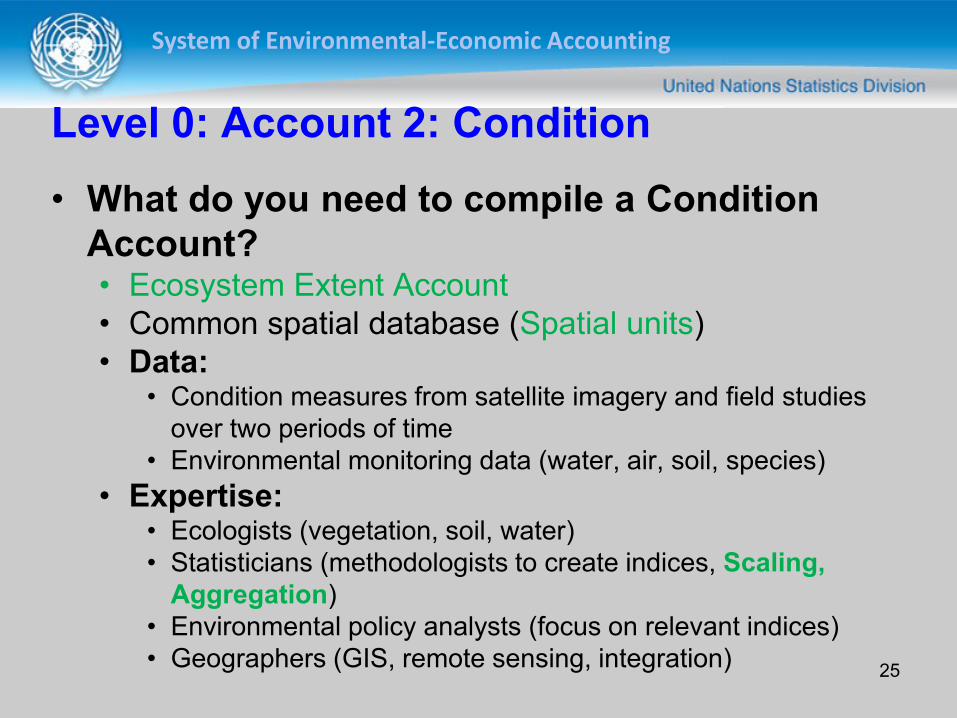
Level 0: Account 2: Condition
• What do you need to compile a Condition
Account? • Ecosystem Extent Account
• Common spatial database (Spatial units)
• Data: • Condition measures from satellite imagery and field studies
over two periods of time
• Environmental monitoring data (water, air, soil, species)
• Expertise: • Ecologists (vegetation, soil, water)
• Statisticians (methodologists to create indices, Scaling,
Aggregation)
• Environmental policy analysts (focus on relevant indices)
• Geographers (GIS, remote sensing, integration)
25

System of Environmental-Economic Accounting
Account 3: Water
26

System of Environmental-Economic Accounting
Level 0: Account 3: Water
• What? • Spatially-detailed version of SEEA-CF Water Account to capture:
• Inter-ecosystem flows of water (SEEA-EEA 4.62),
• Water quality and
• Supply/use for ecosystems
• Why? • Policies on water security, water quality, impacts of water
abstraction on ecosystems
• Links to other accounts (Condition, Services Supply & Use)
• Links to SEEA-CF; SEEA-WATER
• Indicators: • Local water supply/use, quality (use > supply?)
• Variability in supply, trends (droughts, floods)
27

System of Environmental-Economic Accounting
Level 0: Account 3: Water
What does a Water Account look like?
28
Maps Tables
Use
Rainfall
Hydrology
Spatial units
Classifications
Biophysical modelling
Socio-economic data
Agriculture,
forestry and
fishing
Mining &
quarrying,
manufacturing
and
construction
Electricity,
gas, steam
and air
conditioning
supply
Water
collection,
treatment and
supply Sewerage
Other
industries Households Total use
Source of abstracted water
Inland water resources
Surface water
Goundwater
Soil water
Total
Other water sources
Precipitation
Sea water
Total
Total use of abstracted water
Abstracted water
Distributed water
Own use
Use of water
mill ions m3

System of Environmental-Economic Accounting
Level 0: Account 3: Water
• What does a Water Account look like? • Spatially-detailed data on:
• Stock
• Supply, and
• Use including soil moisture & groundwater
• Water quality measures (contribution to Condition Account)
29

System of Environmental-Economic Accounting
Level 0: Account 3: Water
• What do you need to compile a Water
Account? • Ecosystem Extent Account
• SEEA-CF Water Account (national level)
• Common spatial infrastructure (Spatial Units)
• Data: • Spatially-detailed supply (rainfall, transfers)
• Use (abstraction, inter-ecosystem transfers);
• Water quality measures
• Expertise: • Geographers (GIS and remote sensing)
• Hydrologists
• Ecologists
• Climatologists
30

System of Environmental-Economic Accounting
Account 4: Carbon
31

System of Environmental-Economic Accounting
Level 0: Account 4: Carbon
• What? • Accounts for biocarbon as an asset (e.g., soil carbon)
• Carbon-related services (sequestration and storage)
• Carbon as a characteristic of ecosystem condition (productivity)
• Why? • Policies on climate change, low-carbon economy
• Assess changes in land cover and land use on carbon stocks
and sequestration
• Links to other SEEA accounts (Condition, Services Supply)
• Links to SEEA-CF (timber, soil, materials)
• Links to international guidelines (IPCC and REDD+)
• Indicators:
• Natural and human additions to carbon stock where
• Natural and human removals from carbon stock where
32

System of Environmental-Economic Accounting
Level 0: Account 4: Carbon
What does a Carbon Account look like?
33
Soil
Vegetation
Hydrology
Removals
Maps Tables
Scaling
Biophysical modelling
Geocarbon Biocarbon Oceans Atmosphere
Opening stock 10,000 400 20,000 100
Additions - 4 10 24
Reductions 10 5 9 14
Closing stock 9,990 399 20,001 110
billion tonnes C

System of Environmental-Economic Accounting
Level 0: Account 4: Carbon
• What does a Carbon Account look like? • Spatially detailed in terms of:
• Stock
• Additions and reductions of biocarbon
• Natural & human additions and removals
34
System of Environmental-Economic Accounting
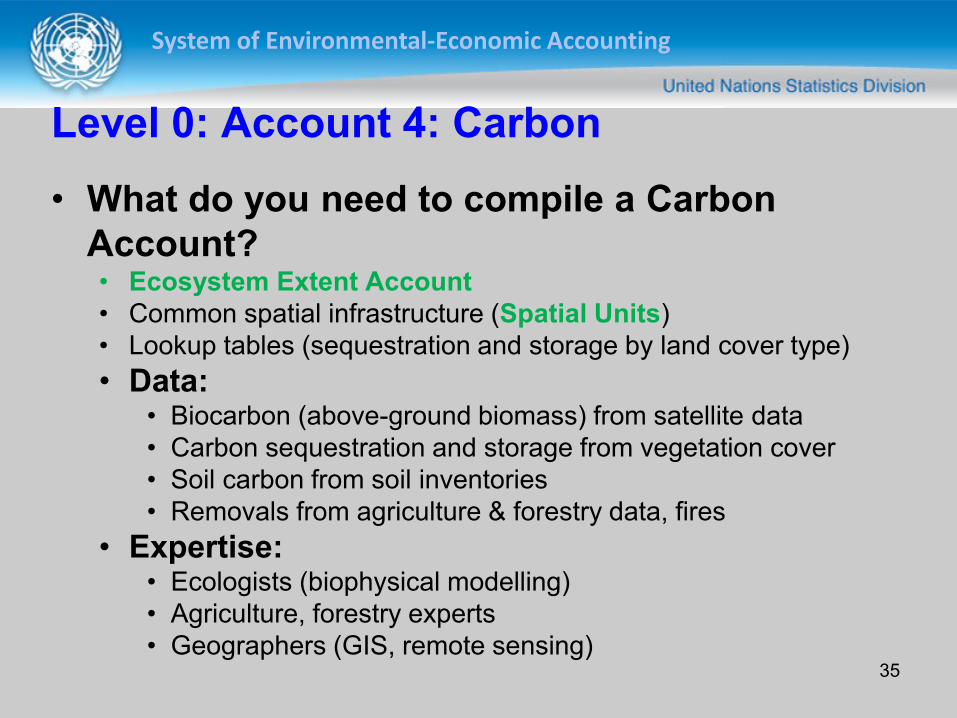
Level 0: Account 4: Carbon
• What do you need to compile a Carbon
Account? • Ecosystem Extent Account
• Common spatial infrastructure (Spatial Units)
• Lookup tables (sequestration and storage by land cover type)
• Data: • Biocarbon (above-ground biomass) from satellite data
• Carbon sequestration and storage from vegetation cover
• Soil carbon from soil inventories
• Removals from agriculture & forestry data, fires
• Expertise: • Ecologists (biophysical modelling)
• Agriculture, forestry experts
• Geographers (GIS, remote sensing) 35

System of Environmental-Economic Accounting
Account 5: Biodiversity
36

System of Environmental-Economic Accounting
Level 0: Account 5: Biodiversity
What do Biodiversity Accounts contain?
• Biodiversity information linked to areas of ecosystems
(from Extent Account)
• Spatially detailed information on key species:
• Abundance,
• Richness
• Conservation status
• Other characteristics (e.g., health)
• Spatially detailed summary statistics (index) on
species diversity (used in Condition Account)
37

System of Environmental-Economic Accounting
Level 0: Account 5: Biodiversity
Why would you create Biodiversity Accounts?
• To compare trends in biodiversity with economic and
social activity in a spatially explicit manner
• To link biodiversity information with other SEEA
accounts (Condition, Ecosystem Services
Generation)
• To meet global commitments under the Convention
on Biological Diversity’s Strategic Plan for Biodiversity
(2011-2020)
• To support sustainable development
38

System of Environmental-Economic Accounting
Level 0: Account 5: Biodiversity
What does a Biodiversity Account look like?
39
Maps Tables
Species 2
Species 1
Species 3
Ecosystems
Species data:
- abundance
- richness
- classification
- conservation status
- characteristics
- health
Priority species and ecosystems
Index
Species 1 Species 2 Species 1 Species 2
Pop. Ecosys.
Area
Pop. Ecosys.
Area
Pop. Ecosys.
Area
Pop. Ecosys.
Area
Reference
Opening
Closing
Net
change
System of Environmental-Economic Accounting
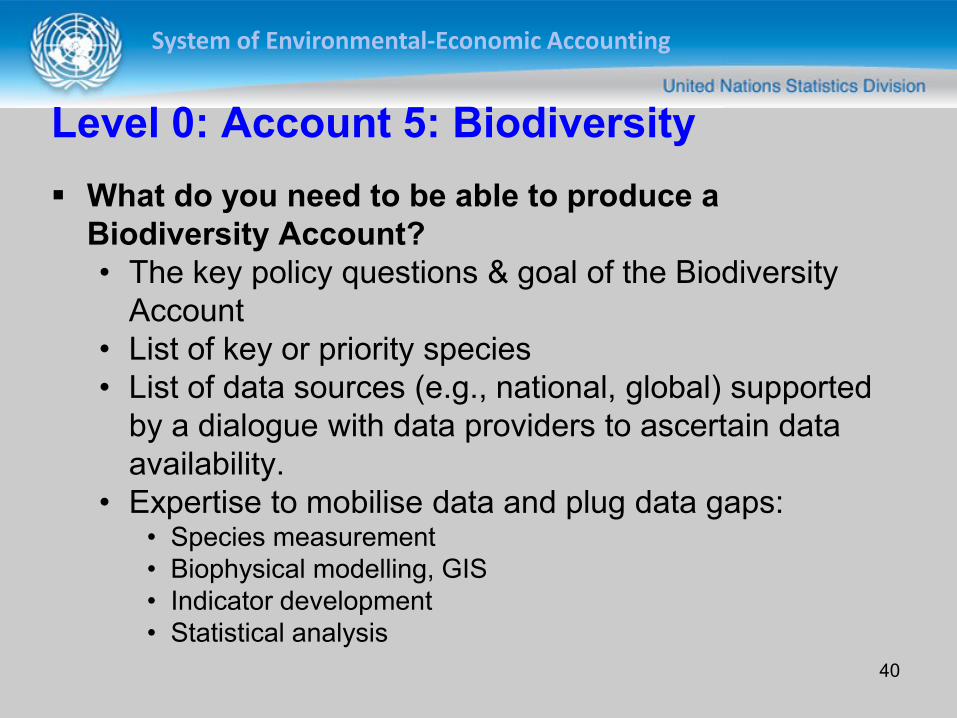
Level 0: Account 5: Biodiversity
What do you need to be able to produce a
Biodiversity Account?
• The key policy questions & goal of the Biodiversity
Account
• List of key or priority species
• List of data sources (e.g., national, global) supported
by a dialogue with data providers to ascertain data
availability.
• Expertise to mobilise data and plug data gaps: • Species measurement
• Biophysical modelling, GIS
• Indicator development
• Statistical analysis
40

System of Environmental-Economic Accounting
Level 0: Account 5: Biodiversity
What do you need to produce a Biodiversity
Account?
• Information on key or priority species • Species classifications (family, genus)
• Species measures (ranges, richness, population counts over
time)
• Characteristics (e.g., habitat, specialist/generalist, health)
• Conservation status
• Extent Account or some form of spatial infrastructure
for ecosystems (spatial units)
41

System of Environmental-Economic Accounting
Account 6: Services Supply
42

System of Environmental-Economic Accounting
Level 0: Account 6: Services Supply
• What? • Physical and monetary flows of “final” ecosystem services from
ecosystems to beneficiaries
• Directly used by (or affect) people
• Why? • Inform policies of contribution of ecosystems to human
well-being
• Assess trade-offs between development and conservation
• Link to standard economic production measures in SNA
• Link to other SEEA-EEA accounts (Condition, Services Use,
Monetary Asset valuation)
• Indicators: • Flows of individual services (physical and monetary) change
• Indices of aggregated services by ecosystem type change
43

System of Environmental-Economic Accounting
Level 0: Account 6: Services Supply
44
• What does a Services Supply Account look like?
Regulating
Provisioning
Cultural
Land cover
Maps Tables
Lookup tables
Biophysical modelling
Urban and
associated Forest tree cover Agricultural land Open wetlands
Provisioning
e.g., tonnes of
timber
e.g., tonnes of
wheat
Regulating
e.g., tonnes of
CO2 stored /
released
e.g., tonnes of
CO2 stored /
released
e.g., tonnes of
CO2 stored /
released
e.g., tonnes of
P absorbed
Cultural
e.g., hectares of
parkland
e.g., number of
visitors / hikers
e.g., hectares
of duck habitat
Ecosystem type
Type of service
Valuation
Monetary Services Supply
System of Environmental-Economic Accounting
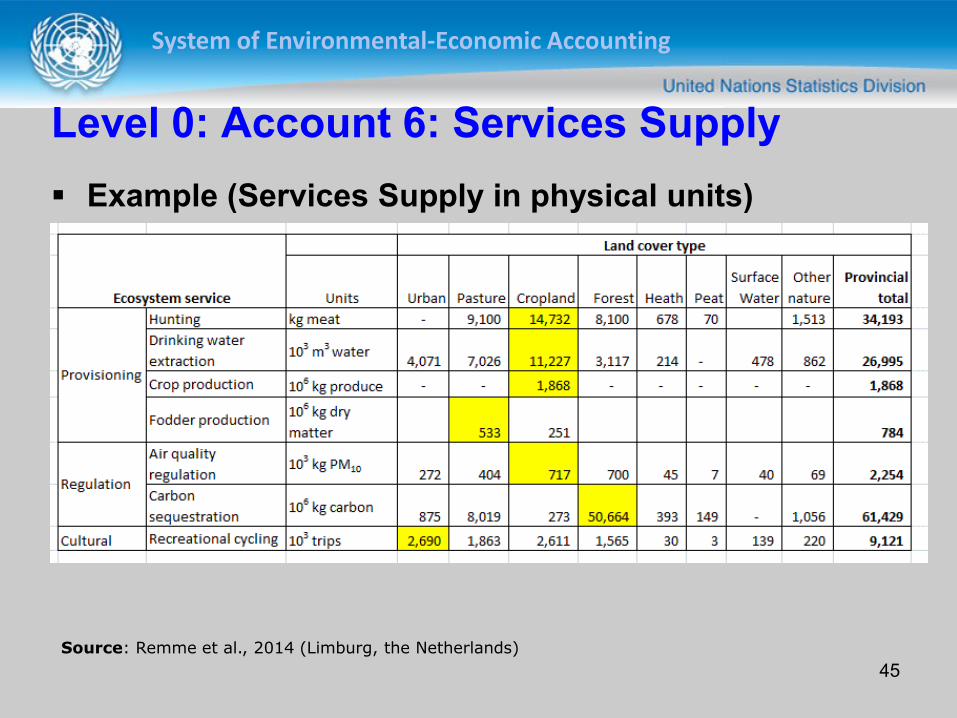
Level 0: Account 6: Services Supply
Example (Services Supply in physical units)
Source: Remme et al., 2014 (Limburg, the Netherlands)
45

System of Environmental-Economic Accounting
Level 0: Account 6: Services Supply
• What does a Services Supply Account look like?
• Spatially-detailed physical measures of “final” services according
to common Classification:
• Provisioning
• Regulating
• Cultural
• Physical measures (crops, flood control, clean drinking water,
carbon sequestration, recreation, …)
• Valuation where appropriate and available
Monetary Services Supply
46

System of Environmental-Economic Accounting
Level 0: Account 6: Services Supply
• What do you need to create a Services
Supply Account? • Ecosystem Extent, Ecosystem Condition
• Common spatial infrastructure (Spatial Units)
• Common Classification of services
• Data: • Field studies
• Transfer from other locations (benefits transfer, valuation)
• Economic production (agriculture, forestry, fisheries, water)
• Biophysical modelling
• Expertise: ecologists, geographers (GIS),
economists, policy analysts, statisticians
47

System of Environmental-Economic Accounting
Account 7: Services Use
48

System of Environmental-Economic Accounting
Level 0: Account 7: Services Use
• What? • Physical and monetary flows from ecosystems to beneficiaries
• Why? • Social, economic and environmental policies:
• Who benefits from ecosystem services?
• Who is dependent on ecosystem services?
• Link to consumption accounts in SNA (Augmented I-O…)
• Link to other SEEA-EEA accounts (Services Supply)
• Indicators:
• Dependence on ecosystem services where and whom
• Public goods from private ecosystems
49

System of Environmental-Economic Accounting
• What does a Services Use Account look like?
Level 0: Account 7: Services Use
50
Services Supply Account
Tables
Urban and
associated Forest tree cover Agricultural land Open wetlands
Provisioning
e.g., tonnes of
timber
e.g., tonnes of
wheat
Regulating
e.g., tonnes of
CO2 stored /
released
e.g., tonnes of
CO2 stored /
released
e.g., tonnes of
CO2 stored /
released
e.g., tonnes of
P absorbed
Cultural
e.g., hectares of
parkland
e.g., number of
visitors / hikers
e.g., hectares
of duck habitat
Ecosystem type
Type of service
Allocation Valuation
Monetary Services Use
System of Environmental-Economic Accounting
Level 0: Account 7: Services Use
• What does a Services Use Account look like?
• Aggregate tables of use of ecosystem services by:
• Beneficiary and
• Ecosystem type
• Physical measures
• Valuation where appropriate and available
Monetary Services Use
51

System of Environmental-Economic Accounting
Level 0: Account 7: Services Use
• What do you need to compile a Services Use
Account?
• Services Supply Account
• Data:
• Beneficiaries of ecosystem services by:
• service
• type of beneficiary and
• type of asset
• Expertise: Ecosystem accounting
52

System of Environmental-Economic Accounting
Account 8: Capacity
53

System of Environmental-Economic Accounting
Level 0: Account 8: Capacity
• What? • Expected flows of services
• Modeled using Ecosystem Condition Account
• Current and future capacity to supply services
• Why? • Policies related to changing land use, land use intensity,
environmental quality, population distribution
• Ecosystem assessments: Trade-off scenarios of services for
different future conditions
• Estimate Services Supply if little data available
• Calculate Ecosystem Asset Account
• “Value” is Net Present Value of future flows of services
• Indicators: • Services in physical and monetary terms
54

System of Environmental-Economic Accounting
Level 0: Account 8: Capacity
What do Capacity Accounts look like?
55
Urban and
associated Forest tree cover Agricultural land Open wetlands
Provisioning
e.g., tonnes of
timber
e.g., tonnes of
wheat
Regulating
e.g., tonnes of
CO2 stored /
released
e.g., tonnes of
CO2 stored /
released
e.g., tonnes of
CO2 stored /
released
e.g., tonnes of
P absorbed
Cultural
e.g., hectares of
parkland
e.g., number of
visitors / hikers
e.g., hectares
of duck habitat
Ecosystem type
Type of service
Area
Urban and
associated
Rainfed
herbaceous
cropland
Forest tree
cover
Inland water
bodies
Open wetlands
hectares
Ecosystem typeEcosystem extent
Ecosystem condition
Vegetation Biodiversity Soil Water Carbon Index
Condition Account (Current) Capacity (Current)
Assumptions about future
Condition Account (Future)
Area
Urban and
associated
Rainfed
herbaceous
cropland
Forest tree
cover
Inland water
bodies
Open wetlands
hectares
Ecosystem typeEcosystem extent
Ecosystem condition
Vegetation Biodiversity Soil Water Carbon Index
Biophysical
Modelling
Capacity (Future)
Urban and
associated Forest tree cover Agricultural land Open wetlands
Provisioning
e.g., tonnes of
timber
e.g., tonnes of
wheat
Regulating
e.g., tonnes of
CO2 stored /
released
e.g., tonnes of
CO2 stored /
released
e.g., tonnes of
CO2 stored /
released
e.g., tonnes of
P absorbed
Cultural
e.g., hectares of
parkland
e.g., number of
visitors / hikers
e.g., hectares
of duck habitat
Ecosystem type
Type of service
Biophysical
Modelling

System of Environmental-Economic Accounting
Level 0: Account 8: Capacity
• What do Capacity Accounts look like?
• Spatially-detailed: by ecosystem and service type
• Looks the same as the Services Supply Account
• But: Services are modelled
• Biophysical models estimate Capacity from Condition
• Capacity Accounts record “hypothetical” flow of services
• e.g., water purification potential of wetlands if there is no
pollution or beneficiaries
• Assumptions about the future are used to generate a
future Conditions Account
• Biophysical models estimate Future Capacity Account
56

System of Environmental-Economic Accounting
Level 0: Account 8: Capacity
• What do you need to compile a Capacity
Account? • Extent Account and Condition Account
• Ecosystem services classification
• Scenarios: assumptions about the future
• Data: • Ecological production functions
• Models may be generic or calibrated to local conditions
• Expertise: • Ecologists (modelling & production functions)
• Spatial analysts (many models are linked to GIS packages)
• Ecosystem accounting (to ensure coherence)
• Stakeholders (to agree on future scenarios)
57
System of Environmental-Economic Accounting
Account 9: Augmented I-O
58

System of Environmental-Economic Accounting
Level 0: Account 9: Augmented I-O
• What? • Addition to standard Input-Output tables to take into
account ecosystems (producers) and ecosystem
services (commodities)
• Why? • Show contribution of ecosystems and services to the
economy (direct and indirect)
• Support decisions about the economic impacts of
ecosystem change
• Link to SNA
• Use I-O methods to balance production and
consumption 59

System of Environmental-Economic Accounting
Level 0: Account 9: Augmented I-O
What do Augmented I-O Accounts look like?
60
Urban and
associated Forest tree cover Agricultural land Open wetlands
Provisioning
e.g., tonnes of
timber
e.g., tonnes of
wheat
Regulating
e.g., tonnes of
CO2 stored /
released
e.g., tonnes of
CO2 stored /
released
e.g., tonnes of
CO2 stored /
released
e.g., tonnes of
P absorbed
Cultural
e.g., hectares of
parkland
e.g., number of
visitors / hikers
e.g., hectares
of duck habitat
Ecosystem type
Type of service
Services Supply
Augmented I-O
Services Use

System of Environmental-Economic Accounting
Level 0: Account 9: Augmented I-O
• What do you Augmented I-O Accounts look
like?
• National level I-O tables (provincial or state if available)
• Rows added for commodities (ecosystem services)
• Columns added for producers (ecosystems)
• Physical or monetary
• Need monetary to balance
61

System of Environmental-Economic Accounting
Level 0: Account 9: Augmented I-O
• What do you need to compile Augmented I-O
Accounts? • Services Supply Account (physical and monetary)
• Services Use Accounts (physical and monetary)
• Data:
• Economic production functions including
ecosystem services • e.g., crop = f(ecosystem services, capital, labour…)
• Expertise:
• Input-Output experts (set up and operation)
• Productivity experts (production functions)
• Ecological economists (production functions)
62

System of Environmental-Economic Accounting
Account 10: Integrated Sector Accounts and
Balance Sheet
63

System of Environmental-Economic Accounting
Level 0: Account 10: Integrated Sector
Accounts and Balance Sheet
• What? • Economic sector level summary accounts
• Standard aggregates adjusted for degradation
• Why? • Augment the economic accounts of the SNA by integrating
into the sequence of accounts
• Integrated Sector Accounts produce aggregate
measures of economic activity, such as national income
and saving, which are adjusted for ecosystem degradation.
• Balance Sheets compare the values of ecosystem assets
with values of produced assets, financial assets (and
liabilities) and other economic assets.
64

System of Environmental-Economic Accounting
Level 0: Account 10: Integrated Sector
Accounts and Balance Sheet
What do Integrated Sector Accounts and
Balance Sheet look like?
65
Asset
Services
Supply
Services
Use
SNA

System of Environmental-Economic Accounting
Level 0: Account 10: Integrated Sector
Accounts and Balance Sheet
What do Integrated Sector Accounts and
Balance Sheet look like? • For example, the Production Account takes
▫ Total Output
Less: Intermediate consumption
= Gross Value Added
Less: Consumption of Fixed Capital
= Net Value Added
Less Depletion/Degradation of natural resources
= Depletion-adjusted Net Value Added
• Similar calculations result in other important
indicators: ▫ Depletion-adjusted Net Saving
66

System of Environmental-Economic Accounting
Level 0: Account 10: Integrated Sector
Accounts and Balance Sheet
What do you need to compile Integrated
Sector Accounts and Balance Sheet? • Asset Account
• Services Supply Account
• Services Use Account
• SNA
Data: • Monetary value of assets, services
Expertise: • National accounting
• Ecosystem accounting
67

System of Environmental-Economic Accounting
Supporting information: Socio-economic
68

System of Environmental-Economic Accounting
Level 0: Supporting Information: Socio-economic
• What? • Socio-economic data and other drivers of change
• Why? • People, governments and businesses are drivers of change and
beneficiaries of Ecosystem Services
• Understand why a change occurred (natural or human?)
• Support scenarios of future (Capacity)
• Links to SEEA-EEA accounts (Extent, Condition, Water,
Carbon, Biodiversity, Services Supply, Services Use, Asset)
• Indicators: • Allocate changes in assets to local, national and global drivers
• Allocate supply of services to beneficiaries
• Estimate dependence of population and business on ecosystems
(food security, water security, flood risks)
69

System of Environmental-Economic Accounting
Level 0: Supporting Information: Socio-economic
What does Socio-economic Information look like?
• Drivers of change: ▫ Maps or tables to explain changes in Extent, Conditions and
Services Supply
– e.g., changes in land-use
– e.g., trends in rainfall
• Socio-economic data: ▫ Maps or tables to explain business and population drivers
– e.g., changes in commodity prices
– e.g., trends in population growth
▫ Maps or tables to calculate beneficiaries
– e.g., population distribution
70

System of Environmental-Economic Accounting
Level 0: Supporting Information: Socio-economic
• What do you need to compile Socio-economic
information?
• Common spatial infrastructure (Spatial Units)
• Drivers of change data: • Local, global climate
• Global, national, local economic conditions (GDP,
employment, growth rates)
• Local activities (agriculture intensity, forestry intensity,
recreation intensity)
• Local development plans (land use, urban expansion)
• Expertise: Economists, climate specialists,
sociologists, regional planners
71

System of Environmental-Economic Accounting
Level 0: Supporting Information: Socio-economic
• What do you need to compile Socio-economic
information?
• Socio-economic data:
• Local population distribution (Census, surveys, case studies):
• Income
• Industry of employment
• Dependence on nature (Case studies)
• Business types by location (surveys, Business Register)
• Environmental protection expenditures
• Dependence on nature (biomass, energy, water,
pollution regulation…)
• Expertise: Economists, sociologists, statisticians,
geographers (GIS, integration) 72
System of Environmental-Economic Accounting
End of Accounts…
Questions?
Discussion
Prepare for group exercise…think about: • What are your priority accounts?
• What are the opportunities to produce them? ▫ Stakeholders?
▫ Institutional mechanisms?
▫ Current activities?
• What are the constraints? ▫ Data?
▫ Capacity?
Next up: Tools 73

System of Environmental-Economic Accounting
Level 0: Tools
Classifications
Spatial units, scaling & aggregation
Biophysical modelling
Valuation
Other tools: • Statistical quality guidelines
• Interdisciplinary teams
• Case studies and surveys
Not discussed: GIS (spatial analysis), data
analysis, communications, engagement, data
management, project planning and evaluation…
74

System of Environmental-Economic Accounting
Tools 1: Classifications
75

System of Environmental-Economic Accounting
Level 0: Tools 1: Classifications
What? • From SEEA-CF:
▫ Land Cover, Land Use
▫ Economic units, industry sectors
• New: ▫ Final ecosystem services
Why? • Accounting needs Consistent and Coherent and
Comprehensive: Classifications ▫ Consistent: use same classification for same concept
▫ Coherent: with other classifications
▫ Comprehensive: “Classifications Certify Complete Coverage”
76

System of Environmental-Economic Accounting
Level 0: Tools 1: Classifications
Land Cover • From SEEA-CF (p.276)
• Uses FAO LCCS3
(Food and Agriculture
Organization – Land
Cover Classification
System v3) definitions
• High-level aggregate: • May adapt to local
situations
• Used as basis for
“ecosystem type”
77
01 Artificial surfaces (including urban and associated
areas)
02 Herbaceous crops
03 Woody crops
04 Multiple or layered crops
05 Grassland
06 Tree covered areas
07 Mangroves
08 Shrub covered areas
09 Shrubs and/or herbaceous vegetation, aquatic or
regularly flooded
10 Sparsely natural vegetated areas
11 Terrestrial barren land
12 Permanent snow and glaciers
13 Inland water bodies
14 Coastal water bodies and inter-tidal areas

System of Environmental-Economic Accounting
Level 0: Tools 1: Classifications
Land Use From SEEA-CF (p. 266)
Detailed (4-digit level)
78
1.0 Land 1.1 Agriculture
1.2 Forestry
1.3 Aquaculture
1.4 Built up and related areas
1.5 Maintenance and restoration of environmental functions
1.6 Other uses of land
1.7 Land not in use
2.0 Inland waters 2.1 Aquaculture and holding facilities
2.2 Maintenance and restoration of environmental functions
2.3 Other uses of inland waters
2.4 Inland waters not in use
3.0 Coastal waters 3.1 Aquaculture and holding facilities
3.2 Maintenance and restoration of environmental functions
3.3 Other uses of coastal waters
3.4 Coastal waters not in use
4.0 Exclusive Economic Zone (EEZ) 4.1 Aquaculture and holding facilities
4.2 Maintenance and restoration of environmental functions
4.3 Other uses of coastal waters
4.4 Coastal waters not in use

System of Environmental-Economic Accounting
Level 0: Tools 1: Classifications
Services • Based on Common
International
Classification of
Ecosystem Services
(CICES)
• Not mutually exclusive
• A list of “final”
services
• More detail (4-digit)
• Does not include
“supporting services”
(= ecosystem
functions)
79
Section Division Group
01.01.01 Biomass
01.01.02 Water
01.02.01 Biomass
01.02.02 Water
01.03.01 Biomass-based energy sources
01.03.02 Mechanical energy
02.01.01 Mediation by biota
02.01.02 Mediation by ecosystems
02.02.01 Mass flows
02.02.02 Liquid flows
02.02.03 Gaseous / air flows
02.03.01 Lifecycle maintenance, habitat and gene pool
protection
02.03.02 Pest and disease control
02.03.03 Soil formation and composition
02.03.04 Water conditions
02.03.05 Atmospheric composition and climate
regulation
03.01.01 Physical and experiential interactions
03.01.02 Intellectual and representative interactions
03.02.01 Spiritual and/or emblematic
03.02.02 Other cultural outputs
01. Provisioning
02. Regulation &
Maintenance
03. Cultural
01.01 Nutrition
01.02 Materials
01.03 Energy
02.01 Mediation of waste,
toxics and other nuisances
02.02 Mediation of flows
02.03 Maintenance of
physical, chemical,
biological conditions
03.01 Physical and
intellectual interactions
with biota, ecosystems, and
land-/seascapes
[environmental settings]
03.02 Spiritual, symbolic
and other interactions with
biota, ecosystems, and land-
/seascapes [environmental
settings]
System of Environmental-Economic Accounting
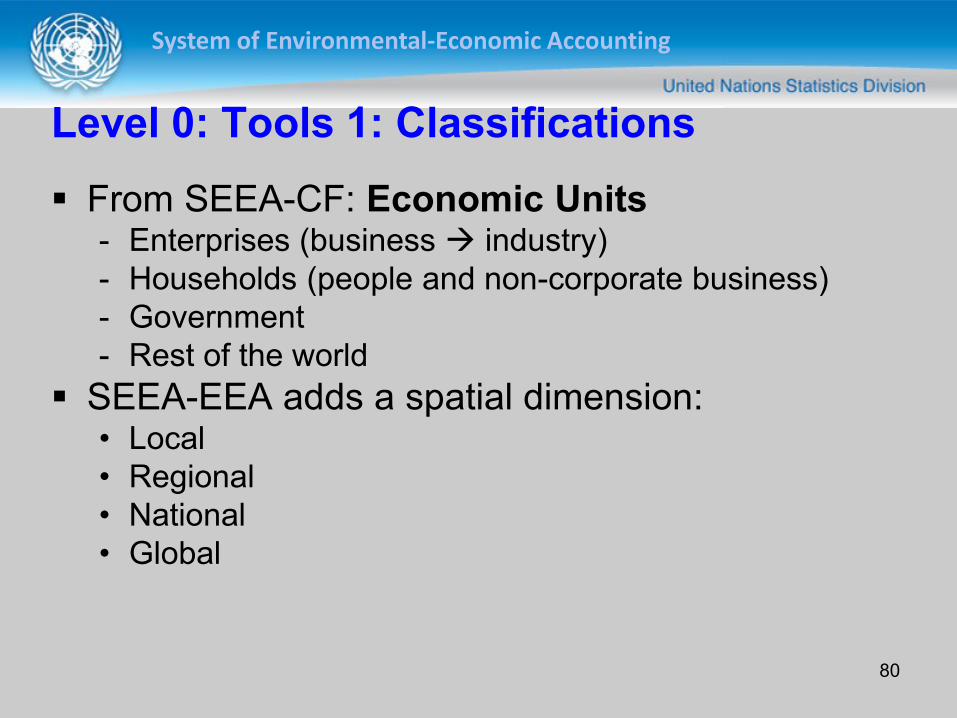
Level 0: Tools 1: Classifications
From SEEA-CF: Economic Units - Enterprises (business industry)
- Households (people and non-corporate business)
- Government
- Rest of the world
SEEA-EEA adds a spatial dimension: • Local
• Regional
• National
• Global
80

System of Environmental-Economic Accounting
Tools 2: Spatial units
81

System of Environmental-Economic Accounting
Level 0: Tools 2: Spatial units
What? • A common definition of Spatial Units for all accounts
• Based on surface characteristics (terrestrial, freshwater, coastal
and marine)
Why? • Accounting needs statistical units about which information is
compiled, derived, reported and compared ▫ e.g., business statistics are built on locations, establishments,
companies and enterprises
• Information is collected on many spatial levels ▫ Needs to be consolidated within a GIS or spatial model
• First step in tabulating & aggregating more detailed data ▫ Not everybody is a GIS expert
• Links accounts together:
▫ (Extent, Condition, Services Supply…) 82

System of Environmental-Economic Accounting
Recommended three levels: hierarchical and mutually exclusive: 1. Basic Spatial Unit (BSU)
• Pixel or grid cell 2. Ecosystem Unit (EU)
• Homogenous according to criteria (cover, slope, drainage area, elevation…)
• Consolidate for tables by EU type 3. Ecosystem Reporting Area (ERA)
• For reporting (sub-drainage area, administrative area…)
Establishes Ecosystem Extent Account
Source: Statistics Canada, 2013
Level 0: Tools 2: Spatial units
83

System of Environmental-Economic Accounting
Level 0: Tools 2: Scaling
What? • Converting information from one scale to another (spatial,
temporal, thematic)
Why? • Information exists in various types:
▫ Point (water quality monitoring, “study sites”, etc.)
▫ Area (land cover, protected area, species range, etc.)
▫ Network (roads, streams, corridors, etc.)
• Need to understand how and when to attribute information from
one scale to another
84

System of Environmental-Economic Accounting
Level 0: Tools 2: Scaling
Main approaches • Downscaling
▫ Attributing information from larger areas to smaller areas contained
within them
▫ Caution: Data need to be evenly distributed
• Upscaling ▫ Attributing information from smaller areas to larger areas
▫ Caution: Data need to be representative
• Transfer ▫ Transferring information measured in one location to another
▫ Often used in terms of Benefits Transfer
▫ Caution: Locations need to be very similar
85

System of Environmental-Economic Accounting
Level 0: Tools 2: Aggregation
What?
• Combining many measures into simpler ones
• Dissimilar measures may be aggregated using:
▫ Indices (e.g., water quality index)
▫ Conversion to common units (e.g., CO2 equivalents)
Why?
• Accounting requires aggregates (of dollars, business
types, sub-populations, regional summaries, national
indicators…)
• Summary indicators for dashboards, linking to
economic accounts
86

System of Environmental-Economic Accounting
Level 0: Tools 2: Aggregation
Aggregating dissimilar biophysical measures:
• Requires indexing (comparison with reference)
• Example: ecosystem condition measures, service measures
• Caution: Requires understanding of relative importance of
component measures (weighting)
Final aggregates
• e.g., total value of ecosystem services, total asset value
• Require many assumptions (relative importance, methods…)
• Services can be competing, complementary or independent
• Caution: Monetary valuation is often applied inappropriately
Valuation results can be misleading
87

System of Environmental-Economic Accounting
Tools 3: Biophysical modelling
88

System of Environmental-Economic Accounting
Level 0: Tools 3: Biophysical modelling
What? • Four main approaches:
Why? • Estimate Ecosystem Services across spatial units and time
• Estimate Ecosystem Capacity from Ecosystem Condition
• Combine data from various sources and scales (e.g., point field
data and satellite data)
• Estimate unknown data values
• GIS-based spatial modelling approaches have methods built-in
89
1. Look-up tables
2. Statistical approaches
3. Geostatistical interpolation
4. Process-based modelling

System of Environmental-Economic Accounting
Level 0: Tools 3: Biophysical modelling
Approaches: 1. Look-up tables 2. Statistical approaches 3. Geostatistical interpolation 4. Process-based modeling
90
Attribute values for an ecosystem service (or other measure) to every Spatial Unit in the same class (e.g., a land cover class).
Example: Benefits Transfer
one ha of forest = $5000 attribute to each ha of forest
error rate: 60-70%

System of Environmental-Economic Accounting
Level 0: Tools 3: Biophysical modelling
Approaches: 1. Look-up tables 2. Statistical approaches 3. Geostatistical interpolation 4. Process-based modeling
91
Estimate ecosystem services, asset or condition based on known explanatory variables such as soils, land cover, climate, distance from a road, etc., using a statistical relation.
Example: Function Transfer
Value = f(land cover, population, roads, climate)
Error rate = 40-50%

System of Environmental-Economic Accounting
Level 0: Tools 3: Biophysical modelling
Approaches: 1. Look-up tables 2. Statistical approaches 3. Geostatistical interpolation 4. Process-based modeling
92
Use algorithms to predict the measure of unknown locations on the basis of measures of nearby known measures:
Example: Kriging
Error rate = ?
Known
Unknown

System of Environmental-Economic Accounting
Level 0: Tools 3: Biophysical modelling
Approaches: 1. Look-up tables 2. Statistical approaches 3. Geostatistical interpolation 4. Process-based modeling
93
Predict ecosystem services based on a set of future condition or management scenarios:
Example: Scenario for future services based on expected changes in land cover, demand and management
Error rate = 100%

System of Environmental-Economic Accounting
Tools 4: Valuation techniques
94

System of Environmental-Economic Accounting
Level 0: Tools 4: Valuation
What? • Attributing economic or social value to assets
& services
• Ecosystem services valuation produces:
95
▫ Average values (per hectare, under specific conditions)
▫ Or Marginal values (change in value of converting one hectare)
• Asset valuation: ▫ Scenarios of future Conditions and demand net present value of
Ecosystem Asset
Why? • Integrate with SNA
▫ Augmented I-O, Integrated Sector Accounts and Balance Sheet
• Assessing trade-offs: Convert or protect?
• Monetary valuation is embedded in many: ▫ National plans: cost/benefit, payment & compensation schemes
▫ Research approaches: contingent valuation, choice modelling

System of Environmental-Economic Accounting
Level 0: Tools 4: Valuation
Approaches (non-market): • Revealed preferences:
▫ Production function: (resource rent)
• value = f(ecosystem, produced capital, labour)
▫ Replacement cost: produce service with another ecosystem/asset
▫ Hedonic pricing: real-estate prices, wages with respect to distance
▫ Averting behaviour: expenditures to avoid degradation
▫ Travel cost: expenditures to enjoy a service (e.g., recreation)
• Stated preference: ▫ Contingent valuation, choice modelling: willingness to pay
• Simulated exchange values: model supply/demand
• Payments for ecosystem services (PES): ▫ Carbon, biodiversity markets
• Payments made to improve condition: Rehabilitation costs
96

System of Environmental-Economic Accounting
Level 0: Tools 4: Valuation
Measurement challenges • More challenging for Regulating and Cultural Services
• How to measure monetary value of regulating services? ▫ Spatial dependencies (downstream, species/habitat)
▫ Multiple beneficiaries
▫ Risks (e.g., flood control, climate regulation)
• Non-linear responses ▫ Thresholds/resilience, climate change, refuge areas
• Aggregating values of different services ▫ Services can be competing, complementary or independent
• Transferring measured values from one site to another ▫ (Discussed under Biophysical Modelling & Scaling)
• Highly dependent on decision context ▫ Project assessment: trade-offs
▫ Long-term sustainable use of ecosystems: high-level indicators
▫ Payments and compensation: needs to have precise values
97

System of Environmental-Economic Accounting
Tools 5: Other tools
98

System of Environmental-Economic Accounting
Level 0: Tools 5: Other tools
What? • Statistical quality guidelines
Why? • Need a common concept of quality, uncertainty and “fitness for
use”
How? • Apply national or international guidelines
▫ UN National Quality Assurance Framework (NQAF)
▫ International Monetary Fund – Data Quality Assessment
Framework (IMF-DQAF)
▫ Disciplinary “accepted methods” are less-well documented
• Build a culture of quality:
▫ Metadata, process documentation, strategic planning…
• Work within accepted statistical processes (e.g., Generic
Statistical Business Processing Model – GSBPM) 99

System of Environmental-Economic Accounting
Level 0: Tools 5: Other tools
Why? • No single discipline can do it alone
Need a shared “language”
Need to become transdisciplinary
How? • Agree on common objectives and approaches
• Work together to avoid disciplinary “stovepipes”
• Engage experts, data providers, users and supporters
100
What? • Interdisciplinary teams (ecology,
economics, geography, policy, sociology,
statistics…)

System of Environmental-Economic Accounting
Level 0: Tools 5: Other tools
What? • Case studies & surveys linking services with benefits
Why? • In some countries, there is a close relationship between
ecosystem services and poverty, water security, food security,
employment…
• Link ecosystem condition, services with socio-economic priorities
(well-being, health, income, employment…)
How? • Local surveys for priority stakeholders (e.g., dependent on
ecosystem services)
• National sample surveys (e.g., water use, importance of nature,
expenditures on environmental protection…)
101

System of Environmental-Economic Accounting
Other related training materials
Secretariat for the Convention on Biological
Diversity (SCBD) • Quick Start Package (QSP) (Weber, 2014)
▫ Available online at www.ecosystemaccounting.net
▫ Includes free GIS software and tutorials
• National Biodiversity Strategies and Action Plans ▫ Training modules at www.cbd.int/nbsap/training/
World Bank WAVES
Statistics Canada: • Measuring Ecosystem Goods and Services Teacher’s Kit
102

System of Environmental-Economic Accounting
Evaluation of the training module
Please complete the online evaluation form for this
module: http://tinyurl.com/pbopmy2
For this module
• What did you learn that you could apply in your work?
• Was the presentation clear and informative?
• Was it too simple? Too complex?
• Was there anything you did not understand?
• What additions or deletions would you suggest (recognizing that
the unit is intended for a general audience)?
• Do you have any suggestions as to how the SEEA-EEA may be
improved (concepts, principles) in this area?

System of Environmental-Economic Accounting
References
SNA 2008
SEEA Central Framework, SEEA-EEA, Applications and Extensions
SCBD Quick Start Package
World Bank WAVES: Designing Pilots for Ecosystem Accounting
International Monetary Fund: DQAF
UN: NQAF
UNECE: GSBPM Australian Bureau of Statistics, 2013. Land Account: Queensland, Experimental
Estimates, 2013
Eigenraam, M., Chua, J. and HASKER, J., 2013. Environmental-Economic Accounting:
Victorian Experimental Ecosystem Accounts, Version 1.0. Melbourne, Australia:
Department of Sustainability and Environment, State of Victoria.
Remme, Roy P., Matthias Schröter, and Lars Hein. "Developing spatial biophysical
accounting for multiple ecosystem services." Ecosystem Services 10 (2014): 6-18.
Statistics Canada, 2013. Human Activity and the Environment: Measuring Ecosystem
Goods and Services 2013. 16-201-XWE. Ottawa: Government of Canada.
Weber, J., 2014. Ecosystem Natural Capital Accounts: A Quick Start Package. 77
(Technical Series). Montreal: Secretariat of the Convention on Biological Diversity. 104

System of Environmental-Economic Accounting
Acknowledgements
This project is a collaboration between The United
Nations Statistics Division (UNSD), United Nations
Environment Programme (UNEP) and the Secretariat of
the Convention on Biological Diversity (CBD) and is
supported by the Government of Norway.
Contact: [email protected]
105