kernel holding s.a. annual report€¦ · kernel holding s.a. annual report and accounts 30 june...
TRANSCRIPT

www.kernel.ua Kernel Holding S.A. Annual Report and Accounts 30 June 2019 0
Kernel Holding S.A.
ANNUAL REPORT For the year ended 30 June 2019

Kernel Holding S.A. Annual Report and Accounts 30 June 2019 2 www.kernel.ua
Contents
Strategic
Report Sustainability
Corporate
Governance
Financial
Statements
Kernel is a diversified agricultural business in the Black Sea region, listed on the main market of the Warsaw Stock Exchange. We are the world’s largest producer and exporter of sunflower oil,
the largest grain exporter from Ukraine, operator of an extensive
agricultural logistics network and the largest producer of grain
and oilseeds in Ukraine. In FY2019, we supplied 9 million tons of
agricultural products from Ukraine across the world.
01-38 Strategic Report 3 Key Highlights
4 Operating Highlights
5 Chairman’s Statement
7 Our Business Model
8 Kernel at a Glance
9 Our Strategy 2021
10 Financial Performance in FY2019
13 Segment Performance
13 Oilseed Processing
19 Infrastructure and Trading
25 Farming
30 Risk Management
35 Alternative Performance Measures
39-60
Sustainability
61-67
Corporate Governance
68-127 Financial Statements
68 Independent Auditor’s Report
72 Statement of Management Responsibilities
73 Selected Financial Data
74 Consolidated Statement of Financial Position
75 Consolidated Statement of Profit or Loss
76 Consolidated Statement of Profit or Loss and
Other Comprehensive Income
77 Consolidated Statement of Changes in Equity
78 Consolidated Statement of Cash Flows
79 Notes to the Consolidated Financial Statements
128 Corporate Information

Kernel Holding S.A. Annual Report and Accounts 30 June 2019 3 www.kernel.ua
Key Highlights
Strategic
Report Sustainability
Corporate
Governance
Financial
Statements
…………………………………………………………………… Net debt / EBITDA
0.9x 0.8x
1.6x
2.8x
2.0x
FY2015 FY2016 FY2017 FY2018 FY2019
US$ million except ratios and EPS FY2018 FY2019 y-o-y
Income statement highlights Revenue 2,403 3,992 66%
EBITDA 1 223 346 55%
Net profit attributable to equity holders of Kernel Holding S.A. 52 189 3.6x
EBITDA margin 9.3% 8.7% (0.6pp)
Net margin 2.2% 4.7% 2.6pp
Earnings per share, US$ 0.64 2.31 3.6x
Cash flow highlights Operating profit before working capital changes 183 368 101%
Change in working capital (31) (94) 3.0x
Finance costs paid (69) (76) 10%
Income tax paid (5) (3) (36%)
Net cash generated by operating activities 82 199 2.4x
Net cash used in investing activities (156) (241) 55%
Liquidity and credit metrics Net debt 622 694 11%
Readily marketable inventories 2 325 293 (10%)
Adjusted net debt 3 297 400 35%
Shareholders' equity 1,171 1,351 15%
Net debt / EBITDA 2.8x 2.0x (0.8x)
Adjusted net debt / EBITDA 1.3x 1.2x (0.2x)
EBITDA / Interest 3.4x 4.2x 0.8x
Non-financial highlights Number of employees (full-time equivalent) at 30 June 15,116 13,397 (11%)
Rate of recordable work-related injuries, accidents per million worked hours 0.55 0.60 8%
Social spending, US$ million 2.4 2.3 (6%)
Direct greenhouse gas emissions, thousand tons of CO2 equivalent 260 234 (10%)
Total energy consumption, terajoules 6,977 6,857 (2%) Note: Financial year ends 30 June. 1. Hereinafter, EBITDA is calculated as the sum of the profit from operating activities plus amortization and depreciation. 2. Readily marketable inventories are inventories such as corn, wheat, sunflower oil and other products that could easily be converted into cash due to their commodity characteristics, widely
available markets and the international pricing mechanism. 3. Adjusted debt is the sum of short-term interest-bearing debt, current maturities of long-term interest-bearing debt and long-term interest-bearing debt, less cash and cash equivalents, market-
able securities and readily marketable inventories at cost. Hereinafter differences between totals and sums of the parts are possible due to rounding. Hereinafter “Kernel”, “Group” or “Company” refers to the Kernel Holding S.A. group of companies. Non-financial highlights for FY2018 may differ with ones presented in FY2018 annual report due to changes in calculation methodology, as described in “Sustainability” section of this report.
……………………………………………………………………
EBITDA US$ million
397
346 319
223
346
FY2015 FY2016 FY2017 FY2018 FY2019
…………………………………………………………………… Net cash from operations US$ million
405
134
77 82
199
FY2015 FY2016 FY2017 FY2018 FY2019

Kernel Holding S.A. Annual Report and Accounts 30 June 2019 4 www.kernel.ua
Operating Highlights
Strategic
Report Sustainability
Corporate
Governance
Financial
Statements
Following the divestment of suboptimal farm-
land, we harvested 529 thousand hectares in
FY2019, down 11% y-o-y. Though the harvest
of key crops was the record in our history,
standing at 3.3 million tons as we achieved
record yields for late crops supported by:
• Favorable weather conditions;
• Quick and successful integration of farming business acquired in 2017; and
• Continued productivity gains
Effective hedging strategy applied along with
strong crop yields resulted in EBITDA margin
increasing to US$ 344 per hectare, up 2.3x y-
o-y.
With 529 thousand hectares harvested in
FY2019, our farming segment generated the
highest ever US$ 182 million EBITDA, 2.0x in-
crease as compared to FY2018, being the flag-
ship Kernel’s business this season.
We processed the highest ever 3.2 million tons
of sunflower seeds in FY2019, and our sales
of sunflower oil achieved highest ever 1.6 mil-
lion tons in FY2019 exceeding the production
volumes and depleting carry-over stock.
EBITDA generated per ton of oil sold recov-
ered from the lowest ever observed level of
US$ 54 per ton in FY2018 to US$ 67 in the re-
porting period. Profitability was impacted by
two opposite factors:
• Strong 15.2 million tons harvest of sunflower seeds in Ukraine, which reduced the gap be-tween crushing capacities in Ukraine and supply of seeds, but…
• … Subdued global sunflower oil prices, which reduced from US$ 750 per ton of un-refined oil sold in bulk (FOB Black Sea ba-sis) at the beginning of the season to US$ 620 per ton of oil in December 2018 (the lowest in a decade). At our level of margins, such price weakness has a tremendous im-pact on profitability, and it undermined more substantial margin improvement in FY2019.
Consequently, segment EBITDA increased
42% y-o-y, to US$ 109 million.
…………………………………………………………………………………… EBITDA margin US$ / ha
256
374 378
149
344
FY2015 FY2016 FY2017 FY2018 FY2019…………………………………………………………………………………… EBITDA
US$ millions
98
146 146
89
182
FY2015 FY2016 FY2017 FY2018 FY2019
…………………………………………………………………………………… EBITDA margin US$ / ton of sunflower oil sold
190
120
83
54 67
FY2015 FY2016 FY2017 FY2018 FY2019
In FY2019, we delivered record volumes in our
history: 6.1 million tons of grain exported (#1 in
Ukraine), 4.6 million tons transshipped through
our terminals, and 4.3 million tons of intake by
our silo network. These achievements were
driven by:
• Record crop yields of our farming segment for 2018 crop;
• Full capacity utilization of our infrastructure;
• Usage of 3rd-party export terminal in the port of Pivdennyi.
EBITDA margin per ton of grain exported
through our value chain reduced to US$ 17, di-
luted by increasing scale of our low-margin
trading operations and Avere negative perfor-
mance, while keeping contribution from our
high-margin infrastructure businesses limited.
As a result, total segment EBITDA in FY2019
added US$ 5 million as compared to the previ-
ous year, to US$ 106 million.
Farming
…………………………………………………………………………………… Kernel’s key crop production
1.8 1.9 2.1 2.5 3.3
383 391 385
596 529
FY2015 FY2016 FY2017 FY2018 FY2019
Crop production, million tons
Acreage harvested, thousand hectares
Oilseed Processing
…………………………………………………………………………………… EBITDA1 US$ millions
213
129
100 77
109
FY2015 FY2016 FY2017 FY2018 FY2019
…………………………………………………………………………………… Segment volumes million tons
2.5 2.7
3.0 3.1 3.2
1.1 1.1 1.2
1.4 1.6
FY2015 FY2016 FY2017 FY2018 FY2019
Oilseeds processed Sunflower oil sales
Infrastructure and Trading
…………………………………………………………………………………… Segment volumes million tons
4.7 4.4
5.1
4.0
6.1
3.6 3.7
4.5 4.1
4.6
2.5 2.8
3.3 3.3
4.3
FY2015 FY2016 FY2017 FY2018 FY2019
Kernel grain export volumes (ex. Avere)Export terminal throughput (Ukraine)Inland silos in-take volumes
Infrastructure and Trading
…………………………………………………………………………………… EBITDA margin US$ / ton of grain exported
24 2422
26
17
FY2015 FY2016 FY2017 FY2018 FY2019
Note: the company has changed segment disclosure starting from FY2019, so the volumes and margins metrics were recalculated retrospectively and differ from figures
reported by FY2018 inclusively.
1) here and further segment EBITDA is provided before unallocated corporate expenses.
…………………………………………………………………………………… EBITDA US$ millions
114 107 110 101 106
FY2015 FY2016 FY2017 FY2018 FY2019

www.kernel.ua Kernel Holding S.A. Annual Report and Accounts 30 June 2019 5
Chairman’s Statement
Strategic
Report Sustainability
Corporate
Governance
Financial
Statements
Andrii Verevskyi Chairman of the Board of Directors,
Founder
Dear Shareholders, On behalf of the Board of Directors of Kernel
Holding S.A. I am pleased to present the re-
sults of the group for the year ended 30 June
2019. We generated US$ 346 million of
EBITDA (up 55% y-o-y) and US$ 189 million
of net profit attributable to shareholders of
Kernel Holding S.A. (up 3.6x y-o-y), improv-
ing our solid balance sheet position with net-
debt-to-EBITDA ratio at 2.0x as of 30 June
2019.
FY2019 highlights FY2019 was a year of great achievements.
We became the undisputed champion in
grain export volumes from Ukraine outper-
forming numerous international and local
peers. Farming segment harvested the rec-
ord crop, the acquisition of grain railcars en-
hanced our logistic capabilities and origina-
tion reach, while Strategy 2021 passed criti-
cal milestones.
Local market fundamentals were more favor-
able for our Oilseed Processing business in
FY2019 than a year ago. Ukraine harvested
a strong 15.2 million tons of sunflower seeds,
13% up y-o-y, which materially bridged the
gap to 18.5 million tons of installed pro-
cessing capacities, pushing up crush mar-
gins. However, general weakness in global
sunflower oil price prohibited EBITDA mar-
gins from recovering to normalized levels. As
a result, our EBITDA margin ended up at US$
67 per ton of oil sold, up 24% y-o-y, below its
long-term potential. Combined with a record
1.6 million tons sales of sunflower oil, it trans-
lated to US$ 109 million segment EBITDA, a
42% increase y-o-y.
Infrastructure and Trading segment perfor-
mance in FY2019 was uneven. On one hand,
we delivered the highest ever volume across
all our business lines, becoming the #1 grain
exporter from Ukraine with 6.1 million tons
of exports. This is solid early progress to-
wards set volume targets in our Strategy
2021. On top of that, record volumes were
achieved in our silo and export terminals busi-
nesses, enhanced by the improvement of
grain trading margins and further boosted
with a timely investment in grain railcars. On
the other hand, these achievements were
blurred by softer infrastructure margins and
negative contribution by Avere in FY2019. As
a result, EBITDA of the segment amounted to
US$ 106 million, up 5% as compared to last
year.
With the largest crop size in our history,
Farming segment generated US$ 182 million
of EBITDA, the highest ever, owing to sup-
portive weather conditions and the smooth in-
tegration of the farming landbank acquired in
2017, along with effectively used hedging so-
lutions.
On our climb to Strategy 2021 targets, we
completed the major greenfield expansion of
our grain storage capacity and commissioned
the first stage of our new export terminal in
the port of Chornomorsk enhancing through-
put capabilities.
In addition, Kernel acquired RTK-Ukraine
LLC, the largest private operator of grain rail-
cars in Ukraine, for US$ 65 million in February
2019. No doubt this deal has strong value-ac-
cretive potential as we expect EBITDA contri-
bution over US$ 35 million in FY2020. With
this transaction, Kernel covered in-house
needs and hedged against constantly grow-
ing railcar renting costs.
In February 2019, Kernel purchased 5.85%
interest in ViOil Holding Ltd, the largest inde-
pendent sunflower oil producer in Western
Ukraine with aggregate crushing capacity of
1.1 million tons and a network of silos. A cus-
tomary shareholder agreement in relation to
ViOil grants certain rights making us the front-
runner in the future sale process. This deal is
an important strategic step towards the future
consolidation of the sector, where Kernel will
play a leading role.
With regards to credit, I would like to highlight
the launch of our cooperation with two world-
class international financial institutions sup-
porting us with long-term project financing.
European Investment Bank provided Kernel
with a 10-year loan amounting to US$ 250
million, and EBRD together with Clean Tech-
nology Fund agreed to finance our green en-
ergy projects up to US$ 56 million with an 8-
year loan.
The permanent focus on sustainability of
our operations translated into the reduction of
energy consumption and greenhouse gas
emissions in FY2019 despite increased scale
of our business. We continued investing in
our employees, supporting local communities
and contributing to overall sector productivity
by sharing our knowledge and technology
with other farmers via proprietary Open Agri-
business platform. As a clear market leader,
we are the role model for other companies in
Ukraine in building sustainable and responsi-
ble business.
Following results of FY2019, the Board of Di-
rectors proposes shareholders to approve the
dividend of US$ 0.25 per share.
FY2020 outlook The new season seems to be fundamentally
strong for our Oilseed Processing segment.
Kernel Holding S.A. Annual Report and Accounts 30 June 2019 6 www.kernel.ua
Chairman’s Statement
Strategic
Report Sustainability
Corporate
Governance
Financial
Statements
Sunflower harvest in Ukraine is expected at
the level of 15.2 million tons, virtually un-
changed vs. FY2019, while sunflower oil
prices now are higher than last year, building
momentum for stronger profitability with a rec-
ord 3.3 million tons of sunflower seed to be
crushed in FY2020.
As part of Strategy 2021, almost half of our
green energy heat & power co-generation ca-
pacities are due for commissioning in spring
2020, contributing to our Oilseed Processing
segment. And the nearby launch of the sec-
ond stage of a brand-new export terminal in
the port of Chornomorsk will add a total of 4
million tons to our annual grain handling ca-
pacity.
As a result, we shall export 8 million tons of
grain from Ukraine in FY2020, 7 million of
which will pass through our terminals achiev-
ing one of our Strategy 2021 targets ahead of
the initial timeline.
In order to secure strong volumes for our
crushing and grain export businesses, our
procurement team plans to originate a record
8.4 million tons of grain and oilseeds in
FY2020, a 33% increase y-o-y.
Unlike last year, Farming segment is ex-
pected to face headwinds as normalization of
crop yields, combined with a nearly 7% cost
base inflation and further drop in global soft
commodity prices, should take their toll. An-
other distinctive element of this season is that
we remain naturally long, which will add both
upside and downside risk to our Farming seg-
ment earnings potential this season.
Capital Expenditures within Strategy 2021
are projected to peak in FY2020 with US$ 300
million to be deployed to cover both expan-
sion and maintenance needs, as part of the
initially planned FY2019 CapEx was moved
forward to FY2020. However, the total invest-
ment program capital requirements remain
unchanged.
The farmland market reform is widely ex-
pected to be adopted near term, whereby ag-
ricultural land may become freely tradable in
Ukraine, although exact terms and conditions
are not yet known. We consider a broad and
liberal farmland reform shall unlock the full
potential of Ukrainian agriculture contributing
to economic development of the country. Ob-
viously, with over 500,000 hectares of farm-
land under cultivation and with the direct ac-
cess to landowners, Kernel is well placed to
be an active farmland market participant lev-
eraging its multiple sources of on-demand
capital.
Delivering on our Strategy 2021 We are building today for the better tomorrow
of Kernel. We have reached a midpoint where
capital deployed gradually turns into cash
generation, crystalizing our leadership posi-
tion with the most efficient asset base across
each business line.
The critical milestones attained over the past
year and set targets for the coming years
clearly evidence that we will deliver on time
and within initially planned budgets. The suc-
cessful completion of investments in silo busi-
ness, grain railcars, and leasehold farmland
done over the recent past are the first minor
achievements on that path.
Our US$ 180 million new Western Ukrainian
oilseed processing equipped with co-genera-
tion heat & power plant is expected to be
commissioned in spring 2021. The US$ 150
million green energy plants will be commis-
sioned throughout spring 2020 and spring
2021. Meanwhile, the second stage of the
US$127 million export terminal facility is al-
most ready, with the launch scheduled by the
start of 2020.
At the gate of new era We are building a successful, sustainable and
vibrant company in a globally competitive
sector of the Ukrainian economy employing
our core values: integrity, efficient and sus-
tainable use of resources.
Today, Kernel is the backbone of Ukrainian
agriculture, providing diverse solutions to our
local and international clients in a cost effi-
cient and highly professional manner.
Operational excellence and sustainable cost
leadership are and will remain our key priori-
ties and we are committed to these with our
strategic investments to better serve the ever-
demanding needs of our stakeholders and
build long-term relationships.
Indeed, we pay great attention to a sustaina-
ble and mutually beneficial long-term co-op-
eration with farmers. Our pledge to
knowledge- and data-sharing, implemented
via the Open Agribusiness initiative, along
with comprehensive pre-crop financing solu-
tions offered to our suppliers, are just few
foundation blocks of an emerging Kernel eco-
system that will enhance the competitive
edge of our platform. This subtle element,
which is widely ignored by our peers, shall
contribute to the prosperous future of Kernel,
probably to the same extent as our strategic
investments in top-notch assets, as the eco-
nomic performance of such assets shall
largely depend on the efficient origination and
flow of the feedstock through our business
system.
Finally, on behalf of the Board of Directors, I
would like to thank the Kernel team for the
good performance in FY2019 and to thank
our stakeholders for their continued confi-
dence in our business.
Andrii Verevskyi Chairman of the Board of Directors,
Founder

Kernel Holding S.A. Annual Report and Accounts 30 June 2019 7 www.kernel.ua
Our Business Model
Strategic
Report Sustainability
Corporate
Governance
Financial
Statements
2
3
Own Farming 1
Procurement 2
Bottled sunflower oil 5
Grain railcars 6
Export terminals in ports 7
Oilseed processing 4
Silo storage 3
1
2 6
4
5
7
Topping industry league tables in all segments
Oilseed Processing segment → #1 global sunflower oil producer (~8% of global production) and exporter (~15% of global exports)
→ #1 bottled sunflower oil producer and marketer in Ukraine
→ 3.5 million tons annual sunflower seed processing capacity
Infrastructure and Trading segment
→ #1 grain exporter from Ukraine with 12% share of country’s total grain export
→ Own grain export port terminal in Ukraine with annual capacity to transship 4.8 million tons of soft
commodities. Similar facility in Russia (50/50 JV with Glencore).
→ #1 private inland grain silo network in Ukraine with 2.5 million tons of grain storage capacity
→ #1 private grain railcar fleet in Ukraine (3.4 thousand railcars)
Farming segment
→ #1 crop producer in Ukraine controlling 530 thousand hectares of leasehold farmland
→ Modern large-scale machinery, sustainable agronomic practices, cluster management system
and export-oriented crop mix
→ Nearly 100% of sales volumes flows through our grain and infrastructure and sunflower oil divi-
sions, earning incremental profits

Kernel Holding S.A. Annual Report and Accounts 30 June 2019 8 www.kernel.ua
Kernel at a Glance
Strategic
Report Sustainability
Corporate
Governance
Financial
Statements
…………………………………………………………………………………………………………………………………………………………………………………………………………………………………….. Segment results summary (new presentation format) Revenue, US$ million EBITDA, US$ million Volume, thousand tons 2 EBITDA margin, US$/t 3
FY2018 FY2019 y-o-y FY2018 FY2019 y-o-y FY2018 FY2019 y-o-y FY2018 FY2019 y-o-y
Oilseed Processing 1,393 1,493 7% 77 109 42% 1,413 1,619 15% 54.3 67.3 24%
Infrastructure and Trading 1,025 3,140 3.1x 101 106 4.9% 3,953 6,094 54% 25.5 17.4 (32%)
Farming 470 602 28% 89 182 2.0x 2,594 3,294 27% 148.9 343.7 2.3x
Unallocated corporate expenses (44) (51) 17%
Reconciliation (486) (1,243) 2.6x
Total 2,403 3,992 66% 223 346 55%
Note 2 Physical grain volumes exported (ex. Avere) for Infrastructure and Trading. Note 3 US$ per ton of oil sold for Oilseed Processing; US$ per ton of grain exported (ex. Avere volumes) for Infrastructure and Trading; US$ per hectare for Farming.
Segment results summary (old presentation format) Revenue, US$ million EBITDA, US$ million Volume, thousand tons 4 EBITDA margin, US$/t 5
FY2018 FY2019 y-o-y FY2018 FY2019 y-o-y FY2018 FY2019 y-o-y FY2018 FY2019 y-o-y
Sunflower oil
Sunflower oil sold in bulk 1,264 1,353 7% 63 93 47% 1,301 1,496 15% 48.7 62.2 28%
Bottled sunflower oil 130 140 8% 13 16 19% 119 131 10% 112.6 121.6 8% 1,393 1,493 7% 77 109 42%
Grain and infrastructure
Grain trading 951 3,077 3.2x 17 31 80% 4,646 10,444 2.2x 3.8 3.0 (20%)
Export terminals (Ukraine) 53 49 (7%) 39 36 (8%) 4,112 4,606 12% 9.5 7.8 (18%)
Silo services 72 71 (2%) 44 38 (13%) 3,292 4,276 30% 13.4 9.0 (33%) 1,077 3,197 3.0x 101 106 5%
Farming 470 602 28% 89 182 2.0x 2,594 3,294 27% 148.9 343.7 2.3x
Unallocated corporate expenses (44) (51) 17%
Reconciliation (538) (1,300) 2.4x - -
Total 2,403 3,992 66% 223 346 55%
Note 4 Million liters for bottled sunflower oil; grain trading volumes include physical trading volumes reported by Avere, a subsidiary of Kernel involved in physical and proprietary trading. Note 5 US$ per thousand of liters for bottled sunflower oil; US$ per hectare for farming. Differences are possible due to rounding.
`
Note 1 Operated under tolling agreement.
Oilseed processing plants Grain silos Leasehold farmland bank Export terminals
50 km
Poltava
TransBulkTerminal
Black Sea Industries
Bandurka
Kropyvnytskyi
Prydniprovskyi
Ellada1
Prykolotne
Vovchansk
Taman (50/50 JV)
558
462
356
149
274
4,800
4,000
620
432
617
Starokostiantyniv 1,000
TransGrainTerminal 4,000
Refining and bottling facilities Co-generation heat and power plants (renewable energy) Assets under construction
xxx Sunflower seed crushing capacity, thousand tons per year Grain transshipment capacity, thousand tons per year
Kernel Holding S.A. Annual Report and Accounts 30 June 2019 9 www.kernel.ua
Our Strategy 2021
Strategic
Report Sustainability
Corporate
Governance
Financial
Statements
……………………………………………………………………………………………………………………………………………………………………………………………………………………………………
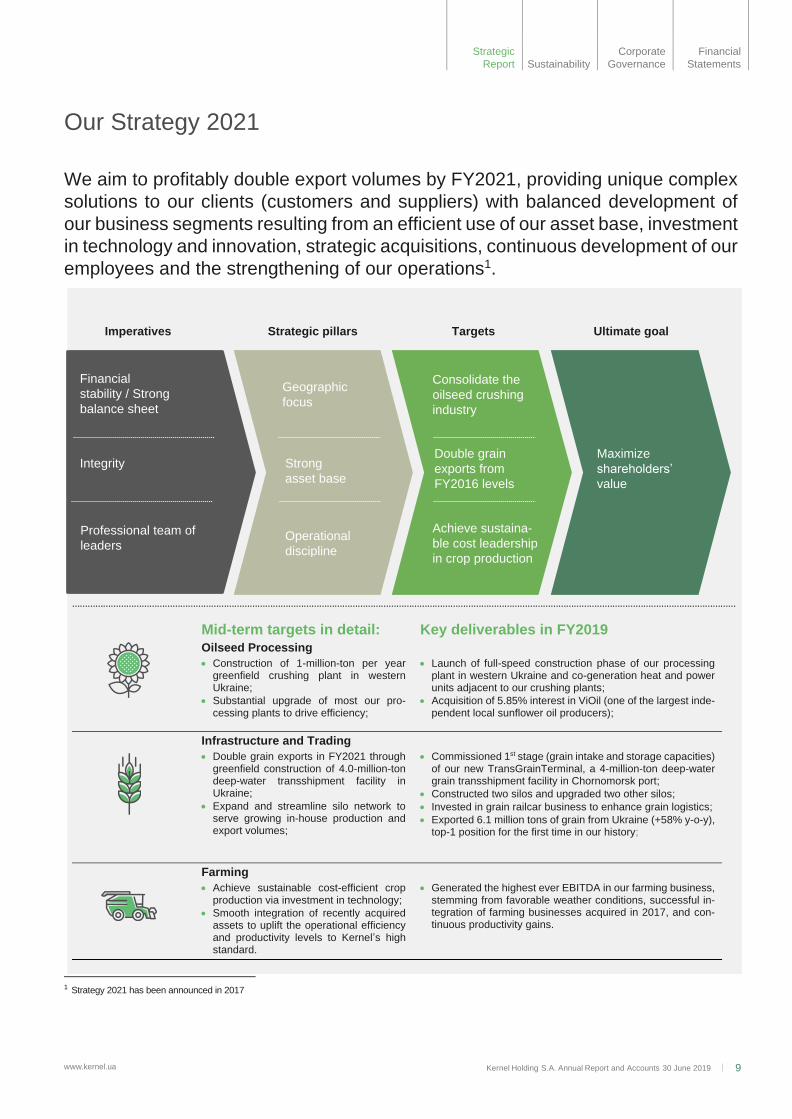
Mid-term targets in detail: Key deliverables in FY2019
Oilseed Processing
• Construction of 1-million-ton per year greenfield crushing plant in western Ukraine;
• Substantial upgrade of most our pro-cessing plants to drive efficiency;
• Launch of full-speed construction phase of our processing plant in western Ukraine and co-generation heat and power units adjacent to our crushing plants;
• Acquisition of 5.85% interest in ViOil (one of the largest inde-pendent local sunflower oil producers);
Infrastructure and Trading
• Double grain exports in FY2021 through greenfield construction of 4.0-million-ton deep-water transshipment facility in Ukraine;
• Expand and streamline silo network to serve growing in-house production and export volumes;
• Commissioned 1st stage (grain intake and storage capacities) of our new TransGrainTerminal, a 4-million-ton deep-water grain transshipment facility in Chornomorsk port;
• Constructed two silos and upgraded two other silos;
• Invested in grain railcar business to enhance grain logistics;
• Exported 6.1 million tons of grain from Ukraine (+58% y-o-y), top-1 position for the first time in our history;
Farming
• Achieve sustainable cost-efficient crop production via investment in technology;
• Smooth integration of recently acquired assets to uplift the operational efficiency and productivity levels to Kernel’s high standard.
• Generated the highest ever EBITDA in our farming business, stemming from favorable weather conditions, successful in-tegration of farming businesses acquired in 2017, and con-tinuous productivity gains.
We aim to profitably double export volumes by FY2021, providing unique complex
solutions to our clients (customers and suppliers) with balanced development of
our business segments resulting from an efficient use of our asset base, investment
in technology and innovation, strategic acquisitions, continuous development of our
employees and the strengthening of our operations1.
1 Strategy 2021 has been announced in 2017
Imperatives Strategic pillars Targets Ultimate goal
Financial
stability / Strong
balance sheet
Integrity
Professional team of
leaders
Geographic
focus
Strong
asset base
Operational
discipline
Double grain
exports from
FY2016 levels
Achieve sustaina-
ble cost leadership
in crop production
Maximize
shareholders’
value
Consolidate the
oilseed crushing
industry

www.kernel.ua Kernel Holding S.A. Annual Report and Accounts 30 June 2019 10
Financial Performance in FY2019
Strategic
Report Sustainability
Corporate
Governance
Financial
Statements
Kernel delivered solid financial results for the year
ended 30 June 2019. Group EBITDA increased
55% y-o-y, to US$ 346 million in FY2019 on robust
performance of Farming business and recovery in
the Oilseed Processing segment.
Farming segment was driving Company’s perfor-
mance this year, posting the highest ever US$ 182
million EBITDA, 2x up compared to the previous
year and accounting for 53% of total Company’s
EBITDA in FY2019. Supportive weather conditions
in Ukraine, prompt and successful integration of ac-
quired farmland landbank along with the effective
hedging of crop defined outstanding results.
In line with our guidance, Oilseed Processing seg-
ment EBITDA recovered in FY2019, adding 42% y-
o-y to US$ 109 million. Margin in the business im-
proved to US$ 67 EBITDA per ton of oil sold, sup-
ported by strong harvest of sunflower seeds in
Ukraine, though extremely low sunflower oil prices
prohibited margin from further improvement.
Financial result of Infrastructure and Trading seg-
ment was up 5% in FY2019 on the y-o-y basis, with
EBITDA standing at US$ 106 million. Good perfor-
mance of grain export business line and addition of
railcars business was blurred by negative Avere
performance and slight margin contraction in infra-
structure businesses.
Unallocated corporate expenses increased by
17% y-o-y, to US$ 51 million in FY2019, due to gen-
eral growth in administrative expenses and intro-
duction of IFRS 9 and respective recognition of loss
allowance for trade accounts receivable.
Leverage of the company reduced to 2.0x net-debt-
to-EBITDA, and EBITDA-to-interest coverage ratio
improved to 4.2x.
Net profit attributable to shareholders of Kernel
Holding S.A. in FY2019 soared 3.6x y-o-y, to US$
189 million. Consequently, the Board of Directors
of Kernel Holding recommends the General Meet-
ing of Shareholders distributing to shareholders
US$ 20.5 million as a dividend, unchanged as com-
pared to the previous year and resulting in 11% div-
idend payout ratio.
Revenue
US$ 3,992 million +66% y-o-y
EBITDA
US$ 346 million +55% y-o-y
A season with strong performance boosted by Farming segment
………………………………………………………………………………… Kernel Holding S.A. market capitalization US$ billion
Source: Bloomberg
-
0.5
1.0
1.5
2.0
2.5
Aug
19
Dec 1
8
Ma
r 1
8
Ju
l 17
Nov 1
6
Fe
b 1
6
Ju
n 1
5
Oct 1
4
Ja
n 1
4
Ma
y 1
3
Aug
12
Dec 1
1
Apr
11
Ju
l 10
Nov 0
9
Ma
r 0
9
Ju
n 0
8
Kernel Holding S.A. Annual Report and Accounts 30 June 2019 11 www.kernel.ua
Financial Performance in FY2019 continued
Strategic
Report Sustainability
Corporate
Governance
Financial
Statements
Income statement highlights We generated a record revenue in Group’s
history, reaching US$ 3,992 million in FY2019,
up 66% y-o-y. The result is mostly driven by
record grain export volume from Ukraine (up
58% y-o-y) stemming from strong in-house
harvest of grain and highest ever procurement
of grain from 3rd-party farmers in Ukraine, as
well as Avere physical trade operations. On
top of that, we delivered strong sales of sun-
flower oil minimizing the carry-over stock.
The Group recognized US$ 9 million gain
from net change in fair value of biological
assets and agricultural produce in FY2019,
compared to a US$ 19 million gain a year ago.
This component included a gain from revalu-
ing crops in fields to fair value less costs to sell
as of 30 June 2019 and expensing of the re-
spective gain booked a year earlier, as well as
a gain from change in the fair value of live-
stock.
Cost of sales surged by 62% y-o-y, to US$
3,654 million in FY2019, in line with revenue
growth and reflecting higher volumes of pro-
curement of grain and higher costs incurred by
our farming business as a result of intensifica-
tion of crop production on landbank added to
our operations in 2017, as well as doubled
shipping and handling costs reflecting growing
volumes sold on CIF-basis. Consequently,
gross profit for the period more than doubled
y-o-y, reaching the highest in Kernel history
US$ 348 million.
Other operating income totaled at US$ 28
million in FY2019, down from US$ 59 million
in FY2018, mostly driven by US$ 14 million
loss on operations with commodity futures in
FY2019, as compared to US$ 32 million gain
for a year ago. For a detailed breakdown of
other operating income, please, refer to Note
27 of the financial statements on page 115.
General and administrative costs increased
by 33% y-o-y, to US$ 107 million in FY2019.
The increase was driven mainly by payroll
costs increase, bad debt expenses (mostly
due to provisions recognized following the ap-
plication of IFRS 9 standard) and higher audit,
legal and other professional fees incurred over
the period.
As a result of the factors discussed above and
considering also low comparison base, oper-
ating profit in FY2019 doubled as compared
to the previous year, reaching US$ 269 mil-
lion. EBITDA of the company constituted US$
346 million, a 55% growth y-o-y.
Finance costs in FY2019 added US$ 17 mil-
lion y-o-y, totaling US$ 82 million. The growth
is mostly driven by more intensive use of work-
ing capital facilities over the season given ex-
panded scale of the business.
During the reporting period, we recognized
net foreign exchange gain of US$ 13 million,
up from US$ 5 million a year ago. This item is
mostly a non-cash gain recognized after the
revaluation of our intra-group balances de-
nominated in Ukrainian hryvnia. All of the
Group’s subsidiaries use the US Dollar as
their functional currency, except for farming,
export terminals and silo services, which use
the Ukrainian hryvnia and the Russian ruble.
As a normal course of business, the Group’s
subsidiaries may need intercompany debt fi-
nancing which, when revalued, causes either
foreign exchange gains or losses at one of the
Group’s enterprises, if the lender and the bor-
rower had different functional currencies.
Other expenses amounted to US$ 8 million
in FY2019, mostly reflecting losses from reval-
uation of property, plant and equipment.
Corporate income tax expenses totaled to
US$ 12 million in FY2019, as compared to
US$ 6 million income tax benefit recognized a
year ago.
As a result, net profit in FY2019 posed a hefty
3.2x growth y-o-y, reaching US$ 179 million.
Net profit attributable to shareholders of Ker-
nel Holding S.A. comprised US$ 189 million,
up from US$ 52 million in FY2018.
Adhering to the dividend policy, the Company
in April 2019 paid the dividend of US$ 0.25 per
share totaling to US$ 20.5 million for FY2018.
Considering Company performance in
FY2019, the Board of Directors recommends
the general meeting of shareholders to ap-
prove the dividend of US$ 0.25 per share to
be paid during the financial year ending 30
June 2020.
Cash flow highlights Similar to Company’s EBITDA improvement,
operating profit before working capital
changes added US$ 185 million to the previ-
ous year result, totaling to US$ 368 million in
FY2019.
Working capital changes resulted in US$ 94
million cash outflow (driven by growth in trade
accounts receivable due to Avere operations),
which, together with US$ 76 million finance
costs paid, US$ 4 million interest received
and US$ 3 million income tax paid resulted in
US$ 199 million net cash generated by op-
erating activities.
Net cash used in investing activities
reached US$ 241 million, mostly driven by our
expansion investments: US$ 167 million
………………………………………………………………………… Kernel’s EBITDA split US$ million
213
129 100 77 109
98
146 146
89
182
114
107 110
101
106
(29) (36) (36) (44) (51)
397
346 319
223
346
FY2015 FY2016 FY2017 FY2018 FY2019
Oilseed Processing Farming
Infrastructure and Trading Unallocated G&A and other
…………………………………………………………………………………………………………………………………………………………. Income statement highlights US$ million
FY2018 FY2019 y-o-y
Revenue 2,403 3,992 66% Net IAS 41 gain 19 9 (51%) Cost of sales (2,261) (3,654) 62% Gross profit 160 348 2.2x Other operating income 59 28 (52%) General and administrative expenses (80) (107) 33% Operating profit 140 269 93% Finance costs, net (65) (82) 26% Foreign exchange gain(loss), net 5 13 2.4x Other expenses, net (31) (8) (73%) Share of profit/(losses) of joint venture 1 (1) n/m
Profit / (loss) before income tax 50 190 3.8x
Income tax (benefit)/expenses 6 (12) n/m Profit for the period 56 179 3.2x
Attributable to equity holders of Kernel Holding S.A. 52 189 3.6x Non-controlling interest 4 (11) n/m
EBITDA 223 346 55%
Kernel Holding S.A. Annual Report and Accounts 30 June 2019 12 www.kernel.ua
Financial Performance in FY2019 continued
Strategic
Report Sustainability
Corporate
Governance
Financial
Statements
purchase of PP&E as an execution of our
CapEx program under Strategy 2021 and US$
56 million payment under RTK-Ukraine acqui-
sition (with additional US$ 8 million to be paid
in FY2020).
Company also paid US$ 20.5 million divi-
dends in FY2019, distributing 39% of profit at-
tributable to shareholders of Kernel Holding
S.A. for FY2018.
To finance the gap between operating and in-
vesting cashflows, we attracted US$ 61 million
of new debt (mostly long-term facilities), and
reduced Group’s cash balance.
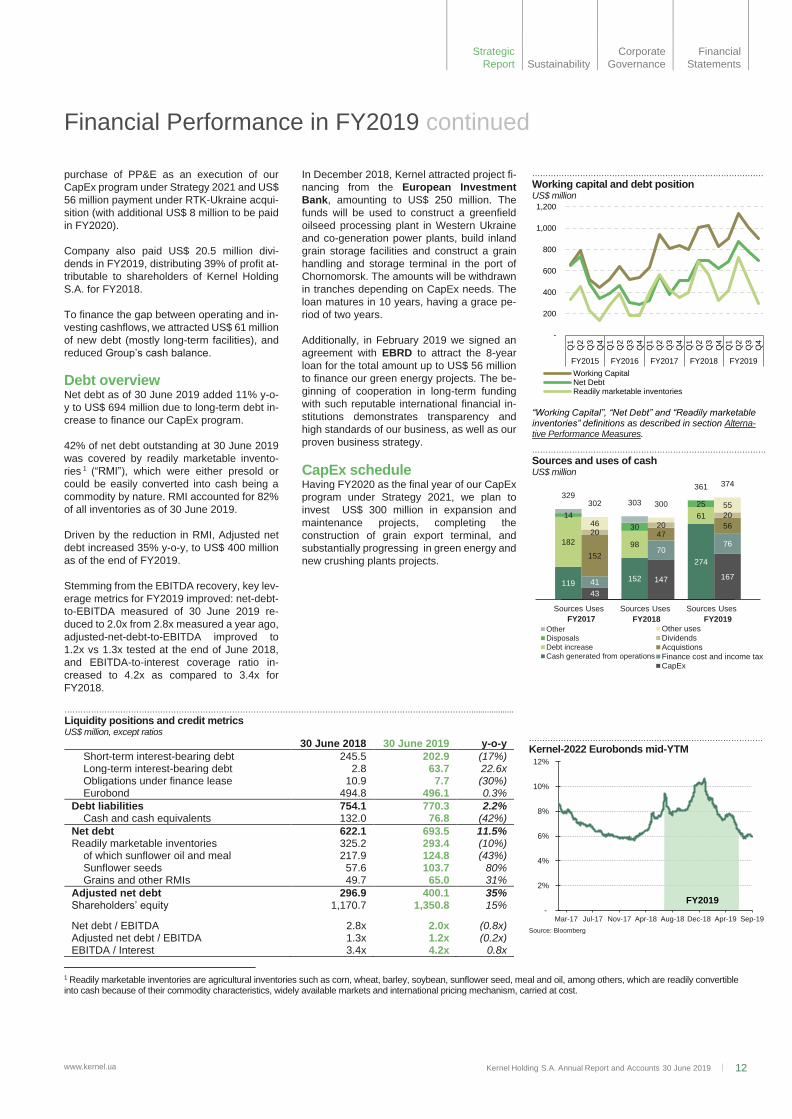
Debt overview Net debt as of 30 June 2019 added 11% y-o-
y to US$ 694 million due to long-term debt in-
crease to finance our CapEx program.
42% of net debt outstanding at 30 June 2019
was covered by readily marketable invento-
ries 1 (“RMI”), which were either presold or
could be easily converted into cash being a
commodity by nature. RMI accounted for 82%
of all inventories as of 30 June 2019.
Driven by the reduction in RMI, Adjusted net
debt increased 35% y-o-y, to US$ 400 million
as of the end of FY2019.
Stemming from the EBITDA recovery, key lev-
erage metrics for FY2019 improved: net-debt-
to-EBITDA measured of 30 June 2019 re-
duced to 2.0x from 2.8x measured a year ago,
adjusted-net-debt-to-EBITDA improved to
1.2x vs 1.3x tested at the end of June 2018,
and EBITDA-to-interest coverage ratio in-
creased to 4.2x as compared to 3.4x for
FY2018.
1 Readily marketable inventories are agricultural inventories such as corn, wheat, barley, soybean, sunflower seed, meal and oil, among others, which are readily convertible
into cash because of their commodity characteristics, widely available markets and international pricing mechanism, carried at cost.
In December 2018, Kernel attracted project fi-
nancing from the European Investment
Bank, amounting to US$ 250 million. The
funds will be used to construct a greenfield
oilseed processing plant in Western Ukraine
and co-generation power plants, build inland
grain storage facilities and construct a grain
handling and storage terminal in the port of
Chornomorsk. The amounts will be withdrawn
in tranches depending on CapEx needs. The
loan matures in 10 years, having a grace pe-
riod of two years.
Additionally, in February 2019 we signed an
agreement with EBRD to attract the 8-year
loan for the total amount up to US$ 56 million
to finance our green energy projects. The be-
ginning of cooperation in long-term funding
with such reputable international financial in-
stitutions demonstrates transparency and
high standards of our business, as well as our
proven business strategy.
CapEx schedule Having FY2020 as the final year of our CapEx
program under Strategy 2021, we plan to
invest US$ 300 million in expansion and
maintenance projects, completing the
construction of grain export terminal, and
substantially progressing in green energy and
new crushing plants projects.
……………………………………………………………………………
Working capital and debt position US$ million
“Working Capital”, “Net Debt” and “Readily marketable inventories” definitions as described in section Alterna-tive Performance Measures.
-
200
400
600
800
1,000
1,200
Q1
Q2
Q3
Q4
Q1
Q2
Q3
Q4
Q1
Q2
Q3
Q4
Q1
Q2
Q3
Q4
Q1
Q2
Q3
Q4
FY2015 FY2016 FY2017 FY2018 FY2019
Working CapitalNet DebtReadily marketable inventories
………………………………………………………………………………………………………………………………………...................
Liquidity positions and credit metrics US$ million, except ratios
30 June 2018 30 June 2019 y-o-y
Short-term interest-bearing debt 245.5 202.9 (17%) Long-term interest-bearing debt 2.8 63.7 22.6x Obligations under finance lease 10.9 7.7 (30%) Eurobond 494.8 496.1 0.3%
Debt liabilities 754.1 770.3 2.2% Cash and cash equivalents 132.0 76.8 (42%)
Net debt 622.1 693.5 11.5% Readily marketable inventories 325.2 293.4 (10%) of which sunflower oil and meal 217.9 124.8 (43%) Sunflower seeds 57.6 103.7 80% Grains and other RMIs 49.7 65.0 31%
Adjusted net debt 296.9 400.1 35% Shareholders’ equity 1,170.7 1,350.8 15%
Net debt / EBITDA 2.8x 2.0x (0.8x) Adjusted net debt / EBITDA 1.3x 1.2x (0.2x) EBITDA / Interest 3.4x 4.2x 0.8x
.
…………………………………………………………………………….
Kernel-2022 Eurobonds mid-YTM
Source: Bloomberg
-
2%
4%
6%
8%
10%
12%
Sep-19Apr-19Dec-18Aug-18Apr-18Nov-17Jul-17Mar-17
FY2019
…………………………………………………………………………….
Sources and uses of cash US$ million
119 152
274
182 98
61 14
30
25 329
303
361
Sources Sources Sources
Other
Disposals
Debt increase
Cash generated from operations
43
147 167 41
70 76
152
47 56
20 20
20 46
55 302 300
374
Uses Uses Uses
Other usesDividendsAcquistionsFinance cost and income taxCapEx
FY2017 FY2018 FY2019

Kernel Holding S.A. Annual Report and Accounts 30 June 2019 13 www.kernel.ua
Oilseed Processing
Strategic
Report Sustainability
Corporate
Governance
Financial
Statements
Kernel is a global powerhouse in sunflower seed
processing, actively consolidating the market and
greenfield investing. We emerged as the largest
global producer and exporter of sunflower oil with
3.5 million tons of annual sunflower seed pro-
cessing capacity and 1.6 million tons sales of sun-
flower oil in FY2019. Segment EBITDA increased
42% y-o-y, to US$ 109 million.
Margins in this business substantially declined over
last several years. Although it is challenge for us as
oilseed processor, it creates a competitive land-
scape where Kernel’s scale and efficiency is
strongly positioned to advance. Being the global
leader, we continue to strengthen our position
through greenfield investing, adding adjacent busi-
nesses to our portfolio, consolidating the market
and increasing the horizon of our operations.
Firstly, in FY2021 we plan to commission the larg-
est in Ukraine oilseed processing plant in western
part of Ukraine – high-potential region for sunflower
seed crushing. By investing US$ 180 million green-
field, we will add 1 million tons of annual processing
capacity to our portfolio by spring 2021.
Secondly, we are entering new synergetic busi-
ness of green energy generation from biomass by
investing US$ 150 million. The project is a truly
transformational addition to our oilseed processing
business. We use the first mover advantage, as we
are the first big oilseed processor in Ukraine to in-
vest in such heat & power cogeneration projects,
which makes us more competitive against peers.
Thirdly, we continue with our market consolidation
strategy. In FY2019, we acquired 5.85% interest in
ViOil Holding Ltd, one of the largest independent
sunflower oil producers in Ukraine. The deal grants
us certain advantages in case of future sale process
of the remaining stake.
Finally, we increase the horizon of our operations.
Historically we used to sell our sunflower oil in Black
sea ports to big international traders, but in FY2019
we initiated one step ahead and started selling more
on the CIF-basis (port of destination) through our
Avere subsidiary.
We remain focused on the delivering on our Strat-
egy 2021 to bring our Oilseed Processing segment
to the next level.
Record 3.2 million tons of oilseeds processed in FY2019
EBITDA (before unallocated head office expenses)
US$ 109 million +42% y-o-y
Revenue
US$ 1,493 million +7% y-o-y
Global leader in sunflower oil production

Kernel Holding S.A. Annual Report and Accounts 30 June 2019 14 www.kernel.ua
Oilseed Processing continued
Strategic
Report Sustainability
Corporate
Governance
Financial
Statements
Market overview
We believe there are two key external factors
materially affecting Kernel oilseed processing
business: 1) global sunflower oil prices and 2)
supply-demand balance on Ukrainian sun-
flower seed processing market. While the first
factor is important for combined earnings of
sunflower seed farming and processing, the
second one determines a split of margins
between farmers and processors.
Local market fundamentals were favorable for
oilseed processing business in FY2019, but
general global price weakness prohibited
crushing margins from sizable increase vs
FY2018 level.
Global sunflower oil prices Sunflower oil is the 4th largest vegetable oil in
terms of global consumption with 9.3% market
share in 2018/19 season and the fastest y-o-
y growth in consumption of 7.8%. Main de-
mand on global market comes from India and
China (driven by income and population
growth and rapidly expanding food processing
industries) and EU, together taking 58% in
global imports, while the largest global ex-
porter is Ukraine with 57% share in total ex-
ports and 6.2 million tons of sunflower oil ex-
ported in 2018/19 season1.
Over FY2019, sunflower oil Black Sea FOB
price fluctuated between 620-750 US$ per ton
of oil, reaching its 10-year minimum in De-
cember 2018. Key factors behind that were:
• Strong supply of sunflower seed globally, which was compared to (as initially per-ceived) an unchanged y-o-y demand base judged by sunflower oil’s relative value against competing oils;
• Global vegetable oils price weakness driven by energy sell-off towards the end of calendar year 2018 together with de-pressed palm oil prices.
Closer to the end of FY2019 sunflower oil
prices recovered driven by dried out farmer
selling with seeds prices having approximated
to the cost of production threshold, and more
active demand from Southeast Asia on the
back of low sunflower oil flat price having in-
centivized stockpiling driven by opened refin-
ing and bottling margins.
Supply-demand balance on Ukrainian sunflower seed processing market Sunflower seed processing in Ukraine is
heavily localized: nearly all sunflower seeds
harvested by local farmers are processed do-
mestically. While combined profitability of
farmers (producers of seeds) and crushers
(processors of seeds) is determined by global
1 Source: USDA, July 2019
prices, the exact split of earnings between
farmers and crushers depends on supply of
seeds (harvest) and demand for seeds (pro-
cessing capacities).
In FY2019, sunflower seed processing capac-
ities in Ukraine increased by 3% y-o-y to 18.5
million tons, as three new facilities in south-
eastern Ukraine announced the launch of op-
erations. At the same time, sunflower seeds
harvest in the season increased by 1.8 million
tons, to 15.2 million tons, driven by supportive
weather conditions and strong crop yields. As
a result, the gap between crushing capacities
and supply of seeds reduced, positively im-
pacting crushing margin over the season.
Additionally, multiseed crushers in Ukraine
started to process more soybeans and rape-
seeds in FY2019 as compared to FY2018,
thus reducing demand for sunflower seeds.
Outlook for FY2020 The beginning of the season looks supportive
for Ukrainian crushing industry.
In FY2019, sunflower remained the most prof-
itable crop generally for farmers in Ukraine2,
but temporary weakness in sunflower oil
prices over the season discouraged farmers
to further increase the acreage under sun-
flower for FY2020. The most recent field data
make us expect close to 15.2 million tons sun-
flower seed harvest in Ukraine in FY2020, se-
curing a strong supply of seeds on the market.
The competitive landscape is not expected to
change – we do not envisage any new pro-
jects entering the market, so the effective sun-
flower seed processing capacities are likely to
remain unchanged at 18.5 million tons.
Global sunflower oil prices recovered at the
beginning of the FY2020 season, supporting
the upsurge in margins.
2 Source: www.ukrstat.gov.ua
……………………………………………………………………………………
Processing capacities as at MY 2018/19 million tons
Source: Kernel’s estimates
19%
20%
5%24%
32%
Kernel Multinationals MHP Local big Local small
18.5
……………………………………………………………………………………
Mismatch between supply and demand for sunflower seeds in Ukraine million tons
Source: Kernel’s data, Kernel’s estimates.
9
11 10
12
15.2
13.5
15.2
9
12 13
14
17.4 18.0 18.5 175 176
190
120 83
54 67
FY13 FY14 FY15 FY16 FY17 FY18 FY19
Sunflower seed harvest
Industrial sunflower seed processing capacities
Kernel's EBITDA, US$ per ton of oil sold
………………………………………………………………………... Sunflower oil export price, FOB-Chornomorsk US$ per ton of unrefined oil sold in bulk
Source: Bloomberg
500
550
600
650
700
750
800
850
Aug 19Jan 19Jun 18Nov 17May 17Oct 16
FY2019

Kernel Holding S.A. Annual Report and Accounts 30 June 2019 15 www.kernel.ua
Oilseed Processing continued
Strategic
Report Sustainability
Corporate
Governance
Financial
Statements
Our business model Market leader in oilseed processing We are the largest sunflower oil producer and
exporter in the world, with annual capacity to
process 3.5 million tons of sunflower seeds. In
FY2019 we produced ~8% of global produc-
tion of sunflower oil and exported ~15% of
global export1.
We operate seven of our own oilseed pro-
cessing plants in Ukraine and also process
seeds under the tolling agreement on the 3rd-
party-owned Ellada crushing plant in Kropyv-
nytskyi city. Our facilities compose 19% of
country industrial sunflower crushing capac-
ity, and we keep 21% of total sunflower pro-
cessing volumes in Ukraine. We are currently
2.4 times bigger than the 2nd-largest crusher
in Ukraine and seek to further increase our
market share after commissioning the largest
in Ukraine oilseed processing plant with 1 mil-
lion tons of annual sunflower seeds crushing
capacity, scheduled for early 2021.
87% of the sunflower seeds we processed in
FY2019 were sourced from 3rd-party farmers,
and 13% were produced by our farming seg-
ment.
Sunflower seed processing yields two major
products: sunflower oil and meal, which we
export globally mostly through 3rd-party termi-
nals, with only a minor portion transshipped
through our own TransBulkTerminal. Sun-
flower seed husk, a biomass, is either burnt
in-house to generate steam for production
purposes, or pelletized and sold to 3rd parties.
We are currently constructing co-generation
1 USDA, Kernel analysis.
heat and power units adjacent to all but one
our crushing plants to burn all the husk pro-
duced and generate electricity. Since 2009
our Kropyvnytskyi plant has operated a similar
facility with 1.6 MW installed turbine capacity,
supplying the electricity generated to national
grid.
Up to 10% of crude sunflower oil is further re-
fined and bottled on our Poltava and Pry-
kolotne plants for higher-added-value prod-
uct. On the Ellada plant we also process high-
oleic sunflower seeds. Most of our crushing
plants are multi-seed and able to switch to
soybean or rapeseed processing if needed.
All the assets are located across the sun-
flower seed production belt in Ukraine in close
proximity to farmers, ensuring the high utiliza-
tion rates and profitability, as the low density
of sunflower seed negatively impacts the eco-
nomics of transporting seeds to the distant re-
gions.
Our crushing plants are modern facilities con-
structed or fully renovated recently, granting
us processing cost advantages over most of
the other players. Our scale also allows us to
benefit from more efficient usage of our coun-
try-wide origination network and allocation of
overheads over larger volumes.
Markets and customers Oilseed processing is an export-oriented busi-
ness. Over 90% of produced sunflower oil is
exported in bulk, with India, EU, Middle East
and China being our key markets of destina-
tions. Our customers include processors of
……………………………………………………………………………………
Sunflower oil sold in bulk destinations FY2019 thousand tons
40%
29%
20%
8%3%
India Iraq Europe China Other
1,496
……………………………………………………………………………………
Bottled sunflower oil destinations FY2019 million liters
43%
24%
15%
5%
4%
9%
Ukraine Middle East Europe Asia Africa Other
131
………………………………………………………………………..…..…..…..…..…..…..…..…..…..…..…..…..…..…..…..…..…..…..…..…..…..…..…..…..…
Sunflower seed crushing process
Refining & bottling
Pressing & extracting
Dehulling & filtering
Burning…
Sunflower (1,000 kg)
Dehulled
kernel
Bottled sun-
flower oil
Crude sunflower oil (440 kg)
Sunflower Meal (390 kg)
Electricity (222 kWh)
Husk (160 kg)
… or
selling
An edible oil rich with Omega-3 and Omega-6 ac-
ids. A traditional vegetable oil of choice for many
regions of the world, sunflower oil is used only for
culinary purpose, primarily for salad dressing and
frying.
A protein-rich livestock feed, used for compound feed
production for hog, cattle and poultry industries
across the world. It is the third most important meal
globally after soybean and rapeseed.
Electricity is sold to the national grid, considered as
“green energy”
A biomass used to produce steam and energy on
our plants, but can also be pelletized and sold to
3rd
-parties

Kernel Holding S.A. Annual Report and Accounts 30 June 2019 16 www.kernel.ua
Oilseed Processing continued
Strategic
Report Sustainability
Corporate
Governance
Financial
Statements
soft commodities who refine and bottle sun-
flower oil (with Etihad Food Industries pur-
chasing 29% of our bulk sunflower oil in
FY2019 as the largest of our customers) or in-
ternational commodity traders, such as
COFCO and Cargill, taking 9% and 6% of our
bulk oil sales volumes, respectively, in
FY2019.
Up to 10% of produced crude sunflower oil is
further refined and bottled. In FY2019, 57% of
produced bottled oil was exported mainly to
Africa, Middle East, EU and China under our
brands or private labels. We have about 55%
share in total refined bottled sunflower oil ex-
port from Ukraine, supplying products to such
international retail chains as METRO,
Auchan, Walmart, Maxima and others.
43% of produced bottled oil was sold in
Ukraine to 18 nationwide retailers and 32 re-
gional distributors, comprising 84% and 16%
of domestic sales, respectively, under well-
recognized brands “Chumak”, “Schedryi Dar”,
“Stozhar” and others.
Key developments In FY2019, we processed 3.2 million tons of
oilseeds – a new record for Kernel, slightly ex-
ceeding last year’s result and running at 91%
capacity utilization level. It is imperative to
maximize capacity utilization for margin-tak-
ers in the current low-margin environment.
In FY2019, we commenced work of a co-gen-
eration heat and power unit in our
Kropyvnytskyi oil-extraction plant, which ex-
panded the on-site green energy generation
capacity by four times, to 6 MW.
FY2019 was a year of launch of on-site con-
struction works for our new oilseed processing
plant in Western Ukraine (a region with strong
fundamentals for oilseed processing busi-
ness), with the aim to commission the facility
in January-March 2021. Equipped by machin-
ery from leading global suppliers, the plant in
Starokostiantyniv, Khmelnytskyi region, will
be the largest in Ukraine with annual pro-
cessing capacity of 1 million tons of sunflower
seeds, also accommodating soybeans and
rapeseed crushing. The plant will be equipped
with an integrated 22 MW combined heat and
power generation unit (“CHP unit”) expected
to generate up to 154 thousand MWh of elec-
tricity annually to be sold to the national grid.
In order to expand the production of sunflower
in western and northern regions of Ukraine,
we launched a promotional campaign as a
part of our Open Agribusiness initiative provid-
ing local farmers with Kernel’s real-life cases
of how to streamline their crop mix to produce
more sunflower seeds, historically the most
profitable crop in Ukraine.
In the bottled sunflower oil business, we
added market share in Ukraine as a result of
the customization of bottle size and formats,
successful promotional campaigns and in-
creased cooperation with leading domestic re-
tail chains on production of private labels and
612 679 280
542 419
704 672 909
911 941
700 915
861849 908
506 418 910
834 8962,523
2,685 2,959 3,136 3,164
FY2015 FY2016 FY2017 FY2018 FY2019
Q1 (ends 30 Sep) Q2 (ends 31 Dec)
Q3 (ends 31 Mar) Q4 (ends 30 Jun)
………………………………………………………………………………………………………………………………………………………………………………………………………………………………
Case study: investments into green energy generation Since its onset in early 2000s, sunflower seed processing in Ukraine has gone through several turns in its development. At first, crushing plants used
only pressing technology. The first indutsry shift added extractors to pressing operations, which improved the yields output and made early adopters
of the new technology much more competitive. The second pivotal point happened with the introduction of highly efficient husk-fueled boilers. Crushers
started to invest in modern productive boilers, which generated steam for crushing without using the natural gas, but by burning the sunflower husk – a
biomass-type by-product from the sunflower seed crushing process. And now we are facing the third turning point: installation of cogeneration
equipment.
Since 2015, Ukrainian government made a set of invenstives for the producers of “green” energy from a biomass by obliging the national grid operator to
buy all the electricity generated from biomass at a higher feed-in tariff, which is fixed until 2030 and regularly adjusted for FX fluctuations.
In 2017, we decided to enter this market by installing
cogeneration heat and power equipment, with a combined
turbine capacity of 94 MW on seven of our crushing plants, over
the course of 2019-2021. As before, we will burn husk, and the
steam produced will be used not only for crushing purposes, as
well as for electricity generation.
We see a strong business case for such invesments:
✓Attractive feed-in tariff for “green energy” in Ukraine: 0.12
€/kWh till 31 Dec 2029;
✓A proven track record of running combined heat and power
(CHP) unit on Kropyvnytskyi plant since 2009;
✓Synergies vs greenfield CHP plant construction: existing
infrastructure and secured supplies of biomass feedstock
✓Vacanting railcars use / reduction of logistic costs
The total investments are expected to reach US$ 150 million.
Once done, we will end up as the largest producer of green
energy from biomass in Ukraine.
Steam
turbine
Energy plant
Crude sunflower
oil
Sunflower
meal
Clean exhaust → CO2 saving
Pressing
Dehulling
Sunflower
seeds
Sifting
Sunflower
hulls
……………………………………………………………………………………
Oilseed processing volumes thousand tons
……………………………………………………………………………………
Kernel bottled oil selected customers
……………………………………………………………………………………
Kernel bottled oil core brands
Kernel Holding S.A. Annual Report and Accounts 30 June 2019 17 www.kernel.ua
Oilseed Processing continued
Strategic
Report Sustainability
Corporate
Governance
Financial
Statements
the promotion of our own brands. For export
sales, we also managed to enter a new retail
network Superunie in Netherlands, and in-
creased shipments to Asia and South Amer-
ica, while losing somewhat in Middle East.
Since mid-FY2019, we changed our approach
to the sales of sunflower oil sold in bulk. His-
torically, we sold oil mainly at Ukrainian ports
(FOB-basis) to numerous big international
traders. But since Q3 FY2019, we sell almost
all unrefined sunflower oil produced by our
plants through our Avere trading platform,
shifting sales from FOB more to CIF-basis
(port in the country of destination). In addition
to marketing sunflower oil produced by our
plants, Avere also buys sunflower oil from
other producers in Ukraine (over 200 thou-
sand tons in FY20191), consolidating exports
from Ukraine under its platform and building
up the scale in the vegetable oils export mar-
ket. Based on volumes produced by Kernel
plants, we have ~15% of total global export,
but with the help of Avere trading subsidiary
we intend to increase this stake further, con-
solidating the sunflower oil freight market and
Ukraine FOB-basis market under the Kernel
umbrella.
Over the course of FY2019, we reduced the
headcount in the segment by 10% y-o-y, to
2,258 employees (FTE) as of 30 June 2019.
While half of this reduction comes from the di-
vestment of a small inefficient simple-press
plant in Mykolaiv in July 2018, another 5% re-
sults from our efforts in optimization of busi-
ness processes within the segment.
Finally, in February 2019 Kernel acquired
5.85% stake in ViOil Holding Ltd, one of the
largest independent sunflower oil producers in
Ukraine, controlling 1.1 million tons of annual
sunflower seed processing capacity and a
network of silos used for origination of sun-
flower seeds. By entering a customary share-
holder agreement in relation to ViOil with other
1 Such volumes are reported as a part of “Other trading
volumes” in our Infrastructure and Trading segment.
shareholders of ViOil, we acquired certain
rights which might benefit Kernel in future sale
process.
Performance overview Our sales of sunflower oil achieved highest
ever 1.6 million tons in FY2019, exceeding the
production volumes and depleting the carry-
over stock. Bulk sunflower oil sales reached
1.5 million tons, up 15% y-o-y following
stronger shipments to Middle East. Sales of
bottled sunflower oil jumped to 123 thousand
tons (or 131 million liters), up 10% y-o-y given
growth in domestic sales in Ukraine to further
increase our market share.
EBITDA generated per ton of oil sold recov-
ered from the lowest ever observed level of
US$ 54 per ton in FY2018 to US$ 67 in the
reporting period. Profitability was impacted by
two opposite factors:
• Strong 15.2 million tons harvest of sun-flower seeds in Ukraine, which reduced the gap between crushing capacities in Ukraine and supply of seeds, and…
• Subdued global sunflower oil prices, which reduced from US$ 750 per ton of un-refined oil sold in bulk (FOB Black Sea ba-sis) at the beginning of the season to US$ 620 per ton of oil in December 2018 (the lowest in a decade). At our level of margins, such price weakness has a tremendous im-pact on profitability, and it undermined more substantial margin improvement in FY2019.
As a result of stronger sales volumes and re-
covery in margin, segment EBITDA in FY2019
increased by 42% y-o-y, to US$ 109 million.
We also secured strong volumes of sunflower
seeds to crush in Q1 FY2020, which is the last
quarter before a new harvest of sunflower
seeds starts.
……………………………………………………………………………………
Oilseed Processing segment EBITDA
213
129
100
77
109
190
120
83
5467
FY2015 FY2016 FY2017 FY2018 FY2019
EBITDA,US$ million
EBITDA margin, US$ per ton of oil sold
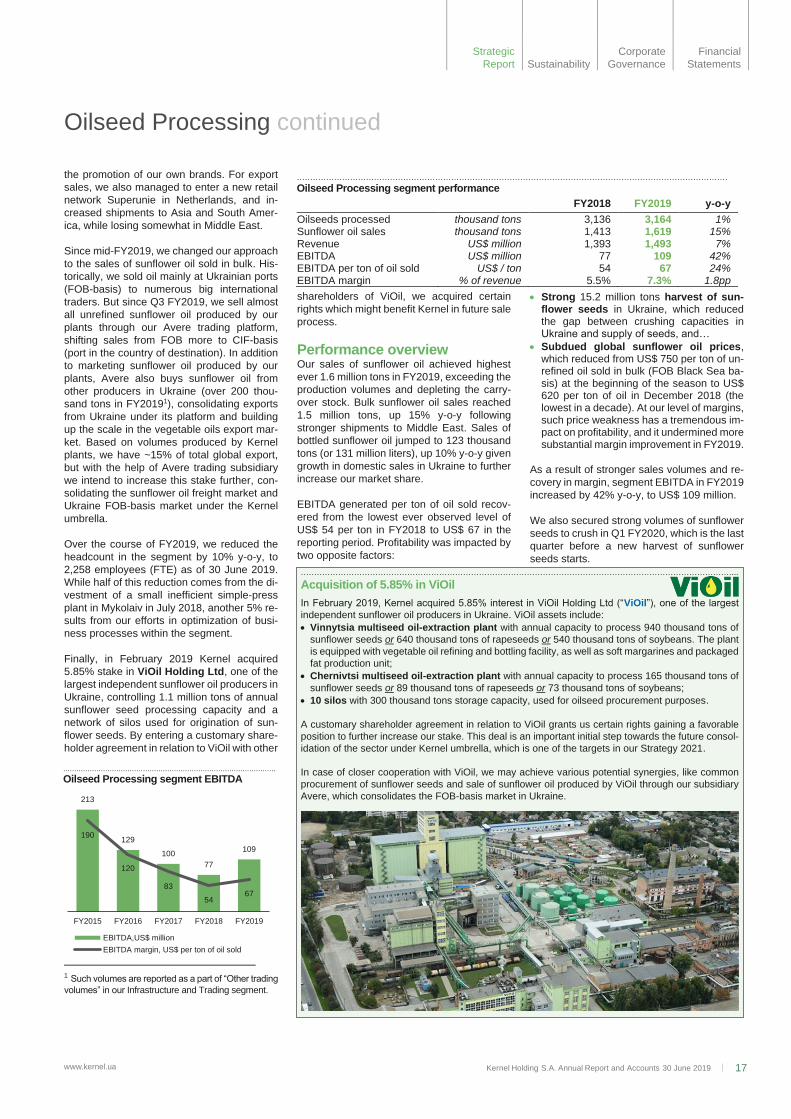
……………………………………………………………………………………………………………………………………………… Oilseed Processing segment performance
FY2018 FY2019 y-o-y
Oilseeds processed thousand tons 3,136 3,164 1% Sunflower oil sales thousand tons 1,413 1,619 15% Revenue US$ million 1,393 1,493 7% EBITDA US$ million 77 109 42% EBITDA per ton of oil sold US$ / ton 54 67 24% EBITDA margin % of revenue 5.5% 7.3% 1.8pp
………………………………………………………………………………………………………………………………………………...
Acquisition of 5.85% in ViOil
In February 2019, Kernel acquired 5.85% interest in ViOil Holding Ltd (“ViOil”), one of the largest
independent sunflower oil producers in Ukraine. ViOil assets include:
• Vinnytsia multiseed oil-extraction plant with annual capacity to process 940 thousand tons of
sunflower seeds or 640 thousand tons of rapeseeds or 540 thousand tons of soybeans. The plant
is equipped with vegetable oil refining and bottling facility, as well as soft margarines and packaged
fat production unit;
• Chernivtsi multiseed oil-extraction plant with annual capacity to process 165 thousand tons of
sunflower seeds or 89 thousand tons of rapeseeds or 73 thousand tons of soybeans;
• 10 silos with 300 thousand tons storage capacity, used for oilseed procurement purposes.
A customary shareholder agreement in relation to ViOil grants us certain rights gaining a favorable
position to further increase our stake. This deal is an important initial step towards the future consol-
idation of the sector under Kernel umbrella, which is one of the targets in our Strategy 2021.
In case of closer cooperation with ViOil, we may achieve various potential synergies, like common
procurement of sunflower seeds and sale of sunflower oil produced by ViOil through our subsidiary
Avere, which consolidates the FOB-basis market in Ukraine.

Kernel Holding S.A. Annual Report and Accounts 30 June 2019 18 www.kernel.ua
Oilseed Processing continued
Strategic
Report Sustainability
Corporate
Governance
Financial
Statements
FY2020 outlook Oilseed Processing segment is expected to
deliver healthy results in FY2020. Volume-
wise, we have a target to process 3.3 million
tons of sunflower seeds in FY2020 – the high-
est volumes in our history, further increasing
our capacity utilization rate. Margin-wise, as
of the date of this report publication we expect
stronger y-o-y margins in FY2020. The har-
vest of sunflower seeds in FY2020 is ex-
pected to be unchanged as compared to the
previous season, and crushing capacities are
not increasing, but sunflower oil prices recov-
ered from extremely low FY2019 levels, con-
tributing to the expected margin recovery. On
top of that, following the increase of the limits
of our sunflower oil pre-export credit line, we
aim to originate more seeds at the beginning
of the season at higher margins, which should
also contribute to general profitability improve-
ment.
As before, first quarter of new financial year
will be weak in terms of volumes, as we nor-
mally have scheduled downtime to prepare
plants for new season in this quarter, but
stronger than Q1 FY2019 given the sufficient
stock of seed on the market after robust har-
vest in FY2019.
Additionally, we expect about US$ 6 million
EBITDA contribution from green energy gen-
eration in FY2020, following the planned com-
missioning of 3 cogeneration heat and power
units on our Poltava, Bandurka and Black Sea
Industries oil-extraction plants in spring 2020
with combined power generation capacity of
40 MW. The remaining 48 MW to be installed
on our Prydniprovskyi, Vovchansk and new
Starokostiantyniv plant in FY2021.
Non-financial performance Occupational health and safety
Our injury prevention system on crushing
plants demonstrated a stellar performance in
FY2019, as there were no recordable work-
related injuries in our Oilseed Processing seg-
ment over the reporting period for the first time
in the last decade.
To prevent health and safety accidents, each
processing site has a dedicated health and
safety specialist who ensures that workplaces
comply with safety requirements. All our work-
ers are equipped with coveralls and receive
proper health and safety training annually. For
more details on our health and safety perfor-
mance, please refer to page 48 of this report.
Employee training and development We dedicate a lot of effort to the training and
professional growth of our people. Over the
course of FY2019, 1.9 thousand participants
employed by our Oilseed Processing segment
invested a total of 30 thousand hours in devel-
opment of their hard and soft skills. We en-
gage employees in all six training and educa-
tion programs we run: professional education,
competency development trainings, one-time
educating activities, corporate modular pro-
grams, trainings from internal trainers and dis-
tance learning. We also have a special corpo-
rate MBA program for our Oilseed Processing
segment.
Energy consumption and emissions intensity
Oilseed Processing is our most eco-friendly
segment, as 83% of energy consumed comes
from renewable fuel (sunflower husk).
In FY2019, we continued the trend of energy
intensity improvement, consuming the lowest
ever 1,312 MJ per ton of sunflower seed
crushed. We reduced total consumption of
electricity and sunflower husk while increasing
oilseed processing volumes.
Greenhouse gas emissions of the segment
amounted to 3 thousand tons of CO2 equiva-
lent in FY2019, slightly up y-o-y on more nat-
ural gas consumed. GHG emissions intensity
remains at the lowest ever level of 1.1 kg of
CO2 equivalent per ton of sunflower seed
crushed.
Product quality and safety
As the largest global producer of sunflower oil,
we strive to set industry benchmarks in terms
of product quality, guaranteeing the highest
standards of goods we deliver to our custom-
ers.
All our crushing plants are certified under ISO
22000, ISO 9001 and GMP+B1. Our bottling
facilities have FSSC 22000 certificates. Be-
yond that, our crushing plants have numerous
other quality certificates which are required to
sell products across the globe (please see
“Product quality and safety certificates” on page
53).
We supply bottled sunflower oil to reputable
international retail chains (Auchan, Metro,
Walmart, Maxima etc.), which serves as proof
of the quality of our produce.
Our food safety and quality system is regularly
tested by independent third-party auditors and
constantly overseen by our internal food
safety team. The audits’ scope includes pro-
duction, storage, distribution and supply pro-
cesses. In FY2019, we passed 88 independ-
ent audits, conducted over 156 days.
……………………………………………………………………………………
Oilseed processing segment energy con-sumption and intensity ratio
3,635
3,068
3,859 3,877 3,852
1,441 1,456 1,412
1,328 1,312
FY2015 FY2016 FY2017 FY2018 FY2019
Oilseed processing energy consuption, '000 GJ
Energy spent, MJ / ton of sunflower seed crushed
……………………………………………………………………………………
GHG emissions intensity ratio (Scope 1)
17.8
6.4
13.1
2.9 3.1
7.1
3.0
4.8
1.0 1.1 FY2015 FY2016 FY2017 FY2018 FY2019
Total GHG emission, thousand tons of CO2e
GHG emission, tons of CO2e per thousand tons ofsunflower seed processed
……………………………………………………………………………………
Number of segment employees (FTE) As of 30 June of the respective year
2,750 2,455
2,592 2,501 2,258
FY2015 FY2016 FY2017 FY2018 FY2019

Kernel Holding S.A. Annual Report and Accounts 30 June 2019 19 www.kernel.ua
Infrastructure and Trading
Strategic
Report Sustainability
Corporate
Governance
Financial
Statements
In the last decade, our Infrastructure and Trading
segment transformed from an asset-light grain trad-
ing business into the biggest grain exporter from
Ukraine with a powerful grain infrastructure plat-
form. We connect more than 4,000 crop producers
in Ukraine with global markets through our best-in-
class integrated value chain, which includes the
largest private silo network, one of the largest grain
export sea terminals, the largest private grain rail-
cars fleet and an extensive procurement network.
The total EBITDA contribution of these businesses
in FY2019 amounted to US$ 106 million, up 5% y-
o-y.
In FY2019, we became the undisputable local
champion in grain export volumes from Ukraine
for the first time in our history, outperforming nu-
merous multinational and local peers. We exported
6.1 million tons of grain from Ukraine, up 58% y-o-
y, which is an important step in our Strategy 2021
execution.
We also added a new important business stream to
our operations – grain railcars. These operations
mitigate logistics risks to successfully deliver on our
Strategy 2021, and also protects us from ever grow-
ing grain logistics costs in Ukraine.
We do not have plans to stop, setting a target of 8
million tons of grain to be exported by Kernel from
Ukraine in FY2020. This new milestone will be
achieved with the help of our new 4-million-tons
grain export terminal we plan to put into operation
in January 2020.
Although FY2019 grain harvest was a record in
Ukraine, FY2020 crop size promises to be even
more outstanding, driven by wheat and barley crop
yields improvement. We believe in the long-term
grain producing potential of Ukraine and we aim to
help farmers in Ukraine to unlock it by sharing with
them our farming know-how, providing working cap-
ital financing and access to our infrastructure. All
these activities are structured through our “Open
Agribusiness” initiative which we launched a year
ago and consider an important instrument in further
boosting productivity of farming business in
Ukraine.
Exported 6.1 million tons of grains and oilseeds from Ukraine
Revenue
US$ 3,140 million +3.1x y-o-y
Unlocking Ukraine’s potential in agriculture
EBITDA (before unallocated head office expenses)
US$ 106 million +4.9% y-o-y

Kernel Holding S.A. Annual Report and Accounts 30 June 2019 20 www.kernel.ua
Infrastructure and Trading continued
Strategic
Report Sustainability
Corporate
Governance
Financial
Statements
Market overview
Key market factors important to follow for our
Infrastructure and Trading segment perfor-
mance include the harvest of grains in
Ukraine, competition among grain traders in
Ukraine and competition among grain infra-
structure assets, along with other factors.
Grain harvest in Ukraine In the season 2018/19 (the company’s
FY2019) Ukraine delivered the largest grain
harvest in its history: 70 million tons1, up 14%
y-o-y. While wheat harvest reduced by 2 mil-
lion tons to 25 million tons, harvest of corn
boosted by almost 50% y-o-y to 36 million tons
in FY2019 on extremely supportive weather
conditions.
With reducing domestic consumption in
Ukraine, grain export volumes accelerated in
2018/19 reaching 50 million tons, up 23% y-o-
y, making Ukraine the 3rd largest grain ex-
porter globally with 12% of global grain trade.
Outlook for FY2020 looks even more inspir-
ing. Grain harvest in Ukraine is expected to in-
crease above 73 million tons mostly driven by
wheat with corn production remaining un-
changed y-o-y. It will secure enough volumes
for high grain infrastructure capacity utilization
countrywide.
Competition among grain traders In Ukraine we compete with established mul-
tinational trade houses (COFCO, Cargill,
ADM, Bunge, Louis Dreyfus, Glencore) as
well as with numerous local names, including
Nibulon as the #2 exporter. While all the larg-
est exporters have their own grain export ter-
minals in ports, only some of them have in-
land silos and grain railcar fleets, not to men-
tion farming business. All those factors com-
bine as a key in winning the race for Kernel.
Grain infrastructure trends Grain export terminals
We estimate current capacity of big special-
ized grain export terminals in Ukraine at ~60
million tons per year (including the recently
commissioned Cargill’s 5-million-ton terminal
in the port of Pivdennyi). On top of that, there
are ~15 million tons of capacity for small and
unspecialized players, which are not efficient,
often lacking the depth at berth and therefore
are heavily underutilized.
The pipeline of new projects includes Kernel’s
4-million-tons TransGrainTerminal and debot-
tlenecking of various players to add, in total, a
maximum 5 million tons more of annual trans-
shipment capacity.
1 Source: USDA
With 53 million tons of grain export expected
for FY2020 and 4-5 million tons of annual
oilseed export expected, port transshipment
capacities are underutilized, which was re-
flected in recent weakness in export terminal
margins marketwise.
Grain railcars business
Over the last several years, inefficient railway
logistics became a barrier for the effective ex-
port of grain from Ukraine. The market faced
a shortage of freight railcars and railway trac-
tion, which endangers the execution of export
contracts and increases the costs for grain ex-
porters. While the rolling stock market was de-
regulated in FY2018 and more private players
started to invest in their own railcar fleet (in-
cluding Kernel), railway traction is still a mo-
nopoly-owned by the national railway opera-
tor, causing inefficiencies in logistics.
Silo business
The most important trend in silo business also
involves railway logistics. Aiming to improve
the turnover of rolling stock, Ukrainian Rail-
ways adopted new rules for freight railcars as-
signment. Consequently, silos with capacity to
load a full shuttle train (54 grain railcars) per
day are primarily allocated with railway wag-
ons during the high season. Therefore, nu-
merous unproductive and inefficient grain
storages face difficulties with getting access to
railcars, and market players started investing
in construction of new silos and debottleneck-
ing of existing ones.
Kernel is one of the largest operators of mod-
ern high loading speed silos in Ukraine. At the
end of FY2019, we added two facilities with
shuttle train-loading capabilities to our opera-
tions as a part of our Strategy 2021 execution.
Global picture Ukraine is well-positioned to remain an im-
portant player in the international grain mar-
ket, owing to both its large farmland area and
strategic location on the Black Sea. Ukraine is
ideally positioned for exports to the Mediterra-
nean market as the closest major grain pro-
ducer with a developed grain transshipment
infrastructure offering logistics and cost ad-
vantages. There are deep-water commercial
seaports connected to an extensive railway
network serving most of the grain elevators in
the country.
……………………………………………………………………… Top grain exporters from Ukraine in FY2019 % of total grain export
Source: STARK
12%
10%
9%
8%
8%
6%
6%
5%
Kernel
Nibulon
COFCO
Cargill
ADM
Bunge
Louis Dreyfus
Glencore
……………………………………………………………………
Top export terminals in Ukraine in FY2019 million tons of grain throuhput
Source: STARK
7.4
4.5
4.2
4.2
3.6
2.8
2.7
2.3
TIS
Nika-Tera
TBT (Kernel)
Glecore
COFCO
Bunge
Nibulon
ADM
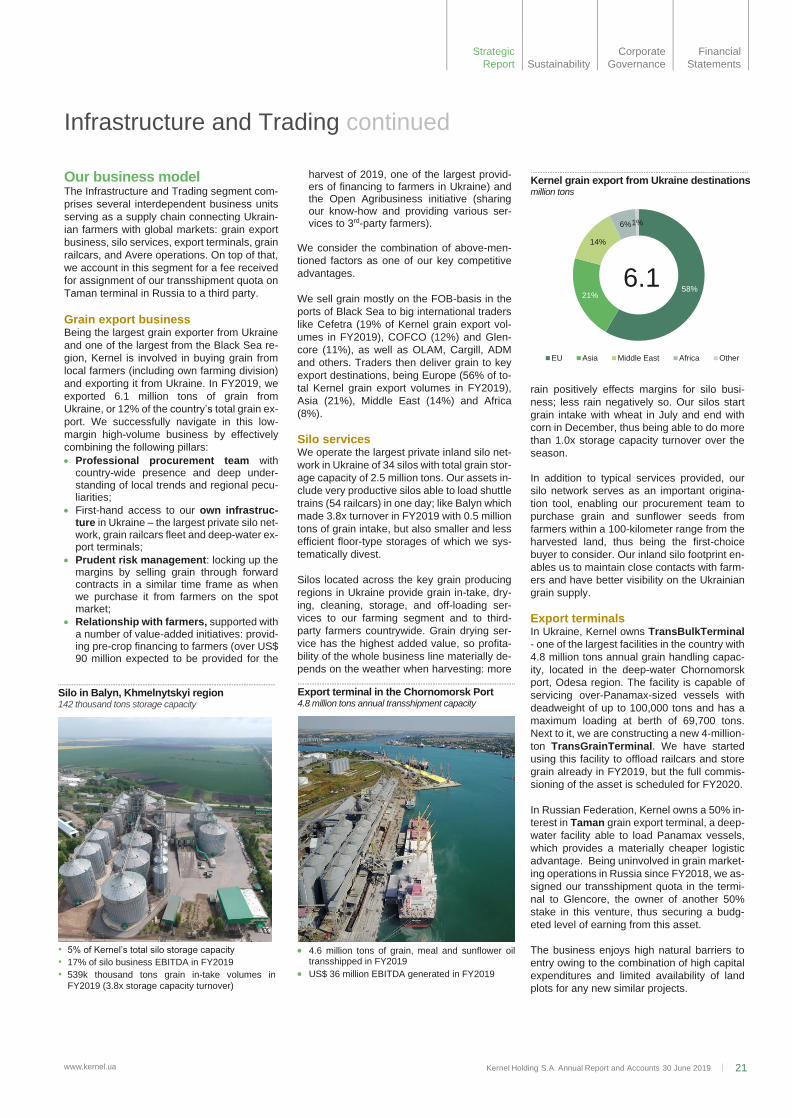
Kernel Holding S.A. Annual Report and Accounts 30 June 2019 21 www.kernel.ua
Infrastructure and Trading continued
Strategic
Report Sustainability
Corporate
Governance
Financial
Statements
Our business model The Infrastructure and Trading segment com-
prises several interdependent business units
serving as a supply chain connecting Ukrain-
ian farmers with global markets: grain export
business, silo services, export terminals, grain
railcars, and Avere operations. On top of that,
we account in this segment for a fee received
for assignment of our transshipment quota on
Taman terminal in Russia to a third party.
Grain export business Being the largest grain exporter from Ukraine
and one of the largest from the Black Sea re-
gion, Kernel is involved in buying grain from
local farmers (including own farming division)
and exporting it from Ukraine. In FY2019, we
exported 6.1 million tons of grain from
Ukraine, or 12% of the country’s total grain ex-
port. We successfully navigate in this low-
margin high-volume business by effectively
combining the following pillars:
• Professional procurement team with country-wide presence and deep under-standing of local trends and regional pecu-liarities;
• First-hand access to our own infrastruc-ture in Ukraine – the largest private silo net-work, grain railcars fleet and deep-water ex-port terminals;
• Prudent risk management: locking up the margins by selling grain through forward contracts in a similar time frame as when we purchase it from farmers on the spot market;
• Relationship with farmers, supported with a number of value-added initiatives: provid-ing pre-crop financing to farmers (over US$ 90 million expected to be provided for the
harvest of 2019, one of the largest provid-ers of financing to farmers in Ukraine) and the Open Agribusiness initiative (sharing our know-how and providing various ser-vices to 3rd-party farmers).
We consider the combination of above-men-
tioned factors as one of our key competitive
advantages.
We sell grain mostly on the FOB-basis in the
ports of Black Sea to big international traders
like Cefetra (19% of Kernel grain export vol-
umes in FY2019), COFCO (12%) and Glen-
core (11%), as well as OLAM, Cargill, ADM
and others. Traders then deliver grain to key
export destinations, being Europe (56% of to-
tal Kernel grain export volumes in FY2019),
Asia (21%), Middle East (14%) and Africa
(8%).
Silo services
We operate the largest private inland silo net-
work in Ukraine of 34 silos with total grain stor-
age capacity of 2.5 million tons. Our assets in-
clude very productive silos able to load shuttle
trains (54 railcars) in one day; like Balyn which
made 3.8x turnover in FY2019 with 0.5 million
tons of grain intake, but also smaller and less
efficient floor-type storages of which we sys-
tematically divest.
Silos located across the key grain producing
regions in Ukraine provide grain in-take, dry-
ing, cleaning, storage, and off-loading ser-
vices to our farming segment and to third-
party farmers countrywide. Grain drying ser-
vice has the highest added value, so profita-
bility of the whole business line materially de-
pends on the weather when harvesting: more
rain positively effects margins for silo busi-
ness; less rain negatively so. Our silos start
grain intake with wheat in July and end with
corn in December, thus being able to do more
than 1.0x storage capacity turnover over the
season.
In addition to typical services provided, our
silo network serves as an important origina-
tion tool, enabling our procurement team to
purchase grain and sunflower seeds from
farmers within a 100-kilometer range from the
harvested land, thus being the first-choice
buyer to consider. Our inland silo footprint en-
ables us to maintain close contacts with farm-
ers and have better visibility on the Ukrainian
grain supply.
Export terminals In Ukraine, Kernel owns TransBulkTerminal
- one of the largest facilities in the country with
4.8 million tons annual grain handling capac-
ity, located in the deep-water Chornomorsk
port, Odesa region. The facility is capable of
servicing over-Panamax-sized vessels with
deadweight of up to 100,000 tons and has a
maximum loading at berth of 69,700 tons.
Next to it, we are constructing a new 4-million-
ton TransGrainTerminal. We have started
using this facility to offload railcars and store
grain already in FY2019, but the full commis-
sioning of the asset is scheduled for FY2020.
In Russian Federation, Kernel owns a 50% in-
terest in Taman grain export terminal, a deep-
water facility able to load Panamax vessels,
which provides a materially cheaper logistic
advantage. Being uninvolved in grain market-
ing operations in Russia since FY2018, we as-
signed our transshipment quota in the termi-
nal to Glencore, the owner of another 50%
stake in this venture, thus securing a budg-
eted level of earning from this asset.
The business enjoys high natural barriers to
entry owing to the combination of high capital
expenditures and limited availability of land
plots for any new similar projects.
…………………………………………………………………………………………………………………
Kernel grain export from Ukraine destinations million tons
58%21%
14%
6%1%
EU Asia Middle East Africa Other
6.1
…………………………………………………………………………………………………………………
Silo in Balyn, Khmelnytskyi region 142 thousand tons storage capacity
• 5% of Kernel’s total silo storage capacity
• 17% of silo business EBITDA in FY2019
• 539k thousand tons grain in-take volumes in
FY2019 (3.8x storage capacity turnover)
…………………………………………………………………………………………………………………
Export terminal in the Chornomorsk Port 4.8 million tons annual transshipment capacity
• 4.6 million tons of grain, meal and sunflower oil
transshipped in FY2019
• US$ 36 million EBITDA generated in FY2019

Kernel Holding S.A. Annual Report and Accounts 30 June 2019 22 www.kernel.ua
Infrastructure and Trading continued
Strategic
Report Sustainability
Corporate
Governance
Financial
Statements
Grain railcars After the purchase of 500 brand-new railcars
in 2018 and the acquisition of the business
with 2,949 used railcars in February 2019,
Kernel became the largest private operator of
grain railcars in Ukraine with ~13% market
share of total grain hoppers fleet in Ukraine.
We use railcars to deliver grain from silos
(owned by us and by other players) to the
grain transshipment terminals in the ports. By
owning the railcars, we save on lease pay-
ments, though we still pay for usage of railway
traction and infrastructure.
Avere operations Avere is a 72.5%-owned subsidiary of Kernel,
with another 27.5% owned by the managing
partners of Avere. It is a research and
knowledge platform founded in FY2018 and
headquartered in Geneva, Switzerland, with
representative offices in USA and Singapore.
Avere employs a highly qualified research,
trading and execution team of approximately
30 specialists. Avere sells almost all sunflower
oil produced by Kernel plants, purchasing
sunflower oil from Kernel at market prices
(FOB Black Sea) and paying Kernel a fee. Ad-
ditionally, Avere helps to hedge Kernel’s
growing grain export volumes and farming
produce. Finally, leveraging its expertise,
Avere is involved in the merchandising and
proprietary trading of grains, oilseeds and re-
lated products in the key world markets.
Key developments In FY2019, we became the largest grain ex-
porter from Ukraine, for the first time in Kernel
history. We outperformed numerous local
peers and international players operating on
the Ukrainian market, delivering to export
markets 6.1 million tons of grain since 1 July
2018 to 30 June 2019. 67% of exported vol-
umes comprised of corn, 26% - of wheat, and
remaining of barley and other crops.
In FY2019, we pursued investments in railcar
business: in addition to US$ 25 million in-
vested into the purchase of 500 brand-new
railcars last season, we obtained 2,949 used
railcars by acquiring RTK-Ukraine LLC in Feb-
ruary 2019 for US$ 65 million. We consider
these investments of strategic importance, as
it improves control over the value chain and
protects from ever-growing logistic costs.
FY2019 was a year of the full-scale roll-out of
our Open Agribusiness initiative. We orga-
nized three large meetings with 246 agripro-
ducers in Ukraine operating in total 1.5 million
hectares of land. On these meetings, we pre-
sented our program and advantages for farm-
ers, disclosed our approach in precision farm-
ing, and demonstrated our fields and crop
production technologies. As of the date of this
report, other farmers shared information on
over 390 thousand hectares of land with each
other to make benchmarking within our Open
Agribusiness program.
Driven by processes optimization and good
coordination between our logistic and export
terminal teams, our TransBulkTerminal pro-
vided record transshipment volumes in
FY2019 of 4.6 million tons, including 4.2 mil-
lion tons of grain and with remaining being
sunflower oil and meal. The facility also set a
new monthly record, transshipping 460 thou-
sand tons of commodities, and we upgraded
the notional capacity of the facility to 4.8 mil-
lion tons per annum.
In FY2019, we initiated optimization of rela-
tions with 3rd-party truck carriers who transport
sunflower seeds to our plants, sunflower oil
and meal to ports, and grain to our silos and
port terminals. We are introducing long-term
contracts with 3rd-party carriers increasing
predictability of their business and guarantee-
ing traffic volumes, and getting as a result re-
duction in tariffs, streamlining of our logistics
and uninterrupted supplies.
In FY2019, we constructed the first stage
(grain in-take and storage capacities) of our
new TransGrainTerminal in the port of Chor-
nomorsk. The facilities are linked with our op-
erating TransBulkTerminal, thus having a pos-
itive impact on the capacity of the last. The fi-
nal commissioning of TransGrainTerminal is
scheduled for FY2020.
In the reporting period, we continued to further
optimize our asset base. Firstly, we have been
disposing of small floor-type grain silos, which
are inefficient with high costs and low capacity
turnover and do not fit our business model. As
a result, by the end of the year our one-time
grain silo storage capacity reduced to 2.5 mil-
lion tons. Secondly, we divested of a small ex-
port terminal located in Mykolaiv port. Kernel
used to transship sunflower meal through this
shallow-water facility, but the terminal was
outdated and inefficient, without any strategic
fit to Kernel operations. Stemming from the
portfolio optimization, the headcount of the
segment reduced 13% y-o-y, to 2,990 employ-
ees as of 30 June 2019.
Delivering on our Strategy 2021, we con-
structed two new silos and substantially
…………………………………………………………………………………………………………………………………………………
Case study: Transforming railway logistics in Ukraine Problem: inefficient inland grain railway logistics in Ukraine not able to effectively handle
steadily growing grain export volumes. Consequently, growing costs, resulting losses and
bottlenecks put at risk the execution of our Strategy 2021 – doubling grain export volumes by
2021 against a FY2016 baseline year
Solution undertaken by Kernel – pro-active 3-stage approach:
1. Purchase 500 brand-new railcars to test the market and operations;
2. Acquire RTK-Ukraine with 2,949 grain railcars to reach a scale for impact;
3. Value-creative initiatives around our fleet to transform the whole system:
• Strict schedule shipments: a joint project with state monopoly Ukrainian Railways to
introduce movement of grain trains by strict schedule. Being the first such initiative in
Ukraine, it aims to increase fleet turnover more than twice, provide for more efficient
logistics planning by Kernel team, and improve the effectiveness of the whole system
in case the project is widely adopted by other operators. We expect to transport 0.9
million tons of grain applying strict schedule scheme in FY2020.
• Transit-Hub: a web-platform for cargo owners storing grain on nearby silos to combine
their efforts in loading a single block train (54 railcars) which travels nonstop to a desti-
nation in the port without being split up or stored en route. Such an approach reduces
shipping time and costs for grain exporters.
Result: Kernel became the 2nd-largest operator (after the state monopoly) of a grain railcar
fleet in Ukraine, contributing to efficiency improvement of the whole industry.

Kernel Holding S.A. Annual Report and Accounts 30 June 2019 23 www.kernel.ua
Infrastructure and Trading continued
Strategic
Report Sustainability
Corporate
Governance
Financial
Statements
upgraded two other silos, almost completing
our US$ 65 million investment program in the
silo business line. New capacities start con-
tributing to our EBITDA as soon as in FY2020.
Performance overview
Historically we used to report Infrastructure
and Trading segment as three sub-segments:
grain marketing, silo services and export ter-
minals. Though, recently we changed our ap-
proach to profitability management in these
segments when taking managerial decisions
and start looking at the margin through the
whole value chain rather than the profitability
of each separate business, also accounting
for numerous intragroup transactions between
our grain export, silo and terminal businesses.
Infrastructure and Trading segment generated
US$ 106 million EBITDA in FY2019, flat as
compared to the previous year. Among the
factors pushing earnings up we need to men-
tion:
• Record volumes across all business
lines. In FY2019, Kernel became the larg-
est grain exporter from Ukraine for the first
time in its history, delivering 6.1 million tons
of grain out of Ukraine, a tremendous 58%
growth y-o-y. Of that, 4.2 million tons was
transshipped through our TransBulkTermi-
nal in the port of Chornomorsk, and the re-
maining transshipped through 3rd-party ter-
minal in the port of Pivdennyi. Our silo busi-
ness in-take volumes posted a hefty 30% y-
o-y growth, to the highest ever 4.3 million
tons, of which 3.3 million tons was supplied
by our farming business, and in-take pro-
duced by other farmers amounted to 1 mil-
lion tons.
• Savings from the railcars business,
which added approximately US$ 15 million
EBITDA to segment earning in FY2019;
At the same time, several factors restrained
earning from growth in the reporting period,
namely:
• Weaker margins in infrastructure busi-nesses. Lack of rains during the harvesting period lowered demand for grain drying ser-vices (the most profitable services for our silos), and increased competition in the ex-port terminals business negatively im-pacted margins of that our branch as well;
• Loss generated by Avere operations.
We were not exporting grain from Russia over
the reporting period. Owning 50% in the deep-
water grain transshipment terminal in Taman,
Russia, we assigned our transshipment quota
to a 3rd-party and received a fee of US$ 8 mil-
lion in FY2019, which is included in the
EBITDA of the segment.
EBITDA margin per ton of grain exported
through our value chain reduced to US$ 17 di-
luted by increasing scale of our low-margin
trading operations and Avere negative perfor-
mance, while keeping contribution from our
high-margin infrastructure businesses limited.
FY2020 outlook
We have a target to export over 8 million tons
of grain and oilseeds from Ukraine in FY2020,
with the key tailwinds being:
• Commissioning of our new Trans-GrainTerminal in the port of Chornomorsk with 4 million tons annual transshipment ca-pacity. Ramp-up of the facility is not likely to take long, so we plan our two terminals in Ukraine to handle over 7 million tons of grain in FY2020;
• putting into operations two new silos and debottlenecking of several other silos, com-pleted in the end of FY2019;
• full-season utilization of the railcars ac-quired in February 2019. We expect to transport 6.7 million tons of cargo (grains, oilseeds, sunflower meal) by our fleet in FY2020.
For FY2020, we plan to increase the share of
CIF export sales (in ports of destination), re-
ducing the sales on the FOB basis (in ports of
Ukraine). It will simplify our logistics and allow
us to earn additional profits.
Our procurement team plans to originate 5.5
million tons of grain from 3rd-party farmers in
Ukraine in FY2020, with the intention to further
increase it to 7 million tons beyond FY2020.
As in the two previous years, we will not be
exporting grain from Russia, as we assigned
our transshipment quota on Taman terminal to
a 3rd party for the annual fee of US$ 9 million
for the season of FY2020.
Profitability-wise, we expect flat margins in
grain export operations and infrastructure
businesses. A new bumper grain crop ex-
pected for FY2020 should be supportive for
our plans.
FY2020 may become the beginning of new
productivity growth stage for farmers in
Ukraine. Farmland market reform has high
chances to be finally adopted in the upcoming
season, and it is generally believed to serve
…………………………………………………………………………………………………………………………………………………………
Infrastructure and Trading segment performance
FY2018 FY2019 y-o-y
Grain export volumes thousand tons 3,953 6,094 54% Export terminal's throughput (Ukraine) thousand tons 4,112 4,606 12% Grain and oilseeds received in inland silos thousand tons 3,292 4,276 30% Revenue US$ million 1,025 3,140 3.1x EBITDA US$ million 101 106 5% EBITDA margin per ton of grain exported US$ 26 17 (34%)
…………………………………………………………………………
Infrastructure and Trading segment EBITDA US$ million
114 107 110
101 106
FY2015 FY2016 FY2017 FY2018 FY2019
…………………………………………………………………………………………………………………………………………………………………………………
TransGrainTerminal (projected design)
Kernel Holding S.A. Annual Report and Accounts 30 June 2019 24 www.kernel.ua
Infrastructure and Trading continued
Strategic
Report Sustainability
Corporate
Governance
Financial
Statements
as an impetus for further crop production in-
tensification. Such a scenario is generally
beneficial for our Infrastructure and Trading
value chain, securing strong utilization of all
the assets.
Non-financial performance
Occupational health and safety Regretfully, we had one fatal accident in Infra-
structure and Trading segment as a result of
the breach of occupational safety regulation.
The number of non-fatal injuries over the re-
porting period, unfortunately, increased to 11
from 2 a year ago. 8 such cases are trivial in-
juries which happened occasionally in its ma-
jority, but 3 incidents caused grievous bodily
harm.
We remain committed to fully eliminate such
accidents in the future, organizing health and
safety trainings, workshops, and regularly in-
specting our assets for compliance with health
and safety requirements. We aim to have our
health and safety systems at all our infra-
structure units fully compliant with OHSAS
18001. The ultimate goal is to have no work-
related injuries among our employees.
We declared FY2020 to be a year of job safety
in our Infrastructure and Trading segment, al-
locating increased budgets for training and
additional involvement of employees to the
discussion of job safety. On top of that, se-
lected KPIs on occupational health and safety
were added to the performance assessment
system for the key management of our assets:
oilseed processing plants, silos and export
terminals.
Employee training and development We remain committed to the professional de-velopment of our employees. 1.1 thousand participants from Infrastructure and Trading segment were involved in our training and de-velopment activities in FY2019, investing more than 9,000 hours in total for training and professional development. The activities were focused on the development of hard and soft skills, various competencies and managerial abilities.
Energy consumption and emissions intensity Our energy consumption within the infrastruc-
ture and trading division decreased by 9% y-
o-y to 1,110 thousand gigajoules in FY2019,
mainly due to the reduction of natural gas con-
sumption given less demand for grain drying
services in silo business line. At the same
time, energy efficiency decreased by 11% in
comparison to the previous year, with 67
megajoules spent for each percentage of
moisture removed from one ton of grain dried,
compared to 61 megajoules a year ago. The
reason is the low humidity of the crops this
season compared to the previous one.
The factors driving energy consumption also
impacted emissions of the division, which de-
creased to 57 thousand tons of CO2 equiva-
lent in FY2019.
For the full group disclosure of energy con-
sumption, emissions and intensity ratios, see
pages 45 and 46 of this report.
…………………………………………………………………………
Infrastructure and Trading segment energy consumption
803
603
1,162 1,224
1,110
63 63 68
61 67
FY2015 FY2016 FY2017 FY2018 FY2019
Energy consumption, 000 GJ
Energy spent per ton-% of grain dried, MJ
…………………………………………………………………………
Infrastructure and Trading GHG emissions
thousand tons of CO2 equivalent
43
29
61
70
57
FY2015 FY2016 FY2017 FY2018 FY2019
……………………………………………………………………………………
Number of segment employees (FTE) As of 30 June of the respective year
3,103 3,250
3,501 3,447
2,990
FY2015 FY2016 FY2017 FY2018 FY2019

Kernel Holding S.A. Annual Report and Accounts 30 June 2019 25 www.kernel.ua
Farming
Strategic
Report Sustainability
Corporate
Governance
Financial
Statements
Kernel is the largest and one of the most technolog-
ically advanced crop producers in Ukraine, operat-
ing 530 thousand hectares of prime farmland. In
just a decade we managed to increase the scale of
our operations 7 times, completely transforming our
crop production technology and boosting productiv-
ity to set industry benchmarks.
Notwithstanding the strong fundamentals for farm-
ing business in Ukraine, like top-quality soils glob-
ally and proximity to key markets, profitability in this
business is extremely sensitive to the level of global
grain prices and weather conditions in Ukraine.
Given our exposure to price and weather risk
(which we cannot control), we are focusing on what
we can actually impact: costs and productivity.
We are much more advanced in crop production
technology than most other farmers in Ukraine, and
we continue to invest in knowledge and processes
optimization by developing our #DigitalAgriBusi-
ness project. This solution will help us to increase
the productivity of each separate field, and better
plan and monitor our field works
The season of FY2019 deserves to be one of the
most prominent in the history of our faming busi-
ness. We achieved record yields and harvested the
largest ever crop of grains and oilseeds. Weather
conditions were close to ideal, prices contracting
momentum was chosen appropriately, and our ad-
vanced farm management system allowed us to
quickly and efficiently integrate the new landbank
added to our operations in summer 2017. As a re-
sult, farming segment generated US$ 182 million
EBITDA, up twice y-o-y, driving the performance of
the whole company.
While we believe in the long-term potential of the
farming business in Ukraine, short-term sentiments
are less optimistic. Next year brings us land lease,
fertilizers and labor costs inflation enhanced by
Ukrainian currency appreciation. Crop yield for corn
is expected to reduce, and global grain prices are
not supportive at the beginning of the season. It
makes us expect the contribution from our farming
segment in FY2020 to be lower than the extremely
good result generated in FY2019.
Revenue
US$ 602 million +28% y-o-y
EBITDA (before unallocated head office expenses)
US$ 182 million +105% y-o-y
Produced 3.3 million
tons of key grains
and oilseeds in
FY2019
Shaping agribusiness in Ukraine to feed the world

Kernel Holding S.A. Annual Report and Accounts 30 June 2019 26 www.kernel.ua
Farming continued
Strategic
Report Sustainability
Corporate
Governance
Financial
Statements
Our business model Large-scale farming Kernel is the largest crop producer in Ukraine,
operating 530 thousand hectares of leasehold
farmland including 513 thousand hectares un-
der 2019 harvest. In FY2019, we produced
3.3 million tons of key crops. We operate in
western, central and northern regions of
Ukraine, rich with black soils and enjoying suf-
ficient precipitation. The land bank is divided
into 6 production clusters, with operational de-
cision-making sufficiently decentralized to en-
sure quick reaction of production teams for
any types of externalities. Central office is re-
sponsible for overall business strategy, pro-
curement of key inputs and control over oper-
ations. Healthy competition between clusters
stimulates constant efficiency improvements.
We retain a simple crop mix, with 45% of acre-
age attributable to corn, 27% to sunflower,
19% for wheat, 5% to soybean, with the re-
maining spread across other minor crops (for
2019 harvest, which will be sold over
FY2020).
Leasehold land operations Close to 25% of agricultural land in Ukraine is
owned by the state, municipalities and state-
owned enterprises. Another 75% is owned by
private individuals in small land plots with an
average size of 4-10 ha depending on the re-
gion, who obtained the ownership rights dur-
ing the land distribution process in 1990s fol-
lowing the collapse of Soviet Union.
All farmland in Ukraine has been under a sale
moratorium for the past 18 years. First
adopted in 2001, it was then extended by the
parliament several times, suppressing the de-
velopment of farming business in Ukraine. As
a result, crop producers lease lands from its
current owners, and since 2015, the minimum
land lease term is 7 years, securing business
operations for farmers.
Kernel leases land through contracts with an
average maturity of 9 years. All lease con-
tracts provide for the right of first refusal to
prolong leases or to buy the land in case of
the moratorium lifting in the future. For 18
thousand hectares of land we operate, we
signed long-term (>70 years) land lease (‘em-
phyteusis’) agreements, whereby all rent pay-
ments are paid to the lessor in one installment
at the signing of the agreement. It allows us to
secure our operations for a much longer pe-
riod compared to typical farmland lease con-
tracts.
89% of the landbank we lease is owned by pri-
vate individuals, and 11% is owned by state
authorities.
After presidential and parliamentary elections
in Ukraine in 2019, and the appointment of a
new government with quite liberal views, farm-
land market reform appeared again in the
agenda. We estimate chances of farmland
market liberalization in a year from date of
publication of this report as quite high.
Efficient and sustainable production technology We take great care to ensure our operations
maintain long-term productivity of soil by ap-
plying sustainable agronomy practices.
………………………………………………………………….. Kernel’s farmland lease rights maturity as % of total landbank
7%
12% 12%
24%
17% 17%
7%
5%
Lessthan 3years
3-5 5-7 7-9 9-11 11-15 15-20 morethan20
years
…………………………………………………………………………………………………………………………………………………………………………………………………………………………………
FY2019 crop production cycle FY2018 FY2019
Jul Aug Sep Oct Nov Dec Jan Feb Mar Apr May Jun July Aug Sep Oct Nov Dec Jan Feb Mar-Jun Corn
Land preparation
Fertilization
Planting
Plant protection
Harvesting
Selling
Jul Aug Sep Oct Nov Dec Jan Feb Mar Apr May Jun July Aug Sep Oct Nov Dec Jan Feb Mar-Jun
Sunflower
Land preparation
Fertilization
Planting
Plant protection
Harvesting
Selling
Jul Aug Sep Oct Nov Dec Jan Feb Mar Apr May Jun July Aug Sep Oct Nov Dec Jan Feb Mar-Jun Soybean
Land preparation
Fertilization
Planting
Plant protection
Harvesting
Selling
Jul Aug Sep Oct Nov Dec Jan Feb Mar Apr May Jun July Aug Sep Oct Nov Dec Jan Feb Mar-Jun
Winter wheat Land preparation Fertilization Planting Plant protection Harvesting Selling

Kernel Holding S.A. Annual Report and Accounts 30 June 2019 27 www.kernel.ua
Farming continued
Strategic
Report Sustainability
Corporate
Governance
Financial
Statements
We do the significant portion of tillage and soil
leveling in autumn, thus completing our spring
planting campaign within a shorter time frame.
We apply mostly differentiated tillage, rotating
mini-till and deep-till technologies. We operate
modern high-productive machinery and equip-
ment with relatively low consumption of fuel
and low level of emissions, driving energy ef-
ficiency.
Save for a thousand hectares of irrigated land
used for in-house seed production, all our
farmland is rain-fed, with all the weather risks
arising from that.
We apply balanced fertilization to enrich our
soils, utilizing both organic and mineral fertiliz-
ers. Unlike the majority of farmers in Ukraine,
we apply most of our fertilizers in autumn,
ahead of the spring planting campaign. Au-
tumn application provides for a longer time for
fertilizers to be absorbed by the land, allows
us to use liquid fertilizers that are more digest-
ible compared to dry fertilizer, and results in
faster completion of the spring planting
campaign. For several years, we apply deep
fertilizer placement (ca. 15-20 cm under the
ground), thus concentrating around the plants’
root system ensuring faster absorption and
improving nutrient use efficiency.
We apply best-quality non-GMO seeds. Most
of it is grown in-house from premium parent
seeds, sometimes jointly with established
global seed producers, and the remaining is
supplied by recognized global players. Our
crop rotation cycle is designed to prevent the
expansion of pathogens and pests and im-
prove the soil structure.
We use only crop protection agents pro-
duced by established international companies
and registered by the Ministry of Ecology and
Natural Resources of Ukraine. Before wide
application, we observe the pesticides in ac-
tion on our test fields for at least three years.
We widely use drones for crop monitoring to
improve the quality of decisions about fertiliz-
ing and crop protection.
Innovation-driven approach We are entering a new era in farming busi-
ness, when digital technologies and modern
farming techniques will have a key role ad-
vancing operational excellence
We have 5 specialized R&D centers with
1,500 test fields and 60 employees, conduct-
ing over 2,000 tests annually. Additionally,
each of our clusters is free to use up to 10%
of acreage under control for experiments to
test various new crop production techniques
focused on productivity improvements.
Our crop yields are well above the country av-
erages, and we share our know-how with
other farmers in Ukraine through the Open Ag-
ribusiness initiative to improve their productiv-
ity and minimize environmental impact.
Key developments In FY2019, we completed the first module
(Planning) of our farming management eco-
system #DigitalAgriBusiness with all the basic
functionality already used in operations. The
system allows us to apply sophisticated IT so-
lutions for the proper organization of pro-
cesses and allocation of resources for sowing
and harvesting campaigns. Now we are fo-
cused on the fine-tuning of the Planning mod-
ule and also developing and implementation
of the second module (Monitoring), including
the monitoring of crops and the monitoring of
machinery. To date, we have invested over
US$ 3 million in the development of the prod-
uct. Following the presentation of the product
on the market, we see a demand in such so-
lution from other local farmers, so we may
consider the release of a commercial version
of #DigitalAgriBusiness in the future.
…………………………………………………………………… Kernel’s acreage harvested by crops thousand ha
41% 36% 34% 42% 45%
16% 21%
22% 25% 27%
19% 21%
24% 19% 19%
17% 15%
11%
7% 5%
7% 7%
8%
6% 5%
391 385
596
529 513
FY2016 FY2017 FY2018 FY2019 FY2020
Corn Sunflower Wheat Soybean Other
……………………………………………………………………….. Kernel’s production of key crops thousand tons
83% 82% 81%
82%
83%
17% 18%
19%
18%
17%
1,772 1,864
2,119
2,517
3,266
FY2015 FY2016 FY2017 FY2018 FY2019 Grains Oilseeds
…………………………………………………………………… Kernel’s crop yields 1 tons per ha
Note 1: For comparison purposes, yields for FY2018 are provided for Ker-nel’s initial lands (prior to land bank expansion in summer 2017) to avoid dilution effect.
7.2
8.9
7.3
9.9
5.15.8
5.45.1
2.83.0
2.73.2
1.8
2.7
1.9
3.0
FY2019
FY2018
FY2017
FY2016
Ukraine
Corn Wheat Sunflower Soybean
……………………………………………………………………………………
Profitability dynamics US$ million
310
358 381
470
602
98
146 146 89
182
32%41%
38%
19%
30%
FY2015 FY2016 FY2017 FY2018 FY2019
Revenue EBITDA
EBITDA margin, %
……………………………………………………………………………………
Number of segment full-time employees As of 30 June of the respective year
8,770
7,767
9,389
8,448
7,405
22.7
20.4
16.8 16.0
14.4
FY2015 FY2016 FY2017 FY2018 FY2019
Number of segment full-time employees
Farming employees per thousand ha

Kernel Holding S.A. Annual Report and Accounts 30 June 2019 28 www.kernel.ua
Farming continued
Strategic
Report Sustainability
Corporate
Governance
Financial
Statements
In FY2019, we reduced headcount to 14 em-
ployees per thousand hectares as of 30 June
2019 from 16 as of 30 June 2018. As a result,
total headcount in farming segment measured
as of 30 June 2019 reduced by 13% (or more
than 1 thousand) y-o-y, to 7,405 full-time em-
ployees. We understand there is further po-
tential for labor productivity improvement,
which will remain our focus for the next sev-
eral years.
Considering the situation with fertilizers in
Ukraine, we initiated the construction of the
equipment for production of UAN (solution of
urea and ammonium nitrate in water), which is
widely applied as a fertilizer. We installed such
equipment in one of our clusters, and plan to
install similar units on our other clusters, in-
vesting US$ 0.5 million in total with less than
a year payback period.
For FY2020 harvest, we further increased per-
centage of acreage under sunflower and corn
– key crops for our production technology.
Perfromance overview Our farming segment generated the highest
ever EBITDA of US$ 182 million, up 105% y-
o-y, with the following factors contributing to
this achievement:
• Supportive weather conditions for late
crops (corn, sunflower and soybean). In
July, persistent above-normal precipitation
along with seasonal temperatures were
ideal to promote successful pollination. As a
result, Kernel achieved record crop yields in
our history;
• quick and successful integration of farm-
ing businesses acquired in 2017. FY2019
was the first year when we applied our full-
cycle crop production approach on new
lands, and we substantially improved the
productivity there with minor further upside
remaining. We demonstrated our ability to
easily replicate our advanced technology on
new lands boosting crop yields;
• our efforts in productivity improvement;
• proper approach to price hedging. We
managed to catch relatively high prices
within the season and successfully con-
tracted our volumes.
With 529 thousand hectares harvested in
FY2019, our farming segment generated US$
344 EBITDA per hectare.
The largest cost categories in farming busi-
ness in FY2019 were land lease costs (17%
of total farming costs), fertilizers (15%), labor
costs (13%) and costs of seeds (11%).
FY2020 outlook In general, we share the prevailing negative
sentiment towards farming segment perfor-
mance in FY2020. Crop yield for corn as our
key crop is expected to decrease in FY2020
as compared to unusually high base of
FY2019, while crop yields for wheat and sun-
flower will improve. Growing cost base (mainly
land lease costs, energy costs (fuel and ferti-
lizers), and labor costs) coupled with the ap-
preciation of local currency may pose some
near-term downside risk on the performance
of our farming business, especially consider-
ing weak grain prices at the beginning of the
season.
Non-financial performance Occupational health and safety
Our approach to work-related injury preven-
tion resulted in the lowest number of accidents
in our Farming segment over the last decade.
We had 2 non-fatal injuries in FY2019, 5x less
than a year ago. Since it is still above our tar-
get of zero accidents, we are paying special
attention to minimize such cases in the future
by training our health and safety specialists,
organizing labor safety trainings and informing
all employees about each accident immedi-
ately after it occurs.
Employee training and development Envisaging the highest potential in labor
productivity improvement in farming as com-
pared to other our segments, we pay special
attention to professional development and
training of our farming employees. In FY2019,
3.9 thousand participants employed by our
Farming segment attended our training and
development activities, investing in total 40
thousand hours for improving their profes-
sional and managerial skills, developing
knowledge and competencies. A major por-
tion of our professional education program is
targeted on our farming personnel. We run
fully equipped modern training facilities lo-
cated in several of our farming clusters, where
we organize module-based practical training
programs taught by local and visiting trainers
for our agronomists, engineers and other ag-
ribusiness specialists. Since 2013, we have
organized a corporate MBA program for our
agri managers and key specialists and also ar-
range numerous experience-exchange pro-
grams, crop tours and site visits. Finally, we
conduct regular in-person meetings for repre-
sentatives of our clusters, which are spread all
over Ukraine, to share their experience and
best practices.
…………………………………………………………………………………………………………………………………………………... Farming segment performance
FY2018 FY2019 y-o-y
Revenue US$ million 470 602 28% EBITDA US$ million 89 182 105%
Volumes sold thousand tons 2,594 3,294 27% Acreage harvested thousand ha 596 529 (11%) Revenue per hectare US$ / ha 790 1,137 44% EBITDA per hectare US$ / ha 149 344 131% EBITDA margin % 18.9% 30.2% 11.4pp

Kernel Holding S.A. Annual Report and Accounts 30 June 2019 29 www.kernel.ua
Farming continued
Strategic
Report Sustainability
Corporate
Governance
Financial
Statements
Energy consumption and emissions intensity
Our practice in farming business is sustaina-
ble intensification of the farming: produce
more food with less inputs.
As a result of the farmland bank expansion,
total energy consumed by our faming division
increased by 28% y-o-y in FY2018 and re-
mains stable in FY2019. However, the energy
spent per ton of crop grown decreased by
19%, as the operations on the lands we ac-
quired became as efficient as the operations
on our initial lands. At the same time, a down-
ward sloping trend in energy consumption in-
tensity is obvious, reflecting our constant ef-
forts in efficiency improvement. Emissions in-
tensity remained at a record low 53 kg of CO2
equivalent per ton of grain grown.
Giving back to local communities
Rural communities within the scope of our
farming operations are a key focus of our com-
pany’s social and charity activities. More than
two hundred of our employees serve as rela-
tionship managers with their respective com-
munities, some working full-time in this role
while others are part-time. Direct contact with
local residents allows us to plan and execute
our social activities in the most efficient way
and receive direct feedback on the impact of
our operations on communities.
Over the course of FY2019 our social expenses
totaled US$ 2.3 million, comprising mostly in-
vestments into infrastructure (US$ 625 thou-
sand, excluding spending related to our busi-
ness needs), schools and kindergartens, as
well as charity donations and other social
spending facilitating sport, art and leisure activ-
ities. All our support of local communities is
structured through the charitable foundation
‘Together with Kernel’, which runs its own web-
site aimed at promoting our social activities and
serving as a point of contact with local stake-
holders.
…………………………………………………………………………
Farming division energy consumption
1,522 1,392 1,445
1,847 1,867
854 708
630 675 546
FY2015 FY2016 FY2017 FY2018 FY2019
Farming division energy consumption, '000 GJ
Energy spent per ton of crop grown, MJ
…………………………………………………………………………
Farming division GHG emissions (Scope 1)
174 161 156
186 173
97 84
68 68
50
FY2015 FY2016 FY2017 FY2018 FY2019
'000 tons of CO2 equivalent
kg of CO2 equivalent per ton of grain grown

Kernel Holding S.A. Annual Report and Accounts 30 June 2019 30 www.kernel.ua
Risk management
Strategic
Report Sustainability
Corporate
Governance
Financial
Statements
Risk management system At Kernel Holding S.A., management defines
risk as an event, action or lack of action, which
can lead to non-achievement of the Com-
pany’s objectives.
Kernel has an evolving system of risk man-
agement aimed at preserving the stability
and solvency of the Company under ex-
treme conditions to preserve long-term
sustainable value for shareholders.
Based on Risk Management Policy (adopted
by the Board of Directors in November 2018)
and underlying policies and procedures, Ker-
nel monitors and assesses its risk exposures
on an ongoing basis and takes steps to mini-
mize their impact.
Key roles The Company’s risk management is realized
by the Board of Directors, executive manage-
ment team and other management and staff,
which starts from the strategy development
and impacts all activities and processes of the
Company. These activities aim at risk identifi-
cation and risk management, in order to pro-
vide reasonable assurance of the Companies’
goals achievement. Please see details at Key
roles and duties in the risk management pro-
cess chart.
Risk management cycle The risk management cycle includes 5 stages:
risk identification; risk assessment and priori-
tization; planning of risk management actions;
actions implementation; measurement, con-
trol and monitoring.
Risk categories The management classifies all risks under 5
categories:
1. Strategic (Business)
2. Operational
3. Financial
4. Regulatory
5. Sustainability
Top-10 risks identified for FY2020 includes
risks from Strategic (Business) and Opera-
tional categories.
………………………………………………………………………………………………………………………………………................
Kernel’s risk identification and mitigation system
………………………………………………………………………………………………………………………………………............
Key roles and duties in the risk management process
CEO → owner of the risk management
process for the Company as a
whole;
→ responsible for implementing
the risk management strategy
and functioning of the effective
risk management system.
Board of Directors
Risk Committee of the Executive Management Team
Audit Committee Assists the Board of Directors in the discharge of its risk man-
agement responsibilities
→ formulating a description of the risks specific to the Company;
→ overseeing adequacy and effectiveness of the Kernel’s risk
management system;
→ reviewing the Company’s policies on risk assessment and
risk management.
→ supervise the risk manage-
ment process
→ determine and approve the
level of risk acceptability and
Company’s risk appetite
→ decide on critical and signif-
icant risks
→ review the risk related re-
ports
→ ensure the introduction and implementation of the risk
management policy and procedures;
→ develop and continuously improve an effective risk
management and monitoring system, spreading the
culture of decision-making in terms of risks, their valu-
ation and likelihood of occurrence;
→ coordinate roles and participants;
→ identify, assess, manage and control key risks;
→ coordinate updating and improvement of the internal
control system.
Internal Audit
→ assess the adequacy and effectiveness of risk
management processes and internal controls in
operations;
→ assist Directors on operational risk identification,
assessment and prioritization in operations;
→ implementation, status monitoring, internal con-
trols and mitigation activities of action plan of op-
erational risks;
→ assist, advice and consult management in im-
proving the effectiveness of risk management
and internal control systems in operations.
Directors and executives risk owners within their functional duties
→ Identification of risks;
→ Assessment of risks;
→ Making and implementing deci-
sions on risks mitigating actions.
Risk identification
Risk assessment and prioritization
Risk
mitigation plan
development
and execution
Monitoring of
plan execution
Risk manage-
ment process
enhancement
1
2
3
4
5 Risk management
cycle

Kernel Holding S.A. Annual Report and Accounts 30 June 2019 31 www.kernel.ua
Risk management continued
Strategic
Report Sustainability
Corporate
Governance
Financial
Statements
Top-10 risks This section includes a summary of the main
risks that Kernel may face during the normal
course of its business. However:
• this section does not purport to contain an
exhaustive list of the risks faced by Kernel
and Kernel may be significantly affected
by risks that it has not identified or consid-
ered not to be material;
• some risks faced by Kernel, whether they
are mentioned in this section or not, may
arise from external factors beyond Ker-
nel’s control;
• where mitigations are mentioned in this
section, there is no guarantee that such
mitigations will be effective (in whole or in
part) to remove or reduce the effect of the
risk;
• investors may face other risks when deal-
ing with Kernel securities (shares and
bonds).
As a result of the latest review cycle, the
Board approved Top-10 risks faced by the
Group for FY2020 as depicted on chart below.
Key changes for FY2020 Top-10 risks
against FY2019 Top-10 risks are:
→ Increased probability of risks related to
Trade position management due to 1)
expected increases in grain export vol-
umes in FY2020 following the commis-
sioning of TransGrainTerminal, and 2)
Avere operations;
→ Higher estimated probability of fraudu-
lent activities risk due to increased vol-
umes of grain stored on 3rd-party silos as
a result of expected growth in grain export
volumes from Ukraine in FY2020;
→ New top-10 risk: failure to properly inte-
gration and manage new business (grain
railcars).
………………………………………………………………………………………………………………………………………..........................................................................................................................
Kernel FY2020 Top-10 risks Top-10 risks matrix
1
2
3
4
5
6789
10
Ris
k i
mp
act
Risk Probability
Very low Low High Very high
Severe
Majo
rM
odera
teM
inor
Mediu
m
Medium
Strategic (Business)risks
Operational risks
New risks Change y-o-y
Other risks identified by the Company’s management include (but are not limited to):
→ Increase in competition;
→ Compliance with environmental standards;
→ A prolonged period of weak economic growth, either globally or in the Company’s key markets;
→ Economic policy, political, social, and legal risks and uncertainties in certain countries in which Kernel Holding S.A. operates;
→ Any loss or diminution in the services of Mr. Andrii Verevskyi, Kernel Holding S.A.’s chairman of the Board of Directors;
→ The risk that changes in the assumptions underlying the carrying value of certain assets, including those occurring as a result of adverse
market conditions, could result in the impairment of tangible and intangible assets, including goodwill;
→ The risk of fluctuations in the exchange rate of the Ukrainian hryvnia to the US dollar;
→ The risk of disruption or limitation of natural gas or electricity supply;
→ The risk of disruptions in Kernel Holding S.A.’s manufacturing operations;
→ The risk of product liability claims;
→ The risk of potential liabilities from investigations, litigation, and fines regarding antitrust matters;
→ The risk that Kernel Holding S.A.’s governance and compliance processes may fail to prevent regulatory penalties or reputational harm, both
at operating subsidiaries and in joint ventures; and
→ The risk that Kernel Holding S.A.’s insurance policies may provide inadequate coverage.
Strategic (Business) risks:
1. Weak harvest in Ukraine
2. Low global soft commodities prices
Operational risks:
3. Trade position management issues
4. Fraudulent activities
5. Investment projects issues
6. Crop loss due to late harvesting
7. New business management issues (railcars)
8. Failure to maintain the integrity of the leasehold
farmland bank
9. General IT and information security risks
10. Human capital risks

Kernel Holding S.A. Annual Report and Accounts 30 June 2019 32 www.kernel.ua
Risk management continued
Strategic
Report Sustainability
Corporate
Governance
Financial
Statements
Kernel FY2020 Top-10 risks and mitigating factors
Risk Possible impact Mitigating factors
1. Weak har-
vest in Ukraine:
low crop yields
for Kernel farm-
ing business
• Subdued Farming segment EBITDA as a
result of reduced total tonnage harvested due
to unfavorable weather conditions while un-
changed cost base.
→ Diversified land bank (in northern, central and western regions of
Ukraine) reduces to some extent the overall Farming segment expo-
sure to weather risks;
→ Insurance of winter crop related costs, and insurance against limited
rainfalls and soil moisture content on some of our fields.
1. Weak har-
vest in Ukraine:
sunflower seeds
• Lower capacity utilization of Company’s
oilseed processing plants due to physical
deficit of the seeds on the market;
• Lower crushing margins due to higher
competition among crushers for the limited
supply of oilseeds.
→ Diversified origination base:
• Our oilseed processing plants are spread from the north-east to
the south of Ukraine, with origination areas covering the whole
sunflower seed growing belt in Ukraine, thus reducing our ex-
posure to weather volatility in any particular region. We are also
entering Western Ukraine by constructing greenfield oilseed pro-
cessing plant there;
• Our grain procurement network cover most of the regions of
Ukraine;
→ Comprehensive data-driven procurement strategy based on re-
gional supply-demand balances composed from the official statistics,
market consensuses, inputs from our farming and procurement
teams, examination of crop conditions by monitoring of the satellite
images, analysis of competitors and logistics bottlenecks;
→ Pre-crop financing of 3rd-party farmers conditional upon obligatory
sale of future harvest (sunflower seeds and grain) to Kernel, thus
covering part of our needs;
→ Volumes provided by our own farming production (~10% of sun-
flower seeds we process and almost half of grain we export);
→ “Open Agribusiness” platform serves to share our farming know-
how with 3rd-party farmers (thus increasing their productivity) and to
provide various services to crop producers (thus increasing their loy-
alty to Kernel as grain and oilseeds originator);
→ Improved control over logistics (own railcars) provides additional
flexibility in accessing crop producers across the whole country;
→ Insurance against low crop yields in key our procurement regions.
1. Weak har-
vest in Ukraine:
grain
• Lower profitability of grain export value
chain (underutilized infrastructure capacities
or depressed margins) given that major por-
tion of our grain export volumes will be origi-
nated from 3rd-party farmers.
2. Low global
soft commodi-
ties prices:
grain
• Undermined profitability of our Farming
segment (which is always in naturally long
position as a typical upstream type of busi-
ness) in case of low global grain pricing envi-
ronment.
→ Hedging grain prices: we use various hedging tools, including CME
corn and soybean futures and options, forward contracts for Black
Sea origin premium and direct forward contacts. Physical delivery for-
ward contracts are typically used for shorter duration hedging, nor-
mally within six months.
→ Long period of crop sales: we start selling next year’s crop as soon
as we have the initial understanding of the next year’s production
costs, considering also the entire value chain margin.
→ Detailed analysis of global soft commodity fundamentals: our
subsidiary Avere provides the insight on the global soft commodity
market, assisting us with the selection of timing and pricing of our
hedging operations.
2. Low global
soft commodi-
ties prices: sun-
flower oil
• Compressed margins in Oilseed Pro-
cessing segment: low prices for sunflower
oil reduce combined earnings shared by
farmers and crushers in Ukraine in the short-
term, and discourage farmers from expan-
sion of acreage under sunflower in the long-
term.
→ “Balanced book” policy to mitigate short-term price weaknesses.
As we buy sunflower seed on a spot basis, within a similar time-frame
we enter into forward contracts to sell sunflower oil, thus fixing the
selling price and volumes in advance and locking our margin. While
this policy allows us to mitigate some portion of the risk, a certain
seasonality mismatch between sunflower seed procurement and de-
mand for edible oils could cause our exposure to price volatility to rise
during some periods;
→ More intense procurements at the beginning of the season,
(when a huge supply of seeds post-harvest allows for negotiating
more attractive sunflower seed prices) to partially mitigate long-term
sunflower oil price weakness.

Kernel Holding S.A. Annual Report and Accounts 30 June 2019 33 www.kernel.ua
Risk management continued
Strategic
Report Sustainability
Corporate
Governance
Financial
Statements
Kernel FY2020 Top-10 risks and mitigating factors
Risk Possible impact Mitigating factors
3. Trade posi-
tion manage-
ment issues
• Losses arising from our trade position
mismanagement. For example, an open po-
sition in sunflower oil may have adverse ef-
fect on the Company’s earnings in case of
significant movements in sunflower oil price.
→ Trade position control system. We set limits on the position (long /
short) and control it on daily basis, limit Value at Risk and drawdown
to control the position of traders. We have daily reporting on traders’
positions/results. Contract execution and scheduling of shipments is
centralized;
→ “Balanced book” policy (as described above).
4. Fraudulent
activities • Losses from external frauds (e.g. theft of
company’s grain stored on 3rd-party silos);
• Losses from internal frauds (e.g. theft of
company’s inventories by employees, con-
flicts of interests etc.).
→ Diligent analysis of suppliers and counterparties;
→ Extension of misappropriation assets insurance (scope, assets,
coverage, risks);
→ Zero fraud tolerance approach is widely communicated to employ-
ees and counterparties, as an anti-corruption clause is a must in our
contracts with counterparties;
→ Continuous improvement of business processes:
• centralization of a warehouse system in the Farming division;
• improvement of a procurement model with additional controls;
• development of analytical procedures aimed to fraud risk identifi-
cation;
• automation of processes (including electronic documents flow);
→ improvement of access and authorization system in accounting.
5. Investment
project issues • Extra spending beyond budgets. Our key in-
vestments include US$ 180 million invest-
ments into construction of greenfield oilseed
processing plant in Western Ukraine, US$
150 million “green” energy projects invest-
ments, and US$ 127 million investments into
new grain export terminal;
• Lost profits due to execution delays.
→ Strong in-house expertise in greenfield projects execution (includ-
ing Bandurka greenfield processing plant, Balyn, Vesnianka and
Lazirky silos etc.) with dedicated team of experienced professionals
to manage new projects;
→ Rigorous project management. All projects are carefully analyzed
and properly documented. Each project is organized by a charter of
the investment project, which defines goals, budget, delivery mile-
stones, schedules, deadlines, project team, definition/evaluation/re-
sponse to the project risks, assessment of business case and feasi-
bility study. In case of necessity, we organize quality control of project
documentation for investment construction projects by an independ-
ent expert company. Technical specifications for new construction
projects are evaluated, amended and approved by all related busi-
ness segments;
→ Proper oversight: we have the deep involvement of the Investment
Committee and supervision from the Strategic Committee.
6. Crop loss
due to late har-
vesting
• Partial losses of crop due to delayed har-
vesting as a result of unfavorable weather
conditions during harvesting campaigns and
lack of capacity for crop transportation and
storage;
→ More intensive use of 3rd-party trucks;
→ Debottlenecking of our silos: we constantly work on increasing the
in-take, drying, cleaning and off-load capacities of our silos. We have
recently commissioned construction of two greenfield silos, and sig-
nificantly modernized another two silos. We also have had positive
experiences of storing grain and oilseeds in ground plastic ‘sleeve’
bags, which allows us to reduce pressure on our infrastructure during
harvest peak;
→ 3rd-party services. We have an optionality to conclude agreements
with other silos and export terminal facilities to facilitate grain and
oilseeds flow.
7. New busi-ness manage-ment issues
• Extra spending or lost profits due to failure
to properly integrate new grain railcar busi-
ness, effectively organize railcars repair and
maintenance works.
→ New processes, procedures, controls already in place;
→ Experienced team managing the integration process.
8. Failure to maintain the in-tegrity of the leasehold farm-land bank.
• Reduction of Farming segment EBITDA
due to lower acreage under operations. The
Company leases the land it farms from nu-
merous individual owners across Ukraine for
an average term of 9 years, but it may fail to
prolong certain land lease agreements due to
growing competition for the land plots with
→ Paying market price for land lease;
→ Maintaining the excellent reputation of the Company in the regions
of operations. We try to positively differentiate ourselves from com-
petitors through reliability, active support of the communities, and
promoting the sustainability of our farming practices. We employ ded-
icated teams of relationship managers to the villages where we op-
erate, who allow us to keep direct contact with our land lessors and

Kernel Holding S.A. Annual Report and Accounts 30 June 2019 34 www.kernel.ua
Risk management continued
Strategic
Report Sustainability
Corporate
Governance
Financial
Statements
Kernel FY2020 Top-10 risks and mitigating factors
Risk Possible impact Mitigating factors
other land operators, or due to willingness of
landowners to cultivate the land themselves.
respond to community needs;
→ Emphyteusis agreements. For about 15 thousand hectares of land
we operate, we signed long-term land lease (‘emphyteusis’) agree-
ments, whereby all rent payments are paid to the lessor in one install-
ment at the signing of the agreement. It allows us to secure our op-
erations for a much longer period compared to typical farmland lease
contracts;
→ Rights of first refusal to extend leasehold contract (or to buy the
land once this option is available) embedded in all our land lease
agreements;
→ Public support of farmland market reform in Ukraine and acting as
an active market participant once the reform is completed.
9. General IT and infor-mation security risks
• The loss or disclosure of key information
may threaten business operations and devel-
opment of business;
• Interruption of business processes and
decisions which are dependent on the con-
tinuity of IT applications and infrastructure.
→ Implemented IT business continuity and data recovery policy;
→ Multifactor authentication (MFA) and Rights Management Sys-
tem (RMS) is being implemented to reduce the risk of documents,
correspondence and other confidential data leakage;
→ Regular testing of the IT recovery plan; regular vulnerability testing
from inside and outside;
→ Backup data center, constant modernization of data backup system;
→ Patch management policy – regular installations of critical and se-
curity patches on servers and workstations;
→ Special solution to combat the APT and 0-day virus attacks is be-
ing implemented.
10. Human cap-ital risk
• Interruptions in business and support
processes due to general staff shortage and
inability to replace key employees given low
qualification of new candidates.
→ Competitive compensation: the level we pay matches or exceeds
the benchmark in our industries. We aim to increase further compen-
sation levels to successfully compete with neighboring countries
along the way;
→ Talent management, professional development and education of
our employees. We have numerous education programs with exten-
sive coverage (page 51) and system of individual development and
career planning (page 49);
→ Safe and convenient working conditions. Improving working con-
ditions and infrastructure for staff.
→ Employee involvement through effective KPI system, responsibility
delegation, rewards for operation efficiency improvement, and team-
building events
→ Effective recruitment: we use various tools and channels to recruit
the best people on the market. We actively work with universities and
the business community and have a separate Kernel Chance pro-
gram to develop and solicit new associates.

Kernel Holding S.A. Annual Report and Accounts 30 June 2019 35 www.kernel.ua
Alternative Performance Measures
Strategic
Report Sustainability
Corporate
Governance
Financial
Statements
To comply with ESMA Directive on Alternative
Performance Measures (“APMs”), Kernel
Holding S.A. (hereinafter “the Group”) pre-
sents this additional disclosure, which en-
hances the comparability, reliability and com-
prehension of its financial information.
The Group presents its results in accordance
with generally accepted accounting principles
(IFRS), but nonetheless, management con-
siders that certain supplemental non-IFRS
measures, such as
• EBITDA;
• EBITDA margin;
• Segment EBITDA;
• Segment EBITDA margin;
• Investing Cash Flows net of Fixed As-sets Investments;
• Net Fixed Assets Investments;
• Operating Cash Flows before Working Capital Changes;
• Free Cash Flows to the Firm;
• Debt Liabilities;
• Net Debt;
• Readily Marketable Inventories;
• Adjusted Net Debt; and
• Adjusted Working Capital; (together, the ‘Alternative Performance Measures’) provide investors with a supple-mental tool to assist in evaluating current busi-ness performance.
The Group believes the Alternative Perfor-
mance Measures are frequently used by se-
curities analysts, investors and other inter-
ested parties in evaluating companies in the
Group’s industry. The Alternative Perfor-
mance Measures have limitations as analyti-
cal tools, and investors should not consider
any of them in isolation or any combination of
them together as a substitute for analysis of
the Company’s operating results as reported
under IFRS. Other companies in the industry
may calculate these Alternative Perfor-
mance Measures differently or may use them
for different purposes than Kernel Holding
S.A, limiting their usefulness as comparative
measures. Each of the Alternative Perfor-
mance Measures is defined below.
Before FY2019, the Group used to report such
APMs as Funds from Operations and Free
Cash Flows, but since FY2019 the Group
consider these metrics as not relevant any-
more, being distortive going forward. The first
APM included purchases of property, plant
and equipment distorting the operating cash
generation capacity of the Group given the
current heavy CapEx cycle for the Group. The
second APM included dividends paid, thus
distorting the cash flow available to repay debt
1 In other documents (e.g. listing particulars) the Group could use the term Adjusted EBITDA, which is calculated as profit before income tax adding back net finance costs, net foreign exchange gain, net other expenses, share of income/(loss) of joint ventures, and amortization and depreciation, and coming to the same result as EBITDA
and distribute dividends to shareholders. In-
stead, two additional APM’s were introduced
(as defined below): Operating Cash Flows
before Working Capital Changes and Free
Cash Flows to the Firm.
EBITDA and EBITDA margin The Group uses EBITDA1 as a key measure
of operating performance, and which is de-
fined as profit from operating activities adding
back amortization and depreciation.
The Group defines EBITDA margin as EBITDA divided by revenue during the report-ing period.
Kernel Holding S.A. views EBITDA and
EBITDA margin as key measures of the
Group’s performance. The Group uses
EBITDA and EBITDA margin in its public re-
porting, including with respect to the listing of
its equity on the Warsaw Stock Exchange.
The Group believes that these measures bet-
ter reflect the Group and its subsidiaries’ core
operating activities and provide both manage-
ment and investors with information regarding
operating performance, which is more useful
for evaluating the financial position of the
Group and its subsidiaries than traditional
measures, to the exclusion of external factors
unrelated to their performance.
EBITDA and EBITDA margin have limitations
as analytical tools, and investors should not
consider these measures in isolation or in any
combination with Non-IFRS Measures as a
substitute for analysis if the Group’s operating
results as reported under IFRS. Some of
these limitations are as follows:
• EBITDA and EBITDA margin do not reflect the impact of finance costs, which signifi-cance reflect macroeconomic conditions and have little effect on the Group’s operat-ing performance;
• EBITDA and EBITDA margin do not reflect the impact of taxes on the Group’s operat-ing performance;
• EBITDA and EBITDA margin do not reflect
the impact of depreciation and amortization on the Group’s performance. The assets of the Group, which are being depreciated and/or amortized, will need to be replaced in the future and such depreciation and amortization expense may approximate the cost of replacing these assets in the future. By excluding this expense from EBITDA and EBITDA margin, such measures do not reflect the Group’s future cash require-ments for these replacements;
• EBITDA and EBITDA margin do not reflect the impact of share of income / loss of joint ventures, which are accounted under equity method;
• EBITDA and EBITDA margin do not reflect the impact of foreign exchange gain/(loss), which the Group does not consider to be part of its core operating performance be-cause the main difference arise on transac-tions between entities of the Group with dif-ferent functional currencies;
• EBITDA and EBITDA margin do not reflect the impact of other expenses; as such ex-penses are not a part of Group’s core oper-ations.
…………………………………………………………………………………………………………………………………………………... Reconciliation of profit before income tax to EBITDA and EBITDA margin:
in thousand US$ except the margin FY2018 FY2019
Profit from operating activities 139,565 269,207
add back: Amortization and depreciation 82,975 76,303
EBITDA 222,540 345,510
Revenue 2,403,003 3,992,133
EBITDA margin 9.3% 8.7%

Kernel Holding S.A. Annual Report and Accounts 30 June 2019 36 www.kernel.ua
Alternative Performance Measures continued
Strategic
Report Sustainability
Corporate
Governance
Financial
Statements
Segment EBITDA and Segment EBITDA margin The Group uses Segment EBITDA and Seg-
ment EBITDA margin as a key measures of
segment operating performance. The Group
defines Segment EBITDA as profit/(loss)
from operating activities adding back amorti-
zation and depreciation.
The Group defines Segment EBITDA margin
as Segment EBITDA divided by segment rev-
enue during the reporting period.
Investing Cash Flows net of Fixed Assets Investmnets
The Group uses Investing Cash Flows less
Net Fixed Assets Investments as a measure
of its expenditures on investments other than
property plant and equipment and which is de-
fined as net cash used in investing activities
adding back:
• purchase of property, plant and equipment;
• proceeds from disposal of property, plant and equipment.
Net Fixed Assets Investments The Group uses Net Fixed Assets Invest-
ments as a measure of its expenditures on
fixed assets maintenance and which is de-
fined as net cash used in investing activities
less Investing Cash Flows net of Fixed As-
sets Investments or alternatively may be cal-
culated as cash used for purchase of prop-
erty, plant and equipment less proceeds from
disposal of property, plant and equipment.
Operating Cash Flows before Working Capital Changes
The Group uses Operating Cash Flows as a
measure of the cash generation of its core
business operations and which is defined as
net cash generated by operating activities less
changes in working capital, including:
• change in trade and other accounts receiv-able;
• change in prepayments and other current assets;
• change in restricted cash balance;
• change in taxes recoverable and prepaid;
• change in biological assets;
• change in inventories;
• change in trade accounts payable; and
• change in advances from customers and other current liabilities.
…………………………………………………………………………………………………………………………………………………... Reconciliation of net cash used in investing activities to Net Fixed Assets Investments:
in thousand US$ FY2018 FY2019
Net cash used in investing activities (155,694) (241,404)
less: Investing Cash Flows less Net Fixed Assets Investments (16,182) (84,170)
Net Fixed Assets Investments (139,512) (157,234)
…………………………………………………………………………………………………………………………………………………... Reconciliation of net cash used in investing activities to Investing Cash Flows net of Fixed
Assets Investments:
in thousand US$ FY2018 FY2019
Net cash used in investing activities (155,694) (241,404)
Adding back: Purchase of property, plant and equipment (146,565) (166,988)
Proceeds from disposal of property, plant and equipment 7,053 9,754
Investing Cash Flows net of Fixed Assets Investments (16,182) (84,170)
…………………………………………………………………………………………………………………………………………………... Reconciliation of net cash generated by operating activities to Operating Cash Flows before
Working Capital Changes:
in thousand US$ FY2018 FY2019
Net cash generated by operating activities 82,477 198,650
Less: Changes in working capital, including: (31,235) (93,897)
Change in trade and other accounts receivable (7,902) (131,516)
Change in prepayments and other current assets (52,382) (13,706)
Change in restricted cash balance 3,251 538
Change in taxes recoverable and prepaid 3,273 441
Change in biological assets 1,675 18,779
Change in inventories 9,866 (24,160)
Change in trade accounts payable 19,049 60,055
Change in advances from customers and other current liabili-ties
(8,065) (4,328)
Operating Cash Flows before Working Capital Changes 113,712 292,547
…………………………………………………………………………………………………………………………………………………... Calculation of Segment EBITDA and Segment EBITDA margin:
in thousand US$ FY2018 FY2019
Oilseed Processing
Profit from operating activities 60,214 92,598
plus Amortization and depreciation 16,464 16,419
Segment EBITDA 76,678 109,017
Segment revenue 1,393,491 1,493,272
Segment EBITDA margin 6% 7%
Trading and Infrastructure Profit from operating activities 91,968 92,601
plus Amortization and depreciation 8,870 13,134
Segment EBITDA 100,838 105,735
Segment revenue 1,024,579 3,139,916
Segment EBITDA margin 10% 3%
Farming
Profit from operating activities 32,557 136,813
plus Amortization and depreciation 56,174 45,069
Segment EBITDA 88,731 181,882
Segment revenue 470,489 601,585
Segment EBITDA margin 19% 30%
Other
Loss from operating activities (45,174) (52,805)
plus Amortization and depreciation 1,467 1,681
Segment EBITDA (43,707) (51,124)

Kernel Holding S.A. Annual Report and Accounts 30 June 2019 37 www.kernel.ua
Alternative Performance Measures continued
Strategic
Report Sustainability
Corporate
Governance
Financial
Statements
Free Cash Flows to the Firm
The Group uses Free Cash Flows to the
Firm as a measure of the cash generation of
its core business operations and which is de-
fined as sum of net cash generated by operat-
ing activities and net cash used in investing
activities.
Readily Marketable Inventories The Group uses Readily Marketable Inven-
tories (hereinafter ‘RMI’), as an additional
measure of its liquidity, which the Group uses
to provide a supplemental tool to assist man-
agement and investors in evaluating current
business performance and in calculating
credit ratios under certain of the Group’s fi-
nancing arrangements. The Group defines
RMI as agricultural inventories, such as corn,
wheat, barley, soybean, sunflower seed, meal
and oil, which the Group treats as readily con-
vertible into cash because of their commodity
characteristics and widely available markets
and international pricing mechanisms, carried
at cost.
Factors which the Group considers when clas-
sifying inventory as RMI include whether there
is an ascertainable price for the inventory es-
tablished via international pricing mechanism;
whether there are widely available and liquid
markets for the inventory; if the pricing and
margins on the inventory are hedged through
forward sales and can be identified and appro-
priately valued; if there is stable and/or pre-
dictable end-user demand for the inventory;
and whether the inventory is not perishable in
short-term.
Debt Liabilities The Group uses three metrics as the measure
of its leverage and indebtedness, which con-
sists of Debt Liabilities, Net Debt and Ad-
justed Net Debt. The Group defines Debt Li-
abilities as the sum of:
• bonds issued;
• interest on bonds issued;
• long-term borrowings;
• current portion of long-term borrowings;
• short-term borrowings; and
• obligations under finance lease (including current portion).
The Group defines Net Debt as Debt Liabili-ties less cash and cash equivalents. Finally, the Group defines Adjusted Net Debt, as Net Debt less readily marketable inventories.
Adjusted Working Capital The Group uses Adjusted Working Capital
as a measure of its efficiency and short-term
liquidity and which is defined as current assets
(excluding cash and cash equivalents, and as-
sets classified as held for sale) less current li-
abilities (excluding short-term borrowings,
current portion of long-term borrowings, cur-
rent portion of obligations under finance lease
and interest on bonds issued).
…………………………………………………………………………………………………………………………………………………...
The following table shows the Group’s key inventories considered eligible for RMI by type and
the amounts of such inventory that the Group treats as RMI as at the periods indicated:
in thousand US$ As of 30
June 2018 As of 30
June 2019
Sunflower oil & meal 217,878 124,797
Sunflower seed 57,599 103,661
Grains 49,031 63,239
Other 43,945 65,914
Total 368,453 357,610
of which: Readily Marketable Inventories 325,164 293,437
…………………………………………………………………………………………………………………………………………………... Calculation of Debt Liabilities, Net and Adjusted Net Debts as at the dates indicated:
in thousand US$ As of 30
June 2018 As of 30
June 2019
Bonds issued 494,796 496,051
Interest on bonds issued 17,949 17,949
Long-term borrowings 2,812 63,680
Current portion of long-term borrowings 2,811 1,233
Short-term borrowings 224,773 183,692
Obligations under finance lease 7,710 5,230
Current portion of obligations under finance lease 3,236 2,484
Debt Liabilities 754,087 770,319
less: cash and cash equivalents 132,018 76,801
Net Debt 622,069 693,518
less: readily marketable inventories 325,164 293,437
Adjusted Net Debt 296,905 400,081
…………………………………………………………………………………………………………………………………………………... Reconciliation of total current assets to Adjusted Working Capital as at the dates indicated:
in thousand US$ As of 30
June 2018 As of 30
June 2019
Total current assets 1,204,269 1,256,432
less: Cash and cash equivalents 132,018 76,801
Assets classified as held for sale 14,689 2,079
Total current liabilities 475,516 479,760
add back: Short-term borrowings 224,773 183,692
Current portion of long-term borrowings 2,811 1,233
Current portion of obligations under finance lease 3,236 2,484
Interest on bonds issued 17,949 17,949
Adjusted Working Capital 830,815 903,150
…………………………………………………………………………………………………………………………………………………... Calculation of Free Cash Flows to the Firm:
in thousand US$ FY2018 FY2019
Net cash generated by operating activities 82,477 198,650
Net cash used in investing activities (155,694) (241,404)
Free Cash Flows to the Firm (73,217) (42,754)

Kernel Holding S.A. Annual Report and Accounts 30 June 2019 38 www.kernel.ua
Alternative Performance Measures continued
Strategic
Report Sustainability
Corporate
Governance
Financial
Statements
The Management believe that these APMs assist in providing additional useful information on the underlying trends, performance and position of
the Group. APMs are used by the Management for performance analysis, planning, reporting and incentive setting purposes. The measures are
also used in discussions with the investors, investment analyst community and credit rating agencies.
APM Calculation Why APM is the most important for management
EBITDA Profit from operating activities adding back amortiza-
tion and depreciation.
EBITDA is the main metric used by management of the Group to
measure operating performance. It is also widely used by inves-
tors when evaluating businesses, and by rating agencies and
creditors to evaluate the leverage.
EBITDA margin EBITDA divided by revenue during the reporting pe-
riod.
EBITDA margin is a metric widely used to measure profitability
of Group's operations.
Segment EBITDA Segment profit from operating activities adding back
amortization and depreciation.
EBITDA is the main metric used by management of the Group to
measure segment operating performance.
Segment EBITDA margin
Segment EBITDA divided by segment revenue during
the reporting period.
Segment EBITDA margin is a metric widely used to measure
profitability of Group's segment operations.
Investing Cash Flows net of Fixed Assets In-vestments
Net cash used in investing activities adding back pur-
chase of property, plant and equipment, and proceeds
from disposal of property, plant and equipment.
As the Group grew and developed through acquisitions, this APM
helps to monitor the M&A and other investing activities of the
Group.
Net Fixed Assets Investments
Net cash used in investing activities less Investing
Cash Flows net of Fixed Assets Investments.
The Group is executing a solid investment program as a part of
Strategy 2021, and fixed assets investment is an important
measure to monitor capital expenditure as a part of the execution
of investment program.
Operating Cash Flows before Working Capital Changes
Net cash generated by operating activities less
changes in working capital activities, including:
• change in trade and other accounts receivable;
• change in prepayments and other current assets;
• change in restricted cash balance;
• change in taxes recoverable and prepaid;
• change in biological assets;
• change in inventories;
• change in trade accounts payable; and
• change in advances from customers and other cur-rent liabilities.
The Group uses this APM as a pre-working capital measure that
reflects Group’s ability to generate cash for investment, debt ser-
vicing and distributions to shareholders.
Free Cash Flows to the Firm
Sum of net cash generated by operating activities and
net cash used in investing activities.
The Group uses this APM as it reflects the cash generating ca-
pability of the Group to repay debt and distribute dividends to
shareholders.
Readily Marketable Inventories
Agricultural inventories, such as corn, wheat, barley,
soybean, sunflower seed, meal and oil.
The Group uses this APM as an additional measure of its liquid-
ity, which the Group uses to provide a supplemental tool to assist
management and investors in evaluating current business per-
formance and in calculating credit ratios under certain of the
Group’s financing arrangements.
Debt Liabilities Sum of bonds issued, interest on bonds issued, long-term borrowings, current portion of long-term borrow-ings, short-term borrowings; and obligations under fi-nance lease (including current portion).
The Group uses this APM, as it is a useful measure of the lever-
age of the Group, which is widely used by credit investors and
rating agencies.
Net Debt Debt Liabilities less cash and cash equivalents. The Group uses this APM, as it is a useful measure of the lever-
age of the Group, which is widely used by credit and equity in-
vestors and rating agencies.
Adjusted Net Debt
Net Debt less readily marketable inventories. The Group uses this APM as a supplemental measure of the
Group’s liquidity, which shows the amount of Debt Liabilities not
covered by cash and readily marketable inventories (highly liquid
inventories).
Adjusted Working Capital
Current assets (excluding cash and cash equivalents,
and assets classified as held for sale) less current lia-
bilities (excluding short-term borrowings, current por-
tion of long-term borrowings, current portion of obliga-
tions under finance lease and Interest on bonds is-
sued).
The indicator of working capital is important for the Group, as the
Group is involved in trading and processing activities and hold
large volumes of inventories on the balance. The Group also in-
vests in business expansion, which needs working capital invest-
ments to increase efficiency. It is useful for users and investors
because measure of both a company’s efficiency and its short-
term financial health. It also helps management to keep a busi-
ness operating smoothly and meet all its financial obligation
within the coming year.

Kernel Holding S.A. Annual Report and Accounts 30 June 2019 39 www.kernel.ua
Sustainability
Strategic
Report Sustainability
Corporate
Governance
Financial
Statements
Our approach One of the major challenges the world faces is to
feed a constantly growing population (+2 billion of
people to feed by 2050) while envisaging arable
land per capita reduction by 25% from 2020 to
2050, as per FAOSTAT expectations. We at Kernel
aim to contribute to the solution of this challenge in
a sustainable way.
Our approach to sustainable development is under-
pinned by principles stated in the Group’s Code of
Conduct and embedded throughout every level of
our company. We aim to efficiently produce best
quality products with the lowest possible consump-
tion of resources and in strict compliance with reg-
ulatory, safety and product quality standards, thus
minimizing our environmental footprint. As the larg-
est crop producer in Ukraine, we not only follow the
best sustainable long-term agronomy practices our-
selves, but also seek to move the whole industry
into a sustainable direction by sharing our valuable
experience with other farmers. Finally, we strive to
remain the best employer for our people and a reli-
able contributor to local communities in the regions
of our operations.
FY2019 performance In the reporting period, we achieved the lowest ever
consumption of energy per ton of sunflower seed
crushed in our Oilseed Processing segment and
the record low energy spent per ton of grain/oilseed
grown in our Farming segment. We reduced direct
greenhouse gas emissions (Scope 1) and commis-
sioned the first combined heat and power plant from
our US$ 150 million renewable energy investment
program. Additionally, we successfully completed
sustainability inspection conducted by EIB and
EBRD to attract over US$ 300 million long-term fi-
nancing, substantially reduced high-consequence
work-related injuries on group enterprises and con-
tinued to invest into the well-being of local commu-
nities where we operate and the development of our
employees. For the recognition of our efforts, Ker-
nel was included to top-20 socially responsible
companies in Ukraine by reputable local media
“Vlast Deneg”.
Agenda for FY2020 In the next year, we plan to join the UN Global Com-
pact (the world’s largest corporate sustainability ini-
tiative), thereby declaring the company’s commit-
ment to implement 10 universal principles on human
rights, labor, environment and anti-corruption. To-
gether with that, we plan to integrate UN Sustaina-
ble Development Goals into our decision-making
and reporting processes.
Like in FY2019, we will further strengthen our pur-
suit of sustainable development by implementing
energy efficiency projects, expanding the coverage
of our training and professional development pro-
grams, and by promoting the development of the ru-
ral regions where we operate with our contributions
to the development of local communities.
Aside from this, we plan to widen the sustainability
agenda discussed by the Board of Directors, includ-
ing the development and adoption of a Kernel Sus-
tainability Strategy, aiming to define selected goals,
targets and actions for our sustainability approach.
For the next year, we also aim to obtain independ-
ent external assurance of our FY2020 Sustainability
report. Last time we undertook a similar exercise
was in FY2015.
Social spending in FY2019
US$ 2.3 million -6% y-o-y
Energy consumption
6,857 terajoules -2% y-o-y
We are committed to decoupling of the growth in production of food for the growing world population from ever-greater use of resources and environmental degradation.

Kernel Holding S.A. Annual Report and Accounts 30 June 2019 40 www.kernel.ua
Sustainability highlights
Strategic
Report Sustainability
Corporate
Governance
Financial
Statements
……………………………………………………………………………………………………………………………………….............................................................................................................................
Key non-financial KPIs FY2015 FY2016 FY2017 FY2018 FY2019
Total number of full-time employees 15,229 14,075 16,103 15,116 13,397 Oilseed processing 18% 17% 16% 17% 17% Grain and infrastructure 20% 23% 22% 23% 22% Farming 58% 55% 58% 56% 55% Headoffice and other 4% 4% 4% 5% 6%
Total injury accidents 19 16 14 16 17
incl. fatalities 1 1 - 4 1 Injury frequency rate accidents / million worked hours 0.66 0.53 0.45 0.55 0.60
Total training expenditures thousand US$ 241 194 445 474 456 Total social spending thousand US$ 1,919 1,668 2,616 2,440 2,303 Direct (Scope 1) GHG emissions thousand tons of CO2 equivalent 236 198 232 260 234 Gross indirect (Scope 2) GHG emissions thousand tons of CO2 equivalent 76 72 80 86 88 Total energy consumption thousand gigajoules 6,000 5,095 6,499 6,977 6,857
incl. renewable thousand gigajoules 2,854 2,566 3,096 3,230 3,215 Energy spent per ton of sunflower seeds processed megajoules 1,441 1,456 1,412 1,328 1,312 Energy spent per ton-% of grain dried megajoules 63 63 68 61 67 Energy spent per ton of grain grown megajoules 854 708 630 675 546
……………………………………………………………………
Rate of recordable work-related injuries accidents / million worked hours
0.66
0.53
0.45
0.550.60
FY2015 FY2016 FY2017 FY2018 FY2019
……………………………………………………………………
Total social spending US$ thousand
1,9191,668
2,6162,440
2,303
FY2015 FY2016 FY2017 FY2018 FY2019
……………………………………………………………………
Total energy consumption thousand gigajoules
6,000
5,095
6,4996,977 6,857
FY2015 FY2016 FY2017 FY2018 FY2019
……………………………………………………………………
Total number of employees Full-time equivalent, as of 30 June
15,229 14,075
16,103 15,116
13,397
2015 2016 2017 2018 2019
……………………………………………………………………
Total training expenditures US$ thousand
241194
445474 456
FY2015 FY2016 FY2017 FY2018 FY2019
……………………………………………………………………
Total direct (Scope 1) GHG emission thousand tons of CO2 equivalent
236
198
232260
234
FY2015 FY2016 FY2017 FY2018 FY2019

Kernel Holding S.A. Annual Report and Accounts 30 June 2019 41 www.kernel.ua
Sustainability continued
Strategic
Report Sustainability
Corporate
Governance
Financial
Statements
Our approach to materiality
and report content Stakeholder inclusiveness Based on management’s view, media moni-
toring and constant interactions with stake-
holders, the company has identified 11 stake-
holder groups (please see chart “Key stake-
holder groups and engagement channels”).
Management periodically reviews the list of
stakeholder groups.
We regularly engage with all identified stake-
holder groups through various means: directly
at meetings and events, and via media, includ-
ing the corporate website, social networks and
messengers and press. Public Facebook
group “We are Kernel!” allows us to engage
with over 7,000 people, and the corporate Tel-
egram channel communicate information to
almost 1,000 subscribers.
The Company engages with all the identified
stakeholder groups, but for the purposes of
this report management considers capital pro-
viders (shareholders and debt providers) and
employees to be key target audiences, while
engagement with other stakeholder groups is
primarily done through other communication
channels.
Report content In selecting the content of this section, we pur-
sued an overall goal of demonstrating Ker-
nel’s material economic, environmental, and
social impacts to key target audiences, using
the common language of GRI Standards.
As a result of stakeholder engagement pro-
cess, we identified the interests, expectations
and information needs of stakeholders we en-
gage with through this sustainability report.
1 EIB Environmental and Social Standards; EBRD Environmental and Social Policy
This report focuses on material issues deter-
mined based on feedback obtained from em-
ployees and capital providers and a manage-
rial assessment of the aspects’ importance for
the sustainable development of the company.
Environmental and social policies and stand-
ards of our lenders are another valuable
source of guidance on materiality and govern-
ance of the Group’s sustainability aspects.
Our recent capital investments into grain stor-
age, crushing, transshipment, and renewable
energy infrastructure, envisaged by Strategy
2021, are co-financed by the European Bank
for Reconstruction and Development and Eu-
ropean Investment Bank, thus all the planned
developments had to be structured to meet
the requirements of Environmental and Social
Policies of both institutions 1 . Binding
measures required to align the Strategy 2021
activities with the policies, as well as to im-
prove the Group’s overall environmental and
social management practices, have been
identified in the course of a robust due dili-
gence process, that provided us with external
insights on our both strengths and areas for
improvement in terms of sustainability.
Based on analysis of inputs collected from in-
ternal and external stakeholders, the shortlist
of sustainability topics was developed. The
materiality of shortlisted sustainability topics
has been assessed against two criteria: 1) in-
fluence on stakeholder assessments and de-
cisions; and 2) significance of economic, envi-
ronmental and social impacts. The topics with
the highest combination of scores for both cri-
teria were defined as material.
Derived from the materiality exercise, the fol-
lowing list of topics subject to disclosure in the
sustainability report was approved by execu-
tive management:
• Economic performance;
• Indirect economic impacts;
• Anti-corruption;
• Materials;
• Energy;
• Biodiversity;
• Emissions;
• Employment;
• Occupational health & safety;
• Training and education;
• Local communities;
• Customer health and safety.
Our core values and principles: ………………………………………………………………………………………………………………………………………………
→ Efficient use of resources
→ Openness to change and innovation
→ Integrity
→ Responsible leadership
→ Entrepreneurial spirit
→ Mutual respect and trust
………………………………………………………………………………………………………………………………………..........................................................................................................................
Key stakeholder groups and engagement channels
Kernel
reports Website Hotline
Social
networks
Direct
engagement
External
media
Corporate
newspaper Intranet Events
Internal
Employees ✓ ✓ ✓ ✓ ✓ ✓ ✓ ✓ ✓
Management ✓ ✓ ✓ ✓ ✓ ✓ ✓ ✓
Shareholders ✓ ✓ ✓ ✓
External
Debt providers and rating agencies ✓ ✓ ✓ ✓
Suppliers (incl 3rd party farmers) ✓ ✓ ✓
Customers ✓ ✓ ✓
National media ✓ ✓
Local media ✓ ✓ ✓
Local communities ✓ ✓ ✓ ✓ ✓ ✓
Local officials ✓ ✓ ✓ ✓ ✓
Regulatory authorities ✓ ✓
Other engagement channels include special publications, emails, interviews, and teleconferences.

Kernel Holding S.A. Annual Report and Accounts 30 June 2019 42 www.kernel.ua
Sustainability continued
Strategic
Report Sustainability
Corporate
Governance
Financial
Statements
GRI content index (see on page 54) summa-
rizes disclosure of the listed topics in this re-
port.
Notwithstanding the fact that the topic of soils
does not match exactly with the available
topic-specific Standards, we have chosen to
disclose it, as soil properties are crucial for
crop production, and can be largely influenced
by the Group’s farming operations. Since the
topic relates to provision services of ecosys-
tems, GRI 304: Biodiversity Standard has
been applied for reporting on it.
Similarly to soils, climate change adaptation is
pivotal to Kernel’s ability to create value in fu-
ture. Since no dedicated GRI standard is
available for this topic, we opted to disclose it
under GRI 305: Emissions for the reason of
interrelation between climate change and
GHG emissions.
Although not disclosed in this report, we
acknowledge the materiality of our impact on
water resources. While water consumption for
crop production is moderate (only 0.2% of our
landbank is irrigated), our oilseed processing
operations are associated with substantial wa-
ter volumes and more complex water use pat-
terns. We realized that comprehensive disclo-
sure of information on consumption of fresh
water, and wastewater management requires
more time and efforts than we had in our dis-
posal. Therefore, a decision was made to
postpone the disclosure for FY2020.
If not stated otherwise, boundaries for mate-
rial topics includes Kernel subsidiaries where
company has operating control. Our 50/50 Ta-
man JV in Russia is not included in the scope
of this Sustainability Report, as we cannot op-
erate it solely for our benefit and have limited
control over it. For more information, please
refer to the chart “Topic boundaries”.
Key developments
In FY2019, we approved a Corporate Social
Responsibility and Sustainable Development
Policy, which is publicly available on the Com-
pany’s website. The policy defines the Com-
pany’s goals as follows:
• Social: development of people’s potential,
giving back to local communities, and ethi-
cal and responsible labor practices;
• Environmental: keeping the integrity of the
ecosystems the Company operates in, and
minimization of the environmental footprint;
• Economic: reaching maximum profitability
with the optimal usage of natural resources.
The measures taken for the Corporate Social
Responsibility and Sustainable Development
policy implementation shall be disclosed each
year in the special section of the annual re-
port.
In FY2019 we slightly changed the presenta-
tion format of the disclosure in our Sustaina-
bility section, aligning disclosure more to the
GRI guidance.
…………………………………………………………………………………………………………………………………………………
Topic boundaries
Impact Material topics Material
within Kernel Material
outside Kernel Topic boundary
Economic
Economic performance ✓ ✓ All business units
Indirect economic impacts ✓ ✓ All business units
Anti-corruption ✓ ✓ All business units
Environ-mental
Materials ✓ Farming Oilseed Processing
Energy ✓ ✓ All business units
Biodiversity ✓ Farming
Emissions ✓ All business units
Social Employment ✓ ✓ All business units
Occupational health & safety ✓ ✓ All business units
Training and education ✓ ✓ All business units
Local communities ✓ Farming
Customer health and safety ✓ ✓ Oilseed Processing

Kernel Holding S.A. Annual Report and Accounts 30 June 2019 43 www.kernel.ua
Sustainability continued
Strategic
Report Sustainability
Corporate
Governance
Financial
Statements
Economic impact (GRI 200) Economic performance (GRI 201) The ultimate goal of our strategy is to maxim-
ize shareholders’ value, which we aim to
achieve through outstanding economic perfor-
mance. Key strategic pillars behind that are a
strong asset base, operational discipline and
a geographic focus. We are currently under-
going CapEx-heavy cycle, which is expected
to bring the Company’s economic perfor-
mance to a completely new level. Economic
performance is the most important KPI for the
management performance-based part of com-
pensation.
Total economic value retained in FY2019
amounted to US$ 158 million, calculated as
direct economic value generated (US$ 4,030
million) less total economic value distributed
(US$ 3,871 million). This result more than four
times exceeds the total economic value re-
tained in FY2018.
Being a diversified agro-industrial business in
Ukraine with leading positions across all busi-
ness segments, we have significant direct
economic impact on our stakeholders in areas
of all our operations. Direct economic impact
includes our purchasing of goods from suppli-
ers, dividends paid to shareholders, wages
and benefits paid to our employees, financial
expenses paid to creditors, income taxes paid
to the public sector, and community invest-
ments, as well as economic value retained for
investments to increase the capitalization of
the company.
Indirect economic impact (GRI 203) Given the scale of our operations, we have a
large indirect economic impact on some of our
stakeholders.
We have one ambitious purpose in our ap-
proach: contribute to an increase of global
food security by improving productivity and re-
ducing costs along the food supply value
chain we have impact on. We aim to unlock
Ukraine’s potential in agriculture, thus in-
creasing the number of people fed in a sus-
tainable way globally.
Our significant indirect economic impacts,
among others, include:
• Boosting productivity of farmers in Ukraine. Our farming business achieves 15-40% higher crop yields than country av-erages, and since 2018 we widely share our knowledge in crop production with other farmers in Ukraine through the special pro-gram Open Agribusiness, designed to help farmers to increase their yields. We share our knowledge: results of our agrochemical laboratories; our practices in precision farming, differentiated fertilizing and plant-ing, satellite and GPS-monitoring; research results from our R&D center, access to our RTK-stations etc. We also provide farmers in Ukraine with a range of high-quality ser-vices, like working capital financing, solu-tions through Kernel’s #DigitalAgriBusiness platform, high-quality infrastructure ser-vices and trainings. In this way we contrib-ute to the increase of their productivity and reduction of costs of food produced.
• Improving grain railway logistics in Ukraine. Other players in grain infrastruc-ture start widely adopting new approach “Strict schedule shipments” to grain trans-portation, which was first introduced by Ker-nel together with the national monopoly Ukrainian Railways in 2019. The approach
increases fleet turnover and thus reduced grain transportation costs. Additionally, through our “Transit-Hub” solution we sim-plify access to railway logistics for some un-productive silos which face difficulties when shipping grain to ports, due to not being pro-ductive enough to load a full block train (54 railcars) in one day. Our Transit-Hub plat-form allows such silos to combine their ef-forts in loading a single block train, thus im-proving their access to railway transporta-tion services, given railway logistics con-straints in Ukraine.
Combined with our efforts in food supply
value chain optimization, it reduces the total
cost of food, thus making it more affordable
and contributing to the achievement of #2 UN
Sustainable Development goal: Zero Hunger.
We also contribute to the development of rural
areas in Ukraine, which suffer from high pov-
erty rates, by investing in infrastructure
(roads, schools, hospitals, kindergartens),
simplifying access to medical services, and
contributing to local budgets as a responsible
taxpayer. Please see section “Local communi-
ties” for details.
………………………………………………………………………………………………………………………………………………… Economic value generated, distributed and retained (GRI 201-1) US$ million FY2015 FY2016 FY2017 FY2018 FY2019
Direct economic value generated 2,406 2,053 2,207 2,481 4,030 Revenue 2,330 1,989 2,169 2,403 3,992 Net IAS 41 effect (7) 20 (3) 19 9 Other operating income 83 45 41 59 28
Economic value distributed
Operating costs (2,077) (1,766) (1,942) (2,341) (3,760) of which employee wages and benefits (72) (60) (67) (103) (126)
Finance costs (69) (57) (62) (65) (82) Community investments (2) (2) (3) (2) (2) Other costs (156) 19 (3) (22) (1)
Total charges (2,304) (1,805) (2,009) (2,431) (3,839) Income tax (0) (4) (19) 6 (12)
Net income (loss) (2,305) (1,809) (2,028) (2,425) (3,851) Dividends paid (20) (20) (20) (20) (20)
Total economic value distributed (2,325) (1,829) (2,048) (2,445) (3,871)
Economic value retained 81 224 158 35 158 Data presented is calculated based on GRI recommendations using IFRS metrics on an accruals basis.
…………………………………………………………………………………………………………………………………………………………………………………………………………………………………
Sharing knowledge with other farmers in Ukraine within Kernel’s Open Agribusiness initiative

Kernel Holding S.A. Annual Report and Accounts 30 June 2019 44 www.kernel.ua
Sustainability continued
Strategic
Report Sustainability
Corporate
Governance
Financial
Statements
Anti-corruption and anti-fraud (GRI
205) Operating in a region with high fraud and cor-
ruption risks and poor compliance practices,
we understand all the negative impacts of cor-
ruption such as poverty, undermining the rule
of law, misallocation of investments and the
danger to the environment. Kernel is dedi-
cated to imposing proper control and preven-
tion mechanisms to reduce the risks of mis-
conduct in areas of all our operations.
Our approach in this area is presented in the
box at right “How we prevent fraud, corruption
and other types of misconduct”. In three years,
we managed to create a comprehensive com-
pliance system to minimize the risks of mis-
conduct, which was recognized by our financ-
ing providers EIB and EBRD and by independ-
ent compliance auditor Baker Tilly.
As an ultimate punishment measure for fraud-
ulent and corrupt activities, we dismissed 296
employees in FY2019, disclosing such cases
to other employees as a preventive measure.
Equal treatment here is applied to all employ-
ees: top-managers, white and blue collars.
For FY2020, we plan to further focus on inte-
gration of compliance into company opera-
tions and introduce a compliance risk-man-
agement system.
Environmental impact (GRI 300) Operations and products of farming, grain pro-
cessing and storage, crushing, and transpor-
tations have inherent elements that interact
with the environment – environmental as-
pects. The use of chemicals, emissions into
atmosphere, water consumption and
wastewater discharge, if improperly managed,
can cause adverse impacts on natural envi-
ronment and public health.
To avoid adverse impacts, Kernel undertakes
management measures commensurate to sig-
nificance of identified aspects. Resources are
allocated for functioning and professional de-
velopment of the Group’s Environmental De-
partment of 10 full-time employees at Storage,
Oilseed Processing, and Transshipment busi-
nesses. Environmental aspects of farming are
covered by the scope of Environment, Health
and Safety professionals work.
Being associated with relatively higher envi-
ronmental risks, all but one our crushing
plants implemented the requirements of the
ISO 14001 standard, which specifies require-
ments for an effective environmental manage-
ment system. We periodically train our envi-
ronmental specialists under this standard. For
one of our crushing plants, we aim to imple-
ment the ISO 14001 requirements over the
course of FY2020.
Materials (GRI 301) Materials is an important topic for us and our
stakeholders to assess the environmental im-
pact of Kernel operations. Our approach to
materials is guided by the principle stated in
the group’s Code of Conduct: we strive to min-
imize the usage of resources and industrial
waste. To implement this principle, we seek
options to avoid the use of materials, to reuse,
or to recycle it, and promote the use of renew-
able raw materials.
Our impact occurs mostly in our Oilseed Pro-
cessing and Farming segments, whereas our
Infrastructure and Trading segment is a ser-
vice-type business of re-selling grain and
providing logistics services, not consuming
materials to any large extent.
Main non-renewable materials consumed by
Kernel include mineral fertilizers and crop pro-
tection agents used by our farming business,
and solvents and plastic packaging consumed
by our Oilseed Processing segment.
Key renewable materials embrace sunflower
seeds and cardboard packaging in our oilseed
processing, and organic fertilizers and seeds
for farming business. Seed usage varies
based on shifts in crop mix and technology.
For example, wheat planting requires 0.2 tons
per hectare, while corn planting requires 0.02
tons per hectare of the respective seeds. Sim-
ilarly, fertilizer usage varies because of
…………………………………………………………………………………………………………………………………………………… How we prevent fraud, corruption and other types of misconduct
What we
adhere to
→ Zero tolerance to any fraudulent/corrupt activities within the Company and its subsidiaries.
Immediate disposal of employees and immediate ban on cooperation with partners suspected
in prohibited practices;
→ Proper framework in place:
• Code of Conduct (since 2015);
• Corporate Governance Charter (since 2018) also covering compliance issues;
• Anti-corruption policy, fundamental document for our compliance system developed in
accordance with the requirements of the anti-corruption legislation of Ukraine, the US For-
eign Corrupt Practices Act (FCPA) and the UK Bribery Act (UKBA), the Convention on Com-
bating Bribery of Foreign Public Officials in International Business Transactions (the ‘OECD
Convention’), as well as the anti-corruption legislation of the countries in which Kernel oper-
ates;
→ Tone at the Top initiative coming from the Board of Directors and Executive Management
Team;
How we
do it
→ Anti-corruption clause in all Kernel agreements and tendering processes (since 2017);
→ Code of Interaction with Suppliers (since 2019). We require all our suppliers to follow the prin-
ciple of strict legality, treatment of associates, environmental protection, business relations,
and compliance with Corporate Code;
→ In-depth documented due diligence during KYC procedure, conducted by a security service
and compliance officer;
→ Conflict of interest annual declaration procedure for over 5,000 participants in FY2019, with
results carefully analyzed for risks and possible settlements;
→ Business gifts and hospitality rules (since 2018) prohibiting presents and attendance of
events that may influence business decision-making; e-register of business gifts and hospitality
implemented;
→ Channels for informing on misconduct:
• 24 / 7 / 365 toll-free hotline (0-800-501-483) allowing anonymous calls. We received 110
calls reporting misconduct in FY2019 (up 29% y-o-y);
• Form on company’s website (since June 2019)
• Special e-mails: [email protected] and [email protected];
We have whistleblower protection mechanism in place, managed by compliance officer;
→ Diligent additional screening during the employee selection process (including Compliance
officer involvement if needed), with specific attention paid to the employment of former govern-
ment officials;
→ Regular assessment of risks covering conflicts of interest, bribes, charitable contributions
and sponsorships, gifts, hospitality.
→ Increasing compliance-culture awareness among employees:
• Trainings and e-courses (over 1,500 employees attended off-line trainings, all new em-
ployees go through on-line trainings);
• Regular e-mail distributions;
• Promo materials and warnings on the company website, intranet portal (with FAQ on the
topic), corporate media, infodesks at company’s assets, 5,000 printed anti-corruption man-
uals;
• Surveys among employees on compliance understanding. According to the results of in-
ternal survey conducted in FY2018, all our employees are informed about rules and princi-
ples of Code of Conduct and Anti-corruption Policy, and 99.9% them know how to report
fraud and corruption;
• Compliance promo-activities in external and internal media and conferences.
→ Compliance officer always available for providing assistance in case of disputable situations.

Kernel Holding S.A. Annual Report and Accounts 30 June 2019 45 www.kernel.ua
Sustainability continued
Strategic
Report Sustainability
Corporate
Governance
Financial
Statements
changes in technology and the variety of avail-
able fertilizers with different nitrogen, phos-
phorus and potassium content.
We internally source a substantial portion of
renewable materials used in farming, like
seeds and wastes from cattle farming busi-
ness used as organic fertilizers.
Roughly 3% of our produce is packaged and
labeled (measured by tonnage), while the
greater part of our produce is sold in bulk. For
packaged items, we strictly follow the national
regulations for which the product is destined.
Typically, labeling is subject to a three-phase
control and requires an authorized lab or third-
party issued verification for any information
exhibited on the markings.
Energy consumption (GRI 302) As an agro-industrial holding, Kernel has a
significant impact on the environment and
economy through energy consumption. By
boosting the energy efficiency of our opera-
tions and producing renewable energy we
minimize our adverse impacts and contribute
to the global climate change mitigation effort.
In FY2019, Kernel consumed 6,857 terajoules
of energy, 1.7% down y-o-y, a sizable part of
which comes from fossil fuels, thus resulting
in GHG emissions. Although the largest share
of consumed energy (56% of the group’s total
consumption) was associated with operations
of Oilseed Processing business, over 80% of
this energy came from renewable biomass
fuel (sunflower seed husk). Our Farming seg-
ment’s share of 27% derived from diesel and
gasoline consumed by machinery for field
works. Finally, the Infrastructure and Trad-
ing businesses consumed 16% of total en-
ergy, using natural gas for grain drying ser-
vices and electricity for machinery and equip-
ment powering.
In our farming business, we continuously up-
grade our machinery fleet every 5-6 years with
more powerful and larger size vehicles from
recognized global suppliers, providing higher
capacity and a lower specific consumption of
fuel. Along with hardware improvement, we
constantly raise the efficiency of our opera-
tions. GPS trackers installed in all our fuel-in-
tensive fleet allow us to better monitor the ac-
tual fuel consumption and to run some ma-
chinery in auto-pilot mode for better execution
of production technology implying lower fuel
intensity. A fuel consumption remote monitor-
ing system, widely applied by our farming
companies, eliminates thefts of diesel.
In FY2019, we achieved the lowest ever en-
ergy spent per ton of grain grown in our farm-
ing business, which partially reflects our
efforts in the optimization of business pro-
cesses, and partially results from record crop
yields achieved in FY2019.
In Oilseed Processing segment, all our
crushing plants operate biomass fired boilers.
Sunflower seed husk, the crushing process’
byproduct, is the only fuel used. The produced
steam is consumed mainly for technology pur-
poses, while at one of the plants it is also sent
to a turbine to produce electric energy. The
surplus of electricity is supplied to the national
………………………………………………………………………………………………………………………………………………… Energy consumption (GRI 302-1) terajoules FY2015 FY2016 FY2017 FY2018 FY2019
Non-renewable fuel consumed 2,459 1,923 2,647 2,928 2,835 Natural gas 774 549 1,108 1,044 899 Diesel, gasoline 1,682 1,370 1,537 1,884 1,936 Other non-renewable 4 3 2 0 0
Renewable fuel consumed 2,854 2,566 3,096 3,230 3,215 Electricity consumed 732 652 798 853 844 Renewable energy produced and sold 45 46 42 34 37
Electricity 32 35 41 34 37 Heating 13 10 1 - -
Total energy consumption 6,000 5,095 6,499 6,977 6,857
by division Oilseed Processing 3,635 3,068 3,859 3,877 3,852 Infrastructure and Trading 803 603 1,162 1,224 1,110 Farming 1,522 1,392 1,445 1,847 1,867 Other 41 32 33 29 29
by country Ukraine 5,720 5,094 6,496 6,977 6,857 Russia 280 1 3 - -
Energy intensity (GRI 302-3) megajoules
Energy spent per ton of sunflower seed crushed 1,459 1,408 1,428 1,340 1,325 Energy spent per ton-% of grain dried 63 63 68 61 67 Energy spent per ton of grain grown 854 708 630 675 546
Only energy purchased from external suppliers is included in energy consumption. Energy generated and consumed internally
is excluded. Additionally, energy consumption figures exclude heating purchased from third-party suppliers due to the non-ma-
teriality of volumes.
The volumes of natural gas and diesel fuel used for energy production are measured by equipment installed at each point of
consumption. The volumes of diesel fuel, petroleum and liquefied natural gas used in automobiles and agricultural machinery
are calculated based on the actual fuel consumption by each unit of machinery. The volume of sunflower seed husk used to
generate steam and electricity is accounted based on records from scales installed at each point of husk consumption. Electricity
purchased and used is measured by metering devices.
Energy sold includes heating and electricity produced from sunflower seed husk burned at boilers located at our oilseed crushing
plants. The volume of electricity sold is measured by equipment connected to the country’s electricity grid. Heating sold is meas-
ured based on the volume of hot water supplied to external consumers and is measured by equipment installed at the point of
consumption. All noted measuring equipment is certified and regularly checked for accuracy by independent external experts.
The conversion of energy into joules is made using conversion factors sourced from GHG Protocol; Collection of emission indi-
cators (specific emissions) of pollutants into the air by different productions (tome 1) prepared by Ukrainian Research Center for
Technical Ecology (Donetsk, 2004); Methodology of the State Statistic Service of Ukraine.
………………………………………………………………………………………………………………………………………………… Principal materials used (GRI 301-1) thousand tons FY2015 FY2016 FY2017 FY2018 FY2019
Non-renewable materials
Fertilizers (mineral) 128.0 146.0 171.0 179.7 213.4 Crop protection agents 1.8 1.8 2.3 2.3 3.3 Solvents used in oilseed processing 1.1 1.2 1.1 1.3 1.2 Packaging for bottled sunflower oil 2.8 1.5 3.9 3.3 3.7
Renewable materials Sunflower seeds (from external suppliers) 2,351.1 2,037.7 2,489.2 2,824.7 2,738 Sunflower seeds (sourced internally) 171.7 170.7 242.8 311.1 426.0 Packaging for bottled sunflower oil 2.2 2.3 3.3 3.0 3.1 Fertilizers (organic, sourced internally) 132.1 122.4 67.0 40.0 136.1 Seeds for farming (sourced internally) 20.5 34.0 32.0 32.9 46.5 Seeds for farming (from external suppliers) 5.5 8.0 5.7 11.6 9.9
The data excludes Infrastructure and Trading segment, which primarily provides services. Fuel volumes are excluded from the
calculation and are presented in a separate disclosure.

Kernel Holding S.A. Annual Report and Accounts 30 June 2019 46 www.kernel.ua
Sustainability continued
Strategic
Report Sustainability
Corporate
Governance
Financial
Statements
grid. In FY2019, this combined heat and
power (CHP) unit has converted 181 thou-
sand tons of sunflower husk into 552 thou-
sand gigacalories of heat for production pur-
poses and 10.3 million kWh of electricity (sold
to 3rd parties), saving 11 thousand tons of
greenhouse gases (CO2 equivalent).
In order to upscale production of renewable
energy, we are investing US$ 150 million to
become the largest Ukraine producer of en-
ergy from biomass with 94MW installed elec-
tricity generation capacity (see “Case study: in-
vestments into green energy generation”). The
first 6 MW CHP unit has already been in-
stalled, 40 MW are expected to be commis-
sioned in FY2020, and the remaining 48 MW
to be launched in FY2021.
As a result of our efforts, a new record was
achieved in our crushing business in FY2019,
when we spent just 1,312 megajoules of en-
ergy to crush 1 ton of sunflower seeds, our
lower rate ever.
Biomass energy is also harnessed at our Ko-
nonivka grain storage facility. The investment
of US$ 200 thousand has enabled replacing a
diesel heat generator with 4 MW biomass-
fired dryer consuming the site’s by-products.
The expected payback period is 5 years. In
Silo business, we increased energy consump-
tion per ton-% of grain dried due to the low hu-
midity of the crops this season compared to
the previous one.
Biodiversity (GRI 304) Modern agriculture has enabled food produc-
tion to increase dramatically, contributing
much to improving food security and reducing
poverty. However, these improvements, if im-
properly managed, may be associated with
adverse impacts on natural environment and
specifically on biodiversity. Globally, defor-
estation and other forms of land-use conver-
sion, driven by the expansion of agricultural
lands, are key reasons for biodiversity losses.
Another threat derives from chemical pollution
and application of pesticides.
Realizing these threats, we strive to fully elim-
inate any impact of our operations on biodiver-
sity. In our farming business, we cultivate only
lands which have been used for crop produc-
tion for decades, and therefore we do not give
rise to deforestation. We grow only crops
which are typical for the regions of our opera-
tions. The Company does not carry on farming
activities in reserved areas, national parks
and areas with high biodiversity value, thus
not affecting endangered species.
Kernel is strongly committed to sustainable
long-term crop production practices as
opposed to the short-term profit seeking. Our
key target in sustainable farming is long-term
soil productivity based on the following pillars:
• Maintaining proper soil nutrients. We fol-low the balanced crop rotation practice en-suring proper replenishment of nutrients in the soil and apply appropriate fertilization to restore nutrients absorbed by the crops. Once per 3-4 years (in line with our crop ro-tation cycle) we analyze the quality of soils at our fully equipped technological labora-tory, and adjust our crop mix plans, produc-tion technology and fertilization practices if needed;
• Preventing soil erosion. Depending on crop cultivated, land location and soil pat-tern, we carefully select proper tillage tech-nology to minimize soil erosion. For lands with soil erosion risk we implement soil-pro-tective measures and adjust crop mix re-spectively. Additionally, we leave straw on the fields after the harvesting as it serves the organic fertilizer and prevents soil ero-sion;
• Integrated pest management system, which ensures thresholds are set for any pest control actions, and cultural methods aimed at reducing the exposure of plants to infection are applied prior to the use of pes-ticides. We comply with all applicable pesti-cides regulations and use only those crop protection agents, which are authorized for the use in Ukraine. We do not apply prod-ucts forbidden by the Stockholm Conven-tion on Persistent Organic Pollutants and/or products listed in Annex 3 of the Rotterdam Convention. Any new substances are first tested on our inspection fields, and only then widely adopted in our production pro-cess. Pesticides are stored in certified stor-ages, subject to annual inspection by Sani-tary Authority. Proper disposal of the empty containers is controlled.
The key waste produced by our farming seg-
ment is straw. We leave it on our fields after
harvesting campaign is completed, and straw
serves as an organic fertilizer, also preventing
soil erosion. The major portion of waste gen-
erated by our silos is sold to third parties to be
further used as a cattle feed or biofuel, and the
remaining is disposed in landfills.
As required by some our customers, over 170
thousand hectares under corn and 34 thou-
sand hectares under soybean (39% of farm-
land bank under crops) are annually certified
for compliance with ISCC standards. ISCC
(International Sustainability and Carbon Certi-
fication) is a globally leading certification sys-
tem focused on securing traceable and defor-
estation free supply chains, and protection of
land with high biodiversity value. It confirms
our commitment to the highest sustainability
requirements.
Emissions (GRI 305)
The Group’s operations are associated with
emissions of carbon dioxide (CO2), methane
(CH4), nitrous oxide (N2O) - collectively re-
ferred as greenhouse gases (GHG), and other
substances such as carbon monoxide (CO),
nitrogen oxides (NOX), sulfur dioxide (SO2),
PM, and hydrocarbons.
While the impacts of GHG are mainly per-
ceived indirectly, through manifestations of cli-
mate change, other emissions have more
straightforward effect on human health and
ecosystems. We acknowledge our share of
responsibility for these impacts and strive to
minimize emissions. In line with mitigation hi-
erarchy, we prefer prevention over end-of-
pipe treatment. Resource efficiency is our key
preventive strategy.
A large share of emissions stems from our en-
ergy consumption. Although nearly 50% of our
current energy needs are already covered
with renewable energy from biomass (which
significantly reduces our GHG emissions), we
keep investing in measures for rising effi-
ciency and corresponding decrease of emis-
sions, as described in the chapter Energy con-
sumption (GRI 302) above.
Where prevention is not feasible, treatment
equipment is applied: boilers at all our crush-
ing plants (but one plant – installation planned
for 2021) are equipped with electrostatic filters
highly efficient (95-98%) in capturing PM. All
grain handling installations at storage silos
and transshipment terminals are equipped
with cyclone filters. By 2021 several boilers
will receive selective non-catalytic reduction
equipment to lessen nitrogen oxide emis-
sions.
All stationary sources of emissions in Ukraine
are subject to permitting procedure that en-
compasses emissions inventory, dispersion
modelling, and public disclosure of the out-
comes in press. The modeling provides esti-
mates on concentrations of emitted pollutants
at neighboring sensitive receptors areas
(housing, schools, hospitals, etc.). All compa-
nies of the Group operating stationary emis-
sion sources hold valid permits (covering
GHG and other emissions), monitor emis-
sions’ parameters, and pay environmental tax
(US$ 137 thousand in FY2019) accrued
based on actual emissions volume.
When reporting our GHG emissions, we dis-
tinguish between directs GHG emissions from
sources that are controlled by Kernel (Scope
1), and energy indirect GHG emissions that
result from the generation of purchased elec-
tricity, heating, consumed by Kernel (Scope
2).

Kernel Holding S.A. Annual Report and Accounts 30 June 2019 47 www.kernel.ua
Sustainability continued
Strategic
Report Sustainability
Corporate
Governance
Financial
Statements
A major portion of our direct (Scope 1) green-
house gas emissions is produced by our farm-
ing business, mainly from combustion of fuels
by machinery for field works and transporta-
tion. The contribution of enteric fermentation
from our cattle farming is also substantial due
to high global warming potential that has me-
thane emitted by cows.
Though, it should be admitted that fertilizer ap-
plication – another potentially large source of
GHG emissions, stays unaccounted this year
(except for ISCC certified fields). We plan to
extend the accounting practice to the entire
Kernel’s land bank in order to present more
comprehensive figures in our next Annual Re-
port.
As to Scope 2 emissions, three quarters of
them are associated with electricity consumed
by our seed processing segment. Due to pe-
culiarities of national electricity market there
was no opportunity for direct contracts with
electricity producers, therefore a unified spe-
cific emission factor has been applied for the
national grid’s energy mix.
Globally, agricultural sector is responsible for
around 10% of GHG emissions that contribute
to the greenhouse effect by absorbing infrared
radiation, and by that to the climate change.
Yet, the sector in its turn is intrinsically im-
pacted by the climate change. Such impacts
on the Group’s operations, that are already
occurring but expected to intensify, include re-
duced crop and pasture yields and quality, in-
creased spread of crop diseases and pests.
These impacts stem from changes in surface
temperatures, the timing of seasons, and in
the frequency and magnitude of severe
weather events, such as droughts, floods,
storms and heatwaves.
Besides harvest levels, climate change con-
tributes to operational risks through hindered
road transportation (asphalt roads closed dur-
ing high temperatures) and maritime naviga-
tion (increased storms frequency and inten-
sity), and increased risk of fires.
To respond to the abovementioned risks, we
apply measures as follows:
• launched in November 2018 the #DigitalAg-riBusiness project. Embracing field records for the past five years, climate and soil con-ditions, market and agronomic inputs, bio-chemistry and biophysics rules enhanced with the artificial intelligence solutions, ma-chine learning and advanced analytics, it converts data into a single system assisting us in making smarter decisions. This unique planning tool enables us to more precisely model profitability scenarios, optimize re-sources and predict expenses;
• capture weather data using 49 real-time stationary weather stations, which have been installed since 2012 and fundamen-tally reorganized in FY2018.
• expand our land bank and operations in Northern, Central and Western regions of Ukraine that are less exposed to climate change risks;
• insurance of winter crop related costs, and insurance against limited rainfalls and soil moisture content on some of our fields;
• prepare GHG inventories that help us to un-derstand the Group’s exposure to related risks, identify emissions reduction opportu-nities, and communicate performance to in-ternal management and external stakehold-ers.
Our most sizable impact in emissions reduc-
tions will occur after the commissioning of our
renewable energy projects – 7 cogeneration
heat and power units installed at our oilseed
processing plants with a combined capacity of
94MW. Once working at full capacity and gen-
erating green energy from biomass, reduction
of GHG emission is expected to amount at
more than 700 thousand tons of CO2
equivalent.
In addition to the disclosure in this report, Ker-
nel also reports under the CDP Climate
Change initiative, with reports available on
CDP website.
………………………………………………………………………………………………………………………………………………… Greenhouse gas emissions (GRI 305-1, 305-2) thousand tons of CO2 equivalent
FY2015 FY2016 FY2017 FY2018 FY2019
Direct (Scope 1) GHG emissions 236 198 232 260 234
by gas type
CO2 204 168 207 235 216
CH4 29 27 25 25 18
N2O 0 0 0 0 0
by division
Oilseed Processing 18 6 13 3 3
Infrastructure and Trading 43 29 61 70 57
Farming 174 161 156 186 173
Other 2 2 2 1 1
by country
Ukraine 225 197 232 260 234
Russia 11 0 0 - -
by source
Fuel-sourced 162 129 172 200 191
Cattle Farming 71 67 60 60 44
Non fuel-sourced 2 2 - - -
Biogenic (Scope 1) GHG emissions 280 252 304 317 316
Gross indirect (Scope 2) GHG emissions 76 72 80 86 88
Other significant air emissions (non-GHG)
Carbon oxide 0.7 0.7 0.4 0.5 0.4
Sulfur dioxide 0.3 0.3 0.2 0.3 0.1
Particulate matter 0.8 0.8 0.7 1.0 1.4
GHG emissions intensity ratio (GRI 305-4) kg of CO2 equivalent
per ton of sunflower seeds processed 7.1 3.0 4.8 1.0 1.1
per ton of grain grown 97 84 68 68 50
Scope 1 emissions are calculated based on volumes of fossil fuel used across the company and those generated by livestock. The company use financial control consolidation approach for emission. Emissions are calculated based on volumes of fuel consumed and conversion factors sourced from GHG Protocol (GHG Emissions from Stationary Combustion). The calculation excludes GHG emissions from the application of fertilizers and pesticides by our farming and the effect of carbon capture during the development of crops. Currently, we are examining available calculation methodologies. Emissions from livestock farming are calculated based on the average headcount of cattle for the reporting period and established regional normative levels for emissions per head. Scope 2 emissions represent emissions from purchased electricity. Some other substances such as hexane and nitrogen oxides are not disclosed due to immateriality. The conversion factor is calculated as the ratio of total emissions from electricity production in Ukraine sourced from UN GHG Inventory to energy production itself sourced from Ministry of Energy and Coal Mining. We use IPCC 5th Assessment Report rates for global warming potential calculation. We use direct (Scope 1) GHG emissions as a denominator to calculate the intensity ratios.
Kernel Holding S.A. Annual Report and Accounts 30 June 2019 48 www.kernel.ua
Sustainability continued
Strategic
Report Sustainability
Corporate
Governance
Financial
Statements
Social impact (GRI 400) Employment (GRI 401)
Our goal is to find and attract the best people
and develop and retain them to ensure sus-
tainability of our operations and business
model.
As of 30 June 2019, Kernel had 13,397 em-
ployees (FTE), including 12,794 permanently
employed. Although we continue our head-
count optimization program in the existing
businesses, our investments under Strategy
2021 will create over 600 new jobs by 2021.
Trade unions representing employees func-
tionate at Kropyvnytskyi, Prykolotne, Poltava
and Vovchansk oil extraction plants, as well as
on some our silo business entities.
There were no outstanding disputes between
trade unions and Kernel business entities as
of the date of this report.
Competitive remuneration
With people as our most valuable asset, we
constantly strive to maintain competitive re-
muneration.
A fixed part of regular monetary compensa-
tion is set at the level which matches or ex-
ceeds the benchmark paid in our industries.
The variable part depends on numerous KPIs,
which are quite granular, including, for exam-
ple, various indicators for each separate field
in our farming business. What is more im-
portant, we provide employees all tools to di-
rectly affect KPI’s and monitor the KPI’s exe-
cution on close-to-online basis, thus trying to
keep them involved as much as possible. Fol-
lowing the example from our farming busi-
ness, agronomists can observe the results of
their work online using our own system and
third-party solution Cropio.
Apart from regular compensation, employees
receive one-time monetary incentives for
achievements and business efficiency im-
provements, as discussed in “Case study: pro-
moting employee engagement within Kernel”.
We strictly follow the principle that, in case of
staff reduction in a team of employees due to
labor productivity improvements (which is in-
evitable in our business), the salary pool is not
reduced, but rather shared with the other team
members.
Finally, monetary compensation includes
such socially oriented components as fixed
payments in case of retirement and monetary
support in case of employee’s personal life dif-
ficulties.
Average salary in FY2019 increased by 23%
………………………………………………………………………………………………………………………………………………… Human capital indicators As of 30 June of the respective year
FY2015 FY2016 FY2017 FY2018 FY2019
Total number of employees 15,229 14,075 16,103 15,116 13,397 by geography
Ukraine 14,642 14,010 16,048 15,066 13,355 Russia & other 587 65 55 50 42
by age
less than 30 years old 3,099 2,755 2,775 2,648 2,322 30-50 years old 8,440 7,822 8,597 7,647 7,615 more than 50 years old 3,690 3,498 4,731 4,821 3,460
by gender
Male 11,050 10,048 11,307 11,148 9,897 Female 4,179 4,027 4,796 3,968 3,500
by level
Managers 1,166 1,040 1,157 991 885 Specialists 3,081 3,141 3,841 3,959 3,665 Workers 10,982 9,894 11,105 10,166 8,847
by business division
Oilseed Processing 2,750 2,455 2,592 2,501 2,258 Infrastructure and Trading 3,103 3,250 3,501 3,447 2,990 Farming 8,770 7,767 9,389 8,448 7,405 Headoffice and other 606 603 621 720 744
by employment contract, by region Permanent 14,602 13,626 15,659 14,724 12,794
Ukraine 14,020 13,561 15,605 14,674 12,752 Russia & other 582 65 54 7 0
Seasonal and temporary 627 449 444 392 603 Ukraine 622 449 443 392 603 Russia & other 5 0 1 0 0
by employment contract, by gender Permanent 14,602 13,626 15,659 14,724 12,794
Male 10,313 9,717 10,956 10,882 9,383 Female 4,289 3,909 4,703 3,842 3,411
Seasonal and temporary 627 449 444 392 603 Male 489 331 351 289 514 Female 138 118 93 103 89
by employment type, by gender Permanent 14,747 13,606 15,459 14,774 13,143
Male 10,586 9,828 11,029 11,002 9,774 Female 4,161 3,779 4,431 3,772 3,369
Seasonal and temporary 482 469 644 342 254 Male 216 220 278 169 123 Female 266 248 365 173 131
%-age of women in executive management 29.0% 40.0% 33.3% 25.0% 18.2% %-age of women on Board of Directors 25.0% 25.0% 37.5% 37.5% 37.5%
Note: Differences are possible due to rounding. Headcount data include FTE (full-time equivalent) employees as at 30 June of the respective period
………………………………………………………………………………………………………………………………………………… Personnel benefits
Competitive salary (regular monitoring of labor market)
Guaranteed compliance with all the legal labor requirements (incl. parental leaves)
Training and development of personnel, formation of personnel reserve
Occupational health and safety, including respective insurance
Financing sport initiatives of the employees
Material assistance to employees facing difficult life circumstances
Rewards and other benefits dedicated for special events (birth, marriage)
Retirement provisions and privileged pensions for employees at hazardous jobs

Kernel Holding S.A. Annual Report and Accounts 30 June 2019 49 www.kernel.ua
Sustainability continued
Strategic
Report Sustainability
Corporate
Governance
Financial
Statements
as compared to FY2018, and we expect fur-
ther compensation growth in FY2020.
Our non-monetary compensation includes
additional paid leave in case of special family
events, numerous events organized for em-
ployees’ children, gifts, trainings and educa-
tion programs, various discounts for employ-
ees (vaccination, tickets for sport, art and cul-
ture events etc.).
We fully comply with local labor legislation and
pay all salary-related taxes and social
contributions, despite somewhat losing com-
petitive advantage versus those market play-
ers who are involved in shady operations.
Individual development system and career
planning
In FY2019, we more than doubled the number
of people participating in standardized perfor-
mance appraisals, from 238 employees in
FY2018 to 514 in FY2019. We expanded cov-
erage of employees in our Oilseed Processing
business, and also added selected employees
from silo business.
All new employees attend several adaptation
meetings, where managers from various de-
partments present their activities. Such prac-
tice allows newcomers to better understand
the business of the Company from various an-
gles, thus making them more productive from
their first days.
We have a special program, Internal Kernel
Chance, designed to create a talent pool
within the group for key positions. We carefully
select participants through self-nomination,
………………………………………………………………………………………………………………………………………………………………………………………………………………………………
Purpose: increase employee engagement, cultivate entrepreneurial spirit within the company
Approach: we have several programs to reach the purpose
1. Kernel Agribusiness League of Champions. Since 2014, we annually award employees
for the best achievements in our farming business. We organize a large gala performance
inviting over 700 employees from all company farming clusters. We award the best machinery
operators, best agronomists for each crop, best engineer team and other for both individual
and team achievements. In FY2019, we provided 52 awards in 9 categories. The award cer-
emony is streamed online via corporate YouTube channel. Results of the champions are 15-
30% higher than average for the company, and applied practices are widely adopted there-
after within the company.
There are two important elements of the award. The average monetary award amounts to
US$ 900 per employee, with total FY2019 award pool of over US$ 1 million. But quite often
public recognition is even more important. We award the best teams and employees in front
of their colleagues, widely cover the winners in our corporate media and social networks.
Winners get the chance to award new winners at next year ceremony.
We consider League of Champions as one of the most important projects for employee en-
gagement and promotion of healthy competition in our farming business. Since FY2019, we
organized similar events for other departments: oil extraction plants, silos, terminals, procure-
ment and logistics.
2. While Champions’ League awards the best achievements within the season, our Super League contest awards the best achieve-
ments among production teams on crushing plants, silos, terminals and the best farming cluster mechanized unit for each month.
3. In all our segments we launched the initiative “We have an idea!”, whereby each employee may propose efficiency improvement
solutions and receive a monetary award if their solution is chosen for implementation by the initiative jury. The winners are announced
in corporate media, on our Facebook page and honor boards, promoting an entrepreneurial spirit and attitude to work within the
company. In FY2019, 112 initiators provided 192 ideas for productivity improvement, of which 98 were implemented. Average payment
to initiators amounts to US$ 1.2 thousand.

Kernel Holding S.A. Annual Report and Accounts 30 June 2019 50 www.kernel.ua
Sustainability continued
Strategic
Report Sustainability
Corporate
Governance
Financial
Statements
professional testing, assessment of compe-
tencies and assessment of achieving effi-
ciency indicators. Then we draw up a Devel-
opment plan for soft and hard skills and a list
of precision tasks and measurable goals.
Over the course of the program we control the
progress and, following the completion, create
talent pool for appointment to vacant position
and set tasks for the next period. In FY2019
74 employees participated in the program
Working with universities
In Ukraine, we cooperate with 28 specialized
universities. All of them participate in “Kernel
Chance” – a paid internship program for un-
dergraduates and graduates allowing them to
work in the company for several months under
the mentorship of our professionals, learn the-
oretical and practical aspects of the selected
area, and propose the area for optimization.
Following the evaluation process, the best
students get job offers from Kernel, and once
employed, undergo intensive on-job training
and rigorous mentoring, thus creating a ready-
made career plan. Since the launch of the pro-
gram in 2011, we employed 297 “Kernel
Chance” alumni, the majority of whom have
proven to be such a talented staff, that they
earned a special “MBA for Challengers” inter-
nal training course. In FY2019, we received 61
applicants for the program.
For 90 people in FY2019, Kernel became the
first workplace.
In FY2019, Kernel together with other Ukrain-
ian agricultural companies, PWC Ukraine and
the National University of Life and Environ-
mental Sciences of Ukraine created a special-
ized 1.5-year master program in agriculture
“Agrokebety” for up to 50 students. The pur-
pose of the program is to prepare a new gen-
eration of agribusiness managers with a uni-
versal set of skills in agronomy, agriculture en-
gineering and business management. After
the curriculum is polished, the program is
planned to be spread among other universi-
ties, thus improving the quality of higher edu-
cation in agriculture in Ukraine. As a Gold
Partner of the project, Kernel contributes fund-
ing to the program, provides tutors and men-
tors for students, and organizes internships
for students.
Employee engagement
In FY2019, we have launched an annual
AgriChallenge project, under which 78 partici-
pants of our corporate MBA program spent
several days working outside office as blue
collars at company’s assets. As a result of the
AgriChallenge, a number of initiatives on au-
tomation and process efficiency improvement
have been collected: 10 - completed and 7 -
are being implemented. Besides collected im-
provement initiatives, benefits of the project
include improved cross-functional interaction
at different levels, and participants enhanced
understanding of operational activities. We
plan to make such field visits regular with an
increased number of participants.
To evaluate our impact, we hired an independ-
ent marketing and social research company
InMind, which conducted the engagement
study of employees in our Farming and
Oilseed Processing segments and head office
in 2017-2018. The study covered such topics
as employee work satisfaction, loyalty and en-
gagement, benchmarking Kernel results with
market averages. Results demonstrated that
Kernel employee satisfaction level is 19-24%
above the market averages, employee loyalty
is 12-61% higher than market averages, and
employee engagement level exceeds the one
of peers by 5-59% depending on the segment
analyzed.
Occupational health and safety (GRI
403) Operating in the region with historically poor
work-related safety culture, we pay special at-
tention to the improvement of occupational
safety and remain committed to providing ad-
equate working conditions in compliance with
labor legislation at all Kernel sites.
We have a system of hazard identification, and
ranking, which serves as a basis for creating a
proper preventive system. All job positions in
the company’s subsidiaries are classified by
risk exposure, which determines the fre-
quency of compulsory safety trainings we reg-
ularly organize for all our employees. Work-
places and production processes are orga-
nized as a way to comply with safety
requirements and regulations. Workers are
fully equipped with required special work
clothes and take a regular medical examina-
tion as prescribed in their role.
Being high-risk assets, all our crushing plants
meet the requirements of OHSAS 18001 from
which we plan to migrate to ISO 45001 in the
near future, and we are working on imple-
menting such requirements on our grain infra-
structure assets as well. The ultimate goal is
to have health and safety systems at most of
our production units fully compliant with ISO
45001.
Our occupational health and safety frame-
work, as well as numerous OHSAS 18001 re-
quirements, are regularly inspected by third-
party auditors as a part of more complex au-
dits organized for various product certification
purposes. Additionally, we had over 60 audits
and inspections run by our internal team,
members of which constantly undergo train-
ings under ISO 45001 and are supervised by
a group level health and safety committee.
We declared FY2020 to be the year of occu-
pational safety in our Infrastructure and Trad-
ing segment, allocating increased budgets for
trainings and additional involvement of em-
ployees to the discussion of job safety. On top
of that, selected KPIs on occupational health
and safety were added to the performance as-
sessment system for the key management of
our assets: oilseed processing plants, silos
and export terminals.
As a preventive measure to work-related inju-
ries, we installed 26 alcohol detectors at en-
trances to our key infrastructure and
………………………………………………………………………………………………………………………………………………… Work-related injuries (GRI 403-9) FY2015 FY2016 FY2017 FY2018 FY2019
Recordable work-related injuries 19 16 14 16 17 Oilseed Processing 2 2 2 1 - Infrastructure and Trading 12 3 2 3 11 Farming 5 11 10 12 6
of which
Fatalities 1 1 - 4 1 Oilseed Processing - - - 1 - Infrastructure and Trading 1 - - 1 1 Farming - 1 - 2 -
High-consequence work-related injuries (excl. fa-talities)
10 8 5 6 5
Oilseed Processing 2 1 - - - Infrastructure and Trading 6 2 2 1 3 Farming 2 5 3 5 2
Hours worked, million 29 30 31 29 28
Rate of recordable work-related injuries 0.66 0.53 0.45 0.55 0.60 Rate of fatalities as a result of work-related injury 0.03 0.03 - 0.14 0.04 Rate of high-consequence work-related injuries (excl. fatalities)
0.35 0.26 0.16 0.21 0.18
Injury data is collected in accordance with local regulatory requirements in Ukraine and Russia and does not include minor
(first-aid level) injuries and does not include contractors working on-site. Injury rates are calculated as total accidents occurred
over the period divided by the actual hours worked (in millions) over the period.

Kernel Holding S.A. Annual Report and Accounts 30 June 2019 51 www.kernel.ua
Sustainability continued
Strategic
Report Sustainability
Corporate
Governance
Financial
Statements
production assets in FY2019. We plan to in-
stall 26 more in FY2020.
By following this approach, we aim to reach a
healthy and injury-free working environment
for all Kernel entities.
Regretfully, we had one fatal accident in our
Infrastructure and Trading segment, caused
by breach of occupational safety regulation.
The number of high-consequence work-re-
lated injuries (excluding fatalities) in FY2019
reduced to 5 from 6 a year ago. While high-
consequence work-related injuries reduced in
FY2019 as compared to FY2018, we under-
stand that the current level is unacceptable,
and we aim to further reduce it.
Training and education (GRI 404) We treat people as our key competitive ad-
vantage and extensively invest in the develop-
ment of their hard and soft skills. We have nu-
merous training and education programs for
all our business units and for various profes-
sions and career bands. Our purpose is to
continuously develop human capital within the
organization.
Our education activities are structured in six
different directions:
• Professional education, focused mainly on agribusiness, where we see the highest potential for implementing cutting-edge farming approached in our operations. Based at fully equipped modern training fa-cilities located in several of our farming clusters, we organize module-based practi-cal training programs taught by local and visiting trainers for our agronomists, engi-neers and other agribusiness specialists. Similar programs are also organized for our crushing and infrastructure divisions. Over 4.2 thousand participants were covered by professional education programs in FY2019.
Additionally, we organize numerous experi-
ence-exchange trips in Ukraine and abroad
for our specialists, including attendance of
exhibitions and site visits.
• Ad-hoc competency development train-ings tutored mostly by external trainers and organized depending on business needs. Over 0.5 thousand participants attended such programs in FY2019.
• One-time educating activities includes master-classes, conferences and seminars led by both internal and external trainers, as well as one-time courses for new manag-ers. Almost 0.8 thousand participants sub-scribed for such activities in FY2019.
• Corporate modular programs include
corporate MBA and other programs for ex-ecutives. First initiated for agri managers and key specialists in 2013, corporate MBA program then emerged into 6 separate pro-grams for oil production, logistics, agricul-ture and other divisions, educating 0.6 thou-sand participants in FY2019. Each program has two workshops per year consisting of case studies, team-based assignments and a final project, and is tutored by lecturers who teach at certified MBA programs. A special version of Corporate MBA is availa-ble to high potential specialists and mem-bers of our personnel reserve pool.
• Training from internal coaches. A pool of 31 internal coaches provides various 8-hour-average learning programs, promot-ing knowledge and experience sharing within the company. The program was launched in 2017 and proved to be ex-tremely popular, with 1.2 thousand partici-pants attending the trainings in FY2019.
• Distance learning, including e-courses, online-tests, webinars. The core element here is Kernel Hub – a distance learning and knowledge web/mobile platform. De-veloped in 2014, Kernel Hub allows any employee to take hard- and soft-skills learn-ing e-courses, get access to accumulated in-house expertise and e-books from vari-ous fields of personal and professional de-velopment. In FY2018, we did a pivotal up-grade of the system aimed on further ex-pansion of user base, whose number reached 1 thousand in FY2019.
Additionally, each year we organize a one-
week on-campus executive education pro-
gram in a high-ranked global business school
for a group of our top-level executives.
We offer a mentorship program, which is de-
signed to accelerate the adaptation of new
employees and develop their hard skills. The
program manager assigns mentors to new
employees, and structures, formalizes and
oversees mentor-employee relationships.
Mentors get monetary incentives and proper
training to improve their coaching skills and
ability to provide feedback. First introduced in
2015, the program has proven to be a useful
tool and successfully extended in FY2019, in-
creasing the number of mentors from 74 in
FY2017 to 81 in the reporting period.
In FY2018, we also launched a mentorship
program designed for soft skills improvement.
The program now includes 33 mentors and 21
mentees. Both categories received proper
training before the launch of the program:
workshops, training for mentors and master-
classes for mentees.
Since 2014, we have made progress on im-
plementing a unified approach to planning in-
dividual development, the coverage of which
increased in FY2019 to 514 employees (vs
180 employees in FY2017), including employ-
ees from a central office, and management
and key staff from regional branches. The as-
sessment conducted as a part of this program
is used to identify key areas for growth, im-
prove career planning and provide better visi-
bility of the ambitious talent pool, their training
needs and prospects.
Within the company, we are creating an inter-
nal talent pool of highly skilled professionals
who will not only share their expertise with
their colleagues and help them grow profes-
sionally, but also be the leaders in Kernel's
strategy and corporate culture.
In FY2019, we increased the number of
trained employees by 12% y-o-y, to 8.3 thou-
sand.
Local communities (GRI 413) By leasing lands on territories of 617 local
councils in Ukraine and having the majority of
our employees working and living in rural ar-
eas, we strongly interact with local communi-
ties. Villages in Ukraine suffer from high pov-
erty rates, accelerating urbanization, an a lack
of access to basic services and infrastructure.
As a reputable long-term partner, Kernel
shares responsibility for the development of
………………………………………………………………………………………………………………………………………………… Talent development (GRI 404-1, 404-3)
FY2015 FY2016 FY2017 FY2018 FY2019
Training expenditures, thousand US$ 241 194 445 474 456
Training hours 135,426 150,612 83,943 78,477 92,073
Average hours of training per employee 8.9 10.7 5.2 5.2 6.9 by gender
Male 9.7 12.8 5.6 5.3 7.3 Female 8.0 6.3 5.8 5.7 5.6
by employee category Managers n/d n/d n/d n/d 27.6 Specialists n/d n/d n/d n/d 13.7 Workers n/d n/d n/d n/d 2.0
% of workforce taking part in standardized performance appraisals
1.0% 1.3% 1.1% 1.6% 3.8%

Kernel Holding S.A. Annual Report and Accounts 30 June 2019 52 www.kernel.ua
Sustainability continued
Strategic
Report Sustainability
Corporate
Governance
Financial
Statements
neighboring local communities, so our pur-
pose is to continuously contribute to the im-
provement of local communities’ well-being in
the regions of our farming operations.
Striving to better understand the needs of lo-
cal communities and to get feedback about
our social activities, we benefit from:
• a team of 225 dedicated relationship managers who serve as our representa-tives in rural regions, communicate with landowners, local officials and opinion mak-ers, help with offering seasonal and full-time jobs in Kernel to people in rural re-gions. The team has proven to be useful and effective, and we treat it as one of our competitive advantages, as a limited num-ber of other crop producers in Ukraine apply such practice;
• a countrywide 24/7 toll-free hot line (0 800
50 10 59). We received 1,450 calls in the re-
ported period (17% growth y-o-y), up to 70%
of which covers questions related to local
communities, proving the efficiency of this
tool;
• a constant dialogue with local municipal-
ities.
Over the course of FY2019 our investments in
the well-being of local communities totaled to
US$ 2.3 million, comprising investments into in-
frastructure (US$ 625 thousand, excluding
spending related to our business needs),
schools and kindergartens, as well as charity
donations and other social spending facilitating
sport, art and leisure activities. All our support
of local communities is structured through the
charitable foundation ‘Together with Kernel’,
which runs its own website razom.kernel.ua (in
Ukrainian) aimed at promoting our social activ-
ities and serving as a point of contact with local
stakeholders. In 2018, donations covered 905
villages, including 196 schools and 146 rural
health posts which received support from Ker-
nel to buy equipment and make repairs.
In FY2019 we launched a test project “Health
of communities” in one of the regions where
Kernel leases farmland. Since access to
healthcare services there is limited, we ac-
quired and fully equipped a medical car and
hired a professional doctor, who regularly visits
villages and provides medical services.
While keeping our contributions at a stable siz-
able level, we are changing the spending para-
digm by moving from numerous donations cov-
ering day-to-day communities’ needs to invest-
ing into larger projects with strong long-term
spillover effect. As a part of that, we are pro-
gressing in the advancement of social entrepre-
neurship in rural regions. As an example, one
of our farming clusters helps local municipali-
ties create municipal enterprises, to which Ker-
nel contributes with various machinery and
equipment. Such enterprises then provide ser-
vices to municipalities and local people. As of
the date of this report, we helped to create 6
such enterprises with 33 new jobs created.
Since 2011 we publish and freely distribute
over 60,000 copies of a monthly newspaper to
a rural audience, customized to the region of
our operation. It covers local news, provides
legal and other advice on various topics rele-
vant for rural regions, presents available va-
cancies in the Company’s subsidiaries to-
gether with career success stories, and dis-
closes Kernel’s social and business activities.
Unprecedented by its scale, the project is es-
pecially valuable in remote rural areas where
access to information is limited.
We also contribute to local communities’ de-
velopment indirectly, by creating jobs and op-
portunities there. At the same time, we under-
stand that in the long-term our constant effi-
ciency improvements in farming operations
result in gradual reduction of the full-time
headcount. Through our employees, we are
spreading corporate culture, knowledge and
skills, and leaving other positive footprints in
rural areas we are unable to touch it in other
ways. We are also disseminating best farming
practices, which are quickly adopted by small
neighboring farmers.
Finally, being a responsible taxpayer commit-
ted to full compliance with tax payments, we
indirectly support local communities, as a siz-
able portion of the taxes we pay goes directly
to local budgets. In FY2019, we paid US$ 62
million (UAH 1.7 billion) taxes, a substantial
portion of which was directed to local budgets,
supporting the well-being of local communi-
ties.
As a recognition of our efforts in FY2019, our
charity fund “Together with Kernel” has won the
National Charity Award “Charity Ukraine” in one
of 23 nominations among 964 contestants.
Customer health and safety (GRI 416) Being the largest global producer of sunflower
oil, the largest crop producer in Ukraine and
the largest grain exporter from Ukraine, we
are committed to setting the benchmark in
terms of product quality, guaranteeing the
highest standards of goods we deliver to our
customers. Our impact occurs across all our
business lines, but most significantly in the
oilseed-processing segment, where we touch
the final customer with our bottled sunflower
oil product. Other business lines deliver
mostly commodity-type products or related
services with globally recognized product
quality characteristics.
We maintain a preventive food management
system, targeted at addressing the risk of po-
tential biological, chemical and physical haz-
ards in production processes. It ensures the
traceability of products across the entire value
chain under our control.
All our oilseed processing plants are certified
under the ISO 22000 standard (integrates the
principles of the Hazard Analysis and Critical
Control Point (HACCP) system and applica-
tion of procedures developed by the Codex Al-
imentarius Commission), under quality man-
agement system ISO 9001, and have
GMP+B1 certificates which ensure feed
safety and quality for our protein meal produc-
tion. Food safety systems on our bottling facil-
ities are certified under FSSC 22000. Six our
plants are certified under Kosher, two plants
– under Kosher Passover, one plant under
Badatz and Badatz Passover, and five plants
obtained Halal certification. Three of our
plants are FDA-registered, which opens the
USA market to our bottled sunflower oil. All
our crushing facilities obtained registration al-
lowing for the export of sunflower meal to
China, and one plant obtained the registration
to sell sunflower oil to South Korea. Three of
our companies were certified to sell sunflower
meal to Belarus. Our Bandurka asset is certi-
fied under ISCC EU. Finally, our crushing
plant in Poltava is certified under IFS and suc-
cessfully passed BSCI audit (grade “A”),
which confirmed the corporate social respon-
sibility of our business and simplifies our ac-
cess to retailers in EU.
Our export terminals are certified under ISO
9001 and GMP+B3 (for operations with sun-
flower meal). Our laboratory in Poltava is ac-
credited under ISO 17025 standard, which al-
lows us to widen the scope of the analysis
conducted at our own facilities.
Our trading subsidiaries has GMP+B3,
GMP+B3, B4 and ISCC EU certification.
All our farming subsidiaries meet the ISCC EU
requirements for corn, wheat, soybean, and
………………………………………………………………………………………………………………………………………………… Social spending (GRI 413-1) thousand US$
FY2015 FY2016 FY2017 FY2018 FY2019
Total social spending 1,919 1,668 2,616 2,440 2,303
incl. infrastructure 1,025 749 1,049 760 625
Social spending includes only direct expenses by the Company.
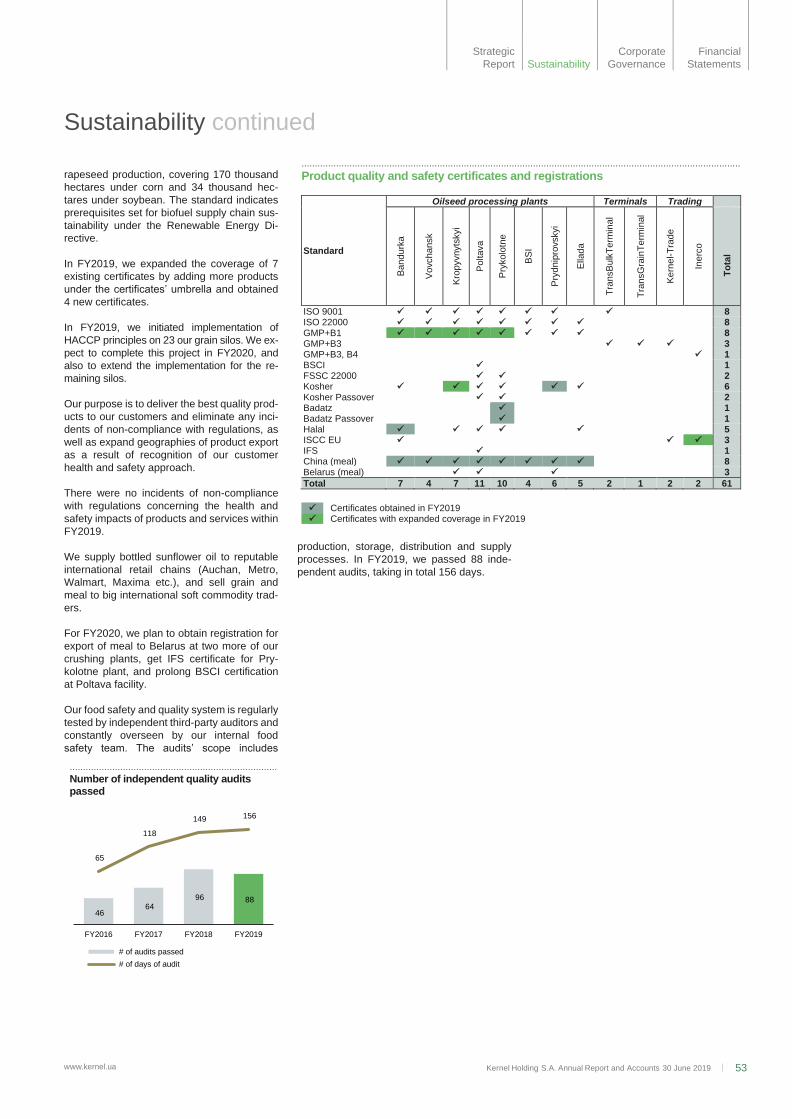
Kernel Holding S.A. Annual Report and Accounts 30 June 2019 53 www.kernel.ua
Sustainability continued
Strategic
Report Sustainability
Corporate
Governance
Financial
Statements
rapeseed production, covering 170 thousand
hectares under corn and 34 thousand hec-
tares under soybean. The standard indicates
prerequisites set for biofuel supply chain sus-
tainability under the Renewable Energy Di-
rective.
In FY2019, we expanded the coverage of 7
existing certificates by adding more products
under the certificates’ umbrella and obtained
4 new certificates.
In FY2019, we initiated implementation of
HACCP principles on 23 our grain silos. We ex-
pect to complete this project in FY2020, and
also to extend the implementation for the re-
maining silos.
Our purpose is to deliver the best quality prod-
ucts to our customers and eliminate any inci-
dents of non-compliance with regulations, as
well as expand geographies of product export
as a result of recognition of our customer
health and safety approach.
There were no incidents of non-compliance
with regulations concerning the health and
safety impacts of products and services within
FY2019.
We supply bottled sunflower oil to reputable
international retail chains (Auchan, Metro,
Walmart, Maxima etc.), and sell grain and
meal to big international soft commodity trad-
ers.
For FY2020, we plan to obtain registration for
export of meal to Belarus at two more of our
crushing plants, get IFS certificate for Pry-
kolotne plant, and prolong BSCI certification
at Poltava facility.
Our food safety and quality system is regularly
tested by independent third-party auditors and
constantly overseen by our internal food
safety team. The audits’ scope includes
production, storage, distribution and supply
processes. In FY2019, we passed 88 inde-
pendent audits, taking in total 156 days.
……………………………………………………………………
Number of independent quality audits passed
46 64
96 88
65
118
149 156
FY2016 FY2017 FY2018 FY2019
# of audits passed
# of days of audit
…………………………………………………………………………………………………………………………………………………
Product quality and safety certificates and registrations
Standard
Oilseed processing plants Terminals Trading
Ba
nd
urk
a
Vo
vch
ansk
Kro
pyvnyts
kyi
Po
ltava
Pry
ko
lotn
e
BS
I
Pry
dn
ipro
vskyi
Ella
da
Tra
nsB
ulk
Te
rmin
al
Tra
nsG
rain
Te
rmin
al
Kern
el-T
rad
e
Ine
rco
To
tal
ISO 9001 ✓ ✓ ✓ ✓ ✓ ✓ ✓ ✓ 8 ISO 22000 ✓ ✓ ✓ ✓ ✓ ✓ ✓ ✓ 8 GMP+B1 ✓ ✓ ✓ ✓ ✓ ✓ ✓ ✓ 8 GMP+B3 ✓ ✓ ✓ 3 GMP+B3, B4 ✓ 1 BSCI ✓ 1 FSSC 22000 ✓ ✓ 2 Kosher ✓ ✓ ✓ ✓ ✓ ✓ 6 Kosher Passover ✓ ✓ 2 Badatz ✓ 1 Badatz Passover ✓ 1 Halal ✓ ✓ ✓ ✓ ✓ 5 ISCC EU ✓ ✓ ✓ 3 IFS ✓ 1 China (meal) ✓ ✓ ✓ ✓ ✓ ✓ ✓ ✓ 8 Belarus (meal) ✓ ✓ ✓ 3
Total 7 4 7 11 10 4 6 5 2 1 2 2 61
✓ Certificates obtained in FY2019 ✓ Certificates with expanded coverage in FY2019

Kernel Holding S.A. Annual Report and Accounts 30 June 2019 54 www.kernel.ua
Sustainability continued
Strategic
Report Sustainability
Corporate
Governance
Financial
Statements
GRI Content Index In accordance with the GRI Standards: Core option
GRI Disclosure Reference (page) or direct response
101: Foundation 2016
102: General Disclosures 2016
1. Organizational profile
102-01 Name of the organization Kernel Holding S.A.
102-02 Activities, brands, products, and services Our business model (p.7), Kernel at a Glance (p. 8), brands (p. 8), website
102-03 Location of headquarters Kyiv, Ukraine
102-04 Location of operations Key Kernel assets are in Ukraine (p.8)
In Russia, Kernel has a 50% stake in Taman grain export terminal as a JV
with Glencore, but we do not operate it solely for our benefit and have limited
control over it. Therefore, this asset is not included in the scope of this Sus-
tainability Report.
102-05 Ownership and legal form Group structure (p. 61), Share capital and significant shareholdings (p. 61)
102-06 Markets served • Geographic locations: sunflower oil sold in bulk (p. 15), bottled sun-flower oil (p. 15), grain export markets (p.21)
• Sectors served: food and agriculture
• Types of customers and beneficiaries: global soft commodity traders and processors of agricultural commodities, feed compounders, retail chains and distributors.
102-07 Scale of the organization • Total number of employees: (p. 48)
• Total number of operations: three business segments: Oilseed Pro-cessing, Infrastructure and Trading, Farming (see p.7)
• Net sales: key highlights (p.11)
• Total capitalization: market capitalization (p. 10; for updated figures please see Kernel profile on Warsaw Stock Exchange website); credit metrics (p. 12)
• Quantity of products or services provided: Kernel at a Glance (p. 8)
102-08 Information on employees and other workers a. Human capital indicators (p. 48)
b. Human capital indicators (p. 48)
c. Human capital indicators (p. 48)
d. Workers who are not employees perform insignificant portion of activities
e. Significant variations in the numbers includes only seasonal variations of
employees in Kernel farming business, which does not exceed 5% of total
headcount.
f. Data compiled by Kernel employee accounting system
102-09 Supply chain • Our Business Model (p.7)
• Types of suppliers: independent farmers-suppliers of grain and oilseeds, suppliers of inputs to crop production (seeds, fertilizers, crop protection agents, fuel), suppliers of other inputs (natural gas, energy)
102-10 Significant changes to the organization and its sup-
ply chain
Significant changes to the organization: Note 1 to the Consolidated Fi-
nancial Statements (p. 79), Oilseed Processing (p. 13), Infrastructure and
Trading (p. 19), Farming (p. 25)
There were no significant changes to Kernel supply chain in FY2019. 102-11 Precautionary Principle or approach The Group’s entities apply the Precautionary Principle through maintaining
compliance with the Law of Ukraine on Environmental Impact Assessment
(EIA), that has been adopted in 2017 as a part of Ukraine’s commitment to
harmonize domestic legislation with the EU requirements, specifically
DIRECTIVE 2011/92/EU. The law establishes principles and mechanisms of
integration of environmental considerations into a decision-making process
for economic activities that may have material environmental impacts. The
EIA is carried out at a planning phase, prior to commencement of the activi-
ties (such as construction), and includes preparation and public disclosure
of an EIA Report, public consultations, scrutiny and conclusion by the com-
petent authority. In FY 2019, following requirements of the law:
• 9 EIA procedures have been initiated by the Group’s farming enterprises (2), crushing plants (5), and sea terminals (2)
• 2 Environmental Impact Assessment reports for the Group’s planned de-velopments have been prepared by qualified consultants

Kernel Holding S.A. Annual Report and Accounts 30 June 2019 55 www.kernel.ua
Sustainability continued
Strategic
Report Sustainability
Corporate
Governance
Financial
Statements
GRI Disclosure Reference (page) or direct response
• 1 Public consultation sessions have been held
• 1 Conclusions On EIA have been issued by competent authorities, based on examination of EIA reports and inputs collected in the course of public consultations.
102-12 External initiatives Kernel endorses the following externally-developed economic, environmen-
tal and social charters, principles, and other initiatives:
• International Labour Organization's Fundamental Principles and Rights at Work;
• United Nations Global Compact (UNGC);
• United Nations Universal Declaration of Human Rights;
• Carbon Disclosure Project (CDP);
• Global Reporting Initiative (GRI).
102-13 Membership of associations Kernel, through its subsidiaries, is a member of several industry associations
in Ukraine, including:
• European Business Association (incl. Logistics Committee);
• American Chamber of Commerce;
• Ukrainian Grain Association;
• Ukrainian Agrarian Association;
• U.S.-Ukraine Business Council;
• Federation of Oils, Seeds and Fats Associations;
• Grain and Feed Trade Association;
• UkrOliyaProm;
• Ukrainian Network of Integrity and Compliance.
2. Strategy
102-14 Statement from senior decision-maker Chairman's speech (p. 5)
Our approach (p. 39)
3. Ethics and integrity
102-16 Values, principles, standards, and norms of behavior Our values and principles (p. 41)
Business ethics and compliance section on our website
4. Governance structure
102-18 Governance structure a. Governance structure of the organization (p. 61)
b. Company does not have a separate committee responsible for decision-
making on economic, environmental, and social topics on the Board of
Directors level. Respective responsibilities are attributable to people in
the management team.
5. Stakeholder engagement
102-40 List of stakeholder groups Key stakeholder groups and engagement channels (p.41)
102-41 Collective bargaining agreements Approximately 94% of total employees were covered by collective bargain-
ing agreements as of 30 June 2019
102-42 Identifying and selecting stakeholders ‘Our approach to materiality and report content' and 'Key stakeholder groups
and engagement channels' on p. 41. Although the frequency of our engage-
ment varies, we are intent on staying engaged with all our stakeholders in
areas of mutual interest
102-43 Approach to stakeholder engagement Key stakeholder groups and engagement channels (p.41)
102-44 Key topics and concerns raised Key stakeholder groups and engagement channels (p.41), Stakeholder in-
clusiveness (p.41). Also discussed throughout this report.
6. Reporting practice
102-45 Entities included in the consolidated financial state-
ments
Notes 1 to the Consolidated Financial Statements (p.79). Certain sustaina-
bility information does not include data for all entities, which is highlighted in
each case
102-46 Defining report content and topic Boundaries An explanation of the process for defining the report content and the topic
Boundaries (p.41).
Implementation of the Reporting Principles for defining report content (p. 41):
• Stakeholder Inclusiveness
• Sustainability Context
• Materiality
• Completeness
• Accuracy
• Balance
• Clarity
• Comparability

Kernel Holding S.A. Annual Report and Accounts 30 June 2019 56 www.kernel.ua
Sustainability continued
Strategic
Report Sustainability
Corporate
Governance
Financial
Statements
GRI Disclosure Reference (page) or direct response
• Reliability
• Timeliness 102-47 List of material topics Topic Boundaries (p.42)
102-48 Restatements of information Restatement carried out in the following standards:
• GRI 305-1, 305-2 Emissions Reason – change in calculation methodology
• GRI 302-1 Energy Reason – change in calculation methodology
• GRI 301-1 Materials Reason – Change in historical data methodology for Associated process
materials / solvents used in oilseed processing
102-49 Changes in reporting There were no significant changes from previous reporting periods in the
list of material topics and topic Boundaries.
102-50 Reporting period Financial year 2019 ended 30 June 2019. See also Note 1 to the Consoli-
dated Financial Statements (p. 79).
102-51 Date of most recent report 22 October 2018, as a sustainability section of the FY2018 annual report
102-52 Reporting cycle Annual
102-53 Contact point for questions regarding the report Michael Iavorskyi, [email protected]; [email protected]
102-54 Claims of reporting in accordance with the GRI
Standards
This report has been prepared in accordance with the GRI Standards: Core
option
102-55 GRI content index p.54
102-56 External assurance FY2019 Sustainability report has not been externally assured.
The Company obtained independent external assurance report for FY2015
Sustainability report. The Company expects to obtain independent assur-
ance report for FY2020 Sustainability report.

Kernel Holding S.A. Annual Report and Accounts 30 June 2019 57 www.kernel.ua
Sustainability continued
Strategic
Report Sustainability
Corporate
Governance
Financial
Statements
GRI Disclosure Reference (page) or direct response
Material topics
Economic performance
103: Management Approach 2016
103-1 Explanation of the material topic and its Boundary Economic performance (p. 43), Strategy (p. 9), Topic boundaries (p. 42).
Also discussed throughout the strategic report. 103-2 The management approach and its components
103-3 Evaluation of the management approach
201: Economic performance 2016
201-1 Direct economic value generated and distributed Economic value generated, distributed and retained (p. 43)
201-4 Financial assistance received from government Note 27 'Other operating income' to the Consolidated Financial Statements
(p. 115).
Indirect Economic Impacts
103: Management Approach 2016
103-1 Explanation of the material topic and its Boundary Indirect economic impact (p. 43), Local Communities (p. 51), Topic bounda-
ries (p. 42). 103-2 The management approach and its components
103-3 Evaluation of the management approach
203: Indirect Economic Impacts 2016
203-1 Infrastructure investments and services supported Local Communities (p. 51)
203-2 Significant indirect economic impacts Indirect economic impact (p. 43)
Anti-corruption
103: Management Approach 2016
103-1 Explanation of the material topic and its Boundary Anti-corruption (p. 43), Topic boundaries (p. 42).
103-2 The management approach and its components
103-3 Evaluation of the management approach
205: Anti-corruption 2016
205-1 Operations assessed for risks related to corruption a. All company’s operations are assessed for risks related to corruption. Fol-
lowing the assessment, company identified 19 risk areas assigning each
specific inherent risk level;
b. Significant risks related to corruption identified through the risk assess-
ment, among other, include:
• obtaining undue benefits, which leads to financial losses and may affect the reputation of the Company;
• conflict of interest;
• combination of work in the Kernel Group of Companies with work for another company or entrepreneurial activities.
205-2 Communication and training about anti-corruption
policies and procedures
a. Kernel anti-corruption policies and procedures have been communicated
to all Kernel governance body members;
b. Kernel anti-corruption policies and procedures have been communicated
to all Kernel employees;
c. Kernel anti-corruption policies and procedures have been communicated
to all Kernel business partners. We have a mandatory anti-corruption
clause in all agreements with business partners, and suppliers are com-
municated with our Code of interaction with suppliers;
d. All Kernel governance body members have received training on anti-cor-
ruption;
e. Total number of employees that have received anti-corruption trainings
since 2018: 2,643 (19.7% of total number of employees). All that employ-
ees are based in Ukraine. Breakdown by category: Executive Manage-
ment Team – 11; heads of departments and structural subdivisions – 90;
Heads of lines and functions – 560; Employees of departments / lines /
functions exposed to high compliance risk – 482; Other employees –
1,500;
205-3 Confirmed incidents of corruption and actions taken a. 74 confirmed incidents of corruption in FY2019 (mostly thefts and frauds
by abuse of position);
b. Total number of confirmed incidents in which employees were dismissed
or disciplined for corruption;
c. There were 25 confirmed incidents in FY2019 when contracts with busi-
ness partners were terminated or not renewed due to violations related to
corruption;
d. We are not aware of public legal cases regarding corruption brought
against the Kernel group and its employees during FY2019.

Kernel Holding S.A. Annual Report and Accounts 30 June 2019 58 www.kernel.ua
Sustainability continued
Strategic
Report Sustainability
Corporate
Governance
Financial
Statements
GRI Disclosure Reference (page) or direct response
Materials
103: Management Approach 2016
103-1 Explanation of the material topic and its Boundary Materials (p. 44), Topic boundaries (p. 42).
103-2 The management approach and its components
103-3 Evaluation of the management approach
301: Materials 2016
301-1 Materials used by weight or volume Principal materials used (p. 45)
Energy
103: Management Approach 2016
103-1 Explanation of the material topic and its Boundary The Company is not subject to any government or industry-specific policy
for energy use, while the renewable energy produced from biomass at the
Company’s sites falls under the legal incentive scheme (feed-in tariff). Man-
agement approach disclosed in 'Energy consumption within the organization'
(p.45), Topic boundaries (p. 42).
103-2 The management approach and its components
103-3 Evaluation of the management approach
301: Energy 2016
302-1 Energy consumption within the organization a-g. Energy consumption (p. 45)
302-3 Energy intensity a. Energy intensity (p. 45);
b. Organization-specific metric (the denominators) chosen to calculate the
energy intensity ratios: volumes of sunflower seeds processed (for
Oilseed Processing Segment), ton-percentages of grain dried (for Infra-
structure and Trading Segment) and volumes of grain and oilseeds pro-
duced (for Farming segment);
c. All the energy consumed by respective business segment (fuel, electric-
ity, heating etc.) was included to calculate the respective energy intensity
ratios;
d. All the ratios use energy consumption within the organization;
Biodiversity
103: Management Approach 2016
103-1 Explanation of the material topic and its Boundary Biodiversity (p. 46), Topic boundaries (p. 42).
103-2 The management approach and its components
103-3 Evaluation of the management approach
304: Biodiversity 2016
304-1 Operational sites owned, leased, managed in, or ad-
jacent to, protected areas and areas of high biodi-
versity value outside protected areas
Biodiversity (p. 46)
Emissions
103: Management Approach 2016
103-1 Explanation of the material topic and its Boundary Environment (p. 43), Topic boundaries (p. 42).
103-2 The management approach and its components
103-3 Evaluation of the management approach
305: Emissions 2016
305-1 Direct (Scope 1) GHG emissions a. Emissions (p. 46)
b. Emissions (p. 46)
c. Emissions (p. 46)
d. Base year not applicable
e. Emissions (p. 46)
f. Emissions (p. 46)
g. Emissions (p. 46)
305-2 Energy indirect (Scope 2) GHG emissions Greenhouse gas emissions (p. 47)
305-4 GHG emissions intensity Greenhouse gas emissions (p. 47)
Employment
103: Management Approach 2016
103-1 Explanation of the material topic and its Boundary Employment (p. 48), Topic boundaries (p. 42).
103-2 The management approach and its components
103-3 Evaluation of the management approach
401: Employment 2016
401-2 Benefits provided to full-time employees that are not
provided to temporary or part-time employees
a. Standard benefits for full-time employees in Ukraine (p. 48). Same bene-
fits are provided to temporary and part-time employees.
b. Ukraine is considered as a significant location of operations for the pur-
poses of GRI 401-2 disclosure.

Kernel Holding S.A. Annual Report and Accounts 30 June 2019 59 www.kernel.ua
Sustainability continued
Strategic
Report Sustainability
Corporate
Governance
Financial
Statements
GRI Disclosure Reference (page) or direct response
Occupational health and safety
103: Management Approach 2016
103-1 Explanation of the material topic and its Boundary Occupational health and safety (Oilseed Processing) (p. 18)
Occupational health and safety (Infrastructure and Trading) (p.24)
Occupational health and safety (Farming) (p.28)
Occupational health and safety (p. 48), Topic boundaries (p. 42).
103-2 The management approach and its components
103-3 Evaluation of the management approach
403: Occupational Health and Safety
403-1 Occupational health and safety management sys-
tem
a. Kernel has implemented an occupational health and safety management
system (OHSMS), in accordance with Ukrainian regulatory requirements.
All crushing plants have implemented OHSMS in line with OHSAS 18001
Standard;
b. OHSMS covers all Kernel employees, activities and workplaces.
403-9 Work-related injuries a. Work-related injuries (p. 50). Main types of work-related injuries include
slips, trips and falls;
b. Not applicable; (insignificant number of such workers)
c. The work-related hazards that pose a risk of high-consequence injury are
mostly physical, as these types of hazards contributed most high-conse-
quence injuries historically and in the reporting period. Hazards are de-
termined reactively as a result of high-consequence injury. Most such
cases occur either because of non-adherence to occupational health and
safety instructions, or because of personal negligence. Therefore, actions
taken to minimize risks of this hazard include more intense training and
instructions on occupational health and safety;
d. Actions taken to eliminate other work-related hazards include, among oth-
ers, installation of alcohol detectors in all company’s industrial and infra-
structure assets and re-design of business processes with high potential
risks;
e. Rates have been calculated based on 1,000,000 hours worked;
f. No workers have been excluded from this disclosure;
g. No other contextual information necessary to understand how the data
have been compiled.
Training and education
103: Management Approach 2016
103-1 Explanation of the material topic and its Boundary Training and education (p. 51), Topic boundaries (p. 42).
103-2 The management approach and its components
103-3 Evaluation of the management approach
404: Training and Education
404-1 Average hours of training per year per employee Training and education (p. 51)
404-2 Programs for upgrading employee skills and transi-
tion assistance programs
a. Training and education (p. 51);
b. Transition assistance programs provided to facilitate continued employa-
bility are described in section “Training and education” (p. 51). We do not
provide any specific transition assistance programs to facilitate manage-
ment of career endings resulting from retirement or termination of employ-
ment, apart from one-off severance payment or retirement benefit.
404-3 Percentage of employees receiving regular perfor-
mance and career development reviews
Talent development (p. 51)
Local communities
103: Management Approach 2016
103-1 Explanation of the material topic and its Boundary Local communities (p. 51), Topic boundaries (p. 42).
103-2 The management approach and its components
103-3 Evaluation of the management approach
413: Local Communities 2016
413-1 Operations with local community engagement, im-
pact assessments, and development programs
Local communities (p. 51), Social spending (p. 52).
We estimate that more than half of our operations (by labor count) are ac-
tively involved in local community engagements, though the frequency and
depth of engagement differs by region.
413-2 Operations with significant actual and potential neg-
ative impacts on local communities
Kernel is not aware of any significant negative impacts on local communities
as a result of its activities.
Customer health and safety
103: Management Approach 2016
103-1 Explanation of the material topic and its Boundary Customer health and safety (p. 52), Topic boundaries (p. 42).
103-2 The management approach and its components

Kernel Holding S.A. Annual Report and Accounts 30 June 2019 60 www.kernel.ua
Sustainability continued
Strategic
Report Sustainability
Corporate
Governance
Financial
Statements
GRI Disclosure Reference (page) or direct response
103-3 Evaluation of the management approach
416: Customer Health and Safety 2016
416-1 Assessment of the health and safety impacts of
product and service categories
We assess health and safety impacts for improvement for all our significant
products.
416-2 Incidents of non-compliance concerning the health
and safety impacts of products and services
There were no incidents of non-compliance with regulations and/or voluntary
code concerning the health and safety impacts of products and services
within the reporting period;

www.kernel.ua Kernel Holding S.A. Annual Report and Accounts 30 June 2019 61
Corporate Governance
Strategic
Report Sustainability
Corporate
Governance
Financial
Statements
Main Characteristics of Kernel Group structure
Kernel Holding S.A. is a public limited liability
company (société anonyme) incorporated on
15 June 2005 under the laws of the Grand
Duchy of Luxembourg (RCS Luxembourg
B109173) and having its registered address
19 Rue de Bitbourg, L-1273 Luxembourg.
Kernel Holding S.A. is a holding entity for the
group of companies (altogether ‘the Group’ or
‘the Company’ or ‘Kernel’) and has its share
listed on the main market of the Warsaw Stock
Exchange (Bloomberg ticker: KER PW) since
November 2007. The list of primary subsidiar-
ies is disclosed on page 79 of this report.
Share capital and significant share-holdings The issued capital of the Kernel Holding S.A.
as of 30 June 2019 consisted of 81,941,230
fully paid ordinary single class shares, all
ranking pari passu and having equal voting
rights and no special control rights attached to
any of the shares.
According to notifications received by the
company, three shareholders owned more
than 5% of Company’s shares as of 30 June
2019:
• Namsen Limited, a legal entity directly con-trolled by the Chairman of the Board of Di-rectors and founder of the business, Mr. An-drii Verevskyi, owning 39.93% of shares;
• Julius Baer Group, controlling between 5% and 10%;
• Cascade Investment Fund, holding be-tween 5% and 10%;
The company held no treasury shares as of 30
June 2019.
As of 30 June 2019, there were 5,150,000 out-
standing options granted to the senior manag-
ers of the Group, of which 3,875,000 were
vested (3,000,000 options at PLN 75 strike
price and 875,000 options at PLN 29.61 strike
price). The remaining 1,275,000 options (at
PLN 29.61 strike price) become vested in De-
cember 2019. Each option provides for the
right to acquire one ordinary share of the
Company.
Corporate governance framework
Kernel is committed to high standards of cor-
porate governance and is subject to the
corporate governance framework determined
by:
• the corporate law of the Grand Duchy of Luxembourg as a place of incorporation (in-cluding voluntary compliance with most of the provisions of the X Principles of Corpo-rate Governance of the Luxembourg Stock Exchange); and
• corporate governance rules set out in the Best Practices of Warsaw Stock Exchange Listed Companies 2016 (“Best Practices”) as a place of shares listing. Kernel complies with most of the standards of “Best Prac-tices”, except for the recommendations in-cluded in items IV.R.2 and the detailed prin-ciples included in items I.Z.1.16, I.Z.1.20, IV.Z.2, VI.Z.4. At the same time, the Board of Directors decided that the recommenda-tions and detailed principles, marked as items II.Z.11, III.Z.6. and IV.R.3 do not ap-ply to the Company. The respective state-ment of compliance is published on Com-pany’s website under section “Board of Di-rectors and Corporate Governance”.
Key internal documents laying out the princi-
ples of corporate governance are Kernel Hold-
ing S.A. Articles of Association and Corporate
Governance Charter, both available on Com-
pany’s website.
In FY2019, Kernel’s efforts in enhancing cor-
porate governance practices were recognized
by EBRD and EIB, as both institutions ap-
proved loans to Kernel following the very gran-
ular inspection of corporate governance, com-
pliance and environmental practices adopted
by the company.
General Meeting of Shareholders General Meeting of Shareholders is the high-
est governance body of the Company, having
the broadest power to order, carry out or ratify
all acts relating to the operations of the Com-
pany. All the details about organizing and
functioning of the general meeting of share-
holders are listed in the Articles of Association
and Corporate Governance Charter, both
published on Company’s website.
The annual general meeting held on 10 De-
cember 2018:
• approved the management report of the Board of Directors, consolidated financial statements of the Company and standalone annual accounts of the Kernel Holding S.A., and the report of the independent auditor for the year ended 30 June 2018;
• granted discharge to the directors of the Company for the exercise of their mandates in FY2018;
• renewed the mandates of seven of the di-rectors and approved the fees of executive and non-executive directors for the year ended 10 December 2019;
• granted discharge to the independent audi-tor and reappointed Deloitte Audit as inde-pendent auditor of the Company for one-year term mandate.
There were no extraordinary meetings of
shareholders of Kernel Holding S.A. in
FY2019.
The next annual general meeting of share-
holders is scheduled for 10 December 2019.
All the documents and resolutions adopted by
the shareholder meetings are available on
Company’s website.
Board of Directors
Company is managed by the Board of Direc-
tors (“the Board”), which is the ultimate deci-
sion-making body, except for the powers re-
served for the general meeting of sharehold-
ers by law, the Articles of Association and the
Corporate Governance Charter. The Board is
vested with the broadest powers to perform all
acts of administration and disposition in com-
pliance with the Company’s corporate pur-
pose. The Board resolves to take its decisions
objectively, in the best corporate interest of
the Company. The Board is collectively re-
sponsible and accountable to the sharehold-
ers for the proper conduct of the business, the
long-term success of the Company, the effec-
tiveness of the reporting system and the cor-
porate governance framework.
……………………………………………………………………
Ownership structure
Shares
owned
%-age
owned
Namsen Limited 32,716,775 39.93%
Other1 49,224,455 60.07%
Total 81,941,230 100.00%
Note 1: including two shareholders controlling between 5% and 10% of total shares: Julius Baer Group and Cascade Investment Fund.
………………………………………………………………………………………………………………………………………............
Governance structure
General meeting of shareholders
Board of Directors
Executive Management Team
Nomination and Remu-
neration Committee Audit Committee

Kernel Holding S.A. Annual Report and Accounts 30 June 2019 62 www.kernel.ua
Corporate Governance continued
Strategic
Report Sustainability
Corporate
Governance
Financial
Statements
……………………………………………………………………………………………………………………………………….............................................................................................................................
Effective and experienced leadership Kernel Holding S.A. is governed by the Board of Directors composing of eight members, including three non-executive independent directors.
Biographical details of the Board as at 30 June 2019 are as follows (with further details available on Company’s website).
Andrii Verevskyi, 45
Chairman of the Board, Founder
Tenure: 12 years
Skills and experience:
Founded the Group’s business in
1995, holding various executive
positions within the Group. Pres-
ently, he oversees the strategic
development and overall man-
agement of the Group.
Nathalie Bachich, 45 Non-executive independent
director
Tenure: 3 years
Skills and experience:
With over 15 years’ experience in
international investment banking,
Nathalie spent the majority of that
time in Equity Capital Markets.
Andrzej Danilczuk, 56 Non-executive independent
director
Tenure: 12 years
Skills and experience:
His rare know-how combines with
a strong understanding of west-
ern corporate culture and modus
operandi and a deep knowledge
of local culture and business
practices in the Black Sea region.
Sergei Shibaev, 60 Non-executive independent
director
Tenure: 7 years
Skills and experience:
Occupied different managerial
roles with international consul-
tancy and financial services firms
including PWC, ING Barings,
Deloitte & Touché and Roland
Berger, among others
Board Committee:
Nomination & Remuneration
Committee
Board Committee:
Nomination & Remuneration
Committee, Audit Committee
Board Committee:
Chairman of the Nomination &
Remuneration Committee, Audit
Committee
Board Committee:
Chairman of the Audit Committee
Yevgen Osypov, 43 Chief executive officer
Tenure: 2 year
Skills and experience:
Mr. Osypov is responsible for the
day-to-day management of the
Company’s subsidiaries, execu-
tion of strategy, budgets, and
Board decisions. He completed
several educational programs in
Harvard Business School.
Anastasiia Usachova, 48 Chief financial officer
Tenure: 12 years
Skills and experience:
Ms. Usachova is responsible for
the overall financial management
of Kernel. She holds an MBA de-
gree from IMD (Switzerland).
Viktoriia Lukianenko, 44 Chief legal officer
Tenure: 12 years
Skills and experience:
Ms. Lukianenko is responsible for
providing legal advice and coun-
seling in all aspects of Kernel’s
business operations.
Yuriy Kovalchuk, 38 Corporate investment director
Tenure: 8 years
Skills and experience:
Mr. Kovalchuk contributes to
strategy formulation and is re-
sponsible for the execution of in-
vestment projects. Yuriy has
been a Fellow with Association of
Chartered Certified Accountants
(FCCA), since September 2013.
Board Committee:
None Board Committee:
None
Board Committee:
None Board Committee:
None

Kernel Holding S.A. Annual Report and Accounts 30 June 2019 63 www.kernel.ua
Corporate Governance continued
Strategic
Report Sustainability
Corporate
Governance
Financial
Statements
The responsibilities of the Board include ap-
proval and review of strategies and policies,
governance of the Company and manage-
ment supervision. More detailed responsibili-
ties are specified in Company’s Corporate
Governance Charter.
All Directors are equally accountable for the
proper stewardship of the Company’s affairs.
The non-executive directors have a responsi-
bility for ensuring that the business strategies
proposed are fully discussed and critically re-
viewed. This enables the Directors to promote
the success of the Company for the benefit of
its shareholders, while having regard to,
among other matters, the interest of employ-
ees, the fostering of business relationships
with customers, suppliers and other stake-
holders, as well as promoting the impact of the
Company’s operations on the communities
and the environment in which the business op-
erates.
The Board approves every investment, divest-
ment, acquisition, disposal and funding trans-
action exceeding in value 5% of average 12
months trailing daily market capitalization of
the Company.
Board composition
The Board is composed of 8 directors, of
which 5 executive (including a Chairman) and
3 non-executive independent directors. There
were no changes in the composition of the
Board in FY2019.
The non-executive directors are experienced
and influential individuals from a range of in-
dustries and countries with an appropriate mix
of skills and business experience to contribute
to the proper functioning of the Board and its
Committees.
The mandate of the Chairman expires at the
annual general shareholder meeting in De-
cember 2020. The mandates of all other direc-
tors expire at the annual general shareholder
meeting in December 2019.
Nomination and Remuneration Committee
regularly review the composition of the Board
to ensure that the Board has an appropriate,
diverse and balanced mix of competences,
skills, experience, background and knowledge
of the Company’s affairs. Key principles gov-
erning the processes of nomination, appoint-
ment and re-election of Directors are de-
scribed in the Company’s Corporate Govern-
ance Charter, published on Kernel’s website.
Board diversity
Diversity among Directors makes the Board
high-performing and efficient, serving the best
interests of the Company’s key stakeholders.
The Company benefits from nationality, gen-
der, age, experience and industry expertise
diversity among Directors. The diversity within
the Board is enhanced by Kernel’s Equality,
Diversity and Inclusion Policy, which was
adopted in 2018. The policy is on constant ba-
sis considered by the Nomination and Remu-
neration Committee of the Board and Execu-
tive Management Team when making em-
ployee and management appointment deci-
sions.
Directors consider the diversity among Board
members while evaluating the Board’s effec-
tiveness.
During the annual Board evaluation process
conducted in FY2019, most directors recog-
nized the sufficient range of expertise, atti-
tudes and external relationships within the
Board members.
Directors’ independence
Each non-executive director annually pro-
vides the other members of the Board with a
statement of meeting the independence crite-
ria indicated in Annex II of the European Com-
mission Recommendation of 15 February
2005. The statements are published on Com-
pany’s website.
As per statements received in August 2019,
all non-executive directors meet the inde-
pendence criteria.
Conflict of interest A Corporate Governance Charter adopted in
May 2018 pays special attention to disclosing
conflicts of interests among Board members.
Any Director having a direct or indirect conflict
of interest must inform the Board thereof and
shall refrain from deliberating or voting on the
relevant item of the agenda. Any conflict of in-
terest should be properly declared and docu-
mented.
Members of the Board shall refrain from pro-
fessional or other activities which might cause
a conflict of interest or adversely affect their
reputation as members of the governing bod-
ies of the Company, and where a conflict of
interest arises, immediately disclose it.
The following non-exhaustive list is an exam-
ple of the duties that shall be followed by the
Directors:
• duty not to accept any benefits from third parties, which may give rise to a personal financial interest and/or gain;
• duty to disclose any interest in a proposed transaction or arrangement with the Com-pany and a separate and independent duty to disclose any arrangement with the Com-pany; and
• duty to avoid conflicts of interest unless au-thorized.
There were no cases of conflict of interest
among Directors declared over the course of
FY2019.
As of August 2019, non-executive directors
occupied the following positions in companies
outside the Group:
• Mr. Shibaev is an Independent Director and Audit Committee Chair at RESO Garantia, an Independent Director and Audit Commit-tee Chair at Bank Zenit, an Independent Di-rector and Audit Committee Chair at Katren.
• Mr. Andrzej Danilczuk is a Director at Koepta Brokers Sarl and a Director at Agroil S.A.
• Ms. Nathalie Bachich does not occupy po-sitions in companies outside the Group.
……………………………………………………………………………………………………………………………………….........................................................................................................................
Composition of the Board of Directors as of 30 June 2019
63%
38%
MaleFemale
Gender
13%
63%
25%
30-40
40-50
50+
Age
25%
25%
50%
less than 5 years
5-10 years
more than 10 years
Tenure

Kernel Holding S.A. Annual Report and Accounts 30 June 2019 64 www.kernel.ua
Corporate Governance continued
Strategic
Report Sustainability
Corporate
Governance
Financial
Statements
Board committees
The Board has two committees appointed
amongst its members:
• Audit Committee;
• Nomination & Remuneration Committee (hereinafter “N&R Committee”);
The Board believes this structure is sufficient
enough to ensure its efficient performance of
duties and tasks, as certain specific matters
are heard first by specialized bodies with ex-
plicit professional experience, and only then
considered by the Board.
Following the regular annual review in
FY2019, the Board does not see a necessity
to establish new committees.
Board self-evaluation
Following the best standards of corporate
governance, the Board regularly undertakes a
formal self-evaluation of its performance and
effectiveness as a collective body, operating
efficiency, composition, organizational struc-
ture, compliance with the rules of good gov-
ernment and relationship with the executive
management and other stakeholders. The
survey conducted in FY2019 identified no ma-
jor issues with regards to the items mentioned
above. Board recognized the quality and time-
liness of the information provided to the
Board, quality of Board practices and meet-
ings, appropriate composition of the Board,
adequate Board roles and responsibilities,
proper established committee practices etc.
Corporate secretary and independent advice
All directors can consult with the corporate
secretary. The corporate secretary is availa-
ble to provide assistance and information on
governance, corporate administration and le-
gal matters as appropriate. Directors may also
seek advice on such matters, or on other busi-
ness-related matters relating to the perfor-
mance of his duties, directly from independent
professional advisors, if so desired, at the
Company’s expense.
Board activity report The Board held 7 scheduled meetings in
FY2019, of which 2 where physical meetings
in Luxembourg in 5 meetings were via tele-
conference, with an average attendance rate
of 84%.
Typically, at each meeting, the Chairman of
the Board, together with the Chief Financial
Officer, report on strategy implementation,
present recent developments and manage-
ment accounts. The workplan of the Board for
FY2019 included, among others, the following
items:
• review of Company’s mid-term strategy and
approval of budget;
• review and approval of annual, semi-annual and quarterly accounts; review of opera-tions updates;
• review of management accounts and fi-nancing transactions;
• review of the progress of implementation of corporate governance best practices;
• supervision of the risk management pro-cess: approval of top risks for the Company and mitigation plan, review of reports on top risks mitigation activities; update on imple-menting the risk management system; re-view of risk limits. In particular, in FY2019 the Board approved Kernel Risk Manage-ment Policy;
• updates from Audit Committee and N&R Committee;
• various ad-hoc items (M&A updates, up-dates on market situation, Avere perfor-mance review).
Over the course of FY2019, the Board also
approved financing and M&A transactions and
amended Corporate Governance Charter via
circular resolutions.
Accountability and audit Going concern The Group’s business activities, together with
the factors affecting its performance, position
and future development are set out in the stra-
tegic report on pages 7-29. The financials of
the group, its liquidity position, borrowing fa-
cilities and applicable terms are described in
the financial statement’s accounts.
Current economic conditions have fostered
the development of a number of risks and un-
certainties for the Company, in particular in re-
gard to global soft commodity prices and har-
vest expectations. Details can be seen in the
Risks and Uncertainties section of this report,
pages 30-34.
Directors have reviewed the current and pro-
jected financial position of the Company, mak-
ing reasonable assumptions about the future
trading and production performance, as well
as debt requirements.
The results show that the Company should be
able to operate within the levels of its available
capital. Therefore, the Board has a reasona-
ble expectation that the Company has
adequate resources to continue in operational
existence for the foreseeable future. Accord-
ingly, the Board continues to adopt the going
concern basis in preparing the annual report
and accounts.
Takeover disclosure
The Company’s shares are in electronic form
and are freely transferable, subject only to the
provisions of law and the Company’s Articles
of Association. There are no agreements be-
tween the Company and its employees or di-
rectors providing for compensation of the loss
of office or employment (whether through res-
ignation, purported redundancy, or otherwise)
that would occur because of a takeover bid.
Options granted under management incentive
plans incorporate accelerated vesting in the
event of a takeover.
The Company in the ordinary course of busi-
ness has entered into various agreements
with customers and suppliers around the
world. Some of the Company’s borrowing
agreements, which either by their nature or
value may represent significant agreements,
do provide for the right of termination upon a
change of control of the Company. The com-
mercial sensitivity of these agreements pre-
vents their details from being disclosed.
Except for the preceding disclosure, there are
no other significant agreements to which the
Company is a party that take effect, alter, or
terminate upon a change of control following
a takeover of the Company.
Audit Committee
The Audit Committee is a continuously oper-
ating collective body of the Board. It consists
of three members including a chairman, all of
whom are non-executive independent direc-
tors. The members have competence in ac-
counting and audit, and the competence rele-
vant to the sector in which the company is op-
erating. The Audit Committee is fully capable
of overseeing the affairs of the Company in
the areas of adequacy and effectiveness of
the Kernel’s system of financial reporting, in-
ternal controls and risk management.
The functioning and key responsibilities of the
Audit Committee are described in the Articles
of Association, and further specified in the
Corporate Governance Charter. Both
………………………………………………………………………………………………………………………………………..............
Remuneration of the Board of Directors US$ thousands
FY2015 FY2016 FY2017 FY2018 FY2019
Chairman of the Board 117 200 200 250 200 Three non-executive Directors 250 264 269 268 260 Four executive Directors 50 44 40 50 40
Total Board of Directors 417 508 509 568 500
Excluding reimbursement of travelling expenses incurred by Directors in performing their duties

Kernel Holding S.A. Annual Report and Accounts 30 June 2019 65 www.kernel.ua
Corporate Governance continued
Strategic
Report Sustainability
Corporate
Governance
Financial
Statements
documents available on Company’s website.
Audit Committee activity report The Audit Committee had 5 meetings in
FY2019, of which 2 were physical meetings in
Luxembourg and 3 were meetings via telecon-
ference. Most members of the Audit Commit-
tee attended all the meetings of the committee
over the reported period. Chief Executive Of-
ficer, Chief Financial Officer, head of internal
audit and compliance officer were invited to all
the meetings of the Audit Committee. CFO at-
tended all the meetings of the Audit Commit-
tee, head of internal audit and compliance of-
ficer attended 80% of meetings each. All the
meetings were also attended by representa-
tives of the Company’s external auditor,
Deloitte. During its meetings, Audit Committee
had one closed session with the external au-
ditor and one with the internal auditor to com-
municate without the presence of executives.
Additionally, decisions of the Audit Committee
were taken via 5 circular resolutions signed
over the course of FY2019.
To execute its key functions and discharge its
responsibilities as outlined in the Corporate
Governance Charter, the Committee, during
FY2019:
• assisted the Board in monitoring the reli-ability and integrity of the financial infor-mation provided. The Committee re-viewed the quarterly, semi-annual and an-nual financial reports, reviewed critical ac-counting policies and management esti-mates, among other things;
• conducted oversight over the perfor-mance of the internal audit function, in-cluding the review of the internal audit ac-tivities and action plans and reports. To fur-ther enhance the internal audit function, Au-dit Committee approved the Internal Audit Charter. The committee had one meeting with the Head of Internal Audit of the Com-pany without the presence of executives;
• conducted oversight over the perfor-mance of the external audit function in-cluding review of the annual audit plan and scope of semiannual accounts review and areas of focus, review of auditor reports, presentations and additional auditors re-port, management letter review. The Audit Committee had one face-to-face discussion with the external auditors in the absence of executives. The Audit Committee moni-tored the fee cap of non-audit services, and review of the contract with auditors (includ-ing review of expected fees for the audit and consulting services) and independence of external auditor;
• conducted oversight over the risk man-agement function. The Audit Committee assisted the Board in the discharge of its risk management responsibilities, monitor-ing and examining the effectiveness of the Company’s internal control and risk
monitoring system; reviewing top risks, risk mitigation plans and results of risk mitiga-tion activities, overseeing group risk man-agement procedures; reviewing trade man-agement position risk mitigation activities (including Avere). The Audit Committee also reviewed Kernel group-wide business continuity plan (including Avere IT business continuity plan);
• conducted oversight over the compliance function, including implementation of the Corporate Governance Charter provisions, compliance with good corporate govern-ance practices with respect to the function-ing of the Audit Committee, and reviewing reports from Kernel Compliance Officer on the progress achieved in the enhancement of Company’s compliance function;
• discussed various ad-hoc items, includ-ing communications with Commission de Surveillance du Secteur Financier.
After each meeting, the chairman of the Audit
Committee reports to the Board on key mat-
ters.
Over the course of FY2019 Audit Committee
conducted annual self-evaluation procedure,
which indicated potential areas of Audit Com-
mittee performance and activities improve-
ment and resulted in clear action plan based
on results of the self-evaluation procedure.
Exercising its right to obtain independent pro-
fessional advice, granted by the Corporate
Governance Charter, Audit Committee re-
ceived in FY2019 professional advice from le-
gal advisor with respect to correspondence of
Audit Committee activities to the EU audit
market reform.
Internal audit As an integral part of the system of internal
control, the Company established an internal
audit division headed by an experienced pro-
fessional reporting directly to the Audit Com-
mittee and to the CEO of the Company as a
chairman of the Risk Committee within the Ex-
ecutive Management Team and working
closely with the Board.
The Internal Audit shall provide independent
and objective assurance and consulting ser-
vices in the areas of internal controls and risk
management, aimed at improving the opera-
tions and performance of the Company and its
subsidiaries.
The independence rules defined in generally
accepted international standards of the pro-
fessional internal audit practice apply to mem-
bers of internal audit division.
Main responsibilities of internal audit are:
• to maintain continuous support for the
Directors on the operational risk manage-ment, internal controls and mitigation activ-ities by undertaking regular or ad hoc re-views;
• to provide independent and objective eval-uation of effectiveness and efficiency of in-ternal control systems within operational framework of the Company;
• to assist personnel and management of the Company in improving the effectiveness of risk identification and internal control sys-tems in operations; advise and consult them regarding how to effectively execute their responsibilities, including recommen-dations on specific improvements in poli-cies and procedures; and
• to assist in open and two-way communica-tion among internal and external auditors, management and personnel, Audit Commit-tee and the Board.
External auditor
Deloitte Audit S.a.r.l. (“Deloitte”), with its reg-
istered office at 560 rue du Neudorf, L-2220
Luxembourg and register number B 67 895
with the Luxembourg Trade and Companies’
Register, acts as an external auditor of Ker-
nel’s consolidated and standalone accounts
since FY2012. Annual general meeting of
shareholders held on 10 December 2018 ap-
pointed Deloitte as Kernel’s external auditor
also for the year ended 30 June 2019. In com-
pliance with the EU statutory audit legislation
requirement for key audit partners to rotate af-
ter a maximum of seven years, new Deloitte
partners led Kernel’s external audit process
starting from FY2019.
Deloitte attended all four meetings of the Audit
Committee in FY2019, presenting the results
of the annual audit, additional auditor’s report,
management letter, review of the semi-annual
accounts and audit plan for FY2019 among
other things. Audit Committee also had one
meeting with Deloitte without presence of the
executives. The Audit Committee review and
monitor the level of fees paid by the Company
to external auditor, preapprove permissible
non-audit services and monitor the cap on
non-audit fees.
Audit fees in FY2019 amounted to US$ 659
……………………………………………………………………..
External auditor’s fees
US$ thousand
432 500 534 495 659
33 18 6
-
-465
518 540 495
659
FY2015 FY2016 FY2017 FY2018 FY2019
Non-audit services Audit fees

Kernel Holding S.A. Annual Report and Accounts 30 June 2019 66 www.kernel.ua
Corporate Governance continued
Strategic
Report Sustainability
Corporate
Governance
Financial
Statements
thousand, as compared to US$ 495 thousand
in FY2018. Like in FY2018, external auditors
were not providing Kernel with non-audit ser-
vices in FY2019.
Nomination and remuneration Compensation principles
The Company’s compensation policies and
management incentive plans reward perfor-
mance, sustainable growth and long-term
value creation for all stakeholders. Remuner-
ation programs for the Board and Executive
Management Team are competitive, internally
equitable and straightforward.
The compensation of the Board for execution
of Directors’ duties consists of fixed fees, with-
out any performance-based variable compo-
nent, pension, retirement or similar benefits
provided by the Company. This ensures a cer-
tain degree of independence when it comes to
fulfilling the Board’s duties towards the Exec-
utive Management Team. On top of that, Di-
rectors are reimbursed for certain travel, hotel
and other expenses related to the exercise of
their duties. The fees paid to the independent
directors and the fees paid to executive direc-
tors are approved at the annual general
shareholders’ meeting.
Compensation of the Executive Management
Team is based on a pay-for-performance prin-
ciple, rewarding sustainable growth and long-
term value creation for shareholders. A signif-
icant portion of remuneration comes from a
variable part depending on Company’s perfor-
mance. For details, please see the figure be-
low.
The remuneration of the Executive Manage-
ment Team is proposed by the Chairman of
the Board in accordance with the remunera-
tion policies and incentive plans drawn up by
the N&R Committee and is reviewed and, if
necessary, adjusted by the N&R Committee
on an annual basis. The Board shall approve
any long-term management incentive plan.
Remuneration policies and incentive plans, as
well as amounts, are reviewed by the N&R
Committee on an annual basis and, if re-
quired, adjusted by the Board.
Members of the executive management team
are not granted any pension, retirement or
similar benefits provided by the Company,
apart from those required by the law.
The Company believes that remuneration pol-icy strongly contributes to the long-term shareholder value creation and the company’s stability.
Nomination and Remuneration Com-mittee
The Nomination and Remuneration commit-
tee is a continuously operating collective body
of the Board. It is established from amongst
the members of the Board and consists of
three members, including a chairman elected
by the members of the N&R Committee
amongst themselves. The majority of the
members of the N&R Committee (including
the chairman) are independent nonexecutive
Directors.
The role of the N&R Committee is to assist the
Board in fulfilling its responsibilities by review-
ing, advising and making recommendations to
the Board, the Chairman and the CEO on the
nomination to the Board and Executive Man-
agement Team and their remuneration. The
N&R Committee assists the Board in nominat-
ing and assessing candidates for both direc-
torship and managerial positions, establishing
and reviewing the compensation principles
and strategy. N&R Committee also supports
the Board in preparing the Board’s remunera-
tion proposals to the shareholders’ general
meeting. A detailed list of N&R Committee re-
sponsibilities in available in Corporate Gov-
ernance Charter, published on Company’s
website.
Nomination and Remuneration Com-mittee’s activity report The N&R Committee held two scheduled
meetings during the reporting period, discuss-
ing the composition of the Board, performance
of the CEO and the Executive Management
Team, changes within key management per-
sonnel, and settled on the management com-
pensation for FY2019 standing at US$ 5,518
thousand (including a short-term variable bo-
nus of US$ 3,099 thousand) for 12 key exec-
utives, as compared to the total compensa-
tion of US$ 3,294 thousand (including a bonus
of US$ 827) a year ago for 12 executives.
There were no new management incentive
plans approved over FY2019, and no signifi-
cant amendments to the Executive Manage-
ment Team remuneration policy in FY2019.
Executive Management Team
The Executive Management Team is respon-
sible for the overall financial and operating re-
sults of the Company’s subsidiaries, heading
operating segments and providing support
functions on a daily basis. The Executive Man-
agement Team focuses on strategy imple-
mentation, financial and competitive perfor-
mance, commercial and technological devel-
opments, succession planning and organiza-
tional development.
………………………………………………………………………………………………………………………………………...................
Compensation structure of the Executive Management Team
Base salary
The fixed part of the compensation is determined at the discretion of the
Board considering the respective position and the individual profile of
the manager in terms of qualifications, skill set, and experience. All
amounts are fixed and paid in cash, monthly.
Short-term variable bonus
The annual variable monetary bonus is calculated as a percentage of
the EBITDA less the financial expenses, with exact parameters deter-
mined by the Nomination & Remuneration Committee. A minimum
threshold level is required to activate the pay-out. The bonus rewards
for the short-term financial performance of the Company.
Long-term manage-ment incentive plan
A management incentive plan is a reward for performance of the Com-
pany over the long-term period and shall align the interests of the Exec-
utive Management Team with those of the shareholders by delivering a
substantial portion of share options in the Company as compensation.
The plan is duly reviewed by the Nomination & Remuneration Commit-
tee and approved by the Board. Each option is granted non-vested, with
a vesting period from three to five years, carrying no rights to dividends
and voting, and to be executed in cash.
………………………………………………………………………………………………………………………………………..............
Remuneration of the Executive Management Team US$ thousands
FY2015 FY2016 FY2017 FY2018 FY2019
Total remuneration 8,564 6,476 5,699 3,294 5,518
Base salary 2,564 2,276 2,409 2,467 2.419
Short-term variable bonus 6,000 4,200 3,290 827 3,099
# of executive managers 14 10 10 12 12

Kernel Holding S.A. Annual Report and Accounts 30 June 2019 67 www.kernel.ua
Corporate Governance continued
Strategic
Report Sustainability
Corporate
Governance
Financial
Statements
The Executive Management Team is headed
by the Chief Executive Officer (the “CEO”),
who is appointed and removed by the Board
and report directly to the latter. The role of the
CEO has been established in FY2018. The
CEO is responsible for the day-to-day man-
agement of the Company’s subsidiaries, exe-
cution of strategy, budgets, and Board deci-
sions. The CEO delegates his/her responsibil-
ities to other members of the Executive Man-
agement Team.
The Executive Management Team consists of
12 professionals including CEO. All the mem-
bers of the Executive Management Team
other than CEO are appointed and removed,
as applicable, by the Board upon proposal by
the N&R Committee after prior consultation
with the CEO, save where he is subject of the
procedure. The full list of the members of the
Executive Management Team, including short
biographies for each member is available on
the Company’s website.
Responsibilities of the Executive Manage-
ment Team are described in more detail in
Company’s Corporate Governance Charter,
available on Company’s website.
There are various committees operating on
the Executive Management Team level: Stra-
tegic Committee, Investment Committee,
Trade Committee, with executive directors
In FY2019, Executive Management Team cre-
ated a risk committee with CEO of the Com-
pany acting as a chairman of this committee.
The responsibilities of the committee include,
among others, the implementation of the risk
management policy and procedures together
with development and continual improvement
of an effective risk management system. See
more details in section Risk management sys-
tem.
Compliance system In December 2016, Kernel initiated a Corpo-
rate Compliance Program (“CCP”) – an ac-
tion plan of bringing Company’s compliance
system in accordance with best international
standards. Progress on CCP implementation
was monitored each quarter by Baker Tilly,
with final report presented in summer 2019,
after completion of the CCP in June 2019.
Baker Tilly recognized a significant progress
achieved in the implementation of Kernel’s
Compliance Program due to the actual execu-
tion of both internal and external control activ-
ities, highlighting also the aspects for further
continuous improvement.
Our efforts in enhancing corporate govern-
ance and compliance practices were recog-
nized by such reputable institutions as
European Investment Bank and EBRD, which
provided Kernel with financing over the course
of FY2019 after a very granular inspection of
corporate governance, compliance and envi-
ronmental practices adopted by the company.
Since 2017, compliance function within Kernel
is headed by a dedicated Compliance Officer,
who reports directly to CEO and Audit Com-
mittee of the Board, as well as attends all Au-
dit Committee meetings.
Compliance at Kernel is focused on the follow-
ing areas:
• preventing fraud, corruption and other misconduct (see details in section Anti-cor-ruption and anti-fraud);
• managing risk of cooperation with unre-liable counterparties and international sanctions. We improved the process of checking our contractors for sanctions risk in FY2019. Compliance officer and security department check business partners for compliance risks: sanctions, corruption, money-laundering, terrorism financing;
• making company activities compliant with various external initiatives (GDPR, equal-ity, diversity, and inclusion initiatives, etc.).
Compliance risks are generally assessed
among other risks in Kernel risk management
system.
In FY2019 Kernel became a member of
Ukrainian Network of Integrity and Compli-
ance (UNIC), thus publicly committing itself to
promoting the UNIC’s principles of doing busi-
ness ethically and responsibly, supporting a
good business reputation and constantly im-
proving the integrity standards in accordance
with the best international practices.
Investor Relations Kernel constantly put efforts on establishing
adequate and efficient communication with
shareholders, bondholders and other capital
providers and targets the expansion of inves-
tors base.
The means for that include:
• non-deal roadshows. We had two NDRs in FY2019 after publication of annual and
semiannual reports, meeting equity and credit investors in Poland, Western Europe and Scandinavia, USA and Canada;
• investor conferences. In FY2019, we met with equity and debt investors at 12 confer-ences in Europe and USA, organized by Auerbach Grayson, WOOD, J.P. Morgan, Bank of America Merrill Lynch, Citi, PKO BP, Erste, Dragon Capital, Goldman Sachs, and HSBC. Of that, 3 conferences we at-tended for the first time. The full list of con-ferences is published on our website;
• regular annual Investor Days. In May 2019, Kernel organized for investors a 3-day visit to company assets (farming clus-ter, silo, 2 oilseed processing plants, and export terminal) and a meeting with top management in Kyiv office;
• ad-hoc meetings and calls with investors;
Company is covered by 7 sell-side equity an-
alysts and 3 credit analysts (full list published
on our website).
All reports, presentations and other materials
are available to stakeholders on the Com-
pany’s website https://www.kernel.ua/.
………………………………………………………………………………………………………………………………………...............
Kernel Holding S.A. Investor Calendar
Q1 FY2020 Operations Update 22 October 2019
Q1 FY2020 Financial Report 27 November 2019
Annual general shareholders’ meeting 10 December 2019
Q2 FY2020 Operations Update 21 January 2020
H1 FY2020 Financial Report 28 February 2020
Q3 FY2020 Operations Update 23 April 2020
Q3 FY2020 Financial Report 29 May 2020
Q4 FY2020 Operations Update 20 July 2020
FY2020 Financial Report 30 October 2020

www.kernel.ua Kernel Holding S.A. Annual Report and Accounts 30 June 2019 68
Independent Auditor’s Report
Strategic
Report Sustainability
Corporate
Governance
Financial
Statements
To the Shareholders of
Kernel Holding S.A.
19, rue de Bitbourg
L-1273 Luxembourg
INDEPENDENT AUDITOR’S REPORT
REPORT OF THE REVISEUR D’ENTREPRISES AGREE
Opinion We have audited the consolidated financial statements of Kernel Holding S.A. (the “Company”) and its subsidiaries (the “Group”), which comprise
the consolidated statement of financial position as of 30 June 2019, the consolidated statement of profit or loss and the consolidated statement of
profit or loss and other comprehensive income for the year then ended, the consolidated statement of changes in equity and the consolidated
statement of cash flows for the year then ended, and notes to the consolidated financial statements, including a summary of significant accounting
policies.
In our opinion, the accompanying consolidated financial statements present fairly, in all material respects, the consolidated financial position of the
Group as of 30 June 2019, and its consolidated financial performance and its consolidated cash flows for the year then ended in accordance with
International Financial Reporting Standards (“IFRSs”) as adopted by the European Union.
Basis for opinion We conducted our audit in accordance with the EU Regulation N° 537/2014, the Law of 23 July 2016 on the audit profession (Law of 23 July 2016)
and with International Standards on Auditing (ISAs) as adopted for Luxembourg by the “Commission de Surveillance du Secteur Financier” (CSSF).
Our responsibilities under those Regulation, Law and standards are further described in the “Responsibilities of “Réviseur d’Entreprises Agréé” for
the Audit of the Consolidated Financial Statements” section of our report. We are also independent of the Group in accordance with the Interna-
tional Ethics Standards Board for Accountants’ Code of Ethics for Professional Accountants (IESBA Code) as adopted for Luxembourg by the
CSSF together with the ethical requirements that are relevant to our audit of the consolidated financial statements, and we have fulfilled our other
ethical responsibilities under those ethical requirements. We believe that the audit evidence we have obtained is sufficient and appropriate to
provide a basis for our opinion.
Key Audit Matters Key audit matters are those matters that, in our professional judgment, were of most significance in our audit of the consolidated financial state-
ments of the current period. These matters were addressed in the context of our audit of the consolidated financial statements as a whole, and in
forming our opinion thereon, and we do not provide a separate opinion on these matters.
Why the matter was determined to be a key audit matter How the matter was addressed in the audit
Valuation of biological assets
Under IAS 41, the Group has to measure biological assets at fair value
as of reporting date. As of 30 June 2019, the carrying amount of bio-
logical assets consisted primarily of current biological assets (mainly
crops in fields) in amount of USD 309,030 thousand.
Crops in fields are measured using the discounted cash flow tech-
nique.
The key assumptions used in the preparation of forecasts (see Note
13 to the consolidated financial statements) are:
• expected yields;
• prices;
• discount rates.
We obtained an understanding of controls surrounding valuation of bi-
ological assets.
We challenged management’s assumptions with reference to histori-
cal data (yields) and, where applicable, external benchmarks (prices)
and market data noting the assumptions used fell within an acceptable
range.
We performed an independent recalculation of fair value of biological
assets as of 30 June 2019 using actual prices subsequent to year end,
median actual yields for last five years and a discount rates calculated
by our internal valuation specialists.
We tested the accuracy and methodology of valuation models.
We tested discount rate with the assistance of our internal valuation
specialists and carried out audit procedures on management’s sensi-
tivity calculations.
We considered the appropriateness of the related disclosures pro-
vided in the consolidated financial statements (Note 13 to the consol-
idated financial statements).
Kernel Holding S.A. Annual Report and Accounts 30 June 2019 69 www.kernel.ua
Independent Auditor Report continued
Strategic
Report Sustainability
Corporate
Governance
Financial
Statements
Why the matter was determined to be a key audit matter How the matter was addressed in the audit
Impairment of goodwill
Annually, as of the reporting date, or as required per IAS 36 “Impair-
ment of Assets” more frequently, if there are indicators that the carry-
ing amount of goodwill is no longer recoverable, the Group performs
an impairment test. The Group manages its goodwill at the group of
cash generating unit (“CGU”) level. Impairment is tested with refer-
ence to fair value less cost to sell or the value-in-use, typically based
on the cash flow forecast for each CGU.
Impairment considerations were significant to our audit because the
goodwill balance of USD 107,735 thousand as of 30 June 2019 is ma-
terial to the consolidated financial statements. In addition, manage-
ment’s assessment process is complex, involves judgment and is
based on assumptions, which are affected by expected future market
and economic conditions. The key assumptions with the most signifi-
cant impact on the cash flow forecasts (see Note 17 to the consoli-
dated financial statements) were:
• The discount rate (“WACC”), which is based on the weighted aver-age cost of capital.
• Terminal growth rate.
• Business assumptions, including but not limited to expected oper-ating margins, future production and sales volumes, which are vol-atile.
Further, key considerations included determination of CGUs, whether
the value in use calculation and valuation method used complied with
the requirements of IFRS.
We obtained an understanding of controls around goodwill impairment
test.
Our procedures included, among other, using internal valuation ex-
perts to assist us in evaluating the assumptions and valuation meth-
odologies used by the Group, in particular those relating to the meth-
odology and data used to estimate the WACC of each CGU’s value-
in-use estimate.
We have also focused on those assumptions that have the most sig-
nificant effect on the determination of the recoverable amount of good-
will by performing sensitivity analysis.
More specifically:
We performed audit procedures on impairment models relating to sun-
flower oil and export terminal CGUs. We evaluated reasonableness of
the models by comparing the assumptions made to internal and exter-
nal data. In particular, we:
• compared short-term revenue growth rates to the latest approved budgets and found them to be consistent;
• challenged the reasonableness of the assumptions in manage-ment’s forecasts with reference to past performance, market condi-tions and external benchmarks, where applicable;
• assessed the historical forecasting and budgeting accuracy;
• tested the integrity and mathematical accuracy of the models;
• tested discount rate with the assistance of our internal valuation specialists and carried out audit procedures on management’s sen-sitivity calculations;
• prepared our independent estimation of value-in- use for the tested CGUs and compared amount obtained to the carrying value of non-current assets of these CGUs.
We also considered the adequacy of the Group’s disclosures in re-
spect of goodwill impairment testing (Note 17 to the consolidated fi-
nancial statements) and whether disclosures, related to the sensitivity
of the valuation model used, properly reflecting the risks inherent in
such assumptions.
Revenue recognition
The Group sells different commodities, goods and services to various
counterparties as disclosed in Note 25, and operates in different busi-
ness and geographical segments as described in Note 6 in the con-
solidated financial statements.
ISAs require an auditor in assessing risk of material misstatement to
presume fraud risk in revenue recognition. Given the high volume of
underlying transactions and high number of counterparties, we con-
sider a risk that goods can be sold to certain counterparties per prices
lower than market prices, with part of the profit margin arising from
those sales not included into the consolidated statement of profit or
loss.
We obtained an understanding of controls in respect of completeness
of revenue.
We have disaggregated revenue population for first-class counterpar-
ties (public companies, companies with good reputation identified in
prior periods), and less known counterparties or new counterparties
(“second tier counterparties”).
For second tier counterparties we have performed background search
to obtain information about these counterparties. We have compared
sales prices for a sample of transactions with such counterparties to
market prices at the date of the transactions.
Additionally, we have performed analysis for companies owned by
management and the Major Equity Holder and ensured that no such
companies are related to the Group’s customers.
Other information The Board of Directors is responsible for the other information. The other information comprises the information included in the management report
and the Corporate Governance Statement, but does not include the consolidated financial statements and our report of “réviseur d'entreprises
agréé” thereon.

Kernel Holding S.A. Annual Report and Accounts 30 June 2019 70 www.kernel.ua
Independent Auditor Report continued
Strategic
Report Sustainability
Corporate
Governance
Financial
Statements
Our opinion on the consolidated financial statements does not cover the other information and we do not express any form of assurance conclusion
thereon.
In connection with our audit of the consolidated financial statements, our responsibility is to read the other information and, in doing so, consider
whether the other information is materially inconsistent with the consolidated financial statements or our knowledge obtained in the audit or other-
wise appears to be materially misstated. If, based on the work we have performed, we concluded that there is a material misstatement of this other
information; we are required to report this fact. We have nothing to report in this regard.
Responsibilities of Board of Directors and Those Charged with Governance for the Consolidated Financial Statements The Board of Directors is responsible for the preparation and fair presentation of the consolidated financial statements in accordance with Luxem-
bourg legal and regulatory requirements relating to the preparation and presentation of the consolidated financial statements, and for such internal
control as the Board of Directors determines is necessary to enable the preparation of consolidated financial statements that are free from material
misstatement, whether due to fraud or error.
In preparing the consolidated financial statements, the Board of Directors is responsible for assessing the Group’s ability to continue as a going
concern, disclosing, as applicable, matters related to going concern and using the going concern basis of accounting unless the Board of Directors
either intends to liquidate the Group or to cease operations, or has no realistic alternative but to do so.
Those charged with governance are responsible for overseeing the Group’s financial reporting process.
Responsibilities of the « Réviseur d’Entreprises Agréé » for the Audit of the Consolidated Financial Statements The objectives of our audit are to obtain a reasonable assurance about whether the consolidated financial statements as a whole are free from
material misstatement, whether due to fraud or error, and to issue a report of “Réviseur d’Entreprises Agréé” that includes our opinion. Reasonable
assurance is a high level of assurance, but is not a guarantee that an audit conducted in accordance with the EU Regulation N°537/2014, the Law
of 23 July 2016 and with ISAs as adopted for Luxembourg by the CSSF will always detect a material misstatement when it exists. Misstatements
can arise from fraud or error and are considered material if, individually or in the aggregate, they could reasonably be expected to influence the
economic decisions of users taken on the basis of these consolidated financial statements.
As part of an audit in accordance with the EU Regulation N° 537/2014, the Law of 23 July 2016 and with ISAs as adopted for Luxembourg by the
CSSF, we exercise professional judgment and maintain professional skepticism throughout the audit. We also:
• Identity and asses the risks of material misstatement of the consolidated financial statements, whether due to fraud or error, design and perform audit procedures responsive to those risks, and obtain audit evidence that is sufficient and appropriate to provide a basis for our opinion. The risk of not detecting a material misstatement resulting from fraud is higher than for one resulting from error, as fraud may involve collusion, forgery, intentional omissions, misrepresentations, or the override of internal control.
• Obtain an understanding of internal control relevant to the audit in order to design audit procedures that are appropriate in the circumstances, but not for expressing an opinion on the effectiveness of the Group’s internal control.
• Evaluate the appropriateness of accounting policies used and the reasonableness of accounting estimates and related disclosures made by the Board of Directors.
• Conclude on the appropriateness of Board of Directors’ use of the going concern basis of accounting and, based on the audit evidence obtained, whether a material uncertainty exists related to events or conditions that may cast significant doubt on the Group’s ability to continue as a going concern. If we conclude that a material uncertainty exists, we are required to draw attention in our report of “Réviseur d’Entreprises Agréé” to the related disclosures in the consolidated financial statements or, if such disclosures are inadequate, to modify our opinion. Our conclusions are based on the audit evidence obtained up to the date of our report of “Réviseur d’Entreprises Agréé”. However, future events or conditions may cause the Group to cease to continue as a going concern.
• Evaluate the overall presentation, structure and content of the consolidated financial statements, including the disclosures, and whether the consolidated financial statements represent the underlying transactions and events in a manner that achieves fair presentation.
• Obtain sufficient appropriate audit evidence regarding the financial information of the entities or business activities within the Group to express an opinion on the consolidated financial statements. We are responsible for the direction, supervision and performance of the group audit. We remain solely responsible for our audit opinion.
We communicate with those charged with governance regarding, among other matters, the planned scope and timing of the audit and significant
audit findings, including any significant deficiencies in internal control that we identify during our audit.
We also provide those charged with governance with a statement that we have complied with relevant ethical requirements regarding independ-
ence, and to communicate with them all relationships and other matters that may reasonably be thought to bear on our independence, and where
applicable, related safeguards.
From the matters communicated with those charged with governance, we determine those matters that were of most significance in the audit of
the consolidated financial statements of the current period and are therefore the key audit matters. We describe these matters in our report unless
law or regulation precludes public disclosure about the matter or when, in extremely rare circumstances, we determine that a matter should not be
communicated in our report because the adverse consequences of doing so would reasonably be expected to outweigh the public interest benefits
of such communication.

Kernel Holding S.A. Annual Report and Accounts 30 June 2019 71 www.kernel.ua
Independent Auditor Report continued
Strategic
Report Sustainability
Corporate
Governance
Financial
Statements
Report on Other Legal and Regulatory Requirements We have been appointed as « Réviseur d’Entreprises Agréé » by the General Meeting of the Shareholders on 10 December 2018 and the duration
of our uninterrupted engagement, including previous renewals and reappointments, is 8 years.
The management report, which is the responsibility of the Board of Directors, is consistent with the consolidated financial statements and has been
prepared in accordance with applicable legal requirements.
The Corporate Governance Statement, included in the management report (in corporate governance section) and as published on the Group’s
website http://www.kernel.ua is the responsibility of the Board of Directors. The information required by Article 68bis paragraph (1) letters c) and
d) of the law of 19 December 2002 on the commercial and companies register and on the accounting records and annual accounts of undertakings,
as amended, is consistent with the consolidated financial statements and has been prepared in accordance with applicable legal requirements.
The management report is consistent with the consolidated financial statements and has been prepared in accordance with applicable legal
requirements.
We confirm that the audit opinion is consistent with the additional report to the audit committee or equivalent.
We confirm that the prohibited non-audited services referred to in the EU Regulation No 537/2014 on the audit profession were not provided and
that we remain independent of the Group in conducting the audit.
Other matter The Corporate Governance Statement includes information required by Article 68bis paragraph (1) of the law of 19 December 2002 on the com-
mercial and companies register and on the accounting records and annual accounts of undertakings, as amended.
For Deloitte Audit, Cabinet de révision agréé
Marco Crosetto,
Réviseur d’entreprises agréé
Partner
27 September 2019

www.kernel.ua Kernel Holding S.A. Annual Report and Accounts 30 June 2019 72 72 72 72
Statement of the Board of Directors’ Responsibilities for the
Preparation and Approval of the Consolidated Financial
Statements for the year ended 30 June 2019
Strategic
Report Sustainability
Corporate
Governance
Financial
Statements
The Board of Directors is responsible for the preparation and fair presentation of the consolidated financial statements in accordance with Luxem-
bourg legal and regulatory requirements relating to the preparation and presentation of the consolidated financial statements, and for such internal
control as the Board of Directors determines is necessary to enable the preparation of consolidated financial statements that are free from material
misstatement, whether due to fraud or error.
In preparing the consolidated financial statements, the Board of Directors is responsible for assessing the Group’s ability to continue as a going
concern, disclosing, as applicable, matters related to going concern and using the going concern basis of accounting unless the Board of Directors
either intends to liquidate the Group or to cease operations, or has no realistic alternative but to do so.
We confirm that to the best of our knowledge and belief:
→ The consolidated financial statements of Kernel Holding S.A. (the ‘Company’) presented in this Annual Report and established in con-
formity with International Financial Reporting Standards as adopted by the European Union give a true and fair view of the consolidated
statements of comprehensive income, changes in equity and cash flows for the year then ended, and notes to the consolidated financial
statements, including a summary of significant accounting policies; and
→ The Management Report includes a fair review of the development and performance of the business and position of the Company and
the undertakings included within the consolidation taken as a whole, together with a description of the principal risks and uncertainties
it faces.
27 September 2019
On behalf of the Board of Directors
Andrii Verevskyi Anastasiia Usachova
Chairman of the Board of Directors Director, Chief Financial Officer

www.kernel.ua Kernel Holding S.A. Annual Report and Accounts 30 June 2019 73 73 73 73
Selected Financial Data for the year ended 30 June 2019 (in thousands of US dollars, unless otherwise stated)
The accompanying notes are an integral part of these financial statements.
Strategic
Report Sustainability
Corporate
Governance
Financial
Statements
1 Please see Note 3 for the exchange rates used for conversion
USD1 PLN EUR
30 June 2019
30 June
2018 30 June
2019
30 June
2018 30 June
2019
30 June
2018
I. Revenue 3,992,133 2,403,003 15,042,756 8,529,459 3,499,903 2,014,918
II. Profit from operating activities 269,207 139,565 1,014,399 495,386 236,014 117,025
III. Profit before income tax 190,406 50,054 717,469 177,667 166,929 41,970
IV. Profit for the period from continuing operations 178,504 55,954 672,621 198,609 156,494 46,917
V. Net cash generated by operating activities 198,650 82,477 748,534 292,753 174,155 69,157
VI. Net cash used in investing activities (241,404) (155,694) (909,634) (552,636) (211,639) (130,549)
VII. Net cash generated by financing activities 29,102 76,121 109,659 270,191 25,514 63,827
VIII. Total net cash flow (13,652) 2,904 (51,441) 10,308 (11,970) 2,435
IX. Total assets 2,463,600 2,210,514 9,198,097 8,276,164 2,163,287 1,897,505
X. Current liabilities 479,760 475,516 1,791,232 1,780,332 421,277 408,183
XI. Non-current liabilities 637,814 557,394 2,381,342 2,086,883 560,064 478,467
XII. Issued capital 2,164 2,164 8,080 8,102 1,900 1,858
XIII. Total equity 1,346,026 1,177,604 5,025,523 4,408,949 1,181,946 1,010,855
XIV. Number of shares 81,941,230 81,941,230 81,941,230 81,941,230 81,941,230 81,941,230
XV. Profit per ordinary share (in USD/PLN/EUR) 2.31 0.64 8.71 2.26 2.03 0.53
XVI. Diluted number of shares 82,820,378 82,887,231 82,820,378 82,887,231 82,820,378 82,887,231
XVII. Diluted profit per ordinary share (in USD/PLN/EUR) 2.29 0.63 8.62 2.23 2.01 0.53
XVIII. Book value per share (in USD/PLN/EUR) 16.49 14.29 61.57 53.50 14.48 12.27
XIX. Diluted book value per share (in USD/PLN/EUR) 16.31 14.12 60.90 52.87 14.32 12.12

www.kernel.ua Kernel Holding S.A. Annual Report and Accounts 30 June 2019 74 74 74 74
Consolidated Statement of Financial Position for the year ended 30 June 2019 (in thousands of US dollars, unless otherwise stated)
The accompanying notes are an integral part of these financial statements.
Strategic
Report Sustainability
Corporate
Governance
Financial
Statements
Notes
As of
30 June 2019
As of
30 June 2018
Assets
Current assets
Cash and cash equivalents 8, 36 76,801 132,018
Trade accounts receivable, net 3, 9, 33, 36 183,196 92,355
Prepayments to suppliers and other current assets, net 3,10 129,822 113,342
Corporate income tax prepaid 24 8,484 6,937
Taxes recoverable and prepaid, net 11 118,575 114,695
Inventory 12 357,610 368,453
Biological assets 13 309,030 289,436
Other financial assets 36 70,835 72,344
Assets classified as held for sale 14 2,079 14,689
Total current assets 1,256,432 1,204,269
Non-current assets
Property, plant and equipment, net 15 764,686 588,127
Intangible assets, net 16 114,942 104,466
Goodwill 17 107,735 103,691
Investments in joint ventures 32 51,252 52,218
Deferred tax assets 24 8,447 18,536
Corporate income tax prepaid 4,374 4,645
Other non-current assets 18, 33 155,732 134,562
Total non-current assets 1,207,168 1,006,245
Total assets 2,463,600 2,210,514
Liabilities and equity
Current liabilities
Trade accounts payable 36 136,043 73,629
Advances from customers and other current liabilities 19, 33 104,976 104,898
Short-term borrowings 20 183,692 224,773
Current portion of long-term borrowings 21 1,233 2,811
Interest on bonds issued 23, 29, 36 17,949 17,949
Other financial liabilities 36 35,867 51,456
Total current liabilities 479,760 475,516
Non-current liabilities
Long-term borrowings 21 63,680 2,812
Obligations under finance leases 22 5,230 7,710
Deferred tax liabilities 24 29,010 19,570
Bonds issued 23 496,051 494,796
Other non-current liabilities 7, 33, 36 43,843 32,506
Total non-current liabilities 637,814 557,394
Equity attributable to Kernel Holding S.A. equity holders
Issued capital 2,164 2,164
Share premium reserve 481,878 481,878
Additional paid-in capital 39,944 39,944
Equity-settled employee benefits reserve 9,111 8,114
Revaluation reserve 62,249 43,815
Translation reserve (734,396) (724,054)
Retained earnings 1,489,996 1,318,872
Total equity attributable to Kernel Holding S.A. equity holders 1,350,946 1,170,733
Non-controlling interests (4,920) 6,871
Total equity 1,346,026 1,177,604
Total liabilities and equity 2,463,600 2,210,514
Book value 1,350,946 1,170,733
Number of shares 37 81,941,230 81,941,230
Book value per share (in USD) 16.49 14.29
Diluted number of shares 37 82,820,378 82,887,231
Diluted book value per share (in USD) 16.31 14.12
On behalf of the Board of Directors
Andrii Verevskyi Anastasiia Usachova
Chairman of the Board of Directors Director, Chief Financial Officer

www.kernel.ua Kernel Holding S.A. Annual Report and Accounts 30 June 2019 75 75 75 75
Consolidated Statement of Profit or Loss for the year ended 30 June 2019 (in thousands of US dollars, unless otherwise stated)
The accompanying notes are an integral part of these financial statements.
Strategic
Report Sustainability
Corporate
Governance
Financial
Statements
On behalf of the Board of Directors
Andrii Verevskyi Anastasiia Usachova
Chairman of the Board of Directors Director, Chief Financial Officer
1 During the year ended 30 June 2019, the Group has changed its accounting policy due to IFRS 15 adoption and changed presentation of Distributions costs and included them in Cost of sales. Comparative information was reclassified respectively. Please see Note 3 for more details and description of changes in accounting policy and reclassi-fications made
Notes As of 30 June 2019 As of 30 June 20181
Revenue 25, 33 3,992,133 2,403,003
Net change in fair value of biological assets and agricultural produce 13 9,140 18,699
Cost of sales 26, 33 (3,653,762) (2,261,230)
Gross profit 347,511 160,472
Other operating income, net 27 28,228 59,092
General and administrative expenses 28, 33 (106,532) (79,999)
Profit from operating activities 269,207 139,565
Finance costs, net 29, 33 (82,319) (65,099)
Foreign exchange gain, net 30 12,860 5,375
Other expenses, net 31, 33 (8,376) (30,980)
Share of (loss)/income of joint ventures 32 (966) 1,193
Profit before income tax 190,406 50,054
Income tax (expenses)/benefit 24 (11,902) 5,900
Profit for the period from continuing operations 178,504 55,954
Profit for the period 178,504 55,954
Profit for the period attributable to:
Equity holders of Kernel Holding S.A. 189,464 52,143
Non-controlling interests (10,960) 3,811
Earnings per share
From continuing operations
Weighted average number of shares 37 81,941,230 81,941,230
Profit per ordinary share (in USD) 2.31 0.64
Diluted number of shares 37 82,820,378 82,887,231
Diluted profit per ordinary share (in USD) 2.29 0.63

www.kernel.ua Kernel Holding S.A. Annual Report and Accounts 30 June 2019 76 76 76 76
Consolidated Statement of Profit or Loss and
Other Comprehensive Income for the year ended 30 June 2019 (in thousands of US dollars, unless otherwise stated)
The accompanying notes are an integral part of these financial statements.
Strategic
Report Sustainability
Corporate
Governance
Financial
Statements
30 June 2019 30 June 2018
Profit for the period 178,504 55,954
Other comprehensive income/ (loss)
Items that will not be reclassified subsequently to profit or loss:
Gain on revaluation of property (Note 15) 25,833 ─
Income tax related to components of other comprehensive income (Note 24) (4,650) ─
Items that may be reclassified subsequently to profit or loss:
Exchange differences on translating foreign operations (10,979) (16,574)
Other comprehensive income/(loss), net 10,204 (16,574)
Total comprehensive income for the period 188,708 39,380
Total comprehensive income/(loss) attributable to:
Equity holders of Kernel Holding S.A. 200,305 35,547
Non-controlling interests (11,597) 3,833
On behalf of the Board of Directors
Andrii Verevskyi Anastasiia Usachova
Chairman of the Board of Directors Director, Chief Financial Officer

www.kernel.ua Kernel Holding S.A. Annual Report and Accounts 30 June 2019 77 77 77 77
Consolidated Statement of Changes in Equity for the year ended 30 June 2019 (in thousands of US dollars, unless otherwise stated)
The accompanying notes are an integral part of these financial statements.
Strategic
Report Sustainability
Corporate
Governance
Financial
Statements
Attributable to Kernel Holding S.A. shareholders
Issued
capital
Share
premium
reserve
Additional
paid-in
capital
Equity-
settled
employee
benefits
reserve
Revalu-
ation
reserve
Translation
reserve
Retained
Earnings Total
Non-
controlling
interests
Total
equity
Balance as of 30 June 2017 2,164 481,878 39,944 7,014 43,815 (707,458) 1,285,671 1,153,028 4,581 1,157,609
Profit for the period ─ ─ ─ ─ ─ ─ 52,143 52,143 3,811 55,954
Other comprehensive (loss)/income ─ ─ ─ ─ (16,596) ─ (16,596) 22 (16,574)
Total comprehensive (loss)/income for the
period
─ ─ ─ ─ ─ (16,596) 52,143 35,547 3,833 39,380
Distribution of dividends ─ ─ ─ ─ ─ (20,485) (20,485) ─ (20,485)
Effect of changes in non-controlling interests ─ ─ ─ ─ ─ ─ 1,543 1,543 (1,543) ─
Recognition of share-based payments (Note 2) ─ ─ ─ 1,100 ─ ─ ─ 1,100 ─ 1,100
Balance as of 30 June 2018 (as previously re-
ported)
2,164 481,878 39,944 8,114 43,815 (724,054) 1,318,872 1,170,733 6,871 1,177,604
Effect of IFRS 9 implementation (Note 3, 9) ─ ─ ─ ─ ─ ─ (314) (314) ─ (314)
Balance as of 1 July 2018 (restated) 2,164 481,878 39,944 8,114 43,815 (724,054) 1,318,558 1,170,419 6,871 1,177,290
Profit/(Loss) for the period ─ ─ ─ ─ ─ ─ 189,464 189,464 (10,960) 178,504
Other comprehensive income/(loss) ─ ─ ─ ─ 21,183 (10,342) ─ 10,841 (637) 10,204
Total comprehensive income/(loss) for the
period
─ ─ ─ ─ 21,183 (10,342) 189,464 200,305 (11,597) 188,708
Distribution of dividends (Note 2) ─ ─ ─ ─ ─ ─ (20,485) (20,485) ─ (20,485)
Disposal of subsidiaries ─ ─ ─ ─ (1,626) ─ 1,626 ─ ─ ─
Effect of changes on minority interest ─ ─ ─ ─ ─ ─ (290) (290) (194) (484)
Recognition of share-based payments (Note 2) ─ ─ ─ 997 ─ ─ ─ 997 ─ 997
Transfer of revaluation reserve ─ ─ ─ ─ (1,123) ─ 1,123 ─ ─ ─
Balance as of 30 June 2019 2,164 481,878 39,944 9,111 62,249 (734,396) 1,489,996 1,350,946 (4,920) 1,346,026
On behalf of the Board of Directors
Andrii Verevskyi Anastasiia Usachova
Chairman of the Board of Directors Director, Chief Financial Officer

www.kernel.ua Kernel Holding S.A. Annual Report and Accounts 30 June 2019 78 78 78 78
Consolidated Statement of Cash Flows for the year ended 30 June 2019 (in thousands of US dollars, unless otherwise stated)
The accompanying notes are an integral part of these financial statements.
Strategic
Report Sustainability
Corporate
Governance
Financial
Statements
Notes As of 30 June 2019 As of 30 June 2018
Operating activities:
Profit before income tax 190,406 50,054
Adjustments for:
Amortization and depreciation 76,303 82,975
Finance costs, net 29 82,319 65,099
Movement in allowance for doubtful receivables 7,905 997
Other accruals 31 5,036 44,870
Gain on disposal of property, plant and equipment (605) (791)
Net foreign exchange gain (13,840) (12,179)
Write-offs and (reversal)/impairment loss 16, 17, 31 (116) 577
Net change in fair value of biological assets and agricultural produce 13 (9,140) (18,699)
Gain on bargain purchase 7, 31 — (2,309)
Share of loss/(income) of joint ventures 32 966 (1,193)
Gain on sales of subsidiaries 7, 31 (4,833) (2,972)
Net loss/(gain) arising on financial assets classified as at fair value through profit or loss 23,662 (23,137)
Other losses 10,234 —
Operating profit before working capital changes 368,297 183,292
Changes in working capital:
Change in trade and other accounts receivable1 (131,516) (7,902)
Change in prepayments and other current assets (13,706) (52,382)
Change in restricted cash balance 538 3,251
Change in taxes recoverable and prepaid 441 3,273
Change in biological assets 18,779 1,675
Change in inventories (24,160) 9,866
Change in trade accounts payable 60,055 19,049
Change in advances from customers and other current liabilities (4,328) (8,065)
Cash generated from operations 274,400 152,057
Interest paid (76,233) (69,482)
Interest received 3,829 5,106
Income tax paid (3,346) (5,204)
Net cash generated by operating activities 198,650 82,477
Investing activities:
Purchase of property, plant and equipment (166,988) (146,565)
Proceeds from disposal of property, plant and equipment 9,754 7,053
Purchase of intangible and other non-current assets (25,375) (15,670)
Acquisition of subsidiaries, net of cash acquired 7 (56,272) (46,512)
Disposal of subsidiaries 7 11,313 24,706
Amount advanced for subsidiaries 3,873 (1,996)
Amount advanced to related parties (10,085) —
Proceeds from disposal of financial assets — 23,290
Payment to acquire financial assets (7,624) —
Net cash used in investing activities (241,404) (155,694)
Financing activities:
Proceeds from borrowings 577,983 777,599
Repayment of borrowings (516,713) (680,026)
Payment of dividends 2 (20,485) (20,485)
Financing for farmers (11,083) —
Net cash generated by financing activities 29,702 77,088
Effects of exchange rate changes on the balance of cash held in foreign currencies (600) (967)
Net increase in cash and cash equivalents (13,652) 2,904
Cash and cash equivalents, at the beginning of the year 90,069 87,165
Cash and cash equivalents, at the end of the year 76,417 90,069
For non-cash financing activities please see Note 8.
On behalf of the Board of Directors
Andrii Verevskyi Anastasiia Usachova
Chairman of the Board of Directors Director, Chief Financial Officer
1 Includes movement in other financial assets

www.kernel.ua Kernel Holding S.A. Annual Report and Accounts 30 June 2019 79 79 79 79
Notes to the Consolidated Statements for the year ended 30 June 2019 (in thousands of US dollars, unless otherwise stated)
The accompanying notes are an integral part of these financial statements.
Strategic
Report Sustainability
Corporate
Governance
Financial
Statements
1. Corporate Information Kernel Holding S.A. (hereinafter referred to as the ‘Holding’ or the ‘Company’) incorporated under the legislation of Luxembourg on 15 June 2005
(number B 109,173 in the Luxembourg Register of Companies) is the holding company for a group of entities (hereinafter referred to as the
‘Subsidiaries’), which together form Kernel Group (hereinafter referred to as the ‘Group’ or the ‘Kernel Group’).
Kernel Holding S.A has been a publicly traded company since 2007. Its ordinary shares are traded on the Warsaw stock exchange.
The Group’s principal business activity is the production and subsequent export of sunflower oil and meal in bulk, the production and sale of bottled
sunflower oil, the wholesale trade of grain (mainly corn, soybean, wheat and barley), farming, and the provision of logistics and transshipment
services. The majority of the Group’s manufacturing facilities is primarily based in Ukraine. As of 30 June 2019, the Group employed 13,397 people
(15,116 people as of 30 June 2018).
The Group’s financial year runs from 1 July to 30 June.
The principal operating office of the Group is located at 3 Tarasa Shevchenka Lane, Kyiv, 01001, Ukraine.
As of 30 June 2019 and 30 June 2018, the primary Subsidiaries of the Group and principal activities of the Subsidiaries consolidated by the Holding
were as follows:
Group’s effective ownership in-
terest and voting rights as of
Subsidiary Principal activity
Country of
incorporation 30 June 2019 30 June 2018
Jerste S.a.r.l. Holding companies. Luxembourg 100.0% 100.0%
Inerco Trade S.A. Trading in sunflower oil,
meal and grain.
Switzerland 100.0% 100.0%
Restomon Ltd British Virgin Islands 100.0% 100.0%
Kernel-Trade LLC Ukraine 100.0% 100.0%
Avere Commodities SA Switzerland 60.0% 60.0%
Ukragroinvest LLC Ukraine 100.0% 100.0%
Poltava OEP PJSC Oilseed crushing plants. Production of
sunflower oil and meal.
Ukraine 99.7% 99.7%
Bandurka OEP LLC Ukraine 100.0% 100.0%
Vovchansk OEP PJSC Ukraine 99.4% 99.4%
Prykolotnoe OEP LLC Ukraine 100.0% 100.0%
Kropyvnytskyi OEP PJSC1 Ukraine 99.2% 99.2%
Ekotrans LLC 2 Ukraine 0.0% 100.0%
BSI LLC Ukraine 100.0% 100.0%
Prydniprovskyi OEP LLC Ukraine 100.0% 100.0%
Estron Corporation Ltd Provision of grain, oil and meal
handling and transshipment services.
Cyprus 100.0% 100.0%
Poltava HPP PJSC Grain elevators. Provision of grain and
oilseed cleaning, drying and storage ser-
vices.
Ukraine 94.0% 94.0%
Kononivsky Elevator LLC Ukraine 100.0% 100.0%
Agro Logistics Ukraine LLC Ukraine 100.0% 100.0%
Bilovodskyi KHP PJSC Ukraine 91.12% 91.12%
Unigrain-Agro (Semenivka)
LLC3
Agricultural farms. Cultivation of agricultural
products: corn, wheat, soybean, sunflower
seed, rapeseed, forage, pea and barley.
Ukraine 0.0% 100.0%
Agrofirma Arshytsya LLC4 Ukraine 0.0% 100.0%
Hliborob LLC Ukraine 100.0% 100.0%
Vyshneve Agro ALLС3 Ukraine 0.0% 100.0%
Prydniprovskyi Kray ALLC Ukraine 100.0% 100.0%
Enselco Agro LLC Ukraine 100.0% 100.0%
Druzhba-Nova ALLC Ukraine 100.0% 100.0%
Agro Invest Ukraine LLC5 Ukraine 0.0% 100.0%
Druzhba 6 PE Ukraine 100.0% 100.0%
AF Semerenky LLC Ukraine 100.0% 100.0%
Hovtva ALLC Ukraine 100.0% 100.0%
Buymerske PE6 Ukraine 0.0% 100.0%
These consolidated financial statements were authorized for release by the board of directors of Kernel Holding S.A. on 27 September 2019.
1 The company was renamed from Kirovogradoliya PJSC 2 The company was disposed on 30 July 2018 3 The company merged with Prydniprovskyi Kray ALLC 4 The company merged with Hovtva ALLC 5 The company merged with Hliborob LLC 6 The company merged with AF Semerenky LLC
www.kernel.ua Kernel Holding S.A. Annual Report and Accounts 30 June 2019 80 80 80 80
Notes to the Consolidated Statements continued for the year ended 30 June 2019 (in thousands of US dollars, unless otherwise stated)
The accompanying notes are an integral part of these financial statements.
Strategic
Report Sustainability
Corporate
Governance
Financial
Statements
2. Change in Issued Capital Since 15 June 2005, the parent company of the Group is Kernel Holding S.A. (Luxembourg). The issued capital of the Holding as of 30 June 2019,
consisted of 81,941,230 ordinary electronic shares without indication of the nominal value (30 June 2018: 81,941,230). Ordinary shares have
equal voting rights and rights to receive dividends.
The shares were distributed as follows:
As of 30 June 2019 As of 30 June 2018
Equity holders
Shares allotted
and fully paid
Share
owned
Shares allotted
and fully paid
Share
owned
Namsen Limited Liability Company registered under the legislation of Cy-
prus (hereinafter the ‘Major Equity Holder’)
32,716,775 39.93% 32,344,404 39.47%
Free float 49,224,455 60.07% 49,596,826 60.53%
Total 81,941,230 100.00% 81,941,230 100.00%
As of 30 June 2019 and 2018, 100% of the beneficial interest in the Major Equity Holder was held by Andrii Mykhailovych Verevskyi (hereinafter
the ‘Beneficial Owner’).
As of and during the year ended 30 June 2019, the fair value of the share-based options granted to the management was USD 9,111 thousand
and USD 997 thousand was recognized as an expense (part of payroll and payroll related expenses), with a corresponding increase in equity over
the vesting period (as of and during the year ended 30 June 2018: USD 8,114 thousand and USD 1,100 thousand, respectively).
On 10 December 2018, the annual general meeting of shareholders approved an annual dividend of USD 0.25 per share amounting to
USD 20,485 thousand.
On 25 April 2019, the dividends were fully paid to the shareholders.
On 10 November 2017 the Company received a notification from Cascade Investment Fund, regarding the acquisition of shares in Kernel Holding
S.A. The Cascade Investment Fund held 5,397,453 shares in the Company, representing 6.59% of the share capital and entitling it to 5,397,453
votes at the Company’s general shareholders’ meeting, equal to 6.59% of the total number of votes.
On 18 June 2018, the Company received a notification from Julius Baer Group Ltd, regarding the acquisition of shares in Kernel Holding S.A. that
on 8 June 2018 it had crossed 5% threshold. The Julius Baer Group Ltd held 5,098,297 shares in the Company, representing 6.22% of the share
capital.
Luxembourg companies are required to allocate to a legal reserve a minimum of 5% of the annual net income until this reserve equals 10% of the
subscribed issued capital. This reserve, in the amount of USD 216 thousand as of 30 June 2019 and 2018, may not be distributed as dividends.
3. Summary of Significant Accounting Policies
Basis of Preparation and Accounting The consolidated financial statements of the Group have been prepared in accordance with International Financial Reporting Standards (IFRS)
as adopted by the European Union.
The consolidated financial statements have been prepared under the historical cost convention, as modified by the revaluation of property, plant
and equipment for bulk and bottled oil segments, assets held for sale, biological assets, agricultural produce and certain financial assets and
liabilities - measured at fair value. The consolidated financial statements have been prepared on a going concern basis.
The Group’s Subsidiaries maintain their accounting records in local currencies in accordance with the accounting and reporting regulations of the
countries of their incorporation. Local statutory accounting principles and procedures may differ from those generally accepted under IFRS. Ac-
cordingly, the consolidated financial statements, which have been prepared from the Group’s Subsidiaries’ accounts under local accounting reg-
ulations, reflect adjustments necessary for such financial statements to be presented in accordance with IFRS.
Adoption of New and Revised Standards In the current year, the Group has adopted a number of new and revised IFRS standards that became effective as of 1 July 2018.
IFRS 15 Revenue from Contracts with Customers
IIFRS 15 supersedes IAS 18 Revenue, IAS 11 Construction Contracts and related Interpretations and it applies, with limited exceptions, to all
revenue arising from contracts with customers.
The core principle of IFRS 15 is that an entity should recognize revenue to depict the transfer of promised goods or services to customers in an
amount that reflects the consideration to which the entity expects to be entitled in exchange for those goods or services.
The standard introduced a 5-step model to revenue recognition where entities have to exercise judgement, taking into consideration all of the
relevant facts and circumstances when applying each step of the model to contracts with their customers. The standard also specifies the ac-
counting for the incremental costs of obtaining a contract and the costs directly related to fulfilling a contract. In addition, the standard requires
extensive disclosures.
Kernel Holding S.A. Annual Report and Accounts 30 June 2019 81
www.kernel.ua
Notes to the Consolidated Statements continued for the year ended 30 June 2019 (in thousands of US dollars, unless otherwise stated)
The accompanying notes are an integral part of these financial statements.
Strategic
Report Sustainability
Corporate
Governance
Financial
Statements
The Group elected the modified retrospective method (without practical expedients) with the effect of initially applying this standard recognized at
the date of initial application as of 1 July 2018. In accordance with the transition guidance, IFRS 15 has only been applied to contracts that are
incomplete as at 1 July 2018. As the majority of the Group’s revenue is derived from commodity sales, for which the point of recognition is
dependent upon contract sales terms (Incoterms), the transfer of risks and rewards as defined by IAS 18 and the transfer of control as defined by
IFRS 15 could differ. The application of IFRS 15 has an impact on the Group’s commodity sales as it may be necessary to recognize a separate
performance obligation and allocate part of the transaction price to a carriage and fright services incorporated in some contracts that the Group
undertakes to perform. The Group allocates the transaction price based on the relative stand-alone selling prices of the commodities and support-
ing services. The revenue from these carriage and fright services is recognized over time.
IFRS 15 uses the terms ‘contract asset’ and ‘contract liability’ to describe what might more commonly be known as ‘accrued revenue’ and ‘deferred
revenue’, however the Standard does not prohibit an entity from using alternative descriptions in the statement of financial position. A contract
liability is an entity’s obligation to transfer goods or services to a customer for which the entity has been entitled for receipt of consideration from
the customer. Contract liabilities are included in advances from customers and other current liabilities line item.
As of 30 June 2018, there were no incomplete contracts, which will materially affect revenue recognition retrospectively. As such, the adoption of
this standard has had no material impact in respect of timing and amount of revenue recognized by the Group and accordingly retained earnings
have not been impacted by the first application of the standard.
The Group’s accounting policies for its revenue streams are disclosed in detail in note below. Apart from providing more extensive disclosures for
the Group’s revenue transactions, the application of IFRS 15 has not had a significant impact on the financial position and/or financial performance
of the Group. However, in context of IFRS 15, the Group decided to change its accounting policy for presentation of distribution costs as illustrated
below in paragraph ‘Change in Accounting Policy’.
The adoption of IFRS 15 has had no material impact with respect to timing of recognition for carriage, freight and insurance services
IFRS 9 Financial Instruments
IFRS 9 replaces IAS 39 Financial Instruments: Recognition and Measurement that relate to the recognition, classification and measurement of
financial assets and financial liabilities, derecognition of financial instruments, impairment of financial assets and hedge accounting.
The Group reassess classification of financial assets from four to three primary categories (amortized cost, fair value through profit and loss, fair
value through other comprehensive income). Reclassification depends on the business model for managing the financial assets and the contrac-
tual terms of the cash flows characteristics. Financial liabilities continue to be measured at either fair value through profit and loss or amortized
cost. In addition, IFRS 9 introduced an expected credit loss (“ECL”) impairment model, which means that anticipated as opposed to incurred credit
losses are recognized resulting in earlier recognition of impairments.
In accordance with the transitional guidance, comparative figures have not been restated for prior year other than certain presentation changes.
Therefore, the difference between the carrying amount of financial instruments under IAS 39 and the carrying amount under IFRS 9 has been
recognized in the opening retained earnings as at date of initial application as of 1 July 2018.
The following summarizes the impact of transition to IFRS 9 on the opening balance of reserves, retained earnings and non-controlling interest:
• Presentational changes primarily in the trade accounts receivable (Note 9) and prepayments to suppliers and other current assets (Note 10) disclosures to reflect the business model and cash flow characteristics of these assets and liabilities and group them into their respective IFRS 9 category or other IFRS classification;
• Additional disclosure around classification and measurement of financial instruments; and
• An additional net credit loss allowance of USD 314 thousand as at 1 July 2018, recognized against opening retained earnings. The Group considered that the new classification requirements do not have a material impact on its accounting for financial assets and liabilities
previously classified as receivables and loans. Loans and receivables are held to collect contractual cash flows and are expected to give rise to
cash flows representing solely payments of principal and interest. The Group analyzed the contractual cash flow characteristics of those instru-
ments and concluded that they meet the criteria for amortized cost measurement under IFRS 9. Therefore, reclassification for these instruments
is not required.
There were no financial assets or financial liabilities which the Group had previously designated as at FVTPL under IAS 39 that were subject to
reclassification or which the Group has elected to reclassify upon the application of IFRS 9. There were no financial assets or financial liabilities
which the Group has elected to designate as at FVTPL at the date of initial application of IFRS 9.
Trade and other receivables that were classified as loans and receivables under IAS 39 are now classified at amortized cost. An increase of
USD 314 thousand in the allowance for impairment over these receivables was recognized in opening retained earnings at 1 July 2018 on transi-
tion to IFRS 9.
Additionally, the Group has adopted consequential amendments to IFRS 7 Financial Instruments: disclosures that are applied to disclosures about
2018, but have not been generally applied to comparative information.
The Group has adopted the other standards and interpretations effective for annual periods beginning on or after 1 July 2018.
The adoption of new standards, except for IFRS 15, had no effect on earnings per share either in the current or previous periods.

Kernel Holding S.A. Annual Report and Accounts 30 June 2019 82
www.kernel.ua
Notes to the Consolidated Statements continued for the year ended 30 June 2019 (in thousands of US dollars, unless otherwise stated)
The accompanying notes are an integral part of these financial statements.
Strategic
Report Sustainability
Corporate
Governance
Financial
Statements
The adoption of other new or revised standards did not have any material effect on the consolidated financial position or performance of the Group
and any disclosures in the Group’s consolidated financial statements.
Standards and Interpretations Issued but not Effective IFRS 16 was issued in January 2016 and it replaces IAS 17 Leases, IFRIC 4 Determining whether an Arrangement contains a Lease, SIC-15
Operating Leases-Incentives and SIC-27 Evaluating the Substance of Transactions Involving the Legal Form of a Lease.
The standard establishes principles for the recognition, measurement, presentation and disclosure of leases, with the objective of ensuring that
lessees and lessors provide relevant information that faithfully represents those transactions.
IFRS 16 provides a comprehensive model for identification of lease arrangements and their treatment (on-balance sheet) in the financial state-
ments of both lessees and lessors. Under the new standard, a lessee is required to recognize the present value of the unavoidable lease payments
as a lease liability on the statement of financial position (including those currently classified as operating leases) with a corresponding right of use
asset. The unwind of the financial charge on the lease liability and amortization of the leased asset are recognized in the statement of income
based on the implied interest rate and contract term respectively. On transition, for leases previously accounted for as operating leases exist
exemptions for short-term leases and leases of low-value items. Lessors will continue to classify all leases using the same classification principle
as in IAS 17 and distinguish between two types of leases: operating and finance leases. Furthermore, extensive disclosures are required by IFRS
16.
The Group will apply this standard retrospectively with the cumulative effect recognized in retained earnings at the date of initial application on 1
July 2019 as permitted under the specific transition provisions in the standard. Under this approach, the Group will not restate amounts previously
reported and will apply the practical expedient available on transition to IFRS 16 not to reassess whether a contract is or contains a lease.
Accordingly, the definition of a lease in accordance with IAS 17 and IFRIC 4 will continue to apply to those leases entered or modified before 1
July 2019. The Group will apply the definition of a lease and related guidance set out in IFRS 16 to all lease contracts entered into or modified on
or after 1 July 2019 (whether it is a lessor or a lessee in the lease contract).
Impact on Lessee Accounting is as follows:
Operating leases
IFRS 16 will change how the Group accounts for leases previously classified as operating leases under IAS 17, which were off-balance sheet. On
initial application of IFRS 16, for all leases (except as noted below), the Group will:
• Recognize right-of-use assets and lease liabilities in the consolidated statement of financial position, initially measured at the present value of the future lease payments;
• Recognize depreciation of right-of-use assets and interest on lease liabilities in the consolidated statement of profit or loss;
• Separate the total amount of cash paid into a principal portion (presented within financing activities) and interest (presented within operating activities) in the consolidated cash flow statement.
Lease incentives (e.g. rent-free period) will be recognized as part of the measurement of the right-of-use assets and lease liabilities whereas under
IAS 17 they resulted in the recognition of a lease liability incentive, amortized as a reduction of rental expenses on a straight-line basis. Under
IFRS 16, right-of-use assets will be tested for impairment in accordance with IAS 36 Impairment of Assets.
For short-term leases (lease term of 12 months or less) and leases of low-value assets (such as personal computers and office furniture), the
Group will opt to recognize a lease expense on a straight-line basis as permitted by IFRS 16.
As at 30 June 2019, the Group has non-cancellable operating lease commitments of USD 591,547 thousand. A preliminary assessment indicates,
and hence the Group may recognize a right-of-use asset and a corresponding lease liability in a range between USD 245,000 thousand and USD
335,000 thousand in respect of all these leases, other than short-term leases and leases of low-value assets. The impact on the consolidated
statement of profit or loss and other comprehensive income, the Group will be recognizing depreciation charges on right to use-of-asset and the
interest expense from unwinding the lease the discount on the lease liability instead of rental payments in cost of sales and general and adminis-
trative expenses.
Under IAS 17, all lease payments on operating leases are presented as part of cash flows from operating activities. The impact of the changes
under IFRS 16 would be to reduce the cash generated by operating activities and to increase net cash used in financing activities by the same
amount.
Finance leases
The main differences between IFRS 16 and IAS 17 with respect to assets formerly held under a finance lease is the measurement of the residual
value guarantees provided by the lessee to the lessor. IFRS 16 requires that the Group recognizes as part of its lease liability only the amount
expected to be payable under a residual value guarantee, rather than the maximum amount guaranteed as required by IAS 17. On initial application
the Group will present equipment previously included in property, plant and equipment within the respective note lines in property, plant and
equipment, disclosing them as right-of-use assets and the lease liability, previously presented within obligations under finance lease, will be
presented in a separate note line within lease liabilities.
The above assessment for IFRS 16 is preliminary because not all transition work has been finalized. The actual effect of adopting IFRS 16 may
change because their adoption will require the Group to revise its accounting processes and internal controls and these changes are not yet
completed. The new accounting policies, assumptions, judgements and estimation techniques are subject to changes until the Group finalizes its
first consolidated financial statements that include the date of initial application.

Kernel Holding S.A. Annual Report and Accounts 30 June 2019 83
www.kernel.ua
Notes to the Consolidated Statements continued for the year ended 30 June 2019 (in thousands of US dollars, unless otherwise stated)
The accompanying notes are an integral part of these financial statements.
Strategic
Report Sustainability
Corporate
Governance
Financial
Statements
Standards and Interpretations Issued but not Effective At the date of authorization of these consolidated financial statements, the following standards and interpretations, as well as amendments to the
standards had been issued but were not yet effective:
Standards and Interpretations
Effective for annual period
beginning on or after
IFRS 16 Leases 1 January 2019
IFRS 17 Insurance contracts 1 January 2021
Amendments to IAS19: Plan Amendment, Curtailment or Settlement 1 January 2019
Amendments to IAS 28: Long-term Interests in Associates and Joint Ventures 1 January 2019
Amendments to IFRS 9: Prepayment Features with Negative Compensation 1 January 2019
Amendments to IAS 1 and IAS 8: Definition of Material 1 January 2020
Annual improvements to IFRS Standards 2015-2017 Cycle 1 January 2019
IFRIC 23 Uncertainty over Income Tax Treatments 1 January 2019
Amendments to IFRS 3 Definition of a Business 1 January 2020
Amendments to References to the Conceptual Framework in IFRS Standards 1 January 2020
For other standards and interpretations, management anticipates that their adoption will not have a material effect on the consolidated financial
statements of the Group in future periods.
Change in Accounting Policy Starting from 1 July 2018, the Group voluntary changed its accounting policy relating to the classification of distribution expenses charged to its
customers. The Group sells products to customers based on different selling terms, which include among other carriage and freight services,
storage and dispatch services which are relating to costs incurred to store and to prepare goods for delivery and some other distribution services
(custom, certification and sanitation services and other services). These services are relating to costs incurred to deliver goods to the customers’
indicated locations and consist mostly of services provided by third parties. Carriage and freight, storage and dispatch costs and other distribution
expenses have been previously presented cumulative as distribution costs.
The Group decided to change the accounting policy regarding classification of distribution costs upon analysis of its performance obligations and
principal versus agent considerations according to the requirements of the new revenue standard (IFRS 15), adopted by the Group starting from
1 July 2018. More specifically, the Group has identified a separate performance obligation relating to freight and other related services. Further-
more, since the control over promised goods or services is transferred to the customers only upon their receipt of the goods or services, the Group
is considered to be a principal in providing freight and other services. As such and since the proceeds from freight and other services are presented
gross within Revenues, the corresponding cost of such services should be also presented gross in Cost of sales. Based on the above, the Group
decided to present all cost relating to freight and other related services within Cost of sales and to apply the above mentioned change in the
accounting policy retrospectively in order to eliminate inconsistency in presentation of carriage and freight and other related distribution expenses
and to comply with the requirements of the new revenue standard.
This approach is most commonly used in the industry and the Group’s management believes that such change in accounting policy will provide
more precise, relevant and consistent approach towards gross profit result of the Group.
The effect of the retrospective application of this policy on the Consolidated Financial Statement of Profit or Loss was as follows:
For the year ended 30 June 2019 For the year ended 30 June 2018
New Policy Old Policy
Effect of the change
in accounting policy New Policy Old Policy
Effect of the change
in accounting policy
Cost of sales 3,653,762 3,345,500 308,262 2,261,230 2,107,677 153,553
Distribution costs — 308,262 (308,262) — 153,553 (153,553)
The change in accounting policies had no effect on earnings per share either in the current or previous periods.
Functional and Presentation Currency The Group’s presentation currency is the United States dollar (USD). The functional currency of the majority of the Group’s foreign Subsidiaries
is their local currency, except for businesses engaged in the production and sale of sunflower oil, for which USD was selected as the functional
currency.
Foreign Currencies Transactions in currencies other than the functional currencies of the Group`s companies are initially recorded at the rates of exchange prevailing
on the dates of the transactions. Subsequently, monetary assets and liabilities denominated in such currencies are translated at the rates prevailing
on the reporting date. Non-monetary items carried at fair value that are denominated in foreign currencies are retranslated at the rates prevailing
at the date when the fair value was determined. Non-monetary items that are measured in terms of historical cost in a foreign currency are not
retranslated.
On consolidation, the assets and liabilities of the Subsidiaries are translated at exchange rates prevailing on the reporting date. Income and
expense items are translated at the average exchange rates for the period, unless the exchange rates fluctuate significantly during that period, in
which case the exchange rates at the dates of the transactions are used. Exchange differences arising, if any, are recognized in Consolidated
Statement of Profit or Loss and Other Comprehensive Income accumulated in ‘Translation reserve’.

Kernel Holding S.A. Annual Report and Accounts 30 June 2019 84
www.kernel.ua
Notes to the Consolidated Statements continued for the year ended 30 June 2019 (in thousands of US dollars, unless otherwise stated)
The accompanying notes are an integral part of these financial statements.
Strategic
Report Sustainability
Corporate
Governance
Financial
Statements
The exchange rates during the period of the financial statements were as follows:
Currency Closing rate as of
30 June 2019
Average rate for the
year ended 30 June 2019
Closing rate as of
30 June 2018
Average rate for the
year ended 30 June 2018
USD/UAH 26.1664 27.2935 26.1892 26.5878
USD/EUR 0.8781 0.8767 0.8584 0.8385
USD/PLN 3.7336 3.7681 3.7440 3.5495
The average exchange rates for each period are calculated as the arithmetic mean of the exchange rates for all trading days during this period.
The sources of exchange rates are the official rates set by the National Bank of Ukraine for USD/UAH and by the National Bank of Poland for
USD/EUR and USD/PLN.
All foreign exchange gain or loss that occurs on revaluation of monetary balances, presented in foreign currencies, is allocated as a separate line
in the Consolidated Statement of Profit or Loss.
Basis of Consolidation The consolidated financial statements incorporate the consolidated financial statements of the Holding and companies controlled by the Holding
(Subsidiaries) as of 30 June 2019.
The consolidated financial statements incorporate the financial statements of the Company and entities (including structured entities) controlled
by the Company and its Subsidiaries. Control is achieved when the Company:
• has power over the investee;
• is exposed, or has rights, to variable returns from its involvement with the investee; and
• has the ability to use its power to affect its returns.
The Company reassesses whether or not it controls an investee if facts and circumstances indicate that there are changes to one or more of the
three elements of control listed above.
When the Company has less than a majority of the voting rights of an investee, it has power over the investee when the voting rights are sufficient
to give it the practical ability to direct the relevant activities of the investee unilaterally. The Company considers all relevant facts and circumstances
in assessing whether or not the Company’s voting rights in an investee are sufficient to give it power, including:
• the size of the Company’s holding of voting rights relative to the size and dispersion of holdings of the other vote holders;
• potential voting rights held by the Company, other vote holders or other parties;
• rights arising from other contractual arrangements;
• any additional facts and circumstances that indicate that the Company has, or does not have, the current ability to direct the relevant activities at the time that decisions need to be made, including voting patterns at previous shareholders’ meetings.
Consolidation of a Subsidiary begins when the Company obtains control over the Subsidiary and ceases when the Company loses control of the
Subsidiary. Specifically, income and expenses of a Subsidiary acquired or disposed of during the year are included in the Consolidated Statement
of Profit or Loss and Other Comprehensive Income from the date the Company gains control until the date when the Company ceases to control
the over Subsidiary.
All inter-company transactions and balances between the Group’s enterprises are eliminated for the consolidation purpose. Unrealized gains and
losses resulting from inter-company transactions are also eliminated, except for unrealized losses that cannot be recovered.
Non-controlling interests as of the reporting date represent the non-controlling equity holders’ portion of the fair values of the identifiable assets
and liabilities of the Subsidiary at the acquisition date and the non-controlling equity holders’ portion of movements in equity since the date of
acquisition. The total comprehensive income of Subsidiaries is attributed to the equity holders of the Company and to non-controlling interests
even if this results in the non-controlling interests having a deficit balance.
Business Combinations Acquisitions of businesses are accounted for using the acquisition method. The consideration transferred in a business combination is measured
at fair value, which is calculated as the sum of the acquisition-date fair values of the assets transferred by the Group, liabilities incurred by the
Group to the former owners of the acquire and equity interests issued by the Group in exchange for control of the acquire. Acquisition costs are
expensed when incurred and included in general and administrative expenses.
At the acquisition date, identifiable assets acquired, and liabilities assumed are recognized at their fair value, except that:
• Deferred tax assets or liabilities and liabilities or assets related to employee benefit arrangements are recognized and measured in accordance with IAS 12 Income Taxes and IAS 19 Employee Benefits, respectively;
• Liabilities or equity instruments related to share-based payment arrangements of the acquire or share-based payment arrangements of the Group entered into to replace share-based payment arrangements of the acquire are measured in accordance with IFRS 2 Share-based Pay-ment at the acquisition date; and
• Assets (or those held for disposal by the Group) that are classified as held for sale in accordance with IFRS 5 Non-current Assets Held for Sale and Discontinued Operations are measured in accordance with that standard.
For each business combination, the Group measures the non-controlling interests in the acquire either at fair value or at a proportionate share of
the acquirer’s identifiable net assets. If the initial accounting for a business combination cannot be completed by the end of the reporting period in

Kernel Holding S.A. Annual Report and Accounts 30 June 2019 85
www.kernel.ua
Notes to the Consolidated Statements continued for the year ended 30 June 2019 (in thousands of US dollars, unless otherwise stated)
The accompanying notes are an integral part of these financial statements.
Strategic
Report Sustainability
Corporate
Governance
Financial
Statements
which the combination occurs, only provisional amounts are reported, which can be adjusted during a measurement period of 12 months after the
acquisition date.
Changes in the Group’s ownership interests in Subsidiaries that do not result in the Group losing control over the Subsidiaries are accounted for
as equity transactions. The carrying amounts of the Group’s interests and non-controlling interests are adjusted to reflect changes in their relative
interests in Subsidiaries. Any difference between the amount by which the non-controlling interests are adjusted and the fair value of the consid-
eration paid or received is recognized directly in equity and attributed to the equity holders of the Holding.
Goodwill Goodwill arising from a business combination is recognized as an asset at the date that control is acquired (acquisition date). Goodwill is measured
as the excess of the sum of the consideration transferred, the amount of any non-controlling interest in the acquire and the fair value of the
acquirer’s previously held equity interest (if any) in the entity net of the acquisition date amounts of the identifiable assets acquired and the liabilities
assumed.
Goodwill is not amortized but it is tested for impairment annually, or more frequently if events or changes in circumstances indicate that it might
be impaired and is carried at cost less accumulated impairment losses. Gains and losses on the disposal of an entity include the carrying amount
of goodwill relating to the entity sold. If, after reassessment, the net of the acquisition-date amounts of the identifiable assets acquired and liabilities
assumed exceeds the sum of the consideration transferred, the amount of any non-controlling interests in the acquire and the fair value of the
acquirer’s previously held interest in the acquire (if any), the excess is recognized immediately in profit or loss as a bargain purchase gain.
For the purposes of impairment testing, goodwill is allocated to each of the Group’s cash-generating units (or groups of cash-generating units)
that is expected to benefit from the synergies of the combination. The cash generated units or groups of units are identified at the lowest level at
which goodwill is monitored for internal management purposes, being the entity.
Investments in Joint Ventures
A joint venture is a joint arrangement whereby the parties that have joint control of the arrangement have rights to the net assets of the joint
arrangement. Joint control is the contractually agreed sharing of control of an arrangement, which exists only when decisions about the relevant
activities require unanimous consent of the parties sharing control.
The results and assets and liabilities of joint ventures are incorporated in these consolidated financial statements using the equity method of
accounting, except when the investment, or a portion thereof, is classified as held for sale, in which case it is accounted for in accordance with
IFRS 5. Under the equity method, an investment in a joint venture is initially recognized in the consolidated statement of financial position at cost
and adjusted thereafter to recognize the Group’s share of the profit or loss and other comprehensive income of the associate or joint venture and
dividends received. When the Group’s share of losses of a joint venture exceeds the Group’s interest in that joint venture (which includes any
long-term interests that, in substance, form part of the Group’s net investment in the joint venture), the Group discontinues recognizing its share
of further losses. Additional losses are recognized only to the extent that the Group has incurred legal or constructive obligations or made payments
on behalf of the joint venture.
An investment in a joint venture is accounted for using the equity method from the date on which the investee becomes a joint venture. On
acquisition of the investment in a joint venture, any excess of the cost of the investment over the Group’s share of the net fair value of the
identifiable assets and liabilities of the investee is recognized as goodwill, which is included within the carrying amount of the investment. Any
excess of the Group’s share of the net fair value of the identifiable assets and liabilities over the cost of the investment, after reassessment, is
recognized immediately in the profit or loss in the period in which the investment is acquired.
Non-current assets held for sale and Discontinued Operations In compliance with IFRS 5 Non-current Assets Held for Sale and Discontinued Operations, non-current assets and disposal groups are classified
as held for sale if their carrying amounts will be recovered through a sale transaction rather than through continuing use.
This condition is regarded as met only when the sale is highly probable within one year, and the asset or disposal group is available for immediate
sale in its present condition. Non-current assets are measured at the lower of the previous carrying amount or the fair value less costs to sell.
Events or circumstances may extend the period to complete the sale beyond one year. An extension of the period required to complete a sale
does not preclude an asset from being classified as held for sale if the delay is caused by events or circumstances beyond the Group’s control,
and there is sufficient evidence that the Group remains committed to its plan to sell the asset. In such circumstances, the asset is measured at its
fair value less costs to sell at each reporting date. Any impairment loss arising subsequent to reclassification as held for sale is recognized in the
Consolidated Statement of Profit or Loss. Non-current assets and liabilities of a disposal group classified as held for sale are presented separately
from the other assets and liabilities in the balance sheet.
If criteria for classification of the asset as held for sale are no longer met at the reporting date, the Group ceases to classify the asset as held for
sale.
A discontinued operation is a component of the Group that either has been disposed of, or is classified as held for sale, and:
• Represents a separate major line of business or geographical area of operations;
• Is part of a single coordinated plan to dispose of a separate major line of business or geographical area of operations; or
• Is a Subsidiary acquired exclusively with a view to resale.
The result from discontinued operations is presented in the Consolidated Statement of Profit or Loss as a separate item after the profit from
continuing operations. If the criteria for classification of the disposal group held for sale are met after the reporting date, the disposal group is not

Kernel Holding S.A. Annual Report and Accounts 30 June 2019 86
www.kernel.ua
Notes to the Consolidated Statements continued for the year ended 30 June 2019 (in thousands of US dollars, unless otherwise stated)
The accompanying notes are an integral part of these financial statements.
Strategic
Report Sustainability
Corporate
Governance
Financial
Statements
presented as held for sale in those consolidated financial statements when issued. However, when those criteria are met after the reporting date
but before the authorization of the consolidated financial statements for issue, the Group discloses the relevant information in the notes to the
consolidated financial statements.
Fair Value Measurement Fair value is the price that would be received to sell an asset or paid to transfer a liability in an orderly transaction between market participants at
the measurement date. The fair value measurement is based on the presumption that the transaction to sell the asset or transfer the liability takes
place either in the principal market for the asset or liability, or in the absence of a principal market, in the most advantageous market for the asset
or liability. The principal or most advantageous market must be accessible to the Group.
The fair value of an asset or a liability is measured using the assumptions market participants would use when pricing the asset or liability,
assuming that market participants act in their economic best interest.
A fair value measurement of a non-financial asset takes into account a market participant’s ability to generate economic benefits by using the
asset in its highest and best use or by selling it to another market participant that would use the asset in its highest and best use. The Group uses
valuation techniques that are appropriate in the circumstances and for which sufficient data is available to measure fair value, maximizing the use
of relevant observable inputs and minimizing the use of unobservable inputs.
All assets and liabilities for which fair value is measured or disclosed in the consolidated financial statements are categorized within the fair value
hierarchy, described as follows, based on the lowest level input that is significant to the fair value measurement as a whole:
• Level 1: Quoted (unadjusted) market prices in active markets for identical assets or liabilities.
• Level 2: Valuation techniques for which the lowest level input that is significant to the fair value measurement is directly or indirectly observable.
• Level 3: Valuation techniques for which the lowest level input that is significant to the fair value measurement is unobservable.
For assets and liabilities that are recognized in the consolidated financial statements on a recurring basis, the Group determines whether transfers
have occurred between levels in the hierarchy by reassessing categorization (based on the lowest level input that is significant to the fair value
measurement as a whole) at the end of each reporting period.
Inventories Inventories are stated at the lower of cost or net realizable value. Cost consists of the purchase cost and, where applicable, those expenses that
have been incurred in bringing the inventories to their present location and condition. Cost is calculated using the first-in, first-out (FIFO) method.
Net realizable value is the estimated selling price in the ordinary course of business less the estimated costs of completion and the estimated
costs necessary to make the sale.
Biological Assets and Agricultural Produce The Group classifies crops in fields and cattle as biological assets. The Group recognizes a biological asset or agricultural produce when the
Group controls the asset as a result of past events, it is probable that future economic benefits associated with the asset will flow to the Group,
and the fair value or cost of the asset can be measured reliably.
Biological assets are stated at fair value less estimated costs to sell at both initial recognition and as of the reporting date, with any resulting gain
or loss recognized in the Consolidated Statement of Profit or Loss. Costs to sell include all costs that would be necessary to sell the assets,
including costs necessary to get the assets to market.
Agricultural produce harvested from biological assets is measured at its fair value less costs to sell estimated at the point of harvest. A gain or
loss arising from the initial recognition of agricultural produce at fair value less costs to sell is included in the Consolidated Statement of Profit or
Loss.
Biological assets for which quoted market prices are not available and for which alternative estimates of fair value are considered to be clearly
unreliable are measured using the present value of expected net cash flows from the sale of an asset discounted at a current market-determined
rate. The objective of a calculation of the present value of expected net cash flows is to determine the fair value of a biological asset in its present
location and condition.
Cost of agricultural preparation of fields before seeding is recorded as work-in-progress in inventories. After seeding, the cost of field preparation
is recognized as biological assets held at fair value less costs to sell.
The Group classifies biological assets as current or non-current depending upon the average useful life of the particular group of biological assets.
All of the Group’s biological assets except non-current cattle were classified as current, as their average useful life is less than one year.
Property, Plant, and Equipment Buildings, constructions, production machinery and equipment (Oilseed Processing segment) are accounted for at revalued amounts, being the
fair value, which is determined using external professional expert evaluation. Revaluations are performed with sufficient regularity such that the
carrying amount does not differ materially from that which would be determined using fair values at the reporting date. Any accumulated depreci-
ation at the date of revaluation is eliminated against the gross carrying amount of the asset, and the net amount is restated to the revalued amount
of the asset.
If the asset’s carrying amount is increased as a result of a revaluation, the increase is credited directly to other comprehensive income and
accumulated in revaluation reserve in equity. However, such an increase is recognized in the Consolidated Statement of Profit or Loss to the

Kernel Holding S.A. Annual Report and Accounts 30 June 2019 87
www.kernel.ua
Notes to the Consolidated Statements continued for the year ended 30 June 2019 (in thousands of US dollars, unless otherwise stated)
The accompanying notes are an integral part of these financial statements.
Strategic
Report Sustainability
Corporate
Governance
Financial
Statements
extent that it reverses a revaluation decrease of the same asset previously recognized in the Consolidated Statement of Profit or Loss. If the
asset’s carrying amount is decreased as a result of a revaluation, the decrease is recognized in the Consolidated Statement of Profit or Loss.
However, such a decrease is debited directly to the Other Comprehensive Income or Loss to the extent of any credit balance existing in the
revaluation surplus with respect to that asset.
Depreciation on revalued assets is charged to the Consolidated Statement of Profit or Loss. On the subsequent sale or retirement of revalued
assets, the revaluation surplus remaining in the revaluation reserve is transferred directly to retained earnings. No transfer is made from the
revaluation reserve to retained earnings except when an asset is derecognized. Property, plant and equipment are depreciated over the estimated
useful economic lives of assets under the straight-line method.
Useful lives of property, plant, and equipment are as follows:
Buildings and constructions 20 - 50 years
Production machinery and equipment 10 - 20 years
Agricultural equipment and vehicles 3 - 10 years
Other fixed assets 5 - 20 years
Construction in progress (CIP) and uninstalled equipment not depreciated
Except for land, building and constructions and production machinery and equipment of Oilseed Processing segment, all other property, plant and
equipment is stated at historical cost less depreciation and accumulated impairment losses. Land is carried at cost less accumulated impairment
losses and is not depreciated.
Capitalized costs include major expenditures for improvements and replacements that extend the useful lives of assets or increase their revenue-
generating capacity. Repairs and maintenance expenditures that do not meet the foregoing criteria for capitalization are presented the Consoli-
dated Statement of Profit or Loss as incurred.
Construction in progress consists of costs directly related to the construction of property, plant and equipment including an appropriate allocation
of directly attributable variable overhead incurred during construction. Depreciation of these assets commences when the assets are put into
operation.
An item of property, plant and equipment is derecognized upon disposal or when no future economic benefits are expected to arise from the
continued use of the asset. Any gain or loss arising from the disposal or retirement of an item of property, plant and equipment is determined as
the difference between the sales proceeds and the carrying amount of the asset and is recognized in the Consolidated Statement of Profit or Loss.
Intangible Assets Intangible assets with finite useful lives that are acquired separately are carried at cost less accumulated depreciation and accumulated impairment
losses. Amortization is primarily recognized within “Cost of Sales” on a straight-line basis over their estimated useful lives. The amortization
method and estimated useful life are reviewed annually with the effect of any changes in estimate being accounted for on a prospective basis.
Intangible assets with indefinite useful lives that are acquired separately shall not be amortized and are carried at cost less accumulated impair-
ment loss.
Trademarks The ‘Schedry Dar’, ‘Stozhar’, ‘Zolota’ and ‘Domashnya’ trademarks have indefinite useful lives and are not amortized but tested for impairment by
comparing their recoverable amount with their carrying amount annually on 30 June and whenever there is an indication that the trademarks may
be impaired.
Land Lease Rights Land lease rights acquired in a business combination are recognized separately from goodwill at their fair value at the acquisition date (which is
subsequently regarded as their cost).
Amortization of land lease rights is calculated on a straight-line basis during the term of a lease contract. For land lease rights acquired in business
combination, the amortization period varies from 1 to 22 years. The amortization period for emphyteusis contracts varies from 20 to 90 years.
Subsequent to initial recognition, intangible assets acquired in a business combination are reported at cost less accumulated amortization and
accumulated impairment losses, on the same basis as intangible assets that are acquired separately.
An intangible asset is derecognized on disposal, or when no future economic benefits are expected from use or disposal. Gains or losses arising
from derecognition of an intangible asset, measured as the difference between the net disposal proceeds and the carrying amount of the asset,
are recognized in the Consolidated Statement of Profit or Loss when the asset is derecognized.
Impairment of tangible and intangible assets, except Goodwill At each reporting date, the Group reviews the carrying amounts of the Group’s non-current assets to determine whether there is any indication
that those assets have suffered an impairment loss. If any such indication exists, the recoverable amount of the assets is estimated in order to
determine the extent of the impairment loss (if any). Where it is not possible to estimate the recoverable amount of an individual asset, the Group
estimates the recoverable amount of the cash-generating unit to which the asset belongs.
The recoverable amount is the higher of fair value less costs to sell and value in use. In assessing value in use, the estimated future cash flows
are discounted to their present value using a discount rate that reflects current market assessments of the time value of money and the risks

Kernel Holding S.A. Annual Report and Accounts 30 June 2019 88
www.kernel.ua
Notes to the Consolidated Statements continued for the year ended 30 June 2019 (in thousands of US dollars, unless otherwise stated)
The accompanying notes are an integral part of these financial statements.
Strategic
Report Sustainability
Corporate
Governance
Financial
Statements
specific to the asset for which the estimates of future cash flows have not been adjusted.
If the recoverable amount of an asset (or cash-generating unit) is estimated to be less than its carrying amount, the carrying amount of the asset
(or cash-generating unit) is reduced to its recoverable amount. An impairment loss is recognized immediately in the Consolidated Statement of
Profit or Loss, unless the relevant asset is carried at a revalued amount, in which case the impairment loss is treated as a revaluation decrease.
Where an impairment loss subsequently reverses, the carrying amount of the asset (or a cash-generating unit) is increased to the revised estimate
of its recoverable amount to the extent that the increased carrying amount does not exceed the carrying amount that would have been determined
had no impairment loss been recognized for the asset (or cash-generating unit) in prior years. A reversal of an impairment loss is recognized
immediately in the Consolidated Statement of Profit or Loss, unless the relevant asset is carried at a revalued amount, in which case the reversal
of the impairment loss is treated as a revaluation increase.
Financial Instruments
Financial asset and financial liability are recognized in the Group’s Consolidated Statement of Financial Position when, and only when, the Group
entity becomes a party to the contractual provisions of the instrument.
Cash and cash equivalents include cash on hand, cash with banks, and deposits with original maturities of three months or less.
Financial assets are classified as either to the following categories financial assets at amortized cost, at fair value through other comprehensive
income (FVTOCI) or at fair value through profit or loss (FVTPL). The classification depends on the nature and purpose of the financial assets or
financial liabilities and is determined at the time of initial recognition.
The Group does not have financial instruments carried at FVTOCI. The Group measures derivative instruments and investments made in equity
instruments at FVTPL, all other financial instruments are measured at amortized cost.
Financial assets and financial liabilities are initially measured at fair value. All recognized financial assets are measured subsequently in their
entirety at either amortized cost or fair value, depending on the classification of the financial assets. All financial liabilities are measured subse-
quently at amortized cost using the effective interest method or at FVTPL. Transaction costs that are directly attributable to the acquisition or issue
of financial assets and financial liabilities (other than financial assets and financial liabilities at fair value through profit or loss) are added to or
deducted from the fair value of the financial assets or financial liabilities, as appropriate, on initial recognition. Transaction costs directly attributable
to the acquisition of financial assets or financial liabilities at fair value through profit or loss are recognized immediately in profit or loss.
Amortized cost and effective interest method
The Group measures financial assets at amortized cost if both of the following conditions are met:
• The financial asset is held within a business model with the objective to hold financial assets in order to collect contractual cash flows; and
• The contractual terms of the financial asset give rise on specified dates to cash flows that are solely payments of principal and interest on the principal amount outstanding
Financial assets at amortized cost are subsequently measured using the effective interest method and are subject to impairment. Gains and losses
are recognized in profit or loss when the asset is derecognized, modified or impaired.
The effective interest method calculates the amortized cost of a debt instrument and allocates interest income over the relevant period. The
effective interest rate is the rate that exactly discounts estimated future cash receipts (including all fees and points paid or received that form an
integral part of the effective interest rate, transaction costs and other premiums or discounts) through the expected life of the debt instrument, or,
where appropriate, a shorter period, to the net carrying amount on initial recognition.
Interest income is recognized on an effective interest basis for debt instruments other than those financial assets classified as at fair value through
profit or loss. The effect of initial recognition of financial assets and liabilities obtained/incurred at terms below the market is recognized net of the
tax effect as an income or expense, except for financial assets and liabilities with shareholders or entities under common control, whereby the
effect is recognized through equity.
Financial assets at FVTPL
Financial assets that do not meet the criteria for being measured at amortized cost or FVTOCI are measured at FVTPL. Specifically:
• Investments in equity instruments are classified as at FVTPL, unless the Group designates an equity investment that is neither held for trading nor a contingent consideration arising from a business combination as at FVTOCI on initial recognition;
• Debt instruments that do not meet the amortized cost criteria or the FVTOCI criteria are classified as at FVTPL. In addition, debt instruments that meet either the amortized cost criteria or the FVTOCI criteria may be designated as at FVTPL upon initial recognition if such designation eliminates or significantly reduces a measurement or recognition inconsistency (so called ‘accounting mismatch’) that would arise from meas-uring assets or liabilities or recognizing the gains and losses on them on different bases. The Group has not designated any debt instruments as at FVTPL.
Financial assets at FVTPL are measured at fair value at the end of each reporting period, with any fair value gains or losses recognized in profit
or loss to the extent they are not part of a designated hedging relationship. The net gain or loss recognized in profit or loss includes any dividend
or interest earned on the financial asset.
Derecognition of financial assets
The Group derecognizes a financial asset only when the contractual rights to the cash flows from the asset expire, or when it transfers the financial
asset and all the risks and rewards to another entity. If the Group neither transfers nor substantially retains all the risks and rewards of ownership
Kernel Holding S.A. Annual Report and Accounts 30 June 2019 89
www.kernel.ua
Notes to the Consolidated Statements continued for the year ended 30 June 2019 (in thousands of US dollars, unless otherwise stated)
The accompanying notes are an integral part of these financial statements.
Strategic
Report Sustainability
Corporate
Governance
Financial
Statements
and continues to control the transferred asset, the Group recognizes its retained interest in the asset and associated liability for amounts it may
have to pay. If the Group substantially retains all the risks and rewards of ownership of a transferred financial asset, the Group continues to
recognize the financial asset and also recognizes collateralized borrowing for the proceeds received.
On derecognition of a financial asset in its entirety, the difference between the asset’s carrying amount and the sum of the consideration received
and receivable and the cumulative gain or loss that had been recognized in other comprehensive income and accumulated in equity is recognized
in the Consolidated Statement of Profit or Loss.
On derecognition of a financial asset other than in its entirety (e.g. when the Group retains an option to repurchase part of a transferred asset or
retains a residual interest that does not result in the retention of substantially all the risks and rewards of ownership and the Group retains control),
the Group allocates the previous carrying amount of the financial asset between the part it continues to recognize under continuing involvement,
and the part it no longer recognizes on the basis of the relative fair values of those parts on the date of the transfer. The difference between the
carrying amount allocated to the part that is no longer recognized and the sum of the consideration received for the part no longer recognized and
any cumulative gain or loss allocated to it that had been recognized in other comprehensive income is recognized in the Consolidated Statement
of Profit or Loss. A cumulative gain or loss that had been recognized in other comprehensive income is allocated between the part that continues
to be recognized and the part that is no longer recognized on the basis of the relative fair values of those parts.
Impairment of financial assets
The Group recognizes a loss allowance for ECL (expected credit losses) on a financial asset, other than those at FVTPL, at the end of each
reporting period. The amount of ECL and other current assets is updated at each reporting date to reflect changes in credit risk since initial
recognition of the respective financial instrument.
The Group applies a simplified approach permitted by IFRS to measuring ECL which uses a lifetime expected loss allowance for trade receivables
and other current assets. The ECL on trade receivables and other current assets is estimated using a provision matrix, based on historical credit
loss experience and credit rating of customers, adjusted on observable and reasonable information.
Lifetime ECL represents the expected credit losses that will result from all possible default events over the expected life of a financial instrument.
In contrast, 12-month ECL represents the portion of lifetime ECL that is expected to result from default events on a financial instrument that are
possible within 12 months after the reporting date.
Definition of default
The Group considers the following as constituting an event of default for internal credit risk management purposes as historical experience indi-
cates that financial assets that meet either of the following criteria are generally not recoverable:
• when there is a breach of financial covenants by the debtor; or
• information developed internally or obtained from external sources indicates that the debtor is unlikely to pay its creditors, including the Group, in full (without taking into account any collateral held by the Group).
Irrespective of the above analysis, the Group considers that default has occurred when a financial asset is more than 90 days past due unless the
Group has reasonable and supportable information to demonstrate that a more lagging default criterion is more appropriate.
Financial liabilities measured subsequently at amortized cost
Financial liabilities that are not (i) contingent consideration of an acquirer in a business combination, (ii) held‑for‑trading, or (iii) designated as at
FVTPL, are measured subsequently at amortized cost using the effective interest method.
Financial liabilities at FVTPL
Financial liabilities are classified as at FVTPL when the financial liability is (i) contingent consideration of an acquirer in a business combination,
(ii) held for trading or (iii) it is designated as at FVTPL.
A financial liability is classified as held for trading if:
• it has been acquired principally for the purpose of repurchasing it in the near term; or
• on initial recognition it is part of a portfolio of identified financial instruments that the Group manages together and has a recent actual pattern of short‑term profit‑taking; or
• it is a derivative, except for a derivative that is a financial guarantee contract or a designated and effective hedging instrument.

Kernel Holding S.A. Annual Report and Accounts 30 June 2019 90
www.kernel.ua
Notes to the Consolidated Statements continued for the year ended 30 June 2019 (in thousands of US dollars, unless otherwise stated)
The accompanying notes are an integral part of these financial statements.
Strategic
Report Sustainability
Corporate
Governance
Financial
Statements
A financial liability other than a financial liability held for trading or contingent consideration of an acquirer in a business combination may be
designated as at FVTPL upon initial recognition if:
• such designation eliminates or significantly reduces a measurement or recognition inconsistency that would otherwise arise; or
• the financial liability forms part of a group of financial assets or financial liabilities or both, which is managed and its performance is evaluated on a fair value basis, in accordance with the Group’s documented risk management or investment strategy, and information about the grouping is provided internally on that basis; or
• it forms part of a contract containing one or more embedded derivatives, and IFRS 9 permits the entire combined contract to be designated as at FVTPL.
Financial liabilities at FVTPL are measured at fair value, with any gains or losses arising on changes in fair value recognized in profit or loss to
the extent that they are not part of a designated hedging relationship. The net gain or loss recognized in profit or loss incorporates any interest
paid on the financial liability.
However, for financial liabilities that are designated as at FVTPL, the amount of change in the fair value of the financial liability that is attributable
to changes in the credit risk of that liability is recognized in other comprehensive income, unless the recognition of the effects of changes in the
liability’s credit risk in other comprehensive income would create or enlarge an accounting mismatch in profit or loss. The remaining amount of
change in the fair value of liability is recognized in profit or loss. Changes in fair value attributable to a financial liability’s credit risk that are
recognized in other comprehensive income are not subsequently reclassified to profit or loss; instead, they are transferred to retained earnings
upon derecognition of the financial liability.
Derecognition of financial liabilities
The Group derecognizes financial liabilities when, and only when, the Group’s obligations are discharged, cancelled or have expired. The differ-
ence between the carrying amount of the financial liability derecognized and the consideration paid and payable is recognized in profit or loss.
When the Group exchanges with the existing lender one debt instrument into another one with the substantially different terms, such exchange is
accounted for as an extinguishment of the original financial liability and the recognition of a new financial liability. Similarly, the Group accounts
for substantial modification of terms of an existing liability or part of it as an extinguishment of the original financial liability and the recognition of
a new liability. It is assumed that the terms are substantially different if the discounted present value of the cash flows under the new terms,
including any fees paid net of any fees received and discounted using the original effective rate is at least 10 per cent different from the discounted
present value of the remaining cash flows of the original financial liability. If the modification is not substantial, the difference between:
(1) the carrying amount of the liability before the modification; and
(2) the present value of the cash flows after modification should be recognized in profit or loss as the modification gain or loss within other
gains and losses.
Commodity derivatives
The Group enters into variety of derivative financial instruments including futures, options and physical contracts to buy or sell commodities, which
do not meet the own use exemption. These derivatives are initially recognized at fair value at the date the derivative contracts are entered into
and are subsequently remeasured to their fair value at the end of each reporting period. The resulting gain or loss is recognized immediately in
the profit or loss within Other operating income, net, unless the derivative is designated and effective hedging instrument, in which case the timing
of the recognition in profit or loss depends on the nature of the hedge relationship. Fair values are determined using quoted market prices, broker
quotations or using models and other valuation techniques.
A derivative with a positive fair value is recognized as a financial asset whereas a derivative with a negative fair value is recognized as a financial
liability.
Other financial assets include margin accounts that are represented by variation margin and initial margin held in respect of open exchange-traded
futures and forwards contracts. Margin accounts are measured at amortized cost.
Derivatives are not offset in the consolidated financial statements unless the Group has both legal right and intention to offset. As of 30 June 2019
and 2018, the impact of the Master Netting Agreements on the Group’s financial position was not material.
Leases Leases are classified as finance leases whenever the terms of the lease transfer substantially all the risks and rewards of ownership to the lessee.
All other leases are classified as operating leases.
Assets held under finance leases are recognized as assets of the Group at their fair value at the inception of the lease or, if lower, at the present
value of the minimum lease payments. The corresponding liability to the lessor is included in the Consolidated Statement of Financial Position as
an obligation under finance lease.
Finance costs, which represent the difference between the total leasing commitments and the fair value of the assets acquired, are charged to
income over the term of the relevant lease so as to produce a constant periodic rate of charge on the remaining balance of the obligations for
each accounting period.
Rentals payable under operating leases are charged to income on a straight-line basis over the term of the relevant lease except where another
more systematic basis is more representative of the time pattern in which economic benefits from the lease asset are consumed.
Kernel Holding S.A. Annual Report and Accounts 30 June 2019 91
www.kernel.ua
Notes to the Consolidated Statements continued for the year ended 30 June 2019 (in thousands of US dollars, unless otherwise stated)
The accompanying notes are an integral part of these financial statements.
Strategic
Report Sustainability
Corporate
Governance
Financial
Statements
Taxes Recoverable and Prepaid Taxes recoverable and prepaid are stated at their nominal value and reduced by appropriate allowances for estimated irrecoverable amounts.
Employee Benefits Certain entities within the Group participate in a mandatory government defined retirement benefit plan, which provides for early pension benefits
for employees working in certain workplaces with hazardous and unhealthy working conditions. The Group also provides lump sum benefits upon
retirement subject to certain conditions. For defined benefit retirement benefit plans, the cost of providing benefits is determined using the Projected
Unit Credit Method, with actuarial valuations being carried out at the end of each annual reporting period.
The liability recognized in the Consolidated Statement of Financial Position with respect to the defined benefit pension plan is the present value
of the defined benefit obligation at the reporting date, less adjustments for unrecognized actuarial gains or losses and past service costs. The
defined benefit obligation is calculated annually by actuaries using the projected unit credit method. The present value of the defined benefit
obligation is determined by discounting the estimated future cash outflows using interest rates of high-quality corporate bonds that are denomi-
nated in the currency in which the benefits will be paid.
Equity-settled Transactions Equity-settled share-based payments with employees are measured by reference to the fair value at the grant date and are recognized as an
expense over the vesting period, which ends on the date the relevant employees become fully entitled to the award.
Fair value is calculated using the Black-Scholes model. No expense is recognized for awards that do not ultimately vest.
At each reporting date before vesting, the cumulative expense is calculated representing the extent to which the vesting period has expired and
management’s best estimate of the achievement or otherwise of non-market conditions and of the number of equity instruments that will ultimately
vest. The movement in cumulative expense since the previous reporting date is recognized in the Consolidated Statement of Profit or Loss, with
a corresponding entry in equity.
Provisions A provision is recognized in the Consolidated Statement of Financial Position when the Group has a legal or constructive obligation as a result of
a past event, and it is probable that an outflow of economic benefits will be required to settle the obligation and a reliable estimate of the obligation
amount can be made. The amount recognized as a provision is the best estimate of the consideration required to settle the present obligation at
the reporting date, taking into account the risks and uncertainties surrounding the obligation.
Contingencies Contingent liabilities are not recognized in the consolidated financial statements. They are disclosed unless the possibility of an outflow of re-
sources embodying economic benefits is remote. A contingent asset is not recognized in the consolidated financial statements but is disclosed
when an inflow of economic benefits is probable.
Revenue from contracts with customers Sale of Goods and Finished Products
The Group produces and sells a range of agricultural commodities, sunflower oil and meal in the wholesale market. Revenue from contracts with
customers is recognized when control of the goods or services are transferred to the customer at an amount that reflects the consideration to
which the Group expects to be entitled in exchange for those goods or services. A receivable is recognized by the Group when the control over
goods is transferred to the wholesaler as this represents the point of time at which the right to consideration becomes unconditional, as only the
passage of time is required before payment is due. Timing of billing is generally close to the timing of performance obligation satisfaction, respec-
tively, amount of contract assets and contract liabilities is not material.
The promise to provide freight and insurance services after control is transferred is a separate performance obligation for which part of the
transaction price is allocated. Revenue relating to these services is recognized over time. The transaction price allocated to these services is
recognized as a contract liability at the time of the initial sales transaction and is released on a straight-line basis over the period of service. For
provision of such services the Group regularly engages third-party service providers to provide freight and other services to its customers. When
the Group obtains a contract from a customer, the Group enters into a contract with one of those service providers, directing the service provider
to render freight and other services for the customer. The Group is obliged to pay the service provider even if the customer fails to pay. Also, the
Group is responsible for inventory risk during the freight service provision
Rendering of Services
Revenue is recognized over the period of time as the service is rendered. The main type of services provided by the Group are transshipment
services by terminals and crop cleaning, drying and storage services by the Group’s silos. Revenue from transshipment services is recognized
using input methods based on a time-and-materials basis as the services are provided. Revenue from grain cleaning, drying and storage services
is recognized on an accrual basis, based on the fees for the specific service, volumes of crops under service and days of storage.
VAT benefits Till 31 December 2016, in accordance with the Tax Code of Ukraine the Group’s enterprises that qualify as agricultural producers were entitled to
retain a portion of net VAT payable which were recognized as VAT benefits. Starting from 1 January 2017 the special VAT treatment regime has
been abolished but VAT benefits on prepayments received up to this date are recognized upon subsequent sales.

Kernel Holding S.A. Annual Report and Accounts 30 June 2019 92
www.kernel.ua
Notes to the Consolidated Statements continued for the year ended 30 June 2019 (in thousands of US dollars, unless otherwise stated)
The accompanying notes are an integral part of these financial statements.
Strategic
Report Sustainability
Corporate
Governance
Financial
Statements
Government grants Government grants are not recognized until there is reasonable assurance that the Group will comply with the conditions attaching to them and
that the grants will be received.
Government grants are recognized in profit or loss on a systematic basis over the periods in which the Group recognizes as expenses the related
costs for which the grants are intended to compensate. Specifically, government grants whose primary condition is that the Group should purchase,
construct or otherwise acquire non-current assets are recognized as deferred income in the consolidated statement of financial position and
transferred to profit or loss on a systematic and rational basis over the useful lives of the related assets.
Government grants that are receivable as compensation for expenses or losses already incurred or for the purpose of giving immediate financial
support to the Group with no future related costs are recognized in profit or loss in the period in which they become receivable.
Borrowing Costs Borrowing costs directly attributable to the acquisition, construction or production of qualifying assets, which are assets that necessarily take a
substantial period of time to get ready for their intended use or sale, are added to the cost of those assets, until such time as the assets are
substantially ready for their intended use or sale.
Investment income earned on the temporary investment of specific borrowing spending their expenditure on qualifying assets is deducted from
the borrowing costs eligible for capitalization.
All other borrowing costs are recognized in the Consolidated Statement of Profit or Loss in the period in which they are incurred. The interest
expense component of finance lease payments is recognized in the Consolidated Statement of Profit or Loss using the effective interest rate
method.
Taxation Income taxes have been provided for in the consolidated financial statements in accordance with legislation currently enacted in the legal juris-
dictions where the operating entities are located. Income tax expense represents the sum of the tax currently payable and deferred tax expense.
Current and deferred tax for the year Current and deferred tax are recognized in the Consolidated Statement of Profit or Loss, except when they relate to items that are recognized in
other comprehensive income or directly in equity, in which case, the current and deferred tax are also recognized in other comprehensive income
or directly in equity, respectively. Where current tax or deferred tax arises from the initial accounting for a business combination, the tax effect is
included in the accounting for the business combination.
Current tax The current income tax charge is the amount expected to be paid to, or recovered from, taxation authorities with respect to taxable profit or losses
for the current or previous periods. It is calculated using tax rates that have been enacted or substantially enacted by the reporting date in the
countries where the Holding and its Subsidiaries operate and generate taxable income. Taxable profit differs from ‘profit before tax’ because of
items of income or expense that are taxable or deductible in other years and items that are never taxable or deductible taxes other than income
tax are recorded within operating expenses. Some of the Group’s companies that are involved in agricultural production are exempt from income
taxes and pay the Unified Agricultural Tax instead.
Deferred tax Deferred income tax is recognized on temporary differences arising between the carrying amount of assets and liabilities in the financial statements
and their corresponding tax bases used in the computation of taxable profit. Deferred tax balances are measured at tax rates enacted or substan-
tively enacted at the end of the reporting period that are expected to apply to the period when the temporary differences will reverse, or the tax
loss carried forward will be utilized. Deferred tax assets for deductible temporary differences and tax losses carried forward are recorded only to
the extent that it is probable that future taxable profit will be available against which the deductions can be utilized.
The carrying amount of deferred tax assets is reviewed at the end of each reporting period and reduced to the extent that it is no longer probable
that sufficient taxable profits will be available to allow all or part of the asset to be recovered.
Deferred tax liabilities for taxable temporary differences associated with investments in Subsidiaries and joint ventures are recognized, except
when the Group is able to control the reversal of the temporary difference and it is probable that the temporary difference will not reverse in the
foreseeable future.
Deferred tax assets and liabilities are offset when:
• The Group has a legally enforceable right to set off the recognized amounts of current tax assets and current tax liabilities;
• The Group has the intention to settle on a net basis, or to realize the asset and settle the liability simultaneously;
• The deferred tax assets and the deferred tax liabilities relate to income taxes levied by the same taxation authority in each future period in which significant amounts of deferred tax liabilities and assets are expected to be settled or recovered.
Reclassifications Certain reclassifications have been made to the consolidated financial statements as of 30 June 2018 and for the year then ended to conform to
the current year’s presentation.

Kernel Holding S.A. Annual Report and Accounts 30 June 2019 93
www.kernel.ua
Notes to the Consolidated Statements continued for the year ended 30 June 2019 (in thousands of US dollars, unless otherwise stated)
The accompanying notes are an integral part of these financial statements.
Strategic
Report Sustainability
Corporate
Governance
Financial
Statements
4. Critical Accounting Judgments and Key Sources of Estimation Uncertainty The application of IFRS requires the use of reasonable judgments, assumptions and estimates. These estimates and assumptions affect the
reported amounts of assets and liabilities and the disclosure of contingent assets and liabilities at the date of the consolidated financial statements.
The estimates are based on the information available as of the reporting date. Actual results could differ from these estimates.
The estimates and underlying assumptions are reviewed on an ongoing basis. Revisions to accounting estimates are recognized in the period in
which the estimate is revised if the revision affects only that period or in the period of the revision and future periods if the revision affects both
current and future periods.
Critical Judgments in Applying Accounting Policies The following are the critical judgments, apart from those involving estimations (see below), that management has made in the process of applying
the Group’s accounting policies and that have the most significant effect on the amounts recognized in the consolidated financial statements.
Revenue Recognition In the normal course of business, the Group engages in sale and purchase transactions for the purpose of exchanging grain in various locations
to fulfill the Group’s production and trading requirements. In accordance with the Group’s accounting policy, revenue is not recognized with respect
to the exchange transactions involving goods of a similar nature and value. The Group’s management applies judgment to determine whether
each particular transaction represents an exchange or a transaction that generates revenue. In making this judgment, management considers
whether the underlying grain is of similar type and quality, as well as whether the time passed between the transfer and receipt of the underlying
grain indicates that the substance of the transaction is an exchange of similar goods. The amount of exchange transactions involving goods of a
similar nature amounted to USD 105,783 thousand and USD 34,305 thousand for the years ended 30 June 2019 and 2018, respectively.
Revaluation of Property, Plant and Equipment As described in Note 3, the Group applies the revaluation model to the measurement of buildings and constructions and production machinery
and equipment (bulk and bottled oil segments). At each reporting date, the Group carries out a review of the carrying amount of these assets to
determine whether the carrying amount differs materially from fair value. The Group carries out such a review by preparing a discounted cash flow
analysis involving assumptions on projected revenues and costs, and a discount rate. Additionally, the Group considers economic stability and
the availability of transactions with similar assets in the market when determining whether to perform a fair value assessment in a given period.
Useful Lives of Property, Plant and Equipment The Group’s property, plant and equipment are depreciated using the straight-line method over their estimated useful lives, which are based on
management’s business plans and operational estimates.
The factors that could affect the estimation of the life of a non-current asset and its residual value include the following:
• Changes in technology;
• Changes in maintenance technology;
• Changes in regulations and legislation; and
• Unforeseen operational issues.
Any of the above could affect the prospective depreciation of property, plant and equipment and their carrying and residual values. The Group
reviews the estimated useful lives of property, plant and equipment at the end of each annual reporting period. The review is based on the current
condition of the assets and the estimated period during which they will continue to bring economic benefit to the Group. Any change in the
estimated useful life or residual value is recorded on a prospective basis from the date of the change.
Key sources of estimation uncertainty The following are the key assumptions concerning the future, and other key sources of estimating uncertainty at the end of the reporting period,
that have a significant risk of causing a material adjustment to the carrying amounts of assets and liabilities within the next financial year.
Revaluation of Property, Plant and Equipment The Group appointed an independent appraiser to perform a revaluation of buildings, constructions, production machinery and equipment used
in the sunflower oil segments (Oilseed Processing segment) as of 30 June 2019. The independent appraiser has performed the valuation in
accordance with International Valuation Standards applying the following techniques:
• depreciated replacement cost for buildings and constructions; and
• depreciated replacement cost and market comparable approach, if applicable, for production machinery and equipment.
Depreciated replacement cost reflects the cost to a market participant to purchase or construct the comparable asset, adjusted for physical,
functional or economical depreciation, and obsolescence. Depreciated replacement cost approach was based on internal sources and analysis of
the Ukrainian and international markets for similar property, plant and equipment. Economical obsolescence was determined using the discounted
cash flow method. Cash flows were projected based on past experience, actual operating results and analyses of market inputs. The fair value
of non-specialized in nature property, plant and equipment had been determined using market approach that reflects recent transaction prices for
comparable assets.

Kernel Holding S.A. Annual Report and Accounts 30 June 2019 94
www.kernel.ua
Notes to the Consolidated Statements continued for the year ended 30 June 2019 (in thousands of US dollars, unless otherwise stated)
The accompanying notes are an integral part of these financial statements.
Strategic
Report Sustainability
Corporate
Governance
Financial
Statements
Key assumptions used by the independent appraiser in assessing the fair value of property, plant and equipment using the replacement cost and
market comparable methods were as follows:
• present condition of particular assets based on examination of valuation experts and physical wear-and-tear;
• changes in prices of equipment, construction materials and services from the date of their acquisition/construction to the date of valuation represented by inflation rates;
• external prices for production machinery and equipment; and
• other external and internal factors that might have effect on fair value of property, plant and equipment under review.
The results of revaluation using the depreciated replacement cost and market comparable approaches were then compared with results of income
approach for corresponding assets to test whether impairment indicators exist.
Description Fair value as of
30 June 2019
Value
techniques
Fair value
hierarchy
Unobservable
inputs
Range of unobserva-
ble inputs (average)
Relationship of unobserva-
ble inputs to fair value
Buildings and
constructions
207,882 Depreciated
replacement cost
Level 3
Index of
physical
depreciation
0 - 80% (36%) The higher the index of
physical depreciation, the
lower the fair value
Production machinery
and equipment
68,314 Depreciated
replacement cost
Level 3
Index of
physical
depreciation
0 - 82 (56%) The higher the index of
physical depreciation, the
lower the fair value
Production machinery
and equipment
19,123 Market
comparables
Level 3
Index of
physical
depreciation
0 - 82 (69%) The higher the index of
physical depreciation, the
lower the fair value
If the above unobservable inputs to the valuation model were 5 p. p. higher/lower while all other variables were held constant, the carrying amount
of the buildings and constructions and production machinery and equipment would decrease/increase by USD 20,349 thousand and USD 22,154
thousand, respectively.
Distribution of revaluation surpluses to participants is denoted by local legislation.
Impairment Testing of Property, Plant and Equipment Management reviews the carrying amounts of assets to determine whether there is any indication that those assets are impaired.
In making the assessment for impairment, assets that do not generate independent cash flows are allocated to an appropriate cash-generating
unit.
The assessment of whether there are indicators of a potential impairment are based on various assumptions including market conditions, asset
utilization and the ability to utilize the asset for alternative purposes. If an indication of impairment exists, the Group estimates the recoverable
value (greater of fair value less cost to sell and value in use) and compares it to the carrying value, and records impairment to the extent the
carrying value is greater than the recoverable amount.
The value in use is based on estimated future cash flows that are discounted to their present value. Estimated future cash flows require manage-
ment to make a number of assumptions including customer demand and industry capacity, future growth rates and the appropriate discount rate.
Any change in these estimates may result in impairment in future periods.
As of 30 June 2019, no indicators of property, plant and equipment impairment have been identified except for the results of revaluation of property,
plant and equipment (Note 31).
Impairment Testing of Goodwill and Intangible Assets with Indefinite Useful Lives Determining whether goodwill is impaired requires an estimation of the value in use or fair value less costs to sell of the cash-generating units to
which goodwill has been allocated. The calculation of value in use requires management to estimate the future cash flows expected to arise from
the cash-generating unit and a suitable discount rate in order to calculate their present value.
As of 30 June 2019, the carrying amount of goodwill and intangible assets with indefinite useful lives amounted to USD 120,836 thousand (30
June 2018: USD 116,676 thousand). As of 30 June 2019, no impairment loss for goodwill and intangible assets with indefinite useful lives was
recognized (Notes 16, 17) (30 June 2018: USD 577 thousand). Details of the management assumptions used to assess the recoverable amount
of cash-generating units for which goodwill and intangible assets with indefinite useful lives have been allocated to are provided in Notes 16 and
Note 17.
Provision for ECL of trade and other receivables and contract assets The Group uses a provision matrix to calculate ECLs for trade and other receivables and contract assets. The provision rates are based on days
past due for groupings of various customer segments that have similar loss patterns (i.e., by customer type and rating). The amount of ECL is
sensitive to changes in circumstances and of forecasts economic conditions. The Group uses reasonable and supportable forward-looking infor-
mation for the forecast of economic conditions when measuring ECL. Loss given default is an estimate of the loss arising on default. It is based
on the difference between the contractual cash flows due and those that the lender would expect to receive, taking into account cash flows from
collateral and integral credit enhancements.

Kernel Holding S.A. Annual Report and Accounts 30 June 2019 95
www.kernel.ua
Notes to the Consolidated Statements continued for the year ended 30 June 2019 (in thousands of US dollars, unless otherwise stated)
The accompanying notes are an integral part of these financial statements.
Strategic
Report Sustainability
Corporate
Governance
Financial
Statements
Fair Value of Biological Assets and Agricultural Produce Biological assets are recorded at fair value less costs to sell. The Group estimates the fair values of biological assets and agricultural produce
based on the following key assumptions:
• Expected crop output (for crops in fields);
• Expected future inflows from livestock;
• Average number of heads of milk cows and its weight;
• Productive life of one milk cow;
• Estimated changes in future sales prices;
• Projected production costs and costs to sell; and
• Discount rate.
Although some of these assumptions are obtained from published market data, a majority of these assumptions are estimated based on the
Group’s historical and projected results (Note 13).
Fair value measurements Derivative instruments are carried at fair value for which the Group evaluates the quality and reliability of the assumptions and data used to
measure fair value in the three hierarchy levels, Level 1, 2 and 3, as prescribed by IFRS 13 Fair Value Measurement. Fair values are determined
in the following ways: externally verified via comparison to quoted market prices in active markets (Level 1); by using models with externally
verifiable inputs (Level 2); or by using alternative procedures such as comparison to comparable instruments and/or using models with unobserv-
able market inputs requiring Group to make market-based assumptions (Level 3). Level 3 inputs therefore include the highest level of estimation
uncertainty.
5. Operating Segments Operating segments are reported in a manner consistent with the internal reporting as provided to the chief operating decision makers in order to
allocate resources to the segment and to assess its performance. The management and members of the board of directors of the Group are
identified as chief operating decision makers.
Segments in the consolidated financial statements are defined in accordance with the type of activity, products sold or services provided.
Starting from FY 2019, the Group has changed the presentation of segment information in line with the performance management approach to its
business activities. Comparative information as of 30 June 2018 was restated to reflect the changes in presentation.
Starting with 1 July 2018, Kernel is presenting its segment results within three business segments: Oilseed Processing, Infrastructure and Trading,
and Farming. The reason behind this aggregation is to align representation with the management decision making, as business processes within
the historical six business segments are not separate and decisions are mostly made to account for the combined effect on several segments.
In Oilseed Processing segment, the Group combines what was previously reported as Sunflower Oil Sold in Bulk and Bottled Oil segments. With
expansion of the Group’s oilseed processing capacities devoted to bulk oil, the share of Kernel’s sales of sunflower oil through bottled oil channel
has naturally declined, thus decreasing materiality of this sales channel. Furthermore, other sales channels emerged as the size of oilseed pro-
cessing business evolved, while oil sold through different channels exhibit similar profitability trends. In the financial year ended 30 June 2018,
bottled oil contributed less than 10% to the Company’s EBITDA. Kernel’s oilseed crushing business is managed jointly and thus split into segments
is not justifiable.
In Infrastructure and Trading segment, the Group combines what was previously presented in Export Terminals, Silo Services, and Grain seg-
ments. These parts of the business form an integrated supply chain which is managed jointly. The management’s decision-making has evolved
compared with previous years to account for a throughput margin while making a decision on whether to buy or not a specific volume of grain.
Under current framework, the management considers export terminals and grain storage facilities as production assets which serve grain mer-
chandizing business and consequently uses a combined throughput margin to evaluate performance of Infrastructure and Trading business. In
FY2019, 99% of the Group’s export terminals capacity and majority of grain storage capacity were used for the Group’s own export volumes. The
results of the Infrastructure and Trading segment incorporate savings achieved by acquiring and employing the Company’s own railcar park. Also,
the Infrastructure and Trading segment include the results of the Avere Commodities S.A. and its subsidiaries (hereinafter, Avere).
In Farming segment, the Group continues to report results of its crop production business, which includes growing of corn, wheat, soybean,
sunflower seed and rapeseed on the leasehold land, as well as some minor crops and small cattle farming operations. The scope of the farming
segment under new segment reporting structure corresponds to the farming segment reported previously.
Presentation of the operating segments’ activities in previous consolidated financial statements was as follows:
Operating segments Activities
Bottled sunflower oil Production, refining, bottling, marketing and distribution of bottled sunflower oil.
Sunflower oil sold in bulk Production and sales of sunflower oil sold in bulk (crude and refined) and meal.
Export terminals Grain handling and transshipment services in the ports of Chornomorsk and Mykolaiv.
Farming Agricultural farming. Production of corn, wheat, soybean, sunflower seed and rapeseed
Grain Sourcing and merchandising of wholesale grain and other agriculture commodities, proprietary trading
Silo services Provision of grain cleaning, drying and storage services.
Other Income and expenses unallocated to other segments, which are related to the administration of the Holding.

Kernel Holding S.A. Annual Report and Accounts 30 June 2019 96
www.kernel.ua
Notes to the Consolidated Statements continued for the year ended 30 June 2019 (in thousands of US dollars, unless otherwise stated)
The accompanying notes are an integral part of these financial statements.
Strategic
Report Sustainability
Corporate
Governance
Financial
Statements
The measure of profit and loss, and assets and liabilities is based on the Group accounting policies, which are in compliance with IFRS, as adopted
by the European Union.
Reconciliation eliminates intersegment items and reflects income and expenses not allocable to segments. The segment data is calculated as
follows:
• Intersegment sales reflect intergroup transactions effected on an arm’s length basis.
• Capital expenditures, amortization and depreciation related to property, plant and equipment and intangible assets are allocated to segments when possible.
Since financial management of the Group’s companies is carried out centrally, borrowings, obligations under financial lease, deferred taxes and
some other assets and liabilities are not allocated directly to the respective operating segments and are presented in the ‘Other’ segment. Con-
sequently, the assets and liabilities shown for individual segments do not include borrowings, obligations under financial leases, deferred taxes
and some other assets and liabilities.
Seasonality of operations The Oilseed Processing segment normally has seasonally lower sales in the first quarter of the financial year, which corresponds to the end of the
crushing season and lower production levels. The operations of the Farming segment reflect seasonality in the context of seeding and harvesting
campaigns, which are conducted mainly in November-May and June-November, respectively. The Infrastructure and Trading segment usually
experiences somewhat higher volumes in the several months after the commencement of the harvesting campaign (July for early grains and
September for crops harvested in autumn). In addition, the farming segment usually reflects a higher effect from the IAS 41 valuation of biological
assets in the last quarter of the financial year when more acreage is revalued to fair value less costs to sell and a higher effect from the IAS 41
valuation of agricultural produce in the first half of the financial year due to the completion of the harvesting campaign.
6. Key Data by Operating Segment Key data by operating segment for the year ended 30 June 2019:
Oilseed
Processing
Infrastructure
and Trading Farming Other Reconciliation
Continuing
operations
Revenue (external) 878,835 3,083,315 29,983 — — 3,992,133
Intersegment sales 614,437 56,601 571,602 — (1,242,640) —
Total revenue 1,493,272 3,139,916 601,585 — (1,242,640) 3,992,133
Net change in fair value of biological assets and agri-
cultural produce
— — 9,140 — — 9,140
Other operating income, net 1,729 14,755 11,744 — — 28,228
Profit/(Loss) from operating activities 92,598 92,601 136,813 (52,805) — 269,207
Finance costs, net (82,319)
Foreign exchange gain, net 12,860
Other expenses, net (8,376)
Share of loss of joint ventures (966)
Income tax expenses (11,902)
Profit for the period from continuing operations 178,504
Total assets 914,414 748,022 744,796 56,368 — 2,463,600
Capital expenditures 53,431 115,368 91,285 3,600 — 263,684
Amortization and depreciation 16,419 13,134 45,069 1,681 — 76,303
Liabilities 74,532 150,899 69,470 822,673 — 1,117,574
Allocated revenue of promised goods and services by operating segment for the year ended 30 June 2019 under requirements IFRS 15 was as
follows:
Oilseed
Processing
Infrastructure
and Trading Farming
Continuing
operations
Revenue from sales of commodities 865,222 2,946,419 29,983 3,841,624
Freight and other services 13,613 136,896 — 150,509
Total external revenue from contracts with customers 878,835 3,083,315 29,983 3,992,133
During the year ended 30 June 2019, revenues of approximately USD 314,471 thousand (2018: USD 245,201 thousand) are derived from a single
external customer. These revenues are attributed to Oilseed processing and Infrastructure and Trading segments. Also, during that period, export
sales amounted to 97.0% of total external sales.
For the year ended 30 June 2019, revenue from the Group’s top five customers accounted for approximately 36.0% of total revenue (for the year
ended 30 June 2018, revenue from the top five customers accounted for 38.6% of total revenue).
Among other, intersegment sales between Oilseed Processing segment and Infrastructure and Trading segment comprise of sunflower oil which
is marketed by Avere, the activities of which are included in Infrastructure and Trading segment results.

Kernel Holding S.A. Annual Report and Accounts 30 June 2019 97
www.kernel.ua
Notes to the Consolidated Statements continued for the year ended 30 June 2019 (in thousands of US dollars, unless otherwise stated)
The accompanying notes are an integral part of these financial statements.
Strategic
Report Sustainability
Corporate
Governance
Financial
Statements
The Group’s revenue from external customers (based on the location where sale occurred) and information about its segment assets (non‑current
assets excluding financial instruments, deferred tax assets and other financial assets) by geographical location are detailed below:
Revenue from
external customers Non-current assets
Year ended
30 June 2019
As of
30 June 2019
Ukraine 2,083,289 1,144,221
Europe 1,102,392 2,451
North America 806,452 276
Other locations — 51,773
Total 3,992,133 1,198,721
None of the other locations represented more than 10% of total revenue or non-current assets individually. Revenue from external customers
allocated based on the location, where the sale occurred.
Non-current assets that relate to other locations include investments in a joint venture (grain export terminal at the Taman port).
Gain/loss from Avere operations with financial derivatives are presented within Infrastructure and Trading segment.
Key data by operating segment for the year ended 30 June 2018:
Oilseed
Processing
Infrastructure
and Trading Farming Other Reconciliation
Continuing
operations
Revenue (external) 1,393,491 957,983 51,529 — — 2,403,003
Intersegment sales — 66,596 418,960 — (485,556) —
Total revenue 1,393,491 1,024,579 470,489 — (485,556) 2,403,003
Net change in fair value of biological assets and ag-
ricultural produce
— — 18,699 — — 18,699
Other operating income, net 4,712 36,748 17,632 — — 59,092
Profit/(Loss) from operating activities 60,214 91,968 32,557 (45,174) — 139,565
Finance costs, net (65,099)
Foreign exchange gain, net 5,375
Other expenses, net (30,980)
Share of income of joint ventures 1,193
Income tax benefit 5,900
Profit for the period from continuing operations 55,954
Total assets 888,310 540,907 700,052 81,245 — 2,210,514
Capital expenditures 7,804 30,045 91,751 3,784 — 133,384
Amortization and depreciation 16,464 8,870 56,174 1,467 — 82,975
Liabilities 72,046 91,659 84,099 785,106 — 1,032,910
Presentation of the operating segments’ activities in previous consolidated financial statements for the year ended 30 June 2018:
Bottled sun-
flower oil
Sunflower
oil sold in bulk
Export
terminals Farming Grain
Silo
services Other
Reconcili-
ation
Continuing
operations
Revenue (external) 129,859 1,263,632 423 51,529 951,252 6,308 — — 2,403,003
Intersegment sales — — 52,826 418,960 — 65,946 — (537,732) —
Total revenue 129,859 1,263,632 53,249 470,489 951,252 72,254 — (537,732) 2,403,003
Net change in fair value of bio-
logical assets and agricultural
produce
— — — 18,699 — — — — 18,699
Other operating income, net 14 4,698 4 17,632 34,520 2,224 — — 59,092
Profit/(Loss) from operating
activities
11,561 48,653 35,897 32,557 17,492 38,579 (45,174) — 139,565
Finance costs, net (65,099)
Foreign exchange gain, net 5,375
Other expenses, net (30,980)
Share of income of joint ven-
tures
1,193
Income tax benefit 5,900
Profit for the period from con-
tinuing operations
55,954
Total assets 60,403 827,907 119,386 700,052 330,571 90,950 81,245 — 2,210,514
Capital expenditures 607 7,197 7,689 91,751 — 22,356 3,784 — 133,384
Amortization and depreciation 1,805 14,659 3,205 56,174 — 5,665 1,467 — 82,975
Liabilities 3,533 68,513 4,700 84,099 84,945 2,014 785,106 — 1,032,910

Kernel Holding S.A. Annual Report and Accounts 30 June 2019 98
www.kernel.ua
Notes to the Consolidated Statements continued for the year ended 30 June 2019 (in thousands of US dollars, unless otherwise stated)
The accompanying notes are an integral part of these financial statements.
Strategic
Report Sustainability
Corporate
Governance
Financial
Statements
For the purpose of segment reporting, revenue from the sale of sunflower meal and cake is allocated to the bottled sunflower oil segment in
proportion to the share of total sunflower oil production used for bottled sunflower oil sales, while remaining amounts are allocated to the sunflower
oil sold in bulk segment.
The Group’s revenue from external customers (based on the location where sale occurred) and information about its segment assets (non‑current
assets excluding financial instruments, deferred tax assets and other financial assets) by geographical location are detailed below:
Revenue from ex-
ternal customers Non-current assets
Year ended
30 June 2018
As of
30 June 2018
Ukraine 1,519,128 933,149
North America 815,361 21
Europe 58,471 2,303
Other locations 10,043 52,236
Total 2,403,003 987,709
None of the other countries constituted more than 10% of total revenue or non-current assets individually. Revenue from external customers
allocated based on the location, where the sale occurred.
Non-current assets that relate to other locations include investments in a joint venture (grain export terminal at the Taman port).
Gain/loss from Avere operations with financial derivatives are presented within Infrastructure and Trading/Grain segment.
7. Acquisition and Disposal of Subsidiaries On 14 February 2019, to protect the Company against ever rising logistic costs and to procure the smooth and efficient flow of grains from inland
silos, the Group has acquired 100% effective ownership obtaining shares in Rail Transit Kargo Ukraine LLC (herein “RTK-Ukraine”): a railcar
business that manages about 2,949 grain railcars.
As of the date of acquisition, the fair values of assets and liabilities were as follows:
Fair value
Assets
Current assets:
Cash and cash equivalents 1,137
Trade accounts receivable, net 1,696
Prepayments to suppliers and other current assets, net 2,085
Taxes recoverable and prepaid, net 1,982
Inventory 11
Total current assets 6,911
Non-current assets:
Property, plant and equipment, net 56,925
Total non-current assets 56,925
Total assets 63,836
Liabilities
Current liabilities:
Advances from customers and other current liabilities 1,096
Total current liabilities 1,096
Non-current liabilities:
Deferred tax liabilities 6,328
Total non-current liabilities 6,328
Total liabilities 7,424
Fair value of net assets of acquired subsidiaries 56,412
Non-controlling interest —
Fair value of acquired net assets 56,412
Goodwill 3,867
Fair value of purchase consideration 60,279
Less: acquired cash (1,137)
Net cash outflow on acquisition of subsidiaries (48,016)

Kernel Holding S.A. Annual Report and Accounts 30 June 2019 99
www.kernel.ua
Notes to the Consolidated Statements continued for the year ended 30 June 2019 (in thousands of US dollars, unless otherwise stated)
The accompanying notes are an integral part of these financial statements.
Strategic
Report Sustainability
Corporate
Governance
Financial
Statements
Revenue and net profit of the acquired entity from the date of acquisition to 30 June 2019 were as follows:
Total
Revenue 6,002
Net profit 1,832
The Group does not disclose the revenue and net profit of the acquired entity as if it has been acquired at the beginning of the reporting period as
it is impracticable due to the fact that no IFRS financial information is available for the acquired entity as from the beginning of the reporting period
and up to the date of acquisition.
Since initial accounting is incomplete as of the reporting date due to finalization of relevant calculations and market valuations, only provisional
amounts were recognized to determine net assets, and result of acquisition. After finalization of relevant information retrospective adjustments to
the provisional amounts will be made. The Group supposes to finalize result of acquisition and relevant amounts till the end of the period ended
31 March 2020.
At the moment of acquisition, nominal value of consideration amounted to USD 64,833 thousand and comprised of USD 49,153 thousand paid in
cash and USD 15,680 thousand payable (out of which USD 15,000 thousand of deferred consideration payable over 5 years). At the moment of
acquisition, fair value of consideration was USD 60,279 thousand (including USD 11,126 thousand payable) calculated as the present value of
amounts payable at discount rate 7.5% (represented within the line ‘Other non-current liabilities’). As of 30 June 2019, as a result of accelerated
payments of USD 7,350 thousand, made after the acquisition date, the consideration paid comprised USD 56,272 thousand and the present value
of amount payable was USD 5,638 thousand.
The goodwill in the amount of USD 3,867 thousand arising from the accounting for acquisition of RTK-Ukraine as business combination is attribut-
able to the protection the Company against the rising logistic costs and the synergies expected to be gained efficient flow of grains from inland
silos to the ports. It will not be deductible for tax purposes.
During the year ended 30 June 2019, as a result of the optimization process, the Group disposed of farming entities managing about 12,350 hec-
tares of leasehold suboptimal farmlands located in Zhytomyr, Volyn and Mykolaiv regions and grain elevators, located in Ternopil, Kyiv, Chernihiv
and Kharkiv regions.
The net assets of the disposed entities as of the date of disposal were equal to USD 7,671 thousand and the cash consideration receivable was
USD 11,857 thousand (out of which USD 6,300 thousand was received during this reporting period).
Fair value of cash consideration receivable which should be repaid in full in arrears up to 1 December 2020, were calculated at a discount rate
7.5% and as of the reporting date the outstanding amount comprised to USD 4,820 thousand (USD 4,722 thousand as of the date of disposal)
and is presented within the lines ‘Prepayments to suppliers and other current assets, net’ and ‘Other non-current assets’.
During the year ended 30 June 2019, according to management’s plan, the Group disposed of one of its oilseed crushing plants, previously
classified as assets held for sale, located in Mykolaiv region.
The net assets as of the date of disposal amounted to USD 14,432 thousand (including goodwill in the amount of USD 8,096 thousand). The cash
consideration received was USD 15,079 thousand (out of which USD 5,013 thousand was received during this reporting period).
On 4 July 2017, the Group has acquired 100% effective ownership of AIU (Agro Invest Ukraine) Group: a farming business that manages about
27,500 hectares of leasehold farmland and over 170,000 tons of grain storage capacity.
The primary subsidiaries of the acquired Group are as follows:
Subsidiary Principal activity
Country of
incorporation
Group’s effective
ownership interest on
the date of acquisition
Date of
acquisition
Agro Logistics Ukraine LLC Grain elevators. Provision of grain and oilseed
cleaning, drying and storage services.
Ukraine 100.00% 04 July 2017
Agro Invest Ukraine LLC Agricultural farms. Cultivation of agricultural products:
corn, wheat, soybean, sunflower seed, rapeseed, forage,
pea and barley.
Ukraine 100.00% 04 July 2017

Kernel Holding S.A. Annual Report and Accounts 30 June 2019 100
www.kernel.ua
Notes to the Consolidated Statements continued for the year ended 30 June 2019 (in thousands of US dollars, unless otherwise stated)
The accompanying notes are an integral part of these financial statements.
Strategic
Report Sustainability
Corporate
Governance
Financial
Statements
As of the date of acquisition, the fair values of assets, liabilities and contingent liabilities were as follows:
Fair value
Assets
Current assets:
Cash and cash equivalents 4
Trade accounts receivable, net 176
Prepayments to suppliers and other current assets, net 316
Corporate income tax prepaid 29
Taxes recoverable and prepaid, net 2,735
Inventory 1,574
Biological assets 12,006
Total current assets 16,840
Non-current assets:
Property, plant and equipment, net 23,161
Intangible assets, net 14,385
Deferred tax assets 40
Other non-current assets 270
Total non-current assets 37,856
Total assets 54,696
Liabilities
Current liabilities:
Trade accounts payable 3,021
Advances from customers and other current liabilities 687
Total current liabilities 3,708
Non-current liabilities:
Deferred tax liabilities 1,463
Total non-current liabilities 1,463
Fair value of net assets of acquired subsidiaries 49,525
Non-controlling interest —
Fair value of acquired net assets 49,525
Gain on bargain purchase (2,309)
Total cash considerations due and payable 47,216
Less: acquired cash (4)
Net cash outflow on acquisition of subsidiaries (46,512)
Net cash due and payable (700)
The Group does not disclose the revenue and net profit of the acquired group as if it has been acquired at the beginning of the reporting period
due to the fact that the beginning of the reporting period almost coincides with the date of acquisition.
Acquired group manages world-class grain storage infrastructure which complemented the recent expansion of our farmland bank in the region
and completes our land bank expansion strategy.
Based on the knowledge available as of 30 June 2018 the management verified that all acquired or assumed liabilities have been fully accounted
for, and net assets acquired have not been overstated. Gain on bargain purchase was recognized in the amount of USD 2,309 thousand within
‘Other expenses, net’ in the consolidated statement of profit or loss.
Agro-Invest Ukraine was a Ukrainian subsidiary of Serbian-based agroholding MK Group, willing to exit Ukraine since 2014 as part of their business
restructuring. Kernel participated in the organized process of acquisition of Agro-Invest Ukraine, being very flexible and providing the best offer in
terms of consideration payment schedule but receiving instead a price discount.
During the year ended 30 June 2018, as a result of the optimization process of its legal structure, the Group disposed of one grain elevator located
in Poltava region. The net assets of the disposed entity as of the date of disposal were equal to USD 137 thousand and the cash consideration
received was USD 2,013 thousand (out of which USD 1,404 thousand was received during this reporting period).
During the year ended 30 June 2018, as a result of business optimization, the Group disposed of farming entities managing more than 40,000 ha
of leasehold suboptimal farmlands located in Northern and Western regions of Ukraine.

Kernel Holding S.A. Annual Report and Accounts 30 June 2019 101
www.kernel.ua
Notes to the Consolidated Statements continued for the year ended 30 June 2019 (in thousands of US dollars, unless otherwise stated)
The accompanying notes are an integral part of these financial statements.
Strategic
Report Sustainability
Corporate
Governance
Financial
Statements
Net assets of the disposed farming entities as of the date of disposal were as follows:
Fair value
Assets
Current assets:
Cash and cash equivalents 263
Trade accounts receivable, net 1,238
Prepayments to suppliers and other current assets, net 2,583
Taxes recoverable and prepaid, net 1,989
Inventory 3,449
Biological assets 3,040
Total current assets 12,562
Non-current assets:
Property, plant and equipment, net 6,184
Intangible assets, net 13,295
Other non-current assets 1
Total non-current assets 19,480
Total assets 32,042
Liabilities
Current liabilities:
Trade accounts payable 959
Advances from customers and other current liabilities 8,378
Short-term borrowings 10
Total current liabilities 9,347
Non-current liabilities:
Other non-current liabilities 52
Total liabilities 9,399
Net assets disposed 22,643
Non-controlling interest —
Net assets of disposed companies 22,643
Total cash consideration receivable 23,739
Less: cash from assets disposed (263)
Less: accounts receivable for subsidiaries disposed of (174)
Net cash inflow from subsidiaries disposed of 23,302
Gain on disposal 1,096
8. Cash and Cash Equivalents
The balances of cash and cash equivalents were as follows:
As of
30 June 2019
As of
30 June 2018
Cash in banks in USD 64,109 92,617
Cash in banks in UAH 4,448 20,407
Cash in banks in other currencies 8,237 18,989
Cash on hand 7 5
Total 76,801 132,018
Less restricted and blocked cash on security bank accounts (138) (676)
Less bank overdrafts (Note 20) (246) (41,273)
Cash for the purposes of cash flow statement 76,417 90,069
In accordance with the international rating agency of Fitch, credit ratings of the banks with which the Group had the accounts opened as of 30
June 2019 were as follows:
As of
30 June 2019
As of
30 June 2018
Ukrainian subsidiaries of international banks without international ratings 27,504 28,371
International banks with F1 rating 24,740 46,514
International banks with F2 rating 21,122 34,496
International banks with F1+ rating 2,395 75
International banks with F3 rating 562 12,643
Foreign banks without ratings 478 9,919
Total 76,801 132,018
The reconciliation in the table below presents changes in the Group’s liabilities arising from financing activities by incorporating cash flows and
non-cash changes over the reporting period.

Kernel Holding S.A. Annual Report and Accounts 30 June 2019 102
www.kernel.ua
Notes to the Consolidated Statements continued for the year ended 30 June 2019 (in thousands of US dollars, unless otherwise stated)
The accompanying notes are an integral part of these financial statements.
Strategic
Report Sustainability
Corporate
Governance
Financial
Statements
Reconciliation of liabilities arising from financing activities:
Non-cash movements
As of
30 June 2018
Cash flow from pro-
ceeds/ (repayments)
New finance
leases
Amortization of
one-off and trans-
action costs
Foreign exchange
movements
Other
changes1
As of
30 June 2019
Bank borrowings (Note 20, 21) 188,280 64,947 — 2,398 (4,015) (4,537) 247,073
Finance lease obligations (Note 22) 10,946 (3,677) — — 3 442 7,714
Bonds issued (Note 23) 494,796 — — 1,255 — — 496,051
Total 694,022 61,270 — 3,653 (4,012) (4,095) 750,838
Non-cash movements
As of
30 June 2017
Cash flow from pro-
ceeds/(repayments)
New finance
leases
Amortization of
one-off and trans-
action costs
Foreign exchange
movements
Other
changes1
As of
30 June 2018
Bank borrowings (Note 20, 21) 87,210 105,173 — 1,798 (1,587) (4,314) 188,280
Finance lease obligations (Note 22) 5,744 (7,600) 11,572 — (35) 1,265 10,946
Bonds issued (Note 23) 493,648 — — 1,148 — — 494,796
Total 586,602 97,573 11,572 2,946 (1,622) (3,049) 694,022
9. Trade Accounts Receivable, net The balances of trade accounts receivable, net were as follows:
As of
30 June 2019
As of
30 June 2018
Trade accounts receivable 189,669 93,471
Allowance for expected credit losses (6,473) (1,116)
Total 183,196 92,355
As of 30 June 2019, accounts receivable from one European customer accounted for approximately 14.3% (30 June 2018: for approximately
27.9% respectively).
The average credit period on sales of goods was 17 days (for the period ended 30 June 2018: 16 days). No interest is charged on the outstanding
balances of trade accounts receivable.
The Group applies IFRS 9 simplified approach for measuring ECL which uses a lifetime expected loss allowance for all trade accounts receivables.
To measure ECL, trade accounts receivables have been grouped based on shared credit risk characteristics and the days past due.
The expected loss rates are based on the payment profiles of sales over a period of 24 months before 30 June 2019 and the corresponding
historical credit losses experienced within this period. The historical loss rates are adjusted to reflect current and forward-looking information on
macroeconomic factors affecting the ability of the customers to settle the receivables. The Group has identified actual losses per each group to
be the most relevant factor, and accordingly adjusts the historical loss rates based on expected changes in these factors.
As the Group’s historical credit loss experience does not show significantly different loss patterns for different customer groups, the provision for
loss allowance based on past due status is not further distinguished between the Group’s different customer base.
On this basis, the loss allowance as at 30 June 2019 was determined for trade accounts receivables as follows:
Current
Less than 90
days past due
More than 90
days past due Total
Expected loss rate2 0.2% 27.8% 84.6%
Gross carrying amount – trade accounts receivables 176,559 8,874 4,236 189,669
Loss allowance (423) (2,465) (3,585) (6,473)
1 Other changes include translation difference, repayment of transactions costs and one-off borrowing commissions and other non-cash changes. 2 Differences in expected loss rate are possible due to rounding

Kernel Holding S.A. Annual Report and Accounts 30 June 2019 103
www.kernel.ua
Notes to the Consolidated Statements continued for the year ended 30 June 2019 (in thousands of US dollars, unless otherwise stated)
The accompanying notes are an integral part of these financial statements.
Strategic
Report Sustainability
Corporate
Governance
Financial
Statements
The loss allowances for trade accounts receivables as of 30 June reconcile to the opening loss allowances as follows:
Trade accounts receivables
Collectively
assessed
Individually
assessed Total
Opening loss allowance as of 1 July under IAS 39 390 726 1,116
Adjustment upon application of IFRS 9 (Note 3) 314 – 314
Opening loss allowance as of 1 July under IFRS 9 704 726 1,430
Increase in loss allowance recognized in profit or loss during the year 4,899 1,040 5,939
Trade receivables written off during the year as uncollectible (896) – (896)
Unused amount reversed – – –
Closing loss allowance as of 30 June 4,707 1,766 6,473
Trade accounts receivables are written off, where there is no reasonable expectation of recovery. Indicators that there is no reasonable expectation
of recovery include, among others, the failure of a debtor to engage in a repayment plan with the Group, and a failure to make contractual payments
for a period of greater than 90 days past due.
Impairment losses on trade accounts receivables are presented as net impairment losses within operating profit. Subsequent recoveries of
amounts previously written off are credited against the same line item.
10. Prepayments to Suppliers and Other Current Assets, net The balances of prepayments to suppliers and other current assets, net were as follows:
As of
30 June 2019
As of
30 June 2018
Prepayments to suppliers 111,461 110,509
Other current assets 24,137 8,901
Allowance for estimated irrecoverable amounts of prepayments to suppliers and other current assets (5,776) (6,068)
Total 129,822 113,342
Increase of prepayments to suppliers and other current assets as of 30 June 2019 in comparison with 30 June 2018 is mostly connected with
financing of suppliers for future commodities purchases.
11. Taxes Recoverable and Prepaid, net The balances of taxes recoverable and prepaid, net were as follows:
As of
30 June 2019
As of
30 June 2018
VAT (‘value added tax’) recoverable and prepaid 117,880 114,192
Other taxes recoverable and prepaid 695 503
Total 118,575 114,695
VAT recoverable and prepaid mainly represents VAT credits in relation to purchases of agricultural products on the domestic market in Ukraine.
Management expects that these balances will be recovered in full within 12 months after the reporting date through cash collection or set-off with
respective VAT liabilities. For the year ended 30 June 2019, the amount of VAT refunded by the government in cash was USD 331,719 thousand
(30 June 2018: USD 265,048 thousand).
12. Inventory The balances of inventories were as follows:
As of
30 June 2019
As of
30 June 2018
Raw materials 148,205 81,543
Finished products 105,569 210,687
Goods for resale 47,355 37,072
Agricultural products 38,560 22,132
Fuel 7,075 4,411
Packaging materials 1,620 1,634
Work in progress 1,478 1,620
Other inventories 7,748 9,354
Total 357,610 368,453
As of 30 June 2019, raw materials mostly consisted of sunflower seed stock in the amount of USD 103,661 thousand (30 June 2018 USD 57,603
thousand).
As of 30 June 2019, finished products mostly consisted of sunflower oil in bulk in the amount of USD 75,518 thousand (30 June 2018 USD 193,460
thousand).
Write-downs of inventories to net realizable value amounted to USD 1,709 thousand (2018: USD 5,459 thousand).

Kernel Holding S.A. Annual Report and Accounts 30 June 2019 104
www.kernel.ua
Notes to the Consolidated Statements continued for the year ended 30 June 2019 (in thousands of US dollars, unless otherwise stated)
The accompanying notes are an integral part of these financial statements.
Strategic
Report Sustainability
Corporate
Governance
Financial
Statements
As of 30 June 2019 and 2018, the inventory balances in the amounts of USD 166,245 thousand and USD 200,849 thousand, respectively, were
pledged as security for short-term borrowings (Note 20).
13. Biological Assets The balances of crops in fields were as follows:
As of 30 June 2019 As of 30 June 2018
Hectares Value Hectares Value
Corn 231,115 130,075 225,267 123,885
Sunflower seed 136,537 87,855 134,816 80,926
Wheat 97,072 66,304 100,505 56,136
Soybean 24,283 10,031 36,485 16,419
Rapeseed 9,447 9,077 4,605 4,396
Other 5,262 3,773 19,231 5,096
Total 503,716 307,115 520,909 286,858
The following table represents the changes in the carrying amounts of crops in fields during the years ended 30 June 2019 and 30 June 2018:
Capitalized
expendi-
tures
Effect of
biological
transfor-
mation
Fair value of
biological
assets
As of 30 June 2017 230,672 23,810 254,482
Increase due to purchases and subsequent expenditures capitalized in biological assets (harvest
2017)
114,658 — 114,658
Increase resulting from business acquisitions 11,832 — 11,832
Decrease due to harvest (harvest 2017) (357,162) (23,810) (380,972)
Decrease resulting from disposal (2,946) (94) (3,040)
Increase due to purchases and subsequent expenditures capitalized in biological assets (harvest
2018)
231,304 — 231,304
Gain arising from changes in fair value attributable to physical changes and to changes of the market
price (sowing under harvest 2018)
— 52,350 52,350
Exchange difference 4,919 1,325 6,244
As of 30 June 2018 233,277 53,581 286,858
Increase due to purchases and subsequent expenditures capitalized in biological assets (harvest
2018)
126,979 — 126,979
Decrease due to harvest (harvest 2018) (360,256) (53,581) (413,837)
Decrease resulting from disposals (970) (265) (1,235)
Increase due to purchases and subsequent expenditures capitalized in biological assets (harvest
2019)
246,203 — 246,203
Decrease due to harvest (harvest 2019) (333) (71) (404)
Gain arising from changes in fair value attributable to physical changes and to changes of the market
price (sowing under harvest 2019)
— 53,385 53,385
Exchange difference 8,023 1,143 9,166
As of 30 June 2019 252,923 54,192 307,115
As of 30 June 2019, non-current cattle in the amount of USD 5,271 thousand (30 June 2018: USD 7,606 thousand) was represented mainly by
5,058 heads of milk cows (30 June 2018: 7,164 heads) (Note 18), and current cattle of USD 1,915 thousand (30 June 2018: USD 2,578 thousand)
was represented mainly by 4,707 heads of calves (30 June 2018: 6,871 heads). The change in the balances was mainly represented by a change
in the mix of cattle and variation in prices and exchange rates between reporting dates. For the year ended 30 June 2019, the net gain arising
from changes in the fair value of biological assets in the amount of USD 9,140 thousand (2018: gain of USD 18,699 thousand) includes a USD
3,700 thousand loss on changes in current and non-current cattle’s fair value (2018: loss of USD 3,805 thousand).
As a result of business acquisitions, the Group purchased biological assets in the amount of USD 12,006 thousand (Note 7) for the year ended
30 June 2018 (30 June 2019: nil), out of which crops in fields amounted to USD 11,832 thousand (30 June 2019: nil). The fair value of agricultural
produce was estimated based on market prices as at the date of harvest and is within level 2 of fair value hierarchy. Crops in fields and non-
current cattle of the Group are measured using discounted cash flow technique and are within the level 3 of the fair value hierarchy. Current cattle
is measured based on market prices of livestock of similar age, breed and genetic merit, which is within level 2 of the fair value hierarchy.

Kernel Holding S.A. Annual Report and Accounts 30 June 2019 105
www.kernel.ua
Notes to the Consolidated Statements continued for the year ended 30 June 2019 (in thousands of US dollars, unless otherwise stated)
The accompanying notes are an integral part of these financial statements.
Strategic
Report Sustainability
Corporate
Governance
Financial
Statements
There were no changes in valuation technique since previous year. There were no transfers between any levels during the year.
Description
Fair value as of
30 June 2019
Valuation tech-
niques
Unobservable
inputs
Range of unobservable
inputs (average)
Relationship of unobservable
inputs to fair value
Crops in field 307,115 Discounted cash
flows
Crops yield 2.41 - 7.20 (5.39) tons per
hectare
The higher the crop yield, the
higher the fair value
Discount rate 17.88% (in UAH, short
term)
The higher the discount rate, the
lower the fair value
Milk cows 5,271 Discounted cash
flows
Milk yield – liter per cow 17.48 – 22.03 (19.72) liters
per cow per day
The higher the milk yield, the
higher the fair value
Weight of 1 calf 29 - 33 (31) kg The higher the weight, the higher
the fair value
Average yield of calves
from 100 cows per year
61 - 75 (69) calves The higher the yield, the higher the
fair value
Discount rate, % 15.82% (in UAH, long
term)
The higher the discount rate, the
lower the fair value
If the above unobservable inputs to the valuation model were 5% higher/lower while all other variables were held constant, the carrying amount
of the current and non-current biological assets would increase/decrease by USD 23,048 thousand and USD 23,155 thousand, respectively.
Description
Fair value as of
30 June 2018
Valuation tech-
niques
Unobservable
Inputs
Range of unobservable
inputs (average)
Relationship of unobservable
inputs to fair value
Crops in field 286,858 Discounted cash
flows
Crops yield 1.91 - 7.2 (4.55)
tons per hectare
The higher the crop yield, the
higher the fair value
Discount rate 22.90% (in UAH, short
term)
The higher the discount rate, the
lower the fair value
Milk cows 7,606 Discounted cash
flows
Milk yield – liter per cow 16.97 – 21.93 (19.45) liters
per cow per day
The higher the milk yield, the
higher the fair value
Weight of 1 calf 27 - 33 (30) kg The higher the weight, the higher
the fair value
Average yield of calves
from 100 cows per year
62 - 66 (64) calves The higher the yield, the higher
the fair value
Discount rate, % 17.70% (in UAH, long term) The higher the discount rate, the
lower the fair value
If the above unobservable inputs to the valuation model were 5% higher/lower while all other variables were held constant, the carrying amount
of the current and non-current biological assets would increase/decrease by USD 22,506 thousand and USD 22,469 thousand, respectively.
14. Assets Classified as Held for Sale and Discontinued Operations As of 30 June 2019, according to management’s plan to dispose one of export terminals and silo, their net assets, which predominantly consist of
property, plant and equipment in the amount of USD 1,380 thousand were classified as assets held for sale. As of 30 June 2019, advances for
sale of the subsidiaries in the amount of USD 2,290 thousand has been received and represented within the line ‘Advances from Customers and
Other Current Liabilities’ (Note 19). The above-mentioned export terminal was disposed in August 2019. Their operations weren’t presented as
discontinued operations as they do not meet the criteria of recognition since the entities do not represent a separate major line of business or
geographical area of operations.
During the year ended 30 June 2019, according to management’s plan, the Group disposed of one of its oilseed crushing plants, previously
classified as assets held for sale, located in Mykolaiv region. The net assets as of the date of disposal amounted to USD 14,432 thousand
(including goodwill in the amount of USD 8,096 thousand). The cash consideration received was USD 15,079 thousand (out of which USD 5,013
thousand was received during this reporting period).

Kernel Holding S.A. Annual Report and Accounts 30 June 2019 106
www.kernel.ua
Notes to the Consolidated Statements continued for the year ended 30 June 2019 (in thousands of US dollars, unless otherwise stated)
The accompanying notes are an integral part of these financial statements.
Strategic
Report Sustainability
Corporate
Governance
Financial
Statements
15. Property, Plant and Equipment, net The following table represents movements in property, plant and equipment for the year ended 30 June 2019:
Oilseed
Processing
Infrastructure
and Trading Farming Other Total
Net Book Value as at 30 June 2018 302,717 123,496 138,255 23,659 588,127
Land 842 560 64 1,109 2,575
Buildings and Constructions 205,210 73,152 17,517 19,737 315,616
Production machinery and equipment 86,436 36,253 21,883 18 144,590
Agricultural equipment and vehicles 3,590 2,234 81,262 923 88,009
Other fixed assets 2,522 2,185 6,930 1,858 13,495
CIP and uninstalled equipment 4,117 9,112 10,599 14 23,842
Additions 53,339 58,240 66,249 1,455 179,283
CIP and uninstalled equipment 53,339 58,240 66,249 1,455 179,283
Reclassification (5) — 6 (1) —
Land — — 7 — 7
Buildings and Constructions (587) — — — (587)
Production machinery and equipment (756) — (6) — (762)
Agricultural equipment and vehicles 35 — (377) — (342)
Other fixed assets 1,303 — 382 (1) 1,684
CIP and uninstalled equipment — — — — —
Additions from acquisition of subsidiaries — 56,925 — — 56,925
Agricultural vehicles and equipment — 56,925 — — 56,925
Transfers — — — — —
Land 80 — 3 — 83
Buildings and Constructions 1,414 3,090 2,773 141 7,418
Production machinery and equipment 5,148 1,460 17,822 6 24,436
Agricultural equipment and vehicles 1,739 378 20,755 136 23,008
Other fixed assets 989 601 3,524 1,201 6,315
CIP and uninstalled equipment (9,370) (5,529) (44,877) (1,484) (61,260)
Revaluation 15,599 — — — 15,599
Buildings and Constructions 10,133 — — — 10,133
Production machinery and equipment 5,466 — — — 5,466
Disposals (at NBV) (3,127) (4,631) (4,266) (36) (12,060)
Land (70) (124) — — (194)
Buildings and Constructions (1,875) (2,152) (1,107) — (5,134)
Production machinery and equipment (839) (839) (42) (1) (1,721)
Agricultural equipment and vehicles (26) (16) (2,169) (35) (2,246)
Other fixed assets (25) (60) (227) — (312)
CIP and uninstalled equipment (292) (1,440) (721) — (2,453)
Transfers to Assets classified as held for sale — (1,380) — — (1,380)
Land — (54) — — (54)
Buildings and Constructions — (966) — — (966)
Production machinery and equipment — (174) — — (174)
Agricultural vehicles and equipment — (1) — — (1)
Other fixed assets — (10) — — (10)
CIP and uninstalled equipment — (175) — — (175)
Depreciation expense (15,992) (12,506) (33,809) (1,395) (63,702)
Buildings and constructions (6,413) (3,805) (1,637) (494) (12,349)
Production machinery and equipment (8,018) (3,812) (5,575) (4) (17,409)
Agricultural equipment and vehicles (825) (4,400) (24,686) (206) (30,117)
Other fixed assets (736) (489) (1,911) (691) (3,827)
Translation difference 141 780 948 25 1,894
Land — (5) — 1 (4)
Buildings and Constructions — (24) 58 7 41
Production machinery and equipment — (44) 568 1 525
Agricultural equipment and vehicles 71 (3) 31 (17) 82
Other fixed assets (4) 5 128 8 137
CIP and uninstalled equipment 74 851 163 25 1,113
Net Book Value as at 30 June 2019 352,672 220,924 167,383 23,707 764,686
Land 852 377 74 1,110 2,413
Buildings and Constructions 207,882 69,295 17,604 19,391 314,172
Production machinery and equipment 87,437 32,844 34,650 20 154,951
Agricultural equipment and vehicles 4,584 55,117 74,816 801 135,318
Other fixed assets 4,049 2,232 8,826 2,375 17,482
CIP and uninstalled equipment 47,868 61,059 31,413 10 140,350

Kernel Holding S.A. Annual Report and Accounts 30 June 2019 107
www.kernel.ua
Notes to the Consolidated Statements continued for the year ended 30 June 2019 (in thousands of US dollars, unless otherwise stated)
The accompanying notes are an integral part of these financial statements.
Strategic
Report Sustainability
Corporate
Governance
Financial
Statements
The following table represents movements in property, plant and equipment for the year ended 30 June 2018:
Oilseed
Processing
Infrastructure
and Trading Farming Other Total
Net Book Value as at 30 June 2017 319,221 104,321 123,066 23,106 569,714
Land 2,280 332 48 1,163 3,823
Buildings and Constructions 214,124 62,829 18,933 19,944 315,830
Production machinery and equipment 95,174 33,779 2,512 24 131,489
Agricultural equipment and vehicles 1,580 1,727 93,733 599 97,639
Other fixed assets 2,681 1,054 4,333 1,362 9,430
CIP and uninstalled equipment 3,382 4,600 3,507 14 11,503
Additions 6,457 14,565 57,333 1,991 80,346
CIP and uninstalled equipment 6,457 14,565 57,333 1,991 80,346
Reclassification 36 (61) (4) 29 —
Land — — — — —
Buildings and Constructions — (4) — 162 158
Production machinery and equipment — 2,021 — — 2,021
Agricultural equipment and vehicles 56 (76) (4) 14 (10)
Other fixed assets (20) (2,002) — (147) (2,169)
CIP and uninstalled equipment — — — — —
Additions from acquisition of subsidiaries — 15,297 7,584 280 23,161
Land — 228 10 — 238
Buildings and Constructions — 12,275 1,487 — 13,762
Production machinery and equipment — 2,546 57 — 2,603
Agricultural vehicles and equipment — 172 5,832 — 6,004
Other fixed assets — 76 191 280 547
CIP and uninstalled equipment — — 7 — 7
Transfers — — — — —
Land 140 3 5 — 148
Buildings and Constructions 272 3,103 1,128 464 4,967
Production machinery and equipment 1,798 2,047 22,368 4 26,217
Agricultural equipment and vehicles 2,527 838 21,325 503 25,193
Other fixed assets 551 3,432 4,035 1,003 9,021
CIP and uninstalled equipment (5,288) (9,423) (48,861) (1,974) (65,546)
Disposals (at NBV) (641) (1,333) (10,174) (399) (12,547)
Land — — — (49) (49)
Buildings and Constructions (1) (818) (1,874) (269) (2,962)
Production machinery and equipment (575) (35) (1,383) (8) (2,001)
Agricultural equipment and vehicles (2) (10) (6,162) — (6,174)
Other fixed assets (3) (5) (254) (36) (298)
CIP and uninstalled equipment (60) (465) (501) (37) (1,063)
Transfers to Assets classified as held for sale (6,480) — — — (6,480)
Land (1,578) — — — (1,578)
Buildings and Constructions (2,551) — — — (2,551)
Production machinery and equipment (1,853) — — — (1,853)
Agricultural vehicles and equipment (1) — — — (1)
Other fixed assets (35) — — — (35)
CIP and uninstalled equipment (462) — — — (462)
Depreciation expense (16,012) (8,840) (39,101) (1,273) (65,226)
Buildings and constructions (6,634) (3,952) (2,029) (492) (13,107)
Production machinery and equipment (8,108) (4,050) (1,794) (4) (13,956)
Agricultural equipment and vehicles (622) (415) (33,814) (206) (35,057)
Other fixed assets (648) (423) (1,464) (571) (3,106)
Translation difference 136 (453) (449) (75) (841)
Land — (3) 1 (5) (7)
Buildings and Constructions — (281) (128) (72) (481)
Production machinery and equipment — (55) 123 2 70
Agricultural equipment and vehicles 52 (2) 352 13 415
Other fixed assets (4) 53 89 (33) 105
CIP and uninstalled equipment 88 (165) (886) 20 (943)
Net Book Value as at 30 June 2018 302,717 123,496 138,255 23,659 588,127
Land 842 560 64 1,109 2,575
Buildings and Constructions 205,210 73,152 17,517 19,737 315,616
Production machinery and equipment 86,436 36,253 21,883 18 144,590
Agricultural equipment and vehicles 3,590 2,234 81,262 923 88,009
Other fixed assets 2,522 2,185 6,930 1,858 13,495
CIP and uninstalled equipment 4,117 9,112 10,599 14 23,842

Kernel Holding S.A. Annual Report and Accounts 30 June 2019 108
www.kernel.ua
Notes to the Consolidated Statements continued for the year ended 30 June 2019 (in thousands of US dollars, unless otherwise stated)
The accompanying notes are an integral part of these financial statements.
Strategic
Report Sustainability
Corporate
Governance
Financial
Statements
Total cost of property, plant and equipment and total accumulated depreciation as of 30 June 2019 and 2018 were as follows:
Cost as of 30
June 2019
Accumulated
depreciation as
of 30 June 2019
Cost as of 30
June 2018
Accumulated de-
preciation as of 30
June 2018
Land 2,413 - 2,575 —
Buildings and constructions 364,745 (50,573) 356,489 (40,873)
Production machinery and equipment 216,807 (61,856) 189,624 (45,034)
Agricultural equipment and vehicles 292,395 (157,077) 222,320 (134,311)
Other fixed assets 33,652 (16,170) 25,272 (11,777)
CIP and uninstalled equipment 140,350 — 23,842 —
Total 1,050,362 (285,676) 820,122 (231,995)
Had the Group’s buildings and constructions and production machinery and equipment (Oilseed Processing segment) been measured on a his-
torical cost basis, their carrying amount would have been as follows:
As of 30 June 2019 As of 30 June 2018
Buildings and constructions 185,317 193,568
Production machinery and equipment 69,195 75,352
Total 254,512 268,920
Revaluation of property, plant and equipment of oil plants is comprised of impairment loss recognized in other expenses in the amount of USD
10,234 thousand (Note 31) and revaluation surplus recognized in other comprehensive income in the amount of USD 25,833 thousand.
As of 30 June 2019, property, plant and equipment with a carrying amount of USD 104,053 thousand (30 June 2018: USD 540 thousand) were
pledged by the Group as collateral against short-term and long-term bank loans (Notes 20, 21).
As of 30 June 2019, property, plant and equipment with a carrying amount of USD 29,228 thousand (30 June 2018: USD 25,742 thousand) were
pledged by the Group as a collateral for amount due and payable within the acquisition of 560,000 tons oilseed crushing plant located in Kirovograd
region, completed as of 30 June 2016.
As of 30 June 2019 and 30 June 2018, the net carrying amount of property, plant and equipment, represented by agricultural equipment and
vehicles held under finance lease agreements was USD 9,269 thousand and USD 15,976 thousand, respectively.
16. Intangible Assets, net
The following table represents movements in intangible assets for the year ended 30 June 2019:
Trade-
marks
Land lease
rights
Other intangible
assets Total
Cost as of 1 July 2018 22,036 149,069 6,200 177,305
Additions — 24,501 2,975 27,476
Disposals — (5,033) (951) (5,984)
Transfers to Assets classified as held for sale — — (7) (7)
Exchange difference — 1,096 (60) 1,036
Cost as of 30 June 2019 22,036 169,633 8,157 199,826
Trade-
marks
Land lease
rights
Other intangible
assets Total
Accumulated amortization and impairment loss as of 1 July 2018 (9,051) (60,323) (3,465) (72,839)
Amortization charge — (11,643) (958) (12,601)
Disposals — 600 376 976
Transfers to Assets classified as held for sale — — 5 5
Reduction of loss on impairment recognized in the Statement of Profit or Loss 116 — — 116
Exchange difference — (531) (10) (541)
Accumulated amortization and impairment loss as of 30 June 2018 (8,935) (71,897) (4,052) (84,884)
Net book value as of 30 June 2019 13,101 97,736 4,105 114,942
The following table represents movements in intangible assets for the year ended 30 June 2018:
Trade-
marks
Land lease
rights
Other intangible
assets Total
Cost as of 1 July 2017 22,036 136,259 4,589 162,884
Additions from acquisition of subsidiaries (Note 7) — 14,385 — 14,385
Additions — 13,613 1,879 15,492
Disposals — (14,687) (203) (14,890)
Transfers to Assets classified as held for sale — — (17) (17)
Exchange difference — (501) (48) (549)
Cost as of 30 June 2018 22,036 149,069 6,200 177,305

Kernel Holding S.A. Annual Report and Accounts 30 June 2019 109
www.kernel.ua
Notes to the Consolidated Statements continued for the year ended 30 June 2019 (in thousands of US dollars, unless otherwise stated)
The accompanying notes are an integral part of these financial statements.
Strategic
Report Sustainability
Corporate
Governance
Financial
Statements
Trade-
marks
Land lease
rights
Other intangible
assets Total
Accumulated amortization and impairment loss as of 1 July 2017 (10,729) (44,606) (2,688) (58,023)
Amortization charge — (16,981) (768) (17,749)
Disposals — 1,392 79 1,471
Reduction of loss on impairment recognized in the Statement of Profit or Loss 1,678 — — 1,678
Exchange difference — (128) (88) (216)
Accumulated amortization and impairment loss as of 30 June 2018 (9,051) (60,323) (3,465) (72,839)
Net book value as of 30 June 2018 12,985 88,746 2,735 104,466
Included in the intangible assets of Subsidiaries are the ‘Schedry Dar’, ‘Stozhar’, ‘Zolota’ and ‘Domashnya’ trademarks with net book values of
USD 4,567 thousand, USD 5,122 thousand, USD 3,233 thousand and USD 179 thousand, respectively, in 2019 (USD 4,967 thousand, USD 4,298
thousand, USD 3,541 thousand and USD 179 thousand, respectively, in 2018). These trademarks are used by the Group for the sale of bottled
sunflower oil mostly in the Ukrainian market.
In management’s view, there is no foreseeable limit to the period over which the trademarks are expected to generate net cash inflows for the
Group.
The Group believes that, as a result of further promotion of the ‘Schedry Dar’, ‘Stozhar’, ‘Zolota’ and ‘Domashnya’ trademarks, the market share
enjoyed by the Group will be stable and thus the Group will obtain economic benefits from them for an indefinite period of time.
Accordingly, the trademarks that belong to the Group are considered to have an indefinite useful life and thus are not amortized but tested for
impairment by comparing their recoverable amount with their carrying amount annually on 30 June and whenever there is an indication that the
trademarks may be impaired.
The impairment testing of the value of trademarks as of 30 June 2019 was performed by an independent appraiser. The recoverable amount of
trademarks was based on the fair value less costs to sell method using the royalty approach of valuation and is classified within level 3 of the fair
value hierarchy. This calculation uses cash flow projections based on financial budgets approved by management and covering a five-year period.
The total amount of the trademarks was allocated to the Oilseed Processing segment (as one cash-generating unit).
Key assumptions used for the calculation were as follows:
• The royalty rate used was determined at the weighted average market level of 5.00%;
• Growth rates are based on the expected market growth rate for sunflower oil consumption. As of 30 June 2019, management believed that the
market for bottled oil was saturated and for a period of five years no growth is expected; and
• As bottled oil is predominantly sold within Ukraine, the discount rate used was based on the weighted average cost of capital rate of 19.24% for
UAH denominated cash flow projections.
As a result of testing performed as of 30 June 2019, recoverable amounts of the trademarks ‘Schedry Dar’, ‘Stozhar’, ‘Zolota’ and ‘Domashnya’
were USD 4,567 thousand, USD 5,122 thousand, USD 3,233 thousand and USD 320 thousand, respectively (30 June 2018: USD 4,967 thousand,
USD 4,298 thousand, USD 3,541 thousand and USD 301 thousand, respectively).
As a result of testing performed, impairment of the trademarks ‘Zolota’ and ‘Schedry Dar’ in the amount of USD 308 thousand and USD 400
thousand, respectively, was recognized as of 30 June 2019 (30 June 2018: ‘Zolota’ in the amount of USD 368 thousand) as a loss on impairment
of intangible assets within ‘Other expenses, net’ (Note 31). This impairment loss was attributable to the Oilseed Processing segment. Impairment
was caused primarily by shrinkage of consumer demand for premium segment bottled sunflower oil.
As a result of testing performed, impairment loss for the trademarks ‘Stozhar’ recognized in prior periods was partly reversed in the amount of
USD 824 thousand as of 30 June 2019 (30 June 2018: ‘‘Stozhar’ and ‘Schedry Dar’ in the amount of USD 1,054 thousand and USD 992 thousand,
respectively). Reversal was recognized as a reduction of loss on impairment of intangible assets within ‘Other expenses, net’ (Note 31). Value
recovery was caused primarily by increase of export sales.
For the year ended 30 June 2019, additions included USD 24,501 thousand of amounts paid per land lease agreements, where USD 15,305
thousand of this amount related to agreements with an average lease term of 77 years (for the year ended 30 June 2018: USD 11,608 thousand
and 87 years accordingly), amortized using straight-line method. The amount of amortization of the above-mentioned rights for the year ended 30
June 2019 amounted to USD 107 thousand (for the year ended 30 June 2018: USD 127 thousand).
17. Goodwill The following table represents movements in goodwill for the year:
As of
30 June 2019
As of
30 June 2018
Cost 114,705 122,624
Accumulated impairment losses (10,837) (10,837)
Other movements 3,867 (8,096)
Total 107,735 103,691

Kernel Holding S.A. Annual Report and Accounts 30 June 2019 110
www.kernel.ua
Notes to the Consolidated Statements continued for the year ended 30 June 2019 (in thousands of US dollars, unless otherwise stated)
The accompanying notes are an integral part of these financial statements.
Strategic
Report Sustainability
Corporate
Governance
Financial
Statements
As of
30 June 2019
As of
30 June 2018
Cost at beginning of the year 114,528 122,692
Acquisitions of Subsidiaries (Note 7) 3,867 —
Transfer to Assets classified as held for sale (Note 14) — (8,096)
Exchange differences 177 (68)
Balance at the end of the year 118,572 114,528
Accumulated impairment losses
As of
30 June 2019
As of
30 June 2018
Balance at the beginning of the year (10,837) (8,582)
Impairment losses recognized in the year — (2,255)
Balance at the end of the year (10,837) (10,837)
The Group allocates goodwill to individual entities as to separate cash-generating units (CGU). A summary of goodwill allocation to separate
CGUs is presented below:
Goodwill carrying value
Segment Cash-generating unit As of
30 June 2019
As of
30 June 2018
Oilseed Processing BSI LLC 35,331 35,331
Kropyvnytskyi OEP PJSC (former Kirovogradoliya PJSC) 31,334 31,334
Prydniprovskyi OEP LLC 13,225 13,225
Prykolotnoe OEP LLC 2,147 2,147
Other 1,906 1,906
Infrastructure and Trading Transbulkterminal LLC 10,727 10,755
RTK-Ukraine 4,027 —
Farming Druzhba-Nova Group and other agricultural farms 9,038 8,993
Total 107,735 103,691
The group tests whether goodwill has suffered any impairment on an annual basis. The recoverable amounts of Oilseed Processing and Infra-
structure and Trading CGUs were determined based on a value in use calculation, which uses cash flow projections based on the most recent
financial budgets approved by the management and covering a five-year period and a discount rate of 8.6% per annum (2018: 10.2%). The value
in use estimates developed by the Group to estimate the recoverable amount of cash-generating units represent the best available estimate based
on the analysis of the Group’s past perfor-mance, market knowledge and internal assumptions as to future trends on the market.
The discount rate reflects the current market assessment of the risks specific to the cash-generating units. The discount rate was determined by
the weighted average cost of capital based on observable inputs from external sources of information. The discount rate used as of 30 June 2019
was 8.6% (30 June 2018: 10.2%). Cash flows beyond that five-year period have been extrapolated using a steady 2% per annum growth rate. As
of 30 June 2019, the assumptions for expected sunflower oil prices were USD 688 to 769 per one metric ton in 2020-2024 with a corresponding
cost of USD 340 to 349 per one metric ton of sunflower seeds, which corresponds to a margins of USD from 67 to 100 for one metric ton of oil.
As of 30 June 2018, the assumptions for expected sunflower oil prices were USD 750 to 811 per one metric ton in 2019-2023 with a corresponding
cost of USD 368 to 381 per one metric ton of sunflower seeds, which corresponds to a margins of USD from 52 to 100 for one metric ton of oil.
Management believes that the margin per one metric ton of sunflower oil depends on the supply-de-mand balance for raw material in Ukraine
rather than on the level of prices.
Excess of recoverable amount over carrying amount of individual CGUs summarized below:
As of 30 June 2019
Oilseed Processing BSI LLC 159,465
Prydniprovskyi OEP LLC 144,963
Kropyvnytskyi OEP PJSC (former Kirovogradoliya PJSC) 100,453
Volchansk 50,465
Prykolotnoe OEP LLC 8,477
The recoverable amount of Druzhba-Nova Group and other agricultural farms have been determined based on fair value less cost to sell estimates.
The valuation method is based on the market approach and observable market prices, adjusted for the age and liquidity of the assets, which is
within level 2 of the fair value hierarchy.
Management believes that no reasonably possible change in the key assumptions would cause the carrying amount of Transbulkterminal LLC
and Oilseed Processing CGUs to exceed its recoverable amount. Management believes that no reasonably possible change in the key assump-
tions on which the recoverable amount of Druzhba-Nova Group and other agricultural farms is based will cause the carrying amount to exceed
their recoverable amount.
The recoverable amount of RTK CGU was determined based on a value in use calculation, which uses cash flow projections based on the most
recent financial budgets approved by the management and covering railcars useful life period and a discount rate of 14.3% per annum and is
classified within Level 3 of fair value hierarchy.

Kernel Holding S.A. Annual Report and Accounts 30 June 2019 111
www.kernel.ua
Notes to the Consolidated Statements continued for the year ended 30 June 2019 (in thousands of US dollars, unless otherwise stated)
The accompanying notes are an integral part of these financial statements.
Strategic
Report Sustainability
Corporate
Governance
Financial
Statements
As of 30 June 2019 and 2018, no impairment of goodwill was identified except for the impairment of goodwill allocated to BSI LLC oilseed crushing
plant relating to the Oilseed Processing segment was recognized in the amount of USD 2,255 thousand for the year ended 30 June 2018 within
‘Other expenses, net’.
18. Other Non-current Assets The balances of other non-current assets were as follows:
As of
30 June 2019
As of
30 June 2018
Prepayments for property, plant and equipment 87,849 94,047
Loans provided to related parties (Note 33) 19,769 10,124
Loans to farmers 11,083 —
Investments in financial asset 7,341 —
Non-current biological assets (Note 13) 5,271 7,606
Prepayments for business acquisitions 4,500 4,500
Other non-current assets 19,919 18,285
Total 155,732 134,562
19. Advances from Customers and Other Current Liabilities The balances of advances from customers and other current liabilities were as follows:
As of
30 June 2019
As of
30 June 2018
Provision for legal claims (Note 35) 31,872 28,971
Accrued payroll, payroll related taxes and bonuses 16,929 8,160
Taxes payable and provision for tax liabilities 9,748 13,296
Accounts payable for property, plant and equipment 9,230 2,434
Advances from customers 7,277 13,309
Provision for unused vacations and other provisions 6,334 5,911
Settlements for acquired Subsidiaries 5,537 12,364
Settlements with land lessors 2,754 2,048
Obligation under finance lease payable within one year (Note 22) 2,484 3,236
Other current liabilities 12,811 15,169
Total 104,976 104,898
20. Short-term Borrowings The balances of short-term borrowings were as follows:
As of
30 June 2019
As of
30 June 2018
Bank credit lines 182,160 182,657
Interest accrued on short-term borrowings 759 718
Interest accrued on long-term borrowings 527 125
Bank overdrafts (Note 8) 246 41,273
Total 183,692 224,773
The balances of short-term borrowings as of 30 June 2019 were as follows:
Interest rate Currency Maturity Amount due
Ukrainian subsidiary of European bank 4.00% USD July 2019 48,700
European bank Libor + 2.25% USD July 2019 43,447
European bank Libor + 3.95% USD July 2019 32,860
European bank Libor + 4.00% USD July 2019 15,032
Ukrainian subsidiary of European bank 18.00% UAH July 2019 10,261
Ukrainian subsidiary of European bank 18.50% UAH July 2019 8,102
Ukrainian subsidiary of European bank 4.30% USD July 2019 7,300
European bank Libor + 1.50% USD July 2019 6,992
Ukrainian subsidiary of European bank 19.00% UAH July 2019 3,803
European bank Libor + 1.65% USD March 2020 2,903
Ukrainian subsidiary of European bank 18.25% UAH July 2019 2,484
European bank Libor + 2.45% USD July 2019 522
Total bank credit lines 182,406
Interest accrued on short-term loans 759
Interest accrued on long-term loans 527
Total 183,692

Kernel Holding S.A. Annual Report and Accounts 30 June 2019 112
www.kernel.ua
Notes to the Consolidated Statements continued for the year ended 30 June 2019 (in thousands of US dollars, unless otherwise stated)
The accompanying notes are an integral part of these financial statements.
Strategic
Report Sustainability
Corporate
Governance
Financial
Statements
The balances of short-term borrowings as of 30 June 2018 were as follows:
Interest rate Currency Maturity Amount due
European bank Libor + 4.15% USD July 2018 58,672
European bank Libor + 2.25% USD July 2018 41,273
Ukrainian subsidiary of European bank 3.75% USD July 2018 29,971
European bank Libor + 4.00% USD July 2018 23,286
European bank Libor + 3.50% USD July 2018 19,200
European bank Libor + 3.20% USD July 2018 10,500
Ukrainian subsidiary of European bank 3.80% USD July 2018 6,900
Ukrainian subsidiary of European bank 3.50% USD July 2018 6,800
Ukrainian subsidiary of European bank 3.55% USD August 2018 6,700
Ukrainian subsidiary of European bank 3.50% USD December 2018 5,800
Ukrainian subsidiary of European bank 16.40% UAH September 2018 5,475
Ukrainian subsidiary of European bank 3.55% USD July 2018 4,500
Ukrainian subsidiary of European bank 16.30% UAH July 2018 1,993
Ukrainian subsidiary of European bank 16.40% UAH August 2018 1,860
Ukrainian subsidiary of European bank 3.75% USD July 2018 1,000
Total bank credit lines 223,930
Interest accrued on short-term loans 718
Interest accrued on long-term loans 125
Total 224,773
As of 30 June 2019, undrawn short-term bank credit lines amounted to USD 708,866 thousand (as of 30 June 2018: USD 121,908 thousand).
Short-term borrowings from banks were secured as follows:
Assets pledged
As of
30 June 2019
As of
30 June 2018
Inventory (Note 12) 166,245 200,849
Future sales receipts 85,365 41,273
Property, plant and equipment (Note 15) 626 540
Total 252,236 242,662
21. Long-term Borrowings The balances of long-term borrowings were as follows:
As of
30 June 2019
As of
30 June 2018
Long-term bank borrowings 64,913 5,623
Current portion of long-term borrowings (1,233) (2,811)
Total 63,680 2,812
The balances of long-term borrowings as of 30 June 2019 were as follows:
Interest rate Currency Maturity Amount due
European bank Libor + 2.78% USD February 2029 50,000
European bank Libor + 2.77% USD April 2029 12,140
Ukrainian subsidiary of European bank Libor + 4.50% USD August 2021 2,773
Total 64,913
The balances of long-term borrowings as of 30 June 2018 were as follows:
Interest rate Currency Maturity Amount due
European bank Libor + 1.65% USD March 2020 5,623
As of 30 June 2019, undrawn long-term borrowings amounted to USD 243,860 thousand (as of 30 June 2018: nil).
Long-term bank borrowings from banks were secured as follows:
Assets pledged As of
30 June 2019
As of
30 June 2018
Property, plant and equipment (Note 15) 103,427 —
Total 103,427 —

Kernel Holding S.A. Annual Report and Accounts 30 June 2019 113
www.kernel.ua
Notes to the Consolidated Statements continued for the year ended 30 June 2019 (in thousands of US dollars, unless otherwise stated)
The accompanying notes are an integral part of these financial statements.
Strategic
Report Sustainability
Corporate
Governance
Financial
Statements
22. Obligations under Finance Leases The Group entered into finance lease arrangements for part of its agricultural equipment, vehicles and production machinery. Leases are denom-
inated in USD and UAH. The average term of finance leases is 5 years.
The major components of finance lease liabilities were as follows:
As of 30 June 2019 As of 30 June 2018
Minimum
lease
payments
Present value of
minimum lease
payments
Minimum
lease
payments
Present value of
minimum lease
payments
Amounts payable due to the finance lease:
Within one year (Note 19) 3,113 2,484 3,979 3,236
Later than one year and not later than five years 5,983 5,230 9,096 7,710
Total 9,096 7,714 13,075 10,946
Less future finance charges (1,382) — (2,129) —
Present value of lease obligations 7,714 7,714 10,946 10,946
The average effective interest rate contracted for the year ended 30 June 2019 was at the level of 9.74% (30 June 2018: 9.44%).
23. Bonds issued As of
30 June 2019
As of
30 June 2018
Unsecured senior notes 500,000 500,000
Less: Unamortized debt issue costs (3,949) (5,204)
Total 496,051 494,796
In January 2017 the Group issued USD 500,000 thousand unsecured notes (‘the Notes’), that will mature on 31 January 2022. The Notes bear
interest from 31 January 2017 at the rate of 8.75% per annum payable semi-annually in arrears on 31 January and 31 July each year commencing
from 31 July 2017.
As of 30 June 2019 and 2018, accrued interest on bonds issued was USD 17,949 thousand.
The Notes are unsecured, ranking equally with all existing and future senior unsecured indebtedness of the Issuer and have been unconditionally
and irrevocably guaranteed by designated Group subsidiaries on the joint and several basis to the maximum extent permitted by law.
The Notes contain certain restrictive covenants that limit the ability of the Issuer and, where applicable, its restricted subsidiaries to create or incur
certain liens, make restricted payments, engage in amalgamations, mergers or consolidations, or combination with other entities; make certain
disposals and transfers of assets; and enter into transactions with affiliates.
The Notes may be redeemed in whole, but not in part, at the option of the Issuer at a price equal to 100 per cent of their principal amount, plus
accrued and unpaid interest to the redemption date, in case of specified taxation event. The Notes could be redeemed at any time, at the option
of the Issuer, up to 35 per cent of the principal aggregate amount of the Notes (‘Equity Offering’) at redemption price of 108.75 per cent of their
principal amount, plus accrued and unpaid interest to the redemption date.
Upon a change of control event each noteholder has the right, but not the obligation, to require the Issuer to purchase the Notes at the purchase
price equal to 100 per cent of their principal amount, plus accrued and unpaid interest to the purchase date.
The Notes were rated in line with the Issuer’s IDR by Fitch (B+) and S&P (B), which is two notches and one notch above the sovereign at the
issue date, respectively.
24. Income Tax The Company is subject to corporate income tax in Luxembourg. The tax rate in Luxembourg was 27.08% as of 30 June 2019 and 2018. The
effective income tax rate in Switzerland as of 30 June 2019 was in range 9.92% - 11.64%. Income tax rate in the US as of 30 June 2019 was
23.60%. The corporate income tax rate in Ukraine, where the main operations of the Group are located, was 18% as of 30 June 2019 and 2018.
The majority of the Group’s operating entities are located in Ukraine, therefore effective tax rate reconciliations is completed based on Ukrainian
statutory tax rates.
The majority of the Group’s companies that are involved in agricultural production pay the Unified Agricultural Tax (UAT) in accordance with the
Tax Code of Ukraine. The UAT replaces the following taxes for agricultural producers: Corporate Income Tax, Land Tax, Special Water Consump-
tion Duty, and Trade Patent. The UAT is calculated by local authorities and depends on the area and valuation of land occupied. This tax regime
is valid indefinitely. The UAT does not constitute an income tax and, as such, is recognized in the Consolidated Statement of Profit or Loss in
other operating income.

Kernel Holding S.A. Annual Report and Accounts 30 June 2019 114
www.kernel.ua
Notes to the Consolidated Statements continued for the year ended 30 June 2019 (in thousands of US dollars, unless otherwise stated)
The accompanying notes are an integral part of these financial statements.
Strategic
Report Sustainability
Corporate
Governance
Financial
Statements
The components of income tax expense were as follows:
For the year ended
30 June 2019
For the year ended
30 June 2018
Current income tax charge (3,359) (7,391)
Deferred tax (expenses)/benefit relating to origination and reversal of temporary differences (8,543) 13,291
Total income tax (expenses)/ benefit recognized in the reporting period (11,902) 5,900
The income tax expense is reconciled to the profit before income tax per Consolidated Statement of Profit or Loss as follows:
As of
30 June 2019
As of
30 June 2018
Profit before income tax 190,406 50,054
Tax expense at Ukrainian statutory tax rate of 18% (34,273) (9,010)
Effect of income that is exempt from taxation (farming) 34,984 15,996
Effect of different tax rates of Subsidiaries operating in other jurisdictions 1,527 (3,402)
Effect of unused tax losses and tax offsets not recognized as deferred tax assets 764 (510)
Other expenditures not allowable for income tax purposes and non-taxable income, net (14,904) 2,826
Income tax (expenses)/ benefit (11,902) 5,900
For the year ended 30 June 2019, USD 4,650 thousand income tax expenses were recognized in other comprehensive income (2018: nil).
The primary components of the deferred tax assets and deferred tax liabilities were as follows:
As of
30 June 2019
As of
30 June 2018
Tax losses carried forward 4,821 16,611
Valuation of property, plant and equipment 9,417 11,620
Valuation of inventory 307 334
Valuation of advances and other temporary differences 367 494
Deferred tax assets 14,912 29,059
Valuation of property, plant and equipment (32,438) (27,781)
Valuation of intangible assets (1,952) (2,026)
Valuation of prepayments to suppliers and other temporary differences (1,085) (286)
Deferred tax liabilities (35,475) (30,093)
Income tax liability, net (20,563) (1,034)
As of 30 June 2019, based upon projections for future taxable income over the periods in which the deductible temporary differences are antici-
pated to reverse, management believes it is probable that the Group will realize the benefits of deferred tax assets of USD 4,821 thousand (2018:
USD 16,611 thousand) recognized with respect to tax losses carried forward by the subsidiaries. The amount of future taxable income required
to be generated by the Subsidiaries to utilize the tax benefits associated with the tax loss carried forward is approximately USD 26,783 thousand
(2018: USD 92,283 thousand). However, the amount of the deferred tax asset considered realizable could be adjusted in the future if estimates
of taxable income are revised.
Tax losses incurred by subsidiaries registered in Ukraine can be brought forward for a reasonable period of time.
There were no unrecognized deferred tax assets arising from tax losses carried forward by the Group’s subsidiaries as of 30 June 2019 (as of
30 June 2018: USD 764 thousand).
The Group does not recognize a deferred tax liability for all taxable temporary differences associated with investments in subsidiaries as it is able
to control the timing of the reversal of such temporary differences and it is probable that they will not reverse in the foreseeable future.
Certain deferred tax assets and liabilities have been offset in accordance with the Group’s accounting policy. The following is an analysis of the
deferred tax balances (after offset) as they are presented in the Consolidated Statement of Financial Position:
As of
30 June 2019
As of
30 June 2018
Deferred tax assets 8,447 18,536
Deferred tax liabilities (29,010) (19,570)
Net deferred tax liabilities (20,563) (1,034)

Kernel Holding S.A. Annual Report and Accounts 30 June 2019 115
www.kernel.ua
Notes to the Consolidated Statements continued for the year ended 30 June 2019 (in thousands of US dollars, unless otherwise stated)
The accompanying notes are an integral part of these financial statements.
Strategic
Report Sustainability
Corporate
Governance
Financial
Statements
25. Revenue The Group’s revenue was as follows:
For the year ended
30 June 2019
For the year ended
30 June 2018
Revenue from agriculture commodities merchandizing 2,093,333 951,252
Revenue from edible oils sold in bulk, meal and cake 1,744,287 1,286,645
Revenue from bottled sunflower oil 114,526 106,846
Revenue from farming 29,983 51,529
Revenue from grain silo services 5,919 6,308
Revenue from transshipment services 4,085 423
Total 3,992,133 2,403,003
Revenue for the period is comprised of the following:
For the year ended
30 June 2019
Sale of commodities 3,841,624
Freight, storage and other services 150,509
Total 3,992,133
Revenue is obtained principally from the sale of commodities, recognized once the control of the goods has transferred from the Company to the
customer. Revenue derived from freight, storage and other services is recognized over time as the service is rendered. Disaggregated revenue
for each reportable segment is presented in the Note 6.
The transaction price allocated to unsatisfied performance obligations as of 30 June 2019 is of USD 1,952 thousand. This amount represents
revenue from carriage, freight and insurance services under CIF/CFR (INCOTERMS) contracts which are to be executed in July 2019 when the
goods are delivered to the point of destination and under which the Group has already recognized revenue from sale of goods at a point in time
as of 30 June 2019
26. Cost of Sales Cost of sales was as follows:
For the year ended
30 June 20191
For the year ended
30 June 2018
Cost of goods for resale and raw materials used 3,117,528 1,876,392
Shipping and handling costs (Note 3) 307,525 153,553
Amortization and depreciation 71,947 79,789
Rental payments 71,765 72,694
Payroll and payroll related costs 65,666 55,792
Other operating costs 19,331 23,010
Total 3,653,762 2,261,230
27. Other Operating Income, net For the year ended 30 June 2019, other operating income, net amounted to USD 28,228 thousand (2018: USD 59,092 thousand). Decrease was
mainly caused by loss on operations with commodity futures in the amount of USD 13,650 thousand, basically driven by result of Avere operations
with derivative instruments, including its revaluation as of year-end (2018: gain in the amount of USD 32,317 thousand).
For the year ended 30 June 2019, together with income from assigning transshipment quota entitlement in Zernovoy Terminalny Complex Taman
LLC for the amount of USD 8,000 thousand (2018: USD 7,800 thousand) (Note 32), other operating income included result from price difference
settlements namely contracts wash-out and circles, fines and penalties, VAT benefits and other state dotations and other income from operating
activities.
1 During the year ended 30 June 2019, the Group has changed its accounting policy due to IFRS 15 adoption and changed presentation of Distributions costs and included
them in Cost of sales. Comparative information was reclassified respectively. Please see Note 3 for more details and description of changes in accounting policy and reclas-sifications made.

Kernel Holding S.A. Annual Report and Accounts 30 June 2019 116
www.kernel.ua
Notes to the Consolidated Statements continued for the year ended 30 June 2019 (in thousands of US dollars, unless otherwise stated)
The accompanying notes are an integral part of these financial statements.
Strategic
Report Sustainability
Corporate
Governance
Financial
Statements
28. General and Administrative Expenses General and administrative expenses were as follows:
For the year ended
30 June 2019
For the year ended
30 June 2018
Payroll and payroll related costs 60,381 46,887
Audit, legal and other professional fees 11,052 6,841
Bad debts expenses 7,905 997
Repairs and material costs 7,454 6,858
Business trip expenses 4,955 5,073
Amortization and depreciation 3,805 2,870
Taxes other than income tax 2,287 2,478
Rental payments 2,158 1,815
Insurance 1,918 2,554
Communication expenses 1,522 878
Bank services 1,444 1,658
Other expenses 1,651 1,090
Total 106,532 79,999
Audit, legal and other professional fees for the year ended 30 June 2019 include the auditor’s remuneration in the amount of USD 659 thousand
and no consultancy fees for the respective period (for the year ended 30 June 2018: USD 495 thousand and nil, respectively).
29. Finance Costs, net Finance costs, net were as follows:
For the year ended
30 June 2019
For the year ended
30 June 2018
Interest on corporate bonds (Note 23) 44,886 44,619
Interest expense on bank loans 26,520 15,336
Other finance costs, net 10,913 5,144
Total 82,319 65,099
30. Foreign Exchange Gain/(Loss), net For the year ended 30 June 2019, foreign exchange gain, net amounted to USD 12,860 thousand (30 June 2018: USD 5,375 thousand). The
result is mostly connected with fluctuation of exchange rates which influenced on revaluation of balances denominated in other than functional
currencies, namely trade balances, VAT and income tax prepaid, borrowings (including intra-group balances: the Company’s subsidiaries operate
with different functional currencies and during the normal course of business issue intercompany financing which, when revalued, causes either
foreign exchange gains or losses at one of the Company’s subsidiaries if they had different functional currencies) (Note 35).
31. Other Expenses, net Other expenses, net were as follows:
For the year ended
30 June 2019
For the year ended
30 June 2018
Revaluation losses of property, plant and equipment (Note 15) 10,234 —
Charity 2,303 2,440
Fines and penalties (Note 34) 1,610 28,923
Other material expenses 1,341 2,084
Gain on bargain purchase (Note 7) — (2,309)
(Reduction of impairment)/Impairment of intangible assets and goodwill, net (Note 16, 17) (116) 577
Gain on disposal of property, plant and equipment (605) (791)
Gain on disposal of Subsidiaries (Note 7) (4,833) (2,972)
Other (gain)/expenses, net (1,558) 3,028
Total 8,376 30,980
32. Investments in Joint Ventures On 27 September 2012, a 50/50 joint venture was formed with Renaisco BV, a Subsidiary of Glencore International PLC. The joint venture acquired
a 100% interest in a deep-water grain export terminal in Taman port (the Russian Federation). Taman port provides storage and transshipment
services as well as an efficient freight forwarding process.
As of 30 June 2019, the Group assigned its transshipment quota entitlement for the year ended 30 June 2020 (2,000,000 tons) in Zernovoy
Terminalny Complex Taman LLC to a third party (year ended 30 June 2019: 2,000,000 tons). For the year ended 30 June 2019, income received
for the quota entitlement amounted to USD 8,000 thousand (2018: USD 7,800 thousand) and was included in Other operating income, net
(Note 27).

Kernel Holding S.A. Annual Report and Accounts 30 June 2019 117
www.kernel.ua
Notes to the Consolidated Statements continued for the year ended 30 June 2019 (in thousands of US dollars, unless otherwise stated)
The accompanying notes are an integral part of these financial statements.
Strategic
Report Sustainability
Corporate
Governance
Financial
Statements
The investment in the joint venture is accounted for using the equity method from the date of acquisition. The Group has the following significant
interests in joint ventures (all related to the export terminal in Taman port):
Name of joint venture Principal activity
Place of incorporation
and principal place of
business
Proportion of ownership interest and
voting rights held by the Group
As of 30 June 2019 As of 30 June 2018
Taman Grain Terminal Holdings Limited Holding Company Cyprus 50.0% 50.0%
Taman Invest Limited CJSC Holding Company Russian Federation 50.0% 50.0%
Zernovoy Terminalny Complex Taman LLC Grain export terminal Russian Federation 50.0% 50.0%
Financial data in regard to joint ventures, reflecting 100% interest in the underlying joint venture, was as follows:
As of 30 June 2019 As of 30 June 2018
Current assets 3,331 5,621
Non-current assets 64,735 66,260
Current liabilities (20,911) (17,914)
Non-current liabilities (9,274) (14,154)
Net assets of joint ventures 37,881 39,813
The above amount of assets and liabilities include the following:
As of 30 June 2019 As of 30 June 2018
Cash and cash equivalents 20 1,055
Property, plant and equipment, net 63,586 65,633
Current financial liabilities (excluding trade and other payables and provisions) (4,618) (5,050)
Non-current financial liabilities (excluding trade and other payables and provisions) (5,877) (10,532)
Summarized statement of profit or loss and other comprehensive income of joint ventures was as follows:
For the year ended
30 June 2019
For the year ended
30 June 2018
Revenue 23,217 35,572
Cost of sales (23,849) (29,104)
Other operating income 1,244 —
General and administrative expenses (3,304) (3,566)
(Loss)/Profit from operating activities (2,692) 2,902
Other income, net 70 542
(Loss)/Profit before income tax (2,622) 3,444
Income tax benefit/(expenses) 690 (1,058)
(Loss)/Profit for the period and total comprehensive (loss)/income (1,932) 2,386
The above information for the period includes the following:
Year ended
30 June 2019
Year ended
30 June 2018
Depreciation and amortization 4,086 4,217
Interest expenses 1,344 2,271
Reconciliation of the above summarized financial information to the carrying amount of the interest in the joint venture recognized in the consoli-
dated financial statements:
Year ended
30 June 2019
Year ended
30 June 2018
Net assets of the joint venture 37,881 39,813
Proportion of the Group’s ownership interest in the joint venture 50.0% 50.0%
Goodwill 32,311 32,311
Carrying amount of the Group’s interest in the joint venture 51,252 52,218

Kernel Holding S.A. Annual Report and Accounts 30 June 2019 118
www.kernel.ua
Notes to the Consolidated Statements continued for the year ended 30 June 2019 (in thousands of US dollars, unless otherwise stated)
The accompanying notes are an integral part of these financial statements.
Strategic
Report Sustainability
Corporate
Governance
Financial
Statements
33. Transactions with Related Parties Related parties are the Beneficial Owner and companies under control of the Beneficial Owner, joint ventures and the Group’s key management
personnel.
The Group had the following balances outstanding with related parties:
Related party
balances as of
30 June 2019
Total category as per
consolidated state-
ment of financial posi-
tion as of 30 June 2019
Related party
balances as of
30 June 2018
Total category as per
consolidated state-
ment of financial posi-
tion as of 30 June 2018
Trade accounts receivable, net (Note 9) 785 183,196 106 92,355
Prepayments to suppliers and other current
assets, net (Note 10)
9,675 129,822 9,714 113,342
Other non-current assets (Note 18) 19,769 155,732 13,366 134,562
Advances from customers and other current
liabilities (Note 19)
4,462 104,976 8,204 104,898
Other non-current liabilities — 43,843 1,058 32,506
As of 30 June 2019, and 30 June 2018, prepayments to suppliers and other current assets included a trade prepayment to Zernovoy Terminalny
Complex Taman LLC according to the transshipment agreement in the amount of USD 3,574 thousand and USD 4,358 thousand, respectively.
As of 30 June 2019, prepayments to suppliers and other current assets and other non-current assets included a loan at rate comparable to the
average commercial rate of interest in the amount of USD 2,575 thousand provided to Taman Grain Terminal Holding (30 June 2018: USD 2,484
thousand).
As of 30 June 2019, other non-current assets included a loan at rate comparable to the average commercial rate of interest in the amount of USD
10,459 thousand provided to the company under control of the Beneficial Owner (30 June 2018: nil).
As of 30 June 2019, other non-current assets included an interest-free financing in the amount of USD 5,493 thousand and loan at a rate compa-
rable to the market rate in the amount of USD 1,000 thousand provided to key management personnel (30 June 2018: USD 6,076 thousand and
USD 1,000 thousand, respectively).
As of 30 June 2019, advances from customers and other current liabilities included USD 3,099 thousand in bonuses payable to the management
(30 June 2018: USD 1,413 thousand).
The amounts outstanding are unsecured and will be settled in cash. No guarantees have been given or received.
All remaining outstanding balances with related parties, which are presented in the table above, were represented by amounts due to companies
under common control.
Transactions with related parties were as follows:
Amount of opera-
tions with related
parties, for the year
ended 30 June 2019
Total category as
per consolidated
statement of finan-
cial position as of
30 June 2019
Amount of opera-
tions with related
parties, for the year
ended 30 June 2018
Total category per
consolidated state-
ment of profit or
loss for the year
ended 30 June 2018
Revenue (Note 25) 1,165 3,992,133 — 2,403,003
Cost of sales (Note 26) (4,192) (3,653,762) — (2,261,230)
General and administrative expenses (Notes 28) (8,377) (106,532) (7,944) (79,999)
Finance costs, net (Note 29) (611) (82,319) 94 (65,099)
Other expenses, net (Note 31) 3,178 (8,376) (2) (30,980)
Transactions with related parties are performed on terms that would not necessarily be available to unrelated parties.
As of 30 June 2019, the Board of Directors consisted of the following eight directors: the chairman of the board, three non-executive independent
directors and four directors employed by Subsidiaries. Remuneration of the Board of Directors (8 Directors) for the year ended 30 June 2019
amounted to USD 500 thousand (30 June 2018: 8 directors, USD 568 thousand). The non-executive directors were also refunded, to a reasonable
extent, any expenses incurred by them in performing their duties, including reasonable traveling expenses.
Four directors employed by Subsidiaries are entitled to remuneration for their services as members of the management team of the Group.
Remuneration of the management team of the Group, totaling 12 people, amounted to USD 5,518 thousand for the year ended 30 June 2019
(30 June 2018: 12 people, USD 3,294 thousand), including USD 3,099 thousand of variable bonus as per approved remuneration scheme
(30 June 2018: USD 827 thousand).
Members of the Board of Directors and management team are not granted any pensions, retirement or similar benefits by the Group. The man-
agement of the Group has been provided with options to purchase shares of the Holding (Note 2).

Kernel Holding S.A. Annual Report and Accounts 30 June 2019 119
www.kernel.ua
Notes to the Consolidated Statements continued for the year ended 30 June 2019 (in thousands of US dollars, unless otherwise stated)
The accompanying notes are an integral part of these financial statements.
Strategic
Report Sustainability
Corporate
Governance
Financial
Statements
34. Commitments and Contingencies Operating Environment In the recent years, Ukraine has been in a political and economic turmoil. Crimea, an autonomous republic of Ukraine, was effectively annexed
by the Russian Federation. In 2018-2019, an armed conflict with separatists continued in certain parts of Luhansk and Donetsk regions. These
events resulted in higher inflation, devaluation of the national currency against major foreign currencies, decrease of GDP, illiquidity, and volatility
of financial markets.
During the year ended 30 June 2019, annual inflation rate amounted to 9% (2018: 10%). The Ukrainian economy proceeded recovery from the
economic and political crisis of previous years that resulted in GDP smooth growth for the year ended 30 June 2019 for 3% (2018: 3%) and
stabilization of national currency. From trading perspective, the economy continued to demonstrate refocusing on the European Union (“EU”)
market, in such a way effectively reacting to mutual trading restrictions imposed between Ukraine and Russia.
To further facilitate business activities in Ukraine, the National Bank of Ukraine (NBU) lifts the surrender requirement of a share of foreign currency
proceeds. The requirement that obliged entrepreneurs to sell certain share of their foreign currency proceeds was abolished starting from 20 June
2019.
In line with the currency liberalization the National Bank of Ukraine (“NBU”) streamlined currency supervision of compliance with settlement
deadlines for export and import transactions in foreign currency from 120 to 365 days and cancelled all limits on repatriation of dividends since
July 2019 (from March 2018, companies were allowed to pay dividends to foreign investors in foreign currency at the amount under USD 7 million
per month regardless of the period, when such dividends were accrued).
Further stabilization of the economic and political situation depends, to a large extent, upon success of the Ukrainian government’s efforts and
cooperation with the International Monetary Fund (“IMF”), yet further economic and political developments are currently difficult to predict.
Retirement and Other Benefit Obligations Employees of the Group receive pension benefits from the government in accordance with the laws and regulations of Ukraine. The Group’s
contributions to the State Pension Fund for the year ended 30 June 2019 were USD 18,619 thousand (2018: USD 15,594 thousand).
The Group is required to contribute a specified percentage of the payroll to the Pension Fund to finance some post-retirement benefits of its former
employees. The only obligation of the Group with respect to this pension plan is to make the specified contributions. For the year ended 30 June
2019, there were USD 222 thousand retirement and other pension obligation expenses of the Group recognized (2018: nil). As of 30 June 2019,
and 30 June 2018, the Group was not liable for any significant supplementary pensions, post-retirement health care, insurance benefits or retire-
ment indemnities to its current or former employees.
Capital Commitments As of 30 June 2019, the Group had commitments under contracts with a group of suppliers for a total amount of USD 152,851 thousand, mostly
for the construction of an oil-crushing plant and port terminal (30 June 2018: USD 109,681 thousand, mostly for the purchase of agricultural
equipment and reconstruction of a terminal).
Contractual Commitments on Sales As of 30 June 2019, the Group had entered into commercial contracts for the export of 802,375 tons of grain and 546,117 tons of sunflower oil
and meal, corresponding to an amount of USD 156,194 thousand and USD 227,450 thousand, respectively, in contract prices as of the reporting
date.
As of 30 June 2018, the Group had entered into commercial contracts for the export of 1,631,918 tons of grain and 503,369 tons of sunflower oil
and meal, corresponding to an amount of USD 314,269 thousand and USD 248,196 thousand, respectively, in contract prices as of the reporting
date.
Commitments on leases of property plant and equipment As of 30 June 2019, following the strategy to increase port capacity, the Group entered into a 49-year lease contract of property plant and
equipment with a renewal option according to the market rent. The Group is obliged to perform fixed monthly payments adjusted on the rate of
inflation. The Group will not obtain the right to acquire property plant and equipment after expiration of the lease contract.
The future minimum lease payments:
Lease term Future minimum lease payment
as of 30 June 2019
Future minimum lease payment
as of 30 June 2018
Less than 1 year 548 550
From 1 to 5 years 2,193 2,198
More than 5 years 21,683 22,289
Total 24,424 25,037
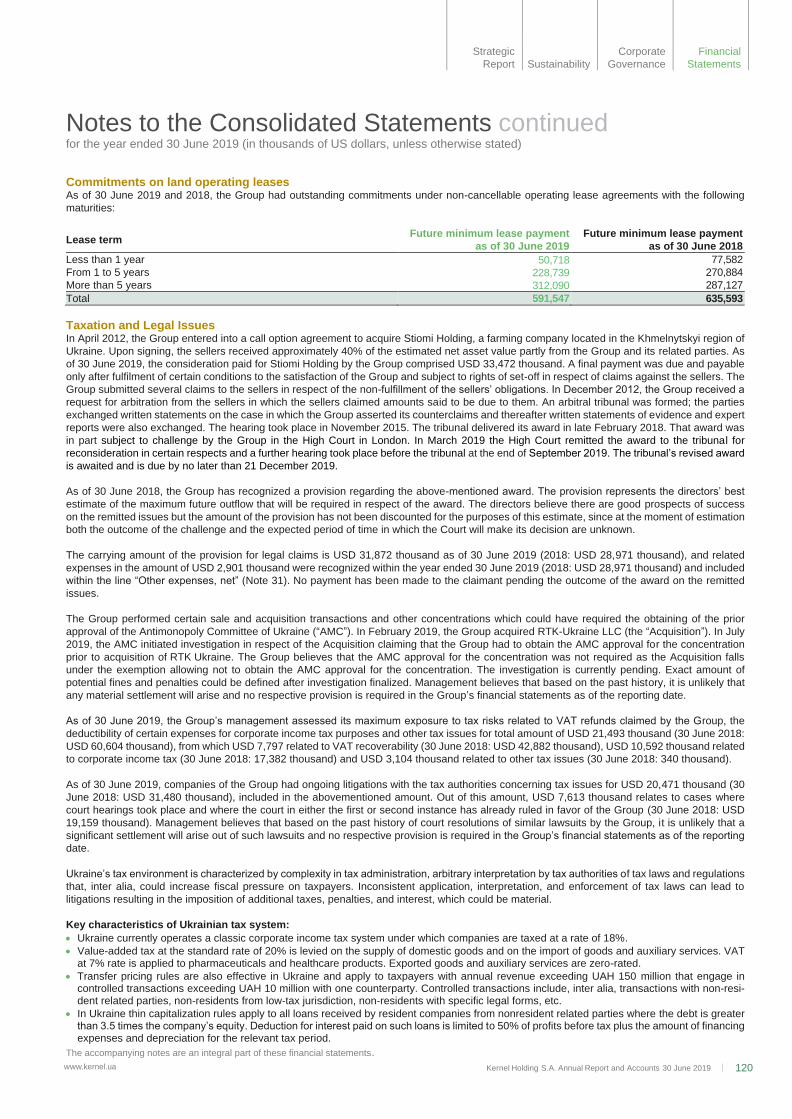
Kernel Holding S.A. Annual Report and Accounts 30 June 2019 120
www.kernel.ua
Notes to the Consolidated Statements continued for the year ended 30 June 2019 (in thousands of US dollars, unless otherwise stated)
The accompanying notes are an integral part of these financial statements.
Strategic
Report Sustainability
Corporate
Governance
Financial
Statements
Commitments on land operating leases As of 30 June 2019 and 2018, the Group had outstanding commitments under non-cancellable operating lease agreements with the following
maturities:
Lease term Future minimum lease payment
as of 30 June 2019
Future minimum lease payment
as of 30 June 2018
Less than 1 year 50,718 77,582
From 1 to 5 years 228,739 270,884
More than 5 years 312,090 287,127
Total 591,547 635,593
Taxation and Legal Issues In April 2012, the Group entered into a call option agreement to acquire Stiomi Holding, a farming company located in the Khmelnytskyi region of
Ukraine. Upon signing, the sellers received approximately 40% of the estimated net asset value partly from the Group and its related parties. As
of 30 June 2019, the consideration paid for Stiomi Holding by the Group comprised USD 33,472 thousand. A final payment was due and payable
only after fulfilment of certain conditions to the satisfaction of the Group and subject to rights of set-off in respect of claims against the sellers. The
Group submitted several claims to the sellers in respect of the non-fulfillment of the sellers’ obligations. In December 2012, the Group received a
request for arbitration from the sellers in which the sellers claimed amounts said to be due to them. An arbitral tribunal was formed; the parties
exchanged written statements on the case in which the Group asserted its counterclaims and thereafter written statements of evidence and expert
reports were also exchanged. The hearing took place in November 2015. The tribunal delivered its award in late February 2018. That award was
in part subject to challenge by the Group in the High Court in London. In March 2019 the High Court remitted the award to the tribunal for
reconsideration in certain respects and a further hearing took place before the tribunal at the end of September 2019. The tribunal’s revised award
is awaited and is due by no later than 21 December 2019.
As of 30 June 2018, the Group has recognized a provision regarding the above-mentioned award. The provision represents the directors’ best
estimate of the maximum future outflow that will be required in respect of the award. The directors believe there are good prospects of success
on the remitted issues but the amount of the provision has not been discounted for the purposes of this estimate, since at the moment of estimation
both the outcome of the challenge and the expected period of time in which the Court will make its decision are unknown.
The carrying amount of the provision for legal claims is USD 31,872 thousand as of 30 June 2019 (2018: USD 28,971 thousand), and related
expenses in the amount of USD 2,901 thousand were recognized within the year ended 30 June 2019 (2018: USD 28,971 thousand) and included
within the line “Other expenses, net” (Note 31). No payment has been made to the claimant pending the outcome of the award on the remitted
issues.
The Group performed certain sale and acquisition transactions and other concentrations which could have required the obtaining of the prior
approval of the Antimonopoly Committee of Ukraine (“AMC”). In February 2019, the Group acquired RTK-Ukraine LLC (the “Acquisition”). In July
2019, the AMC initiated investigation in respect of the Acquisition claiming that the Group had to obtain the AMC approval for the concentration
prior to acquisition of RTK Ukraine. The Group believes that the AMC approval for the concentration was not required as the Acquisition falls
under the exemption allowing not to obtain the AMC approval for the concentration. The investigation is currently pending. Exact amount of
potential fines and penalties could be defined after investigation finalized. Management believes that based on the past history, it is unlikely that
any material settlement will arise and no respective provision is required in the Group’s financial statements as of the reporting date.
As of 30 June 2019, the Group’s management assessed its maximum exposure to tax risks related to VAT refunds claimed by the Group, the
deductibility of certain expenses for corporate income tax purposes and other tax issues for total amount of USD 21,493 thousand (30 June 2018:
USD 60,604 thousand), from which USD 7,797 related to VAT recoverability (30 June 2018: USD 42,882 thousand), USD 10,592 thousand related
to corporate income tax (30 June 2018: 17,382 thousand) and USD 3,104 thousand related to other tax issues (30 June 2018: 340 thousand).
As of 30 June 2019, companies of the Group had ongoing litigations with the tax authorities concerning tax issues for USD 20,471 thousand (30
June 2018: USD 31,480 thousand), included in the abovementioned amount. Out of this amount, USD 7,613 thousand relates to cases where
court hearings took place and where the court in either the first or second instance has already ruled in favor of the Group (30 June 2018: USD
19,159 thousand). Management believes that based on the past history of court resolutions of similar lawsuits by the Group, it is unlikely that a
significant settlement will arise out of such lawsuits and no respective provision is required in the Group’s financial statements as of the reporting
date.
Ukraine’s tax environment is characterized by complexity in tax administration, arbitrary interpretation by tax authorities of tax laws and regulations
that, inter alia, could increase fiscal pressure on taxpayers. Inconsistent application, interpretation, and enforcement of tax laws can lead to
litigations resulting in the imposition of additional taxes, penalties, and interest, which could be material.
Key characteristics of Ukrainian tax system:
• Ukraine currently operates a classic corporate income tax system under which companies are taxed at a rate of 18%.
• Value-added tax at the standard rate of 20% is levied on the supply of domestic goods and on the import of goods and auxiliary services. VAT at 7% rate is applied to pharmaceuticals and healthcare products. Exported goods and auxiliary services are zero-rated.
• Transfer pricing rules are also effective in Ukraine and apply to taxpayers with annual revenue exceeding UAH 150 million that engage in controlled transactions exceeding UAH 10 million with one counterparty. Controlled transactions include, inter alia, transactions with non-resi-dent related parties, non-residents from low-tax jurisdiction, non-residents with specific legal forms, etc.
• In Ukraine thin capitalization rules apply to all loans received by resident companies from nonresident related parties where the debt is greater than 3.5 times the company’s equity. Deduction for interest paid on such loans is limited to 50% of profits before tax plus the amount of financing expenses and depreciation for the relevant tax period.
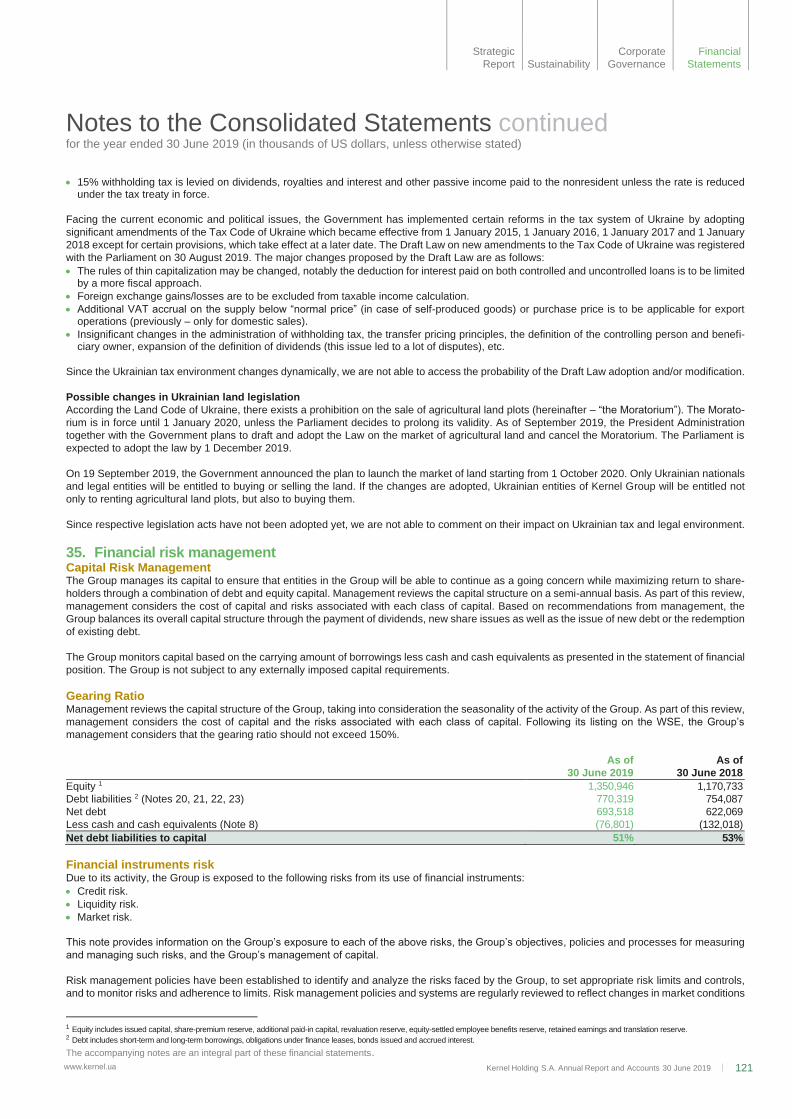
Kernel Holding S.A. Annual Report and Accounts 30 June 2019 121
www.kernel.ua
Notes to the Consolidated Statements continued for the year ended 30 June 2019 (in thousands of US dollars, unless otherwise stated)
The accompanying notes are an integral part of these financial statements.
Strategic
Report Sustainability
Corporate
Governance
Financial
Statements
• 15% withholding tax is levied on dividends, royalties and interest and other passive income paid to the nonresident unless the rate is reduced under the tax treaty in force.
Facing the current economic and political issues, the Government has implemented certain reforms in the tax system of Ukraine by adopting
significant amendments of the Tax Code of Ukraine which became effective from 1 January 2015, 1 January 2016, 1 January 2017 and 1 January
2018 except for certain provisions, which take effect at a later date. The Draft Law on new amendments to the Tax Code of Ukraine was registered
with the Parliament on 30 August 2019. The major changes proposed by the Draft Law are as follows:
• The rules of thin capitalization may be changed, notably the deduction for interest paid on both controlled and uncontrolled loans is to be limited by a more fiscal approach.
• Foreign exchange gains/losses are to be excluded from taxable income calculation.
• Additional VAT accrual on the supply below “normal price” (in case of self-produced goods) or purchase price is to be applicable for export operations (previously – only for domestic sales).
• Insignificant changes in the administration of withholding tax, the transfer pricing principles, the definition of the controlling person and benefi-ciary owner, expansion of the definition of dividends (this issue led to a lot of disputes), etc.
Since the Ukrainian tax environment changes dynamically, we are not able to access the probability of the Draft Law adoption and/or modification.
Possible changes in Ukrainian land legislation
According the Land Code of Ukraine, there exists a prohibition on the sale of agricultural land plots (hereinafter – “the Moratorium”). The Morato-
rium is in force until 1 January 2020, unless the Parliament decides to prolong its validity. As of September 2019, the President Administration
together with the Government plans to draft and adopt the Law on the market of agricultural land and cancel the Moratorium. The Parliament is
expected to adopt the law by 1 December 2019.
On 19 September 2019, the Government announced the plan to launch the market of land starting from 1 October 2020. Only Ukrainian nationals
and legal entities will be entitled to buying or selling the land. If the changes are adopted, Ukrainian entities of Kernel Group will be entitled not
only to renting agricultural land plots, but also to buying them.
Since respective legislation acts have not been adopted yet, we are not able to comment on their impact on Ukrainian tax and legal environment.
35. Financial risk management Capital Risk Management The Group manages its capital to ensure that entities in the Group will be able to continue as a going concern while maximizing return to share-
holders through a combination of debt and equity capital. Management reviews the capital structure on a semi-annual basis. As part of this review,
management considers the cost of capital and risks associated with each class of capital. Based on recommendations from management, the
Group balances its overall capital structure through the payment of dividends, new share issues as well as the issue of new debt or the redemption
of existing debt.
The Group monitors capital based on the carrying amount of borrowings less cash and cash equivalents as presented in the statement of financial
position. The Group is not subject to any externally imposed capital requirements.
Gearing Ratio Management reviews the capital structure of the Group, taking into consideration the seasonality of the activity of the Group. As part of this review,
management considers the cost of capital and the risks associated with each class of capital. Following its listing on the WSE, the Group’s
management considers that the gearing ratio should not exceed 150%.
As of
30 June 2019
As of
30 June 2018
Equity 1 1,350,946 1,170,733
Debt liabilities 2 (Notes 20, 21, 22, 23) 770,319 754,087
Net debt 693,518 622,069
Less cash and cash equivalents (Note 8) (76,801) (132,018)
Net debt liabilities to capital 51% 53%
Financial instruments risk Due to its activity, the Group is exposed to the following risks from its use of financial instruments:
• Credit risk.
• Liquidity risk.
• Market risk.
This note provides information on the Group’s exposure to each of the above risks, the Group’s objectives, policies and processes for measuring
and managing such risks, and the Group’s management of capital.
Risk management policies have been established to identify and analyze the risks faced by the Group, to set appropriate risk limits and controls,
and to monitor risks and adherence to limits. Risk management policies and systems are regularly reviewed to reflect changes in market conditions
1 Equity includes issued capital, share-premium reserve, additional paid-in capital, revaluation reserve, equity-settled employee benefits reserve, retained earnings and translation reserve. 2 Debt includes short-term and long-term borrowings, obligations under finance leases, bonds issued and accrued interest.

Kernel Holding S.A. Annual Report and Accounts 30 June 2019 122
www.kernel.ua
Notes to the Consolidated Statements continued for the year ended 30 June 2019 (in thousands of US dollars, unless otherwise stated)
The accompanying notes are an integral part of these financial statements.
Strategic
Report Sustainability
Corporate
Governance
Financial
Statements
and the Group’s activities. The Group, through its training and management standards and procedures, aims to develop a disciplined and con-
structive control environment in which all employees understand their roles and obligations.
Credit Risk Credit risk is the risk of financial loss to the Group if a customer or counterparty to a financial instrument fails to meet its contractual obligations
and arises principally from the Group’s receivables from customers. The carrying amount of trade receivables and other current assets, cash and
cash equivalents and other financial assets represent the maximum credit exposure.
The Group’s most significant customer is an international customer, which accounted for USD 26,198 thousand out of total trade accounts receiv-
able as of 30 June 2019 (30 June 2018: one international customer accounted for USD 25,785 thousand).
The Group’s exposure to credit risk is influenced mainly by the individual characteristics of each customer. The characteristics of the Group’s
customer base, including the default risk of the industry and country, in which the major customers operate, has less of an influence on credit risk.
The management of the Group has established a credit policy under which each new customer is analyzed individually for creditworthiness before
the Group’s standard payment and delivery terms and conditions are offered. The Group’s review includes external ratings, where available, and
in some cases bank references, and also counterparty recommendations. Purchase limits are established for each customer, which represent the
maximum open amount without requiring approval from the management of the Group. These limits are reviewed quarterly. Customers that fail to
meet the Group’s benchmark for creditworthiness may transact with the Group only on a prepayment basis. To reduce non-payment risk in
international markets, the Group presents title documents via banking channels and uses payment instruments such as letters of credit and bank
guarantees. The Group does not hold any collateral or other credit enhancements to cover its credit risk associated with its financial assets.
Guarantees As of 30 June 2019, the Company has guaranteed to unrelated party that certain subsidiaries of the group will release the assets pledged under
the 3-year loan provided by the Company to unrelated party. In case subsidiaries do not release those after the loan repayment, then the Company
has to pay the amount that is equal to the market price of the assets or USD 29,900. The guarantee is valid for the term of the loan agreement.
Liquidity Risk Liquidity risk is the risk that the Group will not be able to meet its financial obligations as they fall due. The Group manages liquidity risk by
maintaining adequate reserves, banking facilities and reserve borrowing facilities by continuously monitoring forecasted and actual cash flows
and by matching the maturity profiles of financial assets and liabilities.
As of 30 June 2019, the carrying amount of the Group’s maximum exposure to financial obligations was USD 1,041,369 thousand (30 June 2018:
USD 960,300 thousand).
Typically, the Group ensures that it has sufficient cash on demand to meet expected operational expenses for a period of 60 days, including the
servicing of financial obligations; this excludes the potential impact of extreme circumstances that cannot reasonably be predicted, such as natural
disasters.
The average credit period on purchases of goods is 12 days.
The following table details the Group’s remaining contractual maturity for its non-derivative financial liabilities with agreed repayment periods as
of 30 June 2019 and 2018. The table has been drawn up based on the undiscounted cash flows of financial liabilities based on the earliest date
on which the Group can be required to pay. The tables include both interest and principal cash flows.
Non-derivative financial liabilities Carrying
amount
Contractual
cash flows
Less than 1
year 1–2 years 2–5 years
More than 5
years
Trade accounts payable 136,043 (136,043) (136,043) — — —
Short-term borrowings (Note 20) 183,692 (184,754) (184,754) — — —
Long-term borrowings (Note 21) 64,913 (82,988) (4,510) (7,802) (30,141) (40,535)
Obligations under finance leases (Note 22) 7,714 (9,095) (3,113) (2,924) (3,058) —
Bonds issued (Note 23) 514,000 (631,250) (43,750) (43,750) (543,750) —
Other current liabilities 55,297 (55,297) (55,297) — — —
Other non-current liabilities 43,843 (60,236) (1,868) (52,651) (5,717) —
Total 1,005,502 (1,159,663) (429,335) (107,127) (582,666) (40,535)
Non-derivative financial liabilities Carrying
amount
Contractual
cash flows
Less than 1
year 1–2 years 2–5 years
More than 5
years
Trade accounts payable 73,629 (73,629) (73,629) — — —
Short-term borrowings (Note 20) 224,773 (225,824) (225,824) — — —
Long-term borrowings (Note 21) 5,623 (5,995) (3,124) (2,871) — —
Obligations under finance leases (Note 22) 10,946 (13,075) (3,979) (3,113) (5,983) —
Bonds issued (Note 23) 512,745 (675,000) (43,750) (43,750) (587,500) —
Other current liabilities 47,779 (47,779) (47,779) — — —
Other non-current liabilities 32,506 (56,064) (1,867) (3,007) (51,190) —
Total 908,001 (1,097,366) (399,952) (52,741) (644,673) —

Kernel Holding S.A. Annual Report and Accounts 30 June 2019 123
www.kernel.ua
Notes to the Consolidated Statements continued for the year ended 30 June 2019 (in thousands of US dollars, unless otherwise stated)
The accompanying notes are an integral part of these financial statements.
Strategic
Report Sustainability
Corporate
Governance
Financial
Statements
Financial liabilities, which were not included above, are repayable within one year.
The concentration of liquidity risk is limited due to different repayment terms of financial liabilities and sources of borrowing facilities.
Market Risk The Group’s activities expose it primarily to the market risks of changes in foreign currency exchange rates, interest rates and commodity risk.
The objective of market risk management is to manage and control market risk exposures within acceptable parameters, while optimizing the
return on risk. The Group measures and manages market risk using a variety of tools and metrics such as Drawdown or Value at Risk.
Value at Risk (VaR) is a statistical estimate of the potential loss in value of our positions due to adverse market movements. The Avere companies
calculate VaR over a one-day time horizon with a 95 percent confidence level based on a Log-Normal assumption of Returns. Parameters are
estimated using and Exponentially Weighted Moving Average over a 75 days period with a weight of 0.94. Market risk VaR was USD 3,451
thousand as of 30 June 2019.
The Group’s VaR should be interpreted in light of the limitations of the methodologies used. These limitations include the following: • VaR model does not capture the liquidity of different risk positions and therefore does not estimate potential losses if the company liquidates
large positions over a short period of time.
• VaR is based on historical data may not provide the best estimate of the joint distribution of risk factor changes in the future and may fail to capture the risk of possible extreme adverse market movements which have not occurred in the historical window used in the calculations.
The Group does not disclose sensitivity analysis based on VaR as of year end since such analysis is unrepresentative of a risk inherent in financial
instruments during the year.
Currency Risk The major sources of financing of the Group, prices of sales contracts with customers, and prices of significant contracts for the purchase of goods
and services from suppliers are denominated in USD.
Interest and principal on borrowings are denominated in currencies that match the cash flows generated by the underlying operations of the Group,
primarily in USD. This provides the Group with a natural hedge against currency risk and no derivatives are required to cover such risk.
In respect of other monetary assets and liabilities denominated in foreign currencies, the Group ensures that its net exposure is kept at an
acceptable level by buying or selling foreign currencies at spot rates when necessary to address short-term imbalances.
The table below covers UAH and USD denominated assets and liabilities carried by Subsidiaries having distinct functional currencies.
The Group’s exposure to foreign currency risk as of 30 June 2019 and 2018 was as follows:
30 June 2019 30 June 2018
UAH USD UAH USD
Cash and cash equivalents 1,242 146 2,215 4,622
Trade accounts receivable, net 11,069 — 10,354 —
Other current assets 4,798 — — —
Other non-current assets 5,373 4,500 14,887 —
Trade accounts payable (30,442) — (15,702) (137)
Other current liabilities (1,323) (1,479) — —
Other non-current liabilities (35,936) — (31,208) —
Short-term borrowings from Ukrainian subsidiary of European bank (Note 20) (24,650) — (9,328) —
Long-term borrowings European Bank (Note 21) — (62,140) — —
Obligations under finance leases — (4,015) — (5,087)
Net exposure (69,869) (62,988) (28,782) (602)
10% change of the UAH against the USD would prompt a fluctuation in the equity and profit and loss account by the amounts shown below. This
analysis assumes that all other variables, in particular interest rates, remain constant.
Sensitivity of changes in the exchange rate of Ukrainian hryvnia (UAH) against US dollar (USD) is as follows:
Profit or loss (before income tax) effect for the year ended 30 June 2019:
10% strengthening of UAH........................................(1,261)
10% depreciation of UAH............................................. (12)
Profit or loss effect for the year ended 30 June 2018:
10% strengthening of UAH......................................... (2,823)
10% depreciation of UAH..............................................2,811
As of 30 June 2019, the Ukrainian hryvnia stabilized against major foreign currencies. Foreign exchange gains and losses reflected the Ukrainian
hryvnia fluctuation against the US dollar for the years ended 30 June 2019 and 2018. The Group recognized a net foreign exchange gain in the
amount of USD 12,860 thousand for the year ended 30 June 2019 and USD 5,375 thousand for the year ended 30 June 2018 (Note 31). In
management’s opinion, the sensitivity analysis is unrepresentative of the inherent foreign exchange risk because the exposure at the end of the
reporting period does not reflect the exposure during the year. Foreign exchange gain mostly consisted of gain incurred from operations resulted
from normal operating activity during the year ended 30 June 2019.
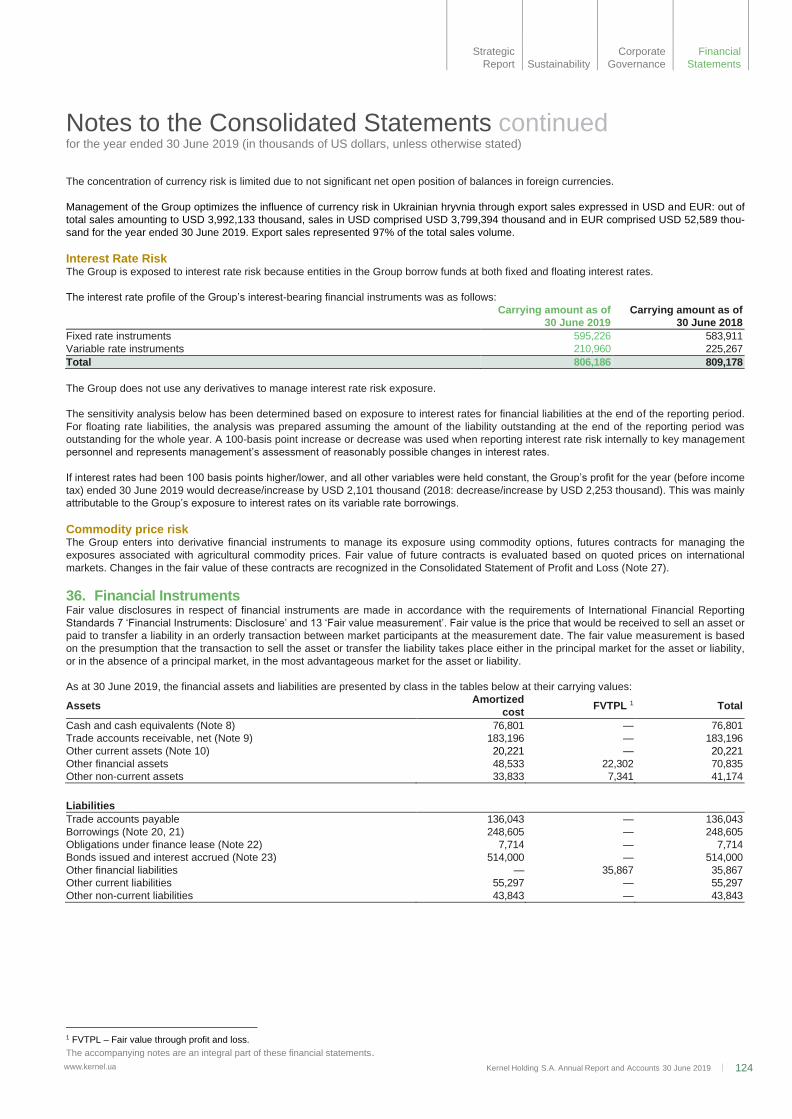
Kernel Holding S.A. Annual Report and Accounts 30 June 2019 124
www.kernel.ua
Notes to the Consolidated Statements continued for the year ended 30 June 2019 (in thousands of US dollars, unless otherwise stated)
The accompanying notes are an integral part of these financial statements.
Strategic
Report Sustainability
Corporate
Governance
Financial
Statements
The concentration of currency risk is limited due to not significant net open position of balances in foreign currencies.
Management of the Group optimizes the influence of currency risk in Ukrainian hryvnia through export sales expressed in USD and EUR: out of
total sales amounting to USD 3,992,133 thousand, sales in USD comprised USD 3,799,394 thousand and in EUR comprised USD 52,589 thou-
sand for the year ended 30 June 2019. Export sales represented 97% of the total sales volume.
Interest Rate Risk The Group is exposed to interest rate risk because entities in the Group borrow funds at both fixed and floating interest rates.
The interest rate profile of the Group’s interest-bearing financial instruments was as follows:
Carrying amount as of
30 June 2019
Carrying amount as of
30 June 2018
Fixed rate instruments 595,226 583,911
Variable rate instruments 210,960 225,267
Total 806,186 809,178
The Group does not use any derivatives to manage interest rate risk exposure.
The sensitivity analysis below has been determined based on exposure to interest rates for financial liabilities at the end of the reporting period.
For floating rate liabilities, the analysis was prepared assuming the amount of the liability outstanding at the end of the reporting period was
outstanding for the whole year. A 100-basis point increase or decrease was used when reporting interest rate risk internally to key management
personnel and represents management’s assessment of reasonably possible changes in interest rates.
If interest rates had been 100 basis points higher/lower, and all other variables were held constant, the Group’s profit for the year (before income
tax) ended 30 June 2019 would decrease/increase by USD 2,101 thousand (2018: decrease/increase by USD 2,253 thousand). This was mainly
attributable to the Group’s exposure to interest rates on its variable rate borrowings.
Commodity price risk The Group enters into derivative financial instruments to manage its exposure using commodity options, futures contracts for managing the
exposures associated with agricultural commodity prices. Fair value of future contracts is evaluated based on quoted prices on international
markets. Changes in the fair value of these contracts are recognized in the Consolidated Statement of Profit and Loss (Note 27).
36. Financial Instruments Fair value disclosures in respect of financial instruments are made in accordance with the requirements of International Financial Reporting
Standards 7 ‘Financial Instruments: Disclosure’ and 13 ‘Fair value measurement’. Fair value is the price that would be received to sell an asset or
paid to transfer a liability in an orderly transaction between market participants at the measurement date. The fair value measurement is based
on the presumption that the transaction to sell the asset or transfer the liability takes place either in the principal market for the asset or liability,
or in the absence of a principal market, in the most advantageous market for the asset or liability.
As at 30 June 2019, the financial assets and liabilities are presented by class in the tables below at their carrying values:
Assets Amortized
cost FVTPL 1 Total
Cash and cash equivalents (Note 8) 76,801 — 76,801
Trade accounts receivable, net (Note 9) 183,196 — 183,196
Other current assets (Note 10) 20,221 — 20,221
Other financial assets 48,533 22,302 70,835
Other non-current assets 33,833 7,341 41,174
Liabilities
Trade accounts payable 136,043 — 136,043
Borrowings (Note 20, 21) 248,605 — 248,605
Obligations under finance lease (Note 22) 7,714 — 7,714
Bonds issued and interest accrued (Note 23) 514,000 — 514,000
Other financial liabilities — 35,867 35,867
Other current liabilities 55,297 — 55,297
Other non-current liabilities 43,843 — 43,843
1 FVTPL – Fair value through profit and loss.

Kernel Holding S.A. Annual Report and Accounts 30 June 2019 125
www.kernel.ua
Notes to the Consolidated Statements continued for the year ended 30 June 2019 (in thousands of US dollars, unless otherwise stated)
The accompanying notes are an integral part of these financial statements.
Strategic
Report Sustainability
Corporate
Governance
Financial
Statements
As at 30 June 2018 the financial assets and liabilities are presented by class in the tables below at their carrying values:
Assets Amortized
cost FVTPL 1 Total
Cash and cash equivalents (Note 8) 132,018 — 132,018
Trade accounts receivable, net (Note 9) 92,355 — 92,355
Other financial assets — 72,344 72,344
Other non-current assets 10,123 — 10,123
Liabilities
Trade accounts payable 73,629 — 73,629
Borrowings 230,396 — 230,396
Obligations under finance lease (Note 22) 10,946 — 10,946
Bonds issued (Note 23) 512,745 — 512,745
Other financial liabilities — 51,456 51,456
Other current liabilities 48,622 — 48,622
Other non-current liabilities 32,506 — 32,506
As of 30 June 2019, other financial assets include Initial margin used as collateral for derivatives in the amount of USD 22,147 thousand. The
cash collateral does not meet the offsetting criteria in IAS 32, but it can be set off against the net amount of the derivative asset and derivative
liability in the case of default and in accordance with associated collateral arrangements.
All assets and liabilities for which fair value is measured or disclosed in the financial statements are categorized within the fair value hierarchy,
described as follows, based on the lowest level input that is significant to the fair value measurement as a whole:
• Level 1: Quoted (unadjusted) market prices in active markets for identical assets or liabilities.
• Level 2: Valuation techniques for which the lowest level input that is significant to the fair value measurement is directly or indirectly observable.
• Level 3: Valuation techniques for which the lowest level input that is significant to the fair value measurement is unobservable.
The following table below represents comparison of carrying amounts and fair value of the financial instruments:
30 June 2019 30 June 2018
Financial liabilities 2 Carrying amount Fair value Carrying amount Fair value
Long-term borrowings (Note 21) 64,913 65,066 5,623 5,623
Obligations under finance lease (Note 22) 7,714 7,709 10,946 10,873
Bonds issued (Note 23) 514,000 527,330 512,745 499,205
For the year ended 30 June 2019, the fair value of bank long-term borrowings was estimated by discounting the expected future cash outflows by
a market rate of interest for bank borrowings of 5.12% (2018: 4.42%) that is within level 2 of the fair value hierarchy.
The fair value of Bonds issued was estimated based on published price quotations in an active market and is within Level 1 of the fair value
hierarchy.
The following table below represents the fair values of the derivative financial instruments including trade related financial and physical forward
purchase as at 30 June 2019 and 2018.
As at 30 June 2019
Other financial assets Level 1 Level 2 Total
Physical forwards — 21,591 21,591
Futures 318 — 318
Options 393 — 393
Total 711 21,591 22,302
Other financial liabilities
Physical forwards — 26,397 26,397
Futures 9,470 — 9,470
Total 9,470 26,397 35,867
1 FVTPL – Fair value through profit and loss. 2 Including accrued interests

Kernel Holding S.A. Annual Report and Accounts 30 June 2019 126
www.kernel.ua
Notes to the Consolidated Statements continued for the year ended 30 June 2019 (in thousands of US dollars, unless otherwise stated)
The accompanying notes are an integral part of these financial statements.
Strategic
Report Sustainability
Corporate
Governance
Financial
Statements
As at 30 June 2018
Other financial assets Level 1 Level 2 Total
Physical forwards — 67,303 67,303
Futures 4,856 — 4,856
Options 185 — 185
Total 5,041 67,303 72,344
Other financial liabilities
Physical forwards — 49,023 49,023
Futures 1,003 — 1,003
Options 1,430 — 1,430
Total 2,433 49,023 51,456
Derivative instruments are carried at fair value for which the Group evaluates the quality and reliability of the assumptions and data used to
measure fair value in the two hierarchy levels, Level 1 and 2, as prescribed by IFRS 13 Fair Value Measurement. Fair values are determined in
the following ways: externally verified via comparison to quoted market prices in active markets (Level 1) or by observable quoted prices sourced
from exchanges or brokers in active markets for identical assets or liabilities (Level 2).
Valuation of the Group’s commodity physical forward contracts categorized within level 2 is based on observable quoted prices sourced from
exchanges or traded reference indices in active markets for identical assets or liabilities and broker mark ups derived from observable quotations
representing differentials, as required, including geographic location and local supply and demand.
Major part of other financial liabilities has contractual maturity due within 6 months.
The fair value is estimated to be the same as the carrying value of cash and cash equivalents, trade accounts receivable, other current assets,
trade accounts payable, other current liabilities and short-term borrowings due to the short-term nature of the financial instruments. Cash and
cash equivalents and short-term borrowings are classified as level 2 fair values in the fair value hierarchy due to the inclusion of directly and
indirectly observable inputs. Trade receivables, other current assets and trade accounts payable, other current liabilities are classified as level 3
fair values in the fair value hierarchy due to the inclusion of unobservable inputs including counterparty credit risk.
For the year ended 30 June 2019, the fair value of obligations under finance lease was estimated by discounting the expected future cash outflows
by a market rate of finance lease of 12.10% (2018: 11.08%) that is within level 2 of the fair value hierarchy.
For the year ended 30 June 2019, the fair value of other non-current assets recognized at amortized cost was estimated by discounting the
expected future cash outflows by a market rate of interest for bank borrowings of 5-10% that is within level 3 in the fair value hierarchy due to the
inclusion of unobservable inputs including counterparty credit risk.
For the year ended 30 June 2019, the fair value of other non-current assets recognized at FVTPL was estimated by market comparable approach
that is within level 2 in the fair value hierarchy.
As of 30 June 2019, fair value of other non-current assets and liabilities does not differ materially from it carrying amount and are classified as
level 3 fair values in the fair value hierarchy due to the inclusion of unobservable inputs including counterparty credit risk. For the year ended 30
June 2019, the fair value of other non-current assets recognized at amortized cost was estimated by discounting the expected future cash outflows
by a market rate of interest for bank borrowings of 5-10% that is within level 3 in the fair value hierarchy due to the inclusion of unobservable
inputs including counterparty credit risk.
For the years ended 30 June 2019 and 2018, the fair value of other non-current liabilities was estimated by discounting the expected future cash
outflows by a market rate of interest for bank borrowings of 24.88% and 22.93%, respectively.
There were no transfers between levels of fair value hierarchy.
There were no changes in the valuation technique since the previous year.
37. Earnings per Share Basic earnings per share from continuing and discontinued operations are computed by dividing net income from continuing and discontinued
operations available to ordinary shareholders by the weighted-average number of ordinary shares outstanding (as of 30 June 2019 and 2018,
81,941,230 weighted average number of ordinary shares for the periods ended then), excluding any dilutive effects of stock options. Diluted
earnings per share are computed in the same way as basic earnings per share, except that the weighted-average number of ordinary shares
outstanding is increased to include additional shares from the assumed exercise of stock options. The number of additional shares is calculated
by assuming that outstanding stock options, except those which are not dilutive, were exercised and that the proceeds from such an exercise
were used to acquire ordinary shares at the average market price during the reporting period. For calculating diluted earnings per share, an
average number of 82,820,378 ordinary shares is taken into account (30 June 2018: 82,887,231).
As of 30 June 2019 and 2018, total of 3,000,000 options granted under the management incentive scheme were excluded from the weighted-
average number of ordinary shares calculation for the purpose of diluted earnings per share as antidilutive.

Kernel Holding S.A. Annual Report and Accounts 30 June 2019 127
www.kernel.ua
Notes to the Consolidated Statements continued for the year ended 30 June 2019 (in thousands of US dollars, unless otherwise stated)
The accompanying notes are an integral part of these financial statements.
Strategic
Report Sustainability
Corporate
Governance
Financial
Statements
Impact from adoption of new standards on both basic and diluted earnings per share was not material.
38. Subsequent Events On 13 August 2019, according to management’s plan, the Company disposed one of export terminals, assets of which as of 30 June 2019 were
classified as assets held for sale.
As of 3 September 2019, the Company entered pre-export credit facility with a syndicate of European banks. Total available limit under amended
facility was increased up to USD 390 million by adding additional tranche of USD 100 million maturing 31 August 2021 Moreover, the tenors of
existing tranches were extended for one year: USD 200 million till 31 August 2022 and USD 90 million till 31 August 2020, respectively. Financing
will be used by the Company to fund the working capital needs of its sunflower oil production business in Ukraine.
As of 6 September 2019, Fitch Ratings has upgraded Ukraine's Long-Term Foreign- and Local-Currency Issuer Default Ratings (IDR) to 'B' from
'B-', the outlooks are positive, according to a report on the rating agency's website.
As of 23 September 2019, the Company entered pre-export credit facility with a syndicate of European banks. Total available limit under amended
facility was increased up to USD 300 million by adding additional tranche of USD 200 million maturing 30 June 2021. Moreover, the tenor of
existing USD 100 million tranche was extended for one year till 30 June 2022.

www.kernel.ua Kernel Holding S.A. Annual Report and Accounts 30 June 2019 128 128 128 128
Corporate Information
Strategic
Report Sustainability
Corporate
Governance
Financial
Statements
Headquarters
3 Tarasa Shevchenka Lane,
Kyiv, Ukraine, 01001
Tel.: +38044 4618801
Fax: +38044 4618864
Registered office
Kernel Holding S.A.
19, rue de Bitbourg L-1273 Luxembourg
Registered number
B109173
Auditors
Deloitte Audit S.а.r.l.,
560, rue du Neudorf,
L-2220 Luxembourg
Investor relations
Mr. Yuriy Kovalchuk,
Corporate Investment Director
Mr. Michael Iavorskyi, IR Manager
3 Tarasa Shevchenka Lane,
Kyiv, Ukraine, 01001
Tel.: +38044 4618801, ext. 72-75
Cautionary statement Certain statements in this document are for-
ward-looking statements. By their nature, for-
ward-looking statements involve a number of
risks, uncertainties or assumptions that could
cause actual results or events to differ materi-
ally from those expressed or implied by the
forward-looking statements. These risks, un-
certainties or assumptions could adversely af-
fect the outcome and financial effects of the
plans and events described herein. Forward-
looking statements contained in this docu-
ment regarding past trends or activities should
not be taken as a representation that such
trends or activities will continue in the future.
You should not place undue reliance on for-
ward-looking statements, which speak only as
of the date of this announcement. Except as
required by law, the Company is under no ob-
ligation to update or keep current the forward-
looking statements contained in this docu-
ment or to correct any inaccuracies which may
become apparent in such forward-looking
statements.
This document does not constitute or form
part of any offer or invitation to sell or pur-
chase, or any solicitation of any offer to sell or
purchase any shares or securities. It is not in-
tended to form the basis upon which any in-
vestment decision or any decision to purchase
any interest in Kernel Holding S.A. is made.
Information in this document relating to the
price at which investments have been bought
or sold in the past or the yield on investments
cannot be relied upon as a guide to future per-
formance.
Investor calendar
Q1 FY2020 Operations Update…………………………………………….....…....22 October 2019
Q1 FY2020 Financial Report…………………………………………………..…27 November 2019
Annual general shareholders’ meeting…………..……………………………...10 December 2019
Q2 FY2020 Operations Update…………………..…………………………………21 January 2020
H1 FY2020 Financial Report………………………………………………..……...28 February 2020
Q3 FY2020 Operations Update…………………………………………..………..……23 April 2020
Q3 FY2020 Financial Report……………………………….……………………………29 May 2020
Q4 FY2020 Operations Update……………………………………….…………………20 July 2020
FY2020 Financial Report…………………………………………………………....30 October 2020
Stock information
Exchange……….…………………………………………………………...Warsaw Stock Exchange
Stock quote currency………………………………………….…………………...……………….PLN
Shares issued as of 30 June 2019……………………………….………………..……..81,941,230
Bloomberg……………………………………………………………….…………..…………KER PW
Reuters ticker……………………………………………………………….…..………..….KERN.WA
ISIN code……………………………………………………….………….......………LU0327357389