kern-inyo-mono counties labor force...
TRANSCRIPT

KERN-INYO-MONO COUNTIES
LABOR FORCE ANALYSIS
OCTOBER 12, 2013
Prepared for:
EMPLOYER TRAINING RESOURCE
WORKFORCE INVESTMENT BOARD
Prepared by:
APPLIED DEVELOPMENT ECONOMICS, INC. 255 Ygnacio Valley Road, Suite 200 Walnut Creek, CA 94596
925.934.8712 www.adeusa.com
A p p l i e d D e v e l o p m e n t E c o n o m i c s
TTAABBLLEE OOFF CCOONNTTEENNTTSS
INTRODUCTION AND SUMMARY ......................................................................... 1
1. LOCAL ECONOMIC CONDITIONS .................................................................... 3
2. KEY DEMOGRAPHIC GROUPS ......................................................................... 5
3. EMPLOYMENT AND OCCUPATION PROJECTIONS ............................................... 12
4. SKILLS ANALYSIS......................................................................................... 31
5. TRAINING RESOURCES ................................................................................. 37
APPENDIX A: CLUSTER DEFINITIONS ................................................................ 45

A p p l i e d D e v e l o p m e n t E c o n o m i c s | P a g e 1
IINNTTRROODDUUCCTTIIOONN AANNDD SSUUMMMMAARRYY
INTRODUCTION
This report presents information on growing industry clusters in the Employer Training Resource WIB
and related business demand for selected occupational skills. The report describes characteristics of
the labor force and in particular focuses on the skills and employment needs of key population
segments such as unemployed and underemployed workers, veterans, the disabled and workers in
major ethnic groups.
The industry cluster analysis updates the recent work completed by the CSU Fresno Office of
Community and Economic Development, in the report, “San Joaquin Valley Regional Industry Cluster
Analysis and Action Plan,” published in September 2012. In that report, six major industry clusters
were identified and evaluated, including:
Agriculture
Energy
Logistics
Health Care
Manufacturing
Water Technology
The present report updates the analysis of the cluster beyond 2010 and provides projection of job
growth and occupational demand to the year 2017, based on data provided by Employment
Management Systems Inc. (EMSI).
In addition, the report provides a detailed demographic analysis of the workforce using the Public Use
Microdata Series (PUMS) data, which permits cross-tabulations of survey data collected through the
American Community Survey (ACS). The resulting analysis is consistent with published ACS population
totals for the Employer Training Resource WIB, but provides greater detail on the employment status
and skills levels of selected demographic groups.
SUMMARY
Economic Conditions. The unemployment rate had improved to 4.5% in Mono and Inyo counties and
dropped close to 8% in Kern County just prior to the recession in 2006. However, as the recession
continued, the unemployment rate reached a high of 10.0% by 2010 in Mono County and 15.9% in
Kern County. It has since declined to a 2012 annual average level of 9.4% in Mono and 13.3% in
Kern. In Inyo County, the unemployment rate initially peaked at 10.3% in 2010 and then briefly
declined to 10.1% in 2011 but increased again to 10.5% in 2012.
Industry Clusters. Agriculture is the largest industry cluster in Employer Training Resource WIB,
with 67,479 jobs and a concentration 3.9 times the statewide average. Agricultural jobs, except for
the Processing industry, have grown over the past decade. However, EMSI projects all agriculture
related jobs to grow over the next five years. For instance, Distribution grew about 23% between
2001 and 2010 and is projected to add another 5,082 jobs by 2017. Logistics is the third largest

A p p l i e d D e v e l o p m e n t E c o n o m i c s | P a g e 2
cluster in this WIB, at 5,822 jobs with a projected further increase of about 1,400 jobs by 2017. The
Water Technology cluster has seen substantial employment decline in the Employer Training Resource
WIB, but retail and tourism jobs are projected to grow between 2012 and 2017.
Labor Force Demographics and Skills. The report documents the correlation between education
and employment, with unemployment rates much higher for non-college graduates. Whites and other
non-Latino groups have higher rates of college graduation.
Under-utilized Workers. Non-college graduates also tend to be underutilized more often in the
workforce and again, Latinos have lower full time utilization rates (53.0 percent) than do whites (58.5
percent). In terms of unemployment rates by industry, a key economic driver for the region – mining,
oil, and gas (NAICS 21) – exhibited a low unemployment rate of 7 percent, about half of the region-
wide 14.4 unemployment rate. In 2011 agriculture had a 17 percent unemployment rate, but a
number of industries also had higher rates than the county average, including residential development
related sectors such as construction and real estate. These industries were particularly affected by the
recession but lodging and restaurants are projected to recover employment more quickly than most of
these other industry sectors.
Veterans. Based on the most recent ACS data, there are about 25,754 veterans in the labor force in
the region, representing about 6.8 percent of the labor force. It is estimated that 10 percent of
veterans were unemployed in 2011, compared to 14.5 percent for the non-veterans labor force.
Among the unemployed veterans, the largest group is in the 35-54 age group, particularly those who
did not graduate high school (46.3 percent unemployed).
Disabled Workers. There are an estimated 26,138 disabled workers in the labor force, comprising
6.9 percent of all workers in the County. The unemployment rate for disabled workers in 2011 is
estimated at 19.2 percent, compared to 14.0 percent for the non-disabled labor force. Unemployment
rates appear to be higher for younger disabled workers under 35 relative to those who are older than
34. Disabled workers with a Bachelor’s degree or higher also experience relatively high rates of
unemployment, as disabled workers in the 35-54 prime working age cohort with at least a Bachelor’s
exhibit a 20.3 percent unemployment rate, and those in the 55-64 age cohort a 13.7 percent
unemployment rate.
Training Programs. The report screens all of the projected growth occupations against the list of
WIB-approved training vendors and identifies which occupations appear to have available training
programs in the ETR region where there are gaps. The Health and Welfare – healthcare delivery sub-
cluster is one of the fastest growing industry sub-clusters and, within this sub-cluster, registered
nurses and radiological technicians occupations are expected to increase in number, although in the
California EDD ETPL database there are no job training program specifically targeting these
occupations in the three-county region. Likewise, there are a number of construction trades typically
utilized in the Energy cluster (energy power generation and transmission sub-cluster) that also do not
have training programs specifically targeting these growing occupations.

A p p l i e d D e v e l o p m e n t E c o n o m i c s | P a g e 3
11.. LLOOCCAALL EECCOONNOOMMIICC CCOONNDDIITTIIOONNSS
EMPLOYMENT TRENDS
The counties of Inyo, Kern and Mono are included
within the Employer Training Resource Workforce
Investment Board (ETR WIB). Employment growth
in the Employer Training Resource WIB was on
upward trend until 2008, when it began to shrink.
Between 2002 and 2008, the County added 42,850
jobs, reaching a peak of 303,040 wage and salary
jobs (Figure 1.1). Job losses from the recession
began to occur in 2009 when employment declined
to 284,960 jobs. The employed labor force, which
includes self-employed and out-commuters, followed
a very similar pattern.
After the 2008 recession, employers struggled to
add new jobs and finally after two rough years in
2009 and 2010 improved the economy with
310,460 Jobs in 2012 which is 7,420 jobs higher
than the previous peak in 2008.
The county had 341,120 employed residents in
2008, but due to the recession employment
dropped and 13,540 residents lost their jobs by
2009. In 2010, the unemployment rate peaked at
15.9 percent in Kern County, 10.3 in Mono
County, and 10.0 percent in Inyo County (Figure
1.2). It then began to drop as employment
recovered. By 2012, 359,930 residents were
employed (Table 1.1).
TABLE 1.1:
DEMOGRAPHIC AND LABOR FORCE TRENDS
2002 2012 2000-2012
Population estimates 728,302 888,417 22.0%
Labor Force 324,270 414,380 27.8%
Employed Labor Force 293,260 359,930 22.7%
Wage and Salary Jobs 260,190 310,460 19.3% Source: ADE, Inc., Department of Finance, California Economic Development
Department
Source: ADE, Inc., California EDD
FIGURE 1.2: UNEMPLOYMENT RATE (2002-2012)
FIGURE 1.1:
TOTAL JOBS AND EMPLOYED LABOR FORCE
(2002-2012)
Source: ADE, Inc., California EDD

A p p l i e d D e v e l o p m e n t E c o n o m i c s | P a g e 4
According to the State Department of Finance (DOF) and the Employment Development Department
(EDD), both population and labor force (16 years and older) had a steady increase from 2000 to 2012.
Population increased by 22 percent between 2002 and 2012; labor force had a steeper growth rate of
27.8 percent. However the percentage of residents who found employment between 2000 and 2012
increased by only 22.7 percent. Additionally, compared to labor force, jobs had a slower growth rate
of 19.3 percent from 2002 (Table 1.1).
The number of wage and salary jobs is almost 25 percent below the size of the labor force in Employer
Training Resource WIB (Table 1.1). Some of this difference would be due to self-employment, but it is
also clear there is a large out-commute of workers from the County to employment centers in
Southern California.
Agriculture is the largest cluster with 67,479 employees (Figure 1.3). The Health and Wellness cluster
with 23,781 employees and the Energy with 13,963 employees are the second and third large
industries in the Employee Training Resource WIB. Water Technology is the smallest industry with 199
employees. Logistics and manufacturing clusters have 5,822 and 4,471 employees, respectively.
Energy and Health Care clusters have shown the highest growth rate over the past ten years.
Agriculture also shows a positive growth rate through 2010. Logistics, Manufacturing, and Water
Technology, on the other hand declined within the last decade. Agriculture is not only the largest
industry but also the highest concentrated job sector, while Health and Wellness and Manufacturing
are the least concentrated job sectors (see Appendix A for industry cluster definitions by NAICS code).
Source: IMPLAN CEW
FIGURE 1.3: EMPLOYER TRAINING RESOURCE REGION CLUSTERS (2001 – 2010)
A p p l i e d D e v e l o p m e n t E c o n o m i c s | P a g e 5
22.. KKEEYY DDEEMMOOGGRRAAPPHHIICC GGRROOUUPPSS
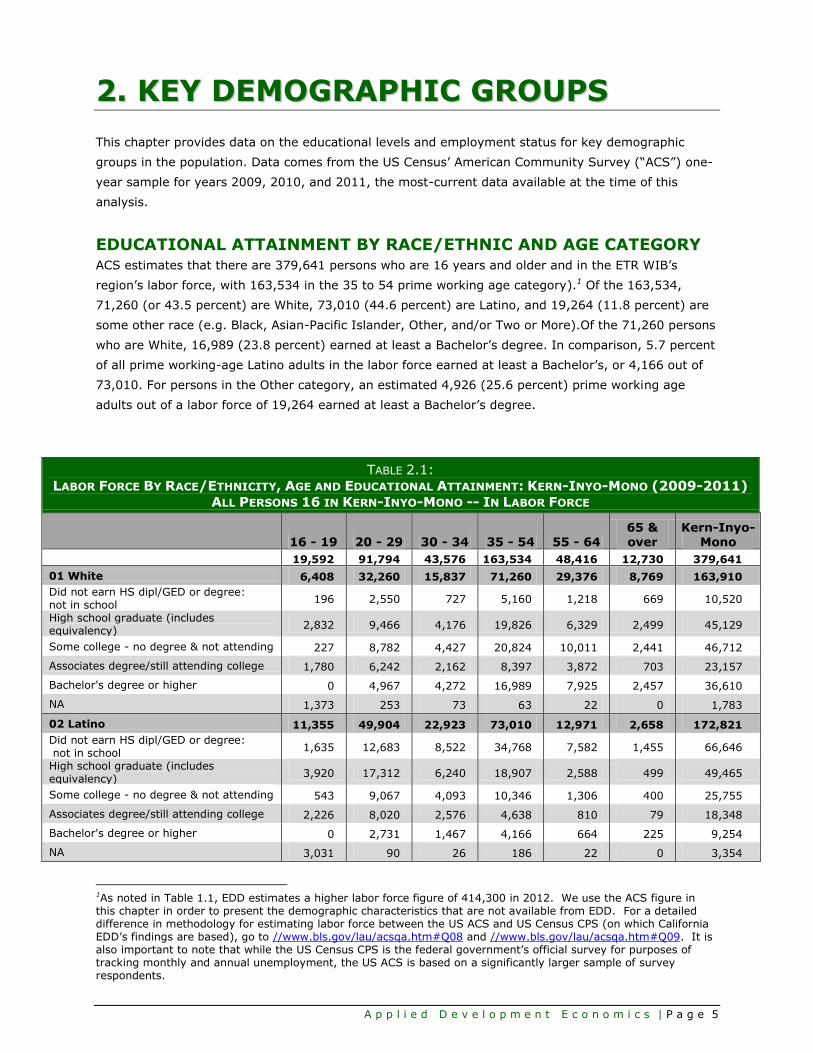
This chapter provides data on the educational levels and employment status for key demographic
groups in the population. Data comes from the US Census’ American Community Survey (“ACS”) one-
year sample for years 2009, 2010, and 2011, the most-current data available at the time of this
analysis.
EDUCATIONAL ATTAINMENT BY RACE/ETHNIC AND AGE CATEGORY ACS estimates that there are 379,641 persons who are 16 years and older and in the ETR WIB’s
region’s labor force, with 163,534 in the 35 to 54 prime working age category).1 Of the 163,534,
71,260 (or 43.5 percent) are White, 73,010 (44.6 percent) are Latino, and 19,264 (11.8 percent) are
some other race (e.g. Black, Asian-Pacific Islander, Other, and/or Two or More).Of the 71,260 persons
who are White, 16,989 (23.8 percent) earned at least a Bachelor’s degree. In comparison, 5.7 percent
of all prime working-age Latino adults in the labor force earned at least a Bachelor’s, or 4,166 out of
73,010. For persons in the Other category, an estimated 4,926 (25.6 percent) prime working age
adults out of a labor force of 19,264 earned at least a Bachelor’s degree.
TABLE 2.1:
LABOR FORCE BY RACE/ETHNICITY, AGE AND EDUCATIONAL ATTAINMENT: KERN-INYO-MONO (2009-2011)
ALL PERSONS 16 IN KERN-INYO-MONO -- IN LABOR FORCE
16 - 19 20 - 29 30 - 34 35 - 54 55 - 64
65 & over
Kern-Inyo-Mono
19,592 91,794 43,576 163,534 48,416 12,730 379,641
01 White 6,408 32,260 15,837 71,260 29,376 8,769 163,910
Did not earn HS dipl/GED or degree: not in school
196 2,550 727 5,160 1,218 669 10,520
High school graduate (includes equivalency)
2,832 9,466 4,176 19,826 6,329 2,499 45,129
Some college - no degree & not attending 227 8,782 4,427 20,824 10,011 2,441 46,712
Associates degree/still attending college 1,780 6,242 2,162 8,397 3,872 703 23,157
Bachelor's degree or higher 0 4,967 4,272 16,989 7,925 2,457 36,610
NA 1,373 253 73 63 22 0 1,783
02 Latino 11,355 49,904 22,923 73,010 12,971 2,658 172,821
Did not earn HS dipl/GED or degree: not in school
1,635 12,683 8,522 34,768 7,582 1,455 66,646
High school graduate (includes equivalency)
3,920 17,312 6,240 18,907 2,588 499 49,465
Some college - no degree & not attending 543 9,067 4,093 10,346 1,306 400 25,755
Associates degree/still attending college 2,226 8,020 2,576 4,638 810 79 18,348
Bachelor's degree or higher 0 2,731 1,467 4,166 664 225 9,254
NA 3,031 90 26 186 22 0 3,354
1As noted in Table 1.1, EDD estimates a higher labor force figure of 414,300 in 2012. We use the ACS figure in this chapter in order to present the demographic characteristics that are not available from EDD. For a detailed difference in methodology for estimating labor force between the US ACS and US Census CPS (on which California EDD’s findings are based), go to //www.bls.gov/lau/acsqa.htm#Q08 and //www.bls.gov/lau/acsqa.htm#Q09. It is also important to note that while the US Census CPS is the federal government’s official survey for purposes of tracking monthly and annual unemployment, the US ACS is based on a significantly larger sample of survey respondents.
A p p l i e d D e v e l o p m e n t E c o n o m i c s | P a g e 6
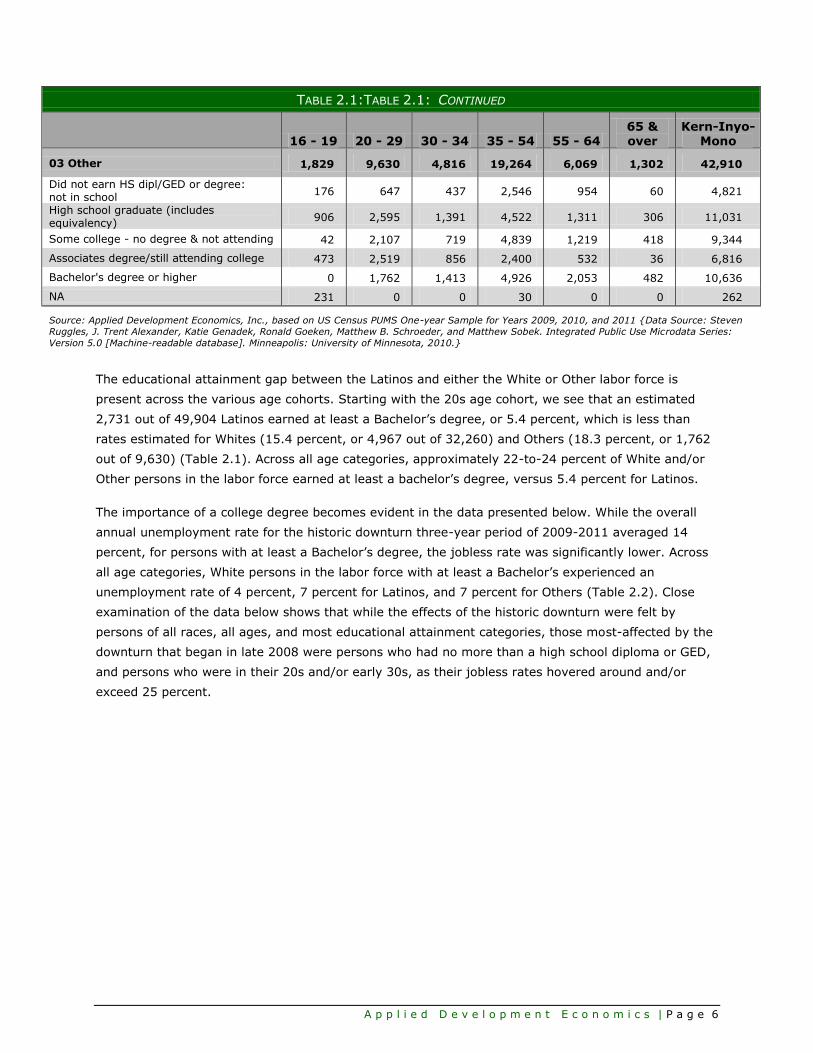
TABLE 2.1:TABLE 2.1: CONTINUED
16 - 19 20 - 29 30 - 34 35 - 54 55 - 64
65 & over
Kern-Inyo-Mono
03 Other 1,829 9,630 4,816 19,264 6,069 1,302 42,910
Did not earn HS dipl/GED or degree: not in school
176 647 437 2,546 954 60 4,821
High school graduate (includes equivalency)
906 2,595 1,391 4,522 1,311 306 11,031
Some college - no degree & not attending 42 2,107 719 4,839 1,219 418 9,344
Associates degree/still attending college 473 2,519 856 2,400 532 36 6,816
Bachelor's degree or higher 0 1,762 1,413 4,926 2,053 482 10,636
NA 231 0 0 30 0 0 262
Source: Applied Development Economics, Inc., based on US Census PUMS One-year Sample for Years 2009, 2010, and 2011 {Data Source: Steven
Ruggles, J. Trent Alexander, Katie Genadek, Ronald Goeken, Matthew B. Schroeder, and Matthew Sobek. Integrated Public Use Microdata Series:
Version 5.0 [Machine-readable database]. Minneapolis: University of Minnesota, 2010.}
The educational attainment gap between the Latinos and either the White or Other labor force is
present across the various age cohorts. Starting with the 20s age cohort, we see that an estimated
2,731 out of 49,904 Latinos earned at least a Bachelor’s degree, or 5.4 percent, which is less than
rates estimated for Whites (15.4 percent, or 4,967 out of 32,260) and Others (18.3 percent, or 1,762
out of 9,630) (Table 2.1). Across all age categories, approximately 22-to-24 percent of White and/or
Other persons in the labor force earned at least a bachelor’s degree, versus 5.4 percent for Latinos.
The importance of a college degree becomes evident in the data presented below. While the overall
annual unemployment rate for the historic downturn three-year period of 2009-2011 averaged 14
percent, for persons with at least a Bachelor’s degree, the jobless rate was significantly lower. Across
all age categories, White persons in the labor force with at least a Bachelor’s experienced an
unemployment rate of 4 percent, 7 percent for Latinos, and 7 percent for Others (Table 2.2). Close
examination of the data below shows that while the effects of the historic downturn were felt by
persons of all races, all ages, and most educational attainment categories, those most-affected by the
downturn that began in late 2008 were persons who had no more than a high school diploma or GED,
and persons who were in their 20s and/or early 30s, as their jobless rates hovered around and/or
exceed 25 percent.

A p p l i e d D e v e l o p m e n t E c o n o m i c s | P a g e 7
TABLE 2.2:
UNEMPLOYMENT RATE BY RACE/ETHNICITY, AGE AND EDUCATIONAL ATTAINMENT:
KERN-INYO-MONO (2009-2011)
ALL PERSONS 16 IN KERN-INYO-MONO -- IN LABOR FORCE
16 - 19 20 - 29 30 - 34 35 - 54 55 - 64
65 &
over
Kern-Inyo-
Mono
34% 17% 14% 12% 10% 7% 14%
01 White 31% 17% 11% 10% 7% 5% 11%
Did not earn HS dipl/GED or degree: not in school
54% 45% 29% 30% 12% 8% 31%
High school graduate (includes equivalency)
27% 24% 16% 13% 8% 3% 15%
Some college - no degree & not attending 0% 13% 13% 9% 8% 6% 10%
Associates degree/still attending college 27% 10% 8% 5% 7% 7% 9%
Bachelor's degree or higher 0% 4% 2% 4% 5% 4% 4%
NA 44% 18% 0% 0% 0% 0% 37%
02 Latino 36% 17% 14% 14% 13% 13% 16%
Did not earn HS dipl/GED or degree: not in school
19% 23% 15% 18% 16% 16% 18%
High school graduate (includes equivalency)
44% 16% 16% 11% 12% 0% 16%
Some college - no degree & not attending 33% 17% 15% 10% 7% 20% 14%
Associates degree/still attending college 18% 14% 10% 9% 7% 0% 12%
Bachelor's degree or higher 0% 5% 4% 10% 0% 16% 7%
NA 46% 0% 100% 0% 0% 0% 43%
03 Other 40% 21% 29% 14% 15% 11% 18% Did not earn HS dipl/GED or degree: not in school
60% 41% 37% 24% 30% 0% 29%
High school graduate (includes equivalency)
46% 37% 46% 15% 21% 9% 27%
Some college - no degree & not attending 0% 11% 16% 17% 9% 13% 14%
Associates degree/still attending college 35% 21% 14% 13% 19% 0% 18%
Bachelor's degree or higher 0% 5% 24% 4% 6% 13% 7%
NA 23% 0% 0% 0% 0% 0% 20%
LABOR FORCE UTILIZATION
Here, we present data illustrating to what extent, if any, the region’s labor force, including those who
are employed, is not being fully utilized. This discussion further underscores the importance of a
college degree. Of the 379,641 persons in the regional labor force in any given year during the 2009-
2011 period, 211,320 were employed full-time and all-year (i.e. 55.7 percent) (Table 2.3). On
average, 69.9 percent of all prime working age persons in the labor force who are White are fully
utilized (49,824 out of 71,260), versus the rate for Latinos, or 57.9 percent (42,258 out of 73,010).
However, for prime-working age Latinos with a Bachelor’s degree, the full utilization rate increases to
72.1 percent (3,002 out of 4,166), thus underscoring the importance of a college degree. Moreover,
relative to Whites, prime working-age Latinos with at least a Bachelor’s in the Kern region exhibit
lower rates of labor force underutilization; almost 28 percent of all prime working age Latinos are
either unemployed or under-employed, versus approximately 30 percent of prime working age Whites.
A p p l i e d D e v e l o p m e n t E c o n o m i c s | P a g e 8
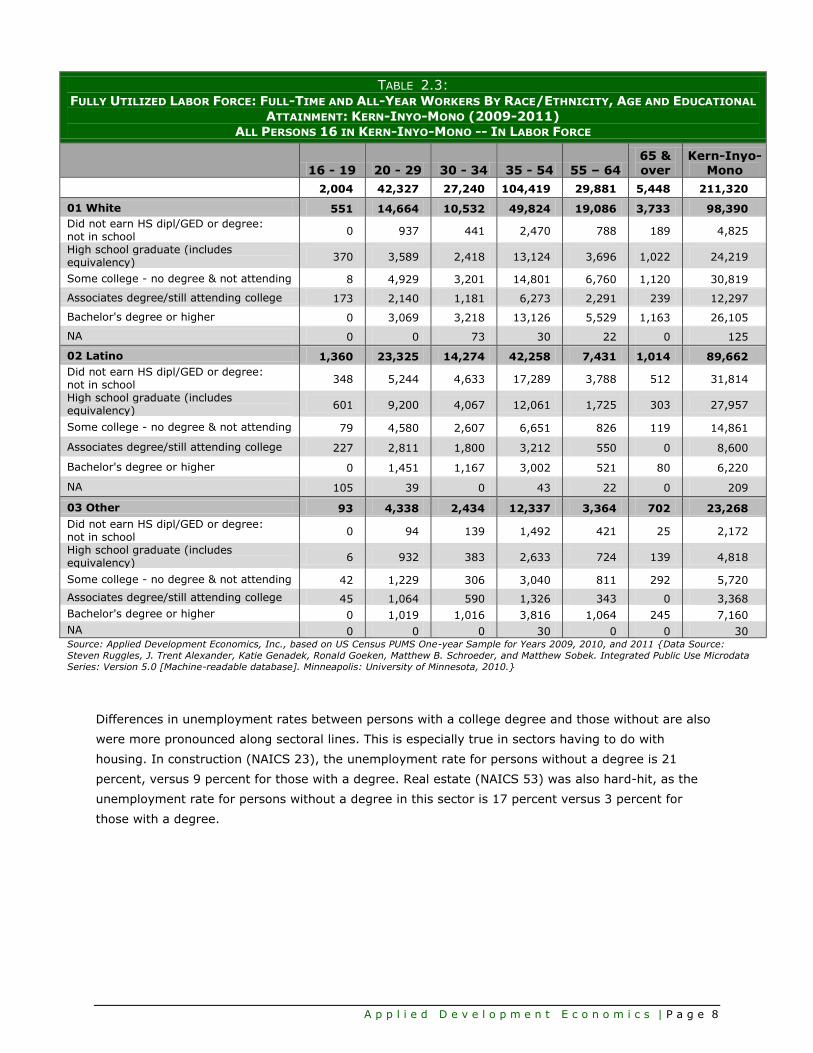
TABLE 2.3: FULLY UTILIZED LABOR FORCE: FULL-TIME AND ALL-YEAR WORKERS BY RACE/ETHNICITY, AGE AND EDUCATIONAL
ATTAINMENT: KERN-INYO-MONO (2009-2011)
ALL PERSONS 16 IN KERN-INYO-MONO -- IN LABOR FORCE
16 - 19 20 - 29 30 - 34 35 - 54 55 – 64
65 & over
Kern-Inyo-Mono
2,004 42,327 27,240 104,419 29,881 5,448 211,320
01 White 551 14,664 10,532 49,824 19,086 3,733 98,390
Did not earn HS dipl/GED or degree: not in school
0 937 441 2,470 788 189 4,825
High school graduate (includes equivalency)
370 3,589 2,418 13,124 3,696 1,022 24,219
Some college - no degree & not attending 8 4,929 3,201 14,801 6,760 1,120 30,819
Associates degree/still attending college 173 2,140 1,181 6,273 2,291 239 12,297
Bachelor's degree or higher 0 3,069 3,218 13,126 5,529 1,163 26,105
NA 0 0 73 30 22 0 125
02 Latino 1,360 23,325 14,274 42,258 7,431 1,014 89,662
Did not earn HS dipl/GED or degree: not in school
348 5,244 4,633 17,289 3,788 512 31,814
High school graduate (includes equivalency)
601 9,200 4,067 12,061 1,725 303 27,957
Some college - no degree & not attending 79 4,580 2,607 6,651 826 119 14,861
Associates degree/still attending college 227 2,811 1,800 3,212 550 0 8,600
Bachelor's degree or higher 0 1,451 1,167 3,002 521 80 6,220
NA 105 39 0 43 22 0 209
03 Other 93 4,338 2,434 12,337 3,364 702 23,268
Did not earn HS dipl/GED or degree: not in school
0 94 139 1,492 421 25 2,172
High school graduate (includes equivalency)
6 932 383 2,633 724 139 4,818
Some college - no degree & not attending 42 1,229 306 3,040 811 292 5,720
Associates degree/still attending college 45 1,064 590 1,326 343 0 3,368
Bachelor's degree or higher 0 1,019 1,016 3,816 1,064 245 7,160
NA 0 0 0 30 0 0 30 Source: Applied Development Economics, Inc., based on US Census PUMS One-year Sample for Years 2009, 2010, and 2011 {Data Source:
Steven Ruggles, J. Trent Alexander, Katie Genadek, Ronald Goeken, Matthew B. Schroeder, and Matthew Sobek. Integrated Public Use Microdata
Series: Version 5.0 [Machine-readable database]. Minneapolis: University of Minnesota, 2010.}
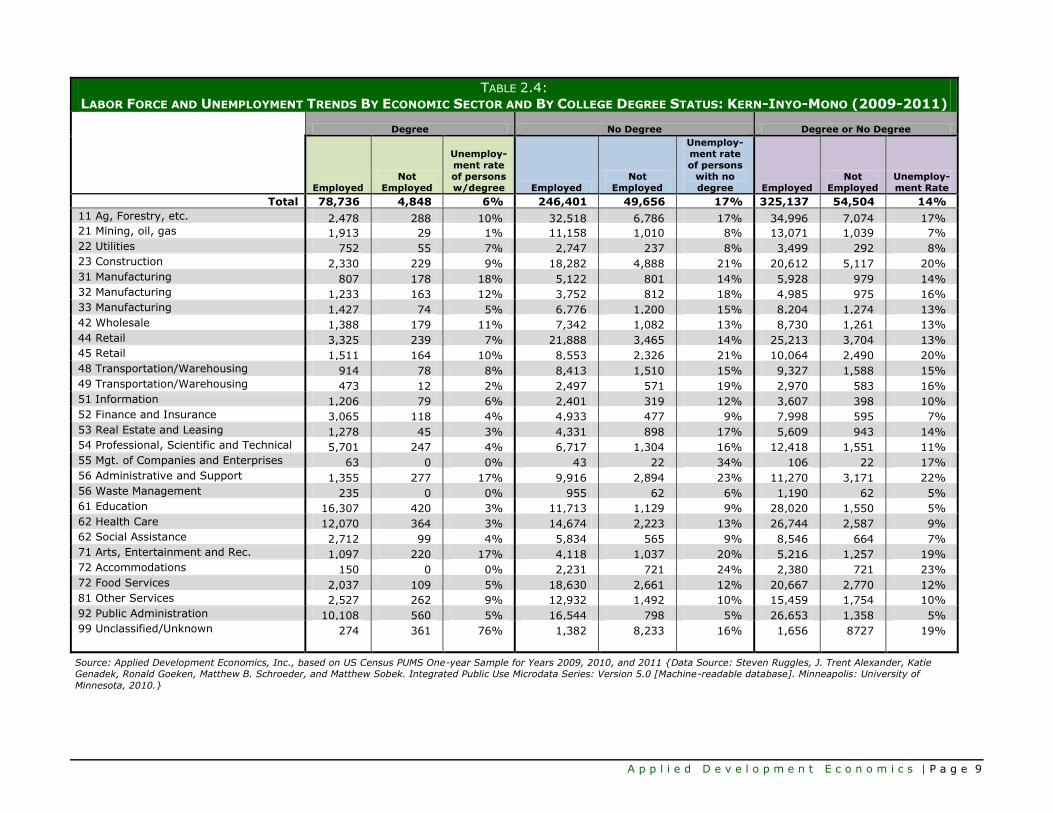
Differences in unemployment rates between persons with a college degree and those without are also
were more pronounced along sectoral lines. This is especially true in sectors having to do with
housing. In construction (NAICS 23), the unemployment rate for persons without a degree is 21
percent, versus 9 percent for those with a degree. Real estate (NAICS 53) was also hard-hit, as the
unemployment rate for persons without a degree in this sector is 17 percent versus 3 percent for
those with a degree.
A p p l i e d D e v e l o p m e n t E c o n o m i c s | P a g e 9
TABLE 2.4:
LABOR FORCE AND UNEMPLOYMENT TRENDS BY ECONOMIC SECTOR AND BY COLLEGE DEGREE STATUS: KERN-INYO-MONO (2009-2011)
Degree No Degree Degree or No Degree
Employed
Not
Employed
Unemploy-
ment rate
of persons
w/degree Employed
Not
Employed
Unemploy-
ment rate
of persons
with no
degree Employed
Not
Employed
Unemploy-
ment Rate
Total 78,736 4,848 6% 246,401 49,656 17% 325,137 54,504 14%
11 Ag, Forestry, etc. 2,478 288 10% 32,518 6,786 17% 34,996 7,074 17% 21 Mining, oil, gas 1,913 29 1% 11,158 1,010 8% 13,071 1,039 7%
22 Utilities 752 55 7% 2,747 237 8% 3,499 292 8%
23 Construction 2,330 229 9% 18,282 4,888 21% 20,612 5,117 20%
31 Manufacturing 807 178 18% 5,122 801 14% 5,928 979 14%
32 Manufacturing 1,233 163 12% 3,752 812 18% 4,985 975 16%
33 Manufacturing 1,427 74 5% 6,776 1,200 15% 8,204 1,274 13%
42 Wholesale 1,388 179 11% 7,342 1,082 13% 8,730 1,261 13%
44 Retail 3,325 239 7% 21,888 3,465 14% 25,213 3,704 13%
45 Retail 1,511 164 10% 8,553 2,326 21% 10,064 2,490 20%
48 Transportation/Warehousing 914 78 8% 8,413 1,510 15% 9,327 1,588 15%
49 Transportation/Warehousing 473 12 2% 2,497 571 19% 2,970 583 16%
51 Information 1,206 79 6% 2,401 319 12% 3,607 398 10%
52 Finance and Insurance 3,065 118 4% 4,933 477 9% 7,998 595 7%
53 Real Estate and Leasing 1,278 45 3% 4,331 898 17% 5,609 943 14%
54 Professional, Scientific and Technical 5,701 247 4% 6,717 1,304 16% 12,418 1,551 11%
55 Mgt. of Companies and Enterprises 63 0 0% 43 22 34% 106 22 17%
56 Administrative and Support 1,355 277 17% 9,916 2,894 23% 11,270 3,171 22%
56 Waste Management 235 0 0% 955 62 6% 1,190 62 5%
61 Education 16,307 420 3% 11,713 1,129 9% 28,020 1,550 5%
62 Health Care 12,070 364 3% 14,674 2,223 13% 26,744 2,587 9%
62 Social Assistance 2,712 99 4% 5,834 565 9% 8,546 664 7%
71 Arts, Entertainment and Rec. 1,097 220 17% 4,118 1,037 20% 5,216 1,257 19%
72 Accommodations 150 0 0% 2,231 721 24% 2,380 721 23%
72 Food Services 2,037 109 5% 18,630 2,661 12% 20,667 2,770 12%
81 Other Services 2,527 262 9% 12,932 1,492 10% 15,459 1,754 10%
92 Public Administration 10,108 560 5% 16,544 798 5% 26,653 1,358 5%
99 Unclassified/Unknown 274 361 76% 1,382 8,233 16% 1,656 8727 19%
Source: Applied Development Economics, Inc., based on US Census PUMS One-year Sample for Years 2009, 2010, and 2011 {Data Source: Steven Ruggles, J. Trent Alexander, Katie
Genadek, Ronald Goeken, Matthew B. Schroeder, and Matthew Sobek. Integrated Public Use Microdata Series: Version 5.0 [Machine-readable database]. Minneapolis: University of
Minnesota, 2010.}

A p p l i e d D e v e l o p m e n t E c o n o m i c s | P a g e 10
VETERANS
Based on the most recent ACS data, there are about 25,754 veterans in the labor force in the Kern-Inyo-Mono region, representing about 6.8 percent
of the labor force. It is estimated that 10.0 percent of veterans were unemployed in 2011, compared to 14.5 percent for the non-veterans labor force
(Table 2.5). Among the unemployed veterans, the largest group is in the 35-54 age group with no high school diploma (46.3 percent unemployed).
TABLE 2.5:
UNEMPLOYED PERSONS AND UNEMPLOYMENT RATES OF ALL PERSONS 16 AND OVER BY VETERAN STATUS AND EDUCATIONAL ATTAINMENT IN
KERN-INYO-MONO
PERSONS IN THE LABOR FORCE AND NOT EMPLOYED (US CENSUS ACS 3-YEAR 2009-2011)
16 - 19 20 – 29 30 – 34 35 - 54 55 - 64
65 &
over
Kern-Inyo-
Mono
Total Number of Unemployed Persons 6,756 15,980 6,297 19,889 4,677 904 54,504
Unemployment Rates 34.5% 17.4% 14.5% 12.2% 9.7% 7.1% 14.4%
01 Not a Veteran
Number of Unemployed Persons Who Are Not Veterans 5,806 15,502 6,014 18,794 3,999 860 50,976
Unemployment Rates for Persons Who Are Not Veterans 32.3% 17.4% 14.5% 12.3% 9.7% 9.1% 14.5%
Did not earn HS dipl/GED or degree: not in school 24.6% 27.2% 16.9% 19.3% 17.6% 16.1% 20.4%
High school graduate (includes equivalency) 39.3% 19.7% 19.3% 12.6% 10.2% 4.3% 17.0%
Some college -- no degree and not attending 22.1% 15.2% 14.2% 11.0% 7.1% 12.8% 12.1%
Associates degree/still attending college 23.3% 13.8% 9.3% 6.3% 7.3% 7.4% 11.3%
Bachelor's degree or higher --- 4.7% 7.1% 5.1% 5.0% 5.3% 5.3%
NA 36.0% 13.4% 26.1% 0.0% 0.0% --- 30.7%
02 Veterans
Number of Unemployed Persons Who Are Veterans 0 478 283 1,096 679 49 2,584
Unemployment Rates for Persons Who Are Veterans --- 18.6% 14.0% 10.4% 9.3% 1.5% 10.0%
Did not earn HS dipl/GED or degree: not in school --- 0.0% 0.0% 46.3% 8.2% 0.0% 20.6%
High school graduate (includes equivalency) --- 41.8% 21.3% 14.2% 13.6% 0.0% 16.9%
Some college -- no degree and not attending --- 10.4% 8.9% 4.1% 7.8% 0.1% 5.6%
Associates degree/still attending college --- 6.2% 16.5% 14.9% 11.5% 0.0% 12.4%
Bachelor's degree or higher --- 0.0% -0.3% 4.2% 6.5% 4.6% 4.6%
NA --- --- --- --- --- --- ---
Source: Applied Development Economics, Inc., based on US Census PUMS One-year Sample for Years 2009, 2010, and 2011 {Data Source: Steven Ruggles, J. Trent Alexander, Katie Genadek,
Ronald Goeken, Matthew B. Schroeder, and Matthew Sobek. Integrated Public Use Microdata Series: Version 5.0 [Machine-readable database]. Minneapolis: University of Minnesota, 2010.}
A p p l i e d D e v e l o p m e n t E c o n o m i c s | P a g e 11
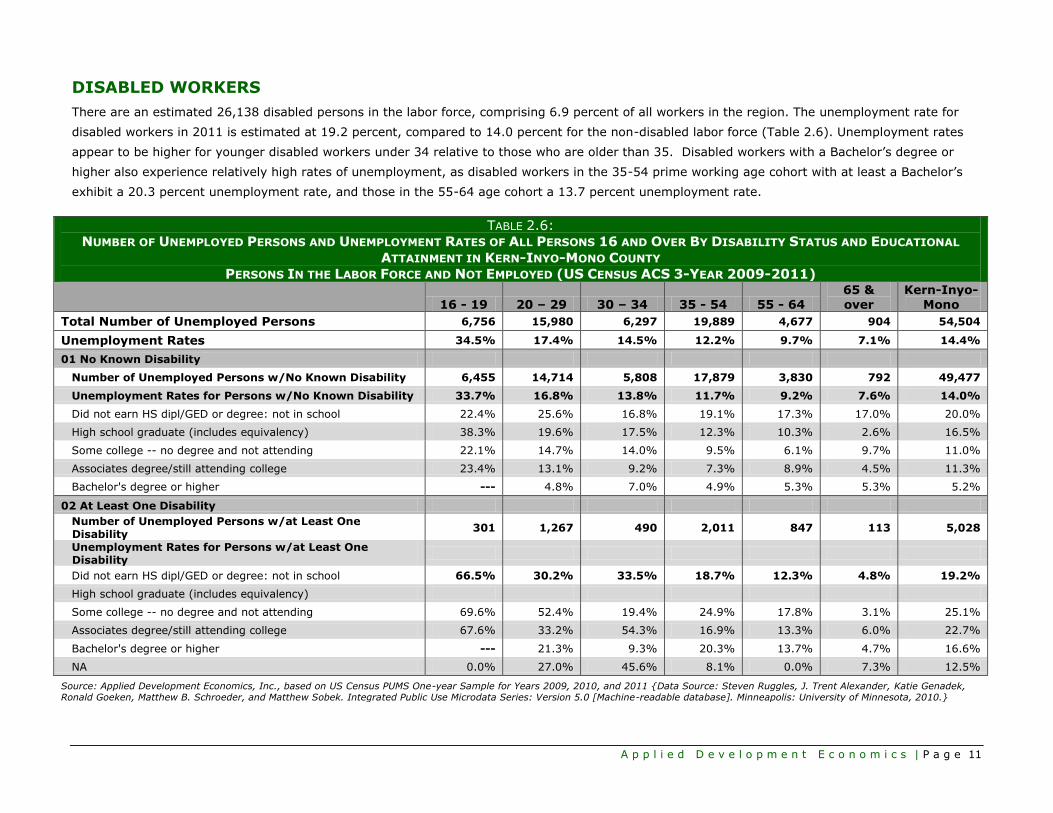
DISABLED WORKERS
There are an estimated 26,138 disabled persons in the labor force, comprising 6.9 percent of all workers in the region. The unemployment rate for
disabled workers in 2011 is estimated at 19.2 percent, compared to 14.0 percent for the non-disabled labor force (Table 2.6). Unemployment rates
appear to be higher for younger disabled workers under 34 relative to those who are older than 35. Disabled workers with a Bachelor’s degree or
higher also experience relatively high rates of unemployment, as disabled workers in the 35-54 prime working age cohort with at least a Bachelor’s
exhibit a 20.3 percent unemployment rate, and those in the 55-64 age cohort a 13.7 percent unemployment rate.
TABLE 2.6:
NUMBER OF UNEMPLOYED PERSONS AND UNEMPLOYMENT RATES OF ALL PERSONS 16 AND OVER BY DISABILITY STATUS AND EDUCATIONAL
ATTAINMENT IN KERN-INYO-MONO COUNTY
PERSONS IN THE LABOR FORCE AND NOT EMPLOYED (US CENSUS ACS 3-YEAR 2009-2011)
16 - 19 20 – 29 30 – 34 35 - 54 55 - 64
65 &
over
Kern-Inyo-
Mono
Total Number of Unemployed Persons 6,756 15,980 6,297 19,889 4,677 904 54,504
Unemployment Rates 34.5% 17.4% 14.5% 12.2% 9.7% 7.1% 14.4%
01 No Known Disability
Number of Unemployed Persons w/No Known Disability 6,455 14,714 5,808 17,879 3,830 792 49,477
Unemployment Rates for Persons w/No Known Disability 33.7% 16.8% 13.8% 11.7% 9.2% 7.6% 14.0%
Did not earn HS dipl/GED or degree: not in school 22.4% 25.6% 16.8% 19.1% 17.3% 17.0% 20.0%
High school graduate (includes equivalency) 38.3% 19.6% 17.5% 12.3% 10.3% 2.6% 16.5%
Some college -- no degree and not attending 22.1% 14.7% 14.0% 9.5% 6.1% 9.7% 11.0%
Associates degree/still attending college 23.4% 13.1% 9.2% 7.3% 8.9% 4.5% 11.3%
Bachelor's degree or higher --- 4.8% 7.0% 4.9% 5.3% 5.3% 5.2%
02 At Least One Disability
Number of Unemployed Persons w/at Least One Disability
301 1,267 490 2,011 847 113 5,028
Unemployment Rates for Persons w/at Least One Disability
Did not earn HS dipl/GED or degree: not in school 66.5% 30.2% 33.5% 18.7% 12.3% 4.8% 19.2%
High school graduate (includes equivalency)
Some college -- no degree and not attending 69.6% 52.4% 19.4% 24.9% 17.8% 3.1% 25.1%
Associates degree/still attending college 67.6% 33.2% 54.3% 16.9% 13.3% 6.0% 22.7%
Bachelor's degree or higher --- 21.3% 9.3% 20.3% 13.7% 4.7% 16.6%
NA 0.0% 27.0% 45.6% 8.1% 0.0% 7.3% 12.5%
Source: Applied Development Economics, Inc., based on US Census PUMS One-year Sample for Years 2009, 2010, and 2011 {Data Source: Steven Ruggles, J. Trent Alexander, Katie Genadek, Ronald Goeken, Matthew B. Schroeder, and Matthew Sobek. Integrated Public Use Microdata Series: Version 5.0 [Machine-readable database]. Minneapolis: University of Minnesota, 2010.}

A p p l i e d D e v e l o p m e n t E c o n o m i c s | P a g e 12
33.. EEMMPPLLOOYYMMEENNTT AANNDD OOCCCCUUPPAATTIIOONN
PPRROOJJEECCTTIIOONNSS
This section of the report provides the employment projections by cluster for the 2012 to 2017 period, as
well as the related occupational demand by employers. The employment and occupational projections
have been prepared by EMSI. The industry cluster definitions follow the Regional San Joaquin Valley
analysis completed in 2012 (see Appendix B).2
Agriculture
Energy
Health and Wellness
Logistics
Manufacturing
Water Technology
The value of industry clusters is that they generally represent the economic base of the region, in which
products and services are exported out of the county and draw income into the county. In this way, they
create worker incomes that then support local serving industries such as retail and services businesses,
which may also see employment growth. In the case of health and wellness, this cluster is not an export
sector, but it is a growing industry with many high paid jobs and warrants attention on that basis.
EMPLOYMENT PROJECTIONS
The Employer Training Resource WIB had a job total of 282,645 in 2010 (Table 3.1). The total number of
jobs is estimated to have increased by 26,021 between 2010 and 2012 and EMSI projects an additional
35,144 new jobs during the 2012 to 2017 projection period, with the total employment count reaching
343,810 by 2017 (Table 3.1). While Table 3.1 shows employment levels by major NAICS category, the
remaining tables in this section show employment by cluster, which combines industries based on their
market relationships.
Agriculture and Health and Wellness are the two clusters in ETR WIB with a considerable
projected employment growth between 2012 and 2017.
The Agriculture cluster had 77,251 employees by 2012 and EMSI forecasts an additional
8,886 workers by the end of the projection period in 2017 (Tables 3.2, 3.3, 3.4, 3.5).
Combined with Social Assistance, Health Care Delivery is projected to add about 5,000 jobs
by 2017 (Table 3.1). However, within the Health and Wellness cluster itself, there were
23,000 employees in total by 2012 and EMSI foresees an additional 4,382 workers by the end
of the projection period in 2017 (Table 3.7).
2 Applied Development Economics. San Joaquin Valley Regional Industry Cluster Analysis and Action Plan. CSU Fresno Office of Community and Economic Development. September 2012.
A p p l i e d D e v e l o p m e n t E c o n o m i c s | P a g e 13
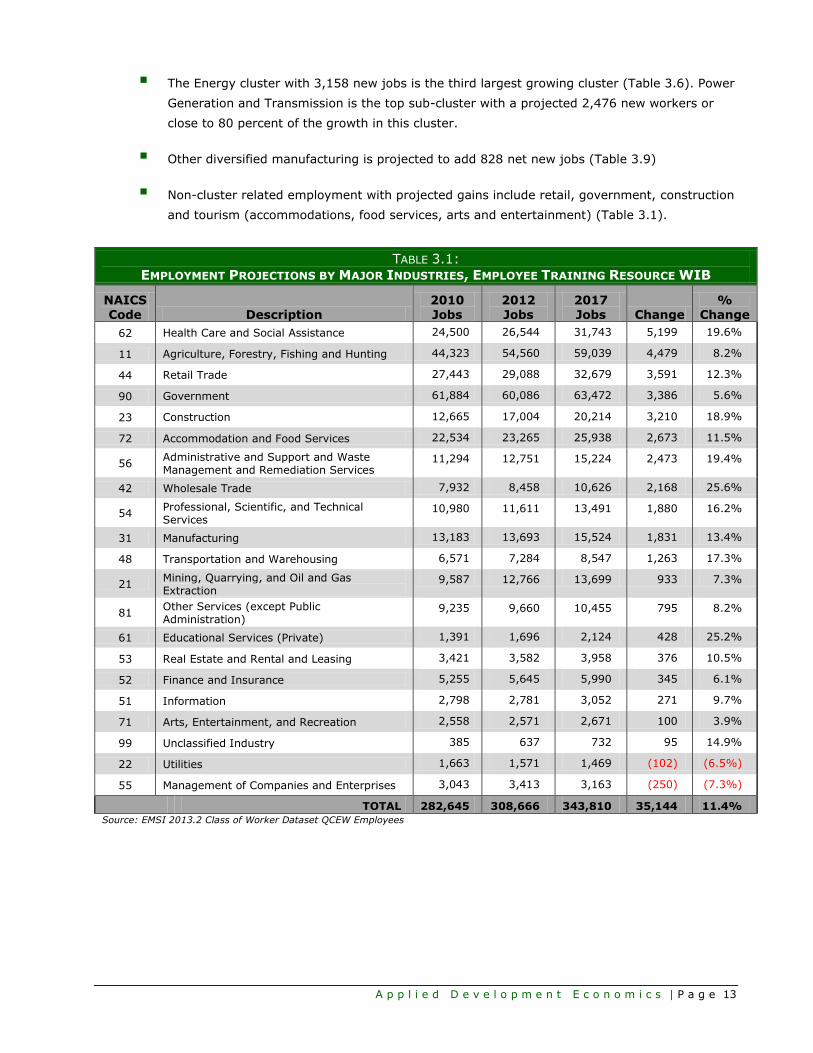
The Energy cluster with 3,158 new jobs is the third largest growing cluster (Table 3.6). Power
Generation and Transmission is the top sub-cluster with a projected 2,476 new workers or
close to 80 percent of the growth in this cluster.
Other diversified manufacturing is projected to add 828 net new jobs (Table 3.9)
Non-cluster related employment with projected gains include retail, government, construction
and tourism (accommodations, food services, arts and entertainment) (Table 3.1).
TABLE 3.1:
EMPLOYMENT PROJECTIONS BY MAJOR INDUSTRIES, EMPLOYEE TRAINING RESOURCE WIB
NAICS Code Description
2010 Jobs
2012 Jobs
2017 Jobs Change
% Change
62 Health Care and Social Assistance 24,500 26,544 31,743 5,199 19.6%
11 Agriculture, Forestry, Fishing and Hunting 44,323 54,560 59,039 4,479 8.2%
44 Retail Trade 27,443 29,088 32,679 3,591 12.3%
90 Government 61,884 60,086 63,472 3,386 5.6%
23 Construction 12,665 17,004 20,214 3,210 18.9%
72 Accommodation and Food Services 22,534 23,265 25,938 2,673 11.5%
56 Administrative and Support and Waste Management and Remediation Services
11,294 12,751 15,224 2,473 19.4%
42 Wholesale Trade 7,932 8,458 10,626 2,168 25.6%
54 Professional, Scientific, and Technical Services
10,980 11,611 13,491 1,880 16.2%
31 Manufacturing 13,183 13,693 15,524 1,831 13.4%
48 Transportation and Warehousing 6,571 7,284 8,547 1,263 17.3%
21 Mining, Quarrying, and Oil and Gas Extraction
9,587 12,766 13,699 933 7.3%
81 Other Services (except Public Administration)
9,235 9,660 10,455 795 8.2%
61 Educational Services (Private) 1,391 1,696 2,124 428 25.2%
53 Real Estate and Rental and Leasing 3,421 3,582 3,958 376 10.5%
52 Finance and Insurance 5,255 5,645 5,990 345 6.1%
51 Information 2,798 2,781 3,052 271 9.7%
71 Arts, Entertainment, and Recreation 2,558 2,571 2,671 100 3.9%
99 Unclassified Industry 385 637 732 95 14.9%
22 Utilities 1,663 1,571 1,469 (102) (6.5%)
55 Management of Companies and Enterprises 3,043 3,413 3,163 (250) (7.3%)
TOTAL 282,645 308,666 343,810 35,144 11.4%
Source: EMSI 2013.2 Class of Worker Dataset QCEW Employees

A p p l i e d D e v e l o p m e n t E c o n o m i c s | P a g e 14
AGRICULTURE CLUSTER
Agriculture oriented jobs include activities such as farm production, food processing, distribution, and
support services. We have grouped the agriculture related industries into these four categories, or sub-
clusters, based on the significant role they play in the agriculture economy.
Food and farm product-related wholesale trade activities, transportation services, and warehousing jobs
are grouped as Distribution. Retail related jobs in grocery and supermarkets establishments are also part
of the Distribution group. The Distribution sub-cluster will add net 1,137 new positions by 2017 with a 14
percent growth rate. In this group, EMSI reports that supermarkets and other grocery (except
convenience) stores (NAICS 445110) are expected to increase employment by 667 jobs. Fresh fruit and
vegetable merchant wholesalers (NAICS 424480) will have a positive change of 210 new jobs in their
employment trends (Table 3.2).
TABLE 3.2:
JOB PROJECTIONS BY CLUSTER – DISTRIBUTION
NAICS Code Description
2010 Jobs
2012 Jobs
2017 Jobs Change
% Change
445110 Supermarkets and Other Grocery (except Convenience) Stores
5,165 5,403 6,070 667 12%
424480 Fresh Fruit and Vegetable Merchant Wholesalers
1,047 505 715 210 42%
493120 Refrigerated Warehousing and Storage 191 206 325 119 58%
424910 Farm Supplies Merchant Wholesalers 397 424 521 97 23%
445120 Convenience Stores 341 423 494 71 17%
424490 Other Grocery and Related Products Merchant Wholesalers
391 401 468 67 17%
424810 Beer and Ale Merchant Wholesalers 304 307 392 85 27%
424450 Confectionery Merchant Wholesalers 77 71 90 19 27%
424430 Dairy Product (except Dried or Canned) Merchant Wholesalers
61 62 77 15 24%
445120 Convenience Stores <10 14 27 13 93%
445310 Beer, Wine, and Liquor Stores 174 185 169 (16) (9%)
445299 All Other Specialty Food Stores 61 63 15 (48) (76%)
TOTAL 8,209 8,064 9,363 1,137 14%
Source: EMSI 2013.2 Class of Worker Dataset QCEW Employees
In the Processing group we have included activities related to manufacturing, packaging, and food and
beverage processing, all of which are classified as manufacturing (NAICS 31). In the Employer Training
Resource, WIB the nuts and perishable product foods manufacturing sector (NAICS 3119) and dairy
product manufacturing (NAICS 3115) include the highest employment counts, with a total of 1,053 new
jobs in 2017. Establishments that perform frozen fruit, juice, and vegetable manufacturing will lose the
most employees, at 170 between 2012 and 2017 (Table 3.3).

A p p l i e d D e v e l o p m e n t E c o n o m i c s | P a g e 15
TABLE 3.3:
JOB PROJECTIONS BY CLUSTER – PROCESSING
NAICS Code Description
2010 Jobs
2012 Jobs
2017 Jobs Change
% Change
311911 Roasted Nuts and Peanut Butter Manufacturing
1,283 1,383 1,718 335 24%
311991 Perishable Prepared Food Manufacturing 1,822 1,824 2,086 262 14%
311520 Ice Cream and Frozen Dessert Manufacturing 921 941 1,187 246 26%
311919 Other Snack Food Manufacturing 595 758 968 210 28%
312111 Soft Drink Manufacturing 98 120 164 44 37%
311412 Frozen Specialty Food Manufacturing 18 40 78 38 95%
311511 Fluid Milk Manufacturing 50 50 82 32 64%
311514 Dry, Condensed, and Evaporated Dairy Product Manufacturing
<10 30 56 26 87%
312120 Breweries 42 44 68 24 55%
311812 Commercial Bakeries 149 81 102 21 26%
311612 Meat Processed from Carcasses 84 91 96 5 5%
312111 Soft Drink Manufacturing 48 44 45 1 2%
311811 Retail Bakeries 42 49 39 (10) (20%)
312130 Wineries 67 53 30 (23) (43%)
312112 Bottled Water Manufacturing 79 54 29 (25) (46%)
311411 Frozen Fruit, Juice, and Vegetable Manufacturing
267 321 151 (170) (53%)
TOTAL 5,565 5,883 6,899 1,016 17%
Source: EMSI 2013.2 Class of Worker Dataset QCEW Employees
The Production group includes animal and crop production. Compared to the Processing group, the
Production group is expected to produce a much higher net growth of 4,221 jobs. There is a projected
increase of 3,471 jobs in farm labor contractors and crew leaders (NAICS 115115) by 2017 (Table 3.4).
TABLE 3.4:
JOB PROJECTIONS BY CLUSTER – PRODUCTION
NAICS Code Description
2010 Jobs
2012 Jobs
2017 Jobs Change
% Change
115115 Farm Labor Contractors and Crew Leaders 22,500 28,957 32,428 3,471 12.0%
111 Crop Production 15,367 17,906 18,729 823 4.6%
112 Animal Production 1,801 1,895 2,127 232 12.2%
113210 Forest Nurseries and Gathering of Forest Products
103 83 107 24 29.0%
115114 Postharvest Crop Activities (except Cotton Ginning)
2,566 2,540 2,511 (29) (1.0%)
115111 Cotton Ginning 95 97 30 (67) (69.0%)
115116 Farm Management Services 791 945 850 (95) (10.0%)
115113 Crop Harvesting, Primarily by Machine 281 235 97 (138) (59.0%)
TOTAL 43,504 52,658 56,879 4,221 8.0%
Source: EMSI 2013.2 Class of Worker Dataset QCEW Employees
The final group of industries under the Agriculture cluster includes all establishments that support
agriculture related activities. A diverse set of services from water utilities, construction, business support
services, professional services, fertilizer and chemicals, and repair services are all included under the
support services group. Altogether, EMSI projects a 2,512 net job increase between 2012 and 2017.

A p p l i e d D e v e l o p m e n t E c o n o m i c s | P a g e 16
Temporary help services (NAICS 561320) would gain 1,338 jobs while water line construction and pump
manufacturing (NAICS 237110 and 333911) would be among the declining industries (Table 3.5).
TABLE 3.5:
JOB PROJECTIONS BY CLUSTER – SUPPORT
NAICS Code Description
2010 Jobs
2012 Jobs
2017 Jobs Change
% Change
561320 Temporary Help Services 3,765 4,446 5,784 1,338 30%
423830 Industrial Machinery and Equipment Merchant Wholesalers
1,068 1,189 1,517 328 28%
541380 Testing Laboratories 469 632 854 222 35%
811310
Commercial and Industrial Machinery and Equipment (except Automotive and Electronic) Repair and Maintenance
740 873 1,062 189 22%
423820 Farm and Garden Machinery and Equipment Merchant Wholesalers
381 412 486 74 18%
221310 Water Supply and Irrigation Systems 436 246 312 66 27%
532490 Other Commercial and Industrial Machinery and Equipment Rental and Leasing
94 147 201 54 37%
541940 Veterinary Services 499 510 560 50 10%
333993 Packaging Machinery Manufacturing 23 93 138 45 48%
561730 Landscaping Services 666 704 748 44 6%
423840 Industrial Supplies Merchant Wholesalers 115 118 151 33 28%
326291 Rubber Product Manufacturing for Mechanical Use
93 101 132 31 31%
541890 Other Services Related to Advertising 95 95 124 29 31%
561110 Office Administrative Services 41 42 66 24 57%
562920 Materials Recovery Facilities 148 142 161 19 13%
541370 Surveying and Mapping (except Geophysical) Services
61 103 121 18 17%
561730 Landscaping Services 56 44 62 18 41%
333992 Welding and Soldering Equipment Manufacturing
<10 14 29 15 107%
332420 Metal Tank (Heavy Gauge) Manufacturing 58 72 85 13 18%
541940 Veterinary Services 33 38 5 15%
561710 Exterminating and Pest Control Services 43 47 4 9%
444220 Nursery, Garden Center, and Farm Supply Stores
137 203 184 (19) (9%)
333911 Pump and Pumping Equipment Manufacturing
47 33 10 (23) (70%)
444210 Outdoor Power Equipment Stores 38 38 11 (27) (71%)
237110 Water and Sewer Line and Related Structures Construction
308 304 266 (38) (13%)
TOTAL 9,414 10,646 13,064 2,512 24%
Source: EMSI 2013.2 Class of Worker Dataset QCEW Employees
A p p l i e d D e v e l o p m e n t E c o n o m i c s | P a g e 17
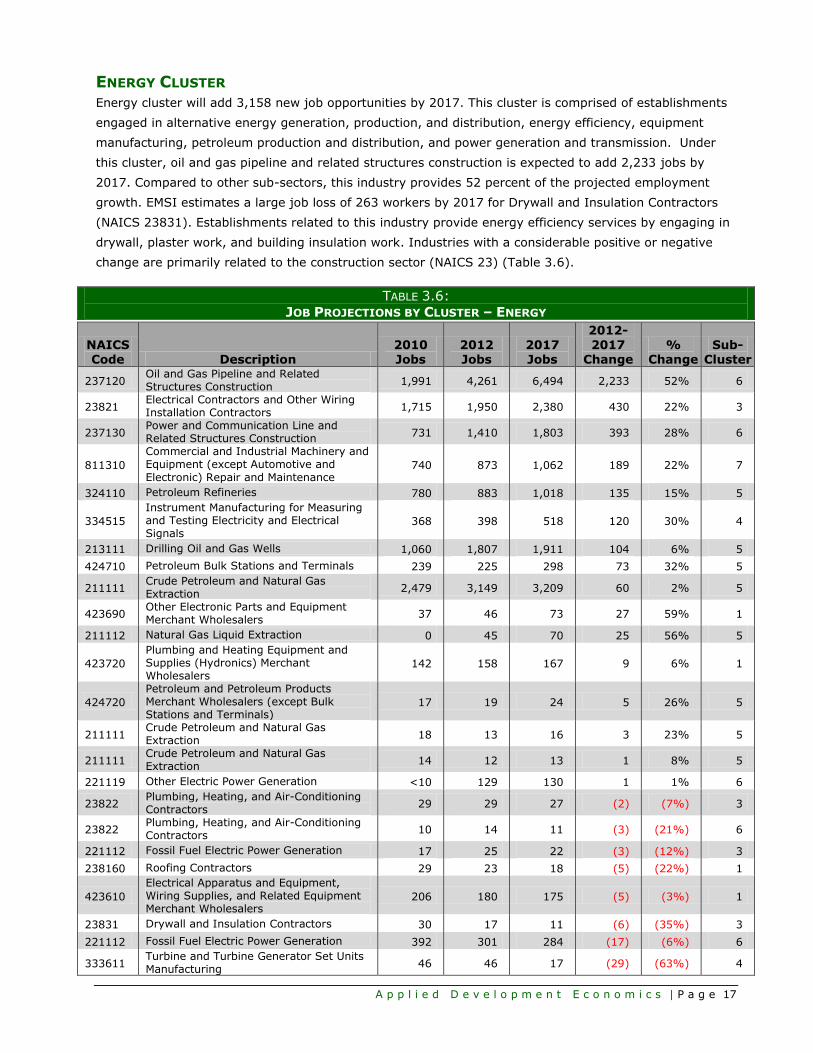
ENERGY CLUSTER
Energy cluster will add 3,158 new job opportunities by 2017. This cluster is comprised of establishments
engaged in alternative energy generation, production, and distribution, energy efficiency, equipment
manufacturing, petroleum production and distribution, and power generation and transmission. Under
this cluster, oil and gas pipeline and related structures construction is expected to add 2,233 jobs by
2017. Compared to other sub-sectors, this industry provides 52 percent of the projected employment
growth. EMSI estimates a large job loss of 263 workers by 2017 for Drywall and Insulation Contractors
(NAICS 23831). Establishments related to this industry provide energy efficiency services by engaging in
drywall, plaster work, and building insulation work. Industries with a considerable positive or negative
change are primarily related to the construction sector (NAICS 23) (Table 3.6).
TABLE 3.6:
JOB PROJECTIONS BY CLUSTER – ENERGY
NAICS Code Description
2010 Jobs
2012 Jobs
2017 Jobs
2012-
2017 Change
% Change
Sub-Cluster
237120 Oil and Gas Pipeline and Related Structures Construction
1,991 4,261 6,494 2,233 52% 6
23821 Electrical Contractors and Other Wiring Installation Contractors
1,715 1,950 2,380 430 22% 3
237130 Power and Communication Line and Related Structures Construction
731 1,410 1,803 393 28% 6
811310
Commercial and Industrial Machinery and Equipment (except Automotive and
Electronic) Repair and Maintenance 740 873 1,062 189 22% 7
324110 Petroleum Refineries 780 883 1,018 135 15% 5
334515
Instrument Manufacturing for Measuring and Testing Electricity and Electrical Signals
368 398 518 120 30% 4
213111 Drilling Oil and Gas Wells 1,060 1,807 1,911 104 6% 5
424710 Petroleum Bulk Stations and Terminals 239 225 298 73 32% 5
211111 Crude Petroleum and Natural Gas Extraction
2,479 3,149 3,209 60 2% 5
423690 Other Electronic Parts and Equipment Merchant Wholesalers
37 46 73 27 59% 1
211112 Natural Gas Liquid Extraction 0 45 70 25 56% 5
423720
Plumbing and Heating Equipment and Supplies (Hydronics) Merchant Wholesalers
142 158 167 9 6% 1
424720
Petroleum and Petroleum Products Merchant Wholesalers (except Bulk Stations and Terminals)
17 19 24 5 26% 5
211111 Crude Petroleum and Natural Gas Extraction
18 13 16 3 23% 5
211111 Crude Petroleum and Natural Gas Extraction
14 12 13 1 8% 5
221119 Other Electric Power Generation <10 129 130 1 1% 6
23822 Plumbing, Heating, and Air-Conditioning Contractors
29 29 27 (2) (7%) 3
23822 Plumbing, Heating, and Air-Conditioning Contractors
10 14 11 (3) (21%) 6
221112 Fossil Fuel Electric Power Generation 17 25 22 (3) (12%) 3
238160 Roofing Contractors 29 23 18 (5) (22%) 1
423610
Electrical Apparatus and Equipment, Wiring Supplies, and Related Equipment Merchant Wholesalers
206 180 175 (5) (3%) 1
23831 Drywall and Insulation Contractors 30 17 11 (6) (35%) 3
221112 Fossil Fuel Electric Power Generation 392 301 284 (17) (6%) 6
333611 Turbine and Turbine Generator Set Units Manufacturing
46 46 17 (29) (63%) 4

A p p l i e d D e v e l o p m e n t E c o n o m i c s | P a g e 18
NAICS Code Description
2010 Jobs
2012 Jobs
2017 Jobs
2012-2017
Change %
Change Sub-
Cluster
237110 Water and Sewer Line and Related Structures Construction
308 304 266 (38) (13%) 4
333132 Oil and Gas Field Machinery and Equipment Manufacturing
354 375 337 (38) (10%) 1
23822 Plumbing, Heating, and Air-Conditioning Contractors
974 944 876 (68) (7%) 3
238160 Roofing Contractors 158 154 75 (79) (51%) 1
221119 Other Electric Power Generation 215 250 156 (94) (38%) 6
23831 Drywall and Insulation Contractors 550 475 212 (263) (55%) 3
TOTAL 13,649 18,515 21,673 3,158 17%
Energy Sub-Clusters
1 - Alternative Energy Generation/Production 5 - Petroleum Production & Petroleum Distribution
2 - Alternative Energy Distribution 6 - Power Generation and Transmission
3 - Energy Efficiency 7 - Research & Services
4 - Equipment Manufacturing
Source: EMSI 2013.2 Class of Worker Dataset QCEW Employees
HEALTH AND WELLNESS CLUSTER
This cluster is projected to have a positive increase in its employment by adding 4,896 additional
employees. Ambulatory and health care services (NAICS 621) and Hospitals (NAICS 622) cover the top
five growing industries under this cluster. Other sectors such as medical device manufacturing,
pharmaceuticals, supplies and services, and wellness and fitness services are also part of this cluster. For
the ETR WIB region, offices of physicians (NAICS 621111) and general medical and surgical hospitals
(NAICS 622110) are anticipated to provide 2,077 employment opportunities (Table 3.7). In addition,
pharmacies and drug stores (NAICS 446110) are expected to add 426 new employees by 2017. In
contrast, surgical appliance and supplies manufacturing (NAICS 339113) is projected to lose 66 jobs. This
industry has demonstrated a declining trend since 2010.
TABLE 3.7:
JOB PROJECTIONS BY CLUSTER – HEALTH AND WELLNESS
NAICS Code Description
2010 Jobs
2012 Jobs
2017 Jobs
2012-2017
Change %
Change Sub-
Cluster
621111 Offices of Physicians (except Mental Health Specialists)
5,377 5,385 6,442 1,057 20% 1
622110 General Medical and Surgical Hospitals (Private)
5,893 6,536 7,556 1,020 16% 1
446110 Pharmacies and Drug Stores 1,560 1,555 1,981 426 27% 5
622310 Specialty (except Psychiatric and Substance Abuse) Hospitals (Private)
570 550 972 422 77% 1
621610 Home Health Care Services 1,021 1,148 1,525 377 33% 1
624310 Vocational Rehabilitation Services 778 881 1,161 280 32% 1
623311 Continuing Care Retirement Communities 537 655 926 271 41% 1
621511 Medical Laboratories 297 561 755 194 35% 1
621210 Offices of Dentists 1,674 1,767 1,953 186 11% 1
621340 Offices of Physical, Occupational and Speech Therapists, and Audiologists
348 402 545 143 36% 1
623220 Residential Mental Health and Substance Abuse Facilities
331 311 425 114 37% 1
339112 Surgical and Medical Instrument Manufacturing
181 204 283 79 39% 2

A p p l i e d D e v e l o p m e n t E c o n o m i c s | P a g e 19
NAICS Code Description
2010 Jobs
2012 Jobs
2017 Jobs
2012-2017
Change %
Change Sub-
Cluster
621493 Freestanding Ambulatory Surgical and Emergency Centers
175 209 286 77 37% 1
621492 Kidney Dialysis Centers 235 282 353 71 25% 1
621330 Offices of Mental Health Practitioners (except Physicians)
139 220 286 66 30% 1
446191 Food (Health) Supplement Stores 74 90 132 42 47% 5
623110 Nursing Care Facilities 106 109 141 32 29% 1
621320 Offices of Optometrists 201 209 239 30 14% 1
623312 Homes for the Elderly 631 725 752 27 0.04% 1
621991 Blood and Organ Banks 72 92 118 26 47% 1
424210 Drugs and Druggists' Sundries Merchant Wholesalers
14 34 58 24 71% 4
621910 Ambulance Services 51 64 84 20 0.31 1
621420 Outpatient Mental Health and Substance Abuse Centers 25 31 50 19 0.61 1
621420 Outpatient Mental Health and Substance Abuse Centers 86 76 92 16 21% 1
623312 Homes for the Elderly 38 36 51 15 0.42 1
446130 Optical Goods Stores 72 81 95 14 17% 5
621498 All Other Outpatient Care Centers 56 78 91 13 17% 1
621910 Ambulance Services 233 239 250 11 5% 1
621610 Home Health Care Services 21 34 44 10 0.29 1
621310 Offices of Chiropractors 148 162 149 (13) (8%) 1
623990 Other Residential Care Facilities 143 191 167 (24) (13%) 1
623110 Nursing Care Facilities 1,310 1,322 1,293 (29) (2%) 1
623210 Residential Mental Retardation Facilities 441 510 478 (32) (6%) 1
621512 Diagnostic Imaging Centers 286 112 78 (34) (30%) 1
339113 Surgical Appliance and Supplies Manufacturing
163 128 62 (66) (52%) 2
TOTAL 23,632 25,130 30,026 4,896 19%
Health and Wellness Cub-Clusters
1 - Health Care Delivery 4 - Supplies and Services
2 - Medical Device Manufacturing 5 - Wellness and Fitness
3 - Pharmaceuticals
Source: EMSI 2013.2 Class of Worker Dataset QCEW Employees
A p p l i e d D e v e l o p m e n t E c o n o m i c s | P a g e 20
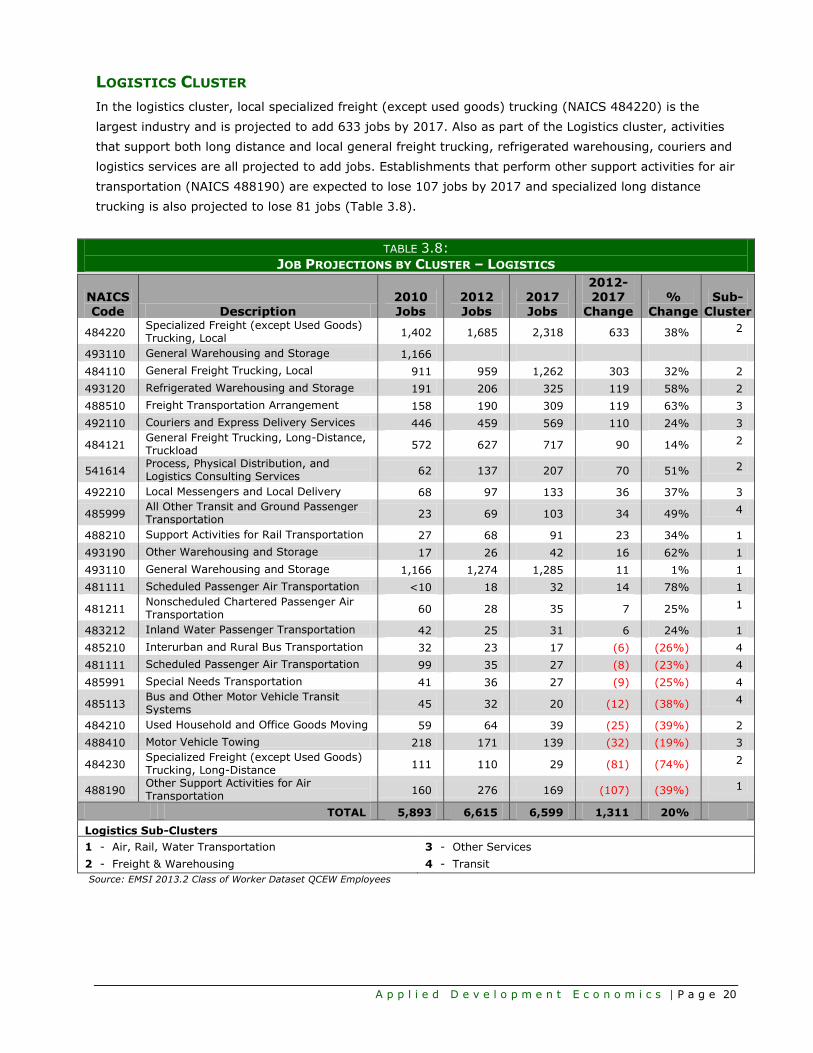
LOGISTICS CLUSTER
In the logistics cluster, local specialized freight (except used goods) trucking (NAICS 484220) is the
largest industry and is projected to add 633 jobs by 2017. Also as part of the Logistics cluster, activities
that support both long distance and local general freight trucking, refrigerated warehousing, couriers and
logistics services are all projected to add jobs. Establishments that perform other support activities for air
transportation (NAICS 488190) are expected to lose 107 jobs by 2017 and specialized long distance
trucking is also projected to lose 81 jobs (Table 3.8).
TABLE 3.8:
JOB PROJECTIONS BY CLUSTER – LOGISTICS
NAICS Code Description
2010 Jobs
2012 Jobs
2017 Jobs
2012-2017
Change %
Change Sub-
Cluster
484220 Specialized Freight (except Used Goods) Trucking, Local
1,402 1,685 2,318 633 38% 2
493110 General Warehousing and Storage 1,166
484110 General Freight Trucking, Local 911 959 1,262 303 32% 2
493120 Refrigerated Warehousing and Storage 191 206 325 119 58% 2
488510 Freight Transportation Arrangement 158 190 309 119 63% 3
492110 Couriers and Express Delivery Services 446 459 569 110 24% 3
484121 General Freight Trucking, Long-Distance, Truckload
572 627 717 90 14% 2
541614 Process, Physical Distribution, and Logistics Consulting Services
62 137 207 70 51% 2
492210 Local Messengers and Local Delivery 68 97 133 36 37% 3
485999 All Other Transit and Ground Passenger Transportation
23 69 103 34 49% 4
488210 Support Activities for Rail Transportation 27 68 91 23 34% 1
493190 Other Warehousing and Storage 17 26 42 16 62% 1
493110 General Warehousing and Storage 1,166 1,274 1,285 11 1% 1
481111 Scheduled Passenger Air Transportation <10 18 32 14 78% 1
481211 Nonscheduled Chartered Passenger Air Transportation
60 28 35 7 25% 1
483212 Inland Water Passenger Transportation 42 25 31 6 24% 1
485210 Interurban and Rural Bus Transportation 32 23 17 (6) (26%) 4
481111 Scheduled Passenger Air Transportation 99 35 27 (8) (23%) 4
485991 Special Needs Transportation 41 36 27 (9) (25%) 4
485113 Bus and Other Motor Vehicle Transit Systems
45 32 20 (12) (38%) 4
484210 Used Household and Office Goods Moving 59 64 39 (25) (39%) 2
488410 Motor Vehicle Towing 218 171 139 (32) (19%) 3
484230 Specialized Freight (except Used Goods) Trucking, Long-Distance
111 110 29 (81) (74%) 2
488190 Other Support Activities for Air Transportation
160 276 169 (107) (39%) 1
TOTAL 5,893 6,615 6,599 1,311 20%
Logistics Sub-Clusters
1 - Air, Rail, Water Transportation 3 - Other Services
2 - Freight & Warehousing 4 - Transit
Source: EMSI 2013.2 Class of Worker Dataset QCEW Employees

A p p l i e d D e v e l o p m e n t E c o n o m i c s | P a g e 21
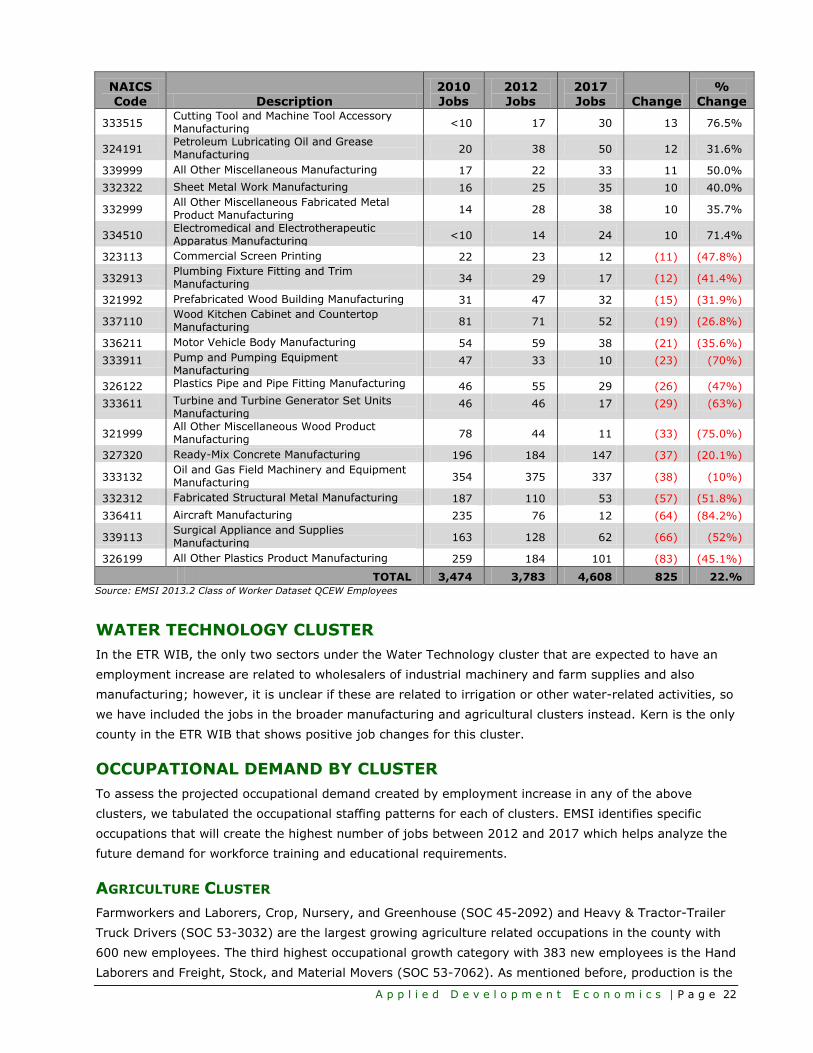
MANUFACTURING CLUSTER
The manufacturing industry providing service to both the major clusters and other growing job sectors is
expected to add a total of 825 jobs by 2017. Very few industries, mostly related to the non-cluster
manufacturing services, are projected to add more than 100 new jobs during the next five years (Table
3.9). The two largest gainers are equipment manufacturing for aircraft parts and other miscellaneous
general purpose machinery manufacturing with a combined net total of 263 jobs between 2012 and
2017. (Industries that would grow or decline by less than 10 employees are not listed.) As part of the
manufacturing related services that do not relate to the main clusters, establishments that perform other
aircraft parts and auxiliary equipment manufacturing (NAICS 336413) activities are expected to gain 120
jobs by 2017.
TABLE 3.9:
JOB PROJECTIONS BY CLUSTER – MANUFACTURING
NAICS Code Description
2010 Jobs
2012 Jobs
2017 Jobs Change
% Change
336413 Other Aircraft Parts and Auxiliary Equipment Manufacturing
439 371 530 159 42.9%
333999 All Other Miscellaneous General Purpose Machinery Manufacturing
79 184 288 104 56.5%
327310 Cement Manufacturing 356 361 457 96 26.6%
325520 Adhesive Manufacturing 247 227 319 92 40.5%
332710 Machine Shops 370 432 513 81 18.8%
334511
Search, Detection, Navigation, Guidance, Aeronautical, and Nautical System and Instrument Manufacturing
74 180 260 80 44.4%
333319 Other Commercial and Service Industry Machinery Manufacturing
45 88 164 76 86%
325199 All Other Basic Organic Chemical Manufacturing
69 133 189 56 42.1%
333298 All Other Industrial Machinery Manufacturing 44 66 116 50 76%
332812
Metal Coating, Engraving (except Jewelry and Silverware), and Allied Services to Manufacturers
73 93 143 50 53.8%
333298 All Other Industrial Machinery Manufacturing 44 66 116 50 75.8%
333993 Packaging Machinery Manufacturing 23 93 138 45 48.4%
336330 Motor Vehicle Steering and Suspension Components (except Spring) Manufacturing
<10 31 75 44 141.9%
332323 Ornamental and Architectural Metal Work Manufacturing
72 62 94 32 51.6%
326291 Rubber Product Manufacturing for Mechanical Use
93 101 132 31 30.7%
321114 Wood Preservation 33 44 72 28 63.6%
334119 Other Computer Peripheral Equipment Manufacturing
<10 48 72 24 50.0%
336212 Truck Trailer Manufacturing 30 50 74 24 48.0%
327992 Ground or Treated Mineral and Earth Manufacturing
46 78 101 23 29.5%
332813 Electroplating, Plating, Polishing, Anodizing, and Coloring
59 64 83 19 29.7%
334513
Instruments and Related Products Manufacturing for Measuring, Displaying, and Controlling Industrial Process Variables
11 27 44 17 63.0%
333992 Welding and Soldering Equipment Manufacturing
<10 14 29 15 107.1%
339991 Gasket, Packing, and Sealing Device Manufacturing
<10 25 40 15 60.0%
331319 Other Aluminum Rolling and Drawing 54 56 69 13 23.2%
332420 Metal Tank (Heavy Gauge) Manufacturing 58 72 85 13 18.1%
A p p l i e d D e v e l o p m e n t E c o n o m i c s | P a g e 22
NAICS
Code Description
2010
Jobs
2012
Jobs
2017
Jobs Change
%
Change
333515 Cutting Tool and Machine Tool Accessory Manufacturing
<10 17 30 13 76.5%
324191 Petroleum Lubricating Oil and Grease Manufacturing
20 38 50 12 31.6%
339999 All Other Miscellaneous Manufacturing 17 22 33 11 50.0%
332322 Sheet Metal Work Manufacturing 16 25 35 10 40.0%
332999 All Other Miscellaneous Fabricated Metal Product Manufacturing
14 28 38 10 35.7%
334510 Electromedical and Electrotherapeutic Apparatus Manufacturing
<10 14 24 10 71.4%
323113 Commercial Screen Printing 22 23 12 (11) (47.8%)
332913 Plumbing Fixture Fitting and Trim Manufacturing
34 29 17 (12) (41.4%)
321992 Prefabricated Wood Building Manufacturing 31 47 32 (15) (31.9%)
337110 Wood Kitchen Cabinet and Countertop Manufacturing
81 71 52 (19) (26.8%)
336211 Motor Vehicle Body Manufacturing 54 59 38 (21) (35.6%)
333911 Pump and Pumping Equipment Manufacturing
47 33 10 (23) (70%)
326122 Plastics Pipe and Pipe Fitting Manufacturing 46 55 29 (26) (47%)
333611 Turbine and Turbine Generator Set Units Manufacturing
46 46 17 (29) (63%)
321999 All Other Miscellaneous Wood Product Manufacturing
78 44 11 (33) (75.0%)
327320 Ready-Mix Concrete Manufacturing 196 184 147 (37) (20.1%)
333132 Oil and Gas Field Machinery and Equipment Manufacturing
354 375 337 (38) (10%)
332312 Fabricated Structural Metal Manufacturing 187 110 53 (57) (51.8%)
336411 Aircraft Manufacturing 235 76 12 (64) (84.2%)
339113 Surgical Appliance and Supplies Manufacturing
163 128 62 (66) (52%)
326199 All Other Plastics Product Manufacturing 259 184 101 (83) (45.1%)
TOTAL 3,474 3,783 4,608 825 22.%
Source: EMSI 2013.2 Class of Worker Dataset QCEW Employees
WATER TECHNOLOGY CLUSTER
In the ETR WIB, the only two sectors under the Water Technology cluster that are expected to have an
employment increase are related to wholesalers of industrial machinery and farm supplies and also
manufacturing; however, it is unclear if these are related to irrigation or other water-related activities, so
we have included the jobs in the broader manufacturing and agricultural clusters instead. Kern is the only
county in the ETR WIB that shows positive job changes for this cluster.
OCCUPATIONAL DEMAND BY CLUSTER
To assess the projected occupational demand created by employment increase in any of the above
clusters, we tabulated the occupational staffing patterns for each of clusters. EMSI identifies specific
occupations that will create the highest number of jobs between 2012 and 2017 which helps analyze the
future demand for workforce training and educational requirements.
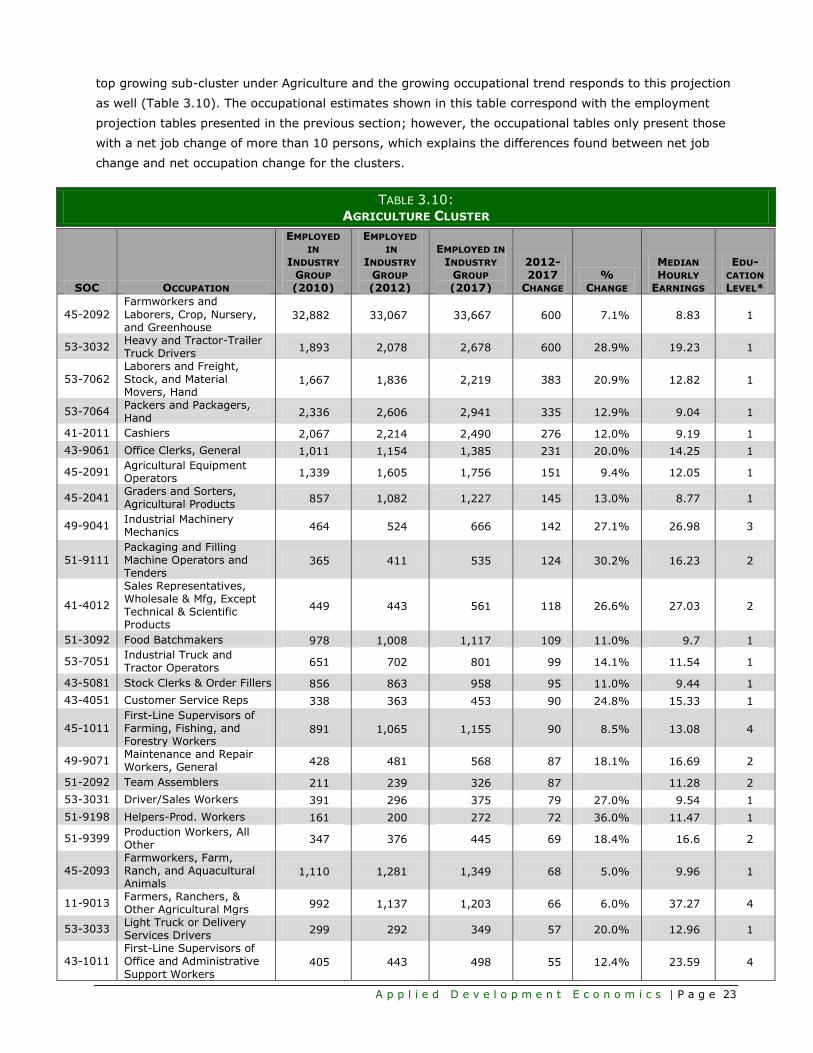
AGRICULTURE CLUSTER
Farmworkers and Laborers, Crop, Nursery, and Greenhouse (SOC 45-2092) and Heavy & Tractor-Trailer
Truck Drivers (SOC 53-3032) are the largest growing agriculture related occupations in the county with
600 new employees. The third highest occupational growth category with 383 new employees is the Hand
Laborers and Freight, Stock, and Material Movers (SOC 53-7062). As mentioned before, production is the
A p p l i e d D e v e l o p m e n t E c o n o m i c s | P a g e 23
top growing sub-cluster under Agriculture and the growing occupational trend responds to this projection
as well (Table 3.10). The occupational estimates shown in this table correspond with the employment
projection tables presented in the previous section; however, the occupational tables only present those
with a net job change of more than 10 persons, which explains the differences found between net job
change and net occupation change for the clusters.
TABLE 3.10:
AGRICULTURE CLUSTER
SOC OCCUPATION
EMPLOYED
IN
INDUSTRY
GROUP
(2010)
EMPLOYED IN
INDUSTRY
GROUP
(2012)
EMPLOYED IN
INDUSTRY
GROUP
(2017)
2012-2017
CHANGE %
CHANGE
MEDIAN
HOURLY
EARNINGS
EDU-CATION
LEVEL*
45-2092
Farmworkers and
Laborers, Crop, Nursery, and Greenhouse
32,882 33,067 33,667 600 7.1% 8.83 1
53-3032 Heavy and Tractor-Trailer Truck Drivers
1,893 2,078 2,678 600 28.9% 19.23 1
53-7062 Laborers and Freight, Stock, and Material Movers, Hand
1,667 1,836 2,219 383 20.9% 12.82 1
53-7064 Packers and Packagers, Hand
2,336 2,606 2,941 335 12.9% 9.04 1
41-2011 Cashiers 2,067 2,214 2,490 276 12.0% 9.19 1
43-9061 Office Clerks, General 1,011 1,154 1,385 231 20.0% 14.25 1
45-2091 Agricultural Equipment Operators
1,339 1,605 1,756 151 9.4% 12.05 1
45-2041 Graders and Sorters, Agricultural Products
857 1,082 1,227 145 13.0% 8.77 1
49-9041 Industrial Machinery Mechanics
464 524 666 142 27.1% 26.98 3
51-9111 Packaging and Filling Machine Operators and Tenders
365 411 535 124 30.2% 16.23 2
41-4012
Sales Representatives, Wholesale & Mfg, Except Technical & Scientific Products
449 443 561 118 26.6% 27.03 2
51-3092 Food Batchmakers 978 1,008 1,117 109 11.0% 9.7 1
53-7051 Industrial Truck and Tractor Operators
651 702 801 99 14.1% 11.54 1
43-5081 Stock Clerks & Order Fillers 856 863 958 95 11.0% 9.44 1
43-4051 Customer Service Reps 338 363 453 90 24.8% 15.33 1
45-1011 First-Line Supervisors of Farming, Fishing, and Forestry Workers
891 1,065 1,155 90 8.5% 13.08 4
49-9071 Maintenance and Repair Workers, General
428 481 568 87 18.1% 16.69 2
51-2092 Team Assemblers 211 239 326 87 11.28 2
53-3031 Driver/Sales Workers 391 296 375 79 27.0% 9.54 1
51-9198 Helpers-Prod. Workers 161 200 272 72 36.0% 11.47 1
51-9399 Production Workers, All Other
347 376 445 69 18.4% 16.6 2
45-2093 Farmworkers, Farm, Ranch, and Aquacultural Animals
1,110 1,281 1,349 68 5.0% 9.96 1
11-9013 Farmers, Ranchers, & Other Agricultural Mgrs
992 1,137 1,203 66 6.0% 37.27 4
53-3033 Light Truck or Delivery Services Drivers
299 292 349 57 20.0% 12.96 1
43-1011 First-Line Supervisors of Office and Administrative
Support Workers 405 443 498 55 12.4% 23.59 4
A p p l i e d D e v e l o p m e n t E c o n o m i c s | P a g e 24
SOC OCCUPATION
EMPLOYED
IN
INDUSTRY
GROUP
(2010)
EMPLOYED IN
INDUSTRY
GROUP
(2012)
EMPLOYED IN
INDUSTRY
GROUP
(2017)
2012-2017
CHANGE %
CHANGE
MEDIAN
HOURLY
EARNINGS
EDU-CATION
LEVEL*
11-1021 General & Operations Mgr 504 544 599 55 10.1% 42.4 7
13-1078 H.R., Training, & Labor Relations Specialists, All Other
114 140 191 51 36.0% 27.41 7
37-3011 Landscaping and Groundskeeping Workers
540 581 627 46 8.0% 10.89 1
43-6014
Secretaries and Administrative Assistants, Except Legal, Medical, and Executive
269 294 339 45 15.0% 17.06 1
51-9061 Inspectors, Testers, Sorters, Samplers, and Weighers
76 94 135 41 44.0% 19.86 2
49-3042 Mobile Heavy Equipment Mechanics, Except Engines
170 197 236 39 20.0% 24.32 3
41-1011 First-Line Supervisors of Retail Sales Workers
258 273 311 38 14.0% 16.75 4
51-3021 Butchers and Meat Cutters 366 389 426 37 10.0% 10.54 3
35-2021 Food Preparation Workers 261 279 316 37 13.0% 9.03 1
43-5011 Cargo and Freight Agents 57 67 103 36 54.0% 17.87 1
35-3021 Combined Food Pre-paration & Serving Wkrs, Including Fast Food
268 286 320 34 12.0% 8.91 1
29-1111 Registered Nurses 98 116 148 32 28.0% 42.03 6
49-3031 Bus and Truck Mechanics & Diesel Engine Specialists
90 99 130 31 31.0% 19.16 5
47-2061 Construction Laborers 169 180 210 30 17.0% 14.11 1
51-1011 First-Line Supervisors of Production and Operating Workers
158 163 193 30 18.0% 27.91 4
51-4041 Machinists 92 111 141 30 27.0% 17.58 3
53-3031 Driver/Sales Workers 157 163 192 29 18.0% 9.54 1
51-2099 Assemblers and Fabricators, All Other
62 73 101 28 38.0% 10.79 2
53-1031
First-Line Supervisors of Transportation and Material-Moving Machine and Vehicle Operators
109 113 141 28 25.0% 28.68 4
37-2011 Janitors and Cleaners, Except Maids and Housekeeping Cleaners
111 130 158 28 22.0% 10.34 1
43-5032 Dispatchers, Except Police, Fire, and Ambulance
77 86 113 27 31.0% 17.41 2
13-2011 Accountants & Auditors 172 202 228 26 13.0% 29.23 7
49-3041 Farm Equipment Mechanics and Service Technicians
175 194 220 26 13.0% 13.46 3
51-4121 Welders, Cutters, Solderers, and Brazers
169 199 225 26 13.0% 29.43 5
37-3012 Pesticide Handlers, Sprayers, and Applicators, Vegetation
58 78 103 25 32.0% 10.41 2
43-4171 Receptionists and Information Clerks
153 166 189 23 14.0% 11.66 1
45-2041 Graders and Sorters, Agricultural Products
371 430 452 22 5.0% 8.77 1
41-3099 Sales Representatives, Services, All Other
108 119 141 22 18.0% 22.17 1
51-8031 Water and Wastewater Treatment Plant and System Operators
126 75 97 22 29.0% 27.87 3
A p p l i e d D e v e l o p m e n t E c o n o m i c s | P a g e 25
SOC OCCUPATION
EMPLOYED
IN
INDUSTRY
GROUP
(2010)
EMPLOYED IN
INDUSTRY
GROUP
(2012)
EMPLOYED IN
INDUSTRY
GROUP
(2017)
2012-2017
CHANGE %
CHANGE
MEDIAN
HOURLY
EARNINGS
EDU-CATION
LEVEL*
31-1011 Home Health Aides 51 62 83 21 34.0% 9.26 1
29-2061 Licensed Practical & Vocational Nurses
57 68 88 20 29.0% 23.62 5
43-5071 Shipping, Receiving, and Traffic Clerks
92 104 124 20 19.0% 13.21 1
37-3011 Landscaping and Groundskeeping Workers
40 32 45 13 41.0% 16.58 1
1 - Short-term on-the-job training 6 - Associate's degree
2 - Moderate-term on-the-job training 7 - Bachelor's degree
3 - Long-term on-the-job training 8 - Bachelor's or higher degree, plus work experience
4 - Work experience in a related occupation 9 - First professional degree
5 - Postsecondary non-degree award 10 – Masters
Source: EMSI 2013.2 Class of Worker Dataset-QCEW Employees
Employees
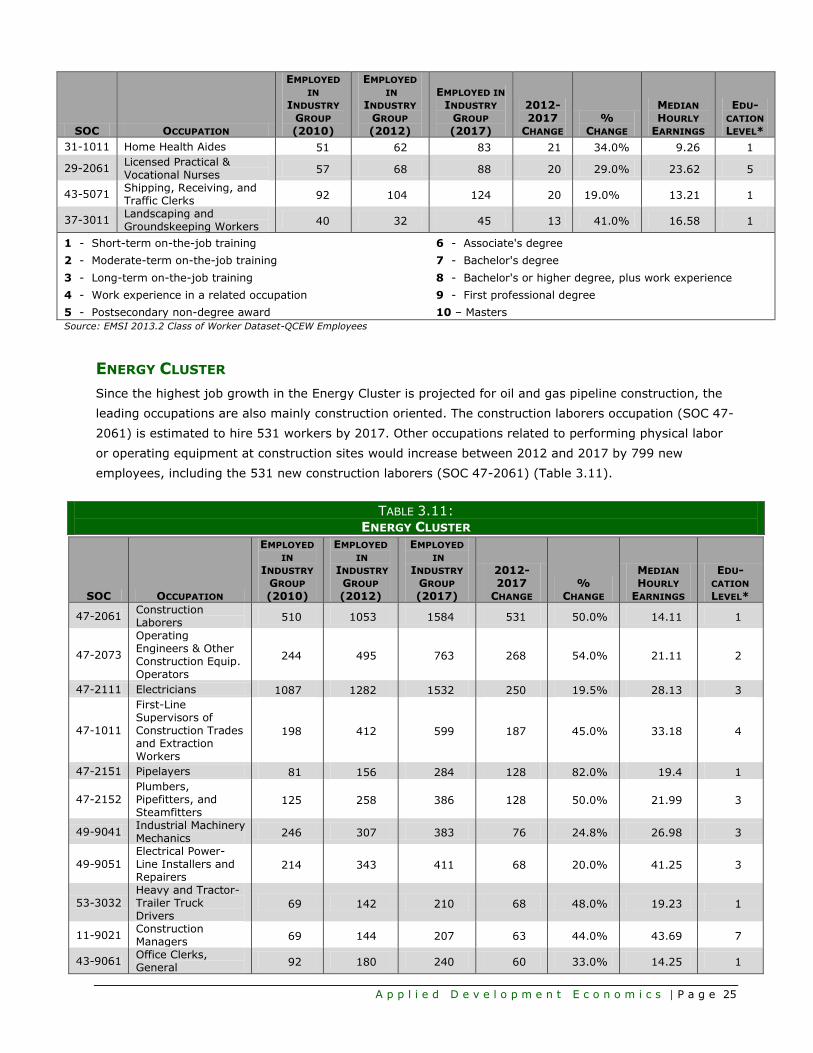
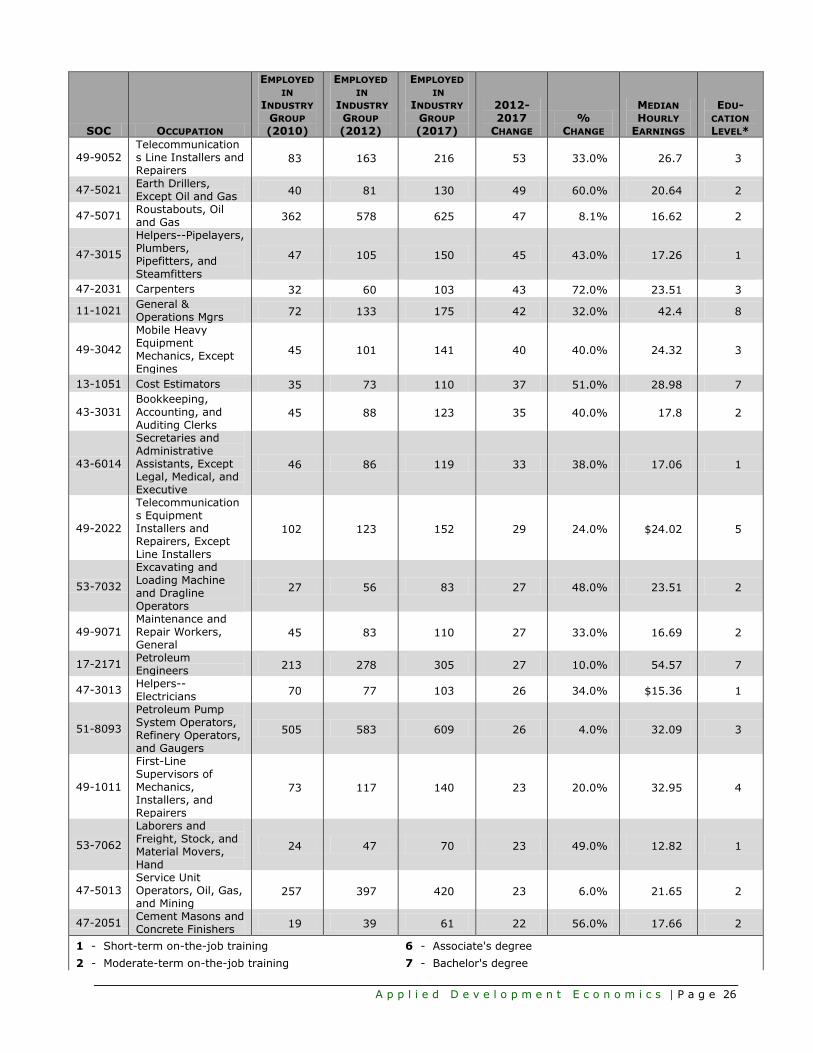
ENERGY CLUSTER
Since the highest job growth in the Energy Cluster is projected for oil and gas pipeline construction, the
leading occupations are also mainly construction oriented. The construction laborers occupation (SOC 47-
2061) is estimated to hire 531 workers by 2017. Other occupations related to performing physical labor
or operating equipment at construction sites would increase between 2012 and 2017 by 799 new
employees, including the 531 new construction laborers (SOC 47-2061) (Table 3.11).
TABLE 3.11:
ENERGY CLUSTER
SOC OCCUPATION
EMPLOYED IN
INDUSTRY
GROUP
(2010)
EMPLOYED IN
INDUSTRY
GROUP
(2012)
EMPLOYED IN
INDUSTRY
GROUP
(2017)
2012-2017
CHANGE %
CHANGE
MEDIAN
HOURLY
EARNINGS
EDU-CATION
LEVEL*
47-2061 Construction Laborers
510 1053 1584 531 50.0% 14.11 1
47-2073
Operating Engineers & Other Construction Equip. Operators
244 495 763 268 54.0% 21.11 2
47-2111 Electricians 1087 1282 1532 250 19.5% 28.13 3
47-1011
First-Line Supervisors of Construction Trades and Extraction Workers
198 412 599 187 45.0% 33.18 4
47-2151 Pipelayers 81 156 284 128 82.0% 19.4 1
47-2152 Plumbers, Pipefitters, and Steamfitters
125 258 386 128 50.0% 21.99 3
49-9041 Industrial Machinery Mechanics
246 307 383 76 24.8% 26.98 3
49-9051 Electrical Power-Line Installers and Repairers
214 343 411 68 20.0% 41.25 3
53-3032 Heavy and Tractor-Trailer Truck Drivers
69 142 210 68 48.0% 19.23 1
11-9021 Construction Managers
69 144 207 63 44.0% 43.69 7
43-9061 Office Clerks, General
92 180 240 60 33.0% 14.25 1
A p p l i e d D e v e l o p m e n t E c o n o m i c s | P a g e 26
SOC OCCUPATION
EMPLOYED IN
INDUSTRY
GROUP
(2010)
EMPLOYED IN
INDUSTRY
GROUP
(2012)
EMPLOYED IN
INDUSTRY
GROUP
(2017)
2012-2017
CHANGE %
CHANGE
MEDIAN
HOURLY
EARNINGS
EDU-CATION
LEVEL*
49-9052 Telecommunications Line Installers and Repairers
83 163 216 53 33.0% 26.7 3
47-5021 Earth Drillers, Except Oil and Gas
40 81 130 49 60.0% 20.64 2
47-5071 Roustabouts, Oil and Gas
362 578 625 47 8.1% 16.62 2
47-3015
Helpers--Pipelayers, Plumbers, Pipefitters, and Steamfitters
47 105 150 45 43.0% 17.26 1
47-2031 Carpenters 32 60 103 43 72.0% 23.51 3
11-1021 General & Operations Mgrs
72 133 175 42 32.0% 42.4 8
49-3042
Mobile Heavy Equipment Mechanics, Except Engines
45 101 141 40 40.0% 24.32 3
13-1051 Cost Estimators 35 73 110 37 51.0% 28.98 7
43-3031
Bookkeeping,
Accounting, and Auditing Clerks
45 88 123 35 40.0% 17.8 2
43-6014
Secretaries and Administrative Assistants, Except Legal, Medical, and Executive
46 86 119 33 38.0% 17.06 1
49-2022
Telecommunications Equipment Installers and Repairers, Except Line Installers
102 123 152 29 24.0% $24.02 5
53-7032
Excavating and Loading Machine and Dragline Operators
27 56 83 27 48.0% 23.51 2
49-9071 Maintenance and Repair Workers, General
45 83 110 27 33.0% 16.69 2
17-2171 Petroleum Engineers
213 278 305 27 10.0% 54.57 7
47-3013 Helpers--Electricians
70 77 103 26 34.0% $15.36 1
51-8093
Petroleum Pump System Operators, Refinery Operators, and Gaugers
505 583 609 26 4.0% 32.09 3
49-1011
First-Line Supervisors of Mechanics, Installers, and Repairers
73 117 140 23 20.0% 32.95 4
53-7062
Laborers and Freight, Stock, and Material Movers, Hand
24 47 70 23 49.0% 12.82 1
47-5013 Service Unit Operators, Oil, Gas, and Mining
257 397 420 23 6.0% 21.65 2
47-2051 Cement Masons and Concrete Finishers
19 39 61 22 56.0% 17.66 2
1 - Short-term on-the-job training 6 - Associate's degree
2 - Moderate-term on-the-job training 7 - Bachelor's degree
A p p l i e d D e v e l o p m e n t E c o n o m i c s | P a g e 27
SOC OCCUPATION
EMPLOYED IN
INDUSTRY
GROUP
(2010)
EMPLOYED IN
INDUSTRY
GROUP
(2012)
EMPLOYED IN
INDUSTRY
GROUP
(2017)
2012-2017
CHANGE %
CHANGE
MEDIAN
HOURLY
EARNINGS
EDU-CATION
LEVEL*
3 - Long-term on-the-job training 8 - Bachelor's or higher degree, plus work experience
4 - Work experience in a related occupation 9 - First professional degree
5 - Postsecondary non-degree award 10 – Masters
Source: EMSI 2013.2 Class of Worker Dataset-QCEW Employees
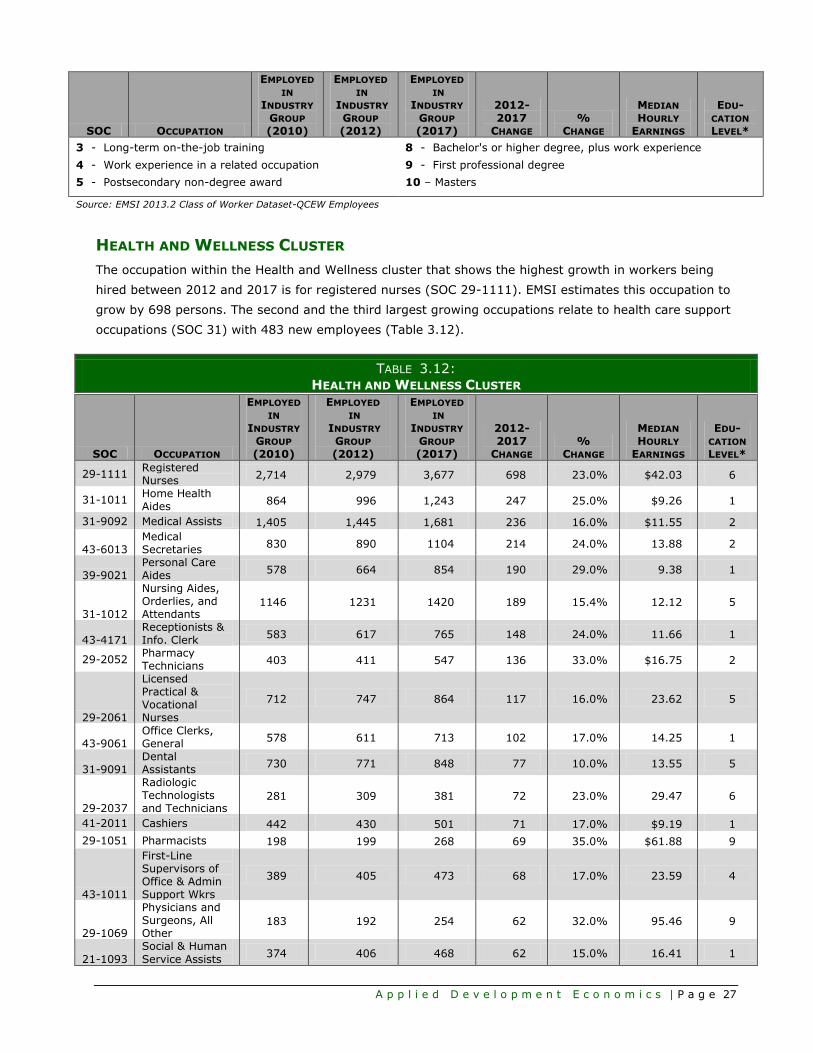
HEALTH AND WELLNESS CLUSTER
The occupation within the Health and Wellness cluster that shows the highest growth in workers being
hired between 2012 and 2017 is for registered nurses (SOC 29-1111). EMSI estimates this occupation to
grow by 698 persons. The second and the third largest growing occupations relate to health care support
occupations (SOC 31) with 483 new employees (Table 3.12).
TABLE 3.12:
HEALTH AND WELLNESS CLUSTER
SOC OCCUPATION
EMPLOYED IN
INDUSTRY
GROUP
(2010)
EMPLOYED IN
INDUSTRY
GROUP
(2012)
EMPLOYED IN
INDUSTRY
GROUP
(2017)
2012-2017
CHANGE %
CHANGE
MEDIAN
HOURLY
EARNINGS
EDU-CATION
LEVEL*
29-1111 Registered Nurses
2,714 2,979 3,677 698 23.0% $42.03 6
31-1011 Home Health Aides
864 996 1,243 247 25.0% $9.26 1
31-9092 Medical Assists 1,405 1,445 1,681 236 16.0% $11.55 2
43-6013 Medical Secretaries
830 890 1104 214 24.0% 13.88 2
39-9021 Personal Care Aides
578 664 854 190 29.0% 9.38 1
31-1012
Nursing Aides, Orderlies, and Attendants
1146 1231 1420 189 15.4% 12.12 5
43-4171 Receptionists & Info. Clerk
583 617 765 148 24.0% 11.66 1
29-2052 Pharmacy Technicians
403 411 547 136 33.0% $16.75 2
29-2061
Licensed Practical & Vocational Nurses
712 747 864 117 16.0% 23.62 5
43-9061 Office Clerks, General
578 611 713 102 17.0% 14.25 1
31-9091 Dental Assistants
730 771 848 77 10.0% 13.55 5
29-2037
Radiologic Technologists and Technicians
281 309 381 72 23.0% 29.47 6
41-2011 Cashiers 442 430 501 71 17.0% $9.19 1
29-1051 Pharmacists 198 199 268 69 35.0% $61.88 9
43-1011
First-Line Supervisors of Office & Admin Support Wkrs
389 405 473 68 17.0% 23.59 4
29-1069
Physicians and Surgeons, All Other
183 192 254 62 32.0% 95.46 9
21-1093
Social & Human
Service Assists 374 406 468 62 15.0% 16.41 1

A p p l i e d D e v e l o p m e n t E c o n o m i c s | P a g e 28
SOC OCCUPATION
EMPLOYED IN
INDUSTRY
GROUP
(2010)
EMPLOYED IN
INDUSTRY
GROUP
(2012)
EMPLOYED IN
INDUSTRY
GROUP
(2017)
2012-2017
CHANGE %
CHANGE
MEDIAN
HOURLY
EARNINGS
EDU-CATION
LEVEL*
11-9111 Medical & Health Svcs Managers
276 297 356 59 20.0% 42.81 7
43-3021
Billing and
Posting Clerks 399 409 466 57 14.0% 14.96 1
29-1123 Physical Therapists
167 184 241 57 31.0% 36.16 9
31-9799
Healthcare Support Wkrs, All Other
247 273 324 51 19.0% 14.01 1
41-1011 First-Line Super-visors of Retail Sales Wkrs
147 149 192 43 29.0% $16.75 4
29-2041 Emergency Medical Techs & Paramedics
29 36 49 13 36.0% 20.61 5
1 - Short-term on-the-job training 6 - Associate's degree
2 - Moderate-term on-the-job training 7 - Bachelor's degree
3 - Long-term on-the-job training 8 - Bachelor's or higher degree, plus work experience
4 - Work experience in a related occupation 9 - First professional degree
5 - Postsecondary non-degree award 10 – Masters
Source: EMSI 2013.2 Class of Worker Dataset-QCEW Employees
LOGISTICS CLUSTER The two occupations with the highest projected growth between 2012 and 2017 are the heavy tractor
trailer drivers (SOC 53-3032) and Laborers and Freight, Stock, and Material Movers (SOC 53-7062) with
520 employees and 139 employees, respectively (Table 3.13). However a number of more skilled
occupations also show projected growth, including Cargo and Freight Agents (SOC 43-5011), Mechanics
and Diesel Specialists (SOC 49-3031) and Supervisors (SOC 53-1031).
TABLE 3.13:
LOGISTICS CLUSTER
SOC OCCUPATION
EMPLOYED IN
INDUSTRY
GROUP
(2010)
EMPLOYED IN
INDUSTRY
GROUP
(2012)
EMPLOYED IN
INDUSTRY
GROUP
(2017)
2012-2017
CHANGE %
CHANGE
MEDIAN
HOURLY
EARNINGS
EDU-CATION
LEVEL*
53-3032 Heavy and Tractor-Trailer Truck Drivers
1,933 2,112 2,632 520 24.6% 19.23 1
53-7062
Laborers and Freight, Stock, and Material Movers, Hand
629 686 825 139 20.3% 12.82 1
53-3033 Light Truck or Delivery Services Drivers
404 434 511 77 17.7% 12.96 1
43-5011 Cargo and Freight Agents
64 75 114 39 52.0% 17.87 1
43-9061 Office Clerks, General
164 184 223 39 21.2% 14.25 1
49-3031
Bus and Truck Mechanics and Diesel Engine Specialists
104 117 147 30 26.0% $19.16 5
43-5032
Dispatchers,
Except Police, Fire, and Ambulance
122 130 158 28 21.5% 17.41 2

A p p l i e d D e v e l o p m e n t E c o n o m i c s | P a g e 29
SOC OCCUPATION
EMPLOYED IN
INDUSTRY
GROUP
(2010)
EMPLOYED IN
INDUSTRY
GROUP
(2012)
EMPLOYED IN
INDUSTRY
GROUP
(2017)
2012-2017
CHANGE %
CHANGE
MEDIAN
HOURLY
EARNINGS
EDU-CATION
LEVEL*
53-7064 Packers and Packagers, Hand
210 233 260 27 12.0% $9.04 1
53-1031
First-Line
Supervisors of Transportation and Material-Moving Machine and Vehicle Operators
113 124 150 26 21.0% 28.68 4
53-7051 Industrial Truck and Tractor Operators
216 231 256 25 10.8% 11.54 1
43-3031 Bookkeeping, Accounting, and Auditing Clerks
70 79 100 21 26.6% 17.8 2
43-5071 Shipping, Receiving, and Traffic Clerks
98 106 126 20 18.9% 13.21 1
47-2051 Cement Masons and Concrete Finishers
19 39 61 22 56.0% 17.66 2
1 - Short-term on-the-job training 6 - Associate's degree
2 - Moderate-term on-the-job training 7 - Bachelor's degree
3 - Long-term on-the-job training 8 - Bachelor's or higher degree, plus work experience
4 - Work experience in a related occupation 9 - First professional degree
5 - Postsecondary non-degree award 10 – Masters
Source: EMSI 2013.2 Class of Worker Dataset-QCEW Employees
MANUFACTURING CLUSTER
As indicated previously, very few manufacturing industries are projected to grow. However, some
occupations within manufacturing are expected to see growth. The Machinist occupation (SOC 51-4041)
is projected to add 58 jobs, with Welders adding 35 and Assemblers adding 32 jobs (Table 3.14).
TABLE 3.14:
MANUFACTURING CLUSTER
SOC OCCUPATION
EMPLOYED
IN
INDUSTRY
GROUP
(2010)
EMPLOYED
IN
INDUSTRY
GROUP
(2012)
EMPLOYED IN
INDUSTRY
GROUP
(2017)
2012-2017
CHANGE %
CHANGE
MEDIAN
HOURLY
EARNINGS
EDU-CATION
LEVEL*
51-4041 Machinists 241 277 335 58 21% $18.61 3
51-4121 Welders, Cutters, Solderers, and Brazers
177 230 265 35 15% $30.67 5
51-2092 Team Assemblers 215 242 274 32 13% $11.92 2
51-1011
First-Line Supervisors of Production and Operating Workers
152 163 186 23 14% $26.08 4
51-9061 Inspectors, Testers, Sorters, Samplers, and Weighers
101 95 115 20 21% $12.91 2
49-9041 Industrial Machinery Mechanics
89 110 129 19 17% $25.88 3
17-2141 Mechanical Engineers
78 90 109 19 21% $44.11 7

A p p l i e d D e v e l o p m e n t E c o n o m i c s | P a g e 30
SOC OCCUPATION
EMPLOYED
IN
INDUSTRY
GROUP
(2010)
EMPLOYED
IN
INDUSTRY
GROUP
(2012)
EMPLOYED IN
INDUSTRY
GROUP
(2017)
2012-2017
CHANGE %
CHANGE
MEDIAN
HOURLY
EARNINGS
EDU-CATION
LEVEL*
51-9023
Mixing and Blending Machine Setters, Operators, and
Tenders
66 58 75 17 29% $16.93 2
51-4011
Computer-Controlled Machine Tool Operators, Metal and Plastic
41 40 55 15 38% $16.54 2
53-3032 Heavy and Tractor-Trailer Truck Drivers
214 202 216 14 7% $18.50 1
17-2011 Aerospace Engineers
169 127 141 14 11% $49.29 7
17-2112 Industrial Engineers 74 71 85 14 20% $50.79 7
41-4012
Sales Reps, Whole-sale & Mfg, Except Technical and Scientific Products
75 79 92 13 16% $30.30 2
53-7062
Laborers and Freight, Stock, and Material Movers, Hand
103 110 122 12 11% $11.74 1
17-3023
Electrical and Electronics Engineering Technicians
28 46 58 12 26% $37.25 6
51-9121
Coating, Painting, and Spraying Machine Setters, Operators, and Tenders
56 66 77 11 17% $13.27 2
11-3051 Industrial Production Managers
53 57 68 11 19% $50.34 8
51-9198 Helpers--Production Workers
38 35 46 11 31% $12.52 1
15-1133 Software Developers, Systems Software
26 22 33 11 50% $56.88 7
51-2022
Electrical and Electronic Equipment Assemblers
17 16 27 11 69% $9.77 1
11-1021 General and Operations Managers
102 110 120 10 9% $42.37 8
43-9061 Office Clerks, General
72 80 90 10 13% $13.18 1
17-2071 Electrical Engineers 23 25 35 10 40% $47.85 7
1 - Short-term on-the-job training 6 - Associate's degree
2 - Moderate-term on-the-job training 7 - Bachelor's degree
3 - Long-term on-the-job training 8 - Bachelor's or higher degree, plus work experience
4 - Work experience in a related occupation 9 - First professional degree
5 - Postsecondary non-degree award 10 – Masters
Source: EMSI 2013.2 Class of Worker Dataset-QCEW Employees

A p p l i e d D e v e l o p m e n t E c o n o m i c s | P a g e 31
44.. SSKKIILLLLSS AANNAALLYYSSIISS
In this section of the report we focus on analyzing the unemployed labor force who had previously
worked in any one of the industry clusters in an effort to analyze the match (or mismatch) between the
labor force and future jobs. In general, it does appear that the educational profile of the County’s
underutilized labor force matches the educational and training requirements of future jobs.
Of the five clusters, agriculture is projected to grow the most new jobs between 2012 and 2017, at 8,886
over a five year period, or 1,777 per year on average (Table 4-1). The bulk of the 8,886 new jobs are in
the lowest education and training categories of short-term OJT (7,038) and moderate-term OJT (851).
The lower-middle rung of the educational/training ladder comprised of jobs requiring long-term OJT
and/or relevant work experience are also projected to increase by almost 800 new jobs over the next five
years. While a substantial number of new jobs are projected in the Agricultural cluster over the next five
years, it is important to remember the seasonal nature of this cluster, which helps explain this cluster’s
high unemployment numbers. There are slightly over 13,800 persons who are unemployed who
previously worked in industries within the Agricultural cluster. Of the 13,800 unemployed persons, the
bulk is in the lower educational attainment rung, of no high school diploma (6,774). Another 6,000 are in
the lower-middle educational attainment rung of some college (2,170) and high school diploma (3,884).
On the surface, with respect to educational qualifications, the unemployed labor force with previous
experience in Agricultural cluster industries matches the educational and training requirements of
anticipated jobs within the Agricultural cluster, as both are in the lower- and lower-middle rungs of
educational/training ladder.
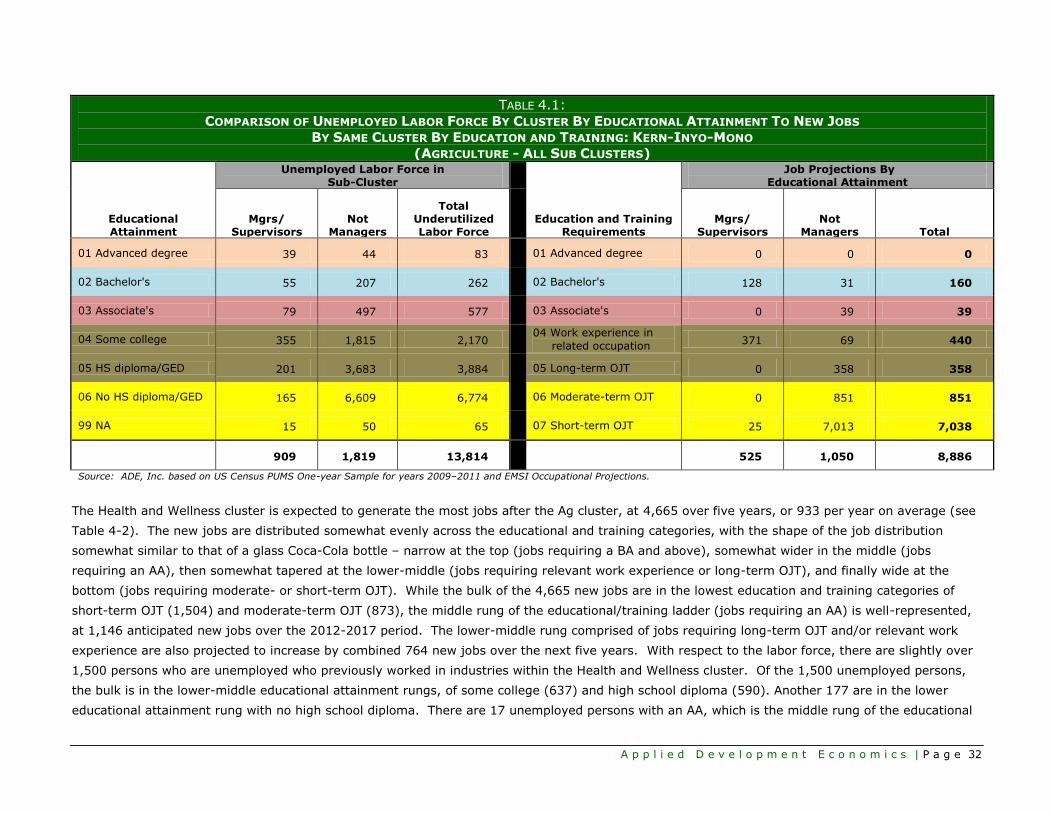
A p p l i e d D e v e l o p m e n t E c o n o m i c s | P a g e 32
TABLE 4.1:
COMPARISON OF UNEMPLOYED LABOR FORCE BY CLUSTER BY EDUCATIONAL ATTAINMENT TO NEW JOBS
BY SAME CLUSTER BY EDUCATION AND TRAINING: KERN-INYO-MONO
(AGRICULTURE - ALL SUB CLUSTERS)
Educational Attainment
Unemployed Labor Force in Sub-Cluster
Education and Training Requirements
Job Projections By Educational Attainment
Mgrs/ Supervisors
Not Managers
Total Underutilized Labor Force
Mgrs/ Supervisors
Not Managers Total
01 Advanced degree 39 44 83
01 Advanced degree 0 0 0
02 Bachelor's 55 207 262
02 Bachelor's 128 31 160
03 Associate's 79 497 577
03 Associate's 0 39 39
04 Some college 355 1,815 2,170
04 Work experience in
related occupation 371 69 440
05 HS diploma/GED 201 3,683 3,884
05 Long-term OJT 0 358 358
06 No HS diploma/GED 165 6,609 6,774
06 Moderate-term OJT 0 851 851
99 NA 15 50 65
07 Short-term OJT 25 7,013 7,038
909 1,819 13,814
525 1,050 8,886
Source: ADE, Inc. based on US Census PUMS One-year Sample for years 2009–2011 and EMSI Occupational Projections.
The Health and Wellness cluster is expected to generate the most jobs after the Ag cluster, at 4,665 over five years, or 933 per year on average (see
Table 4-2). The new jobs are distributed somewhat evenly across the educational and training categories, with the shape of the job distribution
somewhat similar to that of a glass Coca-Cola bottle – narrow at the top (jobs requiring a BA and above), somewhat wider in the middle (jobs
requiring an AA), then somewhat tapered at the lower-middle (jobs requiring relevant work experience or long-term OJT), and finally wide at the
bottom (jobs requiring moderate- or short-term OJT). While the bulk of the 4,665 new jobs are in the lowest education and training categories of
short-term OJT (1,504) and moderate-term OJT (873), the middle rung of the educational/training ladder (jobs requiring an AA) is well-represented,
at 1,146 anticipated new jobs over the 2012-2017 period. The lower-middle rung comprised of jobs requiring long-term OJT and/or relevant work
experience are also projected to increase by combined 764 new jobs over the next five years. With respect to the labor force, there are slightly over
1,500 persons who are unemployed who previously worked in industries within the Health and Wellness cluster. Of the 1,500 unemployed persons,
the bulk is in the lower-middle educational attainment rungs, of some college (637) and high school diploma (590). Another 177 are in the lower
educational attainment rung with no high school diploma. There are 17 unemployed persons with an AA, which is the middle rung of the educational

A p p l i e d D e v e l o p m e n t E c o n o m i c s | P a g e 33
attainment ladder. On the surface, with respect to educational qualifications, the unemployed labor force with previous experience in Health and
Wellness cluster industries matches the educational and training requirements of anticipated jobs within the cluster, although not precisely: the
distribution of the latter assumes a Coke bottle shape, whereas the unemployed labor force is most heavy around the lower-middle section.
Moreover, on the surface, there appears to be opportunities in store for unemployed persons with an AA, as the number of new jobs period requiring
an AA over the 2012-2017, at 1,146, vastly outnumbers the number of unemployed persons with health cluster experience (17).
TABLE 4.2:
COMPARISON OF UNEMPLOYED LABOR FORCE BY CLUSTER BY EDUCATIONAL ATTAINMENT TO NEW JOBS
BY SAME CLUSTER BY EDUCATION AND TRAINING: KERN-INYO-MONO
(HEALTHCARE - ALL SUB CLUSTERS)
Educational Attainment
Unemployed Labor Force in Sub-Cluster
Education and Training Requirements
Job Projections By Educational Attainment
Mgrs/ Supervisors
Not Managers
Total Underutilized Labor Force
Mgrs/ Supervisors
Not Managers Total
01 Advanced degree 0 81 81
01 Advanced degree 196 85 281
02 Bachelor's 27 10 37
02 Bachelor's 88 7 95
03 Associate's 0 17 17
03 Associate's 0 1,146 1,146
04 Some college 67 570 637
04 Work experience in
related occupation 446 317 763
05 HS diploma/GED 64 526 590
05 Long-term OJT 0 1 1
06 No HS diploma/GED 155 22 177
06 Moderate-term OJT 0 873 873
99 NA 0 0 0
07 Short-term OJT 460 1,045 1,504
313 627 1,539
1,190 2,381 4,665
Source: ADE, Inc. based on US Census PUMS One-year Sample for years 2009–2011 and EMSI Occupational Projections.

A p p l i e d D e v e l o p m e n t E c o n o m i c s | P a g e 34
The third fastest growing cluster is Energy, which is projected to grow by 3,158 new jobs, most of which are in the lowest educational/training
category, i.e. short-term OJT (1,259 new job between 2012-2017) and moderate-term OJT (389). The lower-middle career ladder rung consisting of
jobs requiring either relevant work experience (460) or long-term OJT (777) is also expected to increase by roughly 1,200 new jobs. Regarding the
underutilized labor force with experience in the Energy cluster, most are also in the lower-middle educational attainment rungs, with 150 with some
college and 319 with a high school diploma. On the surface, there appears to be a match between educational backgrounds of the labor force and
educational requirements of the new jobs in the Energy Cluster.
TABLE 4.3:
COMPARISON OF UNEMPLOYED LABOR FORCE BY CLUSTER BY EDUCATIONAL ATTAINMENT TO NEW JOBS
BY SAME CLUSTER BY EDUCATION AND TRAINING: KERN-INYO-MONO
(ENERGY - ALL SUB CLUSTERS)
Educational Attainment
Unemployed Labor Force in Sub-Cluster
Education and Training Requirements
Job Projections By Educational Attainment
Mgrs/ Supervisors
Not Managers
Total Underutilized Labor Force
Mgrs/ Supervisors
Not Managers Total
01 Advanced degree 0 39 39
01 Advanced degree 0 0 0
02 Bachelor's 17 42 59
02 Bachelor's 191 66 257
03 Associate's 0 0 0
03 Associate's 0 16 16
04 Some college 31 119 150
04 Work experience in
related occupation 276 183 460
05 HS diploma/GED 3 316 319
05 Long-term OJT 1 776 777
06 No HS diploma/GED 0 280 280
06 Moderate-term OJT 0 389 389
99 NA 0 0 0
07 Short-term OJT 0 1,259 1,259
50 101 847
469 938 3,158
Source: ADE, Inc. based on US Census PUMS One-year Sample for years 2009–2011 and EMSI Occupational Projections.

A p p l i e d D e v e l o p m e n t E c o n o m i c s | P a g e 35
Over the next 5 years, slightly over 1,300 new jobs (or 262 new jobs a year on average) are expected to be created in the Logistics cluster, while
there are an estimated 282 unemployed persons with background in logistics. The unemployed persons are mostly in the lowest educational
attainment levels of no high school diploma (217 unemployed persons out of 282 overall), a trend that generally corresponds to educational/training
requirements of the bulk of future new jobs in the Logistics cluster, i.e. short-term OJT (1,107, or 221 jobs per year).
TABLE 4.4:
COMPARISON OF UNEMPLOYED LABOR FORCE BY CLUSTER BY EDUCATIONAL ATTAINMENT TO NEW JOBS
BY SAME CLUSTER BY EDUCATION AND TRAINING: KERN-INYO-MONO
(LOGISTICS - ALL SUB CLUSTERS)
Educational Attainment
Unemployed Labor Force in Sub-Cluster
Education and Training Requirements
Job Projections By Educational Attainment
Mgrs/ Supervisors
Not Managers
Total Underutilized Labor Force
Mgrs/ Supervisors
Not Managers Total
01 Advanced degree 27 0 27
01 Advanced degree 0 0 0
02 Bachelor's 0 0 0
02 Bachelor's 31 16 47
03 Associate's 0 18 18
03 Associate's 0 0 0
04 Some college 0 20 20
04 Work experience in
related occupation 58 0 58
05 HS diploma/GED 0 0 0
05 Long-term OJT 0 15 15
06 No HS diploma/GED 0 217 217
06 Moderate-term OJT 0 84 84
99 NA 0 0 0
07 Short-term OJT 0 1,107 1,107
27 54 282
89 179 1,311
Source: ADE, Inc. based on US Census PUMS One-year Sample for years 2009–2011 and EMSI Occupational Projections.

A p p l i e d D e v e l o p m e n t E c o n o m i c s | P a g e 36
Over the next 5 years, slightly over 800 new jobs (or 166 new jobs a year on average) are expected to be created in the Manufacturing cluster
(excluding food processing, which is in the Agricultural Cluster), while there are an estimated 478 unemployed persons with background in
manufacturing. The unemployed persons are mostly in the lower-middle educational attainment levels with high school diploma (196 unemployed
persons) and some college (148), with another 134 unemployed persons in the lowest educational attainment run of no high school diploma. While
the unemployed Manufacturing cluster labor force is in the lower and lower-middle educational attainment categories, the new jobs are fairly
dispersed across all educational training categories, except the highest (Master’s degree or above), though new job opportunities coincide with where
the unemployed labor force is distributed along educational categories.
TABLE 4.5:
COMPARISON OF UNEMPLOYED LABOR FORCE BY CLUSTER BY EDUCATIONAL ATTAINMENT TO NEW JOBS
BY SAME CLUSTER BY EDUCATION AND TRAINING: KERN-INYO-MONO
(MANUFACTURING - ALL SUB CLUSTERS EXCEPT FOOD PROCESSING)
Educational Attainment
Unemployed Labor Force in Sub-Cluster
Education and Training Requirements
Job Projections By Educational Attainment
Mgrs/ Supervisors
Not Managers
Total Underutilized Labor Force
Mgrs/ Supervisors
Not Managers Total
01 Advanced degree 0 0 0
01 Advanced degree 0 0 0
02 Bachelor's 0 0 0
02 Bachelor's 60 133 193
03 Associate's 0 0 0
03 Associate's 0 48 48
04 Some college 43 105 148
04 Work experience in
related occupation 40 65 105
05 HS diploma/GED 9 187 196
05 Long-term OJT 10 117 127
06 No HS diploma/GED 0 134 134
06 Moderate-term OJT 0 228 228
99 NA 0 0 0
07 Short-term OJT 0 124 124
52 104 478
110 221 825
Source: ADE, Inc. based on US Census PUMS One-year Sample for years 2009–2011 and EMSI Occupational Projections.

A p p l i e d D e v e l o p m e n t E c o n o m i c s | P a g e 37
55.. TTRRAAIINNIINNGG RREESSOOUURRCCEESS
This section identifies whether training programs exist for the occupations in the growing industry
clusters, which are Agriculture, Health and Welfare, Energy, Logistics, and Manufacturing (Other). In
Table 5-1 below, occupations under any of the five clusters that are assigned a dash (“ --- “) are not
expected to grow. Occupations assigned a number including zero (“0”) are expected to grow and the
assigned number reflects the number of job training programs whose services are relevant to the
corresponding occupation. For example, social and human services assistant (OCCSOC 21-1093) is an
occupation within the health and Wellness cluster that does not require a college degree and instead
requires only short-term on-the-job-training; this occupation is expected grow expected to increase in
number, and there are three job training programs that are specific to this occupation. There will be an
increase in the number of registered nurses (OCCSOC 29-1111) in the near future but there are no job
training programs specifically targeting this occupation, according to the California EDD ETPL database.
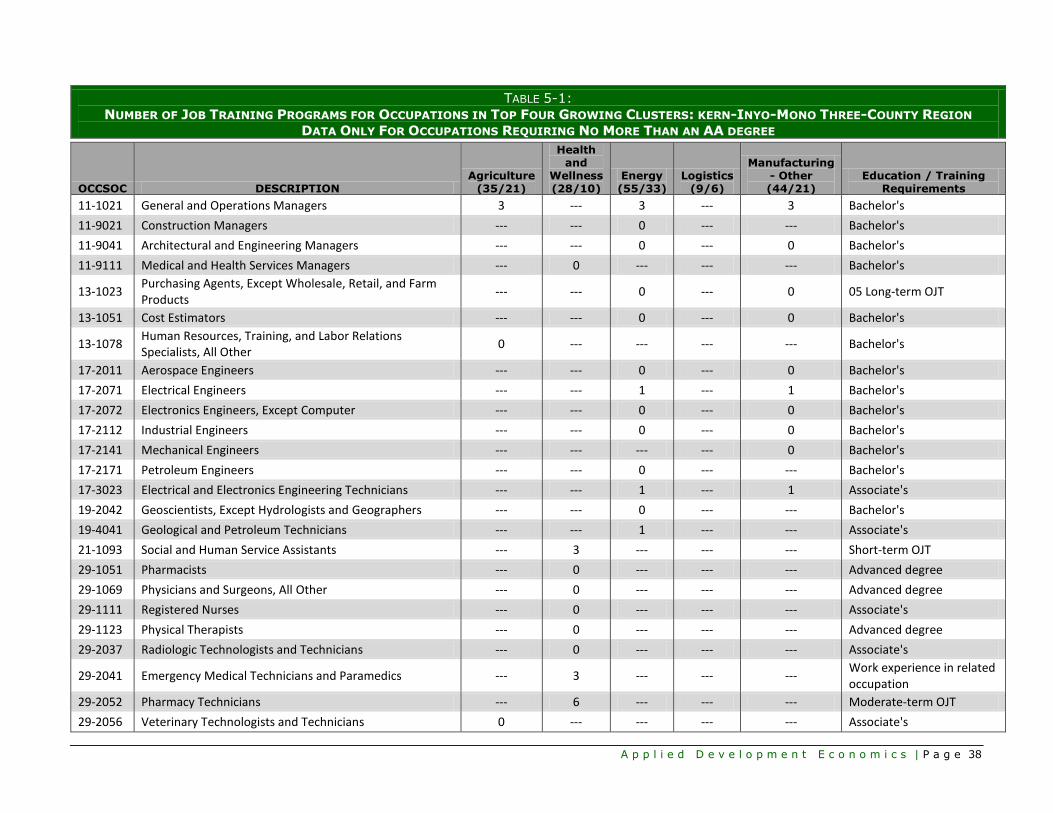
A p p l i e d D e v e l o p m e n t E c o n o m i c s | P a g e 38
TABLE 5-1:
NUMBER OF JOB TRAINING PROGRAMS FOR OCCUPATIONS IN TOP FOUR GROWING CLUSTERS: KERN-INYO-MONO THREE-COUNTY REGION
DATA ONLY FOR OCCUPATIONS REQUIRING NO MORE THAN AN AA DEGREE
OCCSOC DESCRIPTION Agriculture
(35/21)
Health and
Wellness (28/10)
Energy (55/33)
Logistics (9/6)
Manufacturing - Other (44/21)
Education / Training Requirements
11-1021 General and Operations Managers 3 --- 3 --- 3 Bachelor's
11-9021 Construction Managers --- --- 0 --- --- Bachelor's
11-9041 Architectural and Engineering Managers --- --- 0 --- 0 Bachelor's
11-9111 Medical and Health Services Managers --- 0 --- --- --- Bachelor's
13-1023 Purchasing Agents, Except Wholesale, Retail, and Farm Products
--- --- 0 --- 0 05 Long-term OJT
13-1051 Cost Estimators --- --- 0 --- 0 Bachelor's
13-1078 Human Resources, Training, and Labor Relations Specialists, All Other
0 --- --- --- --- Bachelor's
17-2011 Aerospace Engineers --- --- 0 --- 0 Bachelor's
17-2071 Electrical Engineers --- --- 1 --- 1 Bachelor's
17-2072 Electronics Engineers, Except Computer --- --- 0 --- 0 Bachelor's
17-2112 Industrial Engineers --- --- 0 --- 0 Bachelor's
17-2141 Mechanical Engineers --- --- --- --- 0 Bachelor's
17-2171 Petroleum Engineers --- --- 0 --- --- Bachelor's
17-3023 Electrical and Electronics Engineering Technicians --- --- 1 --- 1 Associate's
19-2042 Geoscientists, Except Hydrologists and Geographers --- --- 0 --- --- Bachelor's
19-4041 Geological and Petroleum Technicians --- --- 1 --- --- Associate's
21-1093 Social and Human Service Assistants --- 3 --- --- --- Short-term OJT
29-1051 Pharmacists --- 0 --- --- --- Advanced degree
29-1069 Physicians and Surgeons, All Other --- 0 --- --- --- Advanced degree
29-1111 Registered Nurses --- 0 --- --- --- Associate's
29-1123 Physical Therapists --- 0 --- --- --- Advanced degree
29-2037 Radiologic Technologists and Technicians --- 0 --- --- --- Associate's
29-2041 Emergency Medical Technicians and Paramedics --- 3 --- --- --- Work experience in related occupation
29-2052 Pharmacy Technicians --- 6 --- --- --- Moderate-term OJT
29-2056 Veterinary Technologists and Technicians 0 --- --- --- --- Associate's

A p p l i e d D e v e l o p m e n t E c o n o m i c s | P a g e 39
OCCSOC DESCRIPTION Agriculture
(35/21)
Health and
Wellness (28/10)
Energy (55/33)
Logistics (9/6)
Manufacturing - Other (44/21)
Education / Training Requirements
29-2061 Licensed Practical and Licensed Vocational Nurses --- 4 --- --- --- Work experience in related occupation
31-1011 Home Health Aides --- 4 --- --- --- Short-term OJT
31-1012 Nursing Aides, Orderlies, and Attendants --- 8 --- --- --- Work experience in related occupation
31-9091 Dental Assistants --- 3 --- --- --- Work experience in related occupation
31-9092 Medical Assistants --- 11 --- --- --- Moderate-term OJT
31-9095 Pharmacy Aides --- 1 --- --- --- Short-term OJT
31-9799 Healthcare Support Workers, All Other --- 0 --- --- --- Short-term OJT
35-2021 Food Preparation Workers 0 --- --- --- --- Short-term OJT
35-3021 Combined Food Preparation and Serving Workers, Including Fast Food
0 --- --- --- --- Short-term OJT
37-2021 Pest Control Workers 0 --- --- --- --- Moderate-term OJT
37-3011 Landscaping and Groundskeeping Workers 0 --- --- --- --- Short-term OJT
39-9021 Personal Care Aides --- 0 --- --- --- Short-term OJT
41-1011 First-Line Supervisors of Retail Sales Workers 2 2 --- --- --- Work experience in related occupation
41-2011 Cashiers 1 1 --- --- --- Short-term OJT
41-2031 Retail Salespersons --- 2 --- --- --- Short-term OJT
41-4011 Sales Representatives, Wholesale and Manufacturing, Technical and Scientific Products
--- 0 0 --- 0 Bachelor's
41-4012 Sales Representatives, Wholesale and Manufacturing, Except Technical and Scientific Products
0 --- 0 --- 0 Moderate-term OJT
43-1011 First-Line Supervisors of Office and Administrative Support Workers
2 2 --- 2 2 Work experience in related occupation
43-3021 Billing and Posting Clerks --- 4 --- --- 4 Short-term OJT
43-3031 Bookkeeping, Accounting, and Auditing Clerks 1 --- 1 --- 1 Moderate-term OJT
43-4051 Customer Service Representatives 4 --- --- --- 4 Short-term OJT
43-4171 Receptionists and Information Clerks --- 3 --- --- 3 Short-term OJT
43-4181 Reservation and Transportation Ticket Agents and Travel Clerks
--- --- --- --- --- Short-term OJT
43-5011 Cargo and Freight Agents 0 --- --- 0 --- Short-term OJT

A p p l i e d D e v e l o p m e n t E c o n o m i c s | P a g e 40
OCCSOC DESCRIPTION Agriculture
(35/21)
Health and
Wellness (28/10)
Energy (55/33)
Logistics (9/6)
Manufacturing - Other (44/21)
Education / Training Requirements
43-5021 Couriers and Messengers --- --- --- 0 --- Short-term OJT
43-5032 Dispatchers, Except Police, Fire, and Ambulance 0 --- --- --- 0 Moderate-term OJT
43-5071 Shipping, Receiving, and Traffic Clerks --- --- 0 0 0 Short-term OJT
43-5081 Stock Clerks and Order Fillers 0 0 0 --- 0 Short-term OJT
43-6013 Medical Secretaries --- 9 --- --- --- Moderate-term OJT
43-6014 Secretaries and Administrative Assistants, Except Legal, Medical, and Executive --- --- 2 --- 2 Short-term OJT
43-9061 Office Clerks, General 5 5 5 --- 5 Short-term OJT
45-2041 Graders and Sorters, Agricultural Products 0 --- --- --- --- Short-term OJT
45-2092 Farmworkers and Laborers, Crop, Nursery, and Greenhouse 0 --- --- --- --- Short-term OJT
47-1011 First-Line Supervisors of Construction Trades and Extraction Workers --- --- 0 --- ---
Work experience in related occupation
47-2031 Carpenters --- --- 1 --- --- Long-term OJT
47-2051 Cement Masons and Concrete Finishers --- --- 1 --- 1 Moderate-term OJT
47-2061 Construction Laborers --- --- 1 --- 1 Short-term OJT
47-2073 Operating Engineers and Other Construction Equipment Operators --- --- 1 --- 1 Moderate-term OJT
47-2081 Drywall and Ceiling Tile Installers --- --- --- --- --- Moderate-term OJT
47-2082 Tapers --- --- --- --- --- Moderate-term OJT
47-2111 Electricians --- --- 0 --- 0 Long-term OJT
47-2151 Pipelayers --- --- 0 --- --- Short-term OJT
47-2152 Plumbers, Pipefitters, and Steamfitters --- --- 1 --- --- Long-term OJT
47-2161 Plasterers and Stucco Masons --- --- --- --- --- Long-term OJT
47-2181 Roofers --- --- --- --- --- Moderate-term OJT
47-3013 Helpers--Electricians --- --- 1 --- --- Short-term OJT
47-3015 Helpers--Pipelayers, Plumbers, Pipefitters, and Steamfitters --- --- 0 --- --- Short-term OJT
47-5011 Derrick Operators, Oil and Gas --- --- 0 --- --- Short-term OJT
47-5012 Rotary Drill Operators, Oil and Gas --- --- 0 --- --- Moderate-term OJT
47-5013 Service Unit Operators, Oil, Gas, and Mining --- --- 0 --- --- Moderate-term OJT
47-5021 Earth Drillers, Except Oil and Gas --- --- 0 --- --- Moderate-term OJT

A p p l i e d D e v e l o p m e n t E c o n o m i c s | P a g e 41
OCCSOC DESCRIPTION Agriculture
(35/21)
Health and
Wellness (28/10)
Energy (55/33)
Logistics (9/6)
Manufacturing - Other (44/21)
Education / Training Requirements
47-5071 Roustabouts, Oil and Gas --- --- 2 --- --- Moderate-term OJT
47-5081 Helpers--Extraction Workers --- --- 0 --- --- Short-term OJT
49-1011 First-Line Supervisors of Mechanics, Installers, and Repairers --- --- 0 --- 0
Work experience in related occupation
49-2022 Telecommunications Equipment Installers and Repairers, Except Line Installers --- --- 0 --- ---
Work experience in related occupation
49-3011 Aircraft Mechanics and Service Technicians --- --- --- --- 3
Work experience in related occupation
49-3031 Bus and Truck Mechanics and Diesel Engine Specialists 1 --- --- --- 1
Work experience in related occupation
49-3042 Mobile Heavy Equipment Mechanics, Except Engines --- --- 1 --- --- Long-term OJT
49-3043 Rail Car Repairers --- --- --- 0 --- Long-term OJT
49-9041 Industrial Machinery Mechanics 4 --- 4 --- 4 Long-term OJT
49-9051 Electrical Power-Line Installers and Repairers --- --- 2 --- --- Long-term OJT
49-9052 Telecommunications Line Installers and Repairers --- --- 0 --- --- Long-term OJT
49-9071 Maintenance and Repair Workers, General 0 --- 0 --- 0 Moderate-term OJT
51-1011 First-Line Supervisors of Production and Operating Workers 0 --- 0 --- 0
Work experience in related occupation
51-2022 Electrical and Electronic Equipment Assemblers --- --- 0 --- 0 Short-term OJT
51-2023 Electromechanical Equipment Assemblers --- --- 0 --- 0 Short-term OJT
51-2092 Team Assemblers 1 --- 1 --- 1 Moderate-term OJT
51-2093 Timing Device Assemblers and Adjusters --- --- 0 --- --- Moderate-term OJT
51-3021 Butchers and Meat Cutters 0 --- --- --- --- Long-term OJT
51-3092 Food Batchmakers 0 --- --- --- --- Short-term OJT
51-4041 Machinists --- 2 --- --- 2 Long-term OJT
51-4121 Welders, Cutters, Solderers, and Brazers --- --- 17 --- 17
Work experience in related occupation
51-8013 Power Plant Operators --- --- --- --- --- Long-term OJT
51-8093 Petroleum Pump System Operators, Refinery Operators, and Gaugers --- --- 0 --- --- Long-term OJT
51-9061 Inspectors, Testers, Sorters, Samplers, and Weighers --- --- 1 --- 1 Moderate-term OJT
51-9111 Packaging and Filling Machine Operators and Tenders 0 --- --- --- 0 Moderate-term OJT
51-9399 Production Workers, All Other 0 --- --- --- --- Moderate-term OJT

A p p l i e d D e v e l o p m e n t E c o n o m i c s | P a g e 42
OCCSOC DESCRIPTION Agriculture
(35/21)
Health and
Wellness (28/10)
Energy (55/33)
Logistics (9/6)
Manufacturing - Other (44/21)
Education / Training Requirements
53-1031 First-Line Supervisors of Transportation and Material-Moving Machine and Vehicle Operators 0 --- --- --- 0
Work experience in related occupation
53-3021 Bus Drivers, Transit and Intercity --- --- --- --- --- Moderate-term OJT
53-3022 Bus Drivers, School or Special Client --- --- --- 0 --- Moderate-term OJT
53-3031 Driver/Sales Workers 0 --- --- --- --- Short-term OJT
53-3032 Heavy and Tractor-Trailer Truck Drivers 3 --- 3 --- 3 Short-term OJT
53-3033 Light Truck or Delivery Services Drivers 1 --- 1 1 1 Short-term OJT
53-3041 Taxi Drivers and Chauffeurs --- --- --- 1 --- Short-term OJT
53-6099 Transportation Workers, All Other --- --- --- --- --- Short-term OJT
53-7032 Excavating and Loading Machine and Dragline Operators --- --- 0 --- --- Moderate-term OJT
53-7051 Industrial Truck and Tractor Operators 2 --- --- --- 2 Short-term OJT
53-7062 Laborers and Freight, Stock, and Material Movers, Hand 0 --- 0 0 0 Short-term OJT
53-7064 Packers and Packagers, Hand 0 --- --- --- --- Short-term OJT Source: Applied Development Economics, based on EMSI and California EDD LMID

A p p l i e d D e v e l o p m e n t E c o n o m i c s | P a g e 43
There are approximately 35 occupations that are expected to increase in numbers within the Agricultural
cluster. For 21 of these occupations, there are no job training programs, according to the California EDD ETPL
database. There are 28 occupations within Health and Wellness; for 10 of these growing occupations, there
are no job training programs. There are 55 growing occupations in Energy and, for 33 of these occupations,
there are no job training programs.
Below we identify the WIA-approved job training providers that correspond to the occupational needs in the
table above (Table 5.2). There are 12 job training programs providing servicing that are relevant to growing
occupations in the Agricultural cluster, 15 providers whose services are relevant to Health and Wellness
occupations, 19 providers who services are aimed at occupations in Energy, and 19 job training providers
who programs are relevant to growing occupations in Manufacturing.
TABLE 5-2:
SPECIFIC JOB TRAINING PROVIDERS OFFERING TRAINING FOR OCCUPATIONS IDENTIFIED IN TOP FOUR GROWING
CLUSTERS
Agriculture (12) Health and
Wellness (15) Energy (19) Logistics (3) Manufacturing (19)
DASMESH TRUCK DRIVING SCHOOL, BAKERSFIELD CA 93307
BOSTON REED HANFORD CA 93230
AMERICAN WELL CONTROL & SAFETY BAKERSFIELD CA 93308
KERN COMMUNITY COLLEGE DIST. RIDGECREST CA 93555
ASSOC BLDRS&CONTRACTRS CENT CA, BAKERSFIELD CA 93308
GOODWILL INDUSTRIES BAKERSFIELD CA 93389
CA COLL OF VOCATIONAL CAREERS BAKERSFIELD CA 93301
ASSOC BLDRS&CONTRACTRS CENT CA BAKERSFIELD CA 93308
KERN HIGH SCHOOL DISTRICT BAKERSFIELD CA 93301
DASMESH TRUCK DRIVING SCHOOL, BAKERSFIELD CA 93307
INSTITUTO HISPANO AMERICANO BAKERSFIELD CA 93301
CLINICAL TRAINING INSTITUTE BAKERSFIELD CA 93309
DASMESH TRUCK DRIVING SCHOOL BAKERSFIELD CA 93307
WESTERN TRUCK SCHOOL BAKERSFIELD CA 93308
GOODWILL INDUSTRIES BAKERSFIELD CA 93389
KAPLAN COLLEGE, BAKERSFIELD BAKERSFIELD CA 93304
DELANO ADULT SCHOOL DELANO CA 93215
INSTITUTO HISPANO AMERICANO BAKERSFIELD CA 93301
INSTITUTO HISPANO AMERICANO BAKERSFIELD CA 93301
KERN COMMUNITY COLLEGE DIST. RIDGECREST CA 93555
INSTITUTO HISPANO AMERICANO BAKERSFIELD CA 93301
JOHN LOPEZ WELDING SCHOOL BAKERSFIELD CA 93312
JOHN LOPEZ WELDING SCHOOL BAKERSFIELD CA 93312
KERN HIGH SCHOOL DISTRICT BAKERSFIELD CA 93301
KAPLAN COLLEGE, BAKERSFIELD BAKERSFIELD CA 93304
KAPLAN COLLEGE, BAKERSFIELD BAKERSFIELD CA 93304
KAPLAN COLLEGE, BAKERSFIELD BAKERSFIELD CA 93304
MEXICAN AMER OPPORTUNITY FOUND BAKERSFIELD CA 93301
KERN COMMUNITY COLLEGE DIST. RIDGECREST CA 93555
KERN COMMUNITY COLLEGE DIST. RIDGECREST CA 93555
KERN COMMUNITY COLLEGE DIST. RIDGECREST CA 93555
PROTEUS, INC DELANO CA 93215
KERN HIGH SCHOOL DISTRICT BAKERSFIELD CA 93301
KERN HIGH SCHOOL DISTRICT BAKERSFIELD CA 93301
KERN HIGH SCHOOL DISTRICT BAKERSFIELD CA 93301
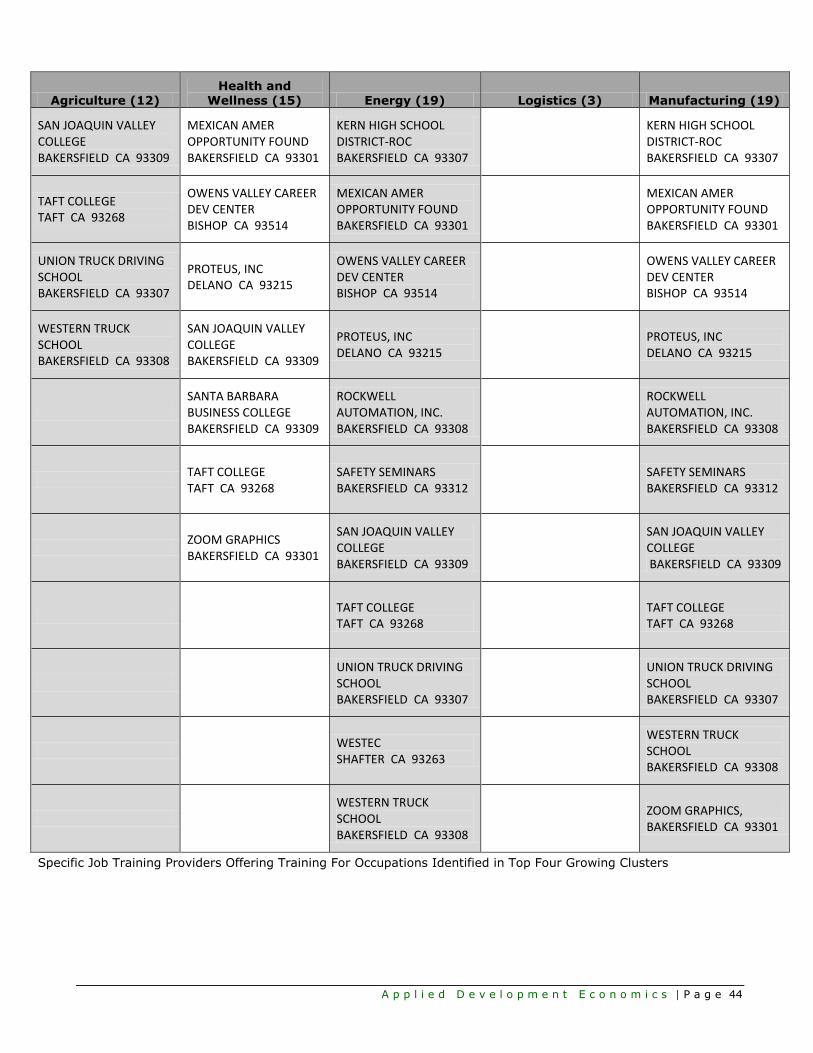
A p p l i e d D e v e l o p m e n t E c o n o m i c s | P a g e 44
Agriculture (12) Health and
Wellness (15) Energy (19) Logistics (3) Manufacturing (19)
SAN JOAQUIN VALLEY COLLEGE BAKERSFIELD CA 93309
MEXICAN AMER OPPORTUNITY FOUND BAKERSFIELD CA 93301
KERN HIGH SCHOOL DISTRICT-ROC BAKERSFIELD CA 93307
KERN HIGH SCHOOL DISTRICT-ROC BAKERSFIELD CA 93307
TAFT COLLEGE TAFT CA 93268
OWENS VALLEY CAREER DEV CENTER BISHOP CA 93514
MEXICAN AMER OPPORTUNITY FOUND BAKERSFIELD CA 93301
MEXICAN AMER OPPORTUNITY FOUND BAKERSFIELD CA 93301
UNION TRUCK DRIVING SCHOOL BAKERSFIELD CA 93307
PROTEUS, INC DELANO CA 93215
OWENS VALLEY CAREER DEV CENTER BISHOP CA 93514
OWENS VALLEY CAREER DEV CENTER BISHOP CA 93514
WESTERN TRUCK SCHOOL BAKERSFIELD CA 93308
SAN JOAQUIN VALLEY COLLEGE BAKERSFIELD CA 93309
PROTEUS, INC DELANO CA 93215
PROTEUS, INC DELANO CA 93215
SANTA BARBARA BUSINESS COLLEGE BAKERSFIELD CA 93309
ROCKWELL AUTOMATION, INC. BAKERSFIELD CA 93308
ROCKWELL AUTOMATION, INC. BAKERSFIELD CA 93308
TAFT COLLEGE TAFT CA 93268
SAFETY SEMINARS BAKERSFIELD CA 93312
SAFETY SEMINARS BAKERSFIELD CA 93312
ZOOM GRAPHICS BAKERSFIELD CA 93301
SAN JOAQUIN VALLEY COLLEGE BAKERSFIELD CA 93309
SAN JOAQUIN VALLEY COLLEGE BAKERSFIELD CA 93309
TAFT COLLEGE TAFT CA 93268
TAFT COLLEGE TAFT CA 93268
UNION TRUCK DRIVING SCHOOL BAKERSFIELD CA 93307
UNION TRUCK DRIVING SCHOOL BAKERSFIELD CA 93307
WESTEC SHAFTER CA 93263
WESTERN TRUCK SCHOOL BAKERSFIELD CA 93308
WESTERN TRUCK SCHOOL BAKERSFIELD CA 93308
ZOOM GRAPHICS, BAKERSFIELD CA 93301
Specific Job Training Providers Offering Training For Occupations Identified in Top Four Growing Clusters

A p p l i e d D e v e l o p m e n t E c o n o m i c s | P a g e 45
AAPPPPEENNDDIIXX AA:: CCLLUUSSTTEERR DDEEFFIINNIITTIIOONNSS
AGRICULTURE CLUSTER
CLUSTER COMPONENTS BY NAICS CODE
Agriculture Cluster - Production
111 Crop Production
112 Animal Production
1141 Fishing
115112 Soil Preparation, Planting, Cultivating
115113 Crop Harvesting, Primarily by Machine
115114 Postharvest Crop Activities
115115 Farm Labor Contractors and Crew Leaders
115116 Farm Mgmt Svcs
115210 Support Activities for Animal Production
Agriculture Cluster - Processing
311 Food Manufacturing
312 Beverage and Tobacco Product Manufacturing
321920 Wood Container and Pallet Mfg
322211 Corrugated and Solid Fiber Box Mfg
Agriculture Cluster - Distribution
424410 General Line Grocery Merchant Wholesalers
424430 Dairy Product Wholesalers
424450 Confectionery Wholesalers
424470 Meat & Meat Product Wholesalers
424480 Fresh Fruit/Veg Wholesalers
424490 Other Grocery Wholesalers
424820 Wine, Alcoholic Beverage Wholesalers
424910 Farm Supplies Wholesalers
424930 Flower, Nursery Stock, and Florists' Supplies Merchant Wholesalers
445110 Supermarkets, Other Grocery
445120 Convenience Stores
445210 Meat Markets
445230 Fruit and Vegetable Markets
445291 Baked Goods Stores
445292 Confectionery and Nut Stores
445299 All Other Specialty Food Stores
445310 Beer, Wine, and Liquor Stores
481111 Scheduled Passenger Air Transportation
481211 Nonscheduled Chartered Passenger Air Trans
482 Rail Transportation
484110 General Freight Trucking, Local
484121 General Freight Trucking, Long-Distance, Truckload
484122 General Freight Trucking, Long-Distance, Less Than Truckload
484220 Specialized Freight Trucking, Local
484230 Specialized Freight Trucking, Long-Dist.
488119 Other Airport Operations
488190 Other Support Activities for Air Transportation
488510 Freight Transportation Arrangement
493110 General Warehousing & Storage
493120 Refrigerated Warehousing and Storage

A p p l i e d D e v e l o p m e n t E c o n o m i c s | P a g e 46
AAPPPPEENNDDIIXX AA:: CCOONNTTIINNUUEEDD
AGRICULTURE CLUSTER (CONTINUED)
CLUSTER COMPONENTS BY NAICS CODE
Agriculture Cluster - Support
221310 Water Supply and Irrigation Systems
237110 Water & Sewer Line & Related Construction
325314 Fertilizer (Mixing Only) Manufacturing
325320 Pesticide and Other Agricultural Chemical Manufacturing
333111 Farm Machinery, Equip Mfg
423820 Farm, Garden Machinery, Equip Wholesalers
423830 Industrial Machinery and Equipment Merchant Wholesalers
423840 Industrial Supplies Merchant Wholesalers
423850 Service Establishment Equipment and Supplies Merchant Wholesalers
444220 Nursery, Garden Ctr, Farm Supply Stores
522292 Real Estate Credit
532490 Other Commercial and Industrial Machinery and Equipment Rental and Leasing
541380 Testing Laboratories
541613 Marketing Consulting Services
541840 Media Representatives
541870 Advertising Material Distribution Services
541890 Other Services Related to Advertising
541940 Veterinary Services
551114 Corporate, Subsidiary, Regional Offices
561110 Office Administrative Services
561311 Employment Placement Agencies
561320 Temporary Help Services
561710 Exterminating and Pest Control Services
561730 Landscaping Services
562920 Materials Recovery Facilities
811310 Commercial and Industrial Machinery and Equipment (except Automotive and
Electronic) Repair and Maintenance Source: ADE, Inc.; data from EMSI.
Notes: Industries included in the cluster each account for a minimum of 10 jobs.

A p p l i e d D e v e l o p m e n t E c o n o m i c s | P a g e 47
AAPPPPEENNDDIIXX AA:: CCOONNTTIINNUUEEDD
ENERGY CLUSTER
CLUSTER COMPONENTS BY NAICS CODE ALTERNATIVE ENERGY GENERATION/PRODUCTION
23711 Water and Sewer Line and Related Structures Construction
311223 Other Oilseed Processing
23816 Roofing Contractors 325193 Ethyl Alcohol Manufacturing
ALTERNTIVE ENERGY DISTRIBUTION
423610 Electrical Apparatus and Equipment, Wiring Supplies, and Related Equipment Merchant Wholesalers
423720 Plumbing and Heating Equipment and Supplies (Hydronics) Merchant Wholesalers
423690 Other Electronic Parts and Equipment Merchant Wholesalers
ENERGY EFFICIENCY
23821 Electrical Contractors and Other Wiring Installation Contractors
23831 Drywall and Insulation Contractors
23822 Plumbing, Heating, and Air-Conditioning Contractors
EQUIPMENT MANUFACTURING
333132 Oil and Gas Field Machinery and Equipment Manufacturing
335110 Electric Lamp Bulb and Part Manufacturing
333414 Heating Equipment (except Warm Air Furnaces) Manufacturing
335121 Residential Electric Lighting Fixture Manufacturing
333611 Turbine and Turbine Generator Set Units Manufacturing
335122 Commercial, Industrial, and Institutional Electric Lighting Fixture Manufacturing
334512 Automatic Environmental Control Manufacturing for Residential, Commercial, and Appliance Use
335129 Other Lighting Equipment Manufacturing
334515 Instrument Manufacturing for Measuring and Testing Electricity and Electrical Signals
335311 Power, Distribution, and Specialty Transformer Manufacturing
334517 Irradiation Apparatus Manufacturing
PETROLEUM PRODUCTION & PETROLEUM DISTRIBUTION
211111 Crude Petroleum and Natural Gas Extraction 424710 Petroleum Bulk Stations and Terminals
211112 Natural Gas Liquid Extraction 424720 Petroleum and Petroleum Products Merchant Wholesalers (except Bulk Stations and Terminals)
212399 All Other Nonmetallic Mineral Mining 486110 Pipeline Transportation of Crude Oil
213111 Drilling Oil and Gas Wells 486210 Pipeline Transportation of Natural Gas
324110 Petroleum Refineries 486910 Pipeline Transportation of Refined Petroleum Products
324199 All Other Petroleum and Coal Products Manufacturing
POWER GENERATION AND TRANSMISSION
221111 Hydroelectric Power Generation 221122 Electric Power Distribution
221112 Fossil Fuel Electric Power Generation 221210 Natural Gas Distribution
221113 Nuclear Electric Power Generation 237120
Oil and Gas Pipeline and Related Structures Construction
221119 Other Electric Power Generation 237130
Power and Communication Line and Related Structures Construction
221121 Electric Bulk Power Transmission and Control
RESEARCH & SERVICES
541 Professional, Scientific, and Technical Services 533110 Lessors of Nonfinancial Intangible Assets (except Copyrighted Works)
523910 Miscellaneous Intermediation 811219 Other Electronic and Precision Equipment Repair and Maintenance
523999 Miscellaneous Financial Investment Activities 811310 Commercial and Industrial Machinery and Equipment (except Automotive and Electronic) Repair and Maintenance

A p p l i e d D e v e l o p m e n t E c o n o m i c s | P a g e 48
AAPPPPEENNDDIIXX AA:: CCOONNTTIINNUUEEDD
HEALTH AND WELLNESS CLUSTER
CLUSTER COMPONENTS BY NAICS CODE HEALTH CARE DELIVERY
621111 Offices of Physicians (except Mental Health Specialists)
621512 Diagnostic Imaging Centers
621112 Offices of Physicians, Mental Health Specialists 621512 Diagnostic Imaging Centers
621210 Offices of Dentists 621610 Home Health Care Services
621310 Offices of Chiropractors 621910 Ambulance Services
621320 Offices of Optometrists 621991 Blood and Organ Banks
621330 Offices of Mental Health Practitioners (except Physicians)
622110 General Medical and Surgical Hospitals
621340 Offices of Physical, Occupational and Speech Therapists, and Audiologists
622210 Psychiatric and Substance Abuse Hospitals
621391 Offices of Podiatrists 622310 Specialty (except Psychiatric and Substance Abuse) Hospitals
621410 Family Planning Centers 623110 Nursing Care Facilities
621420 Outpatient Mental Health and Substance Abuse Centers
623210 Residential Mental Retardation Facilities
621491 HMO Medical Centers 623220 Residential Mental Health and Substance Abuse Facilities
621492 Kidney Dialysis Centers 623311 Continuing Care Retirement Communities
621493 Freestanding Ambulatory Surgical and Emergency Centers
623312 Homes for the Elderly
621498 All Other Outpatient Care Centers 623990 Other Residential Care Facilities
621511 Medical Laboratories 624310 Vocational Rehabilitation Services
MEDICAL DEVICE MANUFACTURING
339112 Surgical and Medical Instrument Manufacturing 339115 Ophthalmic Goods Manufacturing
339113 Surgical Appliance and Supplies Manufacturing 339116 Dental Laboratories
339114 Dental Equipment and Supplies Manufacturing
PHARMACEUTICALS
325411 Medicinal and Botanical Manufacturing 325413 In-Vitro Diagnostic Substance Manufacturing
325412 Pharmaceutical Preparation Manufacturing 325414 Biological Product (except Diagnostic) Manufacturing
SUPPLIES AND SERVICES
423450 Medical, Dental, and Hospital Equipment and Supplies Merchant Wholesalers
424210 Drugs and Druggists' Sundries Merchant Wholesalers
423460 Ophthalmic Goods Merchant Wholesalers 813212 Voluntary Health Organizations
423490 Other Professional Equipment and Supplies Merchant Wholesalers
WELLNESS AND FITNESS
446110 Pharmacies and Drug Stores 532291 Home Health Equipment Rental
446130 Optical Goods Stores 621399 Offices of All Other Miscellaneous Health Practitioners
446191 Food (Health) Supplement Stores 621999 All Other Miscellaneous Ambulatory Health Care Services
446199 All Other Health and Personal Care Stores 812191 Diet and Weight Reducing Centers

A p p l i e d D e v e l o p m e n t E c o n o m i c s | P a g e 49
AAPPPPEENNDDIIXX AA:: CCOONNTTIINNUUEEDD
LOGISTICS CLUSTER
CLUSTER COMPONENTS BY NAICS CODE AIR, RAIL, WATER TRANSPORTATION
481111 Scheduled Passenger Air Transportation 483211 Inland Water Freight Transportation
481112 Scheduled Freight Air Transportation 483212 Inland Water Passenger Transportation
481211 Nonscheduled Chartered Passenger Air Transportation
488111 Air Traffic Control
481212 Nonscheduled Chartered Freight Air Transportation
488119 Other Airport Operations
481219 Other Nonscheduled Air Transportation 488190 Other Support Activities for Air Transportation
482 Rail Transportation 488210 Support Activities for Rail Transportation
483111 Deep Sea Freight Transportation 488310 Port and Harbor Operations
483112 Deep Sea Passenger Transportation 488320 Marine Cargo Handling
483113 Coastal and Great Lakes Freight Transportation 488330 Navigational Services to Shipping
483114 Coastal and Great Lakes Passenger Transportation
488390 Other Support Activities for Water Transportation
FREIGHT & WAREHOUSING
484110 General Freight Trucking, Local 493110 General Warehousing and Storage
484121 General Freight Trucking, Long-Distance, Truckload
493120 Refrigerated Warehousing and Storage
484122 General Freight Trucking, Long-Distance, Less Than Truckload
493130 Farm Product Warehousing and Storage
484210 Used Household and Office Goods Moving 493190 Other Warehousing and Storage
484220 Specialized Freight (except Used Goods) Trucking, Local
541614 Process, Physical Distribution, and Logistics Consulting Services
484230 Specialized Freight (except Used Goods) Trucking, Long-Distance
561910 Packaging and Labeling Services
OTHER SERVICES
488410 Motor Vehicle Towing 488999 All Other Support Activities for Transportation
488490 Other Support Activities for Road Transportation
492110 Couriers and Express Delivery Services
488510 Freight Transportation Arrangement 492210 Local Messengers and Local Delivery
488991 Packing and Crating
RELATED MANUFACTURING
336120 Heavy Duty Truck Manufacturing 336611 Ship Building and Repairing
336510 Railroad Rolling Stock Manufacturing 336612 Boat Building
TRANSIT
485111 Mixed Mode Transit Systems 485310 Taxi Service
485112 Commuter Rail Systems 485410 School and Employee Bus Transportation
485113 Bus and Other Motor Vehicle Transit Systems 485510 Charter Bus Industry
485119 Other Urban Transit Systems 485991 Special Needs Transportation
485210 Interurban and Rural Bus Transportation 485999 All Other Transit and Ground Passenger Transportation

A p p l i e d D e v e l o p m e n t E c o n o m i c s | P a g e 50
AAPPPPEENNDDIIXX AA:: CCOONNTTIINNUUEEDD
MANUFACTURING CLUSTER (CROSS-CLUSTER)
CLUSTER COMPONENTS BY NAICS CODE HEALTH & WELLNESS MANUFACTURING
339112 Surgical and Medical Instrument Manufacturing 325411 Medicinal and Botanical Manufacturing
339113 Surgical Appliance and Supplies Manufacturing 325412 Pharmaceutical Preparation Manufacturing
339114 Dental Equipment and Supplies Manufacturing 325413 In-Vitro Diagnostic Substance Manufacturing
339115 Ophthalmic Goods Manufacturing 325414 Biological Product (except Diagnostic) Manufacturing
339116 Dental Laboratories
FOOD PROCESSING
311111 Dog and Cat Food Manufacturing 311920 Coffee and Tea Manufacturing
311119 Other Animal Food Manufacturing 311930 Flavoring Syrup and Concentrate Manufacturing
311211 Flour Milling 311941 Mayonnaise, Dressing, and Other Prepared Sauce Manufacturing
311212 Rice Milling 311942 Spice and Extract Manufacturing
311213 Malt Manufacturing 311991 Perishable Prepared Food Manufacturing
311221 Wet Corn Milling 311999 All Other Miscellaneous Food Manufacturing
311222 Soybean Processing 312111 Soft Drink Manufacturing
311223 Other Oilseed Processing 312112 Bottled Water Manufacturing
311225 Fats and Oils Refining and Blending 312113 Ice Manufacturing
311230 Breakfast Cereal Manufacturing 312120 Breweries
311311 Sugarcane Mills 312130 Wineries
311312 Cane Sugar Refining 312140 Distilleries
311313 Beet Sugar Manufacturing 312210 Tobacco Stemming and Redrying
311320 Chocolate and Confectionery Manufacturing from Cacao Beans
312221 Cigarette Manufacturing
311330 Confectionery Manufacturing from Purchased Chocolate
312229 Other Tobacco Product Manufacturing
311340 Nonchocolate Confectionery Manufacturing 313111 Yarn Spinning Mills
311411 Frozen Fruit, Juice, and Vegetable Manufacturing
313112 Yarn Texturizing, Throwing, and Twisting Mills
311412 Frozen Specialty Food Manufacturing 313113 Thread Mills
311421 Fruit and Vegetable Canning 313210 Broadwoven Fabric Mills
311422 Specialty Canning 313221 Narrow Fabric Mills
311423 Dried and Dehydrated Food Manufacturing 313230 Nonwoven Fabric Mills
311511 Fluid Milk Manufacturing 313241 Weft Knit Fabric Mills
311512 Creamery Butter Manufacturing 313249 Other Knit Fabric and Lace Mills
311513 Cheese Manufacturing 316110 Leather and Hide Tanning and Finishing
311514 Dry, Condensed, and Evaporated Dairy Product Manufacturing
321113 Sawmills
311520 Ice Cream and Frozen Dessert Manufacturing 321920 Wood Container and Pallet Manufacturing
311611 Animal (except Poultry) Slaughtering 322211 Corrugated and Solid Fiber Box Manufacturing
311612 Meat Processed from Carcasses 322212 Folding Paperboard Box Manufacturing
311613 Rendering and Meat Byproduct Processing 322213 Setup Paperboard Box Manufacturing
311615 Poultry Processing 322214 Fiber Can, Tube, Drum, and Similar Products Manufacturing
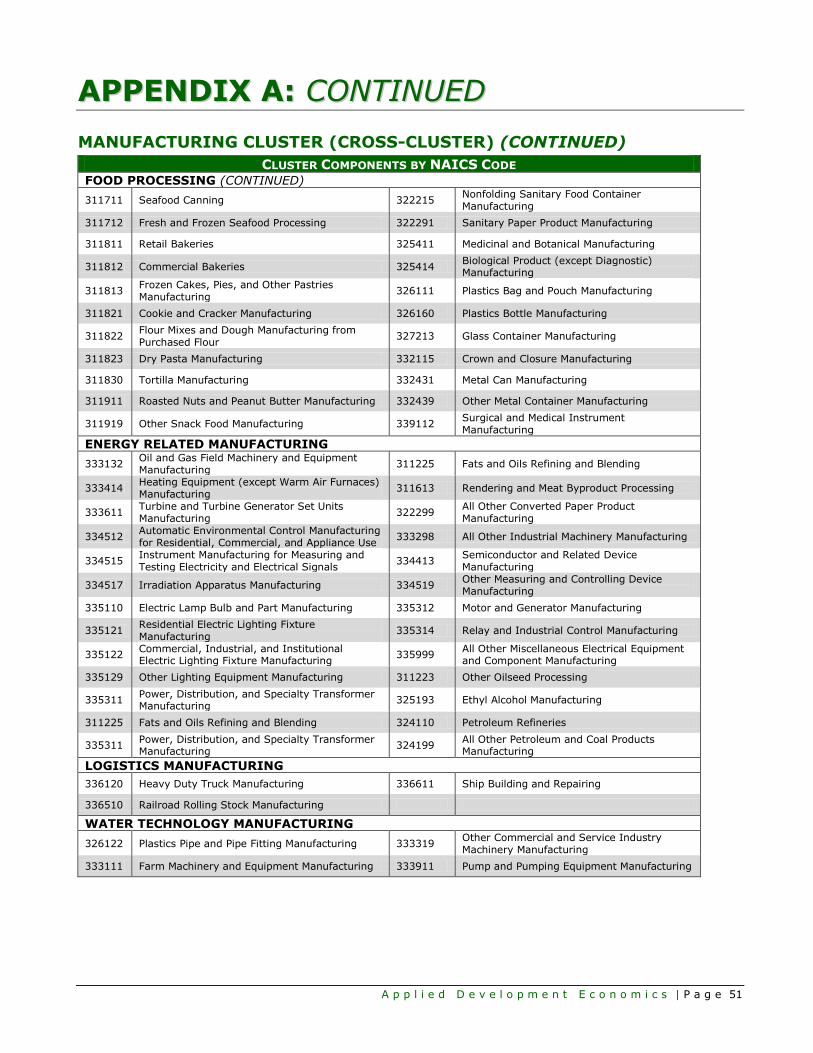
A p p l i e d D e v e l o p m e n t E c o n o m i c s | P a g e 51
AAPPPPEENNDDIIXX AA:: CCOONNTTIINNUUEEDD
MANUFACTURING CLUSTER (CROSS-CLUSTER) (CONTINUED)
CLUSTER COMPONENTS BY NAICS CODE FOOD PROCESSING (CONTINUED)
311711 Seafood Canning 322215 Nonfolding Sanitary Food Container Manufacturing
311712 Fresh and Frozen Seafood Processing 322291 Sanitary Paper Product Manufacturing
311811 Retail Bakeries 325411 Medicinal and Botanical Manufacturing
311812 Commercial Bakeries 325414 Biological Product (except Diagnostic) Manufacturing
311813 Frozen Cakes, Pies, and Other Pastries Manufacturing
326111 Plastics Bag and Pouch Manufacturing
311821 Cookie and Cracker Manufacturing 326160 Plastics Bottle Manufacturing
311822 Flour Mixes and Dough Manufacturing from Purchased Flour
327213 Glass Container Manufacturing
311823 Dry Pasta Manufacturing 332115 Crown and Closure Manufacturing
311830 Tortilla Manufacturing 332431 Metal Can Manufacturing
311911 Roasted Nuts and Peanut Butter Manufacturing 332439 Other Metal Container Manufacturing
311919 Other Snack Food Manufacturing 339112 Surgical and Medical Instrument Manufacturing
ENERGY RELATED MANUFACTURING
333132 Oil and Gas Field Machinery and Equipment Manufacturing
311225 Fats and Oils Refining and Blending
333414 Heating Equipment (except Warm Air Furnaces) Manufacturing
311613 Rendering and Meat Byproduct Processing
333611 Turbine and Turbine Generator Set Units Manufacturing
322299 All Other Converted Paper Product Manufacturing
334512 Automatic Environmental Control Manufacturing for Residential, Commercial, and Appliance Use
333298 All Other Industrial Machinery Manufacturing
334515 Instrument Manufacturing for Measuring and Testing Electricity and Electrical Signals
334413 Semiconductor and Related Device Manufacturing
334517 Irradiation Apparatus Manufacturing 334519 Other Measuring and Controlling Device Manufacturing
335110 Electric Lamp Bulb and Part Manufacturing 335312 Motor and Generator Manufacturing
335121 Residential Electric Lighting Fixture Manufacturing
335314 Relay and Industrial Control Manufacturing
335122 Commercial, Industrial, and Institutional Electric Lighting Fixture Manufacturing
335999 All Other Miscellaneous Electrical Equipment and Component Manufacturing
335129 Other Lighting Equipment Manufacturing 311223 Other Oilseed Processing
335311 Power, Distribution, and Specialty Transformer Manufacturing
325193 Ethyl Alcohol Manufacturing
311225 Fats and Oils Refining and Blending 324110 Petroleum Refineries
335311 Power, Distribution, and Specialty Transformer Manufacturing
324199 All Other Petroleum and Coal Products Manufacturing
LOGISTICS MANUFACTURING
336120 Heavy Duty Truck Manufacturing 336611 Ship Building and Repairing
336510 Railroad Rolling Stock Manufacturing
WATER TECHNOLOGY MANUFACTURING
326122 Plastics Pipe and Pipe Fitting Manufacturing 333319 Other Commercial and Service Industry Machinery Manufacturing
333111 Farm Machinery and Equipment Manufacturing 333911 Pump and Pumping Equipment Manufacturing

A p p l i e d D e v e l o p m e n t E c o n o m i c s | P a g e 52
AAPPPPEENNDDIIXX AA:: CCOONNTTIINNUUEEDD
MANUFACTURING CLUSTER (CROSS-CLUSTER) (CONTINUED)
CLUSTER COMPONENTS BY NAICS CODE HEALTH & WELLNESS MANUFACTURING
339112 Surgical and Medical Instrument Manufacturing 325411 Medicinal and Botanical Manufacturing
339113 Surgical Appliance and Supplies Manufacturing 325412 Pharmaceutical Preparation Manufacturing
339114 Dental Equipment and Supplies Manufacturing 325413 In-Vitro Diagnostic Substance Manufacturing
339115 Ophthalmic Goods Manufacturing 325414 Biological Product (except Diagnostic) Manufacturing
339116 Dental Laboratories
OTHER MANUFACTURING
31-33 All Manufacturing Industries not listed above
WATER TECHNOLOGY CLUSTER
CLUSTER COMPONENTS BY NAICS CODE 2007 NAICS U.S. TITLE
326122 Plastic Pipe and Pipe Fitting Manufacturing 333911 Pump and Pumping Equipment Manufacturing
333111 Farm Machinery and Equipment Manufacturing 423830 Industrial Machinery and Equipment Merchant Wholesalers
333319 Other Commercial and Service Industry Machinery Manufacturing
424910 Farm Supplies Merchant Wholesalers